Introduction
The University in which a person studies or bases their research activity is a crucial factor in the development of their professional career. Graduating from a prestigious university has historically led to a greater likelihood of obtaining more desirable jobs, higher earnings, and the potential to occupy key management positions in organizations (the last five UK Prime Ministers, for example, are all alumni of Oxford University). For research focused careers, collaborating with a renowned university represents the best opportunity for academics to secure funding for their work on a larger scale, particularly important as such income generation is now viewed as a fundamental aspect of the role (Boeren, 2023).
The aim of the research undertaken for this paper was to analyse the distribution of publicly awarded funding by UK Research and Innovation (UKRI), and to compare it against UKRI’s Equality, Diversity, and Inclusivity (EDI) strategy. UKRI is a public body that draws together Research England (an organisation supporting research at higher education institutions), Innovate UK (an innovation agency) and seven discipline-focused research councils (for example, Economic and Social Research Council). According to UKRI (2023a) their roles are to; provide investment and support for researchers, help researchers develop new skills, enable collaboration and engagement, and improve the capabilities across the research system. Creating, and fulfilling EDI objectives is important in avoiding bias in the decisions made in carrying out these roles, and the significance of UKRI’s remit lies in the knowledge that UK universities rely heavily on UK-originating research funding for this aspect of their work (Boeren, 2023). Publicly accessible information via Gateway to Research (GtR) provided by UKRI has been used in this research. According to UKRI
1, GtR was developed by the Research Councils to enable users to search and analyse information about publicly funded research. It includes information about projects supported by all seven Research Councils, UKRI, Innovate UK and NC3Rs and can be filtered by key terms, funder, start year etc.
To achieve this aim, the paper will, first, identify different categories of institutions in the UK higher education sector and how they have been grouped both through their own collaboration and in common parlance. It will then analyse, in detail, how UKRI funding has been distributed amongst these institutional categories. In addition, this paper considers decisions between the requested and awarded amounts of funding for projects by institutions within these categories for these different institutions. Finally, the results will be compared against UKRI’s commitment to EDI. Recommendations will finally be provided to maximise UKRI EDI strategy in distribution of funding.
UK Higher Education Institutions
The UK higher education institution (HEI) landscape is a product of centuries old founding of institutions, changing economic and social fortunes, and more modern government policies. Oxford University records teaching as far ago as 1096, the University of Liverpool was established in 1881, whereas the University of Suffolk was awarded university status in 2016. These developments, and how the institutions, particularly universities (rather than the smaller number of university colleges and other bodies), style themselves in what is a competitive market for students and research work has given rise to group identities (
Table 1).
The ‘Russell Group’ is a membership body, formed in 1994. It includes some of the oldest and highly prestigious universities in the UK among their 24 members (
www.russellgroup.ac.uk), institutions such as the Universities of Oxford, Cambridge, and Edinburgh. Additionally, the Russell Group represents some universities formed in the wake of the industrial revolution, so-called ‘red brick’ organisations, for example the University of Nottingham and University of Sheffield.
The ‘Plate Glass’ group, indicative of the architectural style of the time, is a term used to represent the universities founded between the 1960s and early 1990s (e.g. Lancaster). A description, rather than an interest-led working group, there are 27 organisations that have been given this moniker, although three ‘Plate-Glass’ universities are now within the Russell Group representation, the most recent of whom reportedly paid a half a million-pound fee for the privilege (Jump, 2013). To avoid duplication of results during this paper’s funding analysis, the three universities (Warwick, York, and Newcastle) are only included in the Russell Group, thus, the ‘Plate-Glass’ group consist of only 24 members for the purpose of this study.
The third group are 'Post-92' universities - a reference to former polytechnics or colleges that were awarded university status in the year 1992. Post-92 is simply a descriptive term rather than a body formed to represent their interests (although within the ‘Post-92’ universities there are member groups such as Million Plus and the University Alliance). This group consists of 78 members.
Despite very different geographical locations, subject speciality, and student population bases the above three group terms are in widespread use in perceptions of UK universities and drive the little disputed notion that the UK has a differentiated university system (Boliver, 2015). There are other Research and Knowledge Exchange (RKE) institutions that do not easily fit the above three classifications. For example, the University of St Andrews (currently the leading institution according to The Times rankings) is not a member of any of the identified groups, and the University of Buckingham is a private venture. It is easy to confirm if an organisation is an officially recognised higher education awarding body as their registration is held by government and this can be readily checked on the Office For Students online register. However, an organisation’s non-alignment with, or difficulty in ascribing them to, the three named groups has led to them being placed in the ‘Other Universities’ category for the purposes of this research. Alternative listings of higher education institutes may disagree with some of them being classified as ’other’, and so a comparable research exercise may differ slightly on the number of members. For example, Boliver (2015) categorises Universities/institutions in a different way based on a range of other factors such as teaching and academic selectivity that are not part of the focus of this paper. What can be confirmed is that none of the universities placed in this ‘Other Universities’ group would be considered as members of any of the other named groups.
Defining the category of ‘Other RKE Institutions’ (
Table 1) is challenging. These are institutions that undertake research and Knowledge Exchange activities and receive UKRI funding but are not necessarily classed as a university. They operate under their own authority, but many of these institutions are linked to universities, particularly, Russell Group Universities. For example, the High Value Manufacturing Catapult (HVMC) is categorised under ‘Other RKE institutions’. The HVMC has seven centres in the UK and one of them (WMG) is an academic department at the University of Warwick. Not all these institutions can be identified easily, and some institutions may only exist for a specific RKE project rather than having the wider remit and longevity of universities. For this reason, there is a need to highlight that the number of members in the group ‘Other RKE Institutions’ fluctuates over time.
Finally, it is worth noting that identifying the total number of universities in the UK is a similarly difficult task. The Guardian newspaper (2024) lists 122 universities in its league tables; the Times newspaper (2024) considers 131 institutions as universities; and Universities UK (2024), described as “the collective voice of universities in England, Scotland, Wales and Northern Ireland”, names 142 institutions as universities in the UK. Possible reasons for discrepancy in figures could be due to organisational status and independence, for example, the University of London is a federation of 17 higher education organisations that may or not be counted individually. Notwithstanding the above, the total of 155 universities in
Table 1 are based on the number of individual entries in the UKRI funding data. This includes 140 individual universities, 4 university colleges, and 11 institutions from the University of London.
UK Research and Innovation (UKRI)
In the ‘Case for the Creation of UKRI’, the Department for Business Innovation and Skills (2016, p3) argued that “multi or inter-disciplinary approaches and increased collaboration across traditional boundaries and organisations” is required (namely the UKRI). Thus, UKRI was founded on 1 April 2018 by the Higher Education and Research Act (2017) to unify nine different previous research bodies under one lead organisation (
Table 2). Those research bodies continue to exist and distribute funding, but now do so within the UKRI’s overall strategy.
The UKRI allocates funding for collective programmes and to each of the different councils, which act as separate funders. UKRI finances researchers, businesses, universities, NHS bodies, charities, non-governmental organisations (NGOs) and other RKE institutions. A dual support model is used to allocate funds: grants for individual research projects across the UK (through the research councils) and block grants for research institutions in England (through Research England). UKRI restates the commitment to the Haldane Principle (Haldane Report, 1918) of researchers, through peer review, being the arbiters of allocation of research funding rather than government having this power. However, the subsequent creation of this overarching organisation and its appointment of Chair and Chief Executive with oversight of almost all publicly funded research, and the power to set priorities for such funded research, has been heavily criticised as leading to the abandonment of that Principle (Holligan and Shah, 2017).
The funding process operates through initial peer review of applications across published criteria, some of these reviewers can be nominated by the applicants. Bids then proceed to an independent panel where they are in competition with all the other applications for funding from that revenue stream. UKRI say their assessment is “designed to be sensitive to different needs and cultures in the academic community. It reflects the need to support different types of research” (UKRI, 2023b). In support of this research culture, UKRI has published an EDI (equality, diversity and inclusivity) strategy. UKRI uses ‘equality’ within the term EDI rather than ‘equity’. This is an important point not just semantics, as ‘equity’ recognises that individuals and groups are different and need to receive the level of resources that will help them achieve the same outcome. The strategy recognises “untapped talent and potential across the UK” (UKRI, 2023c) and the need to include a broader range of people in funded research. The aim is to “foster a research and innovation system ‘by everyone, for everyone”. The objectives to achieve this aim do not identify specifically improving the situation for any currently marginalised groups, just that equality, diversity, and inclusivity in general need to improve (UKRI, 2023c).
UKRI publishes funding data based on diversity of funding applicants and awardees (ethnicity/gender/age/disability), which is a good effort towards EDI strategy. However, there is an acceptance by UKRI that these data show that work is needed to address under representation of certain groups in awards. According to UKRI (2023d), they "are using these data, together with other evidence and engagement with the research and innovation community to help us identify and deliver actions to create a more equitable system", noting “the system needs fixing”. UKRI also publishes data that identify geographical distribution of funding. In 2020-21 more than half of all UKRI funding (54%) was allocated to the Greater South-East region (UKRI, 2023e) compared to other parts of the UK.
Research Funding Distribution
Although UKRI's efforts towards EDI across all its funding streams are evident, some critics argue that, despite policies in place, the funding allocations do not always reflect the intended goals. There are concerns about systemic barriers that hinder underrepresented groups' access to resources and opportunities, leading to disparities in funding distribution.
A study by Fransman et al. (2018, p7), in the year UKRI came into existence, and with the intention of informing policy in relation to UK research funding and collaboration with the Global South, noted “approaches, systems and structures that undermine fair and equitable partnership”. Within the study, evidence hierarchies, and who determines the value of potential research, were highlighted as areas in need of reform. Some five years later, Gladstone et al. (2023 p3) identified, in their analysis of UK funding schemes, that “marginalised groups face systemic barriers to securing research funding, that are created and controlled by funders and universities”. These barriers specifically included "vulnerability to bias of both schemes and decision-making" and “failure to account for structural inequality in decision-making" (Gladstone et al., 2023 p3). Gladstone et al.’s (2023) criticisms of the current funding system are many and highlight the need to minimise ambiguity in scoring bids, to rebalance the assessment of bids on past achievement in favour of potential to deliver outcomes, and the need for those in a decision-making capacity to recognise their own bias.
Bias in peer-review system, particularly through the ability for bidders to nominate reviewers, is identified by Jerrim and de Vries (2023) in their examination of ESRC funding proposals. There is inconsistency between these nominated reviews (59% give the highest score available) and independent reviews (17% give the highest score available). This reviewer score impacts the likelihood of funding, and Jerrim and de Vries (2023) use publicly available ESRC data to show that for the Russell Group universities the probability of funding based on the score awarded by the nominated reviewer is higher (0.93) than for any other university group. For what they call the ‘new universities’ (Jerrim and de Vries, 2023) the score is 0.34. There is additional evidence to suggest a ‘halo effect’ in Russell Group research impact submissions (Pinar and Unlu, 2020), impact being a key consideration in funding bid assessment. It is a situation that supports the belief that the Matthew Effect (Merton 1968) is operating, where those already advantaged accrue more advantage, the perpetuation of the same winners and losers in the current UKRI funding system. Those who are not already successful appear to have a limited chance for future success. As Boeren (2023 p20) identifies, in a study of research income and research excellence measured for the UK Research Excellence Framework (REF) 2021, there are “notions of vicious circles that are difficult to break”.
In highlighting inequality in the funding system, Gladstone et al. (2023) refer particularly to researchers who are women, racially minoritised, LGBTQIA+, and disabled. Sarju (2021) expands on one of these characteristics, noting the under-representation of scientists with a declared disability within UKRI applications. The UKRI’'s own work is cited in identifying only 1% of applicants disclose a disability, perhaps wisely when there are lower award rates for principal investigators with such a disclosure. Similarly, Jebsen et al. (2020) spotlight the gender imbalance in both the number of funding awards the UKRI gives to teams led by women, and crucially that the UKRI’s data releases mask discrepancies in the sums and relative prestige of those awards. Certainly, the research for this paper found challenges relating to the format of the publicly available data, and some absences in the records of awards. Importantly, Jebsen et al. (2020) draw attention to intersectionality, a consideration that Lia et al. (2020) also highlight, in so far as compartmentalisation of the data across singular identities by UKRI ignores intersectional experiences. Lia et al. (2020) additionally add socio-economic class to the factors by which someone may be marginalised in UK research funding. It is worth noting that, in the recent Times rankings of UK universities (The Times, 2024) 16 of the bottom 20 places assessed according to social inclusion are occupied by Russell Group universities. By this measurement they are, by some considerable margin, the group least likely to offer opportunities to disadvantaged learners.
Research from other nations suggests the status of individuals and institutions, whether the applicant comes from the reviewer’s community, and the applicant’s previous success are sufficiently relevant to outcomes that suggest favouritism (Lawson and Salter, 2023). Lawson and Salter (2023) use this knowledge to examine the likelihood of additional funding applications from an institution being awarded a grant by UKRI, if there is an overlapping award for the same institution in the same round of funding. They concluded that there is a 22.5% lower chance of receiving funding in such cases if the institution has already been awarded greater than 10% of the overall level of funding, and that panels may consider the diversity of successful institutions when making awards. However, they also find that peer review college membership, affiliation to one of the leading universities, and other personal characteristics such as having a British-sounding name do increase the chances of receiving funding, and that high status institutions may receive a greater degree of leniency (Lawson and Salter, 2023). Moreover, the findings suggest if there is a degree of institutional diversity within the existing funding awards already, the panels judging applications are less concerned with allocating the remaining funding to a widened range of applicants (Lawson and Salter, 2023). As useful as this analysis is, what it does not identify is, if the diversity of successful applications is coming from a wide range of universities, it simply suggests that a high-status university is less likely to receive more funding if it has already claimed more than 10% of the total funding. A second high status university may be the beneficiary. This seems likely for at least the “most prestigious funding” which is said to “flow” to the Russell Group universities (Boeren, 2023 p20).
Considering all current research relating to UKRI funding and the importance of EDI, it is evident a gap exists in identifying funding allocations to categories of UK universities/institutions (as identified in
Table 1) and the impact this has on EDI strategy. Although some universities are popularly ranked higher than others, do more research than others, and receive more funding than others; what is less clear is the extent to which that situation is being perpetuated by public-funding. Moreover, if that public-funding commits to improving the number of awards going to currently marginalised groups, it is important to recognise how such groups may be impacted through the rejection of bids from institutions that have more diverse academic populations. An EDI strategy, one where the aim is to foster a system ‘by everyone, for everyone', would be able to utilise analysis of the public-funding and the continued marginalisation of groups to aid the process of fixing what is perceived to be broken. This paper provides that analysis.
Materials and Methods
The UKRI maintains records of all research projects that have been funded by different funding agencies both prior to 2018 and after the creation of UKRI. These data are publicly accessible via their website and the previously mentioned Gateway to Research (GtR). For this research, funding data from 2005 to 2023 were analysed. For the years 2005 and 2023, full year data was not available. The reason for partial data for 2023 is because the research for this analysis started mid-year; but it is unclear why 2005 does not have full year data. The funding data provides information on the research project, name of funder, project code, lead institution (university or any other type of institution), department to which the funding is attached to, project category, the main researcher/s, funds awarded (< £100K, £100K- £1M, £1M-£10M, above £10M), and project status (active/closed). The funding data for the period of 2005-2023 were downloaded in CSV format. The downloaded files were then converted to suitable formats for processing. This was quite a protracted exercise as the data was not on a continuous dataset. It took considerable effort to compile a list of funding awards in a format that was deemed satisfactory for analysis. This discourages scrutiny of funding awards.
In the second phase of the work, the compiled list of funding awards was refined. The UKRI data produced 134,955 records when downloading the complete database in one process. However, examination of the data showed 3,627 records (2.69%) contained errors that could not be resolved. These were a result of data not being correctly assigned to the appropriate field in the UKRI source. Therefore, these data were removed and a total, 131,328 records (97.31% of complete database) were taken for the final analysis.
In the third phase of analysis, the data were clustered according to previously identified institutional groups (
Table 1). Data accessible from UKRI do not show this in their raw format, instead each individual funding award must be by identified according to their recipient institution and this institution and the award data placed into their group for collation. Herein, the existence of consortia in awarded projects should be noted. The data provided by UKRI identifies the lead participant in a project, but also lists the other participants and the funding they received for the same project. For example, in 2014/15 a project called “Tier2Tier” was led by the company “Viewpoint Construction”, with the University of Northumbria a partner in the project. Further examples were checked to confirm that sums were not counted twice or allocated to the lead partner during the analysis, which could skew the findings and might lead to invalid conclusions. Therefore, careful consideration was given when analysing the data, especially when the project was awarded to a consortium.
During the fourth phase, data from UKRI were analysed to identify the funding requested and awards in terms of the number and value of projects. As earlier analysis identifies no major annual differences, one year has been analysed in detail to represent data behaviour for the whole period. The analysis undertaken in this work is descriptive. This is deliberate as this information is simply not presented in UKRI, academic, or media discussions. Others have done more specific analysis on selected groups, but no current work exists showing the scale and challenges inherent in UKRI funding awards. There is a need to present the headline results for the whole UK higher education sector and how they relate to the stated intentions in being more equitable, diverse, and inclusive of their main public funding body. The results thus comprise the following sections: Overall analysis of UKRI funding; UKRI funding per university group; Funding allocation by each UKRI funder; Funding Success Rate.
Results
Overall Analysis of UKRI Funding
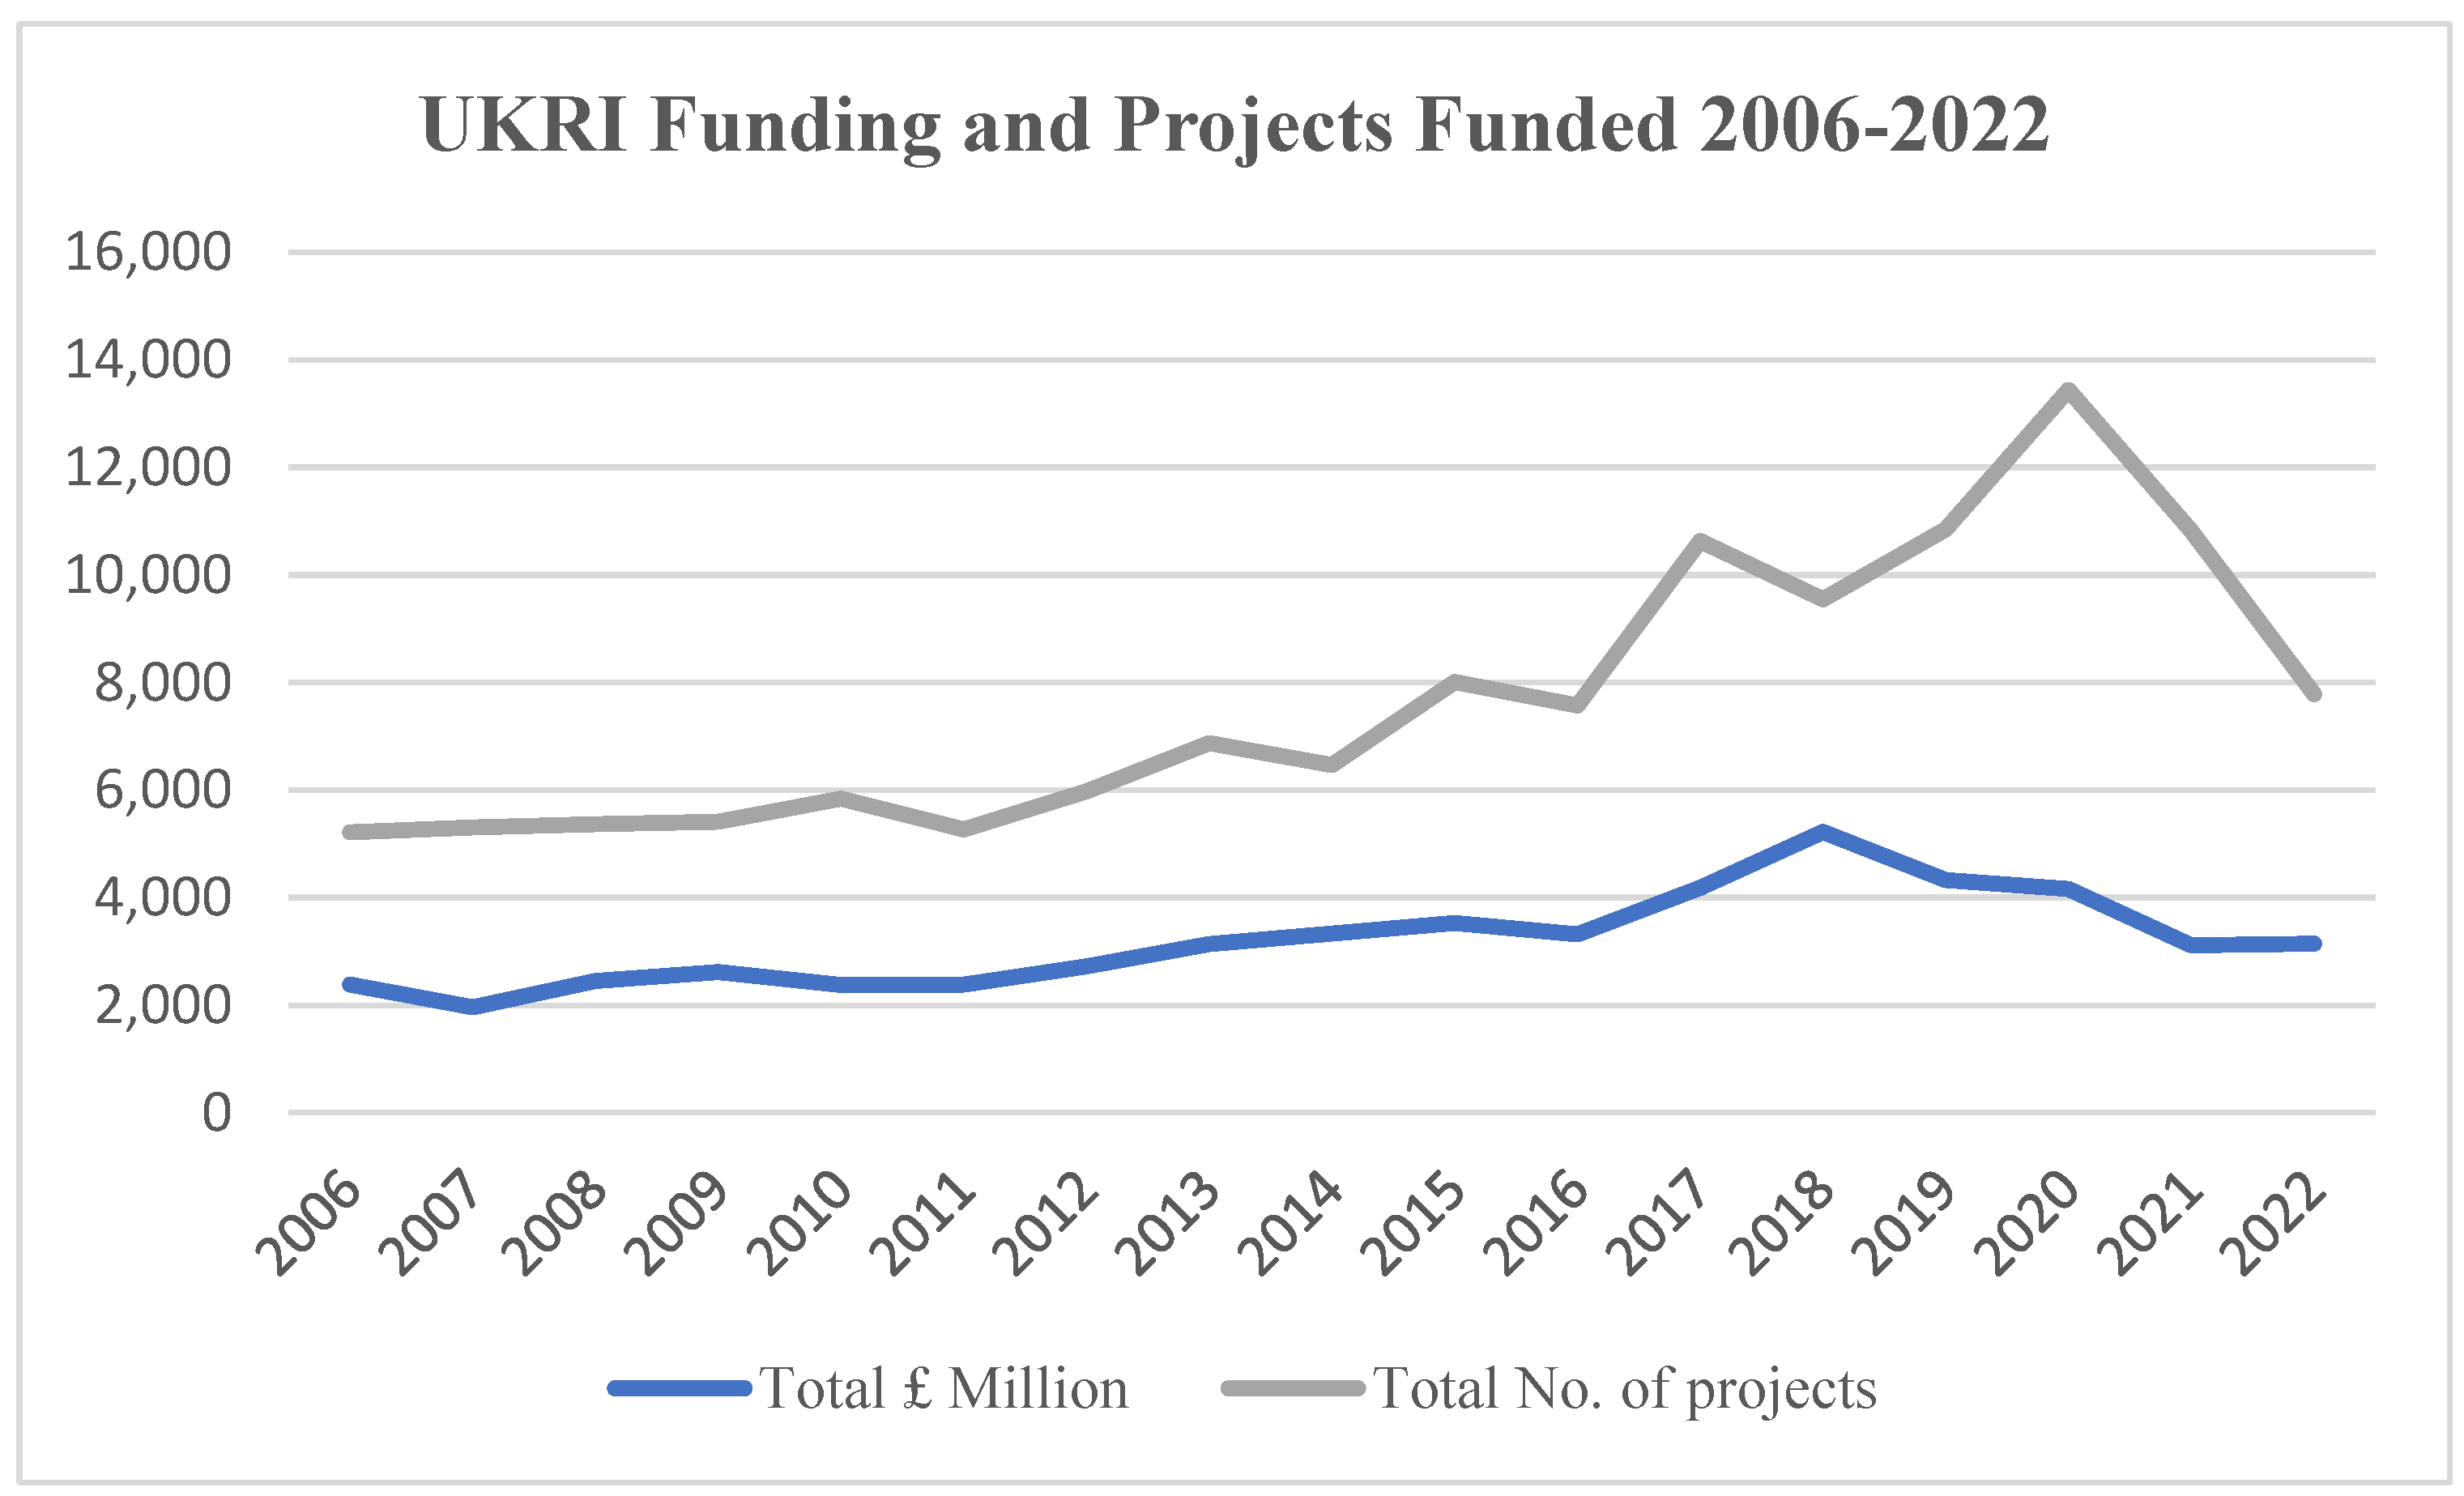
The data from UKRI showed that total funding allocated to research and knowledge exchange projects in the period 2005 – 2023 (
Figure 1 - noting 2005 and 2023 as incomplete years and thus excluding them from this representation) was £55,202 million; and the total number of projects awarded during the period was 131,331. This gives an annual average of £2,905 million of funding awarded by UKRI for projects; and an average number of 6,912 funded projects per year. The year of 2018 had the highest amount of annual funding at £5,221 million, the official launch of UKRI in April 2018 may be related to the surge in funding this year. The highest number of projects (13, 439) were awarded in the year 2020. This rise in the number of projects could be due to the Covid-19 pandemic, which prompted governments worldwide to support many projects on different areas of research relating to the crisis. An average of £420,330 has been awarded per project, but this is across a very broad range of funding awards, with the highest single application receiving £652.1 million (High-Value Manufacturing Catapult project) and 435 other projects funded by an amount of £10 million or above.
UKRI Funding Allocation per University Group
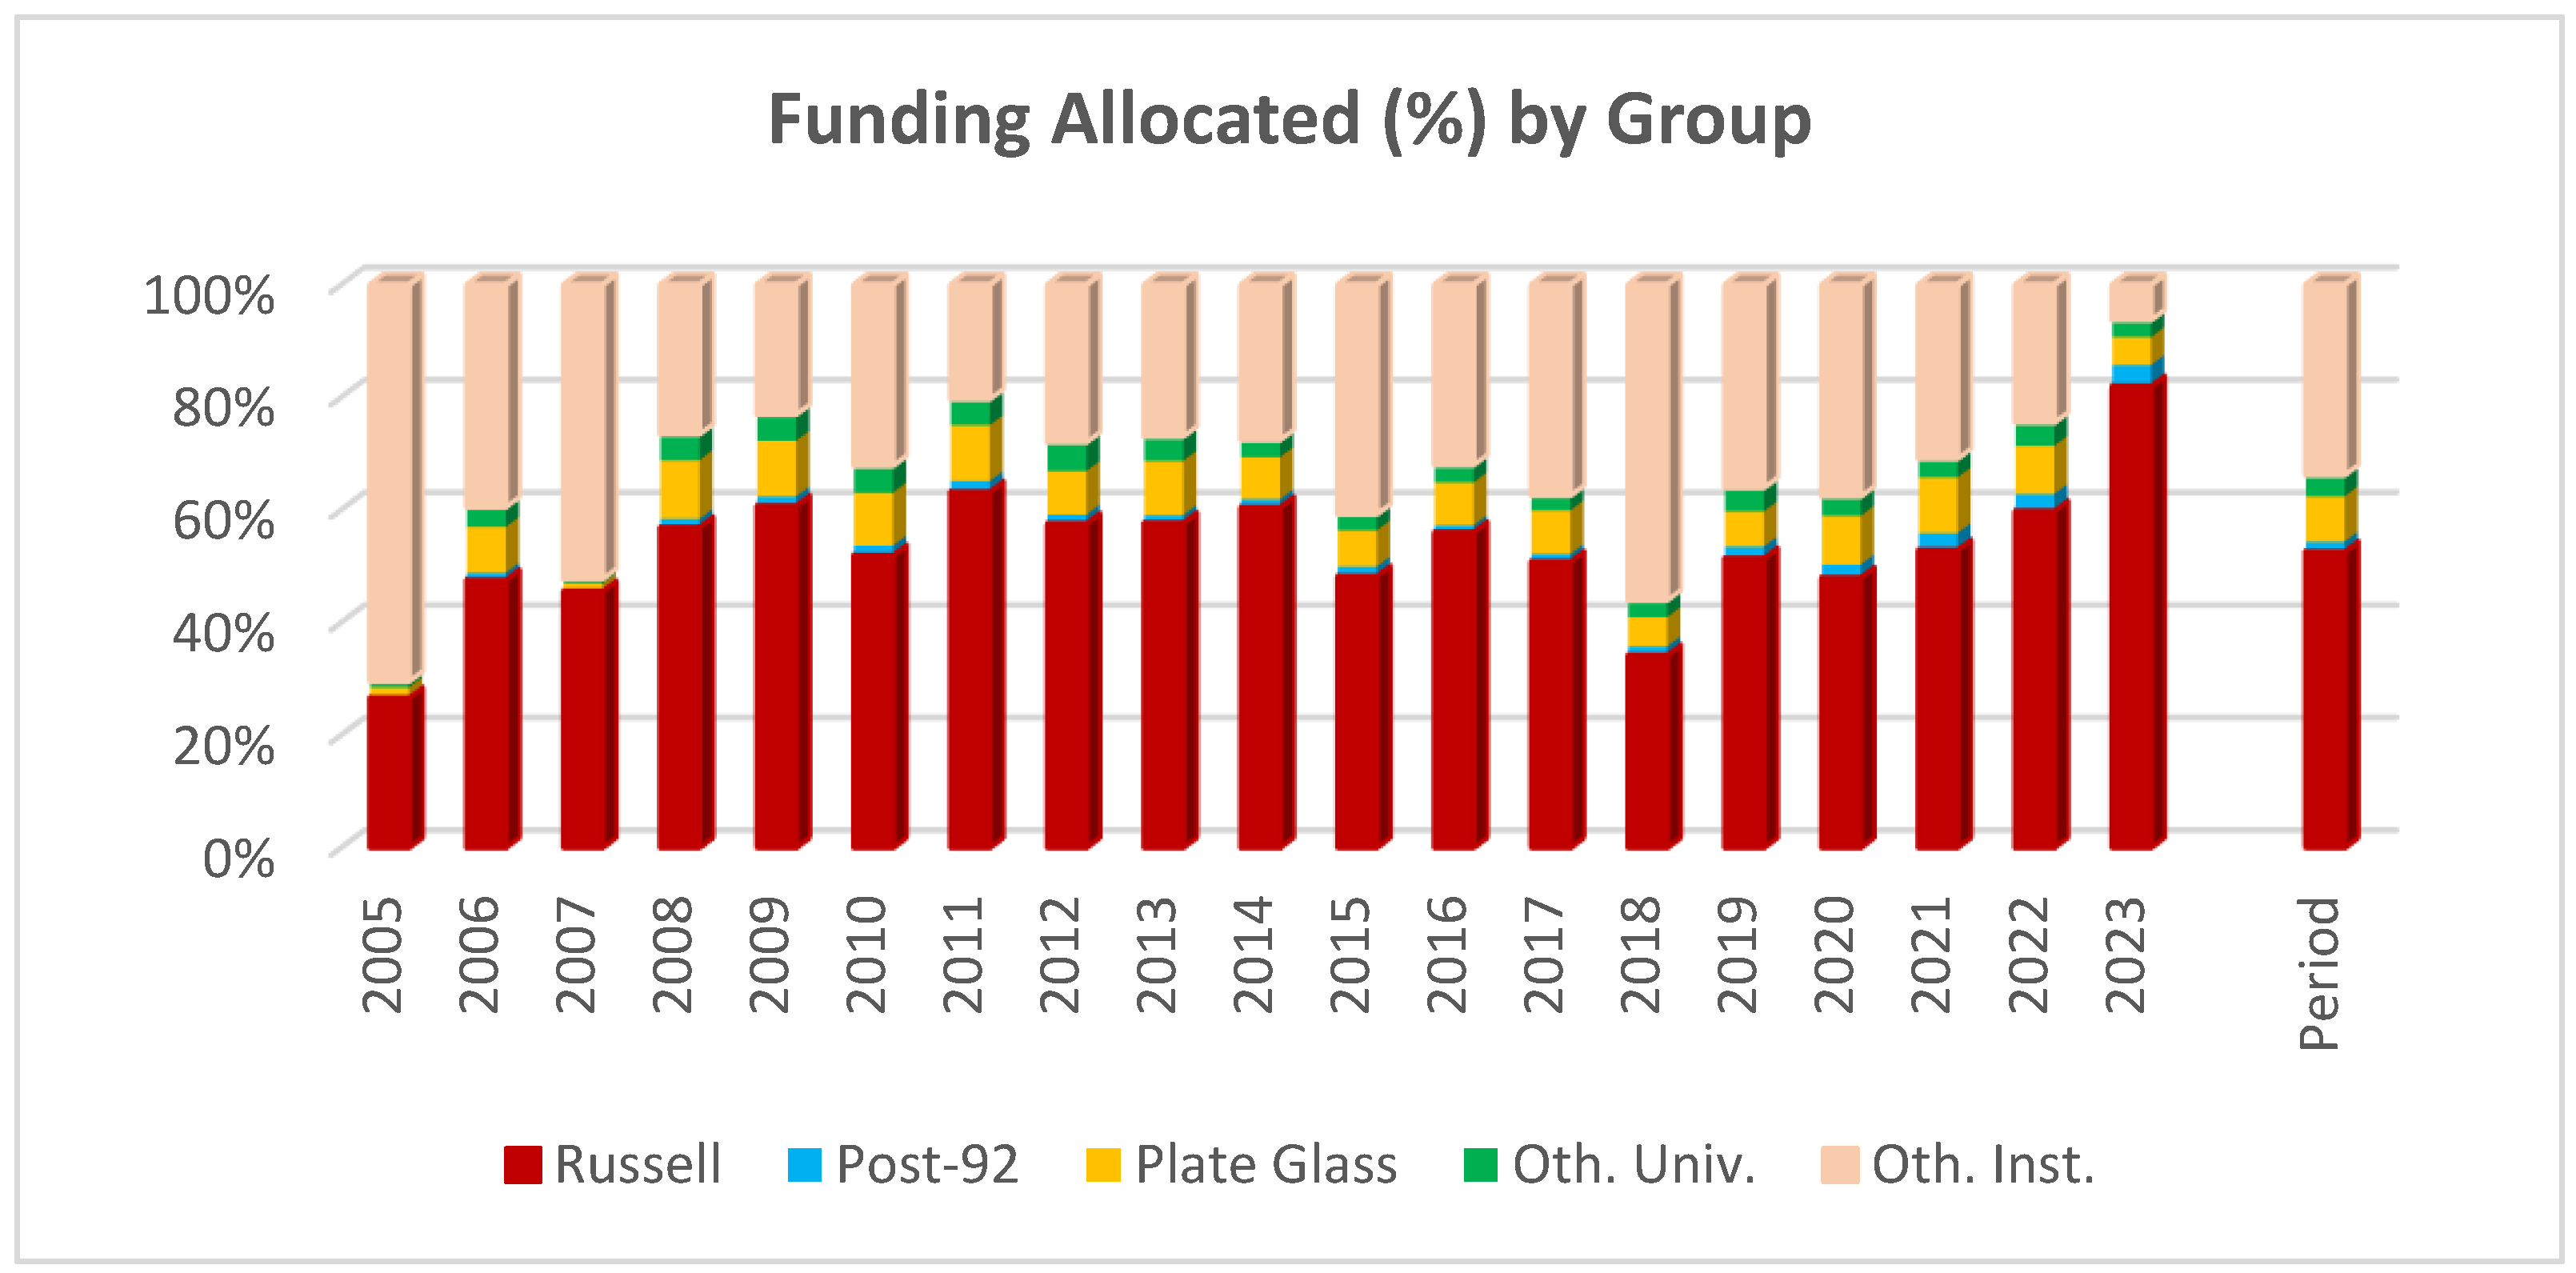
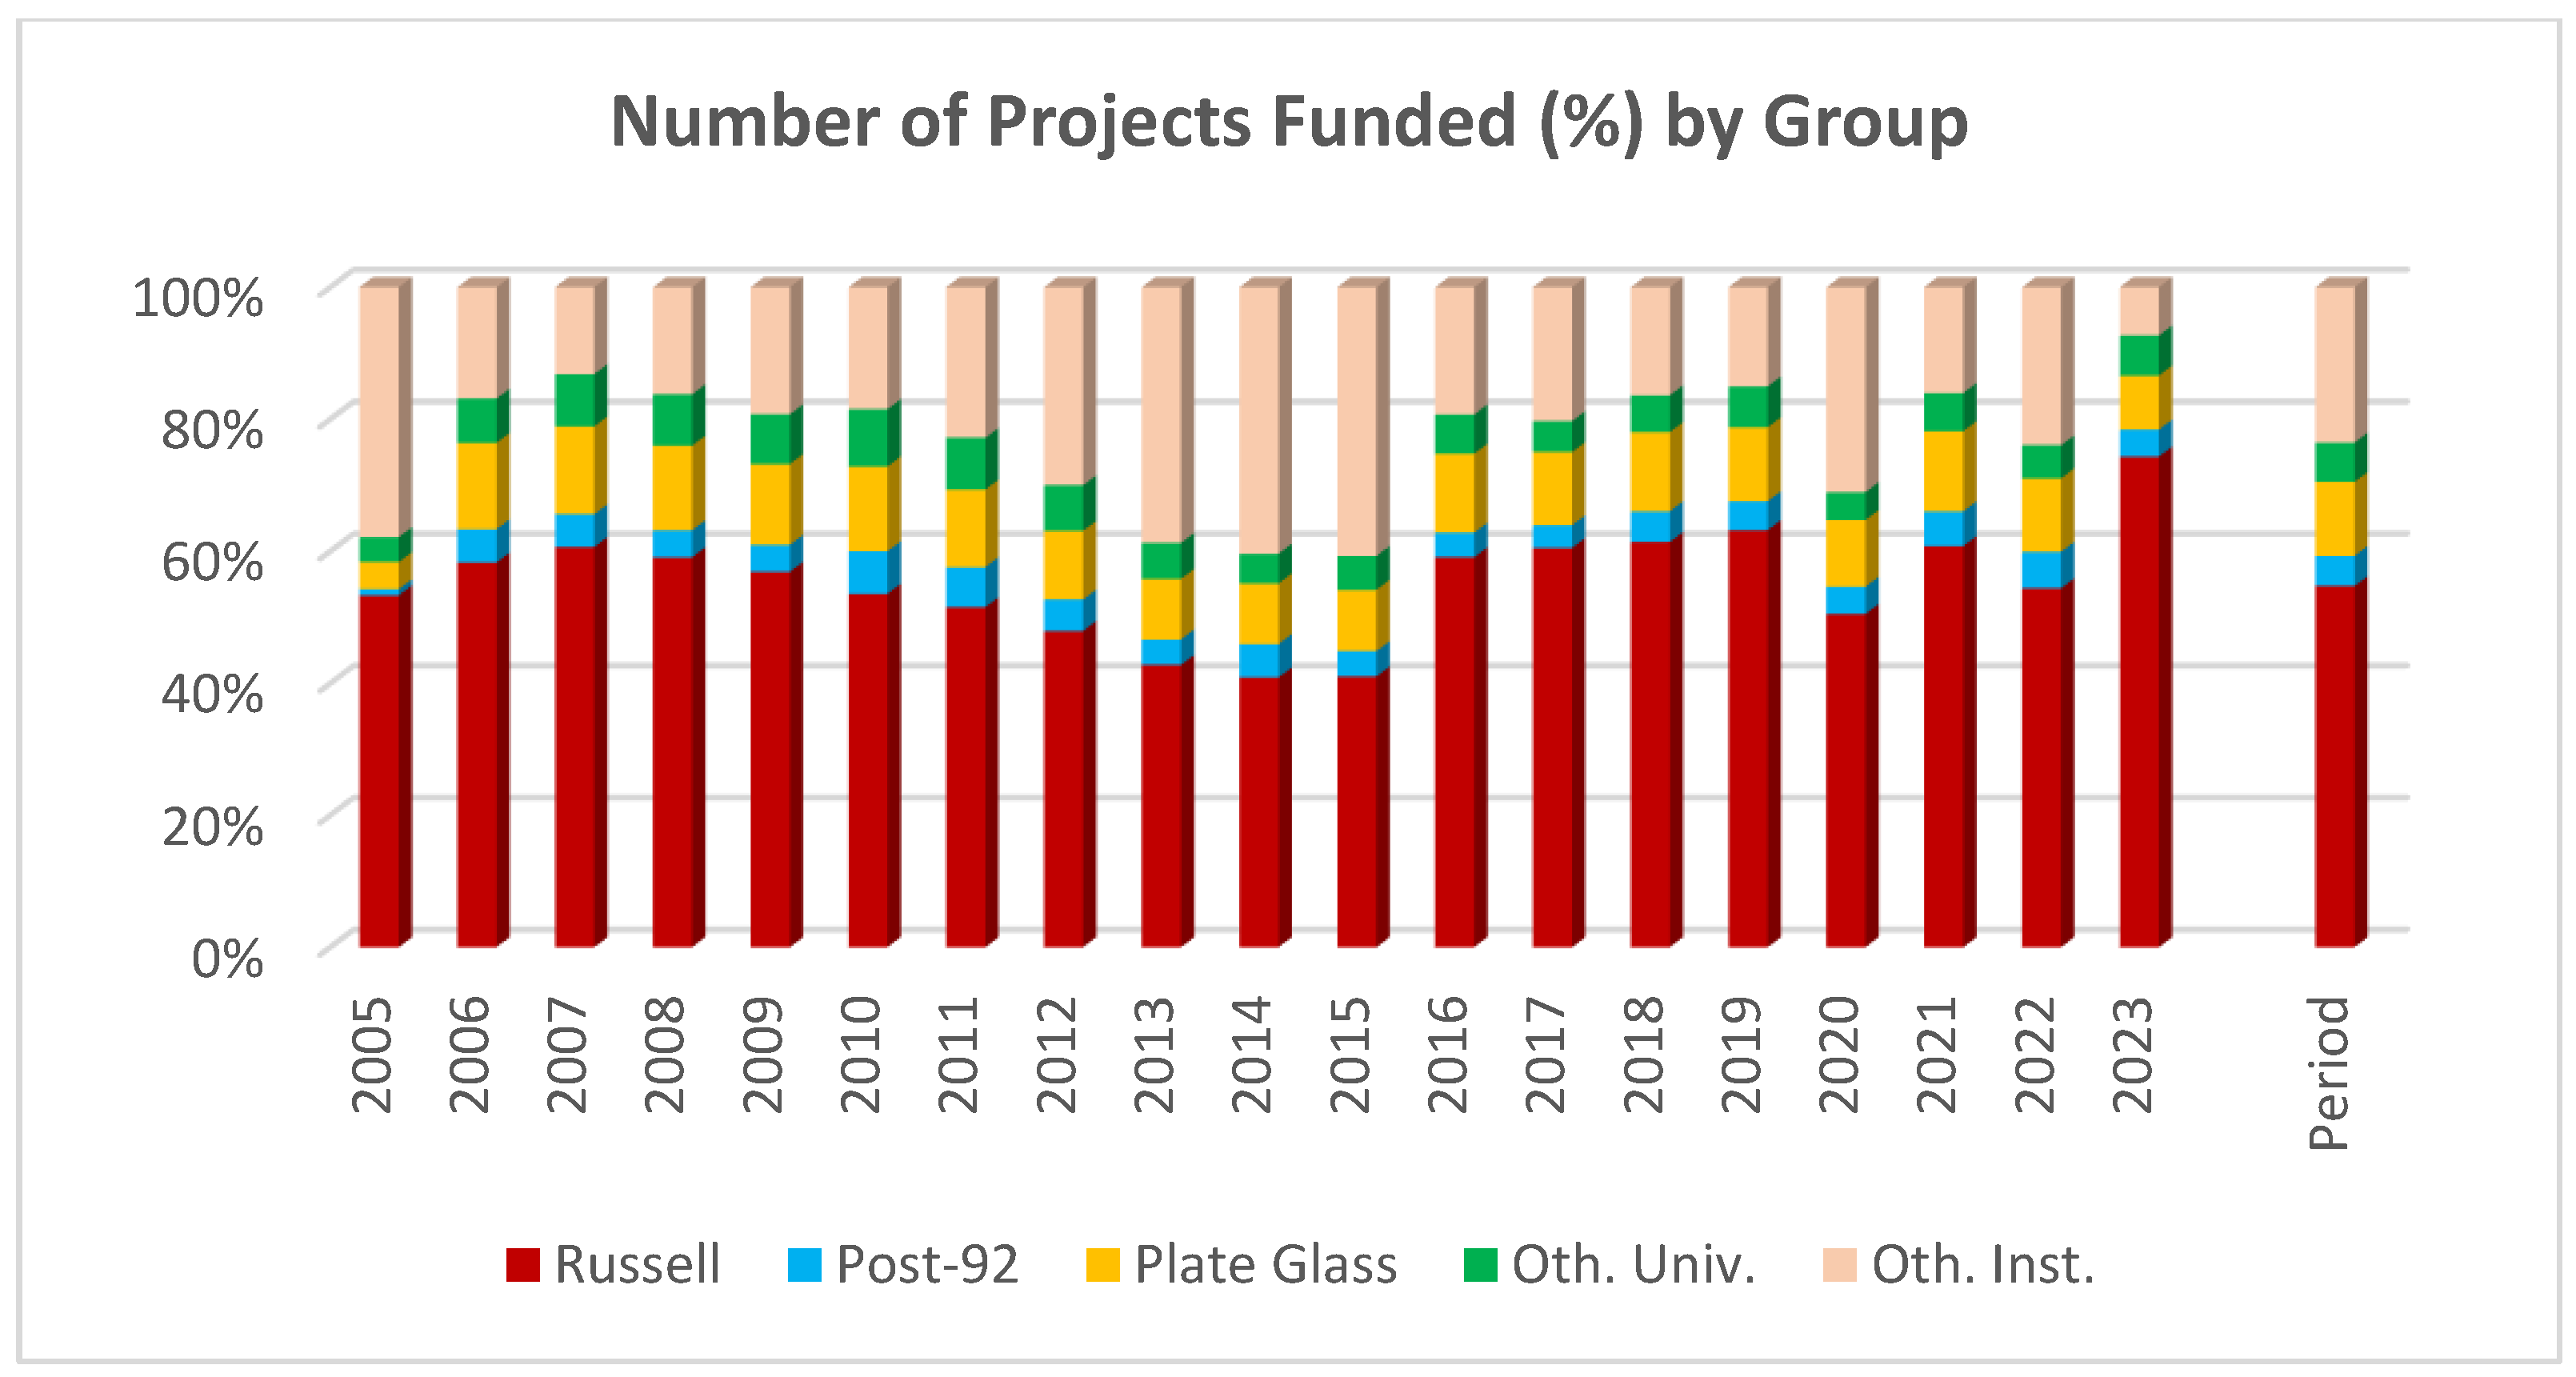
As was expected from the findings of the literature review, the university group receiving the largest sum of funds from UKRI is the Russell Group. What was not as anticipated was the extent of the gap between those 24 universities and the other higher education institutions. The Russell Group received a total of £29,026 million (53% of total funding) across 71,892 projects (55% of total projects) between 2005-2023 (
Figure 2 and
Figure 3). The second largest group that has received UKRI funding is the ‘Other RKE Institutions’ group. They have been awarded a total of £18,654 million (33% of total funding) for 30,940 projects (24% of total projects). The Plate Glass group of universities have received £4,439 million (8% of total funding) across 14,720 projects (11% of total projects). In fourth place is the Other Universities group that has received £2,213 million (4% of total funding) for 7,794 projects (6% of total projects). The Post-92 group, despite being the group with the largest number of universities (
n=78), representing 50.3% of all funded universities in the UK, received the lowest amount of funding over the period analysed, with £969 million (2% of total funding) for 5,982 projects (4% of total projects).
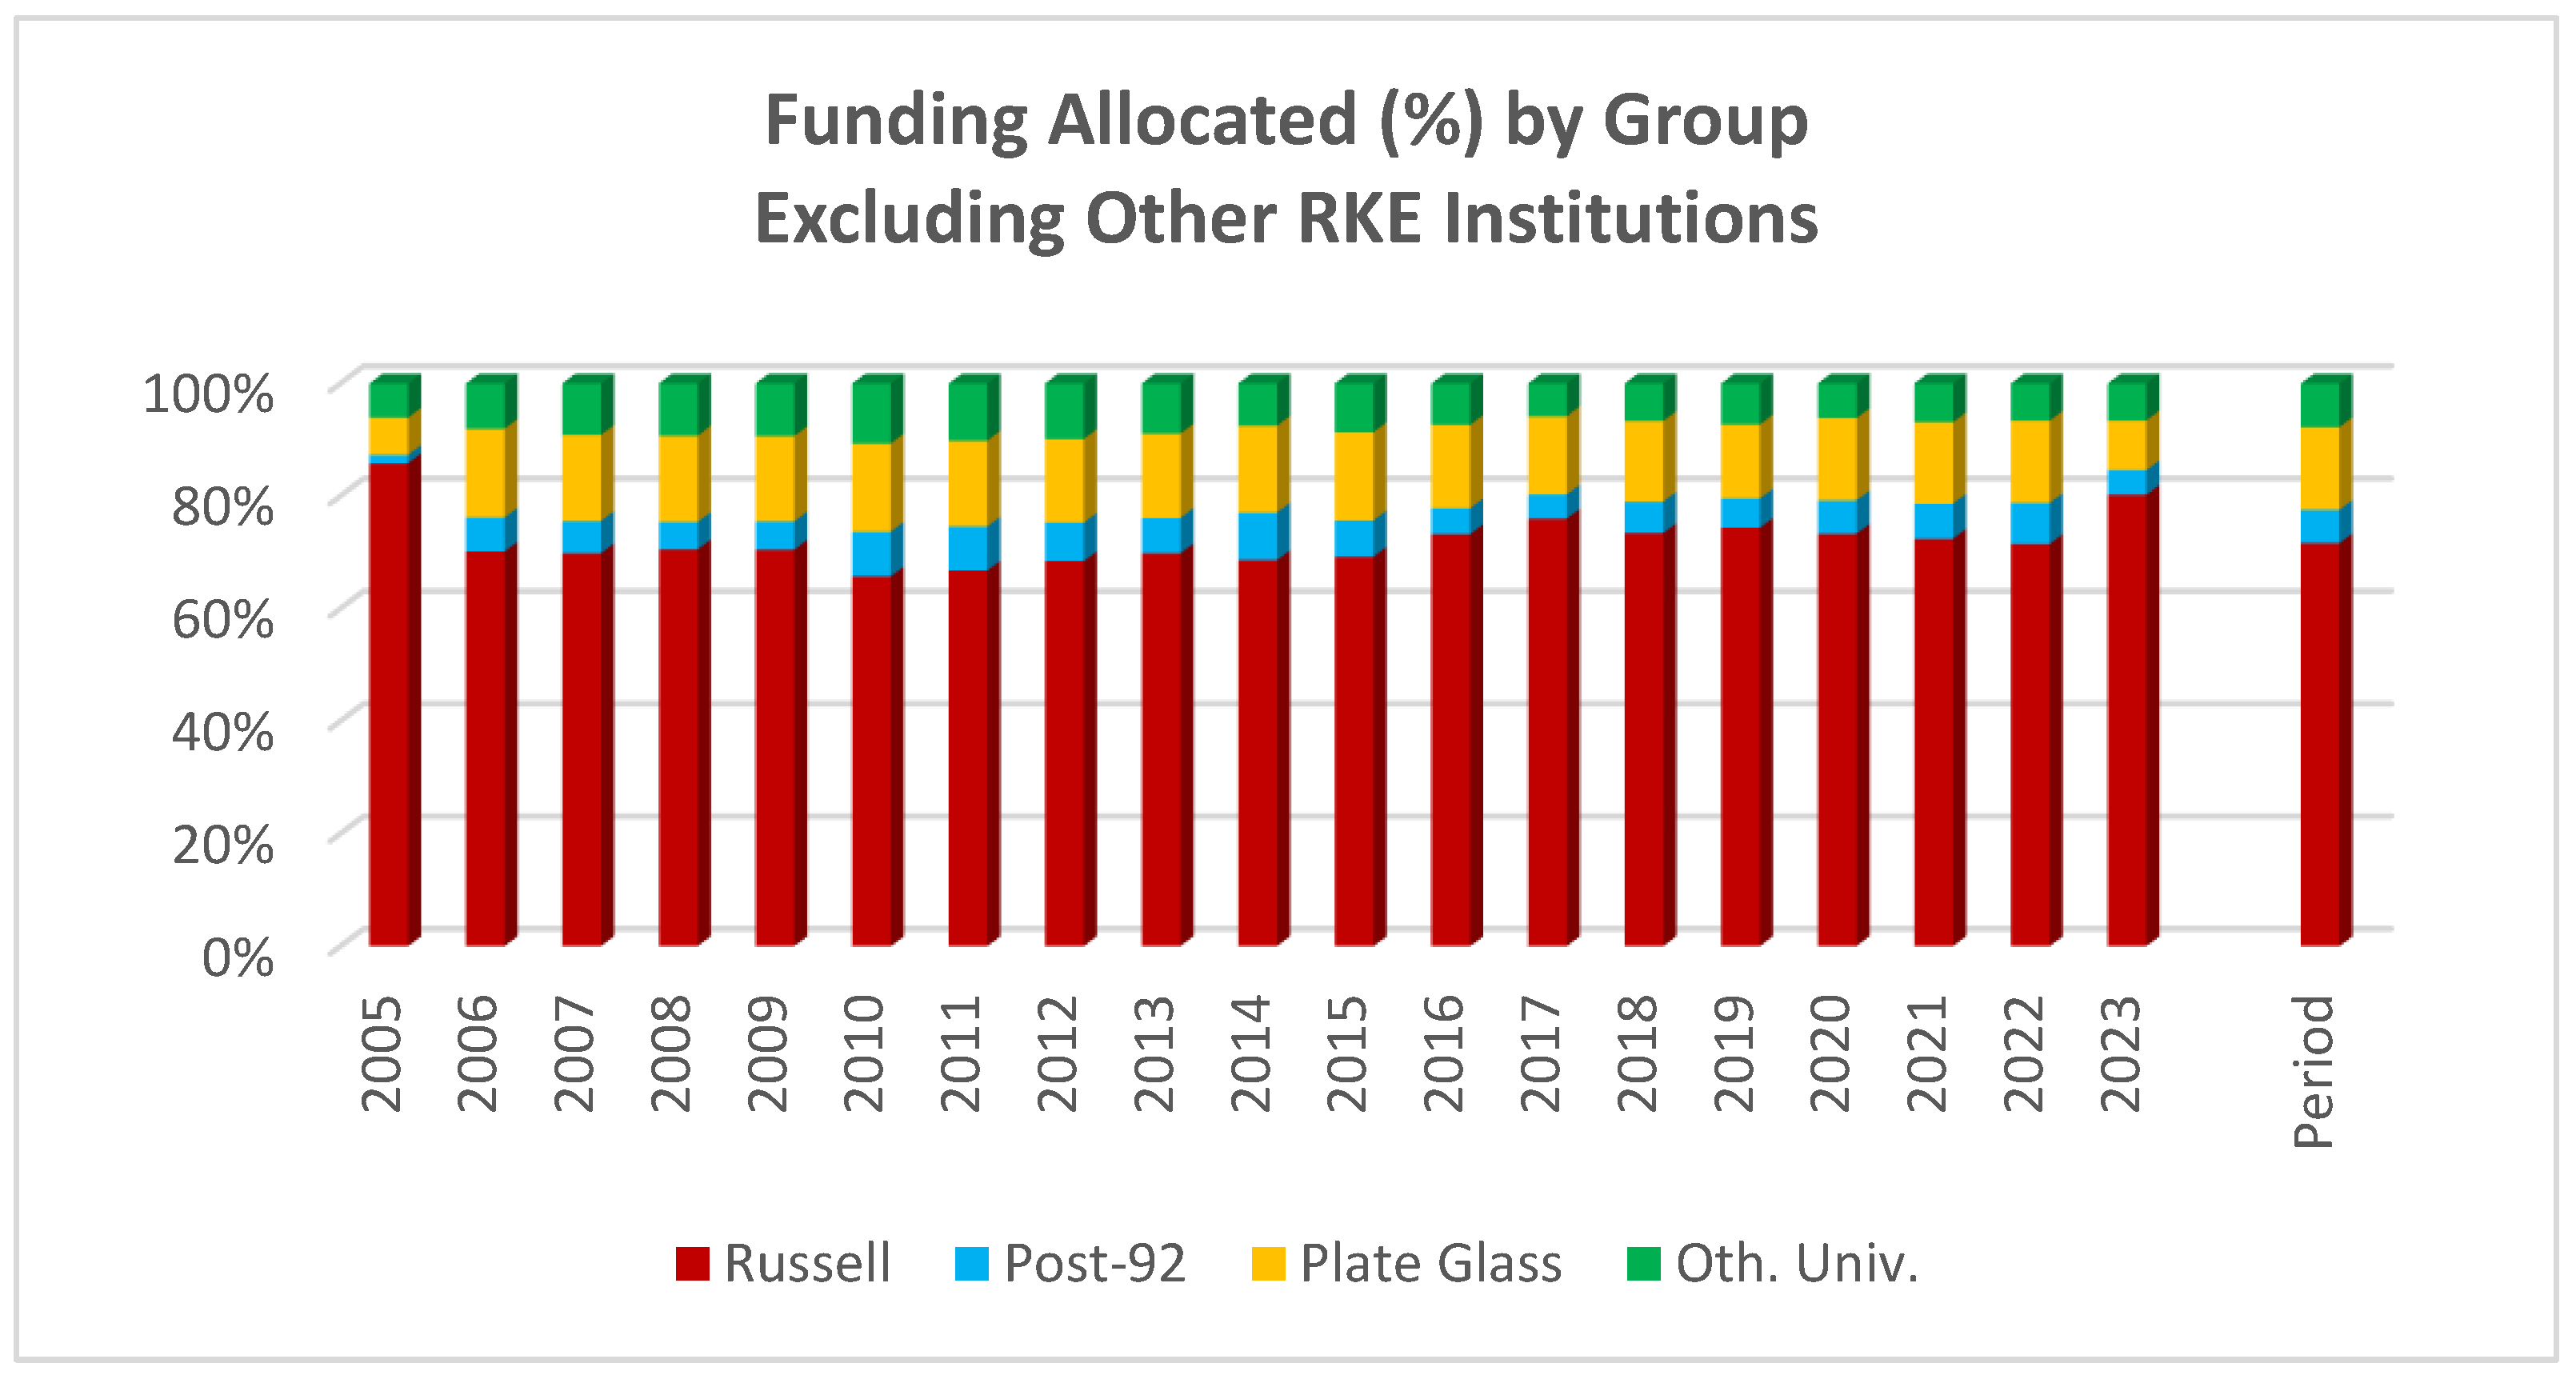
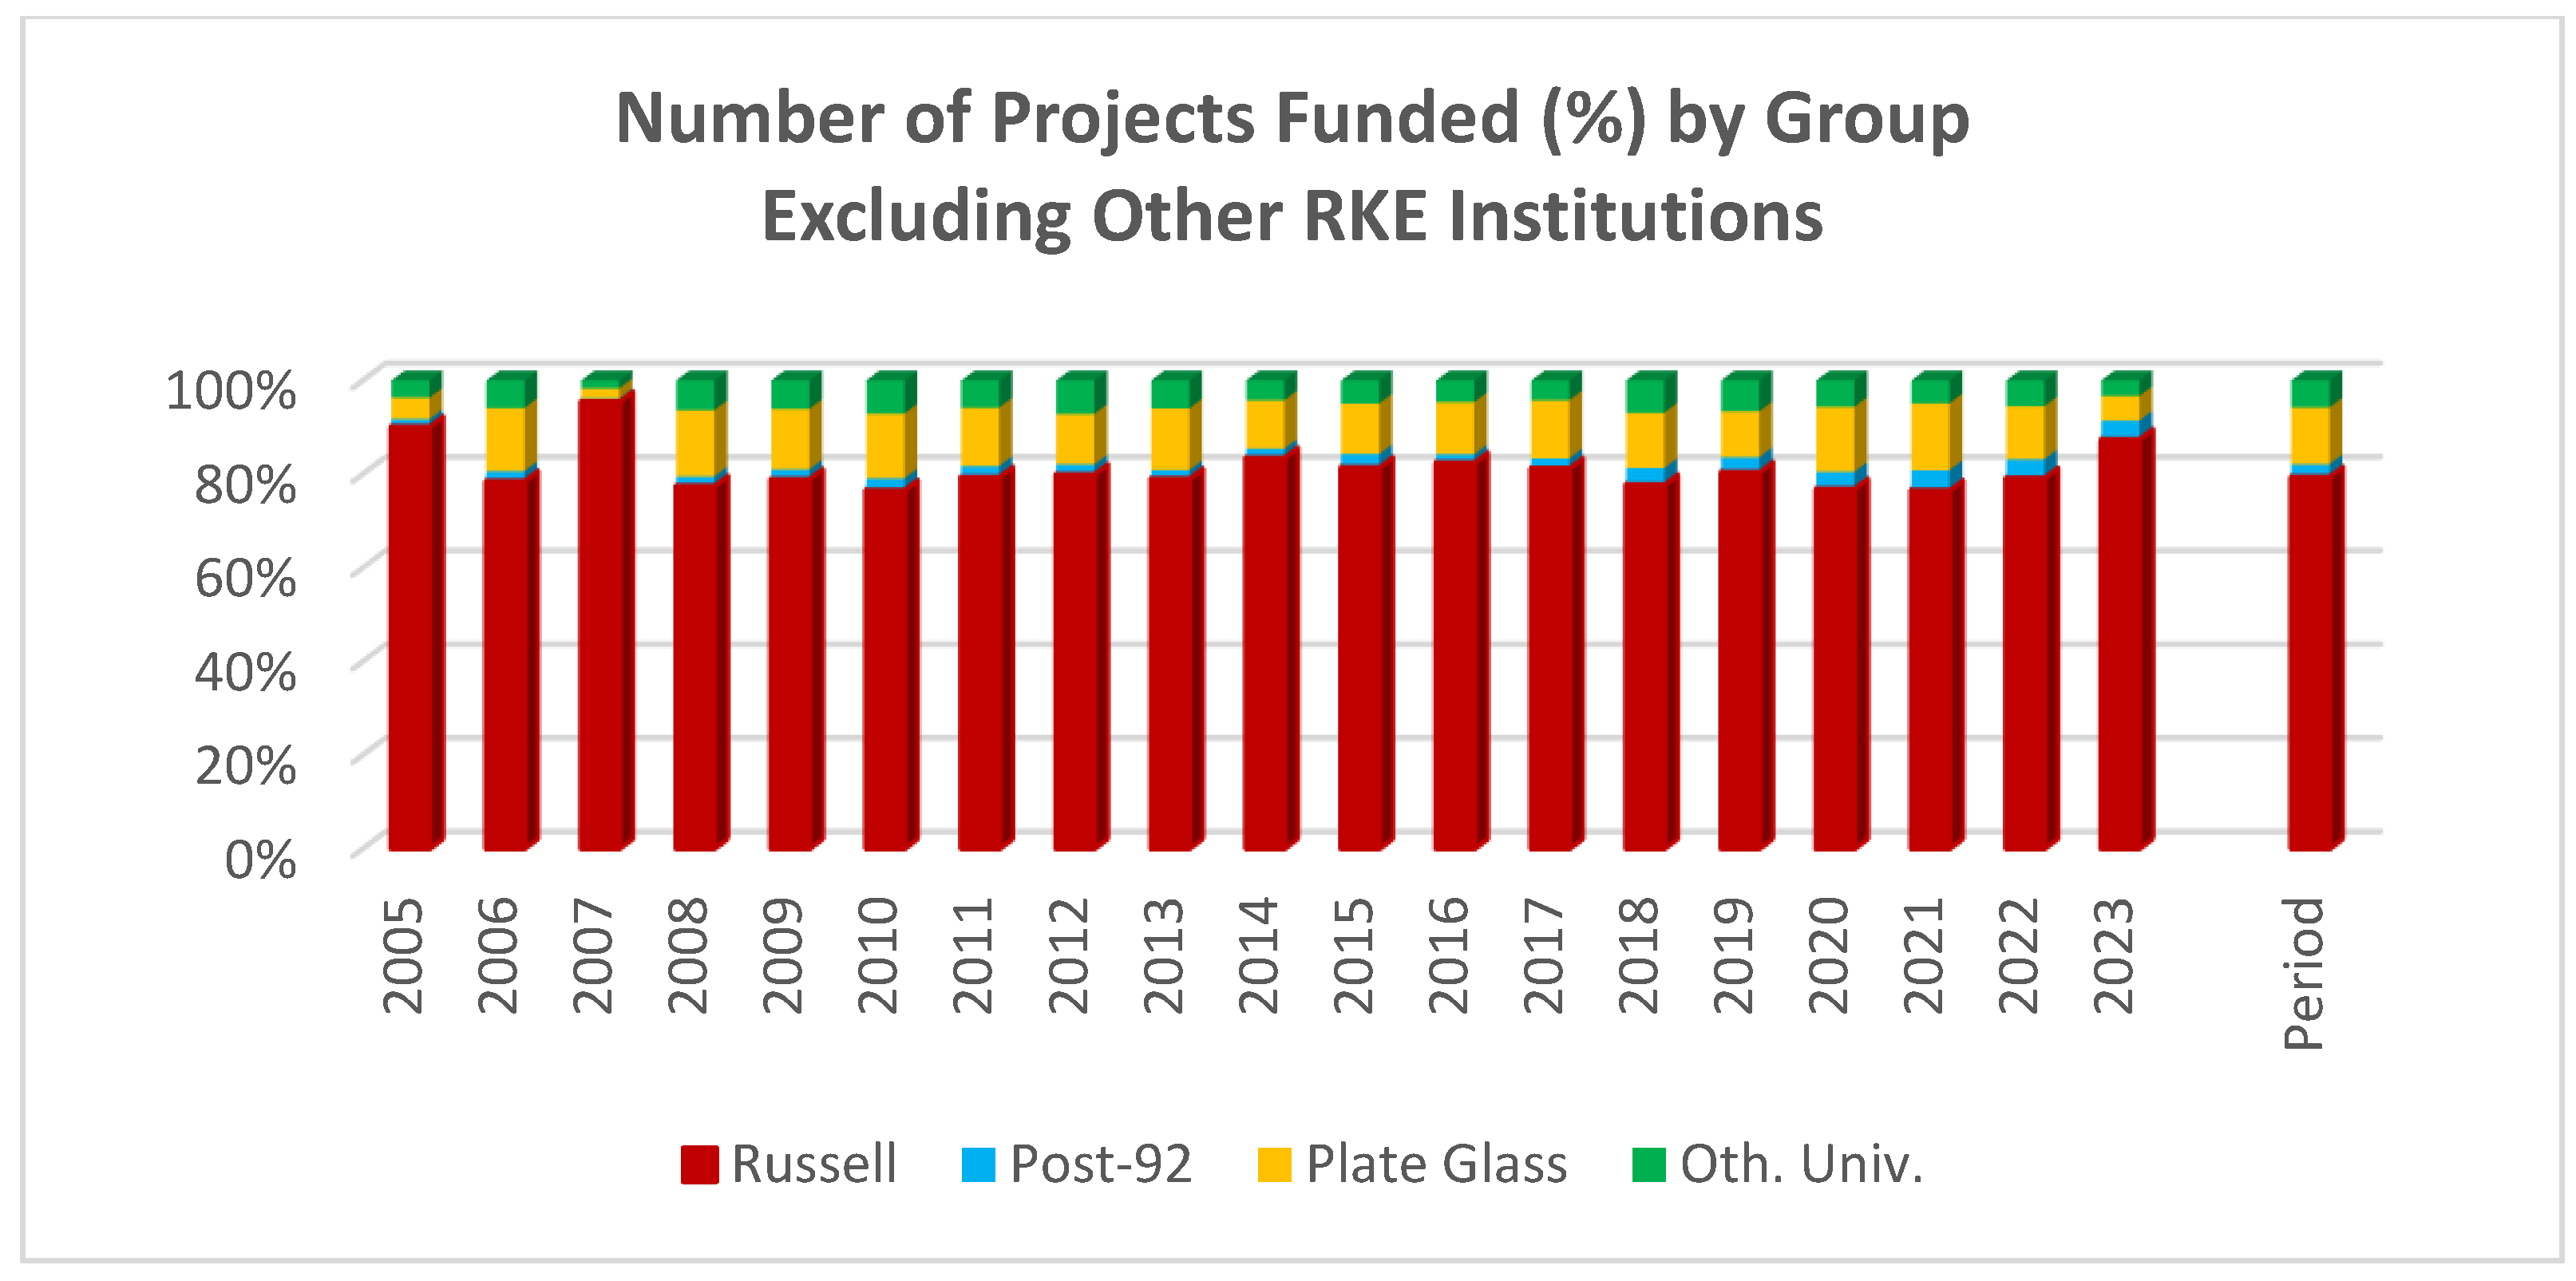
Given the lack of clarity over constituent members and fluctuating numbers of the ‘other RKE institutions’, further analysis removed them from consideration. When focusing only on university groups (
Figure 4 and
Figure 5) the disparity of funding allocation is even more apparent. UKRI has allocated a funding amount of £36,548 million to a total number of 100,338 projects to Universities in the UK from 2005-2023. Of that, Russell Group universities receive 79% of total funding compared to 12% funding allocated to Plate Glass universities, 6% to Other Universities, and only 3% to the Post-92 group. In terms of number of projects, the analysis highlights a similar dominance by Russell group universities; they have been awarded 71% of the funded projects over the period considered, whilst Plate Glass group have been awarded 15% of projects, Other universities 8% of projects, and just 6% of total funded projects going to Post-92 Universities. These percentages suggest that Post-92 universities may be receiving numerous small grant projects but may be failing in obtaining large grants.
Funding Allocation by Each UKRI Funder
UKRI oversee nine funding bodies which can be isolated in the data to show the distribution of their funding to the respective university groups (
Table 3). In addition to the nine funders, there is a UKRI funder category that have awarded fellowship grants and joint research grants. These are identified under the category of ‘UKRI other funds’ within the analysis. Between 2005-2023 the largest funders within UKRI are EPSRC (£15,652 million representing 28% of the total UKRI funding ) and Innovate UK (£12,235 million at 22%), while AHRC and NC3Rs’ spending is less than 5% of total UKRI funding. The differences between funding amounts given to funding bodies by UKRI may be due to UK Government’s view of certain areas as strategically important for the country’s long-term development. Funders that align with these strategic priorities may receive increased funding (Department for Science, Innovation and Technology, 2023). Given that EPSRC’s focus is on advances in Engineering and physical sciences, they support research that leads for example, to the development of new technologies, innovations, and engineering solutions. Conducting this type of research can be costly compared to other types of research. Similarly, Innovate UK’s emphasis on commercialisation of projects and industry collaboration may also need more funding to drive innovation and support businesses (especially SMEs – Small and Medium Enterprises) in the UK. Perhaps due to this reason, Innovate UK has allocated more funding to ‘Other RKE institutions’ (22% of overall funding). According to ‘Innovate UK: Impact Report’ (Gov Grant 2022), Rolls-Royce PLC claims 7% of all Innovate UK funding; and four of the five top entities they fund are research and technology organisations (RTOs) and Catapults. This again highlights the value in sometimes excluding ‘Other RKE institutions’ from the results of the analysis as it is inappropriate to include such as Rolls Royce PLC in a discussion about fairness in higher education funding.
While
Table 3 identifies the absolute values of funding given by each funding body to each university group, and the total percentage of UKRI funding they allocate, it is useful to understand how each funding body’s allocation is distributed. This would give research funding applicants an indication of the previous success, or not, of bids from the university group their institution aligns with.
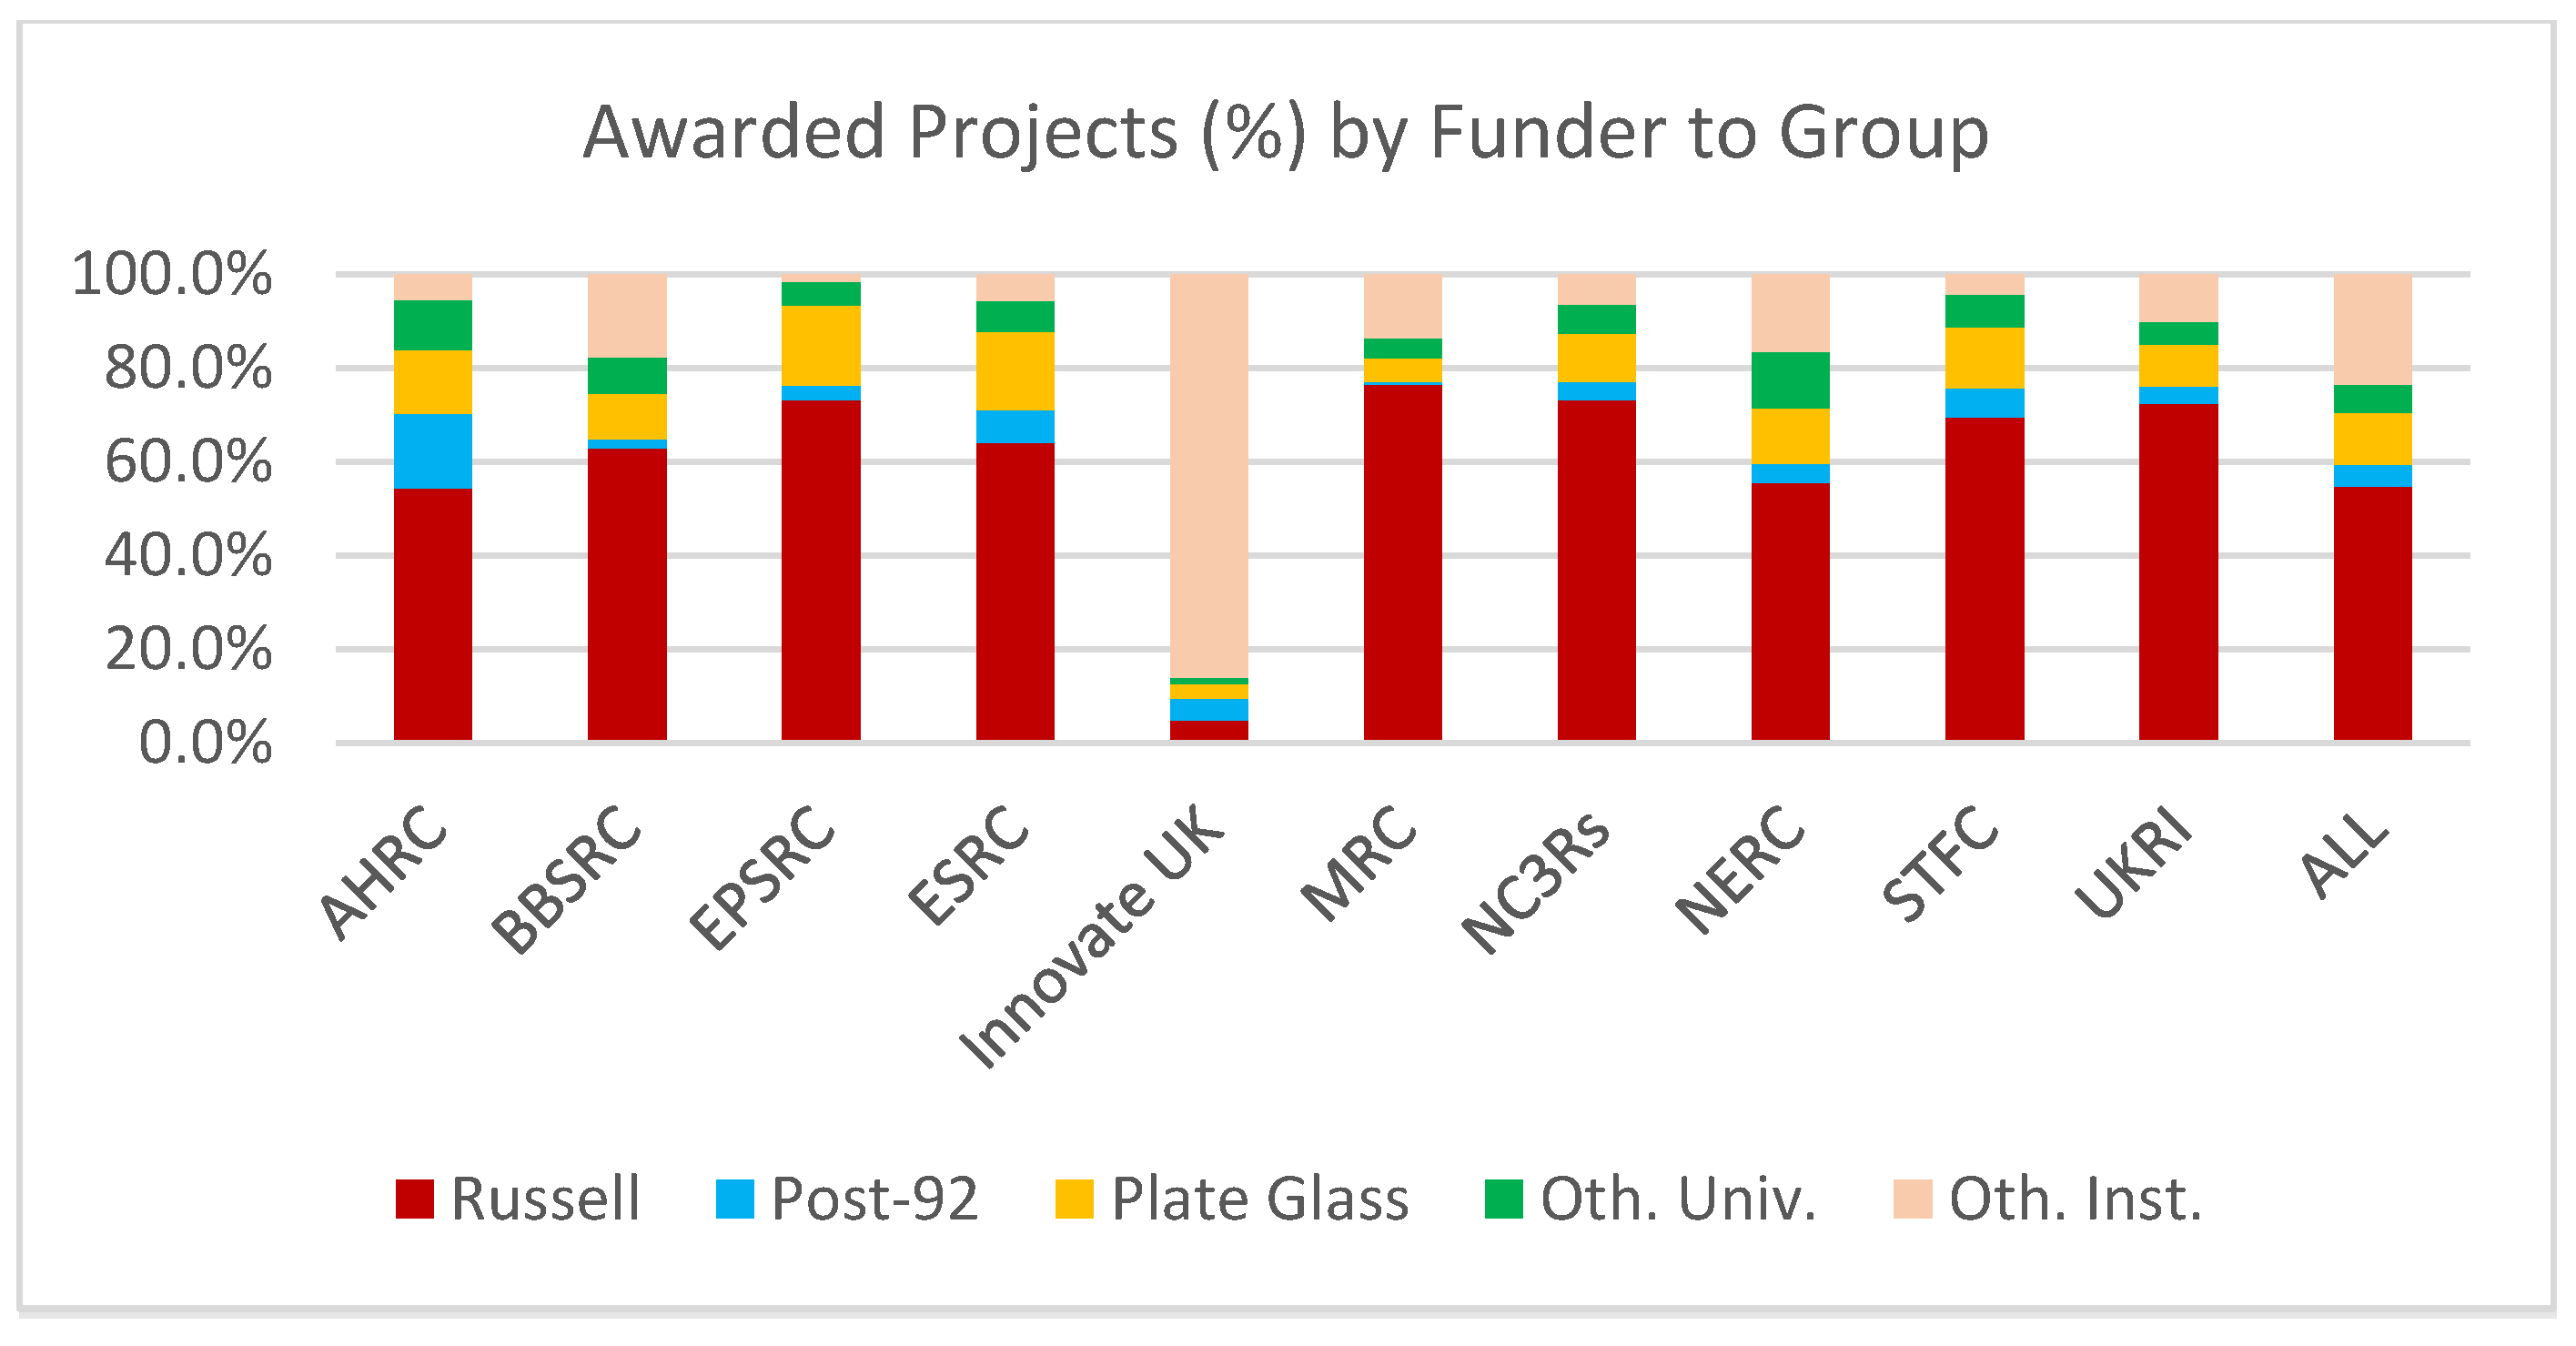
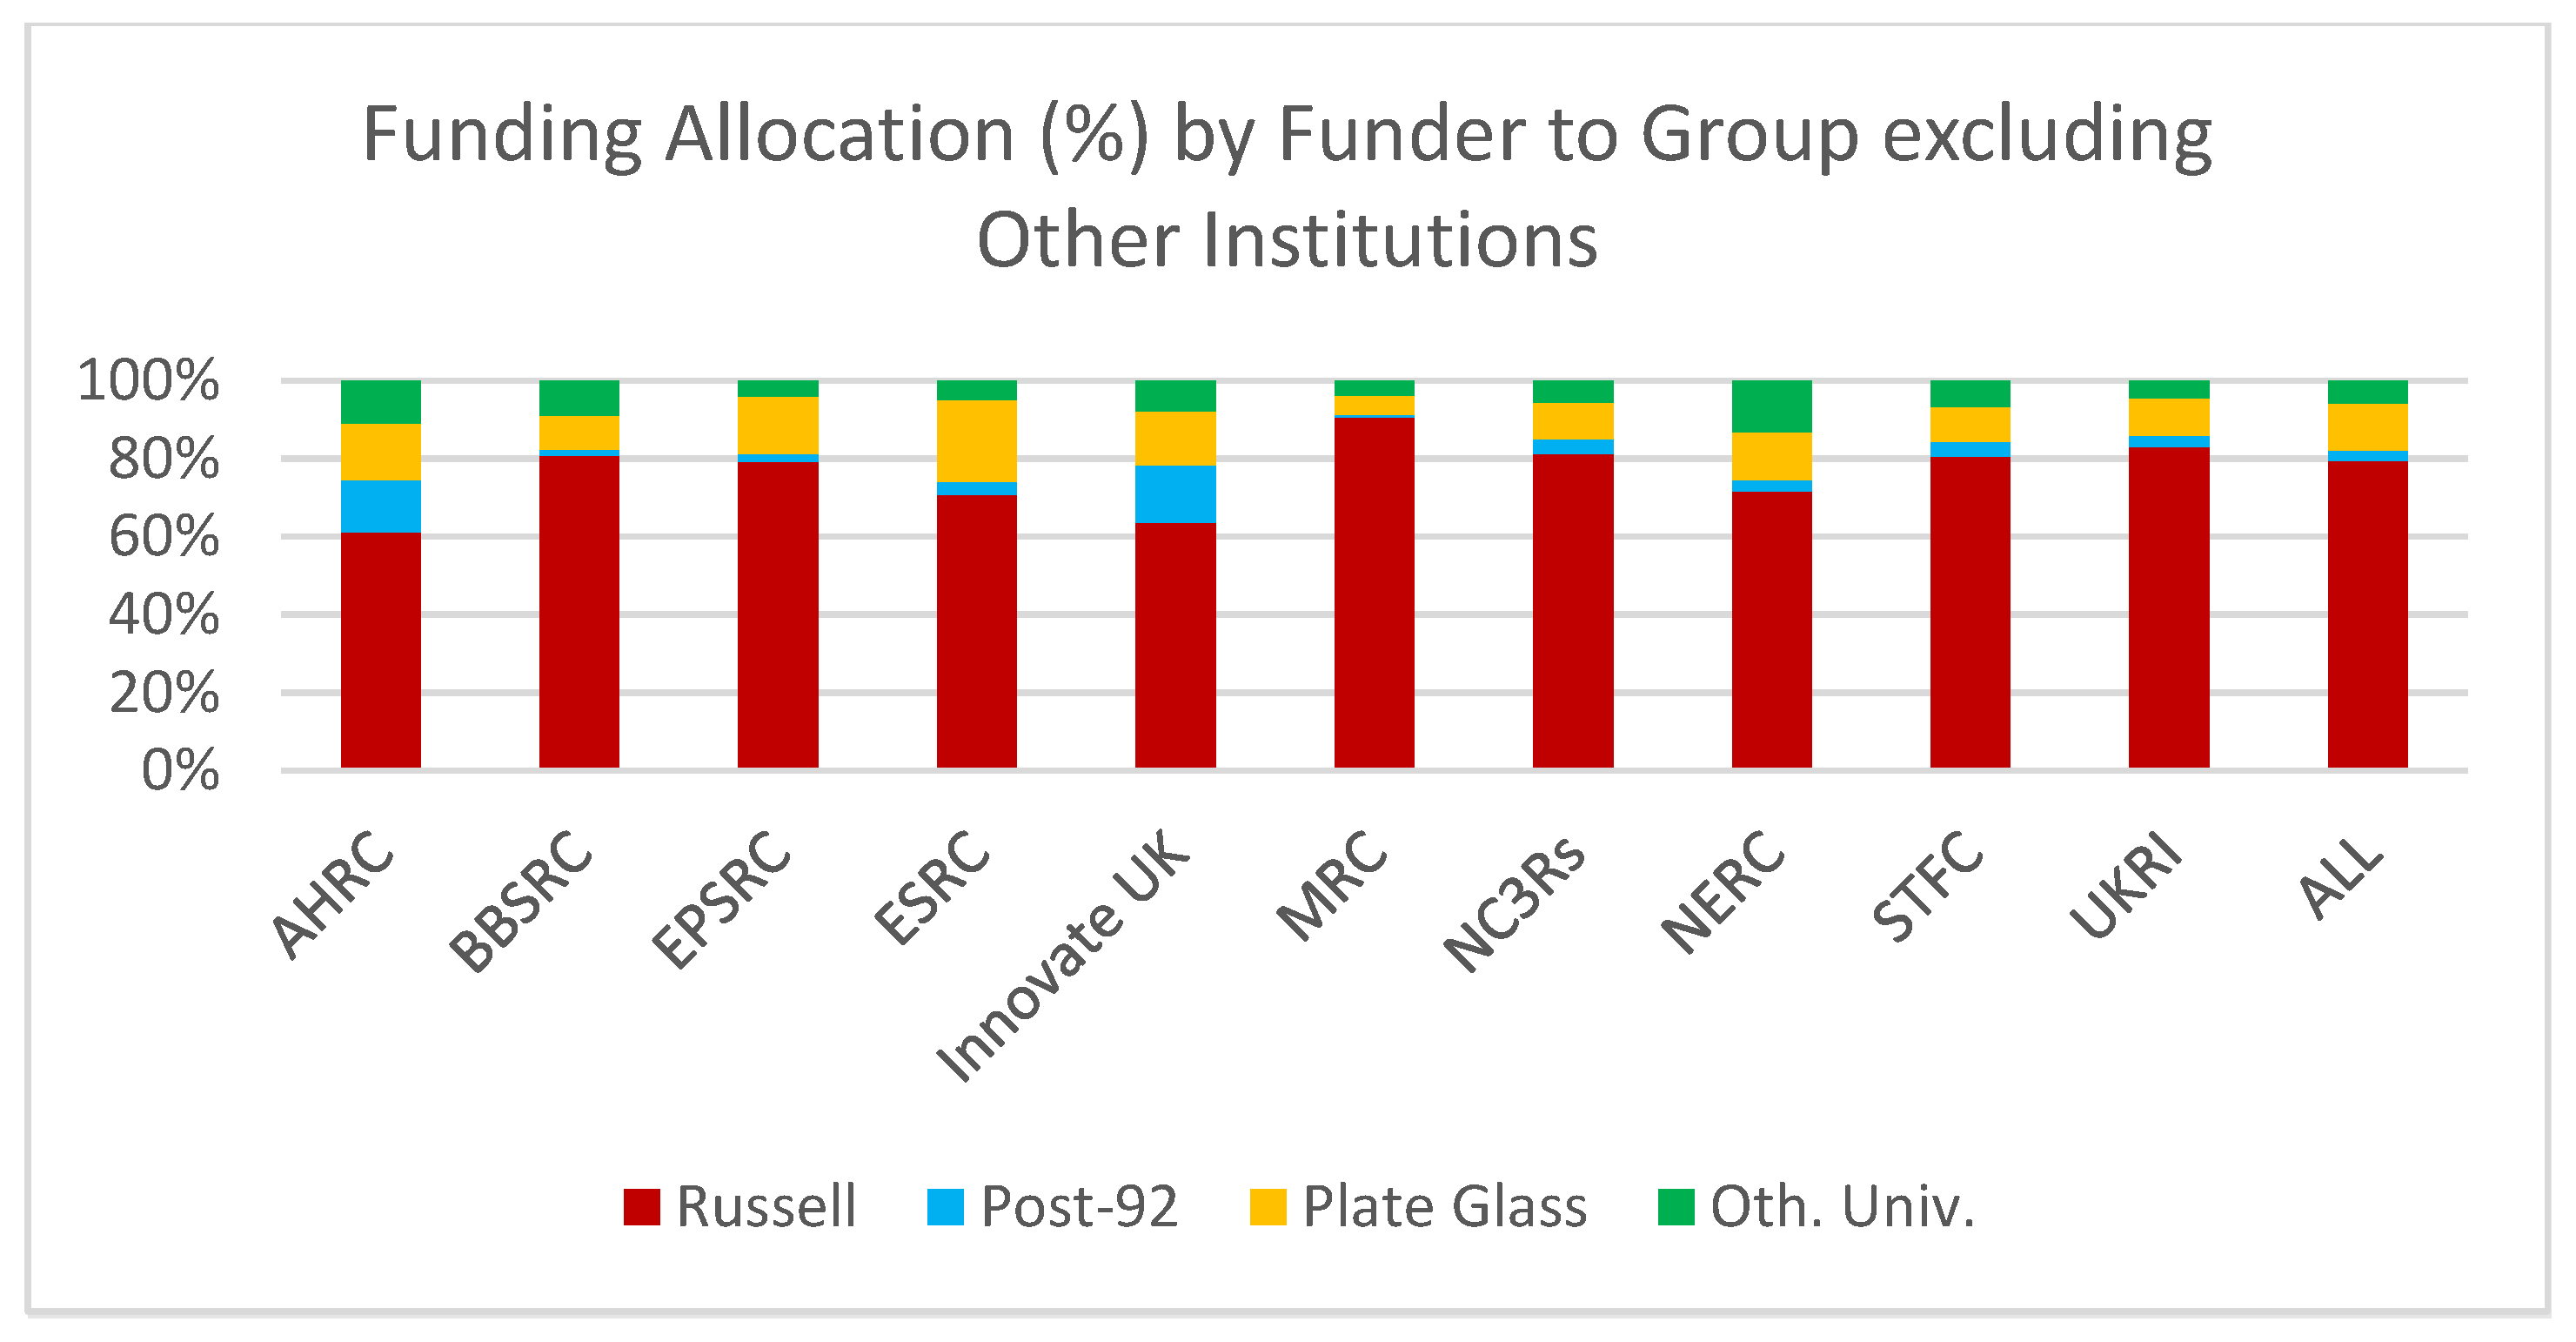
Figure 6 provides the percentage of each funding body’s awards per group on a monetary basis, and
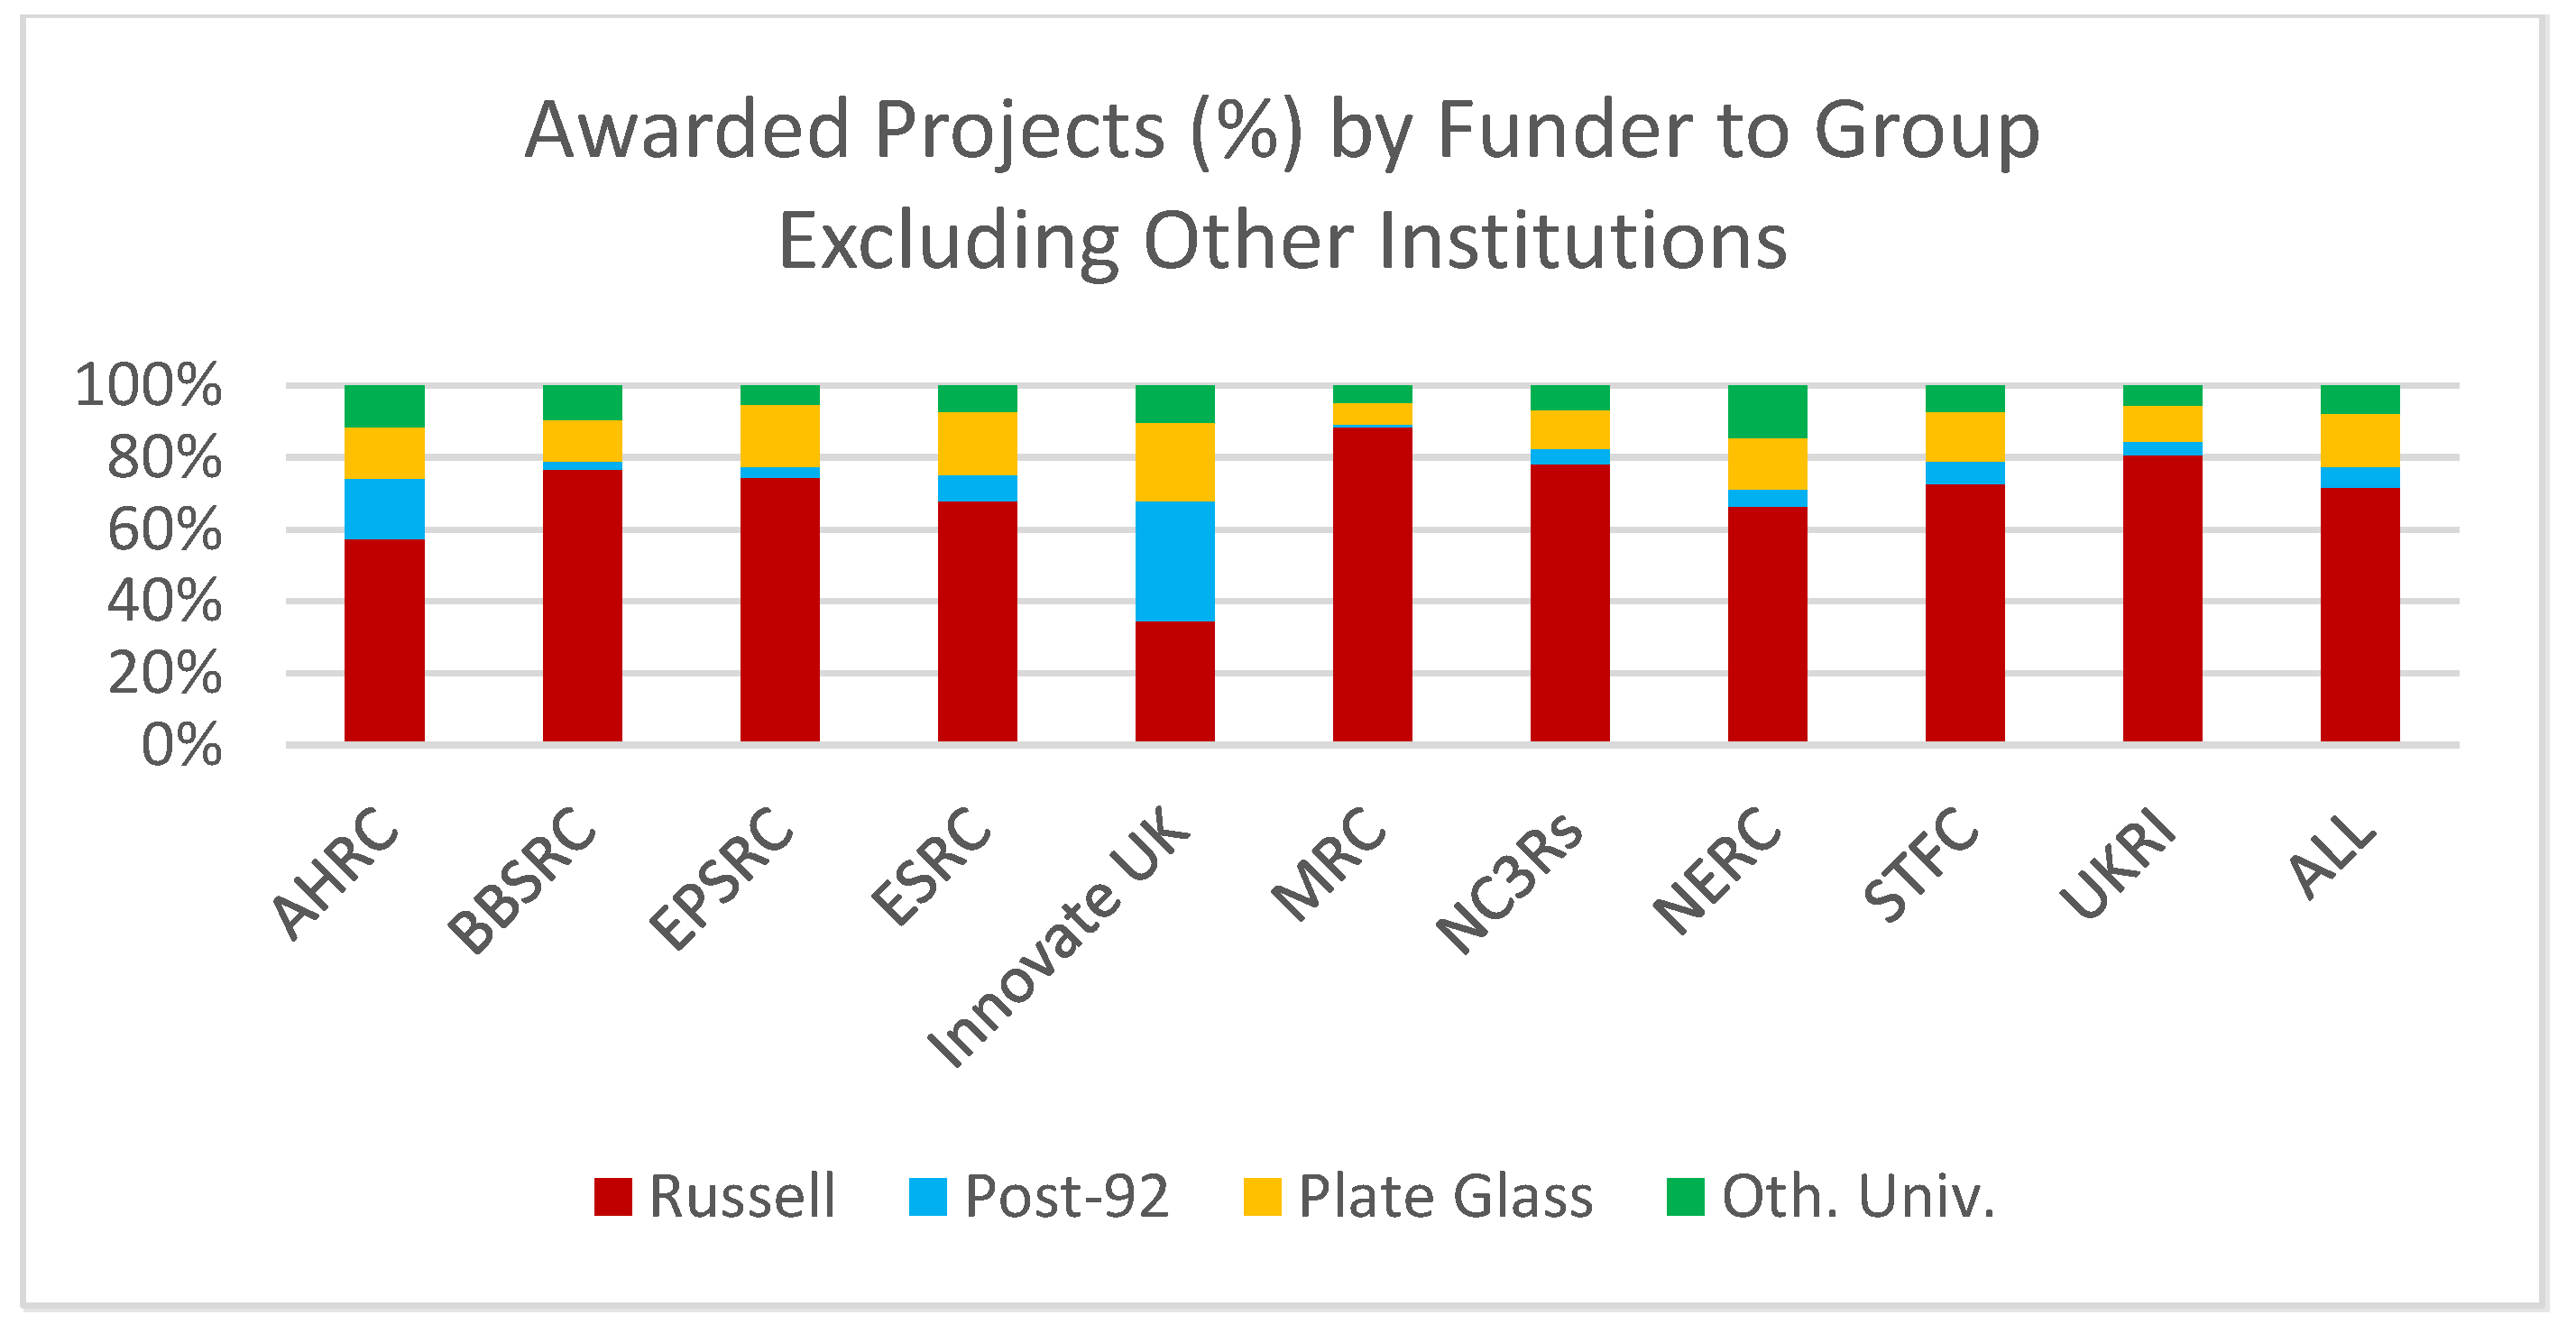
Figure 7 by the number of projects they awarded funding to (
Figure 8 and
Figure 9 replicate these calculations excluding the ‘Other RKE institutions’ group).
The data in
Table 3 and
Figure 6,
Figure 7,
Figure 8 and
Figure 9 identify that the Russell Group universities dominate awards from all funders except Innovate UK. Taking the largest UKRI funder by awards, ESPRC, they have granted a total of £15,652 million for 34,577 projects. Russell group universities have received £11,692 million (75% of ESPRC’s funding) of this, for 25,300 projects (73% of all ESPRC’s funded projects). Post-92 Universities have received just £115 million (1.8%) for 823 projects (3%). For the MRC’s funding awards of £9,090 million to a total of 11,457 projects, the Russell group has received £5,838 million (64%) for 8,759 projects (77%). Post-92 universities have been funded £34 million and have only been awarded 75 projects across a period of 18 years (2005 – 2023). This pattern is replicated across all nine funders, and it is not restricted to the Russell Group achieving the highest figure and Post-92 group the lowest. Despite comprising the same number of members as the Russell Group (24) the Plate Glass group typically are accorded similar percentages of funding; £300 million (7%) for 1,345 projects (8%) by the NERC, and £380 million or 6.5% of the BBSRC’s awards. It suggests that in regard of funding, the Russell Group universities are considered more suitable, more often by what has previously been identified as a flawed process to receive funding across all research subjects by a significant factor. This is made all the more stark when aware that there are only 24 universities in the group compared with 131 non-Russell Group universities, and many hundreds more ‘other RKE institutions’.
Funding Success Rate
To provide context to the decision-making it is relevant to consider the level of success of research project applications for funding from UKRI. It may be supposed that more funding is flowing to the Russell Group universities as they are research-intensive and simply submit more applications, generating higher absolute values. Data provided by UKRI on competitive funding decisions for the period 2015 to 2023 was analysed to identify the number and value of projects applied for and success ratios (
Table 4 – this data comes from a different series of UKRI databases and only extends to 2015, not 2005). Although the annual data varied, the differences are not substantial within the period so a year that represented close to the average funding award was taken (2020-1) to examine in greater detail (2020-21 was saw 21% of projects and 28% of award values requested approved compared with a 26/30% average for 2015-23). There were many more applications for Research and Innovation grants than Fellowship awards so they have been categorized separately, although success rates do not differ greatly.
The individual funders were also analysed for the period of 2020-21 (
Table 5).
It was then possible to divide the application success into individual universities and place them into their aligned groups (
Table 6).
As is evident, Russell group institutions enjoy more than double the percentage success for the value of their applications (31%) than the Post-92 group (15%). The percentages in the other groups are also lower than those of the Russell group, except the value to the Other Universities, although as
Table 3 highlighted the Other Universities only receive 3.8% of UKRI funding compared to the Russell Groups 52.8%. While the Russell Group might be more research-intensive, submit more applications, have more economic and human resources to support bids for larger amounts, they also receive more support for their bids from UKRI. Indeed, the top 20 positions of those universities that obtain funding for the greatest number of projects are occupied by Russell group members. In terms of value of funding within the top 20 positions, only one university is not part of Russell group. The vast majority of universities in the Post-92 group which submit research projects do not obtain any or are successful with just a single project. Only 13 universities in the Post-92 group obtained more than a million pounds in funding.
Discussion
UKRI Funding Allocations: Redressing the EDI Gaps
The analyses show in multiple ways that a bigger proportion of the funding goes to Russell Group Universities. The data consistently highlights that there is lack of equality, diversity, and inclusivity both in terms of funding allocation and number of projects awarded across university groups, and especially relating to the Post-92 Universities. These universities, as identified by measurements such as social inclusion within university rankings (The Times, 2024), contribute to greater equality of opportunities for student populations and reduce the impact of economic discrimination. Reduced UKRI funding can create a challenging situation for Post-92 universities to secure external funding from other sources, as potential collaborators and funders consider a University’s ability to attract prestigious grant as a potential factor for experience, creating a vicious catch-22 situation of limited funding opportunities. Further, if post-92 universities keep on struggling to secure funding, they may fail to attract and retain research-focused academics, which will make it difficult to build and sustain a research profile.
Notwithstanding the above, UKRI has created a working group to implement a plan to align the institutions with their EDI strategy. The ‘UKRI Workforce Equality, Diversity and Inclusion Plan 2022 to 2026’ (UKRI, 2023f) identifies “how we will build a more inclusive culture at UKRI, to offer opportunity for all, and to develop the diversity of people and thought we need to be a world-class organisation”. This is a positive development, and the organisation notes how their plan meets and exceeds the legislative requirement of their Public Sector Equality Duty. Despite this, when analysing the priorities of the UKRI working group (UKRI, 2023f), there is still a lack of planning to address the under-representation of some groups within their funding allocation. The UKRI fund Strategies Priorities Fund, (UKRI, 2024) aims to: increase high-quality multidisciplinary and interdisciplinary research and innovation; and ensure UKRI investment links up effectively with government research and innovation priorities.
There is a mismatch between current UKRI funding allocation under these aims and their EDI strategy of ‘by everyone, for everyone’. There are no specific priorities and measures aimed at redressing the restriction placed on research, through a lack of funding, for the research communities within Post-92 universities.
There are means by which UKRI can improve equality, diversity, and inclusivity within their funding that is approached in a calculated and systematic way. Work has been published (for example, Pinkett, 2023) that includes tools and metrics to measure the content of an EDI strategy. Regarding equality, Hao and Naiman (2010), propose measurement via probability density functions (PDF), cumulative distribution function (CDF), quartile function, and Lorenz Curves. Percentile shares have become a popular approach for analysing distributional inequalities, especially by Piketty (2014), and other authors, such as Jann (2016), have developed the analysis of percentile shares, using STADA software. Further, Arcia et al. (2011) have developed ADePT software that can be applied to education EDI indicators such as education expenditures or school progression that can be adapted for UKRI funding. Other work by Broer et al. (2019) examine changes in inequality of education outcomes over a 20-year period, analysing trends in different socioeconomic groups. Several authors have used Lorenz curves and Gini Index to measure inequalities in education systems. Thomas (1999), in policy research for the World Bank, has proposed two methods (direct and indirect) for calculating an education Gini index that is currently applied to 85 countries. Digdowiseiso (2010) used the direct method focused on estimating the Gini coefficients and the indirect method applied to formulating Lorenz curves while Wörner (2018), measures performance in an unbalanced university system in Chile. More importantly, it is observed that the ESRC funding body (effectively UKRI themselves) use Gini coefficients to internally analyse “key information on the distributions of research applications and funding among Research Organisations (ROs)” during the period 2011-17 (UKRI 2021). This report also includes the top 10 applicant organisations by value, all members of Russell group.
Therefore, there is an established methodology for measuring inequality within an education setting, namely the Lorenz curve and the Gini Index. The use of these techniques is widely used to measure wealth inequalities in countries or regions, but also can be used for specific groups such as companies, organisations, and institutions. In these cases, the economic unit of population is usually the worker, and the defining variable is the salary measured in monetary units. But this relationship can also be extended to other types of units such as individual universities or groups of universities that exist in a country, and the defining unit is the budget of each unit of the total population. Adapting this concept to the context of this paper, the units would be the groups of universities and the amount of funding that each university receives for research. In this way, it will be possible to explore inequalities exist between different groups, and globally.
For considerations of diversity, Budescu and Budescu (2012), review three popular approaches; one, based on a simplistic majority-minority; two, using multiple categories variants; and, three, the generalised variance and an entropy statistic approach. Other proposals of measuring diversity are found in a Handbook of workplace diversity by Harrison and Sin (2006) and a conceptual guide published by Roswell et al (2021). This work retains the use of Gini coefficients to also analyse diversity.
The analysis of inclusion is more difficult as it relies on information that may not be available or easy to obtain. To measure inclusion, there are indicators focused on social dimensions, as proposed by Atkinson et al. (2002), measured in terms of progress over time. More recently, Jaegler (2022) has proposed a new tool, which instead of the usually criticised general rating, generates a rating that measures the level of inclusion of all stakeholders of higher education for different dimensions.
After carefully considering different measures and reasons mentioned above, the authors of this current work have adapted the Gini index for equality and diversity; and to measure levels of ‘inclusivity’, the authors have calculated the number of institutions that have been funded (i.e. considered/included for funding). According to Hasell (2023), Gini Index (GI) measures inequality as a percentage from 0 to 100%. A value of 0 indicates perfect equality – where everyone has the same income. A value of 100 indicates perfect inequality – where one person receives all the income, and everyone else receives nothing. The results of this analysis are presented in
Table 7, with the results are sorted in order of the funding body that has met EDI most effectively using these metrics.
The results show that Innovate UK is the funding body, which better performs in terms of Diversity and Inclusion. In terms of the latter, they show wider distribution of funding across institutions, but this may be possibly because this fund focusses more on institutions and companies. Due to this reason, if Innovate UK is excluded, the findings show that AHRC performs slightly better in terms of all components of EDI principles, due to their lower equality and diversity scores and higher inclusivity score. MRC perform weakest for both equality and diversity, giving them the most to do in terms of achieving UKRI’s EDI strategy, however the remaining funders are not greatly different in their results for these categories. Further, given that there are 155 universities (
Table 1), and the inclusion figures in
Table 7 additionally consider the many hundreds of ‘Other RKE institutions’, all funders have a considerable task to improve their level of inclusivity within their funding decisions.
Conclusions and Recommendations
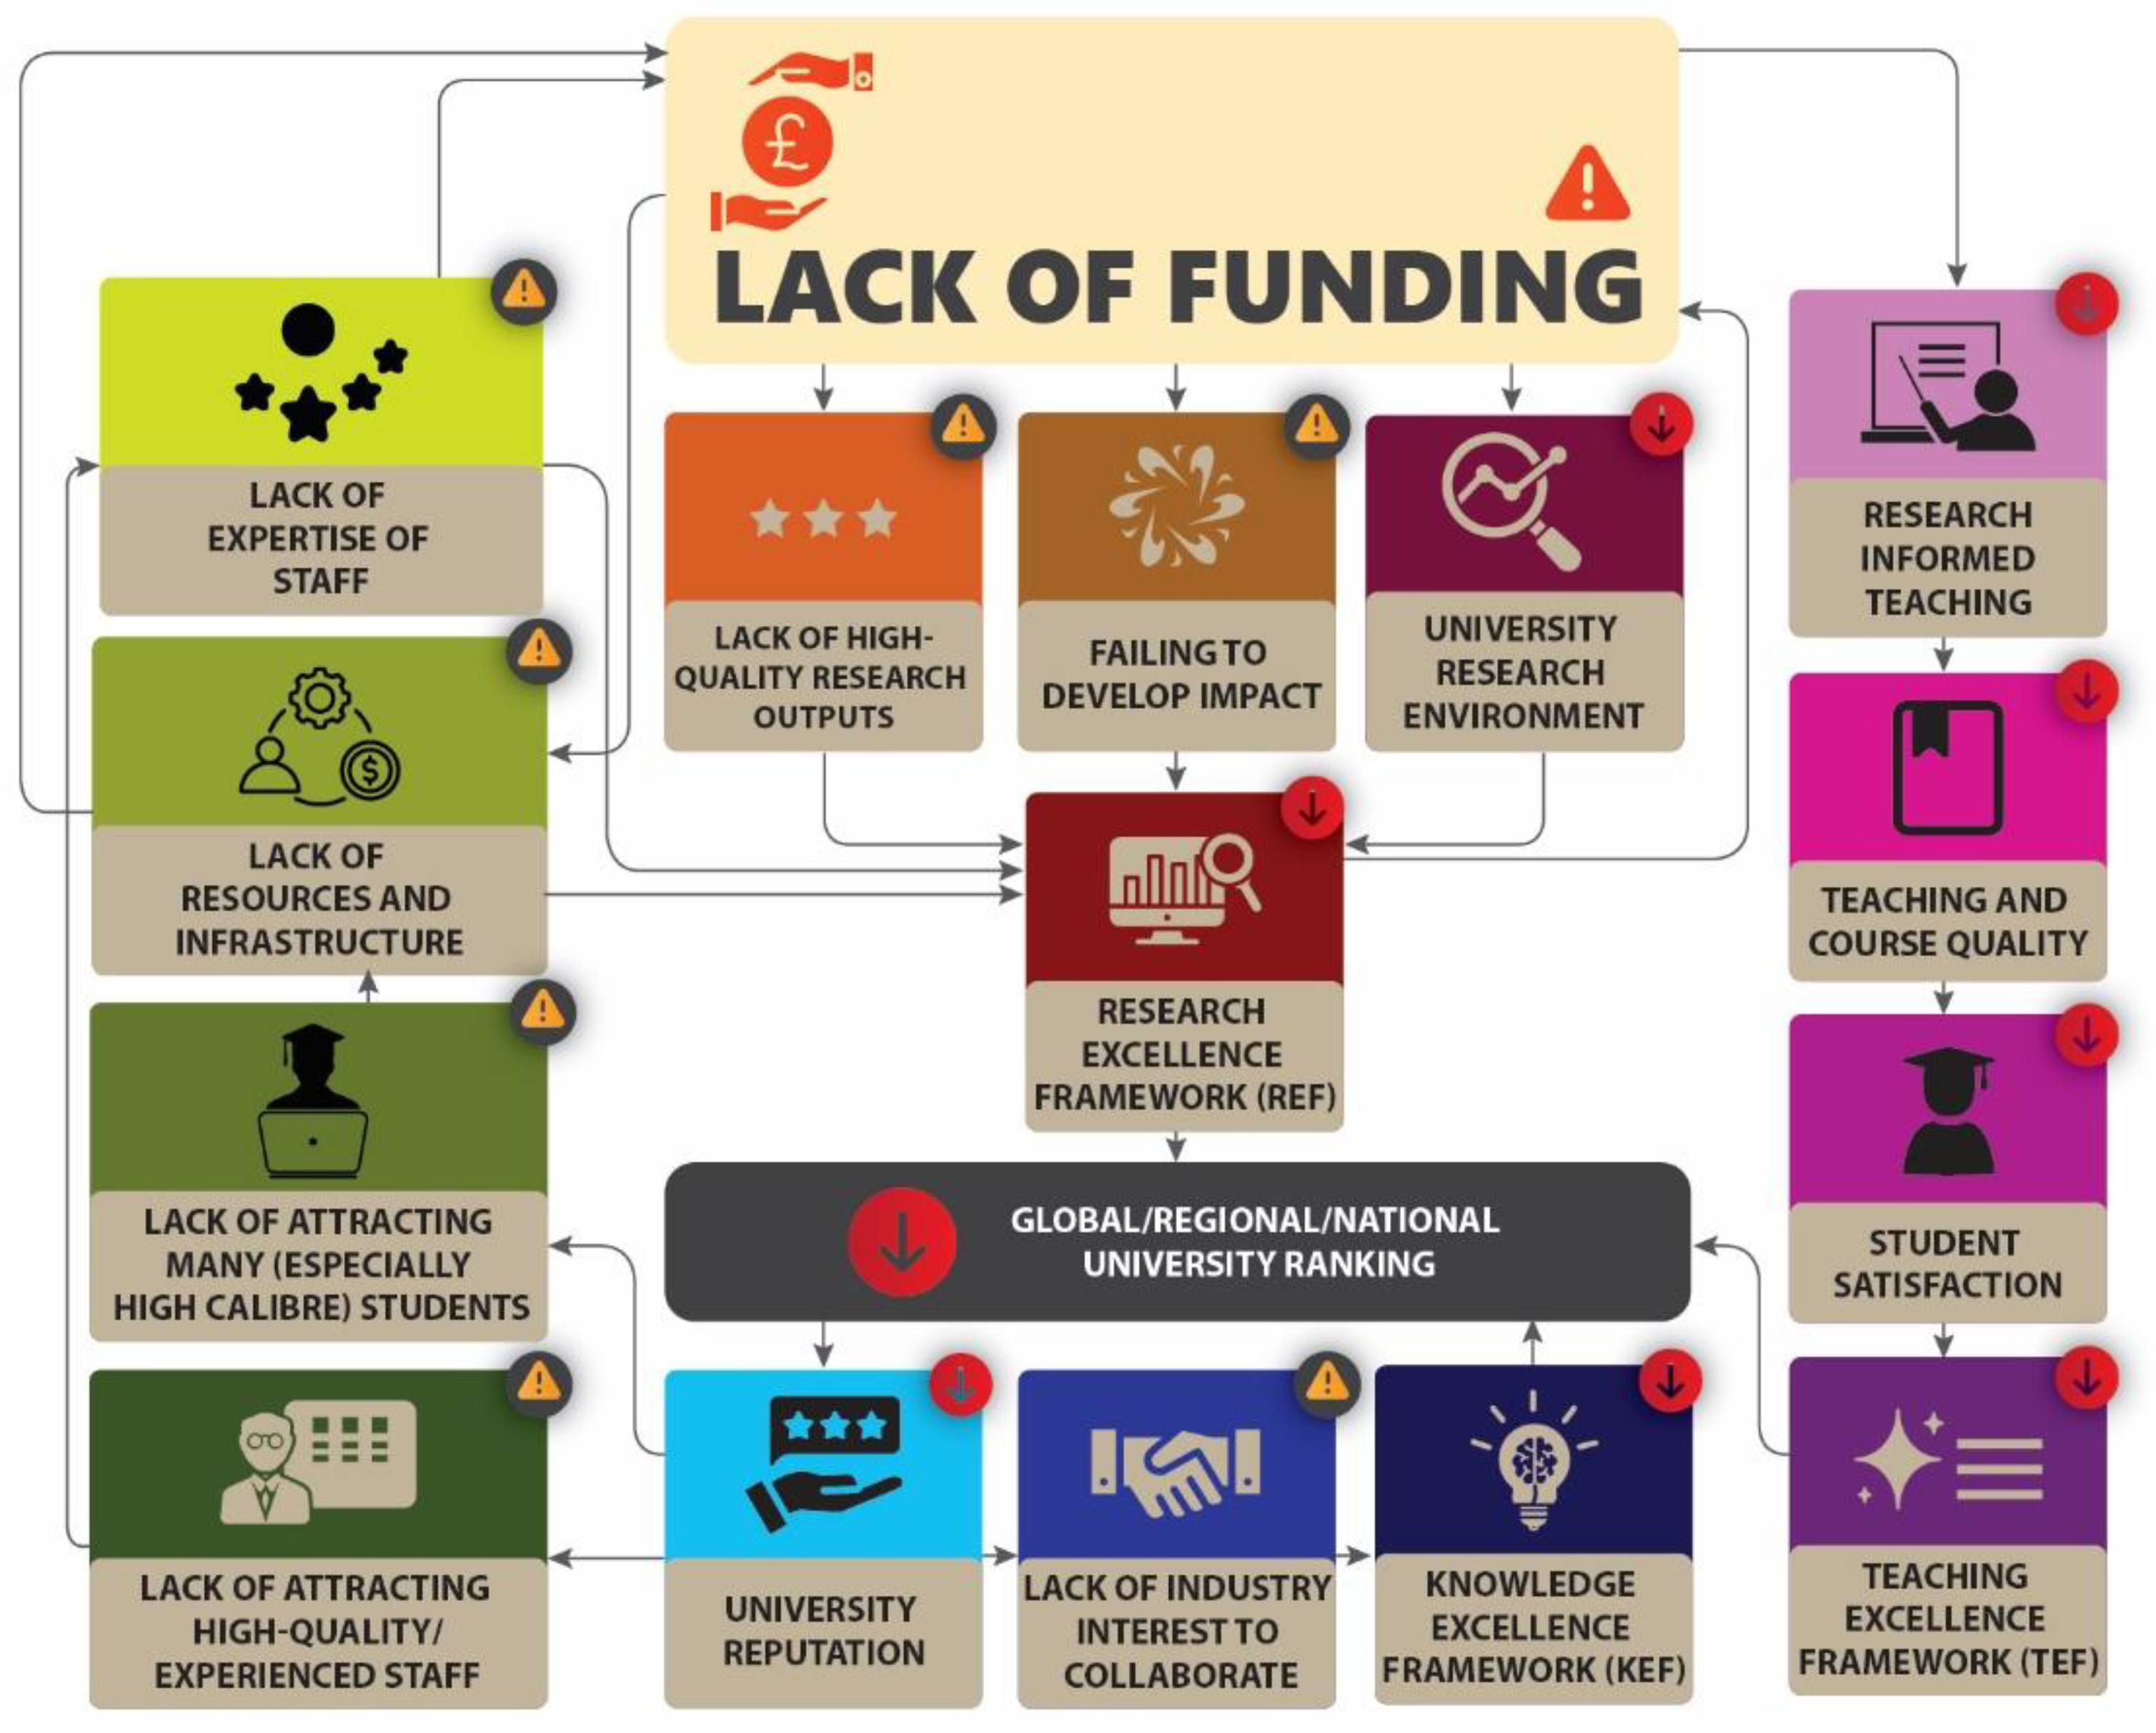
The analysis carried out in this paper show a clear disparity in UKRI funding allocations. Since the funding analysis was carried out for the period of 2005-2023 (18 years), it is also evident that the differences in funding allocation has not significantly changed for decades. If this trend continues, the poorer resource settings (i.e. Post-92 universities) will always remain poor. Lower research income will have a cascading effect on various aspects of university operations, potentially impacting on the Research Excellence Framework (REF) ranking and position in league tables, which will in turn have a damaging effect on attracting high-calibre students and academics to research and teaching programmes (
Figure 10 illustrates the way impacts flow around funding).
There are a number of other challenges in not attracting sufficient research funding: In engaging in or conducting impactful research (one of the criteria for REF assessment); In producing high quality outputs that have a significant knowledge contribution (another criteria for REF assessment); In recruiting and retaining high-calibre academics/researchers, which will impact on research environment (another criteria for REF assessment). Less funding leads to issues for teaching quality, resources, and overall student experience. In underfunded institutions there is a diminishing visibility of academics and consequently the overall reputation of the university. This will also lead to reduced interdisciplinary collaborations, international partnerships and as a result, reducing the university’s ability to engage in research at a global scale. There will be a lack of investment in research infrastructure and facilities, which can hinder the ability to perform cutting-edge research. Similarly, a lack of funding will hinder a university’s ability to engage in knowledge transfer activities and contribute to innovation.
Although UKRI have a robust EDI strategy, the analysis of this paper also showed that all the funding bodies that come under UKRI have a lot to do in achieving equality, diversity, and inclusivity within their funding programmes. As of now, the majority of the funding goes to Russell group universities (with the exception of ‘Innovate UK’). This is not surprising given their long-standing status in research. They attract high-quality staff/researchers; they have a good reputation, which attracts more collaborations; they have better laboratories and facilities; they have more resources to support research bid writing, thus, it is not surprising that their track record of winning research grants is high compared to other groups like Post-92 universities. Boliver (2015) notes that many of the older, and Russell Group universities position themselves as ‘research-intensive’ whereas Post-92 institutions have used terms such as ‘teaching-led’ when describing their activities. The data from UKRI suggests the Post-92 group have little choice but to highlight teaching if they want to put a positive focus on their position within UK higher education. Yet UKRI could, and should, be doing more to address this situation, and give more opportunities to a more diverse group of organisations and the people within them. As Degl’Innocenti et al. (2019) highlight, universities are heterogeneous bodies, with differing strengths, assets, and institutional compositions. Yet the results of this research show a clear pattern in the resources/funding that are allocated in the main to one relatively small group of elite institutions. Overall, if UK universities and their related teaching and research activities are to be sustained and to withstand and respond to global challenges, the other groups of Universities need to exist and evolve (as research-intensive). Since UKRI is a public entity that coordinates research and innovation activities across various sectors, including higher education in the UK, they have a key role in achieving the above. UKRI was heavily criticised by Woolston (2022) in the wake of Brexit amidst changes to established funding programmes that suggested the “UKRI funding scheme is being made up as we go along”. Thus, it is high time that UK government and UKRI had a look at their funding strategies to make it more equal to all, and to standby UKRI’s broader EDI aim (UKRI, 2023c), to “foster a research and innovation system by everyone, for everyone”.
Based on the above, some key recommendations, towards UKRI EDI policy and funding strategies can be given to address the key challenges and gaps existing in the current UKRI funding environment:
1. Changing UKRI Equality, Diversity and Inclusion strategy to Equity, Diversity and Inclusion strategy, according to University College London’s ‘Our understanding of EDI’ (2024);
Equality and Equity are both concepts that relate to fairness, but they are different. Equality assumes the objective is to treat everyone the same regardless of their starting point or their needs. A key shortcoming of this approach is that it can be blind to the historical and structural disadvantages of different members in our communities and in doing so can perpetuate disparities. Equity on the other hand gives strong consideration to the different starting points for different individuals and therefore aims to achieve fairness by providing resources according to need. Equity acknowledges the historical, systemic and structural disadvantages that different cultural and social groups may have been subjected to and strives to reduce barriers.
The above is what UKRI requires to consider as well, if they are to give strong consideration to different standards of proposals, by considering different starting points of different universities/groups.
2. Development of a fairer scoring criteria that is transparent and reflects on the aforementioned equity principles. Transparency will help Universities in understanding what is expected in different funding calls and how decisions are made when allocating funding (especially large grants).
3. Development of targeted support funding programmes for less-resource intensive Universities, e.g. specific grants aimed for these universities.
4. Diverse representation in decision-making (when allocating funding) within UKRI to ensure variety of perspectives and experiences.
5. Development of different funding models to accommodate diverse needs and strengths of less-resource intensive Universities, e.g. flexible funding structures adopted by EU funding bodies; allowing mandatory collaborations between Russell group and less-resource intensive Universities. About the former, there's an emphasis on inclusivity across various EU funding programs, aiming to support researchers from diverse backgrounds and regions. Efforts are made to ensure a fair distribution of funding across member states and to support research excellence irrespective of geographic location.
6. Ensure sustained, long-term commitment to promote equity in funding, which will result in lasting change and systemic inequalities, in the long run.
7. Establish mechanisms; 1) to understand less-resource intensive university challenges; 2) to provide in-depth feedback when they fail in funding.
References
- Arcia, G., Macdonald, K., Radyakin, S., & Lokshin, M. (2011). Assessing sector performance and inequality in education. Disclosure.
-
Social indicators: The EU and social inclusion, Atkinson, T., Cantillon, B., Marlier, E., & Nolan, B. (2002). Social indicators: The EU and social inclusion. OUP: Oxford.
- Boeren, E. (2023). Investigating the relationship between research income and research excellence in education: Evidence from the REF2021-UoA23 data. British Educational Research Journal, 49(6), 1312-1337. [CrossRef]
- Boliver, V. (2015) Are there distinctive clusters of higher and lower status universities in the UK? Oxford Review of Education, 41(5), 608-627. [CrossRef]
- Broer, M., Bai, Y., & Fonseca, F. (2019). Socioeconomic inequality and educational outcomes: Evidence from twenty years of TIMSS. Springer Nature.
- Budescu, D. V., & Budescu, M. (2012). How to measure diversity when you must. Psychological Methods, 17(2), 215-227. [CrossRef]
- Degl’Innocenti, M., Matousek, R., & Tzeremes, N. G. (2019). The interconnections of academic research and universities “third mission”: Evidence from the UK. Research Policy, 48(9), 103793. [CrossRef]
- Dept for Business Innovation and Skills (2016) “The Case for the Creation of UKRI”, HM Government, UK.
- Digdowiseiso, K. (2010). Measuring Gini coefficient of education: the Indonesian case. Online, available at https://mpra.ub.uni-muenchen.de/19865/1/Measuring_Gini_Coefficient_of_Education.pdf Consultado Mayo 2017. (Accessed 24.1.24).
- Fransman, J., Hall, B., Hayman, R., Narayanan, P., Newman, K., & Tandon, R. (2018). Promoting fair and equitable research partnerships to respond to global challenges.
- Gladstone, J., Schipper, L., Hara-Msulira, T., & Casci, T. (2023). Equity and inclusivity in research funding: barriers and delivering change.
- Gov Grant (2022). Innovate UK: The Impact Report. Online, available at www.govgrant.co.uk/innovate-uk-the-impact-report/ (Accessed 21.1.24).
- Grant, P., Paterson, D., Pollard, M., Hope, H., Bruce, R., & Rooryck, J. (2022). Plan S, UKRI and Wellcome policies, and beyond: the past, present and future of open research funding.
- Guardian, The (2024). Online, available at https://www.theguardian.com/education/universityguide (Accessed 21.1.24).
- Haldane, R. B. H. (1918). Final Report (Vol. 9084). HM Stationery Office.
- 23. Hasell, J (2023) “Measuring inequality: What is the Gini coefficient?” Online, available at https://ourworldindata.org/what-is-the-gini-coefficient (Accessed 25.1.24).
- Hao, L., & Naiman, D. Q. (2010). Assessing inequality. Sage Publications: USA.
- Harrison, D. A., & Sin, H. (2006). What is diversity and how should it be measured. Handbook of workplace diversity, 191-216.
- Holligan, C., & Shah, Q. (2017). Global capitalism’s Trojan Horse: Consumer power and the national student survey in England. Power and Education, 9(2), 114-128. [CrossRef]
- Jann, B. (2016). Assessing inequality using percentile shares. The Stata Journal, 16(2), 264-300. [CrossRef]
- Jaegler, A. (2022). How to Measure Inclusion in Higher Education: An Inclusive Rating. Sustainability, 14(14), 8278. [CrossRef]
- Jebsen, J. M., Abbott, C., Oliver, R., Ochu, E., Jayasinghe, I., & Gauchotte-Lindsay, C. (2020). A review of barriers women face in research funding processes in the UK. Psychology of Women and Equalities Review, 3(1-2). [CrossRef]
- Jerrim, J., & Vries, R. (2023). Are peer reviews of grant proposals reliable? An analysis of Economic and Social Research Council (ESRC) funding applications. The Social Science Journal, 60(1), 91-109. [CrossRef]
- Jump, P. (2013) Quartet pay hefty admission fee to enter elite club. Times Higher Education, 30 May 2013.
- Lawson, C., & Salter, A. (2023). Exploring the effect of overlapping institutional applications on panel decision-making. Research Policy, 52(9), 104868. [CrossRef]
- Lia, L. Y., Oliver, R., Bretscher, H., & Ochu, E. (2020). Racism, Equity and inclusion in Research Funding. Science in Parliament, 76(4), 17-19.
- Merton, R. K. (1968). The Matthew effect in science: The reward and communication systems of science are considered. Science, 159(3810), 56-63.
- Piketty, T. (2014). Capital in the Twenty-First Century. Belknap Press: Cambridge, MA.
- Pinar, M., & Unlu, E. (2020). Determinants of quality of research environment: An assessment of the environment submissions in the UK’s Research Excellence Framework in 2014. Research Evaluation, 29(3), 231-244. [CrossRef]
- Roswell, M., Dushoff, J., & Winfree, R. (2021). A conceptual guide to measuring species diversity. Oikos, 130(3), 321-338. [CrossRef]
- Sarju, J. P. (2021). Nothing about us without us–towards genuine inclusion of disabled scientists and science students post pandemic. Chemistry–A European Journal, 27(41), 10489-10494. [CrossRef]
- Thomas V.; Wang Y.; Fan X. (1999). Measuring coefficients of inequality: Gini coefficients of education, Policy Research Working Papers. No. 2525, World Bank Institute, 1999.
- Times, The (2024). University Rankings. Online, available at https://www.thetimes.co.uk/uk-university-rankings (Accessed 21.1.24).
- UKRI (2023a) What We Do. Online, available at https://www.ukri.org/what-we-do/ (accessed 1.12.2023).
- UKRI (2023b) How We Make Decisions. Online, available at https://www.ukri.org/apply-for-funding/how-we-make-decisions/ (accessed 1.12.2023).
- UKRI (2023c) UKRI’s Equality, Diversity and Inclusion Strategy. Online, available at https://www.ukri.org/publications/ukris-equality-diversity-and-inclusion-strategy/ukris-equality-diversity-and-inclusion-strategy-research-and-innovation-by-everyone-for-everyone/ (accessed 1.12.2023).
- UKRI (2023d) Addressing Under Representation and Active Participation. Online, available at https://www.ukri.org/what-we-do/supporting-healthy-research-and-innovation-culture/equality-diversity-and-inclusion/addressing-under-representation-and-active-participation/ (accessed 1.12.2023).
- UKRI (2023e) Geographical Distribution of UKRI Spend.
- 2023; UKRI (2023f) UKRI Workforce Equality, Diversity, and Inclusion Plan 2022 to 2026.
- UKRI (2021) ESRC Funding Distribution. Online, available at https://www.ukri.org/wp-content/uploads/2021/10/ESRC-07102021-FundingDistribution.pdf (accessed 1.12.2023).
- University College London (2024). Our Understanding of Equity, Diversity and Inclusion. Online, available at https://www.ucl.ac.uk/mathematical-physical-sciences/equity-edi/our-understanding-equity-diversity-and-inclusion (accessed 24.1.24).
- Universities UK (2024). Online, available at https://www.universitiesuk.ac.uk/ (accessed 24.1.24).
- Vidovic, S., Clarkson, N., Fenerty, V., Guest, E., Sands, P., Tweedle, J., Beales, A. & White, W. (2021). UKRI return 2020-2021 University of Southampton. Online, available at https://eprints.soton.ac.uk/457182/ (accessed 21.1.24).
- Woolston, C. (2022). "Lost funding, unwelcome moves: UK researchers speak out on ERC ‘disaster’," Nature, 608(7924), 833-835. [CrossRef]
- Wörner, C.H. (2018) ¿Puede un sistema nacional universitario desequilibrado obtener resultados homogéneos? El caso del sistema chileno de universidades (May an unbalanced national university system achieve homogeneous results? The case of the Chilean university system) Working paper. March 2018. [CrossRef]
| 1 |
This was mentioned to us via email by UKRI, when a freedom of Information Act request was sent to them to access UKRI Grant data. |
|
Disclaimer/Publisher’s Note: The statements, opinions and data contained in all publications are solely those of the individual author(s) and contributor(s) and not of MDPI and/or the editor(s). MDPI and/or the editor(s) disclaim responsibility for any injury to people or property resulting from any ideas, methods, instructions or products referred to in the content. |
© 2024 by the authors. Licensee MDPI, Basel, Switzerland. This article is an open access article distributed under the terms and conditions of the Creative Commons Attribution (CC BY) license (http://creativecommons.org/licenses/by/4.0/).
