Preprint
Article

Human-Centred Perception as a Mediator of Environmental Decision-Making: A Study on the Suitability Parameters of Public Underground Spaces – a Case Study of Wujiaochang, Shanghai

Altmetrics

Downloads

45

Views

26

Comments

0

Submitted:

02 October 2024

Posted:

03 October 2024

You are already at the latest version

Alerts
Abstract
With the acceleration of urbanisation and the increase in underground space use, how to provide a comfortable and healthy environment in underground space has become an important research topic. This study constructed an environmental decision-making model for underground space by integrating human perception evaluation and physical environment factors. The study analysed the influence of physical environment parameters on users' perceived experience through field data collection and questionnaire surveys. The data were in-depth analysed using single-indicator fitted regression analysis and XGBoost machine learning model. The results reveal the significant influence of physical parameters such as temperature, humidity, illuminance and wind speed on the comfort of users of underground spaces and determine the range of appropriateness of these physical environment parameters. The results provide a reliable theoretical basis for optimising the design and management of underground spaces and help to enhance the environmental quality and user experience of underground spaces.
Keywords: 
Subject: Arts and Humanities  -   Architecture

1. Introduction

Under globalisation, the deterioration of the quality of the urban built environment can pose a significant threat to the economy, society, and well-being. [1] At the same time, building energy use, which accounts for 35% of global energy consumption, continues to increase [2]. Underground development is essential in developing and reshaping urban areas to meet future challenges [3]. The lack of rational design and management of some underground space environments has resulted in the waste of resources, quality degradation, and other phenomena that need to be urgently addressed.
To enhance the quality of the built environment, some scholars link environmental regulation with human feelings. Yang K H et al. provide a new perspective for high-quality spatial environmental regulation through the index study of PMV (Predicted Mean Vote), which is now diversified [4,5,6]. Some scholars believe that indoor environmental quality (IEQ) evaluation for rational evaluation and control of building environmental parameters can influence the life cycle cost and energy consumption of buildings [7]. Few studies have used these methods in urban spaces such as underground spaces.
Pushkar T argues that A human-centred approach is becoming an objective condition for the effective development of smart cities[8]. As an essential living space for people and an object for future growth, underground space needs a delicate human-centred design to optimise spatial quality and scientifically regulate the built environment. Therefore, it is necessary to construct a set of decision-making models for the underground public space environments based on the perceptual evaluation of the human-centred perspective to create a more high-quality and sustainable architectural space environment by regulating appropriate spatial parameters.

2. Literature Review

2.1. Sustainable Underground Space Quality

Urban underground space use has long been framed as a beneficial solution to urban sustainability [9]; however, due to the different thermal, ventilation, lighting, and other unique environments in the underground space may lead to problems of comfort, health, and safety [10], the spatial evaluation system of the above-ground space does not apply to the underground space. However, due to the different thermal, ventilation, lighting, and other unique environments in underground spaces, which may cause problems for comfort, health, safety, and so on [10], the spatial evaluation system for aboveground spaces does not apply to underground spaces. The spatial quality problem has become an obstacle to the future development of underground space. Therefore, scholars have researched underground space’s environmental quality evaluation system. Xuan W and other scholars have studied the safety of underground space from the safety engineering research by using the fuzzy analysis method [11,12]; Van der Hoeven F and other scholars have researched spatial path and vitality and used the spatial sentence method to analyse the vitality of underground space in terms of visibility and accessibility analysis [13,14], Tao H and other scholars conducted air quality research to study the formaldehyde concentration and odour preference in the underground space [15,16], it can be seen that the above studies are mainly based on the building structure, layout, air quality and other research. In contrast, the comprehensive assessment of its environmental quality is relatively limited.
Some researchers have also carried out studies from the perspective of psychological perception, believing that underground space can promote positive and negative effects on human psychology [17]; Sun L and other scholars start from the salience effect of architectural guidance signs, pointing out the visual salience preference of underground space [18,19], Yao T and other scholars start from the spatial scale to obtain the appropriate combination of spatial scales and the important perceptual indicators [20,21], these studies begin from proving that there are differences in psychological perception between underground and aboveground. These studies have demonstrated a difference in psychological perception between underground and aboveground, which is a good foundation for creating a high-quality spatial environment. However, these studies have only studied a few spatial elements individually, and few studies have combined the overall perception with environmental indicators, so they cannot obtain systematic parameters for environmental regulation.
Therefore, this study will attempt to fill the gap in this research and regulate the recommended suitability data through comprehensive human-centred perception evaluation combined with spatial parameter calculations of physical environment elements, enhancing the quality of underground space and the sustainability of developing underground space.

2.2. Environmental Decision-Making with a Human Perspective

In an earlier study on environment building, Fanger developed the Predicted Mean Vote (PMV) model of thermal comfort based on the heat balance equation on the human skin, correlating it with air temperature, mean radiant temperature, clothing level, etc. [22]. Indoor environmental quality (IEQ) is examined from the perspective of an occupant’s acceptance in four aspects: thermal comfort, indoor air quality, noise level, and illumination level[23,24]. The models of the above two approaches have been widely used to assess the physical environment parameters such as air quality, temperature, humidity, noise level, and illumination level inside a building as an essential reference standard for environmental decision-making. Hong S H has used PMV-controlled to study residential buildings’ thermal comfort, energy, and cost impacts [25]. Shao T used the PMV index to analyse the intelligent control system of green buildings to test the effectiveness of environmental regulation [26]. Wong L T used IEQ to assess the energy performance of air conditioning in office environments [27]. There are also a few studies combining psychological perception with IEQ. Dunleavy G. et al. analysed the psychological impact of above and below-ground workplaces using the OFFICAIR questionnaire to collect IEQ on workplace perceptions [28]. It can be seen that both the PMV model and the IEQ model can meet the regulation needs of environmental decision-making. However, the above studies mainly focus on the spatial assessment of apartment or office space, and there are few studies on the evaluation and environmental regulation of public space. Underground space is closely related to the daily life of urban residents and lacks attention to spatial environmental regulation.
In the PMV or IEQ model questionnaire scale, the related questions that only correspond to the physical parameter indicators are used, leading to data disconnection. To avoid this problem, the study adopts the human-centred perception of spatial quality evaluation indexes to replace the traditional correlation questions. In recent years, with the goal of human-centred urban construction, more and more scholars have conducted spatial quality research from a human perspective [29]. Lucas pointed out that urban space should be an experience for all senses [30,31]. In human-centred perception, the senses, such as Visual, Somatosensory, and Auditory, are multidimensional and work together. In the study of the perception of spatial quality, these multisensory dimensional perception data can, in turn, be divided into more precise indicators to help measure the psychological data more accurately. In terms of selecting perceptual indicators, the study, to reflect the consensus and mainstream views in the field, adopts the literature analysis method [32] to systematically collate and analyse the existing literature and extract the critical indicators in the research field. The Delphi method [33], which is suitable for constructing an evaluation framework for complex issues, is combined with soliciting expert opinions through multiple rounds of anonymous questionnaires to draw more authoritative and unified conclusions in various rounds of consultation. The above methods provide a vital reference for selecting perceptual indicators for underground pedestrian streets.
Therefore, this study conducts correlation research with perception indicators and physical environment parameters, obtains environmental regulation suitability parameters through more comprehensive holistic evaluation data, and carries out environmental decision-making under human-centred perception.

2.3. Machine Learning Applied to Environmental Evaluation Systems

With the rapid development of data-driven technologies, machine learning has been increasingly used in environmental evaluation systems in recent years. By combining street view images, remote sensing data, and environmental variables, researchers can automate environmental quality assessment in cities using machine learning models. Liu L et al. achieved automated evaluation of large-scale urban environments by evaluating street view images with a machine learning model [34]; Ye Y et al. accurately assessed the visual quality of urban streets using the SegNet algorithm [35]; Chen L et al. used urban big data and deep neural networks to predict air quality and optimise urban air quality management based on a deep multi-task learning urban air quality index model [36]. In contrast, Boim A et al. used Generative Adversarial Networks (GANs) to generate complex urban design solutions [37]. These studies demonstrate the wide application and potential of machine learning in urban spatial quality evaluation.
Among them, XGBoost [38], a decision tree-based machine learning algorithm, is widely used in regression, classification, and ranking tasks due to its efficiency and powerful prediction ability. Its core idea is to construct a powerful integrated model by integrating multiple weak learners and gradually optimising the model’s prediction error. Its advantages lie in its ability to automatically deal with missing values in the data, effectively prevent the overfitting problem, and optimise a good generalisation ability when dealing with high latitude data. Therefore, in this study, the XGBoost regression model can be used to analyse the complex relationship between multidimensional perceptual indicators from a human perspective and physical environment variables such as temperature, humidity, and wind speed. Through the regression analysis of this model, this study can accurately quantify the physical environment parameters to provide data reference and validation of humanistic perception, which provides a scientific basis for the design of underground space and environmental optimisation.

3. Materials and Methods

3.1. Case Study
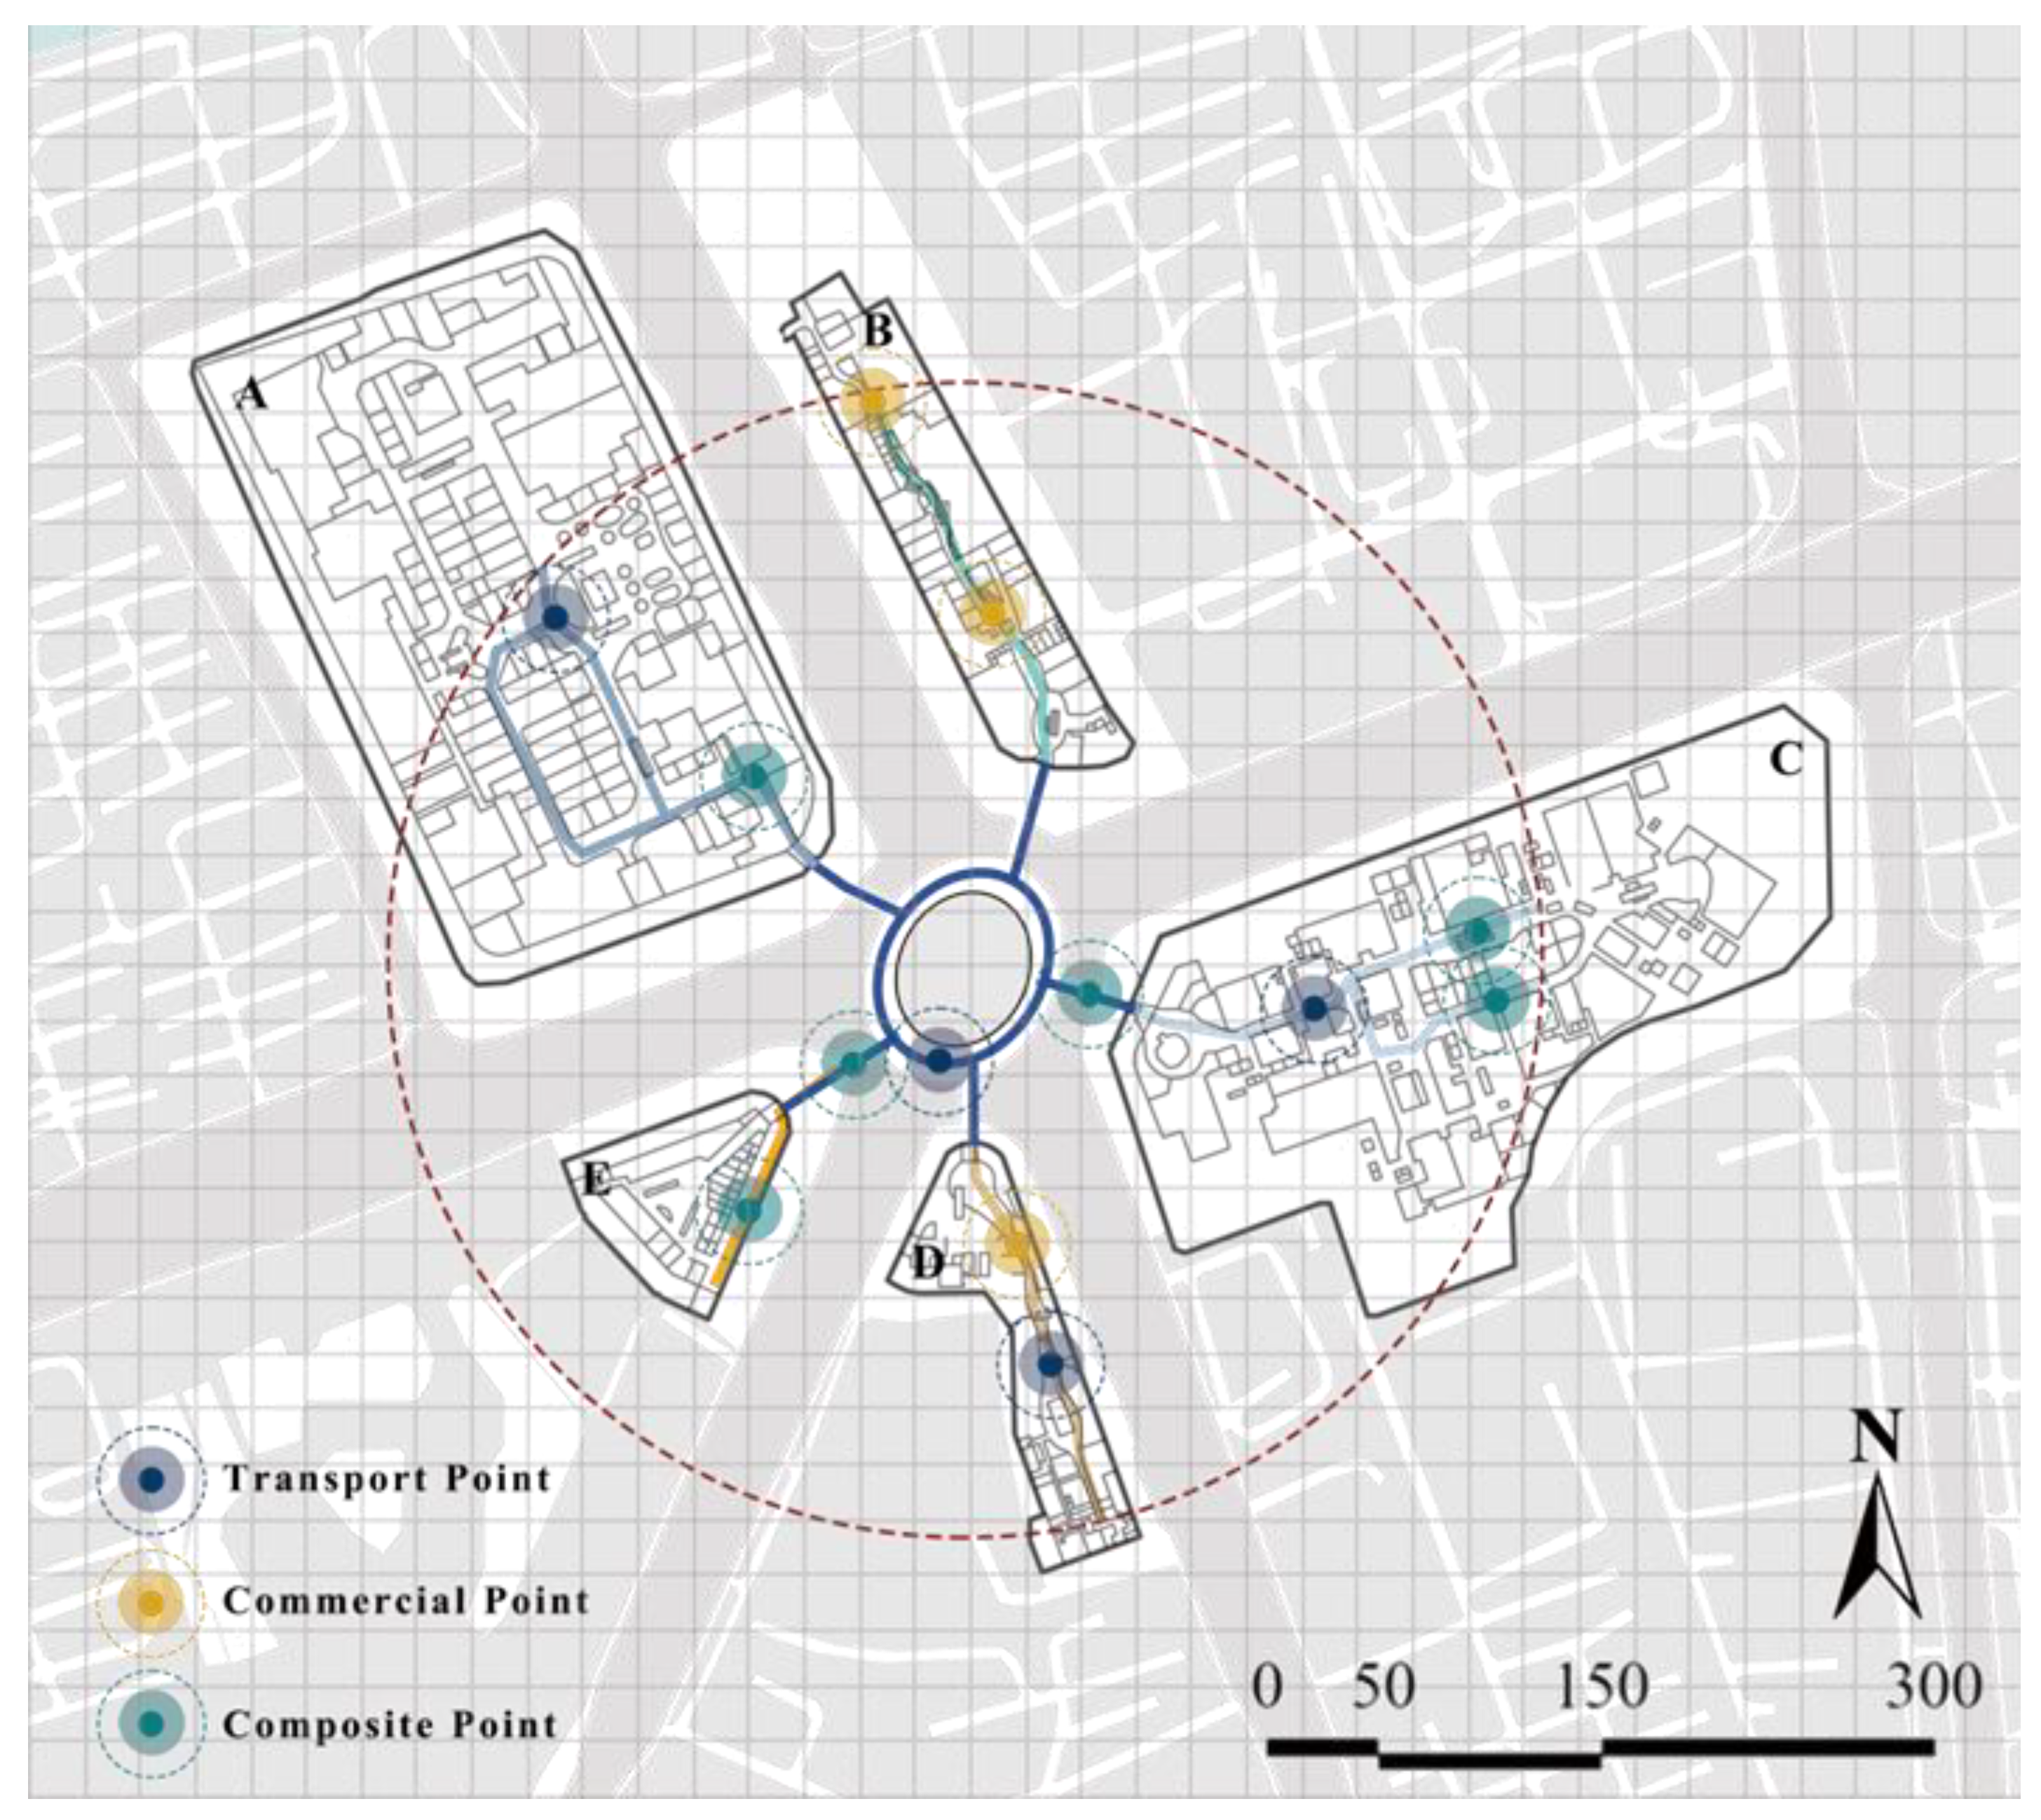
Shanghai, the economic centre of China, has been committed to using urban renewal to enhance urban functions, improve the living environment, and promote the city’s sustainable development. The spatial utilisation of urban underground space can make it possible to solve urban problems such as land shortage and traffic pollution [39]. Along with the rapid development of the metro system, the underground space of Shanghai city has been developing rapidly, and scholars such as Ma C X believe that the underground public space in Shanghai carries essential functions and needs to be planned and designed for urban underground space performance [40,41]. Therefore, Shanghai was selected as a practical case for investigation, in which the underground space of Wujiaochang is representative of one of the four sub-centres of the city. Wujiaochang consists of five dispersed roads, and the overall plot is divided into five representative commercial areas, as shown in Table 1.
From the perspective of a person-centred scale, a walking distance of about 500m is considered a generally acceptable distance [42]. Therefore, the study takes the radius of 250 meters of the underground space of Wujiaochang as the primary research object. The study delineated the functional space through research and located the collection points with functional characteristics. These areas include underground public pedestrian streets, underground commercial pedestrian streets, depressed plazas, and other underground public spaces. The collection points were divided into Traffic Dimension Points, Commercial Points, and Composite points, as shown in Figure 1.
Figure 1. Location of the research object.
Preprints 120075 g001
Table 1. Study site basic information.
No. Name Commercial area/10,000m2 Building area/10,000 m2
A Wanda Plaza 21 33
B Bailian Youyicheng Shopping Mall 9 12
C Heshenghui West Building 16 36
D Youmai Life Plaza 3 4.5
E Suning Plaza 1.5 3.5

3.2. Research Framework

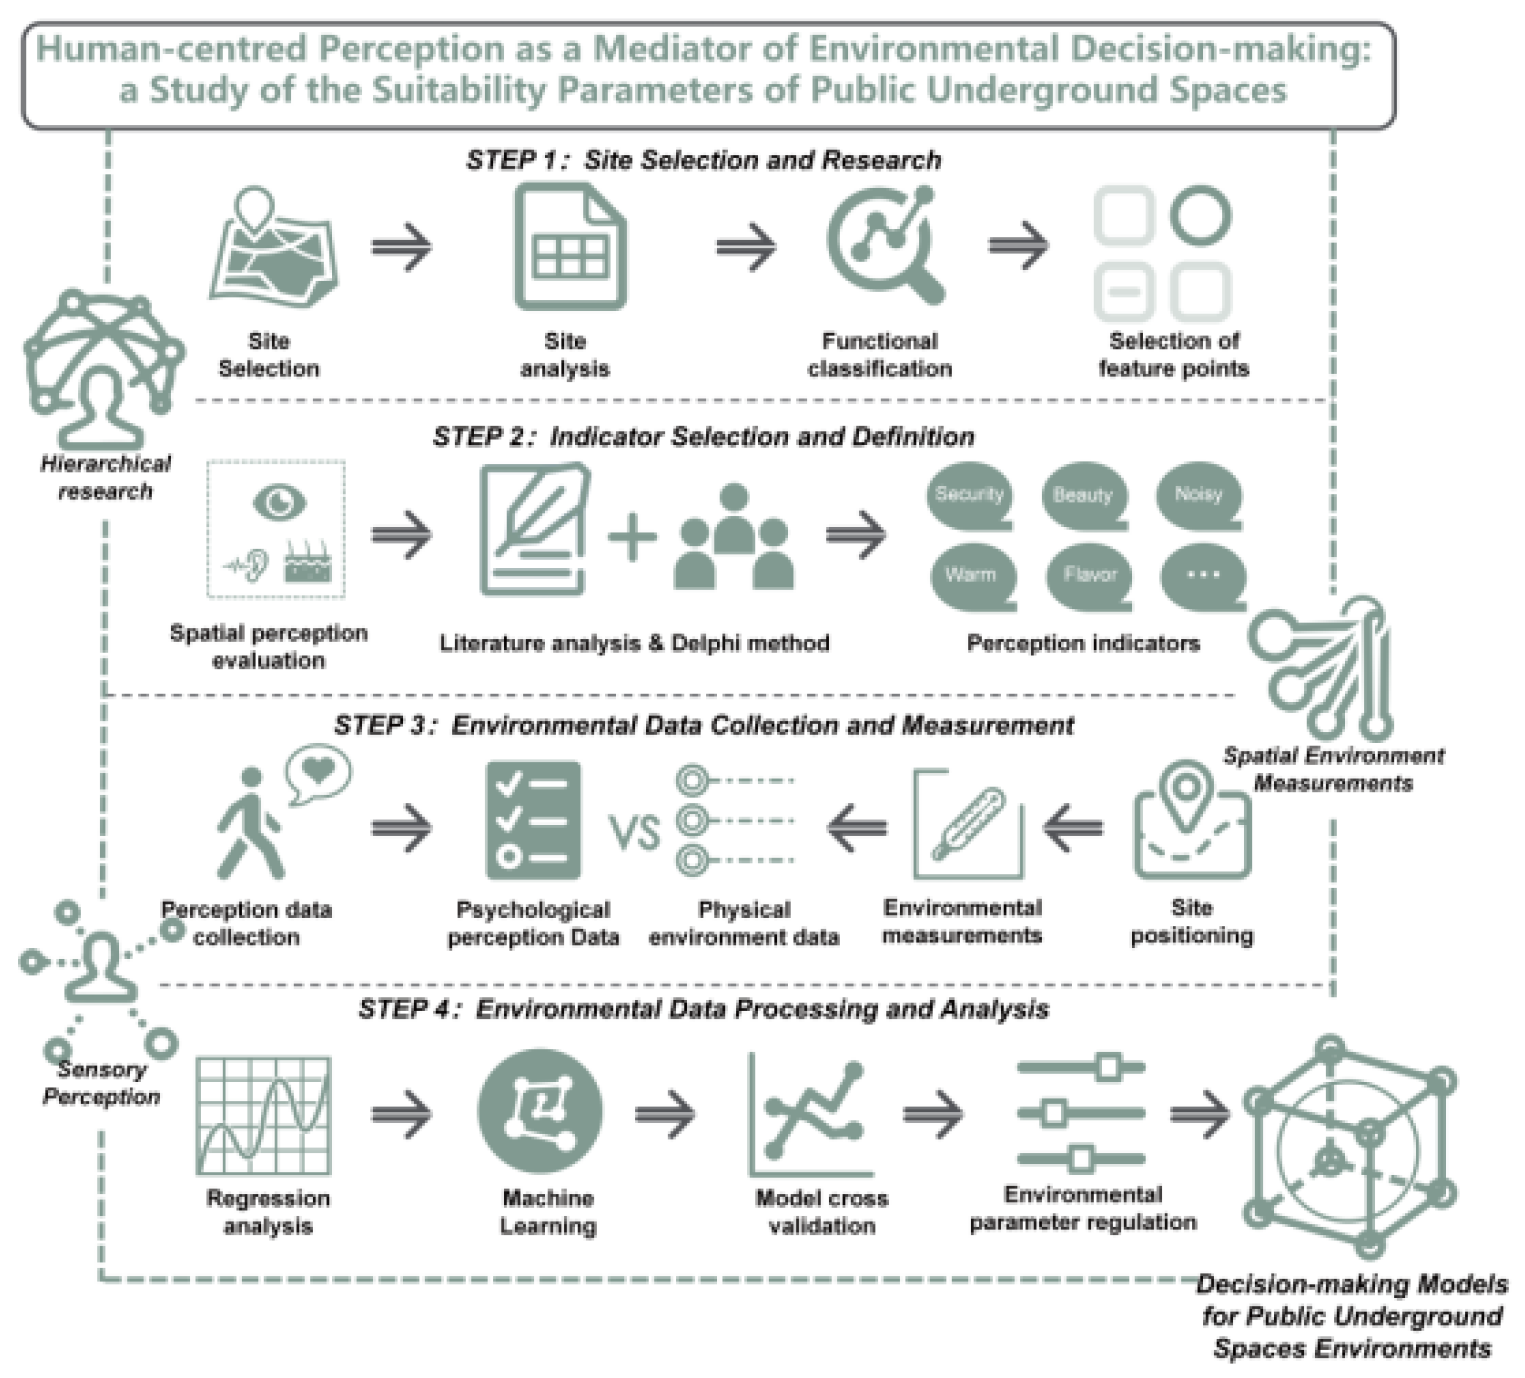
This study constructs an environmental decision-making model of underground public space mediated by human-centred perception using spatial environment measurement. The study is divided into three phases: ①Site Selection and Research. Suitable research objects are selected and analysed through site research. ②Indicator Selection and Definition: Using literature analysis and the Delphi method to select appropriate evaluation and measurement indicators. ③Environmental Data Collection and Measurement: Human-centered on-site measurement and collection of spatial perception and physical environment data. ④Environmental Data Processing and Analysis. The collected data will be processed to calculate the suitable environmental parameters.
The study will explore the impact of physical environment factors on the user’s perception of underground space and ultimately provide strategies for spatial environment regulation. The overall specific research steps are shown in Figure 2.

3.3. Research Methodology

3.3.1. STEP1: Site Selection and Research

This research is centred on people, and the PSPL method was used. Jan Gehl proposed that this method has been used many times in evaluating the quality of urban public space, and it is still an essential method in the study of urban public space nowadays [43]. Matan A and other scholars evaluated the urban space in Australia through the PSPL method and proposed optimising the space; Fan G and other scholars obtained suggestions for improving the urban space through field research on the street scale façade and the scale [44,45]. After comparing several underground urban research cases in Shanghai, the study found that the underground space of Wujiaochang has a diverse spatial layout and sufficient pedestrian activities. Rich spatial functions and broad traffic radiation also characterise the space. Therefore, the space covers various environmental conditions and can provide enough experimental samples, which is very suitable for this underground space environmental research.

3.3.2. STEP 2:Indicator Selection and Definition

The existing research results were systematically sorted out through the literature analysis method, and the human-centred perception and physical environment indicators, closely related to the evaluation of spatial quality, were screened out. The literature analysis method can assess the quality and reliability of the existing studies and identify their biases and limitations, providing the theoretical basis and reference framework for this study. Subsequently, the Delphi method was utilised to evaluate further and screen the initially screened indicators.
A leadership team of five graduate students was organised for this study, and 24 students in architecture and urban and rural planning and 11 in-service faculty members were invited to form a professional expert panel. This diverse team of experts ensured the professionalism and comprehensiveness of the evaluation. The consultation process was divided into three rounds as follows:
The first round of consultation: The expert group selected relevant perceptual and environmental indicators based on existing literature. For example, Vision [46], Auditory [47], Olfactory, Somatosensory, Taste, and other authoritative international research dimensions. After screening, 35 perceptual indicators and ten environmental indicators were initially identified. In the second round of consultation, the expert group members reassessed and categorised these preliminary indicators. After several discussions, 22 perceptual and seven environmental indicators were finally identified for Security, openness, and Wind Speed. The third round of consultation: In response to the feedback from the second round, anonymous opinion collection and focused discussions were conducted until the expert panellists reached a consensus. Finally, three dimensions totalling 13 core perceptual indicators and six environmental indicators were selected as the evaluation criteria for sensory perception of spatial quality in this study. In addition, a five-level Likert scale was used in the questionnaire design, and a separate dimension of “Perception Satisfaction” was added as a criterion for the spatial perception of suitability. The specialised definitions of each indicator can be found in Appendlx A.
Table 2. Spatial quality sensory perception evaluation indicators.
Human-centered Perception Indicators Evaluation
Visual perception evaluation Strongly
Disagree
Disagree Neutral Agree Strongly
agree
1. Security □1 □2 □3 □4 □5
2. Gorgeous □1 □2 □3 □4 □5
3. Non-Repression □1 □2 □3 □4 □5
4. Beauty □1 □2 □3 □4 □5
5. Interesting □1 □2 □3 □4 □5
6. Open □1 □2 □3 □4 □5
7. Comfortable Lighting □1 □2 □3 □4 □5
8. Visual perception Satisfaction □1 □2 □3 □4 □5
Auditory perception evaluation Strongly
Disagree
Disagree Neutral Agree Strongly
agree
9. Quiet □1 □2 □3 □4 □5
10. Varied □1 □2 □3 □4 □5
11. Pleasant □1 □2 □3 □4 □5
12. Auditory perception Satisfaction □1 □2 □3 □4 □5
Somatosensory perception evaluation Strongly
Disagree
Disagree Neutral Agree Strongly
agree
13. Good Ventilation □1 □2 □3 □4 □5
14. Wind Speed □1 □2 □3 □4 □5
15. Warm □1 □2 □3 □4 □5
16. Somatosensory perception Satisfaction □1 □2 □3 □4 □5
Physical environment indicator measurements
Measurement indicators Average value Unit
1. Aspect Ratio - -
2. Humidity - Percentage (%)
3. Illumination - Lux (lx)
4. Sound - Decibels (dB)
5. Temperature - Degrees Celsius (°C)
6. Wind speed - Meters per second (m/s)

3.3.3. STEP 3:Environmental Data Collection and Measurement

(1) Person-centred perceptual data acquisition
This study used the questionnaire method to evaluate human-centred scale environmental perception. This method has a good performance in the study of urban spatial quality [48]. The study selected 13 points on the site to evaluate human-centred scale environmental perception. The questionnaires were distributed in three periods: 11:00-13:00 a.m., 2:00-4:00 p.m., and 5:30-7:30 p.m. Five architecture and planning students distributed the questionnaires within the site and recorded the respondents’ feedback data. The test subjects were mainly about 200 passers-by in the venue, and the randomisation of the respondents ensured the diversity of the research sample.
(2) Physical environment data measurements
To assess the physical environmental data within the site, this study conducted several real-time measurements of environmental data at the same 13 points, covering key parameters such as loudness, temperature, illumination, wind speed, and humidity. Measurement equipment included a Kanomax hot-wire anemometer for accurate wind speed measurements, a CDT-8820 environmental tester for recording temperature, illuminance, and moisture, and a laser range finder for measuring the cross-sectional scale of the site to ensure that the physical environmental scales were recorded accurately at each point. Data measurements were synchronised with questionnaires to record environmental data during each period to allow in-depth analysis of the impact of physical environmental factors on human-centred perceptions. Data were collected from October 11 to October 13, 2023, ensuring continuity and comprehensive coverage.

3.3.4. STEP 4:Environmental Data Processing and Analysis

(1)Determination of indicator weights
This study used the comprehensive weighting method that combines the CRITIC and entropy weighting methods to determine the weights of the human-centred perception indicators in the three dimensions. Using the entropy weight method to measure the information entropy of each indicator has the advantage of determining the indicators’ importance through the objective variability of the data without the influence of subjective factors [49]. The CRITIC weight method ensures that the weights of each indicator can more comprehensively reflect its impact on the overall evaluation by analysing the comparison coefficients and the intrinsic correlation of the indicators [50]. Therefore, by combining these two methods, the weights in each perceptual dimension can be determined more accurately, and a scientific foundation is laid for subsequent analysis.
(2)correlation analysis
This study used Kendall’s tau-b correlation analysis method to further screen out the highly correlated human-centred perception indicators with the physical environment data. Kendall’s tau-b is a nonparametric statistical method suitable for measuring the correlation between two variables. It is particularly suited to dealing with data that contain hierarchical and non-normally distributed data [51]. It has the advantage of being anomalously values insensitive and better able to handle datasets with small sample sizes or asymmetric distributions.
(3)regression analysis
After obtaining metrics highly correlated with the physical environment data, this study conducted a regression analysis of these perceptual metrics with the physical environment data (e.g., illuminance). The regression analysis aims to determine the relationship between the metrics and the physical environment variables by fitting curves. This method has been shown to perform well in regression analysis of spatial perception [52]. In terms of the scores of the perceptual indicators, this study defined a score between 3.5 and 5 as the range of suitability. Fitting curves inferred the optimal environmental parameters for each perception indicator within this range, and the range of suitability parameters was defined by combining the data from actual points.

4. Results

4.1. Human-Centered Perception Questionnaire Collection

A total of 236 questionnaires were collected in this field study. Considering the possibility of invalid questionnaires randomly selecting passers-by, 213 valid samples were retained after screening. Among them, there were 120 male respondents and 93 female respondents. In terms of age distribution, the 18-29 age group had the most significant number of respondents, totalling 106, accounting for 49.78%, followed by the 30-39 age group, with 42 respondents, accounting for 19.72%; the 40-60 age group had 28 respondents, accounting for 13.15%; and there were relatively fewer respondents under the age of 18 and over the age of 60, with 20 respondents (9.39%) and 17 respondents respectively (7.98%). This indicates that the primary users of the underground walkway are concentrated in the age groups of 18-29 and 30-39. Regarding the purpose of using the underground space, commercial activities such as shopping, leisure, and dining accounted for more than 41%, while the demand for transportation accounted for 38.97%. It can be seen that the function of the underground space of this site mainly focuses on the two dimensions of commerce and transportation, which is the core concern of this underground space environment study.

4.2. Data Standardisation and Empowerment

Since this study involves different variables in terms of scale and unit, which can lead to an imbalance in the model, the data were standardised through the normalisation formula to reduce the bias of the results caused by the difference in the scale of the variables. The processed data were calculated using the CRITIC weighting method and the entropy weighting method for the comprehensive weighting method to obtain the four dimensions and the weight relationship between the indicators of each dimension, respectively, as shown in Table 3.
According to the analysis of the data in the table, Auditory-Dimension has the highest weight, reaching 36.343%, indicating that auditory has a dominant role in multidimensional perception; Somatosensory-Dimension has a weight of 32.090%, which is closely followed by the weight of Somatosensory-Dimension, reflecting the importance of somatosensory factors; and Visual-Dimension weights 31.567%. Weight was 31.567%, slightly lower than the first two. These weights indicate that auditory and somatosensory are relatively more significant in human-centred perception, while visual factors are less influential. By weighing the weights of each dimension, the relative contribution of each dimension to person-centred perception can be quantified more scientifically. The weighted perception indexes can improve the accuracy of correlation analysis and reveal the complex relationship between each physical environment parameter and the perception experience, thus providing a practical reference basis for optimising the design of the underground space environment.
Table 3. Results of the combined weights method.
Entropy Weight Method CRITIC Weight Method Final Weight (%)
Item Information Entropy Value e Information Utility Value d Weight (%) Index Variability Index Conflict Information Quantity Weight (%)
Visual-dimension 0.977 0.023 32.626 1.081 0.646 0.699 30.508 31.567
Auditory-Dimension 0.974 0.026 37.913 1.094 0.728 0.796 34.773 36.343
Somatosensory-Dimension 0.98 0.02 29.461 1.049 0.758 0.795 34.719 32.090

4.3. Correlation Analysis of Human-Centred Perception Evaluation and Physical Environment Data

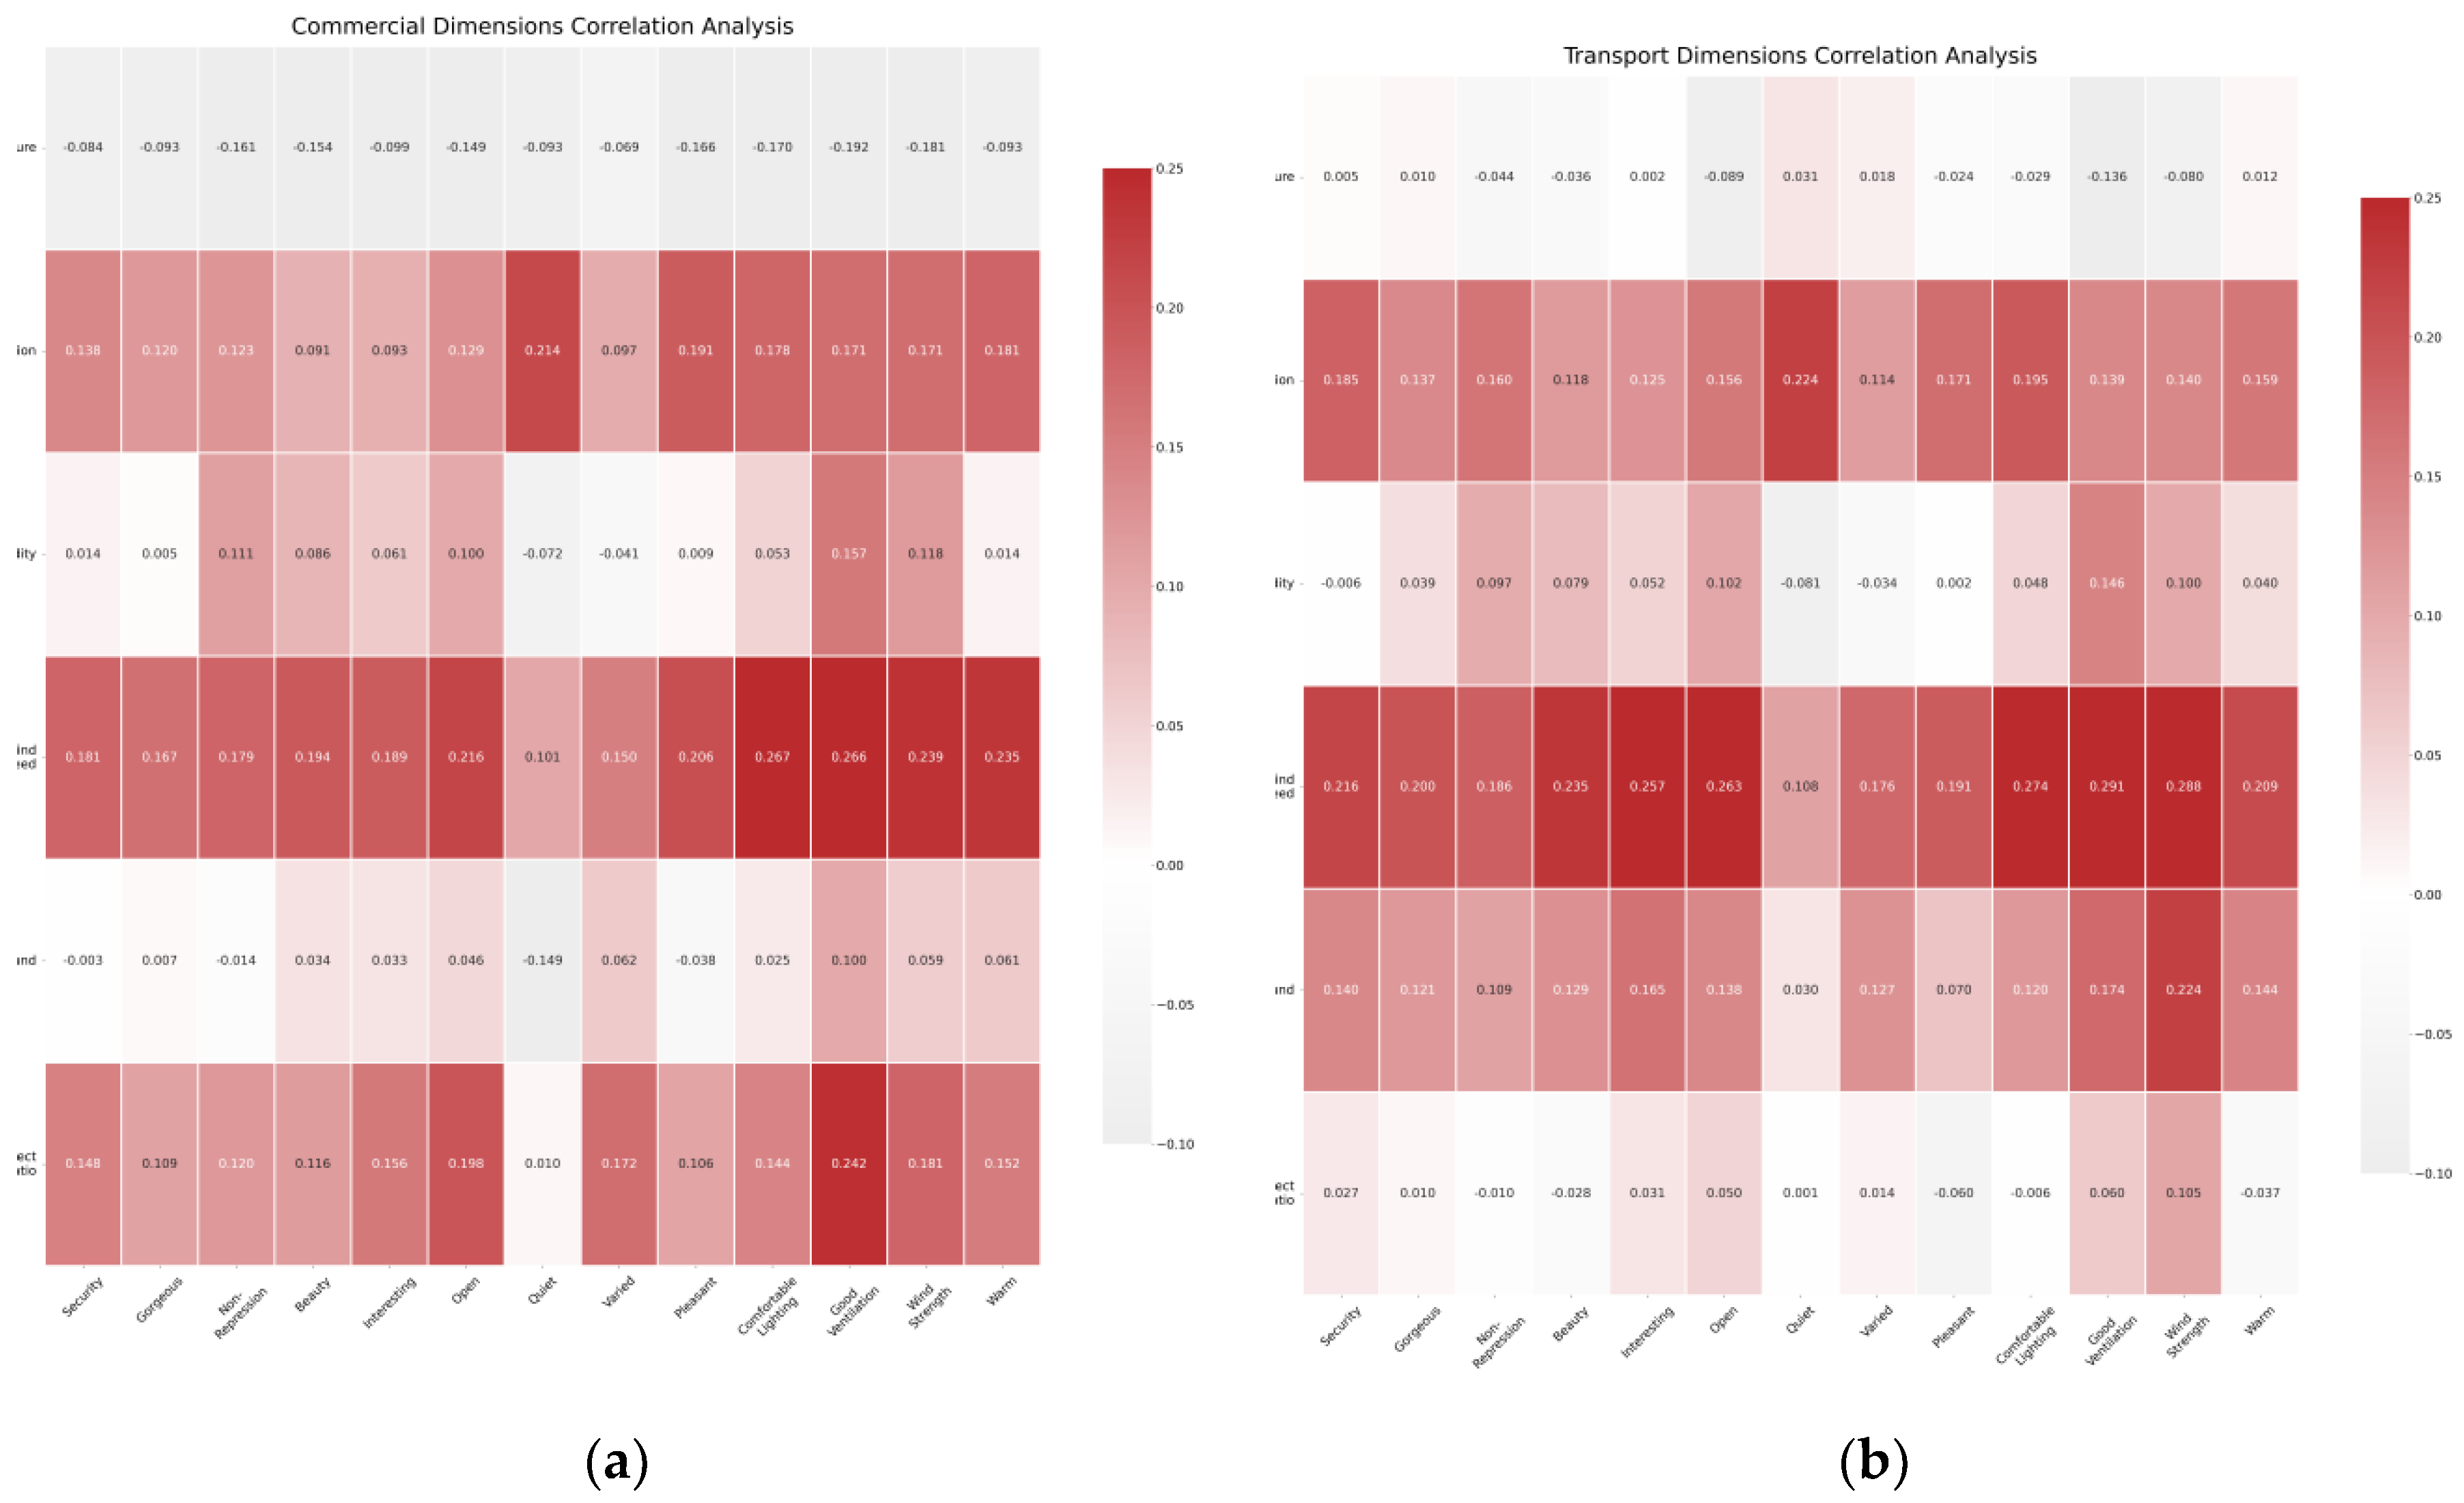
Based on the Kendall correlation analysis method, the human-centred perception evaluation and physical environment data were analysed in the Commerical Dimension and Transportation Dimension, respectively (as shown in Figure 3), and the results are as follows:

4.3.1. Results of Correlation Analysis under Commerical Dimension

In the Commerical Dimension, the correlation between each physical environment parameter and the human-centred perception index is as follows:
(1) Aspect Ratio:
Aspect Ratio is moderately positively correlated with Wind Strength, with a correlation coefficient of 0.171, indicating that changes in spatial ratio have a specific positive impact on wind perception in shopping spaces.
(2) Humidity:
Humidity is correlated with Good Ventilation, with a coefficient of 0.157, indicating that higher humidity can improve ventilation perception. In addition, Humidity and Wind Strength are also positively correlated, with a correlation coefficient of 0.118, indicating that humidity has a specific effect on wind perception.
(3) Illumination:
Illumination and Comfortable Lighting show a positive correlation with a coefficient of 0.178, indicating that better lighting conditions can improve visual comfort. In addition, Illumination also correlates with Security and Open indicators, with coefficients of 0.138 and 0.129, respectively, indicating that good lighting helps to enhance the sense of security and openness in space.
(4) Sound:
Sound is negatively correlated with Quiet, with a coefficient of -0.149, indicating that higher noise levels significantly reduce the perception of quietness and affect auditory comfort. In addition, Sound is also correlated with Varied, with a coefficient of 0.062.
(5) Temperature:
Temperature negatively correlates with Wind Strength, with a coefficient of -0.181, indicating that higher temperatures may reduce the perception of wind, affecting overall physical comfort. In addition, Temperature is also negatively correlated with Comfortable Lighting and Good Ventilation, with correlation coefficients of -0.170 and -0.192, respectively, indicating that higher temperatures may affect the comfort of lighting and ventilation.
(6) Wind Speed:
Wind Speed has the most significant correlation with Good Ventilation and Wind Strength, with correlation coefficients of 0.266 and 0.239, respectively. This indicates that higher wind speeds can significantly enhance the perception of ventilation and wind and improve the physical comfort of shopping spaces.

4.3.2. Correlation Analysis Results under Transport Dimension

In the Transport Dimension, the correlation between each physical environment parameter and the human-centred perception index is as follows:
(1) Aspect Ratio:
Aspect Ratio shows a positive correlation with Wind Strength, with a correlation coefficient of 0.140, indicating a specific positive correlation between changes in spatial ratio and wind perception, especially in the Transport Dimension.
(2) Humidity:
Humidity has a weaker correlation with Good Ventilation and Wind Strength, with correlation coefficients of 0.146 and 0.100, respectively. This indicates that humidity has less influence on ventilation and wind perception in transportation spaces.
(3) Illumination:
Illumination significantly affects Security and Comfortable Lighting, with correlation coefficients of 0.185 and 0.159, respectively, indicating that higher illuminance can enhance the sense of security and comfortable lighting in transportation space. At the same time, Illumination also has a positive correlation with Open and Gorgeous, with coefficients of 0.160 and 0.137, respectively, indicating that good lighting conditions enhance the sense of openness and aesthetics of the space.
(4) Sound:
Sound is negatively correlated with Quiet, with a correlation coefficient of -0.174, indicating that an increase in noise level reduces the perception of quietness in the transportation environment. In addition, Sound is also positively correlated with Varied, with a coefficient of 0.127, indicating that changes in noise have a particular impact on the auditory diversity of the traffic space.
(5) Temperature:
Temperature shows a negative correlation with Good Ventilation, with a correlation coefficient of -0.080, indicating that higher temperatures also reduce the perceived comfort of ventilation in the transportation space. In addition, Temperature also has a negative correlation with Wind Strength, with a coefficient of -0.080.
(6) Wind Speed:
Wind Speed is the most influential physical indicator in the transportation space, with correlation coefficients of 0.291 and 0.288 with Good Ventilation and Wind Strength, respectively, indicating that higher wind speed significantly improves the ventilation experience and wind perception.
By filtering and organising the correlation results between the human-centred perception indicators and each physical environment parameter, a table of correlation attribution of human-centred perception indicators was generated. The relationship between each perceptual dimension and the physical environment parameters is categorised, as shown in Table 4, which provides a clear basis for the correlation of the indicators and also lays a solid foundation for the regression analysis to ensure that the specific impact of the environmental parameters on the perceptual experience can be accurately predicted in further analyses.

4.4. Cross-Validation Analysis Based on Traditional Regression and Machine Learning Regression

Analysing the correlation between the human-centred perception evaluation and the physical environment data, the high correlation human-centred perception indicators are screened out, and regression analysis is carried out using single-indicator fitting and the XGBoost algorithm. In the single-indicator fitting regression analysis, the study determines the fitting curves of the highly correlated human-centred perception indicators using visualisation, combines these data with the data of the actual points, and superimposes these data for analysis. The suitability range of each physical environment parameter was determined based on the fitted curves’ performance. In the machine learning model regression analysis, the XGBoost algorithm performs multivariate regression analysis. The model construction and training are used to capture the complex nonlinear relationship between the human-centred perception evaluation and various physical environment parameters, which provides a more scientific and precise reference basis for determining the optimal configuration of physical environment parameters.

4.4.1. Commerical Dimension’s single-indicator fitted regression analysis

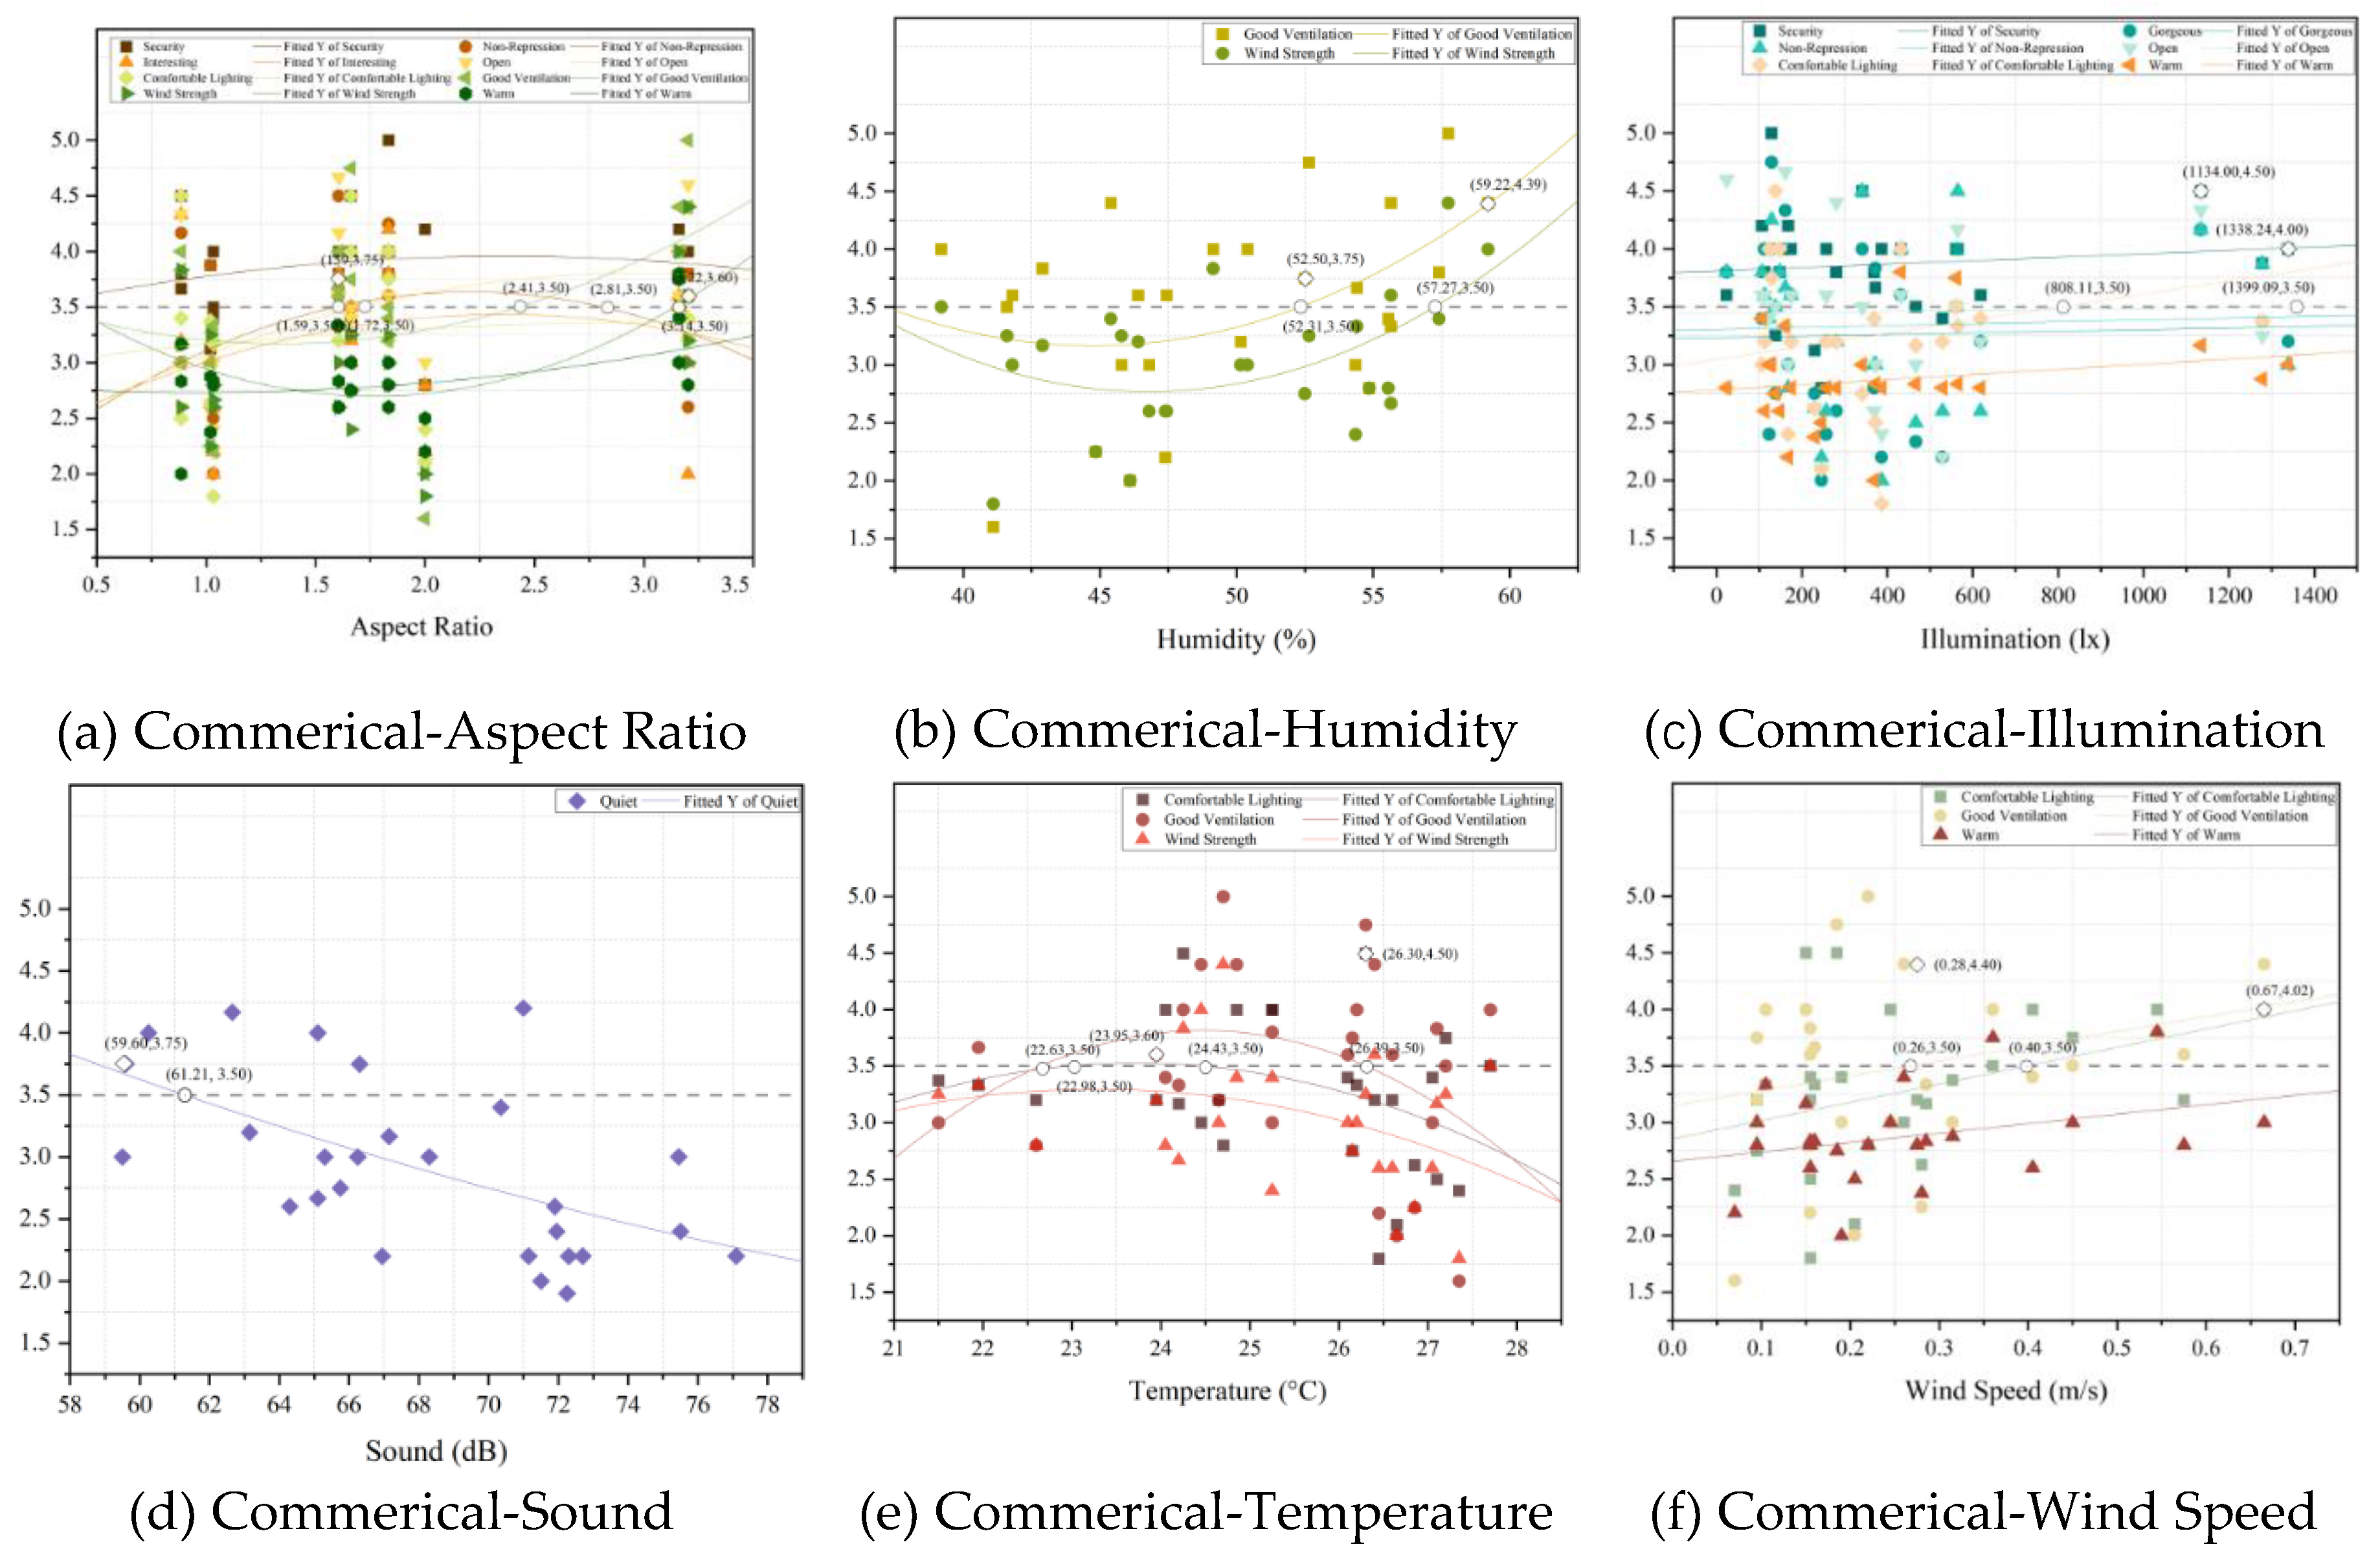
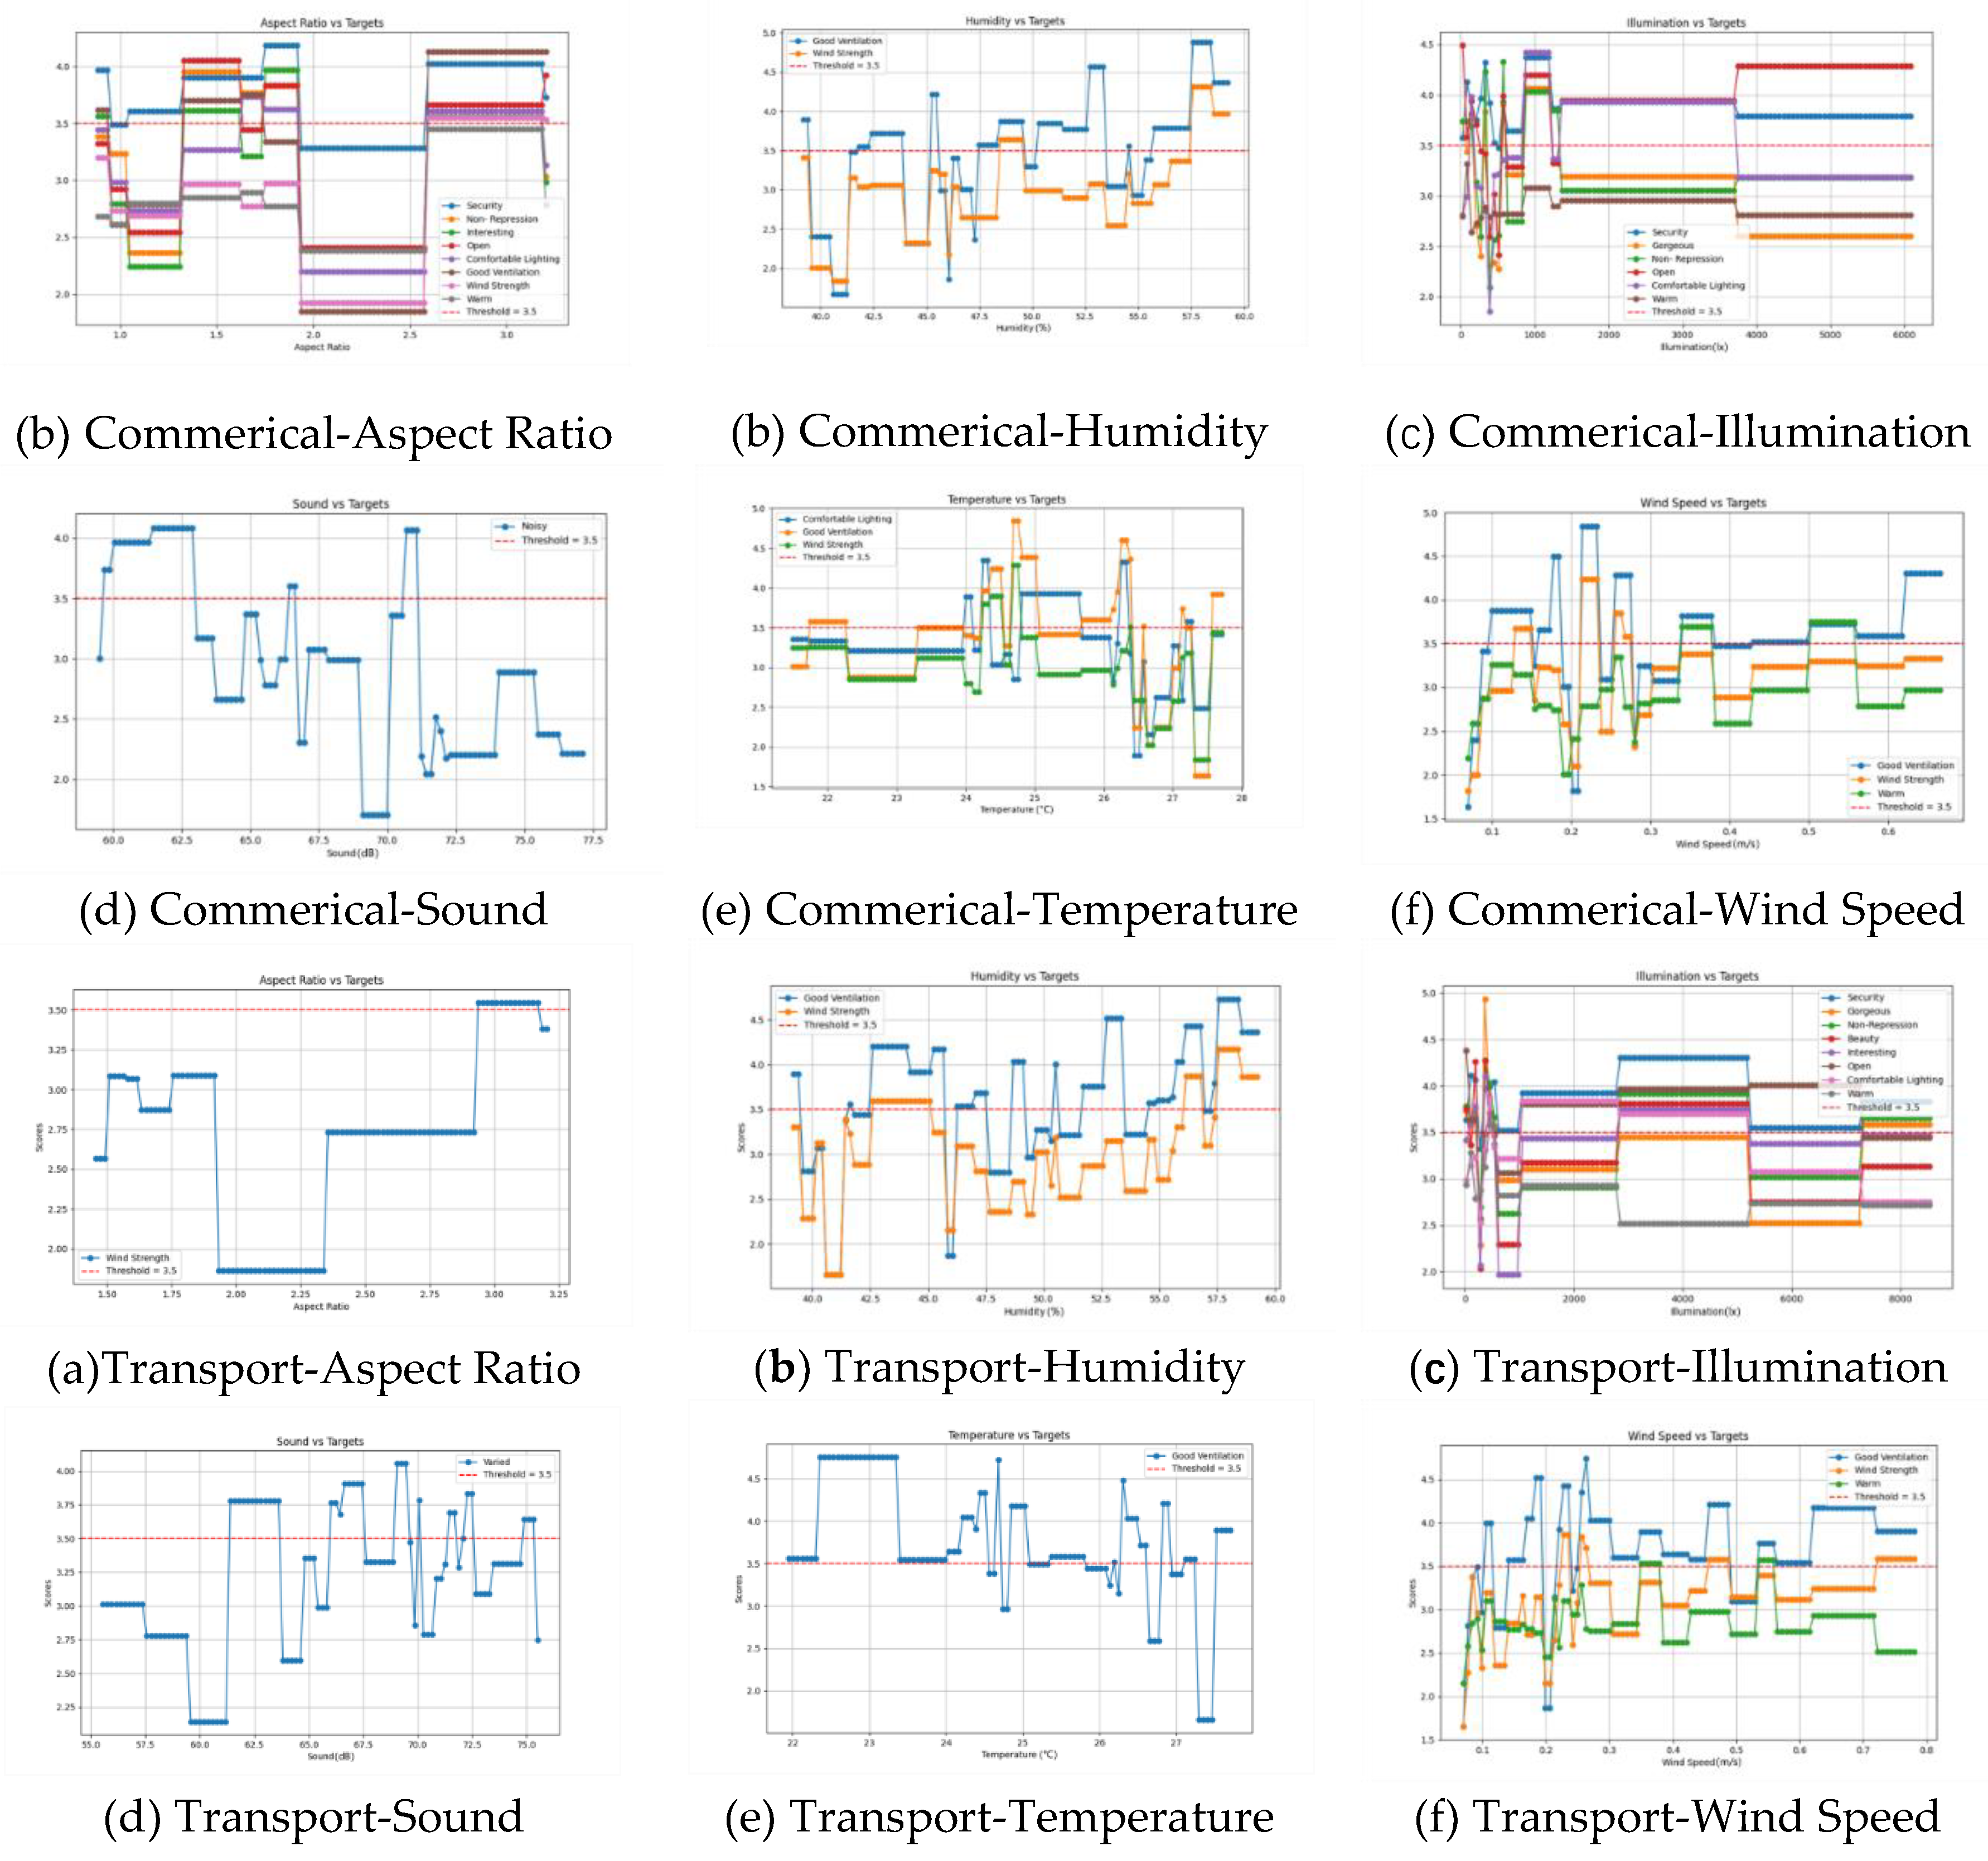
The results of the single-indicator fitted regression analysis under Commerical Dimension (as shown in Figure 4) are as follows:
(1) Aspect Ratio:
In the regression analysis of the Aspect Ratio, multiple human-centred perception indicators (e.g., Security, Interesting, Comfortable Lighting, and Wind Strength) show a significant trend with the change in Aspect Ratio. From the fitted curves, when the Aspect Ratio is between 1.59 and 2.81 and over 3.14, the satisfaction of several perceptual indicators exceeds 3.5 points, and users’ overall satisfaction performs well. The actual points show that the Aspect Ratio is 1.59 and 3.22, several metrics score more than 3.5, especially at 1.83, and the Wind Strength score reaches 3.75. Therefore, the recommended Aspect Ratio range is 1.59 to 2.81 and 3.14 to 3.22.
(2) Humidity:
In the regression analysis of Humidity, the Good Ventilation and Wind Strength metrics showed a clear trend with humidity. The fitted curves show that when the humidity is more significant than 52.31% or 57.27%, the satisfaction of the two indicators exceeds 3.5 points, and the users are more satisfied with the ventilation and wind strength sensation. The actual points show that Wind Strength scores exceed 3.5 for humidity, ranging from 52.50% to 59.22%. Therefore, the recommended Humidity range is 52.31% to 59.22%.
(3) Illumination:
In the regression analysis of Illumination, multiple perceptual indicators showed different trends with illumination. The fitted curves show that when the illuminance is more excellent than 808.11 lx, the satisfaction of various indicators exceeds 3.5 points, and users are more satisfied with the comfort and spatial perception of the lighting. The actual point data showed that when the illuminance was between 1134.00 lx and 1338.24 lx, the metrics Gorgeous and Open had scores of 4.00 or higher. Therefore, the recommended Illumination range is 808.11 lx to 1338.24 lx.
(4) Sound:
In the sound regression analysis, the Quiet metric showed a negative correlation with noise level. The fitted curves show that satisfaction with Quiet generally exceeds 3.5 points when the noise is below 61.21 dB and increases further as the noise level decreases. The points show that the Quiet score reaches 3.75 when the noise level is 59.60 dB. Therefore, the recommended Sound range is from 59.60 dB to 61.21 dB.
(5) Temperature:
In the regression analysis for temperature, satisfaction with comfortable lighting, good ventilation, and wind strength showed different trends in temperature. The fitted curves show that when the temperature is between 22.63°C and 26.39°C, the satisfaction scores of several indicators exceed 3.5, and users perceive ventilation and wind strength more positively. The actual point data shows that Good Ventilation and Wind Strength scores are exceptionally high, at 4.50, when the temperature is between 23.95°C and 26.30°C. Therefore, the recommended temperature range is 22.63°C to 26.39°C.
(6) Wind Speed:
The regression analysis of Wind Speed, Comfortable Lighting, Good Ventilation, and Warm metrics positively correlated with wind speed. The fitted curve shows that when the wind speed is more significant than 0.26 m/s, several satisfaction indicators exceed 3.5 points, and users’ overall satisfaction is higher. The actual point data showed that the Wind Strength score reached 4.02 when the wind speed was between 0.28 m/s and 0.67 m/s. Therefore, the recommended Wind Speed range is from 0.26 m/s to 0.67 m/s.

4.4.2. Single-indicator fitted regression analysis for Transport Dimension

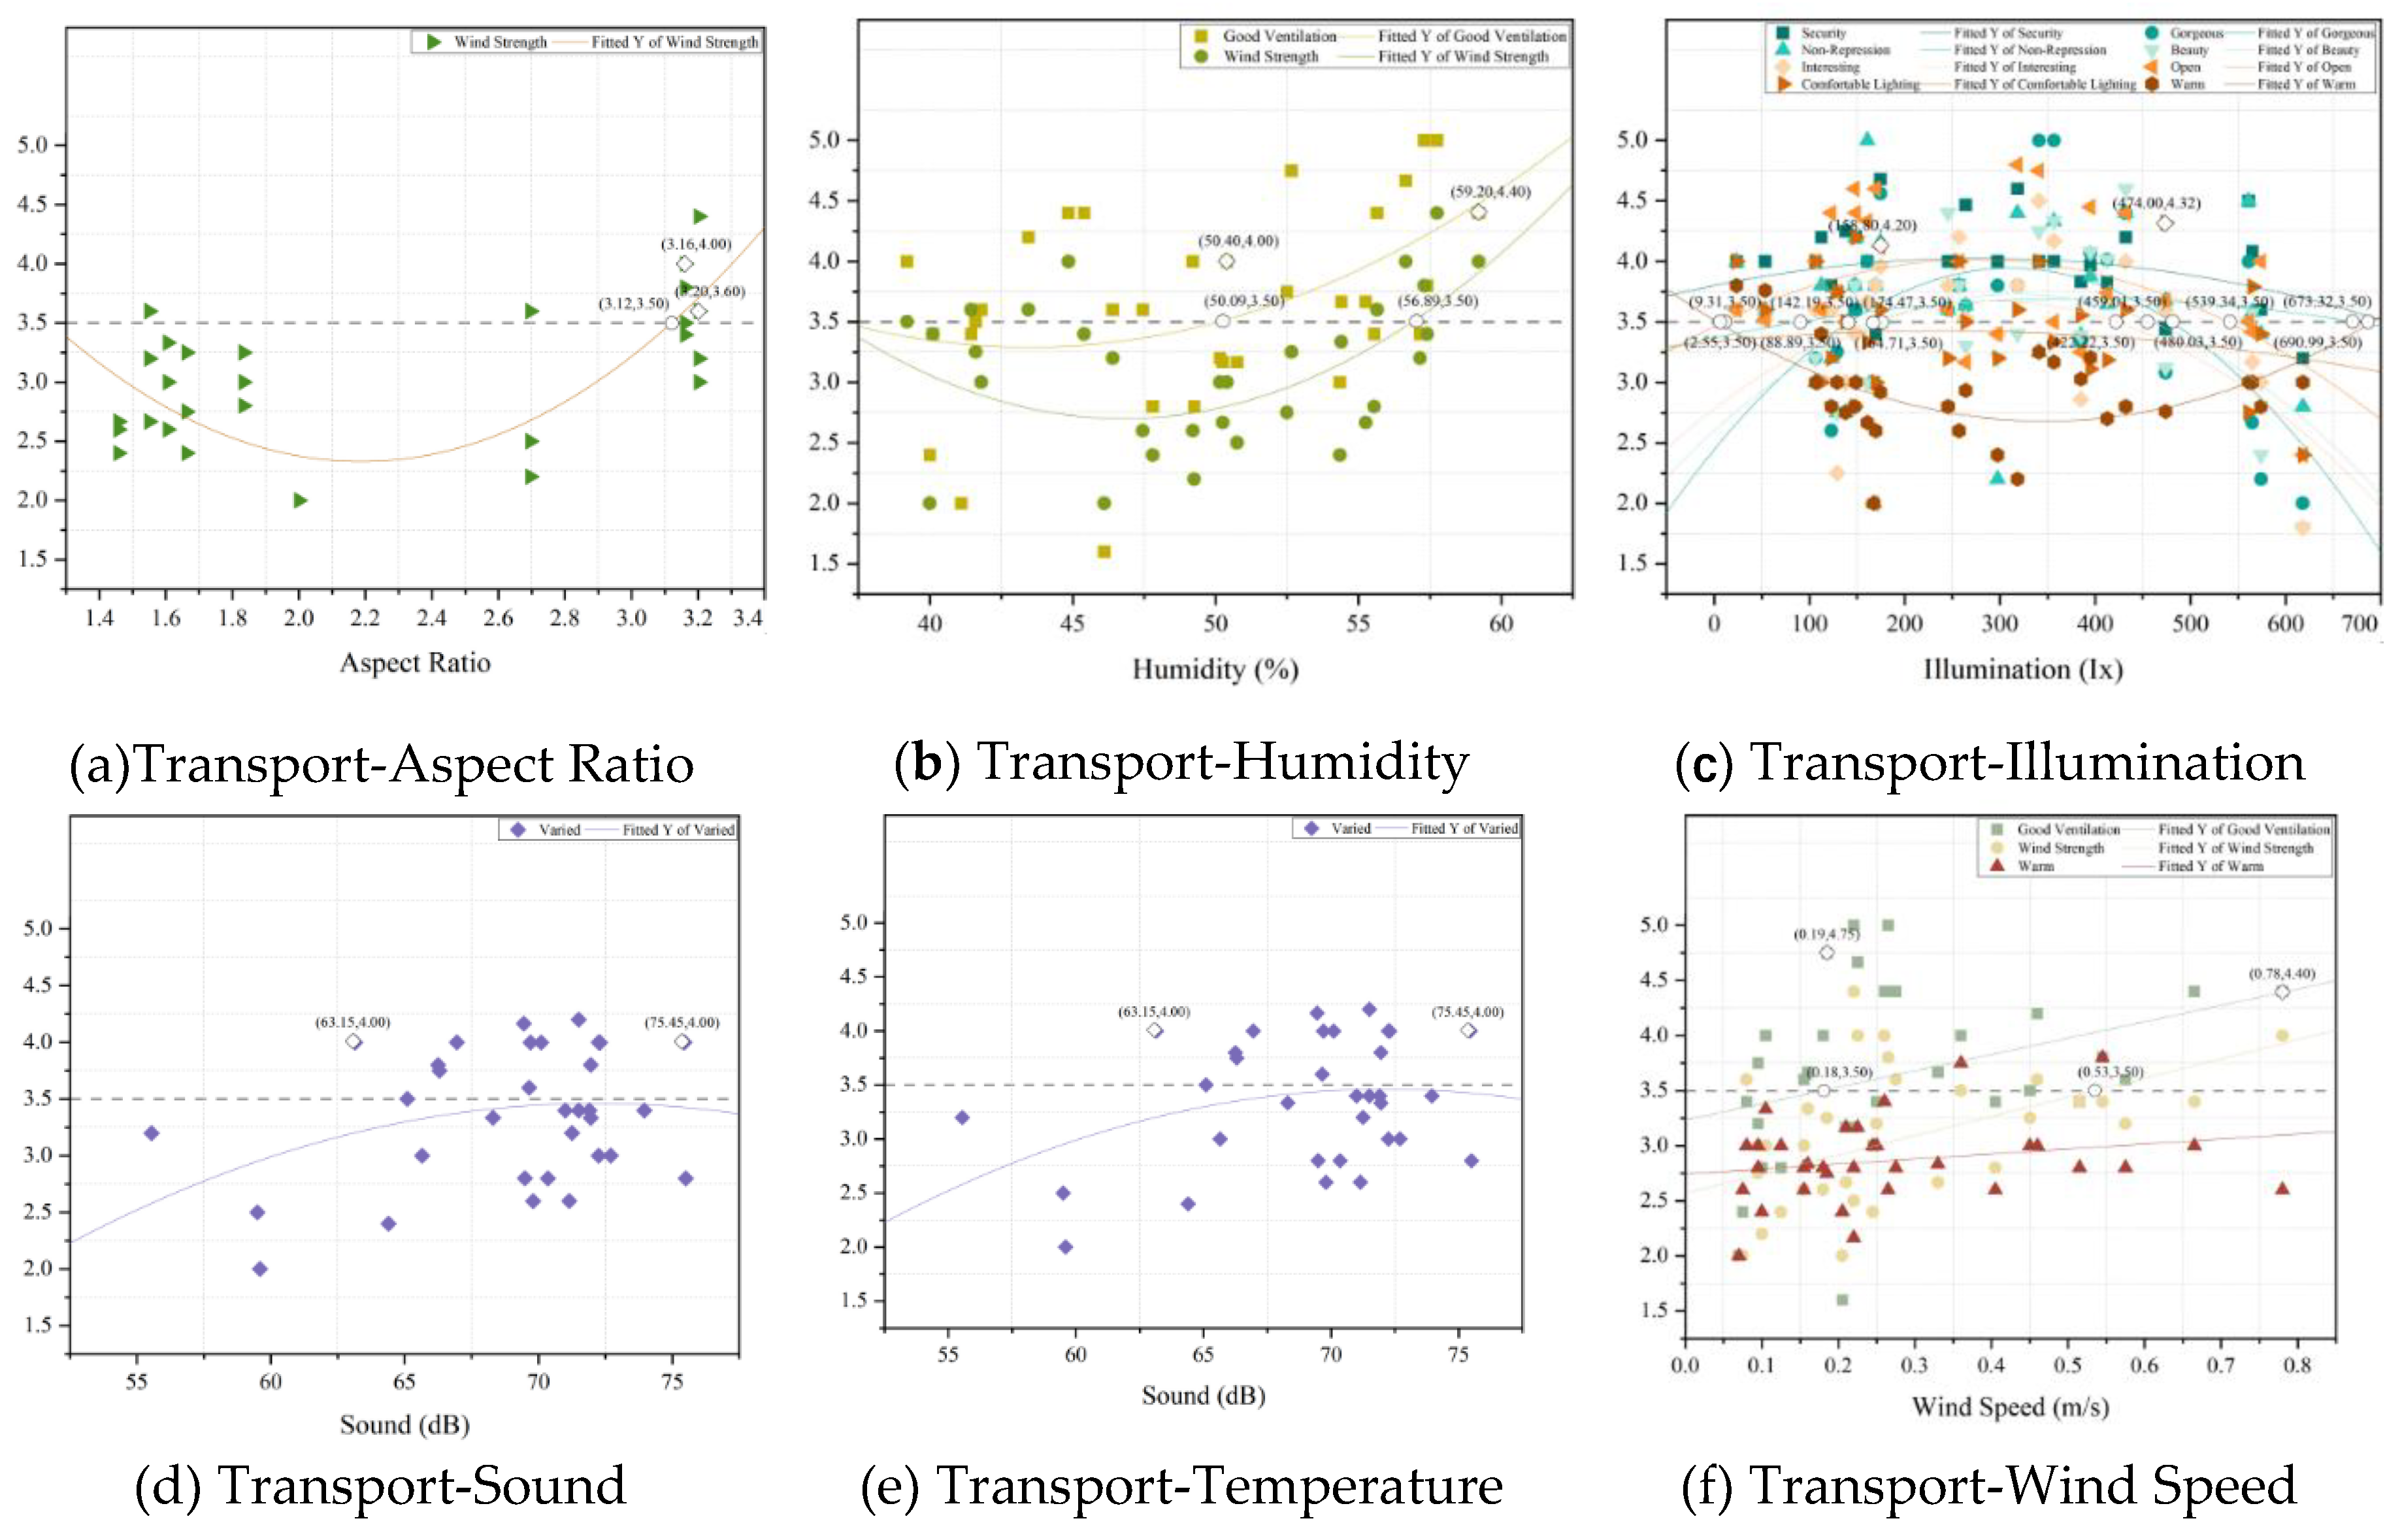
The results of the single-indicator fitted regression analysis under Transport Dimension (as shown in Figure 5) are as follows:
(1)Aspect Ratio
In the regression analysis of the Aspect Ratio, Wind Strength is the primary influence indicator. The fitted curve shows that when the Aspect Ratio is more significant than 3.12, the score of Wind Strength is more than 3.5, and with the increase of Aspect Ratio, the user’s satisfaction gradually increases. The actual points show that the best point for comfort occurs between 3.16 and 3.20, with a score of 4.00. Therefore, the recommended Aspect Ratio range is 3.12 to 3.20.
(2)Humidity
Wind Strength and Good Ventilation were the critical indicators in the regression analysis of Humidity. The fitted curves show that when Humidity is more excellent than 50.09%, the scores of the two metrics gradually exceed 3.5. The actual point data show that Wind Strength performs best in satisfaction when the humidity ranges from 50.40% to 59.20%, especially at 59.20%, where the score reaches 4.40. Therefore, the recommended Humidity range is from 50.09% to 59.20%.
(3) Illumination
In the regression analysis of Illumination, several perception indicators (e.g., Security, Non-Repression, and Comfortable Lighting) showed significant trends with Illumination. The fitted curves show that when Illumination is between 142.19 lx and 480.03 lx, the satisfaction scores for several perceptual indicators are above 3.5 points, while above 480.03 lx, the satisfaction scores start to decrease. The actual points show that the best satisfaction occurs at 158.80 and 474.00 lx, with a score of 4.00. Therefore, the recommended range for Illumination is 142.19 lx to 480.03 lx.
(4) Sound
Although the fitted curve did not provide a clear trend in the regression analysis of Sound, based on the actual point data, the optimal satisfaction range occurs between 63.15 dB and 75.45 dB, with multiple perceptual metrics scoring at or above 4.00 in this range. Therefore, the recommended Sound range is 63.15 dB to 75.45 dB.
(5) Temperature
In the regression analysis of Temperature, Good Ventilation satisfaction showed a significant trend with Temperature. The fitted curve shows that Good Ventilation’s score gradually increases and exceeds 3.5 when the temperature is lower than 26.35°C, indicating that lower temperatures result in higher ventilation satisfaction. The actual point data showed that the optimal Temperature range was between 21.95°C and 26.20°C, where the highest scores were achieved. Therefore, the recommended Temperature range is 21.95°C to 26.35°C.
(6) Wind Speed
In the regression analysis of Wind Speed, the satisfaction with Wind Strength, Good Ventilation, and Warmth increased with increasing Wind Speed. The fitted curves show that when Wind Speed is more significant than 0.18 m/s, the scores of several perception indicators gradually exceed 3.5. The actual point data showed that the optimal Wind Speed range was between 0.19 m/s and 0.78 m/s, with Wind Strength scores reaching 4.75. Therefore, the recommended Wind Speed range is 0.18 m/s to 0.78 m/s.

4.4.3. Regression Model Analysis Based on XGBoost Algorithm

In the regression analysis of the Commercial Dimension and Transport Dimension, the study also used the XGBoost model in machine learning to predict the relationship between different physical environment parameters and human-oriented perception indicators, as shown in Figure 6. Overall, although the prediction of XGBoost is more effective, in general, the model construction results are more random, and the r² scores are insufficient in some cases, showing that the stability of the results still needs to be improved. However, in general, the construction results of the model are more random. In some cases, the R² score of the model is insufficient, showing that the stability of the prediction results still needs to be improved. Nevertheless, the model demonstrated the potential to provide an auxiliary reference for future environmental parameter optimisation, and the study selected a model with R2 greater than
(1)Temperature
The results of the XGBoost regression model show that the Good Ventilation fitted equation in the Commercial Dimension has r² = 0.5269, and the model predicts a good range of temperatures from 21.7505°C to 27.7000°C. Compared to the single-indicator fit (22.63°C to 26.39°C), the machine learning model predicts a slightly more comprehensive range and covers the recommended range of temperature parameters for the single-indicator fit, indicating that the model is more flexible and stable. Compared with the single-indicator fit (22.63°C to 26.39°C), the machine learning model predicts a slightly more comprehensive range and covers the recommended range of the single-indicator fit, which indicates that the model is more flexible and has better stability in predicting temperature parameters. In the Transport Dimension, Good Ventilation’s fitted equation has r² = 0.3602, which is close to the threshold, but the prediction is more limited and falls short of the expected stability.
(2)Illumination
In the Commerical Dimension, the XGBoost regression model showed r² = 0.4077 for the fitted equation for Gorgeous, with a better model prediction and a recommended range of illuminance of 23.5000 lx to 1184.8990 lx. Compared to the recommended range for the single-indicator fit (808.11 lx to 1338.24 lx) Compared to the recommended range for the single metric fit (808.11 lx to 1338.24 lx), the model predicts a lower bound, indicating a more robust user perception in low illumination conditions. In the Transport Dimension, Gorgeous’ fitted equation has r² = 0.3818, and the model predicts well, with a recommended illuminance range of 23.5000 lx to 8525.0000 lx. Compared to the results of the single-indicator fit (142.19 lx to 480.03 lx), the model predicts over a broader range, especially under high illuminance conditions. Compared with the results of the single-indicator fit (142.19 lx to 480.03 lx), the model provides a broader range of predictions, especially under high illumination.
(3)Humidity
The XGBoost regression model in the Commercial Dimension shows Good Ventilation’s fitted equation with r² = 0.5212, which is a good prediction with a recommended humidity range of 39.2000% to 59.2000%. Compared to the recommended humidity range for the single-indicator fit (52.31% to 59.22%), the model extends the range under low humidity conditions and shows greater adaptability. In the Transport Dimension, Good Ventilation’s fitted equation has r² = 0.4043, and the model predicts well, recommending a humidity range of 39.2000% to 59.2000%, again demonstrating a wide range of applicability under low humidity conditions.
(4)Wind Speed
In the commercial dimension, the XGBoost regression model shows that Good Ventilation’s fitted equation has an r² = 0.4828, which is a good prediction, with recommended wind speeds ranging from 0.1001 m/s to 0.6650 m/s. Compared to the single-indexed fit (0.26 m/s to 0.67 m/s), the model performs well at low wind speeds, with a recommended range of 39.2000% to 59.2000%, demonstrating broad applicability at low humidity. Compared with the results of the single-indicator fit (0.26 m/s to 0.67 m/s), the model shows higher prediction ability at low wind speeds, indicating that it can cover more environmental conditions. In the Transport Dimension, Good Ventilation’s fitted equation has r² = 0.3681, which is close to the threshold, but the prediction is more limited and does not reach a high level of stability.
(5)Sound
In the Commerical Dimension, the XGBoost regression model shows that the fitted equation for Noisy has r² = 0.3654, which is close to the threshold but does not achieve the desired stability, with a recommended noise range of 59.6778 dB to 71.0556 dB. Compared to the recommended range for the single metric fit (59.60 dB to 61.21 dB). Compared with the recommended range for single-indicator fitting (59.60 dB to 61.21 dB), the machine learning model has a broader prediction range, which provides more prediction references, especially in high-noise environments, indicating that the model can better cope with different noise conditions. In the Transport Dimension, Varied’s fitting equation has r² = 0.2263, and the model predicts no
(6) Aspect Ratio
In the commercial dimension, the XGBoost regression model has an r² of less than 0.3 for all relevant metrics, which does not provide valid predictions and indicates that the model is unstable in this dimension. In the Transport Dimension, Wind Strength’s fitted equation has an r² = 0.1886, and the model predictions are also not stable enough to provide informative ranges. Therefore, the Aspect Ratio model prediction results in both dimensions did not reach validity and failed to provide a reference basis for design.
This single-indicator fitting regression analysis successfully determined the range of suitability parameters highly correlated with the human-oriented perception indicators for each physical environment parameter in the commercial dimension and Transportation Dimension. Based on these theoretical calculations and actual point data, the recommended physical environment parameter ranges are adaptable and provide a reference basis for subsequent spatial environment optimisation.
On this basis, key physical environment parameters such as Temperature and Illumination were cross-validated by combining the regression analysis results of the XGBoost machine learning model. The XGBoost model provides a more flexible and broader prediction range for these parameters in the commercial dimension. Some results are consistent with the recommended range of single-indicator fitting and even extend the applicability range in the low-parameter or high-parameter interval.

5. Discussion

5.1. Research Innovation

In recent years, with the development of human-centred design concepts, more scholars have carried out bottom-up urban spatial research from the perspective of multi-scale and multi-form human nature. Sevtsuk A used the distribution of human flow in the urban road network to assess the construction of urban facilities [53]. Lopez Baeza J used the intelligent body to simulate the flow of human beings to study the problem of urban land development [54], which are cases that fully demonstrate the value of assessing spatial environments from a human-centred perspective. The perspective of evaluating the spatial environment is informative. There is little research on how people’s perceptions of the spatial environment are formed and what is influenced by the environment. Istrate, A. used pedestrian flow and resident activity as essential indicators and found that environmental factors such as small businesses and buildings along the street are closely related to human activity [55]. Choi J correlated actual pedestrians with the environmental geometric features of the interview sites and identified the main design features that improve pedestrian satisfaction with crucial design features [56]. On the other hand, this study starts from a more microscopic scale of sensory perception to conduct a more comprehensive investigation of human perception in spatial environments.
Indoor spatial environment evaluation models have been used in office or residential spaces, and a more mature evaluation system has been formed [57]. However, it focuses on a single physical environment indicator. Still, this experiment breaks through this limitation and systematically introduces indicators closer to humanistic perception, such as Visual, Auditory and Somatosensory, to realise the correlation research of ‘environment-human’. Through data analysis and perception feedback, the results of human psychological perception are directly reflected in the specific physical environment parameters, which allows for regulating the environmental suitability parameters of human-centred perception. In this paper, machine learning models are used to differentiate the demand for environmental parameters, which verifies the results of single-indicator regression and expands the range of parameters to reveal the different needs of commercial and traffic space in environmental regulation.
In the related research on underground space, several scholars have shown their concern for human behaviour and psychology in underground space [58], using EEG, virtual reality and other methods to simulate underground building environments and carrying out research from the perspectives of user satisfaction and physical and mental health [59]. Meng Q studied the acoustic environment of underground space, pointing out that the background music can cover up the unwanted sound sources and the comfort level is between 65 dB and 70 dB [60], which is consistent with the range obtained in this study, and further reveals the differences in noise tolerance in different spaces, with users in transport spaces having a higher tolerance for noise and commercial spaces requiring more refined noise management, suggesting the need for a more personalised approach to regulating the environments of different functional spaces. Wu Y and other scholars [61] researched the underground working environment, suggesting a range of 545 lx to 1000 lx for underground working environments, with a range of 545 lx to 1000 lx. Wu Y and other scholars proposed an illuminance range of 545 lx to 1000 lx for underground working environments, while this study obtained the recommended illuminance ranges of 142.19 lx to 480.03 lx and 808.11 lx to 1338.24 lx for both dimensions, which shows the need for illuminance regulation in different scenarios. In terms of temperature, the recommended values for the two dimensions in this study range from 22.63°C to 26.39°C and 21.95°C to 26.35°C, which is similar to the conclusion of Wu Y and other scholars and academics that the range is from 22.0°C to 27.3°C. In contrast, this study emphasises the differentiation of the needs of different functional spaces.
Based on a multi-sensory perception survey, this study explores the association between human perception and the physical environment in underground spaces. Compared to previous studies that primarily focused on indoor environments, this study comprehensively analyses the impact of environmental factors on user experience by introducing multi-dimensional perceptual experiences such as Visual, Auditory, and Somatosensory Dimensions. The noise, illumination, and temperature results are consistent with those of scholars such as Meng Q and Wu Y, further verifying the differences in environmental regulation needs in different functional spaces.

5.2. Limitations and Future Directions

In this study, although human perception evaluation was introduced as a mediator in exploring the environmental regulation of underground space, Visual perception dominated the data collection process, resulting in relatively weak data for other perception dimensions. The study is limited in selecting parameters for physical environment measurement, mainly focusing on essential environmental factors such as temperature, humidity, and illuminance while neglecting the consideration of broader environmental factors such as air quality, carbon emission, and green coverage. To better reflect the ecological quality of underground space, these critical indicators related to sustainable development should be included in the future.
In the process of regression analysis, the study used machine learning techniques to model and analyse the environmental data, but there are still some deficiencies in model stability. Due to the diversity and limited scale of the training data, the machine learning model fluctuates in predicting the performance of different contexts, and its practical application in complex environments still requires more in-depth model training and optimisation. Meanwhile, the research cycle is short, ignoring the long-term impact of seasonal changes on the underground space environment. Future research on the ability of underground space to regulate dynamic environmental regulations under different seasonal conditions should be strengthened.
Future research on underground space should develop toward more intelligence and diversification. Meanwhile, combining virtual reality (VR) and augmented reality (AR) technologies brings new possibilities for environmental research. By simulating different physical environment parameters in virtual space, researchers can conduct large-scale experiments in a shorter period, collect subjects’ perceptual feedback, and enhance the extensiveness of research and the richness of experimental data. The introduction of virtual experiments will allow research to break through the limitations of physical space and provide more references for designing and optimising underground spaces. With the continuous development of artificial intelligence and IoT technology, regulating the underground space environment will gradually shift toward intelligence and adaptation. By introducing intelligent sensor networks combined with deep learning algorithms, real-time monitoring and adaptive regulation of the environment can be achieved. The underground space’s temperature, humidity, air quality, and other parameters can be automatically adjusted according to the real-time flow of people, user feedback, and changes in the external environment, allowing for brilliant space management. The concept of sustainable development will also be more deeply integrated into the future underground space design. Through the introduction of renewable energy, low-carbon building materials and intelligent exhaust gas recycling systems, underground spaces will not only provide efficient functional services for cities. Still, they will also become important in promoting green urban development. Combining intelligence and sustainability will be the core direction of future underground space design and operation.

6. Conclusions

6.1. Conclusions of the Research

Through the cross-validation of the single-indicator fitting regression analysis and the XGBoost machine learning model in this study, the relationship between each physical environment parameter and the human perception indicators under the Commerical Dimension and Transport Dimension was comprehensively analysed, and the final suitability thresholds were determined. The specific results are as follows:
(1)Aspect Ratio:
In the commercial dimension, the recommended values range from 1.59 to 2.81 and 3.14 to 3.22, while in the Transport Dimension, the recommended values range from 3.12 to 3.20. The difference is mainly due to the difference in the functions of the two types of spaces. Commercial spaces usually focus on openness, safety and visual comfort, especially in shopping environments, where tourists are interested in a rich experience and narrower spaces are acceptable. In contrast, spacious spaces can enhance the comfort and safety of customers. On the other hand, traffic space focuses on access efficiency and fluidity, with more focused requirements on the spatial scale to ensure a smooth flow of people. The XGBoost model fails to provide reliable results in predicting Aspect Ratio, probably because of the single type of spatial scale data, and it is difficult for the current model to capture the regular changes under this multi-dimensional factor.
(2)Humidity:
In the Commercial Dimension and Transport Dimension, the recommended humidity ranges from 50.09% to 59.22%, and the predictions of the XGBoost model show that the lower limit of suitable humidity can extend to 39.20%. This difference may be because commercial and transport spaces focus on different user experiences regarding humidity regulation. Commercial spaces usually require higher comfort and ventilation, while transport spaces have high traffic flow and maintain medium humidity, which helps to improve air quality. xGBoost model predictions extend the lower humidity limit, showing that good air circulation can be maintained at lower humidity levels.
(3)Illumination:
In the Commerical Dimension, the single-indicator fit analysis yields a recommended range of 808.11 lx to 1338.24 lx, and the XGBoost model predicts a range of 23.50 lx to 1184.90 lx, expanding the applicability at lower illumination levels. In contrast, Transport Dimension recommends a lower illuminance range of 142.19 lx to 480.03 lx, while the XGBoost model predicts an upper limit of 8525.00 lx. The difference in illuminance requirements between the two types of spaces stems from their functional needs. Commercial spaces are concerned with improving the visual experience, safety, and comfort (e.g., Comfortable Lighting and Security Perception Indicators) through appropriate lighting. In contrast, traffic spaces are primarily concerned with essential visibility and do not require high illuminance levels. The high range of illuminance predictions from the XGBoost model for traffic spaces may reflect that the data are unavailable under certain special conditions (e.g., lighting of an exterior space or a skylight). space or skylight lighting) data situations.
(4)Sound:
In the Commerical Dimension, the recommended noise range is 59.60 dB to 61.21 dB. In comparison, the XGBoost model prediction range extends from 59.68 dB to 71.06 dB, which provides more prediction references, especially in noisy environments. Transport Dimension has a more comprehensive recommended noise range of 63.15 dB to 75.0 dB. 63.15 dB to 75.45 dB may reflect the higher noise tolerance in the transport space and the lower sensitivity of users to noise. In the commercial space, on the other hand, the predicted range of the XGBoost model suggests that the effects of noise may be more complex than we expect and require finer tuning. When predicting the XGBoost model in commercial space, the user’s varied perceptual indicators have a more limited impact on the noise changes, and a more accurate prediction calculation is impossible.
(5)Temperature:
In the Commerical Dimension, the recommended temperature range is 22.63°C to 26.39°C, and the XGBoost model predicts a range of 21.75°C to 27.70°C, expanding the upper and lower bounds of the appropriate temperature. In the Transport Dimension, the recommended temperature range is 21.95°C to 26.35°C, and the XGBoost model predicts a range of 21.95°C to 27.7°C, with a minor difference. Temperature requirements are similar in commercial and transport spaces. Still, commercial spaces significantly impact physical comfort (Comfortable Lighting, Good Ventilation, and Wind Strength metrics) due to longer user dwell times. In contrast, in transport spaces, the temperature is regulated primarily to maintain essential comfort, and therefore, the range is more extensive. The range is more extensive.
(6)Wind Speed:
In the Commerical Dimension, the recommended wind speeds range from 0.26 m/s to 0.67 m/s, and the XGBoost model predicts a range of 0.10 m/s to 0.67 m/s, which suggests that good physical comfort can be maintained at lower wind speeds. The recommended wind speeds in the Transport Dimension are 0.18 m/s to 0.67 m/s. 0.18 m/s to 0.78 m/s, and the XGBoost model predicts a range of 0.11 m/s to 0.78 m/s, which slightly extends the upper limit, possibly because transport spaces have a higher demand for wind speeds, and it is essential to maintain appropriate ventilation. As transport spaces tend to be high-traffic areas, more substantial wind speeds can help improve air mobility and overall environmental quality.

6.2. Suggestion of Design and Application

This paper proposes a more innovative and flexible environmental control system for urban underground spaces based on the appropriateness ranges of six key physical environment parameters derived from this study. The system applies not only to all kinds of commercial and transport functional spaces but also to the dynamic balance between user perception and comfort. By integrating environmental sensing technology and data analysis, the system can be adjusted in real-time under different conditions to ensure the adaptability and sustainable development of the environment and then improve the overall efficiency of underground space.
Optimised design of space proportion and layout
In terms of space proportion design, flexible design is emphasised, and precise optimisation is carried out according to the needs of different functional areas. For commercial spaces, it is recommended to introduce modular design and multi-level visual strategy to enhance the visual experience by flexibly adjusting the Aspect Ratio. Expansive atriums or open plazas not only improve the openness of the space but also effectively guide the flow of people and increase the length of time customers stay and interact. The design of storey height should be combined with ergonomics to reduce visual oppression and improve spatial comfort through data model analysis. The design of the traffic space focuses more on efficient access and safety, and the ratio of 3.12 to 3.20 is optimised through refined simulation of pedestrian flow data to ensure smooth access and enhance the operational efficiency of the space.
Humidity control and multi-dimensional environmental adaptation
Humidity control should consider human comfort and combine it with the unique environmental conditions of underground space. The intelligent humidity control system, combined with the regional climate conditions, achieves dynamic humidity adjustment. Commercial spaces can enhance the humidity regulation of the space by incorporating water feature design and intelligent humidification equipment while creating a unique environmental atmosphere to reduce the discomfort of dry air for customers. Humidity control in transport spaces, on the other hand, should be combined with air circulation systems to ensure that humidity is kept within a suitable range and to avoid a feeling of stuffiness or corrosion of facilities caused by humidity. At the same time, careful consideration should be given to the durability of different building materials in high-humidity environments to reduce maintenance costs.
Intelligent lighting design and low energy consumption management
The lighting design of underground space should be fully integrated with an intelligent lighting system to balance user comfort and energy consumption through real-time sensing and adaptive adjustment. Commercial space should adopt multi-mode lighting design, dynamically adjusting the light intensity according to the flow of people and period, especially during peak hours, by increasing the brightness to enhance the sense of security and comfort. Biorhythm lighting technology can be used to simulate natural light changes and improve the psychological state of customers. On the other hand, traffic spaces must prioritise functional lighting, avoiding energy wastage by combining sensors and automatic dimming systems while ensuring essential lighting.
Acoustic environment control and functional zoning optimisation
The design of the acoustic environment needs to consider the differences in the needs of different functional zones. For noise control, it is recommended that the arrangement of sound-absorbing materials and noise barriers be optimised through spatial acoustic simulation technology to reduce the interference of train and equipment noise to users in the traffic space. Commercial spaces can improve customers’ auditory experience through background music and functional zoning design, and the intensity and type of sound can be set according to different zones, e.g., different sound environment designs for shopping and rest areas to avoid auditory fatigue. At the same time, attention should be paid to the psychological and physiological effects of long-term exposure to the noise environment.
Temperature control and intelligent air-conditioning system integration
The temperature control of underground space needs to rely on advanced intelligent systems to adjust the temperature in real-time according to the regional climate, seasonal changes and the flow of people. Commercial spaces should adopt a multi-zone temperature control system that combines intelligent sensors to regulate the temperature of different zones to ensure comfort. For example, a moderately cooler temperature can be maintained in high-traffic areas to enhance the shopping experience. On the other hand, transport spaces should adopt zoned temperature control and waste heat recovery technologies to reduce overall energy consumption and improve passenger comfort through careful thermal management.
Combination of natural ventilation and efficient mechanical ventilation systems
Natural and mechanical ventilation should work together in the underground space to form an optimal air circulation programme. Commercial spaces should incorporate the building’s natural air ducts to enhance air flow while avoiding excessive wind speeds that may cause discomfort. Traffic space should be dynamically adjusted through a real-time air quality monitoring system to ensure optimal air quality and circulation speed. The application of passive ventilation technology can significantly reduce the energy consumption of mechanical ventilation while improving the overall environmental quality of underground space.

Supplementary Materials

The following supporting information can be downloaded at the website of this paper posted on Preprints.org, Figure S1: title; Table S1: title; Video S1: title.

Author Contributions

Conceptualization, Yao Tianning; Data curation, Liang Sun and Kuntao Hu; Formal analysis, Yao Tianning; Funding acquisition, Liang Sun; Investigation, Lin Geng and Kuntao Hu; Methodology, Yao Tianning, Liang Sun, Yao Xu, Xing Chen and Jin Wang; Resources, Lin Geng and Pan Liao; Software, Yao Tianning and Yao Xu; Supervision, Lin Geng, Xing Chen and Jin Wang; Validation, Yao Tianning; Visualization, Yao Xu, Xing Chen and Pan Liao; Writing – original draft, Yao Xu.

Funding

This research was funded by the International Science and Technology Cooperation Fund of Jiangsu Collaborative Innovation Center for Building Energy Saving and Construction Technology, grant number SJXTGJ2102.

Data Availability Statement

The data presented in this study are available on request from the corresponding author. The data are not publicly available due to privacy.

Acknowledgments

In this section, you can acknowledge any support given not covered by the author contribution or funding sections. This may include administrative and technical support, or donations in kind (e.g., materials used for experiments).

Conflicts of Interest

The authors declare that the research was conducted without any commercial or financial relationships that could be construed as potential conflicts of interest.

Appendix A

To enhance the scientific rigour and accessibility of the manuscript, particularly for readers outside the specialised field, we have incorporated a glossary of terms (as shown in Table 1) that elucidates the 13 evaluation metrics related to Human-Centred Perception. This glossary provides precise definitions of each metric while explaining them in more accessible language to facilitate broader comprehension. By doing so, we aim to ensure that readers from diverse backgrounds can effectively understand the key concepts and their relevance to the evaluation of underground spaces while maintaining the manuscript’s technical accuracy and academic integrity.
Table A1. Glossary of terms.
Number Human-centered Perception Indicators Evaluation Description
1 Security Represents the level of perceived safety and protection within the underground environment.
2 Gorgeous Refers to the visual appeal and aesthetic richness of the underground’s design and features.
3 Non-Repression Measures openness, avoiding feelings of confinement or claustrophobia in the underground space.
4 Beauty Reflects the overall attractiveness and harmonious design of the underground.
5 Interesting Captures the engaging and stimulating qualities of the underground that hold pedestrians’ attention.
6 Open Describes the spatial experience of openness and freedom, indicating a lack of clutter and barriers.
7 Comfortable Lighting Assesses the adequacy, warmth, and distribution of lighting within the underground, ensuring it supports visibility and comfort.
8 Quiet Evaluate the noise control level and the absence of disruptive sounds in the underground space.
9 Varied Describes the presence of a diverse range of sounds, contributing to a dynamic and lively acoustic environment.
10 Pleasant Reflects the overall enjoyment of the soundscape, with pleasing auditory elements that enhance the underground experience.
11 Good Ventilation Measures the effectiveness of air movement and freshness in the underground, contributing to physical comfort.
12 Wind Speed Assesses the presence and impact of wind within the underground space, considering comfort and usability.
13 Warm Describes the temperature comfort in the underground, particularly about warmth and coziness.

References

  1. Cellucci, C. Adaptability as a Multi-Scale Strategy for the Regeneration of the Built Environment Through Circular Economy Perspective. *AHFE International*, 2023, 112, 45-55.
  2. Sailor, D. J. Risks of Summertime Extreme Thermal Conditions in Buildings as a Result of Climate Change and Exacerbation of Urban Heat Islands. *Building and Environment*, 2014, 78, 81-88. [CrossRef]
  3. Broere, W. Urban Underground Space: Solving the Problems of Today’s Cities. *Tunnelling and Underground Space Technology*, 2016, 55, 245-248. [CrossRef]
  4. Yang, K. H.; Su, C. H. An Approach to Building Energy Savings Using the PMV Index. *Building and Environment*, 1997, 32(1), 25-30. [CrossRef]
  5. Zampetti, L.; Arnesano, M.; Revel, G. M. Experimental Testing of a System for the Energy-Efficient Sub-Zonal Heating Management in Indoor Environments Based on PMV. *Energy and Buildings*, 2018, 166, 229-238. [CrossRef]
  6. Conceição, E.; Conceição, M.; Conceição, M. I.; et al. Design, Environment, Energy, and Comfort in Buildings Equipped with a PMV-Controlled HVAC System. *Engineering Proceedings*, 2023, 53(1), 24.
  7. Cabovská, B.; Teli, D.; Dalenbäck, J. O.; et al. A Study on the Relationship between Energy Performance and IEQ Parameters in School Buildings. In Proceedings of the *E3S Web of Conferences*, EDP Sciences, 2021; 246, 01006.
  8. Pushkar, T.; Serogina, D.; Matvieieva, N.; et al. Human-Centered Approach to Shaping Smart City Development Strategies. In Proceedings of the *International Conference on Smart Technologies in Urban Engineering*, Cham, Springer Nature Switzerland, 2023; pp. 26-37.
  9. Broere, W. Urban Underground Space: Solving the Problems of Today’s Cities. *Tunnelling and Underground Space Technology*, 2016, 55, 245-248. [CrossRef]
  10. Yang, B.; Yao, H.; Wang, F. A Review of Ventilation and Environmental Control of Underground Spaces. *Energies*, 2022, 15(2), 409. [CrossRef]
  11. Xuan, W. Fuzzy Synthetic Assessment of Geo-Engineering Suitability for Urban Underground Space. In Proceedings of the *International Conference on Applied Informatics and Communication*, Berlin, Heidelberg, Springer Berlin Heidelberg, 2011; pp. 536-543.
  12. Wan, Y.; Luo, Y. Analysis of Geotechnical Engineering Safety Technology in Urban Underground Space Construction. *Journal of Architectural Research and Development*, 2022, 6(1), 1-6. [CrossRef]
  13. Van der Hoeven, F.; van Nes, A. Improving the Design of Urban Underground Space in Metro Stations Using the Space Syntax Methodology. *Tunnelling and Underground Space Technology*, 2014, 40, 64-74.
  14. Xu, Y.; Chen, X. Quantitative Analysis of Spatial Vitality and Spatial Characteristics of Urban Underground Space (UUS) in Metro Area. *Tunnelling and Underground Space Technology*, 2021, 111, 103875. [CrossRef]
  15. Tao, H.; Fan, Y.; Li, X.; et al. Investigation of Formaldehyde and TVOC in Underground Malls in Xi’an, China: Concentrations, Sources, and Affecting Factors. *Building and Environment*, 2015, 85, 85-93. [CrossRef]
  16. Yap, H. S.; Roberts, A. C.; Luo, C.; et al. The Importance of Air Quality for Underground Spaces: An International Survey of Public Attitudes. *Indoor Air*, 2021, 31(6), 2239-2251. [CrossRef]
  17. Lee, E. H.; Christopoulos, G. I.; Kwok, K. W.; et al. A Psychosocial Approach to Understanding Underground Spaces. *Frontiers in Psychology*, 2017, 8, 452. [CrossRef]
  18. Sun, L.; Xu, Y.; Teng, S.; et al. Research into the Visual Saliency of Guide Signs in an Underground Commercial Street Based on an Eye-Movement Experiment. *Sustainability*, 2022, 14(23), 16062. [CrossRef]
  19. Sun, L.; Ding, S.; Ren, Y.; et al. Research on the Material and Spatial Psychological Perception of the Side Interface of an Underground Street Based on Virtual Reality. *Buildings*, 2022, 12(9), 1432. [CrossRef]
  20. Yao, T.; Ding, S.; Zhang, Y.; et al. Research on the Range of Appropriate Spatial Scale of Underground Commercial Street Based on Psychological Perception Evaluation. *Buildings*, 2024, Forthcoming. [CrossRef]
  21. Yao, T.; Xu, Y.; Sun, L.; et al. Application of Machine Learning and Multi-Dimensional Perception in Urban Spatial Quality Evaluation: A Case Study of Shanghai Underground Pedestrian Street. *Land*, 2024, 13(9), 1354. [CrossRef]
  22. Fanger, P. O. Thermal Comfort. *Analysis and Applications in Environmental Engineering*, 1970.
  23. Wargocki, P.; Frontczak, M.; Schiavon, S.; et al. Satisfaction and Self-Estimated Performance in Relation to Indoor Environmental Parameters and Building Features. In Proceedings of the *10th International Conference on Healthy Buildings*, International Society of Indoor Air Quality and Climate, 2012.
  24. Lai, A. C. K.; Mui, K. W.; Wong, L. T.; et al. An Evaluation Model for Indoor Environmental Quality (IEQ) Acceptance in Residential Buildings. *Energy and Buildings*, 2009, 41(9), 930-936. [CrossRef]
  25. Hong, S. H.; Lee, J. M.; Moon, J. W.; et al. Thermal Comfort, Energy and Cost Impacts of PMV Control Considering Individual Metabolic Rate Variations in Residential Building. *Energies*, 2018, 11(7), 1767. [CrossRef]
  26. Shao, T. Indoor Environment Intelligent Control System of Green Building Based on PMV Index. *Advances in Civil Engineering*, 2021, 2021(1), 6619401. [CrossRef]
  27. Wong, L. T.; Mui, K. W. An Energy Performance Assessment for Indoor Environmental Quality (IEQ) Acceptance in Air-Conditioned Offices. *Energy Conversion and Management*, 2009, 50(5), Forthcoming. [CrossRef]
  28. Dias Pereira, L.; Bispo Lamas, F.; Gameiro da Silva, M. Improving Energy Use in Schools: From IEQ towards Energy-Efficient Planning—Method and In-Field Application to Two Case Studies. *Energy Efficiency*, 2019, 12, 1253-1277. [CrossRef]
  29. Yin, L.; Yu, Y. Human-Scale Urban Form: Measurements, Performances, and Urban Planning & Design Interventions. *South Architect.*, 2016, 5, 41-47.
  30. Gibson, J. J. The Senses Are Considered Perceptual Systems. Houghton Mifflin, 1966. Available online: https://psycnet.apa.org/record/1966-35026-000 (accessed on 28 June 2024).
  31. Gibson, J. J. The Ecological Approach to Visual Perception: Classic Edition; Psychology Press: New York, NY, USA, 2014.
  32. Cooper, I. D. Bibliometrics Basics. *J. Med. Libr. Assoc.*, 2015, 103, 217.
  33. Sinéad, H. Review of Literature on the Delphi Technique; National Children’s Office: Dublin, Ireland, 2004; pp. 1-51.
  34. Liu, L.; Silva, E. A.; Wu, C.; et al. A Machine Learning-Based Method for the Large-Scale Evaluation of the Qualities of the Urban Environment. *Computers, Environment and Urban Systems*, 2017, 65, 113-125. [CrossRef]
  35. Ye, Y.; Zeng, W.; Shen, Q.; et al. The Visual Quality of Streets: A Human-Centred Continuous Measurement Based on Machine Learning Algorithms and Street View Images. *Environment and Planning B: Urban Analytics and City Science*, 2019, 46(8), 1439-1457. [CrossRef]
  36. Chen, L.; Ding, Y.; Lyu, D.; et al. Deep Multi-Task Learning Based Urban Air Quality Index Modelling. *Proceedings of the ACM on Interactive, Mobile, Wearable and Ubiquitous Technologies*, 2019, 3(1), 1-17. [CrossRef]
  37. Boim, A.; Dortheimer, J.; Sprecher, A. A Machine-Learning Approach to Urban Design Interventions in Non-Planned Settlements. In Proceedings of the *27th CAADRIA Conference*, 2022; pp. 223-232.
  38. Chen, T.; Guestrin, C. XGBoost: A Scalable Tree Boosting System. In Proceedings of the *22nd ACM SIGKDD International Conference on Knowledge Discovery and Data Mining*, San Francisco, CA, USA, 13-17 August 2016; pp. 785-794.
  39. Cui, J.; Broere, W.; Lin, D. Underground Space Utilisation for Urban Renewal. *Tunnelling and Underground Space Technology*, 2021, 108, 103726. [CrossRef]
  40. Dong,.
Figure 2. Research framework of the model.
Preprints 120075 g002
Figure 3. Matrix of correlation coefficients between human-centred perception evaluation and physical environment data. (a) Matrix of correlation coefficients for spatial sensory indicators of business dimensions; (b) Matrix of correlation coefficients for spatial sensory indicators of business dimensions.
Preprints 120075 g003
Figure 4. Results of single-indicator fitted regression analysis under Commerical Dimension.
Preprints 120075 g004
Figure 5. Results of single-indicator fitted regression analysis under Transport Dimension.
Preprints 120075 g005
Figure 6. Regression model analysis based on the XGBoost algorithm.
Preprints 120075 g006
Table 4. Table of relevance attributions for the human-centred perception indicator.
Physical environment data Perceptual Dimension Commercial Dimension Perceptual indicators Transport Dimension Perceptual indicators
Aspect
ratio
Visual, Somatosensory Security
Non-Repression
Interesting
Open
Comfortable Lighting, Good Ventilation, Wind Strength, Warm
Wind Strength
Humidity Somatosensory Good Ventilation, Wind Strength Good Ventilation, Wind Strength
Illumination Visual, Somatosensory Security, Gorgeous, Non-Repression, Open, Comfortable Lighting, Warm Security, Gorgeous, Non-Repression, Beauty, Interesting, Open, Comfortable Lighting, Warm
Sound Auditory Quiet Varied
Temperature Visual, Somatosensory Comfortable Lighting, Good Ventilation, Wind Strength Good Ventilation
Wind speed Somatosensory Good Ventilation, Wind Strength, Warm Good Ventilation, Wind Strength, Warm
Disclaimer/Publisher’s Note: The statements, opinions and data contained in all publications are solely those of the individual author(s) and contributor(s) and not of MDPI and/or the editor(s). MDPI and/or the editor(s) disclaim responsibility for any injury to people or property resulting from any ideas, methods, instructions or products referred to in the content.
Copyright: This open access article is published under a Creative Commons CC BY 4.0 license, which permit the free download, distribution, and reuse, provided that the author and preprint are cited in any reuse.
Prerpints.org logo

Preprints.org is a free preprint server supported by MDPI in Basel, Switzerland.

Subscribe

© 2024 MDPI (Basel, Switzerland) unless otherwise stated