1. Introduction
Non-destructive testing and evaluation (NDT&E) approaches especially thermal non-destructive testing are becoming increasingly common for detecting the presence of underlying faults in a material being inspected without affecting its output or functionality [
1]. Three widely used active NDT&E procedures in industry are Pulse thermography (PT), Lock-in thermography (LT), and Pulse Phase thermography (PPT) [
2,
3]. In PT, the surface of the test material gets heated from a short pulse of high peak power. And data is acquired while the sample cools down and later analysed. But the method isn’t as efficient because of uneven surface heating due to changes in emissivity [
4]. So, to address this limitation, LT was developed. LT solves this issue by using a periodic sinusoidal thermal wave with lower peak power for longer duration[
5]. This method is less likely to be affected by temperature noise because phase images are used instead of magnitude images during analysis[
6]. The primary drawback with this technique is that it needs to be performed multiple times at different frequencies for respective depths, which makes testing take time consuming. To tackle the issue of surface temperature variation and long experimentation time PPT was introduced, it combines the best parts of both PT and LT into a single method [
7]. With just pulse stimulation, this makes it better for finding deeper flaws and eliminates effects of surface temperature variation as the data is analysed in phase analyses, but issue of high peak power requirement still prevails. To overcome limitations of conventional techniques, new advanced thermographic excitation techniques were introduced. These Recent advances in TNDT&E methods include pulse compression favourable excitation techniques to overcome the limitations of traditional techniques [
8]. These techniques have become popular because they offer high sensitivity and precision for finding defects and detecting them at different depths below the surface. Frequency modulated thermal wave imaging (FMTWI) methods are used in this study. This technique uses the linearly modulated band of frequencies that give better contrast and depth resolution based on the specimen’s thermal diffusivity and size[
9]. So, this eliminates the requirement for high peak power or a long testing time. This lets us cover different depths in a single run of experiment. Previous studies on steel materials primarily focused on conventional techniques such as LT and PPT[
10,
11], with some testing conducted on mild steel samples using frequency modulated thermography which improved SNR and better depth penetration. In contrast, this work explores subsurface defects in hardened steel samples used in shipbuilding applications using FMTWI.
The data captured with infrared camera is stored in form of 3D matrix which consist of thermographic sequence. The data is then enhanced with different post processing techniques i.e., pulse compression which is a signal processing technique which concentrate most of signal power in central lobe thus improving range resolution and signal to noise ratio [
12] and PCA (with different standardization approaches) which is a multivariate data processing technique which reduces the dimensions of large data to principal components which retains most variance[
13]. This work has compared the mentioned statistical post processing approaches on data acquired with FMTWI on their capability of effectively preserving defect shape and contrast, and SNR as figure of merit on a hardened steel specimen with flat bottom hole.
2. Theory
A linear frequency modulated thermal wave with a frequency range of 0.01 Hz to 0.1 Hz is applied to the material for 100 seconds during FMTWI excitation, which provides improved depth resolution [
14]. Thus, heat wave is generated with help of halogen lamps in experimentation following FMTWI excitation, which is captured with infrared camera. The applied heatwave penetrates the test material, leading to a temperature change on the surface. Underlying defects cause a temperature gradient because of variations in emissivity. which the one-dimensional Fourier’s diffusion equation may theoretically explain[
15].
Thermal diffusivity is represented by
α. To find the surface temperature for the following boundary condition in a slab of thickness L, equation 1 is solved in Laplace domain as follows:
Where
Consequently, this can be inferred from the foregoing equations that the frequency at any given time determines the depth resolution over time. Consequently, depth resolution with time-varying instantaneous frequency is provided by time-varying chirp waves[
16].
Several post-processing techniques are used to precisely identify underlying defects in a hardened steel material that has been exposed to external excitation, which results in heat distribution over its surface. These methods seek to decrease data dimensionality, increase sensitivity, and improve flaw detectability.
Pulse Compression: With this method, the thermographic data that is recorded during active heating and subsequently offset is removed using first-order polynomial curve fitting on the FMTWI data[
17]. Further pulse-compressed thermal images are reconstructed. The approach of pulse compression involves calculating the cross-correlation (CC) between the offset removed signal at the defect-free sound region and the signal of each pixel[
18,
19,
20].
Here P(t) is the offset removed signal at various locations in the test sample, and R(t) is the reference signal. The cross-correlation of two signals is represented in equations 3 and 4, where t and τ stand for time and time delay, respectively[
21]. The main advantage of pulse compression is that it concentrates all the energy into a shorter amount of time, which improves signal-to-noise ratio (SNR) and depth resolution [
22].
Principal Component Thermography: An advanced data processing method called Principal Component Thermography (PCT) is applied in thermographic inspection to improve the identification of material defects[
23]. By using Principal Component Analysis (PCA) on thermographic data, this technique enhances thermal gradients and anomalies that can point to the presence of defects[
24]. PCA is a type of multivariate data analysis that is used for more efficient processing of higher dimensional data. Principal Components (PCs), which are uncorrelated vectors arranged in decreasing variance order, are the result of this transformation of the data[
25]. Which is then projected on the standardised data and reconstructed using the selected number of PCs; typically, the first few PCs contain the majority of variance and allow for a relatively loss-free reconstruction of the data [
26]. In this work, the approach used is median centring as novel approach for data standardisation and compared it with conventional mean centred results.
The obtained experimental thermographic data is a 3-dimensional matrix with a size of M×N×T, where T is the number of experimental frames and M×N is the spatial resolution of the data taken with an infrared camera. First, data is converted from 3-D matrix to a 2-D matrix i.e., W of dimension P×T, where P is the product of M and N, to use PCA for data reduction. As a result, each row in matrix W represents a capture frame’s features and elements.
The standardized matrix in equation 5, denoted as
, is obtained by subtracting
from W matrix. PCA is applied using eigen value decomposition (EVD) on the covariance matrix
.
In equation 6,
is covariance matrix of
In equation 7, S is a singular matrix with all the eigenvalues arranged in descending order, and V is an orthogonal matrix [
28]. The coefficients of principle components (PC) are stored in Matrix V in descending order of variance. The standardised data is then multiplied by the coefficient matrix of the PC vector after selecting P number of PCs.
From the equation 8 to 9,
is the Pth PC vector of V matrix and
is the Pth principal component constructed by projecting
on the standardised data[
29]. And reconstructing the data of the subsequent PCs is done by multiplying transpose of
to the calculated principal component i.e.,
as shown in equation 10. Further the data is converted back to 3D matrix.
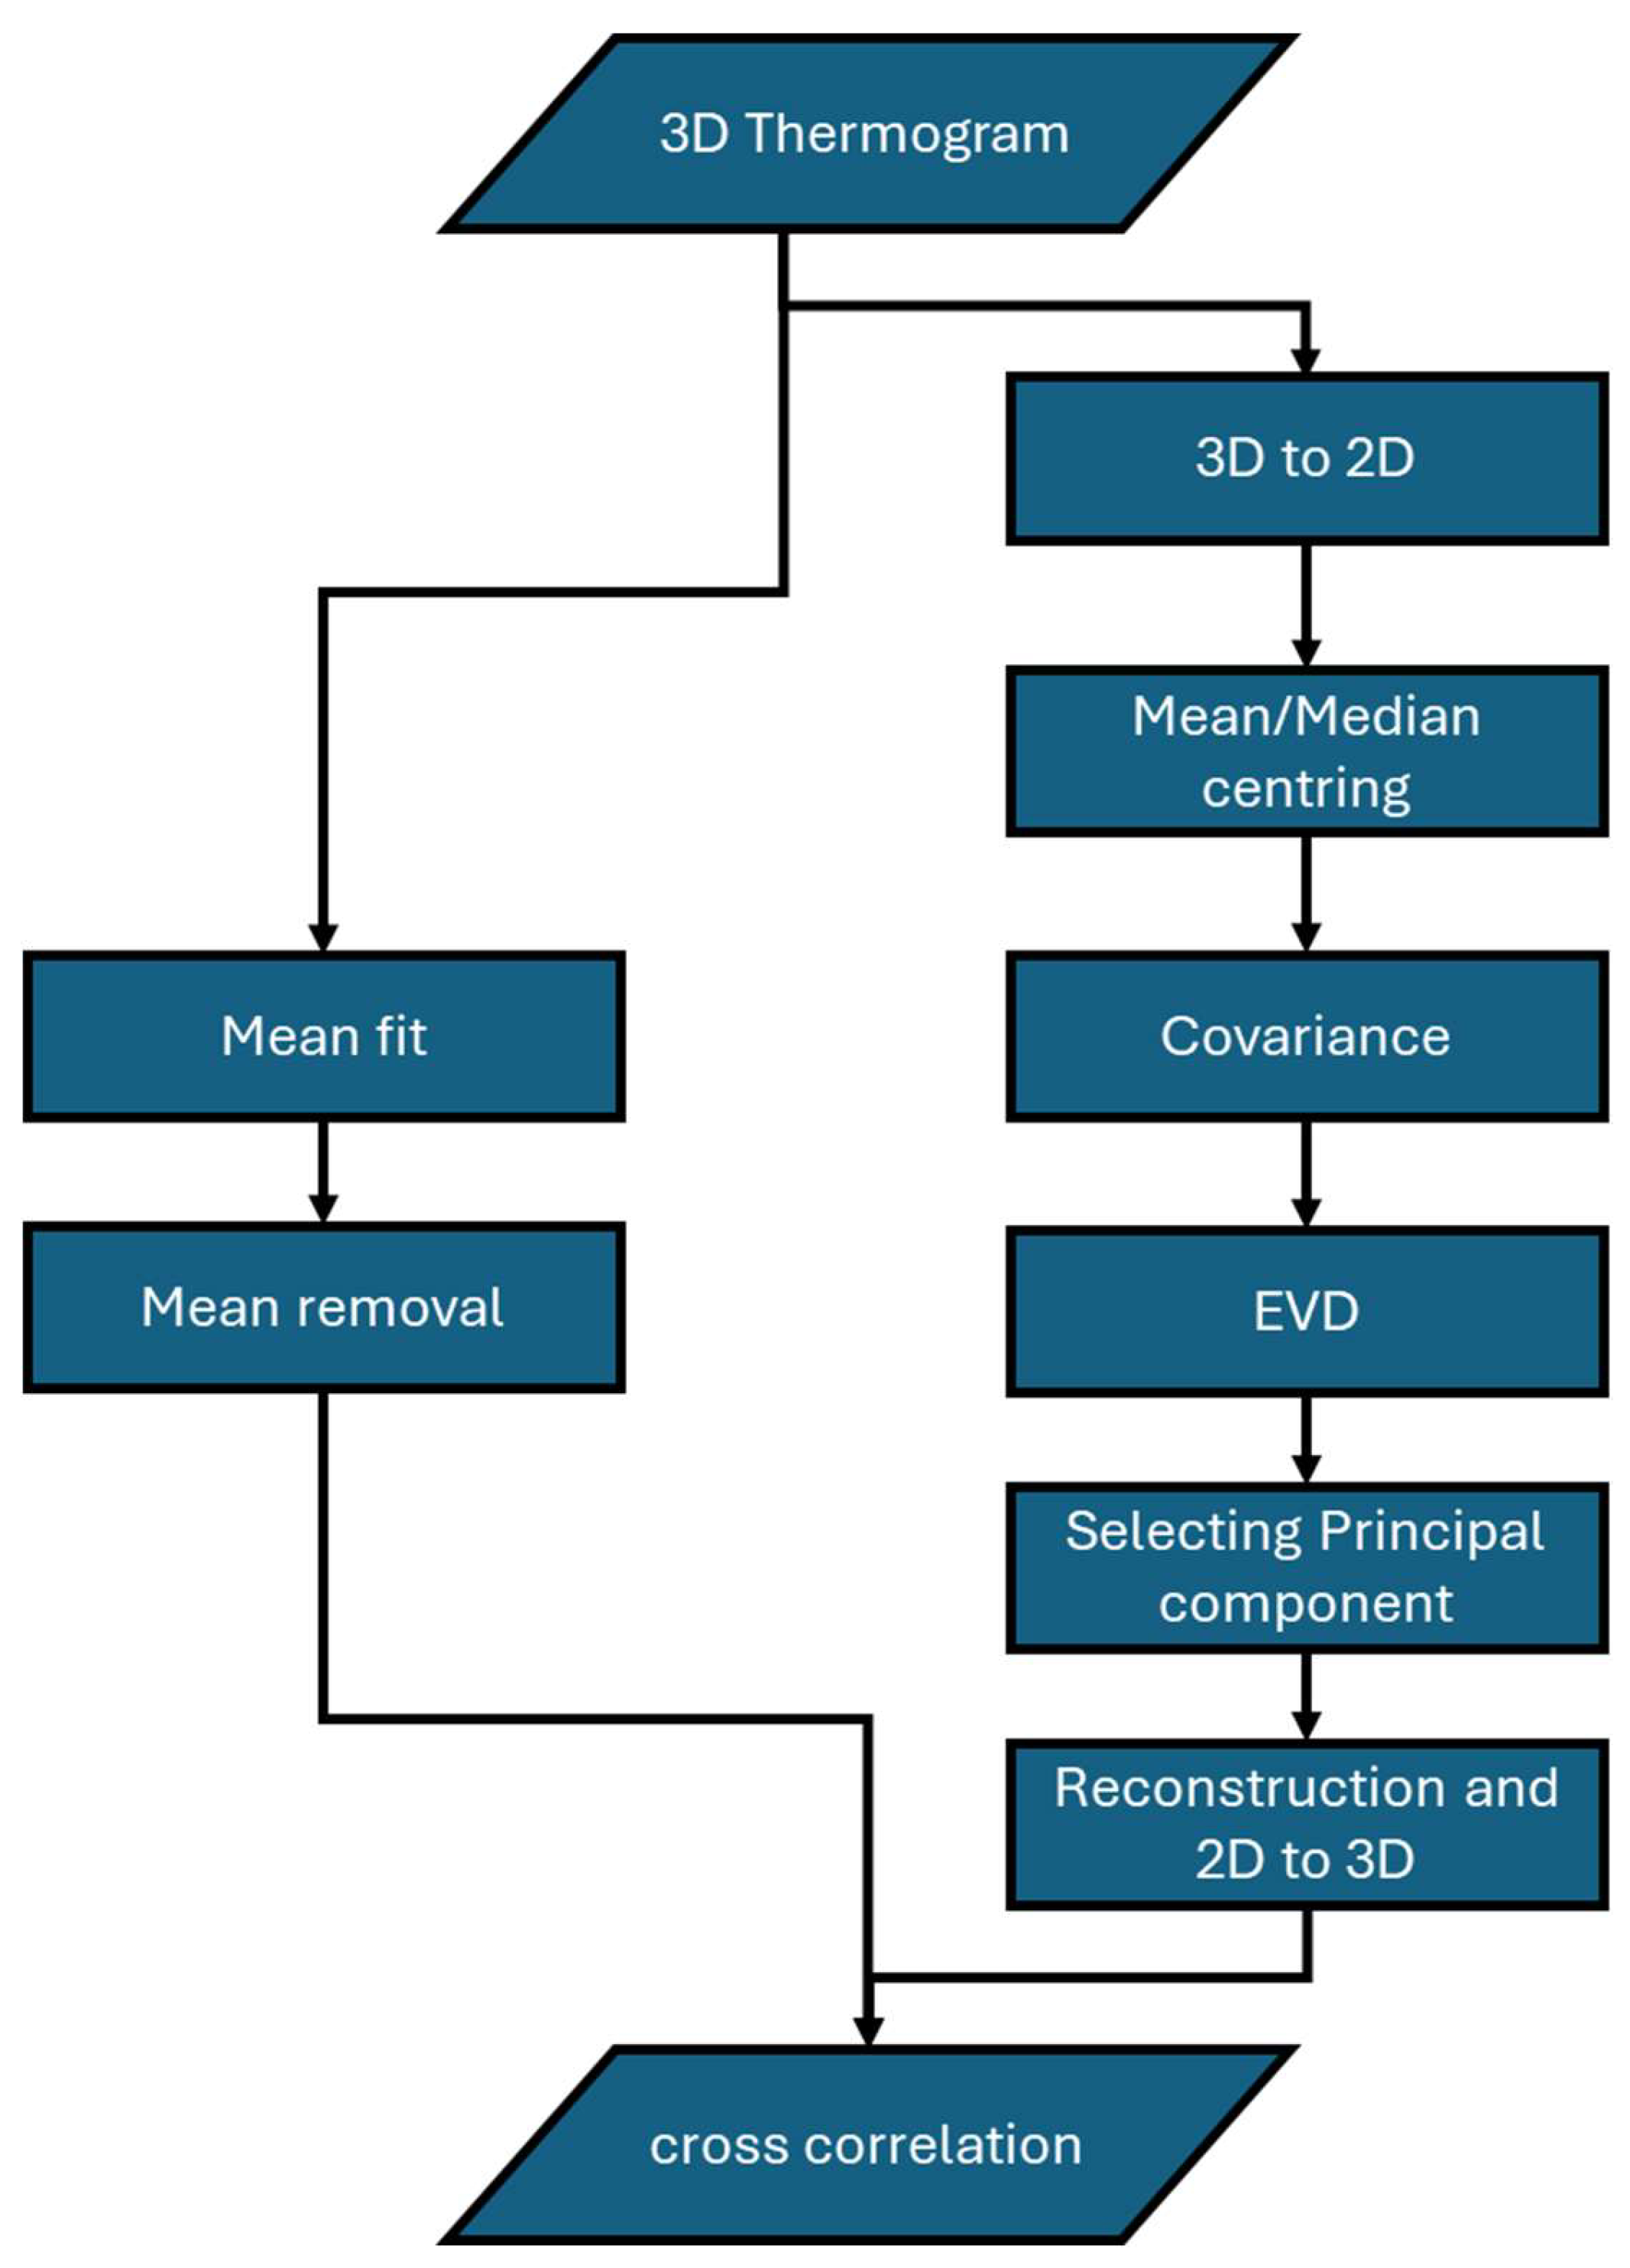
The post-processing approach utilized is illustrated in
Figure 1.
3. Experimentation and Test Sample
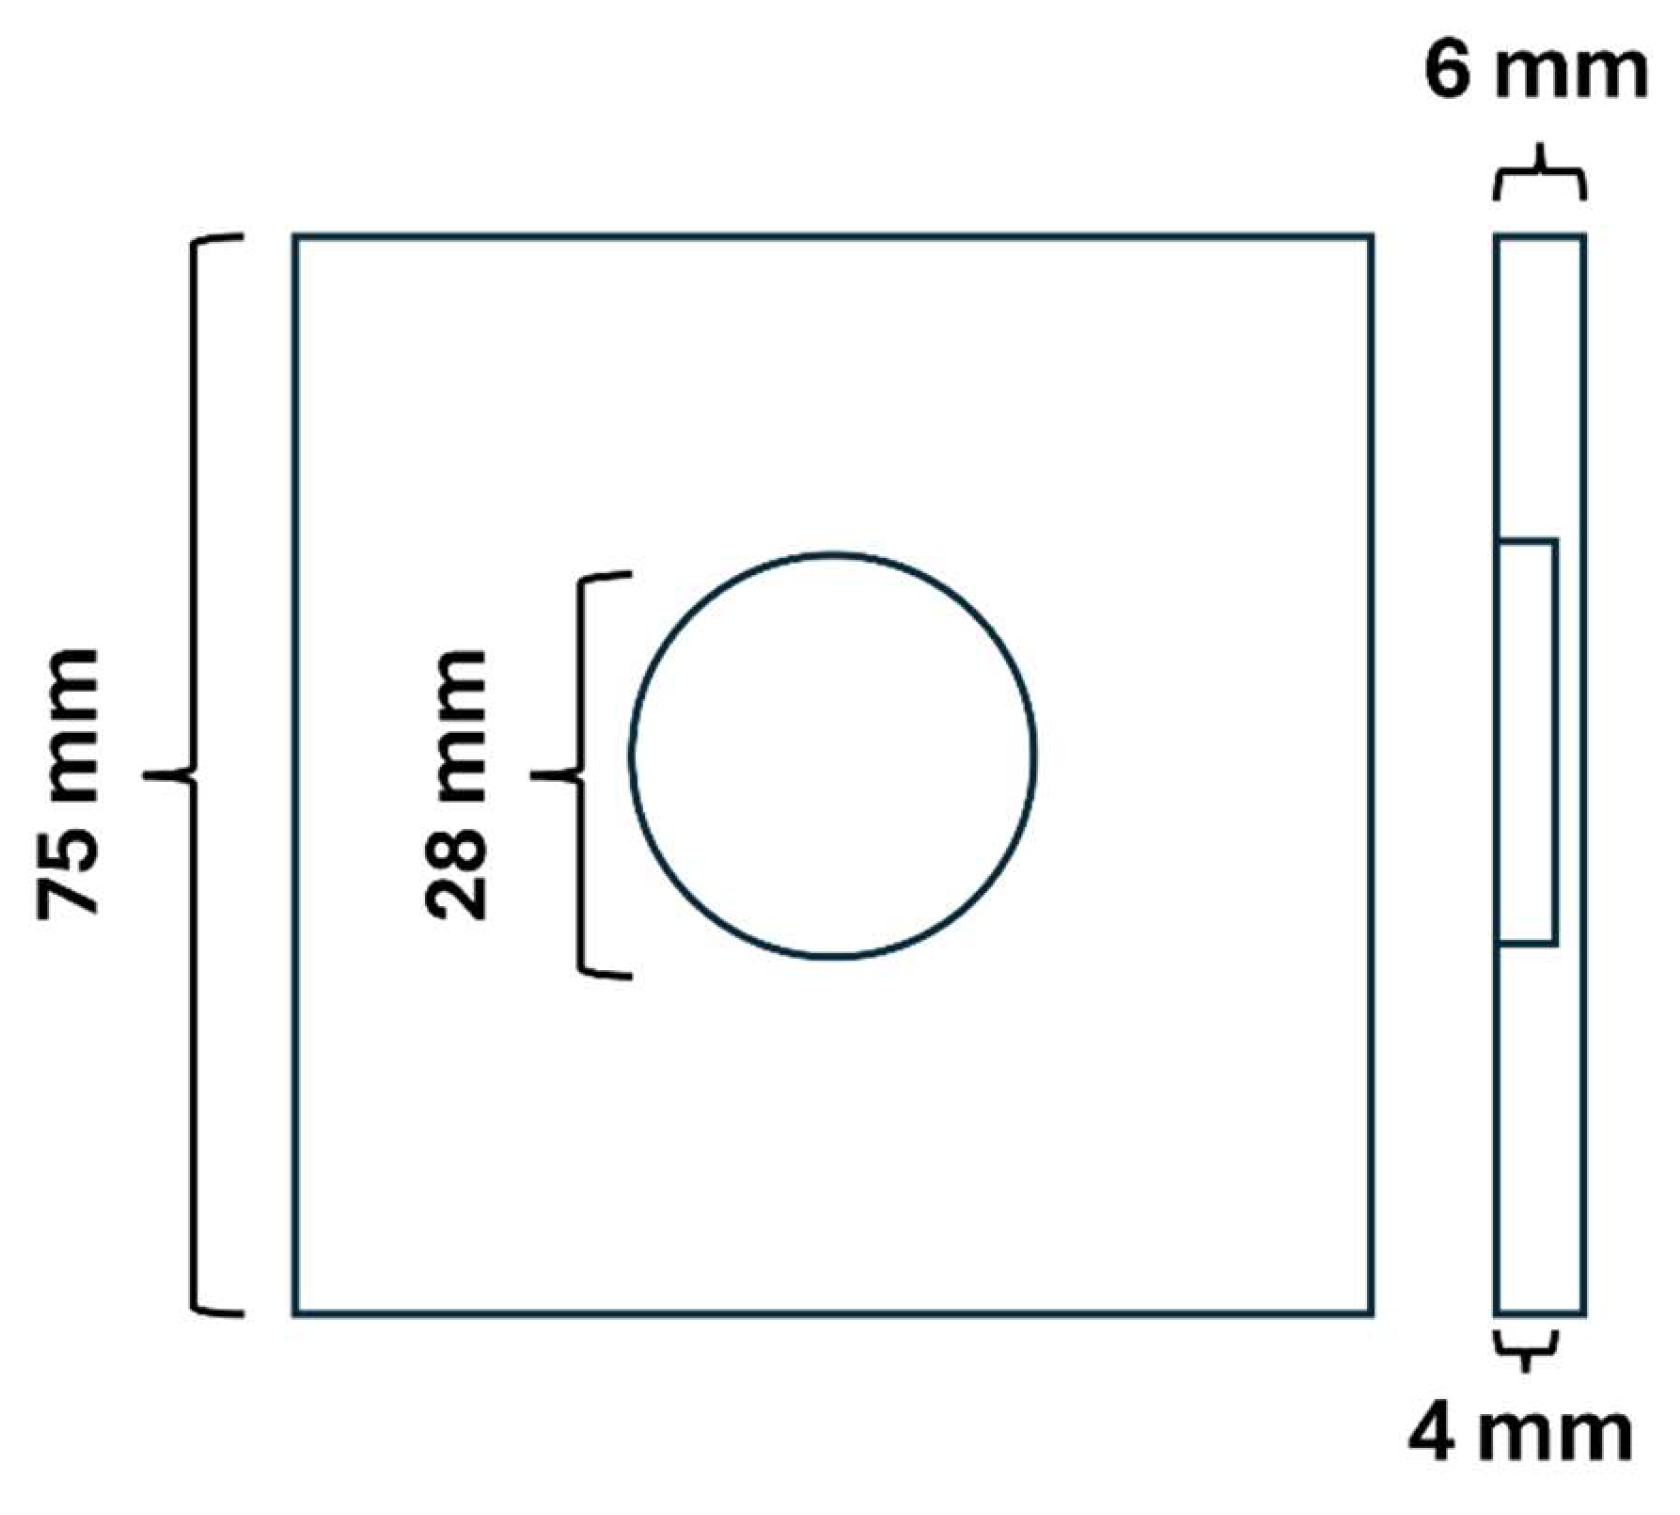
The sample used in the experimentation was hardened steel used in ship building with 6 mm thickness and cross section 75 mm x 75 mm consisting of 1 flat bottom hole of radius 28 mm at depth of 2 mm ash shown in
Figure 2.
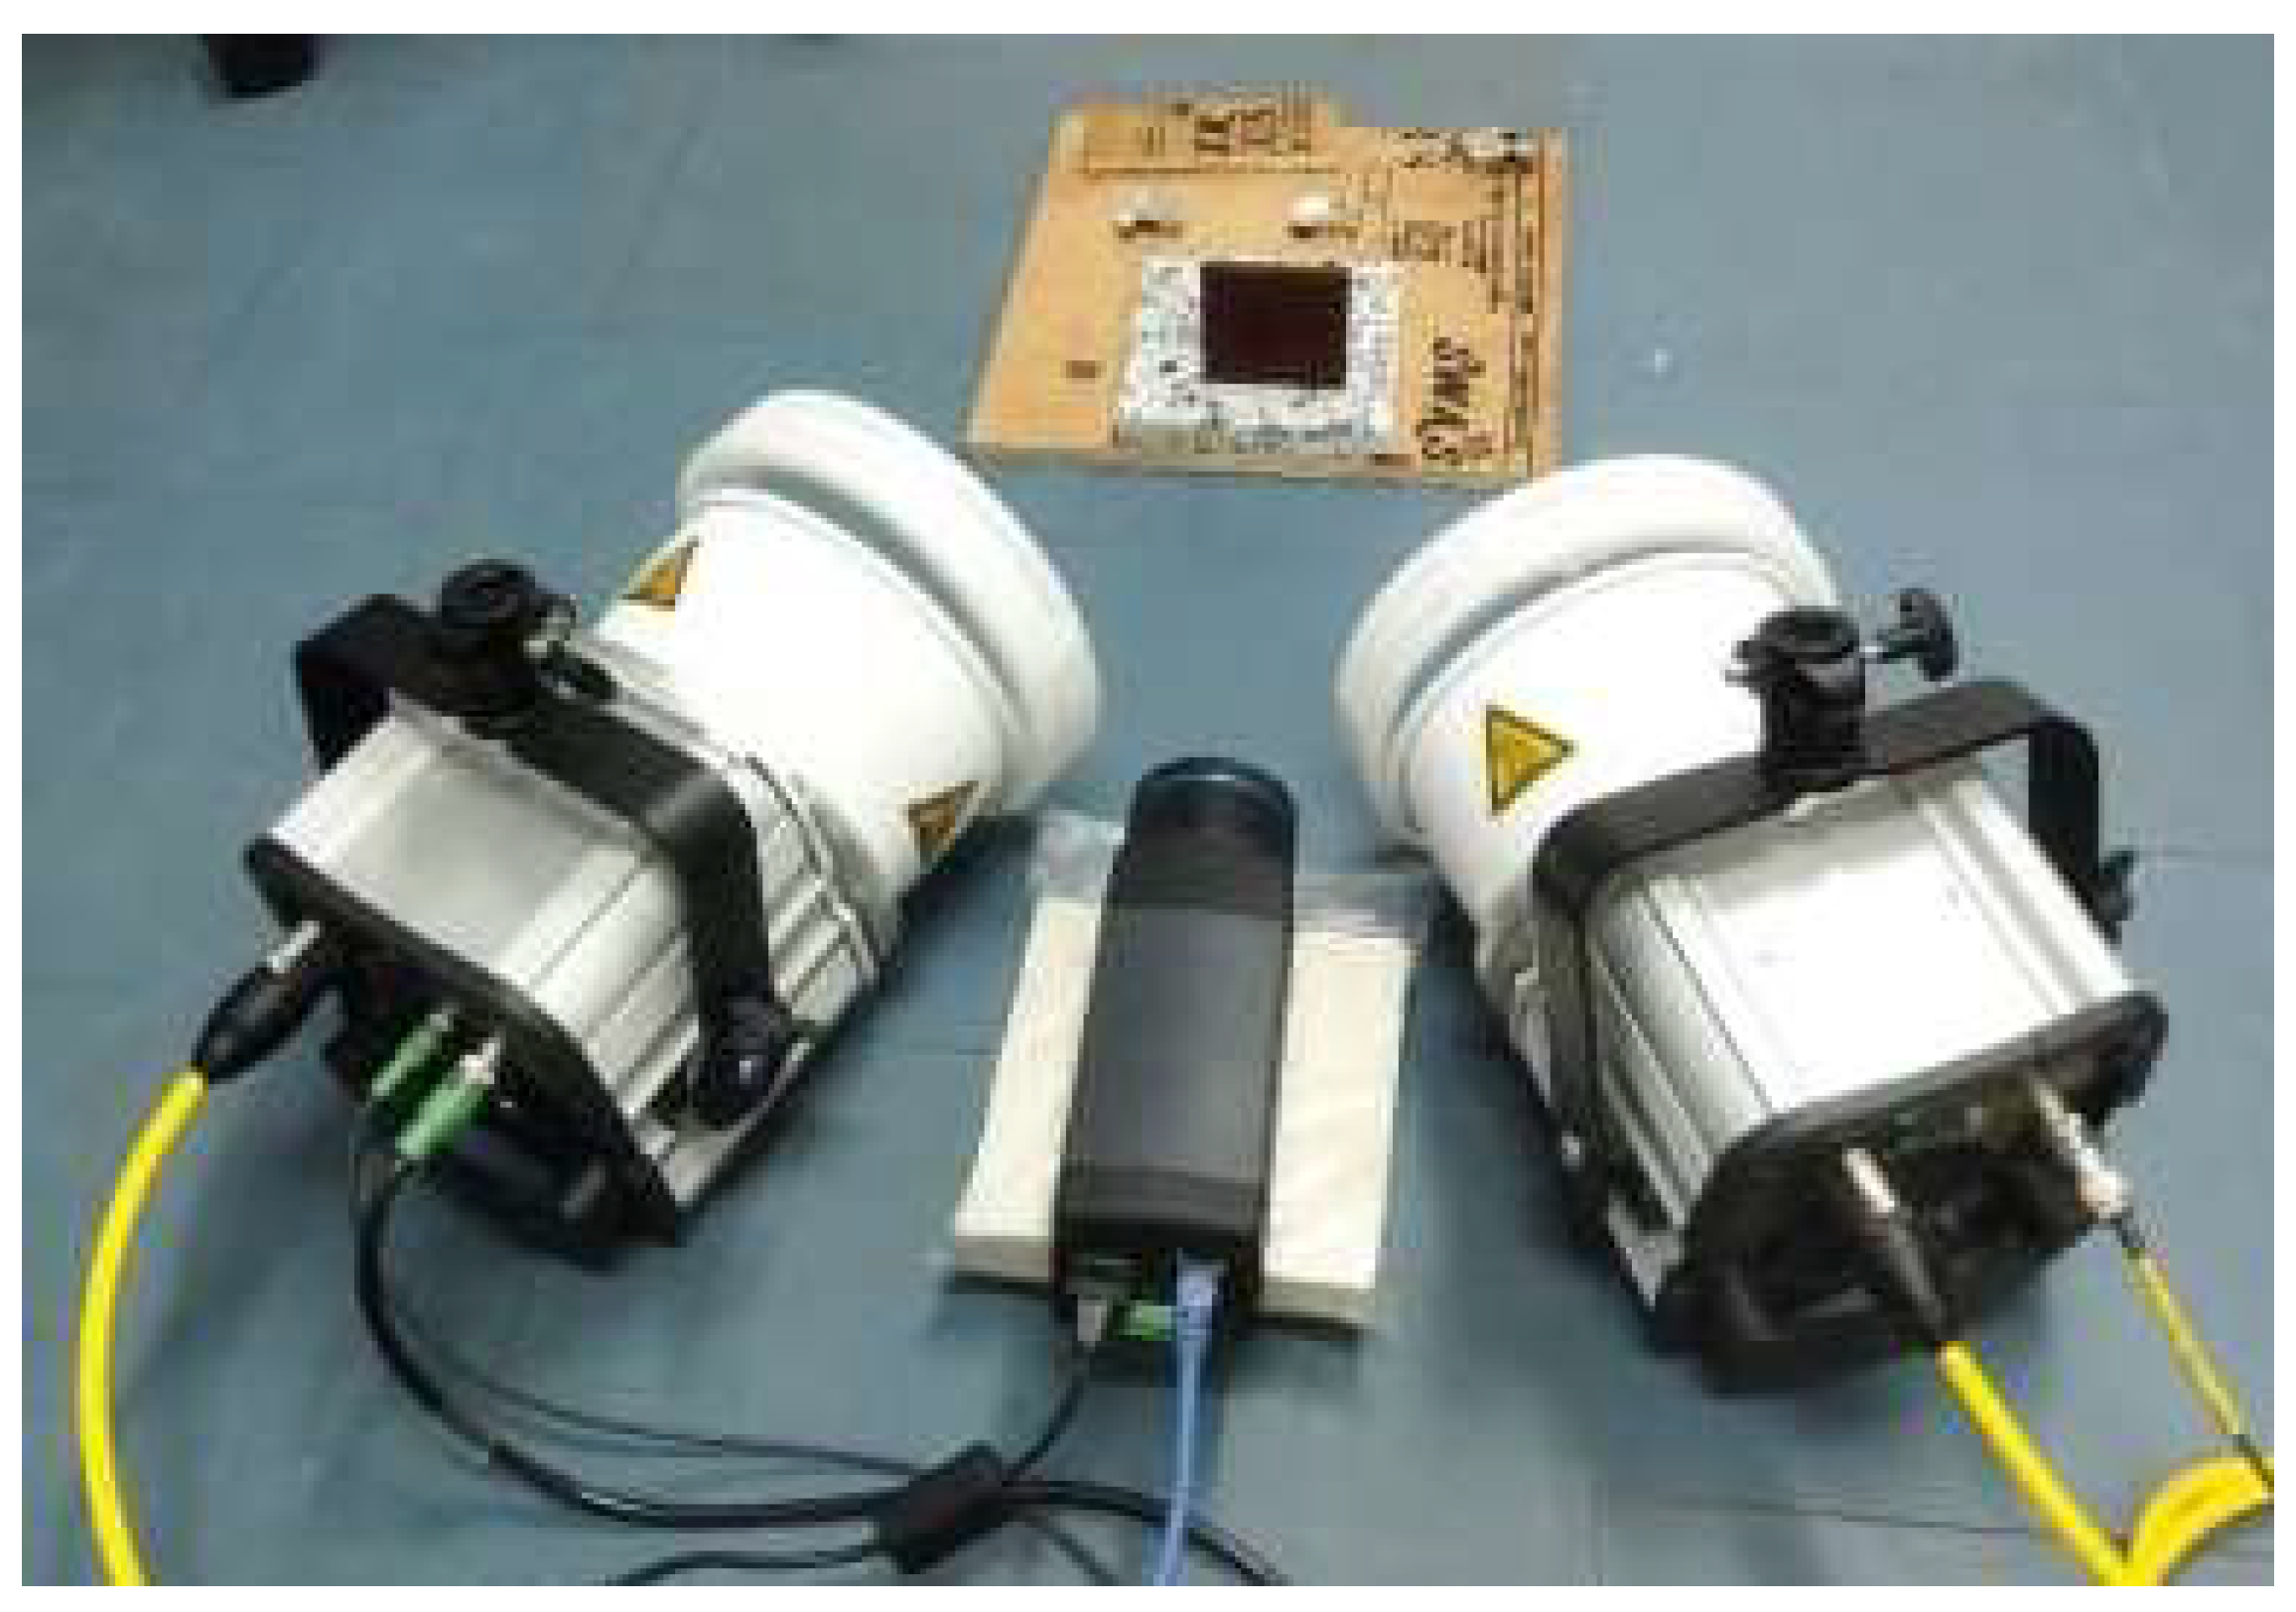
Figure 3 shows the experimental setup used for acquiring the data, two halogen lamps are used to excite the data which delivers the power of 1 kW each, and sample is kept at the distance of 1 m from lamps for uniform illumination. The intensity of lamp is controlled by source control unit with intensity varying following the FMTWI modality with frequency varying from 0.01 Hz to 0.1 Hz for 100 s [
30]. The infrared camera (FLIR-A655sc with spatial resolution 640x480 with spectral sensitivity of 7 µm to 14 µm with frame rate up to 50 fps with standard temperature range of -40 degree C to 650 degree C with temperature sensitivity of 30 mK) is used to record temporal temperature distribution over the sample at frame rate of 25 frames per second (fps) during the active frequency modulated thermal excitation.
4. Results and Discussion
For the quantitative analysis and comparison of different post processing techniques, SNR at defect location is calculated as figure of merit. The following approach is suitable for this work because different post processing schemes are compared. SNR is calculated as [
31]
In the above equation 11, and is mean and standard deviation of pixel region at defected location, and is mean and standard deviation at healthy or non-defective region.
Next processing performed is pulse compression on the thermographic data.
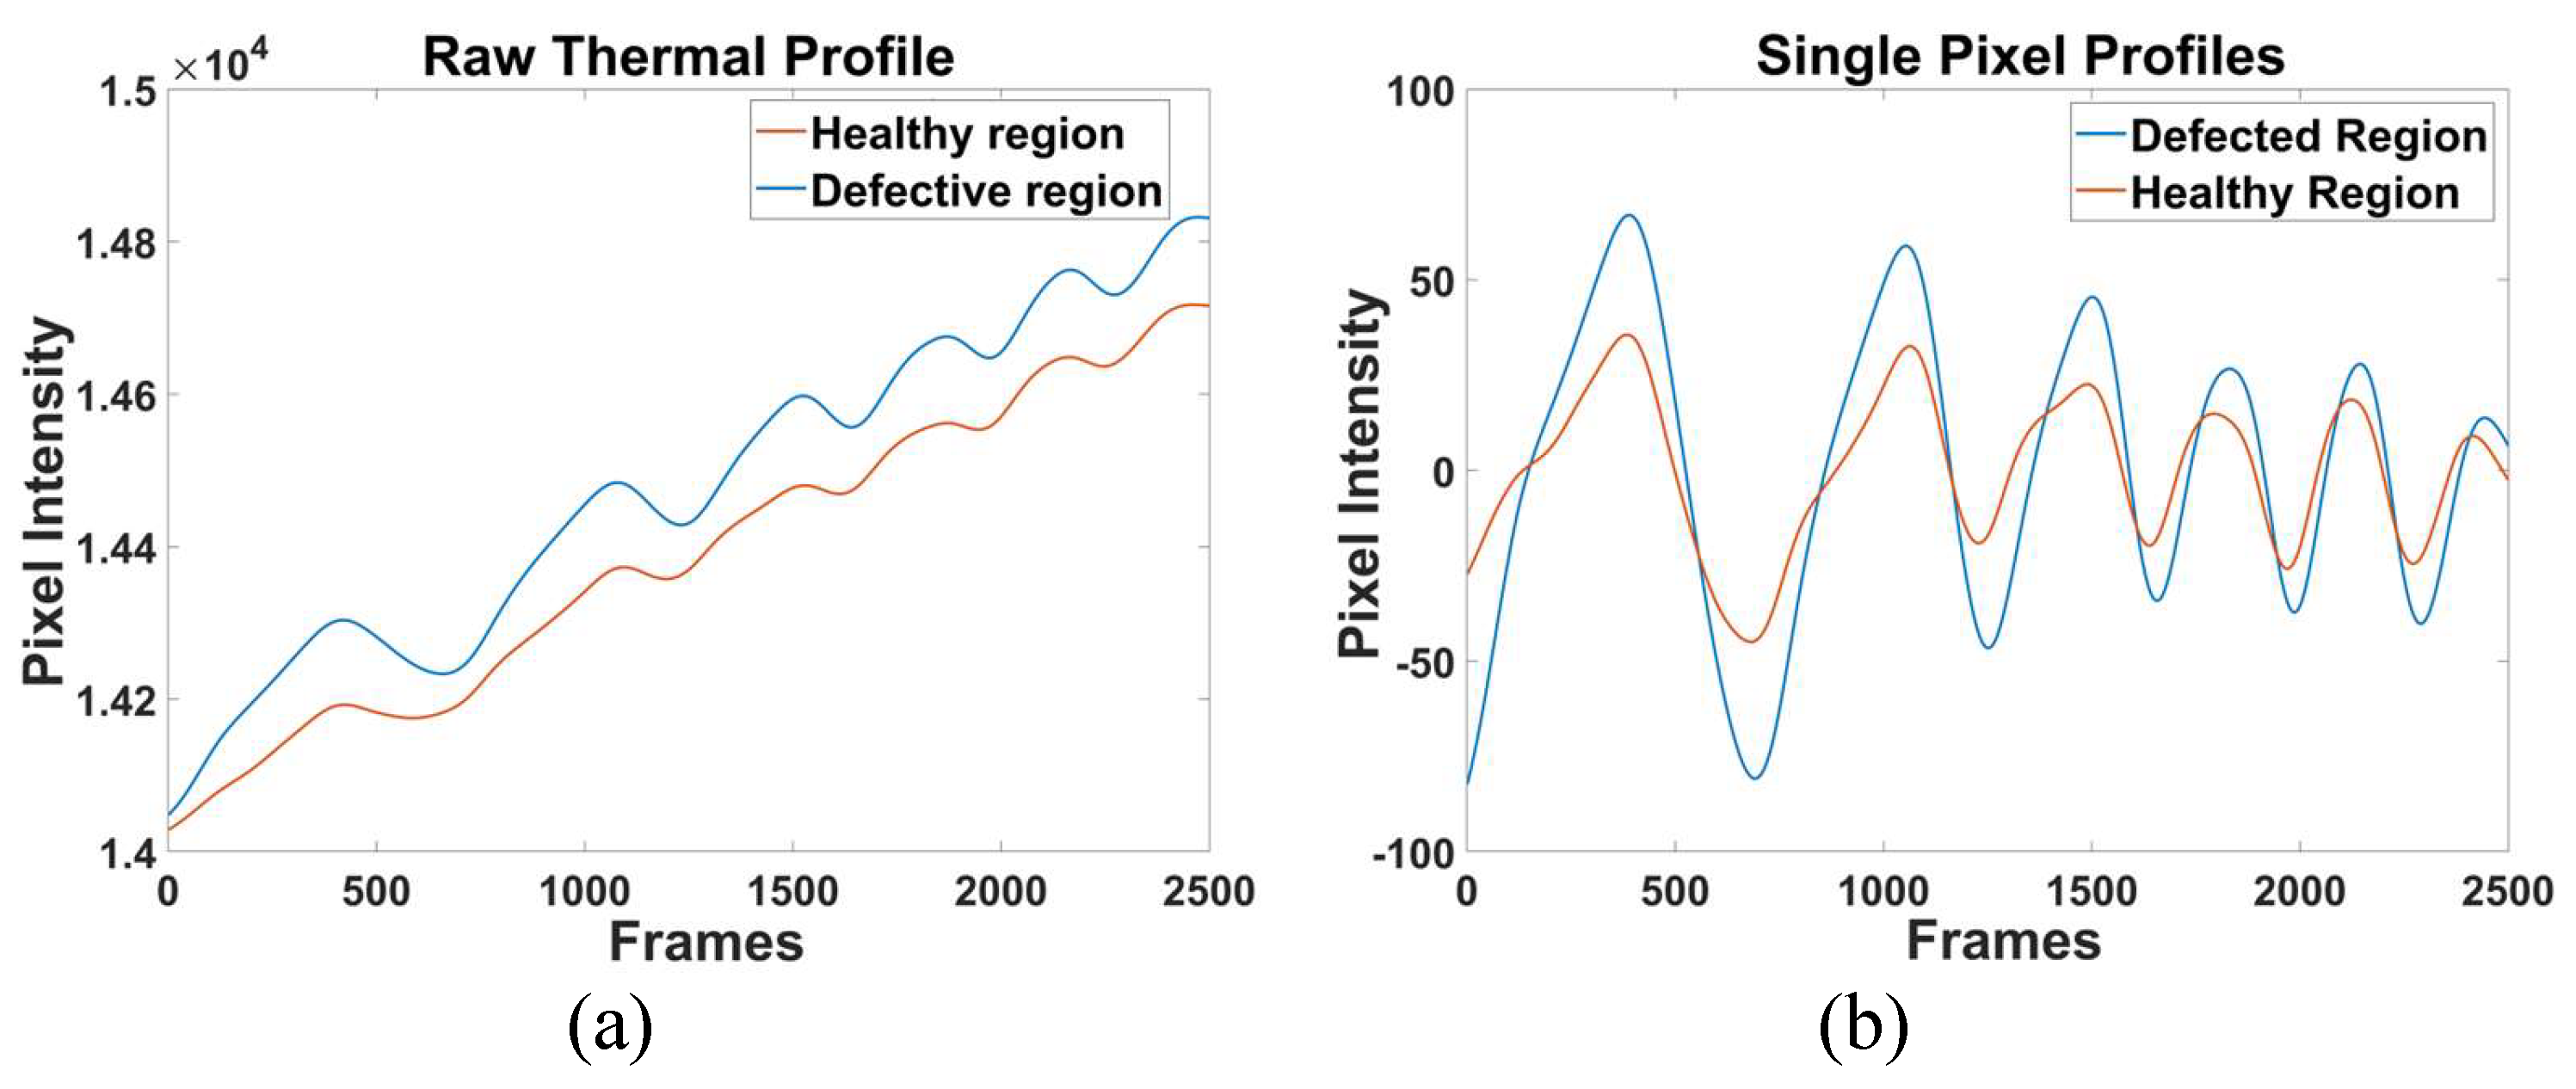
Figure 4 shows thermal profile and offset removed thermal profile along the frames for defective and healthy region, and respective best correlation images obtained along correlation profile is shown in
Figure 4.
Here in
Figure 5, it is visible that pulse compression has an excellent contrast for specimen used in this experiment. Further in this work pulse compression is implemented with PCA and compared the results with polynomial curve fitting.
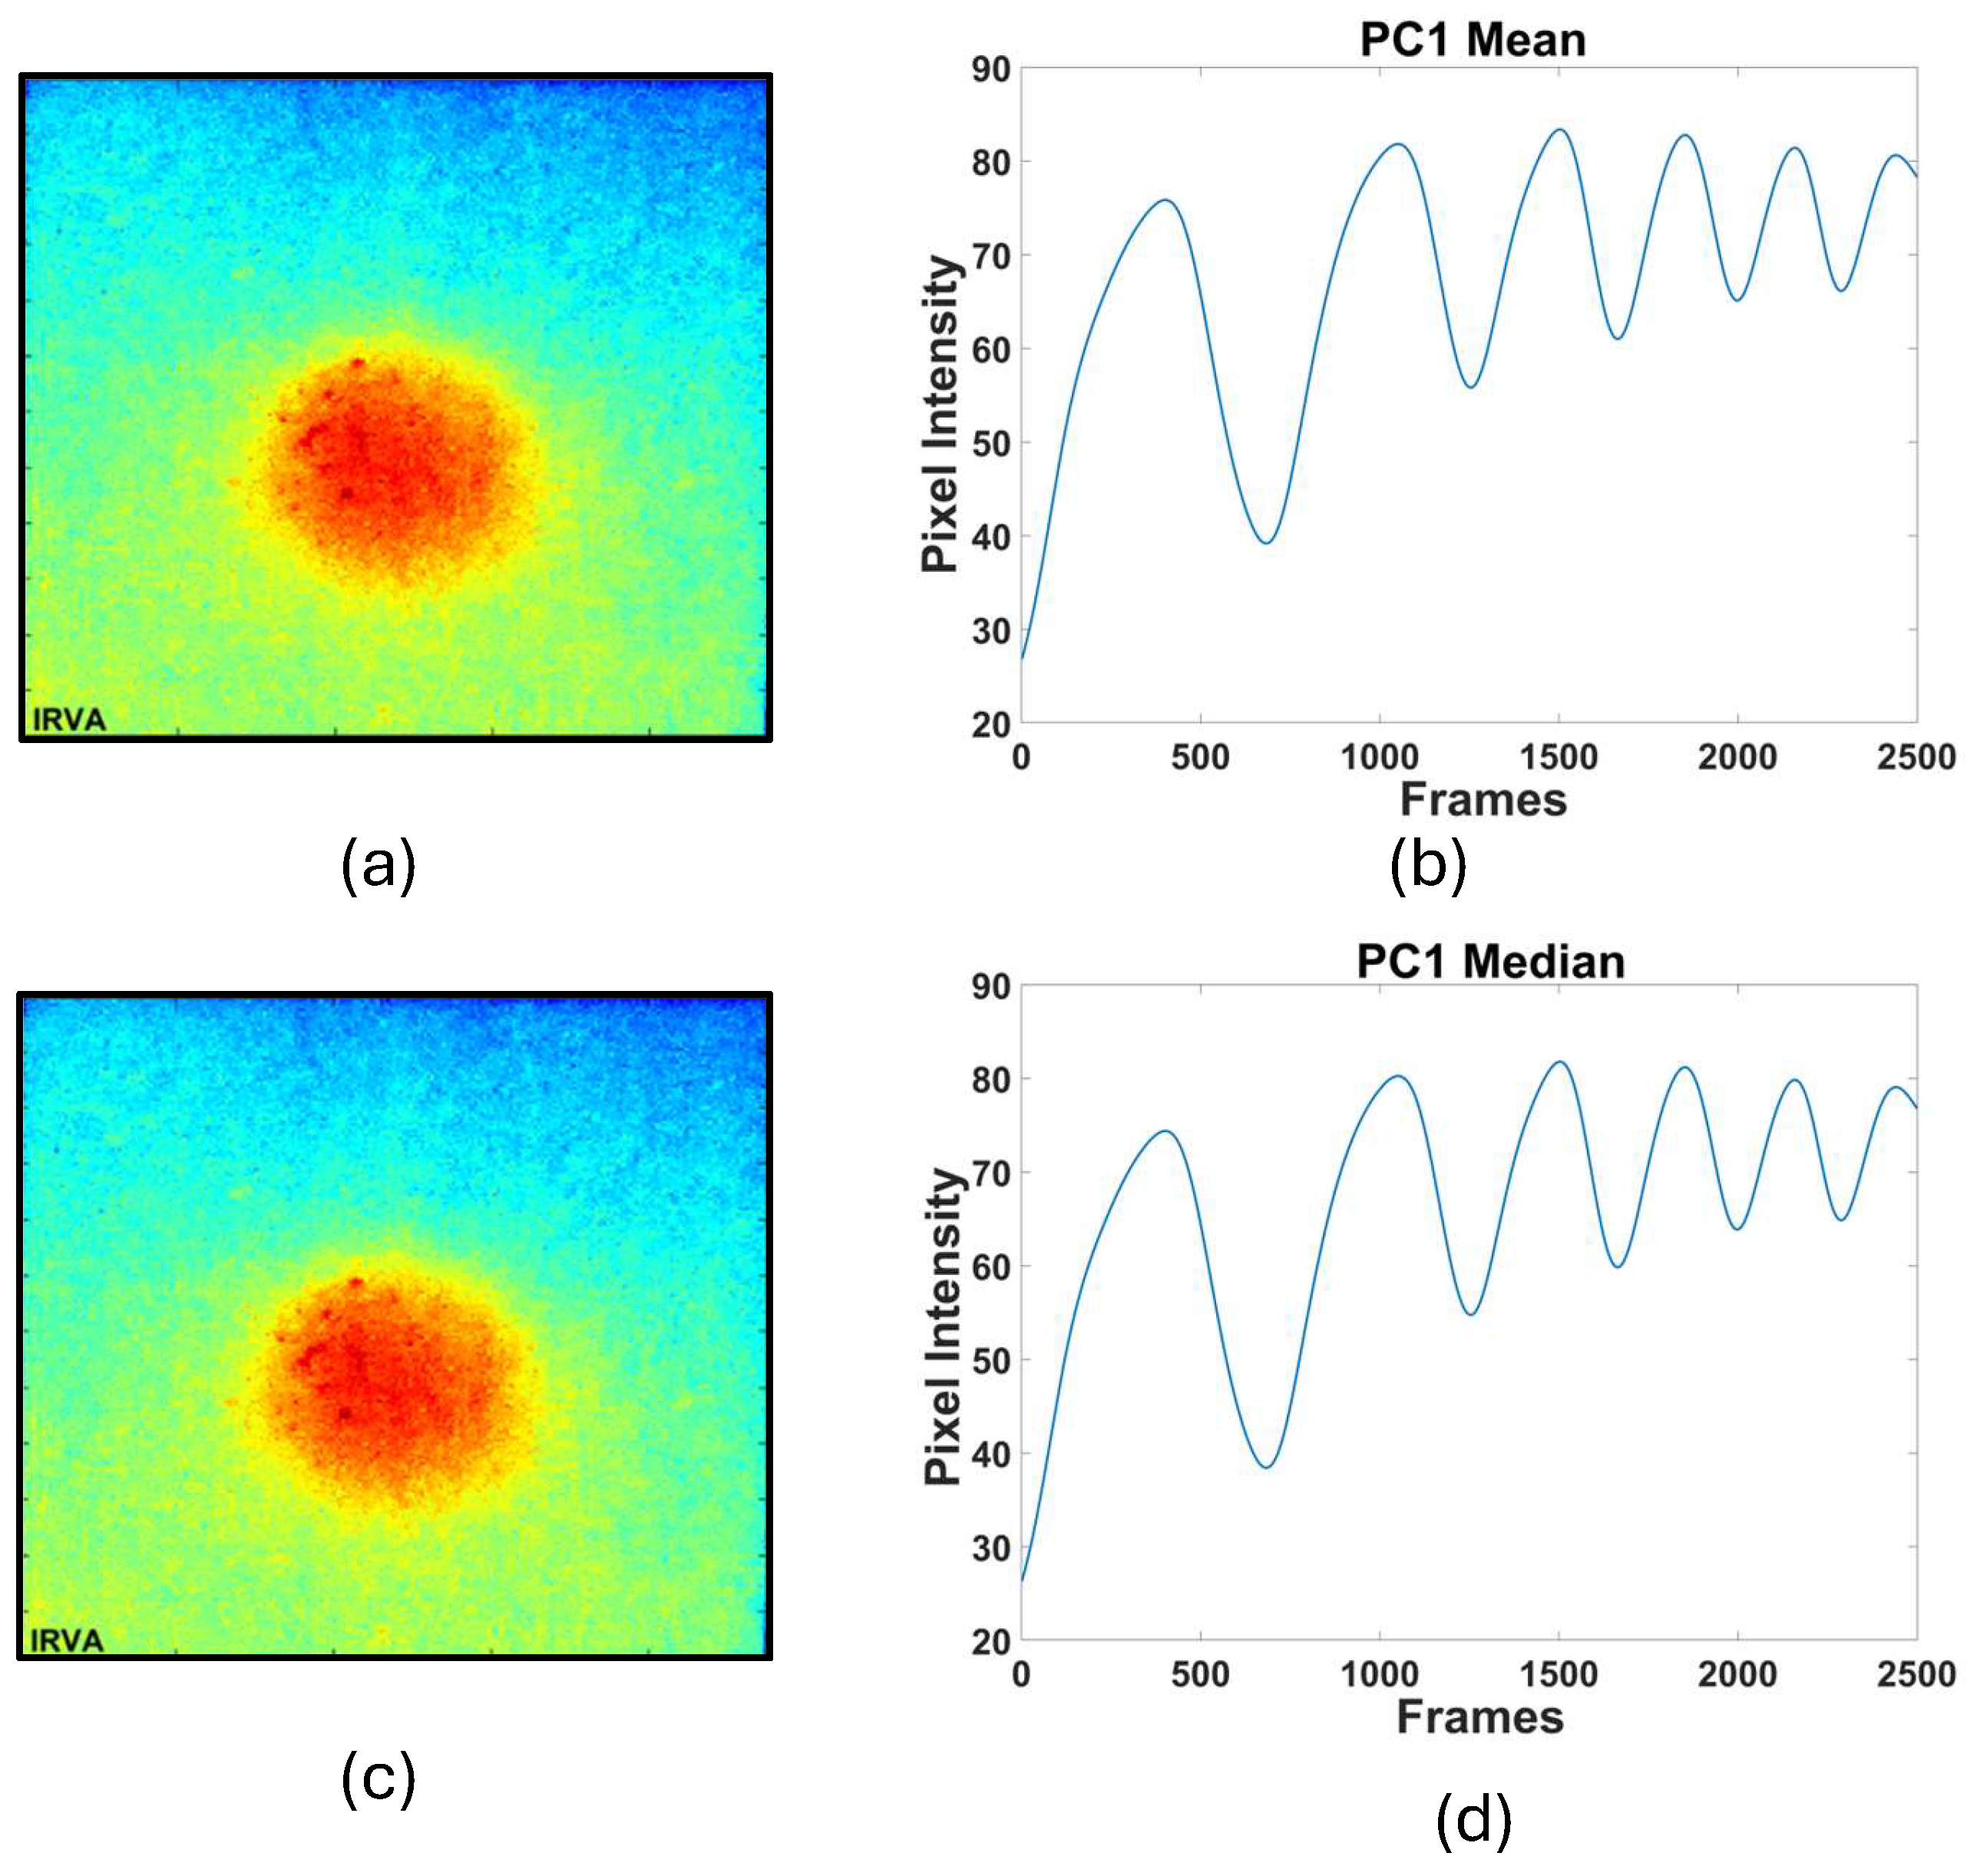
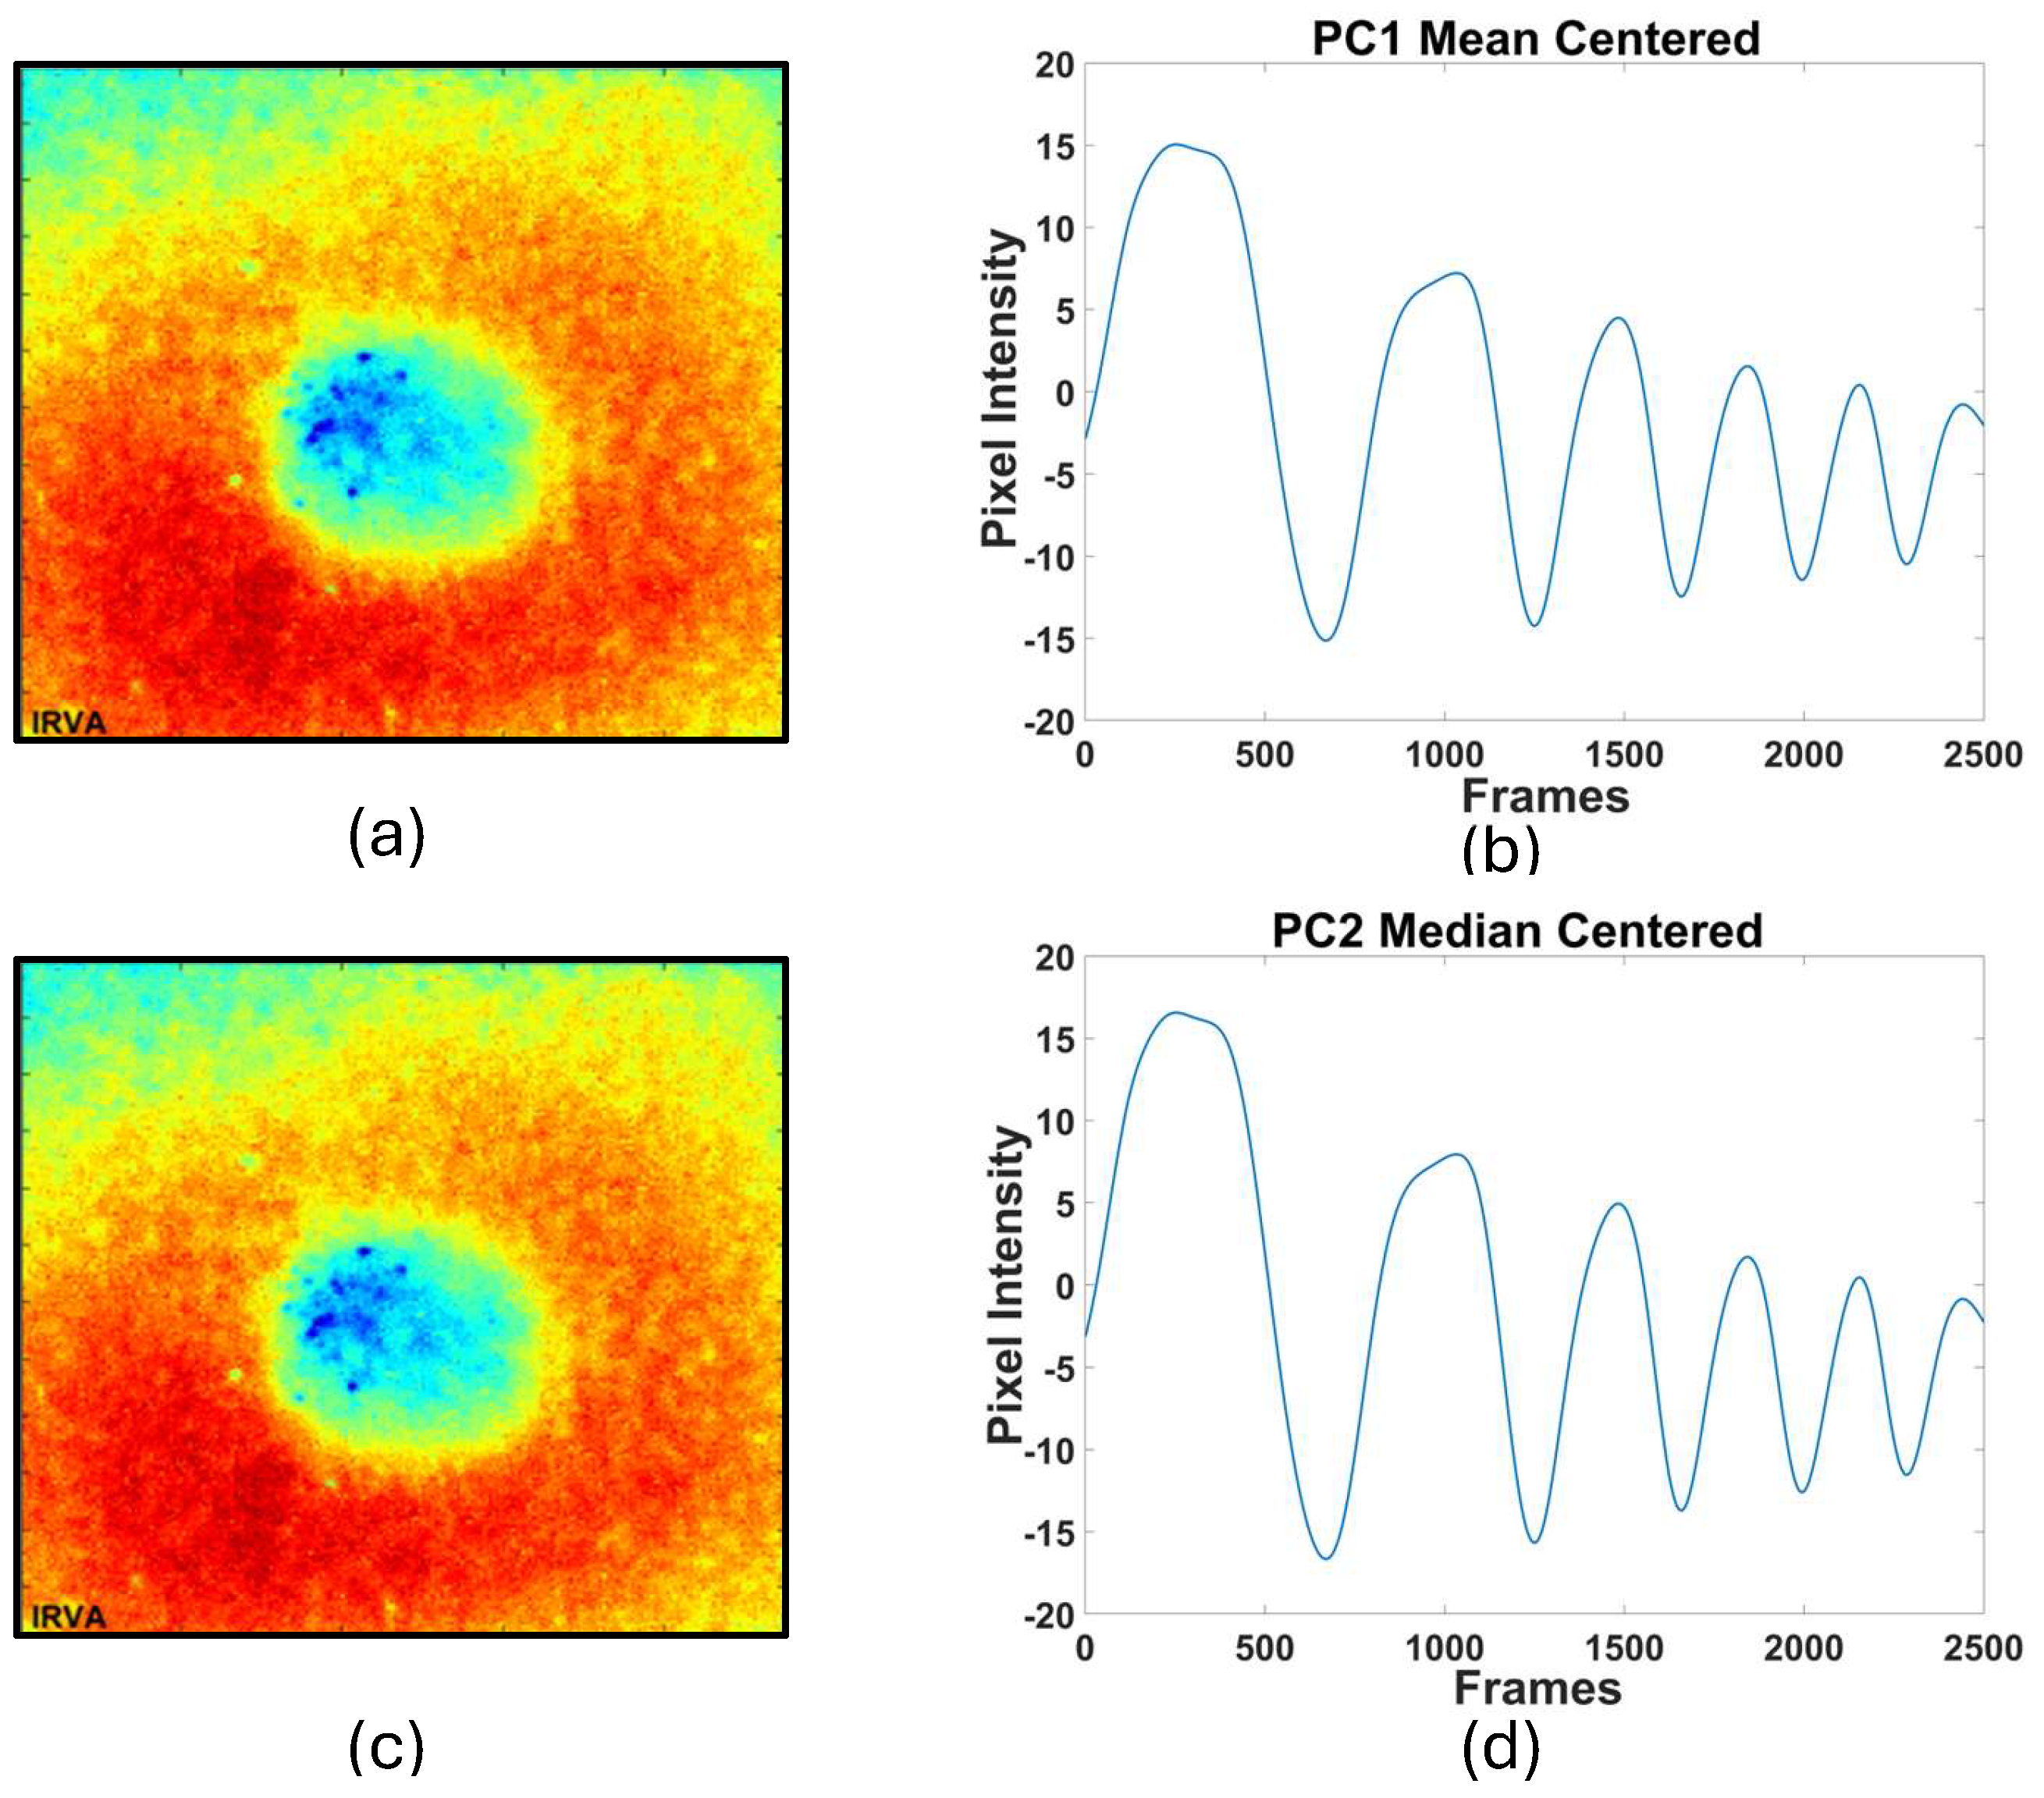
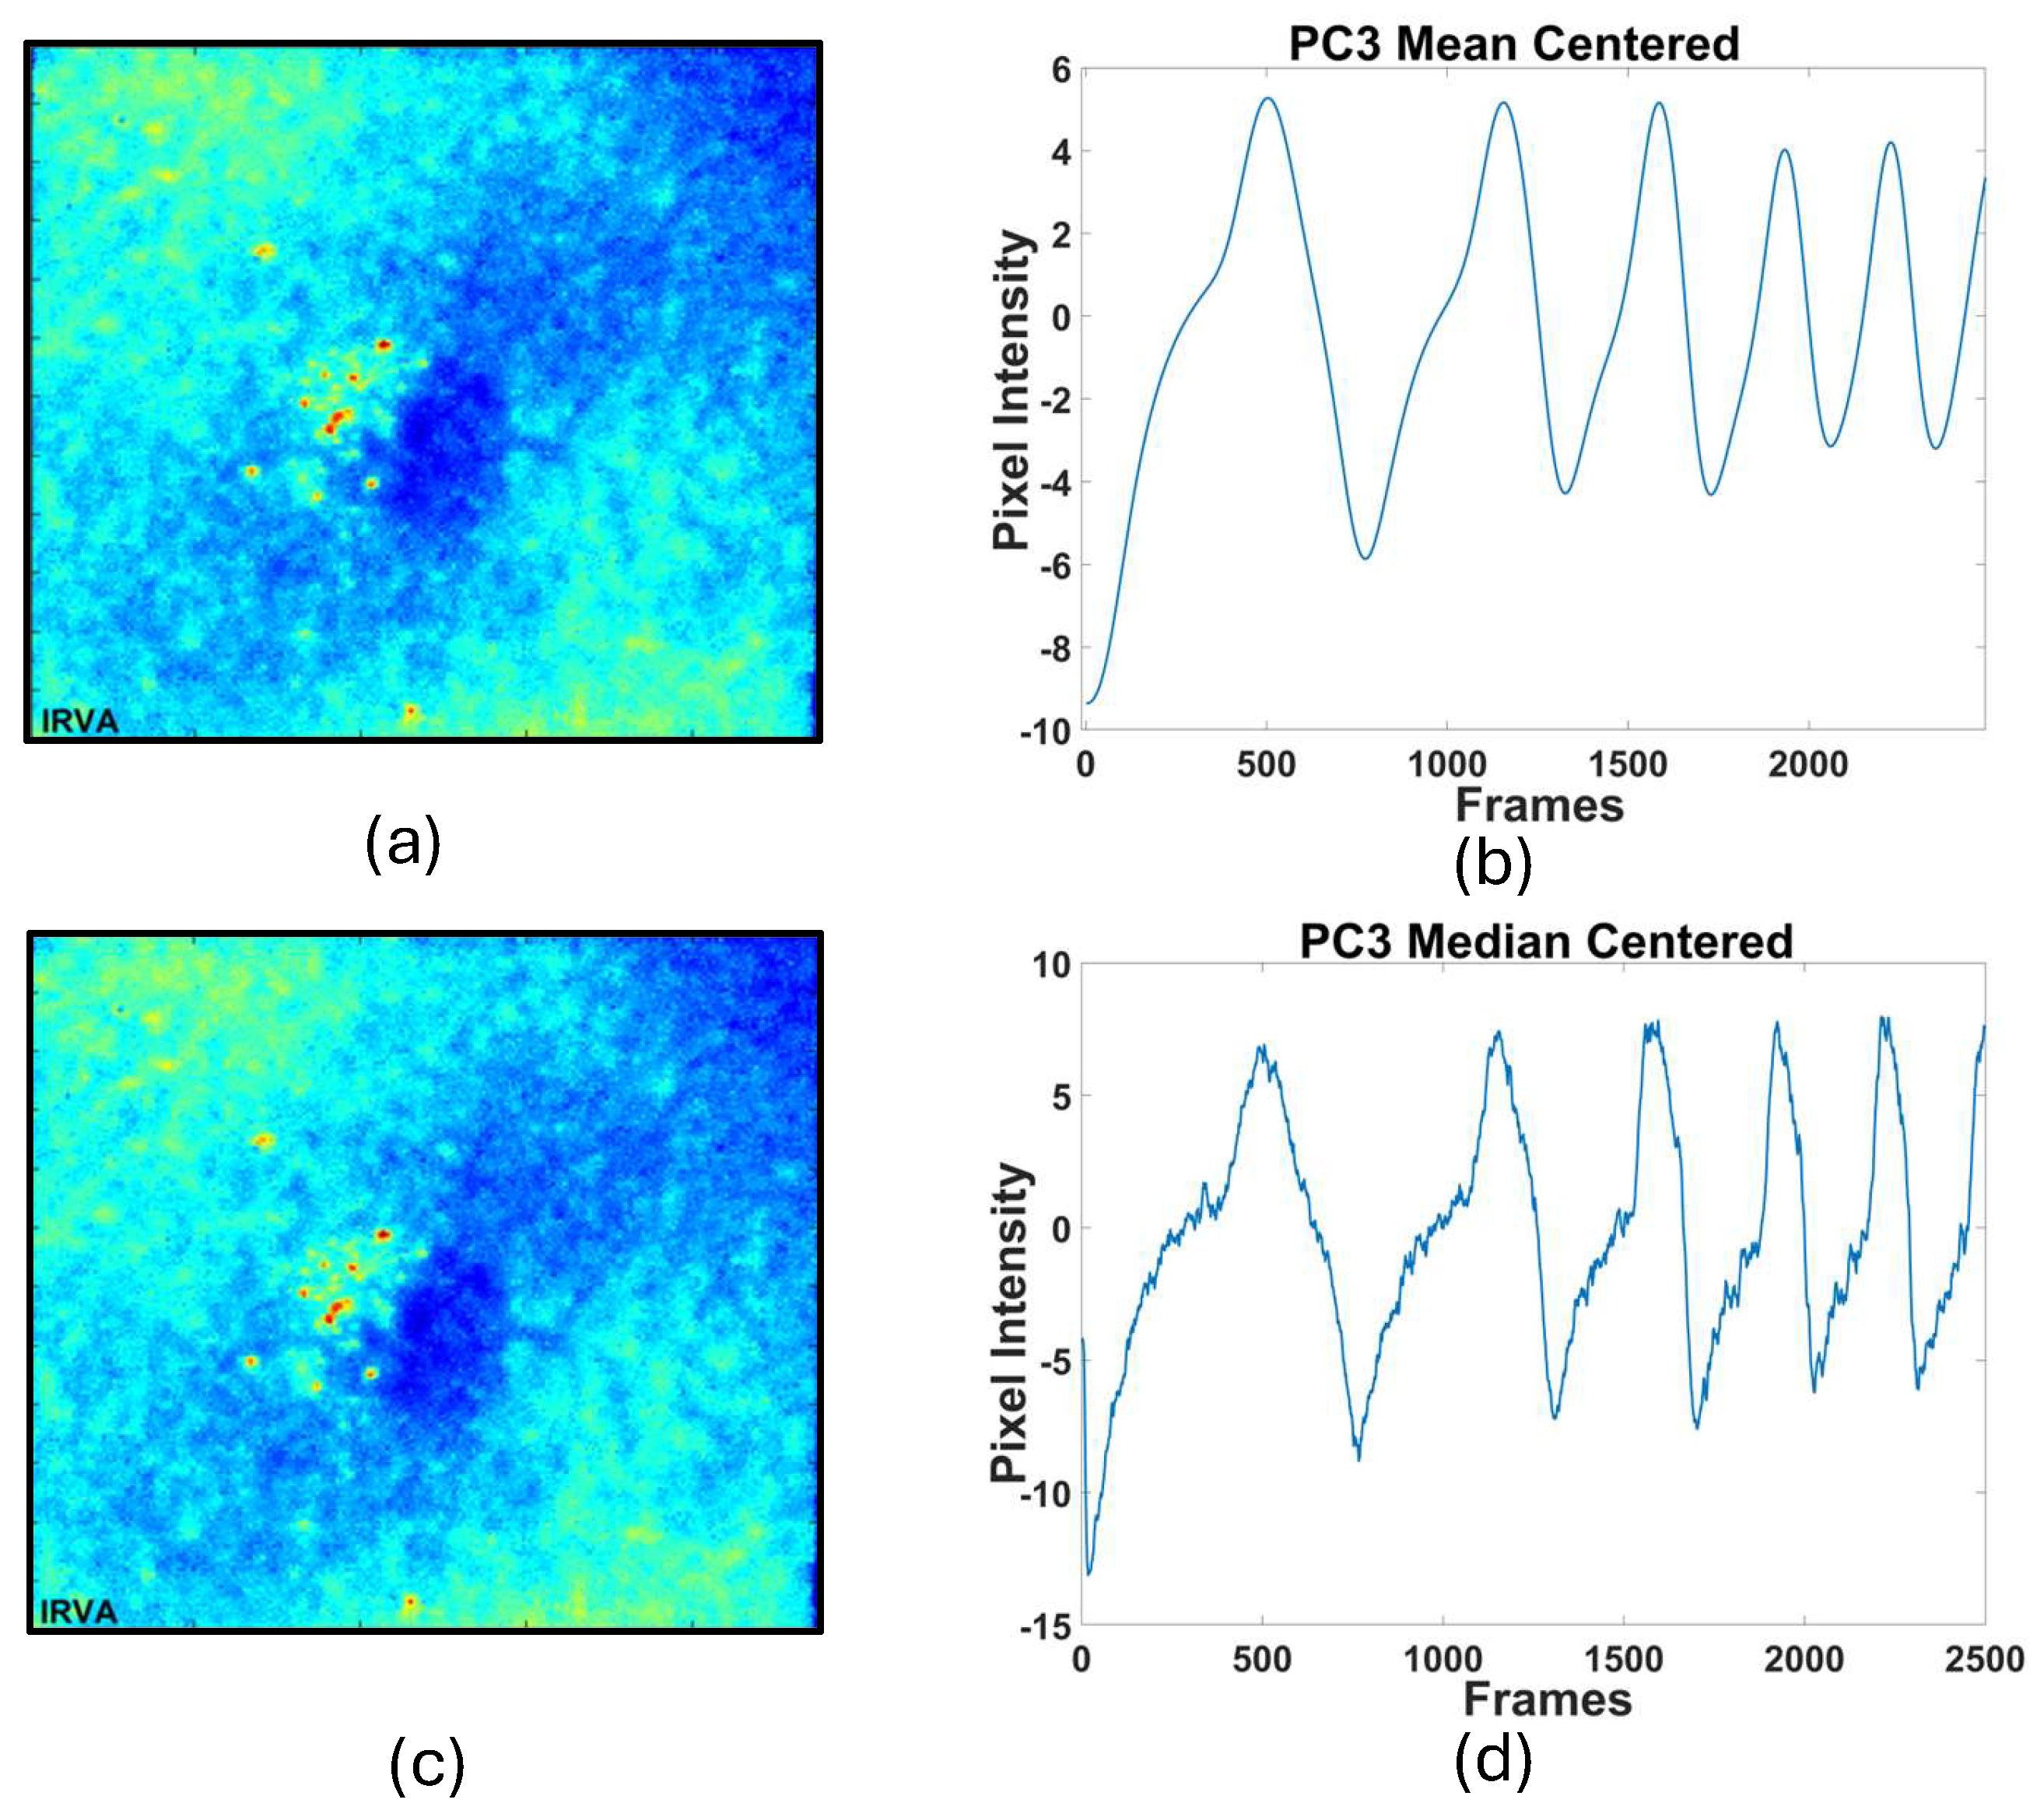
Further the work is done on principal component thermography (PCT) with median centering for standardization. PCT decomposed data into different principal components (PCs) in order of decreasing variance. Thus, mean centering and median centering are compared for standardization. The thermographic data were standardized using two different methods: mean removal and median removal. The data were then reconstructed using the first three principal components (PC1, PC2, and PC3).
As figures 6 to 8 show, the thermal profile in PC1 exhibited the most variance and closely resembled the original thermal profile for both standardization methods. This indicates that most of the relevant thermal information is captured in PC1. PC2 for both mean-removed and median-removed data showed similar characteristics to an offset-removed profile. PC2 also provided the best contrast, making it useful for highlighting variations that are not as prominent in PC1.
Figure 6.
Reconstructed (a) and (b) spatial thermal distribution and (c) and (d) its temporal response obtained from PC1 for mean and median centering respectively.
Figure 6.
Reconstructed (a) and (b) spatial thermal distribution and (c) and (d) its temporal response obtained from PC1 for mean and median centering respectively.
Figure 7.
Reconstructed (a) and (b) spatial thermal distribution and (c) and (d) its temporal response obtained from PC2 for mean and median centering respectively.
Figure 7.
Reconstructed (a) and (b) spatial thermal distribution and (c) and (d) its temporal response obtained from PC2 for mean and median centering respectively.
Figure 8.
Reconstructed (a) and (b) spatial thermal distribution and (c) and (d) its temporal response obtained from PC1 for mean and median centering respectively.
Figure 8.
Reconstructed (a) and (b) spatial thermal distribution and (c) and (d) its temporal response obtained from PC1 for mean and median centering respectively.
The thermal profiles in PC3 began to lose their shape, and the signal quality diminished. This suggests that PC3 captures less relevant information and introduces noise into the thermal profile, especially in median removed profile. When comparing the contrast, PC2 provided the best contrast, effectively highlighting features in the hardened steel sample. In contrast, PC3 failed to provide any meaningful contrast, indicating that it does not contribute significantly to the detection of thermal anomalies.
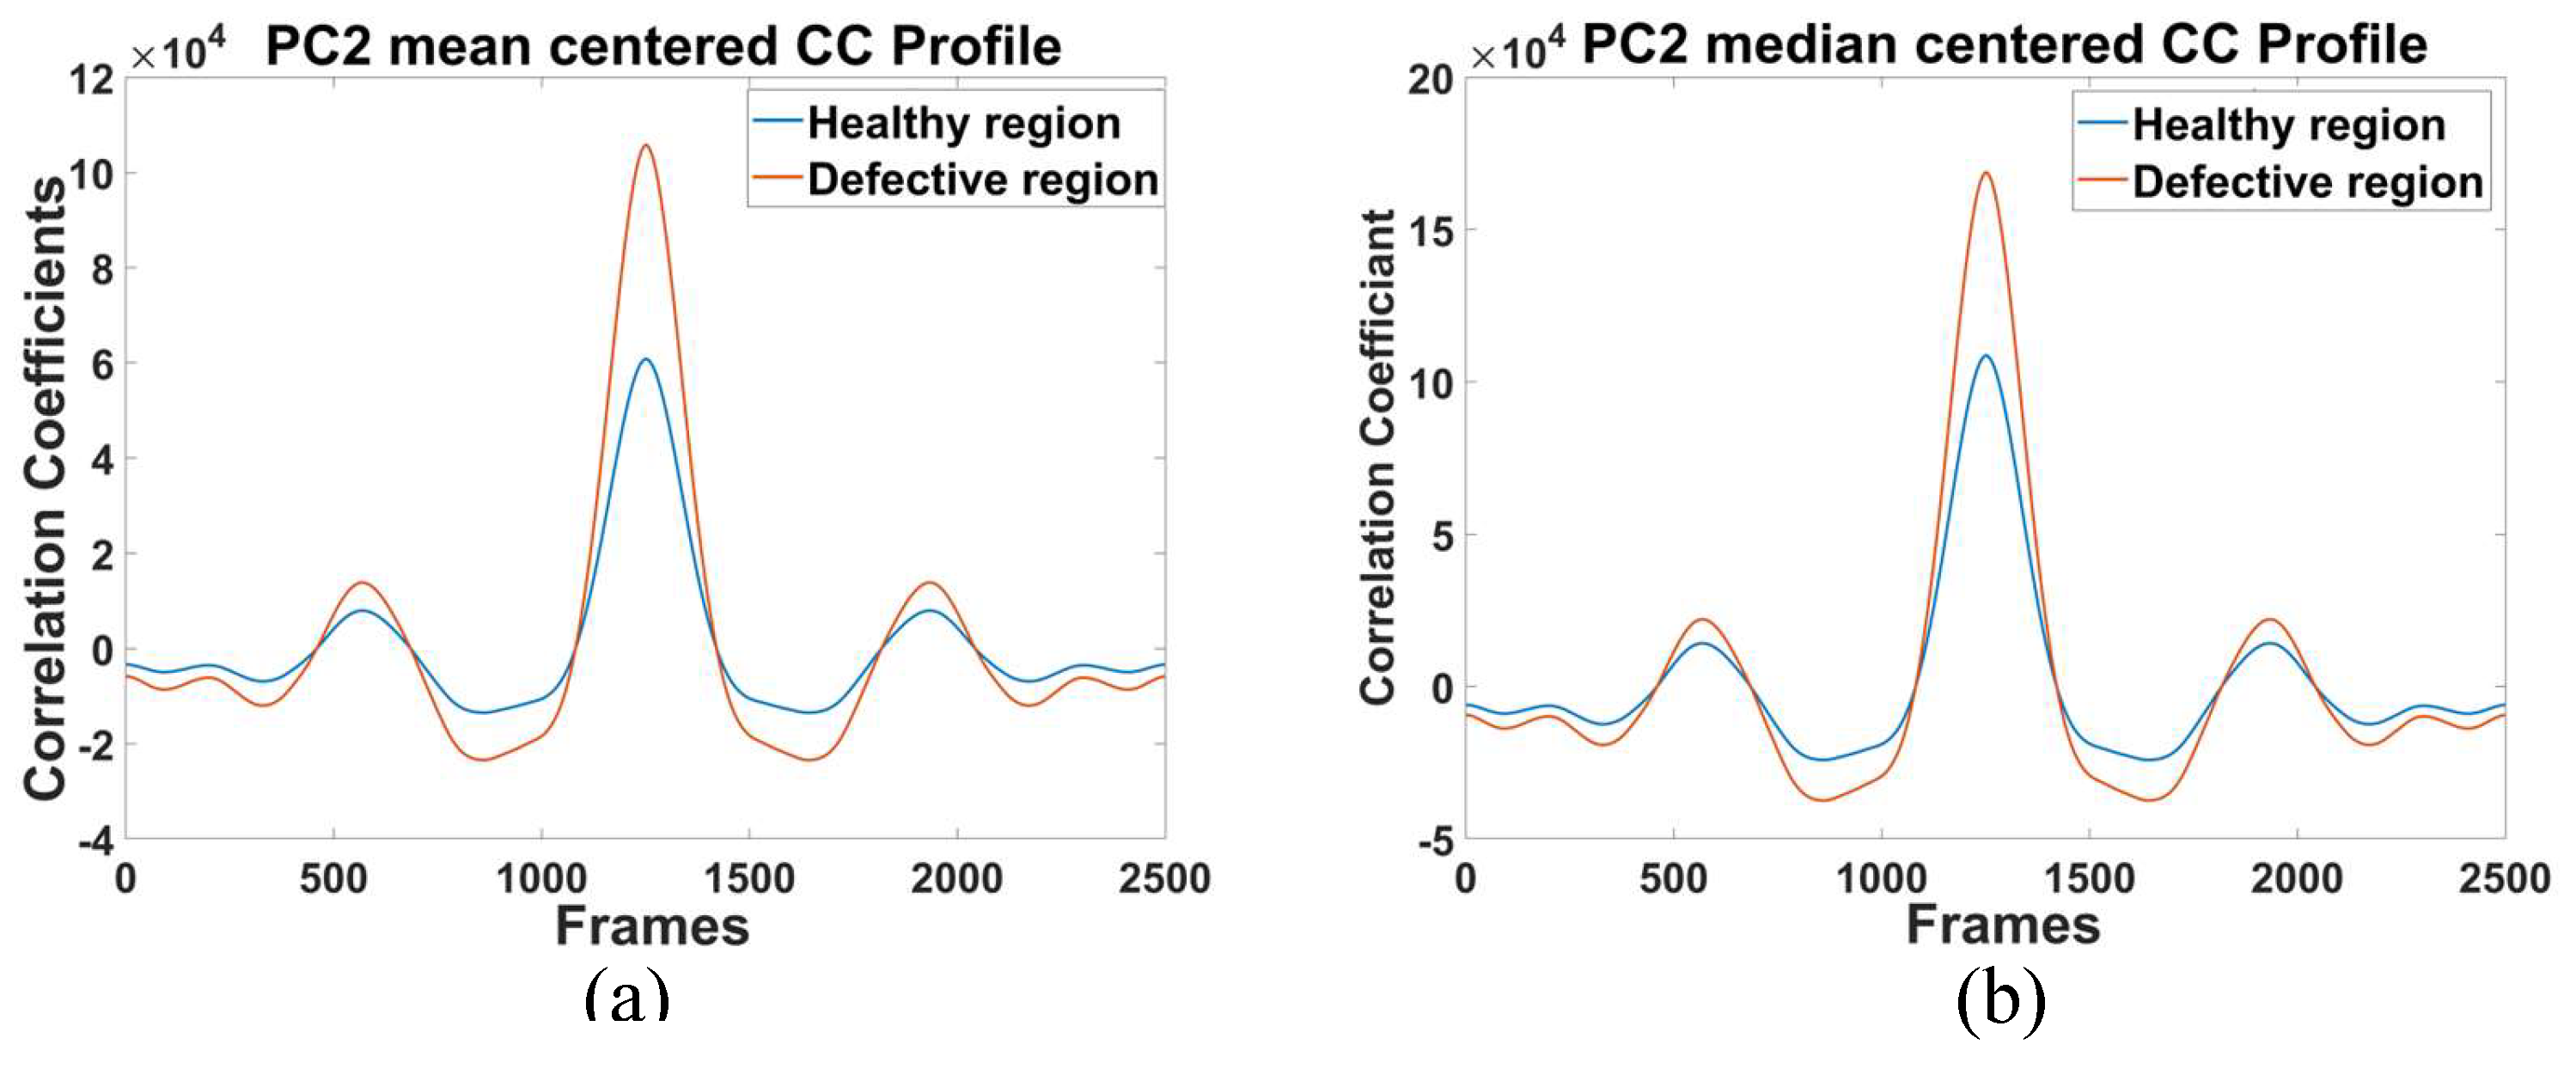
The resolution in PC1 and PC2 was sufficient to capture major defects, but PC3’s loss of detail in temporal tem indicates a drop in accuracy. Thus, pulse compression of PC2 enhanced resolution and accuracy. So, further comparison of pulse compression of mean and median centered data for PC2 is shown in
Figure 9.
Figure 9.
Cross correlation profile for (a) mean centered and (b) median centered PC2 thermal profile.
Figure 9.
Cross correlation profile for (a) mean centered and (b) median centered PC2 thermal profile.
Figure 10.
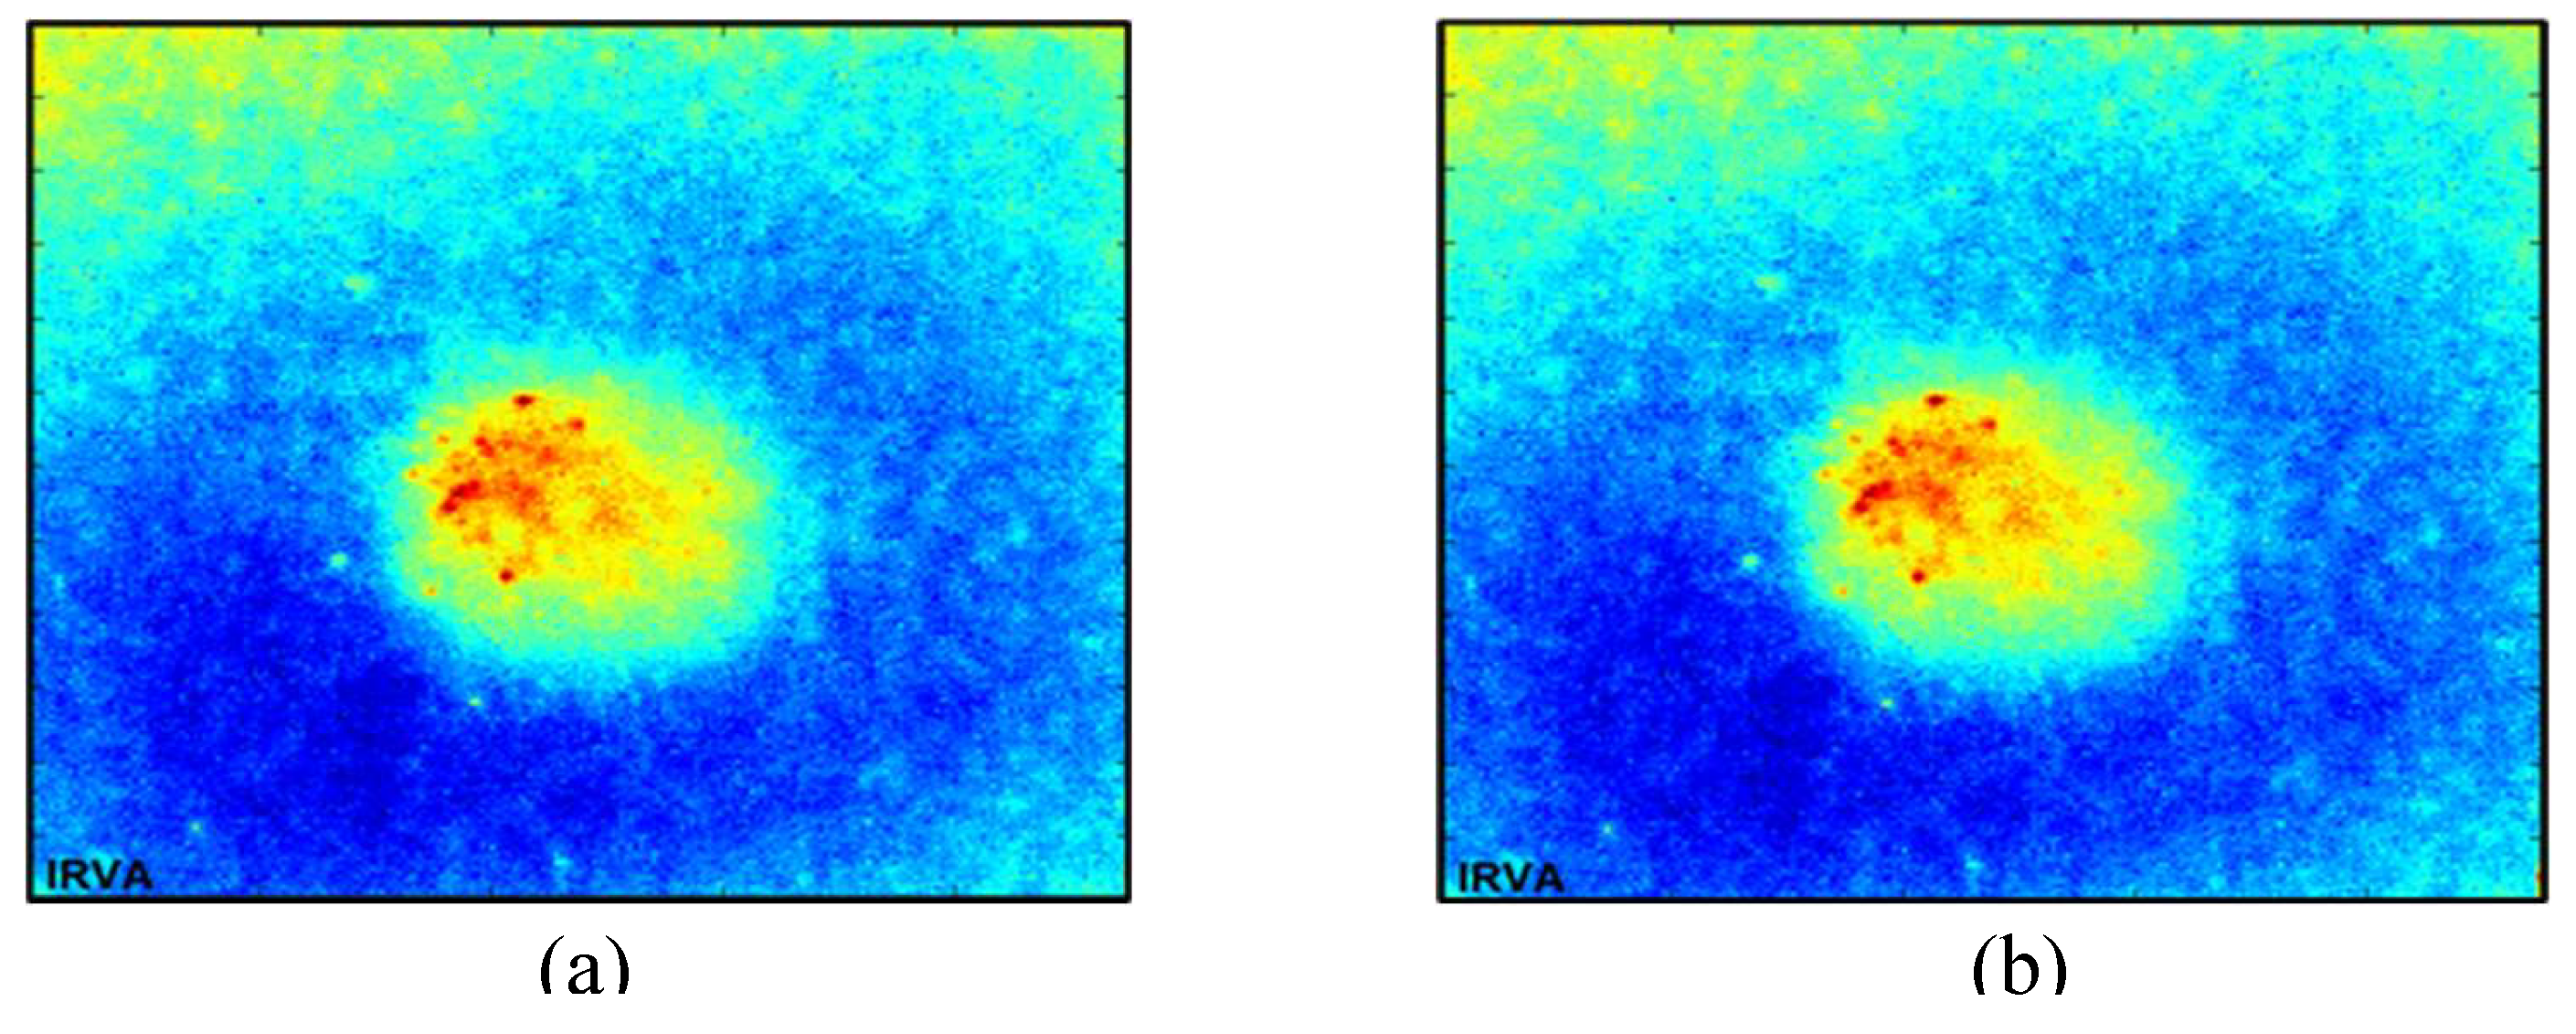
Illustrates reconstructed spatial thermal distribution for obtained by pulse compression of (a) mean centered and (b) median centered for PC2 signal.
Figure 10.
Illustrates reconstructed spatial thermal distribution for obtained by pulse compression of (a) mean centered and (b) median centered for PC2 signal.
Figure 9 shows correlation for PC2 on both mean centered and median centered data and, on this sample, it can be observed that median centered provides better peak to side lobe ratio which means better suppression of noise in compressed pulse, although when comparing enhanced contrast then both techniques have similar performance. From
Figure 5 (b) and 9 then PCT provides better peak to side ratio than pulse compression with polynomial curve fit. And comparing contrasts polynomial curve fit have highest contrast but PCT capture thermal gradient over the material surface more efficiently.
Further for comparing all the techniques results have been evaluated taking SNR as figure of merit, as in equation 16, thus results show above pulse compression (CC) have highest SNR, followed by PC2 with pulse compression, then PC2 and PC1 for both mean and median centering. Having similar contrast and SNR for both mean and median centering.
Thus, different methods are compared as shown in Figure 11 and
Table 1, it was observed that PCA as preprocessing reduces the data much effectively i.e., it makes data processing much more efficient among all techniques with high signal to noise ratio.
5. Conclusion
This paper examines the effectiveness of various statistical post-processing techniques for detecting defects in hardened steel used in ship building using frequency-modulated thermal wave imaging. Experimental findings indicate that for contrast evaluation, pulse compression with polynomial curve fitting as preprocessing outperforms other methods. Additionally, PCA with either mean or median centring shows similar performance on hardened steel specimens. The advantage of PCA lies in its superior performance in data dimensionality reduction, as shown in Figures 5(b) and 9. While pulse compression yields the highest SNR, integrating PCA as a preprocessing step for pulse compression, though slightly reducing the SNR compared to the conventional pulse compression technique, significantly speeds up processing due to the substantial reduction in data dimensions, as illustrated in Figures 4(b), 7(b), and 7(d). And with pulse compression with PCA image achieve better contrast and detectability than conventional PCA. Further in terms of signal-to-noise ratio (SNR), pulse compression achieves the highest SNR, followed by pulse compression with PCA giving similar results for both mean and median centred data, followed by PC2 and PC1 for both mean and median centring. And PC3 results fail to detect the defect and signal starts to lose information thus discarding it for further comparison.
References
- X. Maldague, “Theory and practice of infrared technology for nondestructive testing,” (No Title), 2001.
- X. P. V Maldague, “Introduction to NDT by active infrared thermography,” Mater Eval, vol. 60, no. 9, pp. 1060–1073, 2002.
- R. Yang and Y. He, “Optically and non-optically excited thermography for composites: A review,” Infrared Phys Technol, vol. 75, pp. 26–50, Mar. 2016. [CrossRef]
- C. Jena, N. Sarbhai, R. Mulaveesala, and S. Tuli, “Pulsed Thermography Simulation: 1D, 2D and 3D Electro-Thermal Model Based Evaluation.” [Online]. Available online: https://www.ndt.net/?id=4376.
- R. Montanini, “Quantitative determination of subsurface defects in a reference specimen made of Plexiglas by means of lock-in and pulse phase infrared thermography,” Infrared Phys Technol, vol. 53, no. 5, pp. 363–371, 2010. [CrossRef]
- S. E. Chernykh, V. N. Kostin, and Yu. I. Komolikov, “Thermal Testing of Corundum Ceramic Plates,” Russian Journal of Nondestructive Testing, vol. 59, no. 9, pp. 977–984, Sep. 2023. [CrossRef]
- X. Maldague and S. Marinetti, “Pulse phase infrared thermography,” J Appl Phys, vol. 79, no. 5, pp. 2694–2698, 1996. [CrossRef]
- R. Mulaveesala, G. Dua, V. Arora, J. A. Siddiqui, and A. Muniyappa, “Pulse compression favourable aperiodic infrared imaging approach for non-destructive testing and evaluation of bio-materials,” in Thermosense: Thermal Infrared Applications XXXIX, SPIE, Jun. 2017, p. 102140G. [CrossRef]
- S. Tuli and K. Chatterjee, “Frequency modulated thermal wave imaging,” in AIP Conference Proceedings, 2012, pp. 523–526. [CrossRef]
- J.-C. Krapez, D. Pacou, and G. Gardette, “Lock-in thermography and fatigue limit of metals,” in Proceedings of the 2000 International Conference on Quantitative InfraRed Thermography, QIRT Council, 2000. [CrossRef]
- Y. Chung, R. Shrestha, S. Lee, and W. Kim, “Thermographic Inspection of Internal Defects in Steel Structures: Analysis of Signal Processing Techniques in Pulsed Thermography,” Sensors, vol. 20, no. 21, p. 6015, Oct. 2020. [CrossRef]
- G. Silipigni et al., “Optimization of the pulse-compression technique applied to the infrared thermography nondestructive evaluation,” NDT & E International, vol. 87, pp. 100–110, Apr. 2017. [CrossRef]
- V. P. Vavilov, A. O. Chulkov, V. V. Shiryaev, M. V. Kuimova, and H. Zhang, “Noise suppression in pulsed IR thermographic NDT: Efficiency of data processing algorithms,” NDT & E International, vol. 148, p. 103240, Dec. 2024. [CrossRef]
- R. Mulaveesala et al., “Pulse compression favorable thermal wave imaging methods for testing and evaluation of carbon fibre reinforced polymer,” SPIE-Intl Soc Optical Eng, Apr. 2020, p. 30. [CrossRef]
- Sharma, R. Mulaveesala, and V. Arora, “Novel Analytical Approach for Estimation of Thermal Diffusivity and Effusivity for Detection of Osteoporosis,” IEEE Sens J, vol. 20, no. 11, pp. 6046–6054, Jun. 2020. [CrossRef]
- R. Mulaveesala, V. S. Ghali, and V. Arora, “Applications of non-stationary thermal wave imaging methods for characterisation of fibre-reinforced plastic materials,” Electron Lett, vol. 49, no. 2, pp. 118–119, 2013. [CrossRef]
- R. Mulaveesala, J. S. Vaddi, and P. Singh, “Pulse compression approach to infrared nondestructive characterization,” Review of Scientific Instruments, vol. 79, no. 9, 2008. [CrossRef]
- N. Tabatabaei, A. Mandelis, and B. T. Amaechi, “Thermophotonic radar imaging: An emissivity-normalized modality with advantages over phase lock-in thermography,” Appl Phys Lett, vol. 98, no. 16, Apr. 2011. [CrossRef]
- N. Tabatabaei, “Matched-Filter Thermography,” Applied Sciences, vol. 8, no. 4, p. 581, Apr. 2018. [CrossRef]
- M. Ricci, R. Zito, and S. Laureti, “Pseudo-noise pulse-compression thermography: A powerful tool for time-domain thermography analysis,” NDT & E International, vol. 148, p. 103218, Dec. 2024. [CrossRef]
- J. Gong, J. Liu, L. Qin, and Y. Wang, “Investigation of carbon fiber reinforced polymer (CFRP) sheet with subsurface defects inspection using thermal-wave radar imaging (TWRI) based on the multi-transform technique,” NDT & E International, vol. 62, pp. 130–136, Mar. 2014. [CrossRef]
- G. Dua, V. Arora, and R. Mulaveesala, “Defect Detection Capabilities of Pulse Compression Based Infrared Non-Destructive Testing and Evaluation,” IEEE Sens J, vol. 21, no. 6, pp. 7940–7947, Jun. 2021. [CrossRef]
- N. Rajic, “Principal component thermography for flaw contrast enhancement and flaw depth characterisation in composite structures,” Compos Struct, vol. 58, no. 4, pp. 521–528, Dec. 2002. [CrossRef]
- B. Yousefi, S. Sfarra, F. Sarasini, C. I. Castanedo, and X. P. V Maldague, “Low-rank sparse principal component thermography (sparse-PCT): Comparative assessment on detection of subsurface defects,” Infrared Phys Technol, vol. 98, pp. 278–284, 2019. [CrossRef]
- S. Marinetti et al., “Statistical analysis of IR thermographic sequences by PCA,” Infrared Phys Technol, vol. 46, no. 1–2, pp. 85–91, Dec. 2004. [CrossRef]
- P. Das, V. Arora, and R. Mulaveesala, “Novel Insights on Spatio-Temporal Analysis for Frequency Modulated Thermal Wave Imaging Using Principal Component Analysis on Glass Fibre Reinforced Polymer Material,” J Nondestr Eval, vol. 43, no. 2, p. 34, Jun. 2024. [CrossRef]
- C. Ibarra-Castanedo, D. González, M. Klein, M. Pilla, S. Vallerand, and X. Maldague, “Infrared image processing and data analysis,” Infrared Phys Technol, vol. 46, no. 1–2, pp. 75–83, Dec. 2004. [CrossRef]
- S. Ebrahimi et al., “Robust Principal Component Thermography for Defect Detection in Composites,” Sensors, vol. 21, no. 8, p. 2682, Apr. 2021. [CrossRef]
- B. Milovanović, M. Gaši, and S. Gumbarević, “Principal Component Thermography for Defect Detection in Concrete,” Sensors, vol. 20, no. 14, p. 3891, Jul. 2020. [CrossRef]
- V. S. Ghali and R. Mulaveesala, “Frequency modulated thermal wave imaging techniques for non-destructive testing,” Insight: Non-Destructive Testing and Condition Monitoring, vol. 52, no. 9, pp. 475–480, Sep. 2010. [CrossRef]
- K. Kaur and R. Mulaveesala, “An efficient data processing approach for frequency modulated thermal wave imaging for inspection of steel material,” Infrared Phys Technol, vol. 103, p. 103083, Jun. 2019. [CrossRef]
|
Disclaimer/Publisher’s Note: The statements, opinions and data contained in all publications are solely those of the individual author(s) and contributor(s) and not of MDPI and/or the editor(s). MDPI and/or the editor(s) disclaim responsibility for any injury to people or property resulting from any ideas, methods, instructions or products referred to in the content. |
© 2024 by the authors. Licensee MDPI, Basel, Switzerland. This article is an open access article distributed under the terms and conditions of the Creative Commons Attribution (CC BY) license (http://creativecommons.org/licenses/by/4.0/).
