1. Introduction
Ultrashort pulse laser systems operating in large-scale facilities like APOLLON, BELLA, CLF, ELI, etc. [
1] are heavily booked for secondary source developments and user experiments. The need for scientific and technological developments related to high average power laser–matter interactions, e.g., target systems [
2,
3], diagnostics, etc., calls for frequent experimental testing with appropriate laser sources.
The choice of laser type and material is hence dictated by the near-infrared wavelength regime, and broad bandwidth we aim to work with. Potential applications in a wide range of R&D projects in a university setting pose two further major criteria. First, the system must be tailored easily for various demands, and second, its basic design and assembly must ensure stable operation for long hours. Thus, an obvious choice is the Ti:Sa laser technology [
4], mature enough even for the industrial production of lasers with a wide range of fixed parameters, from multi-kHz repetition rate high average power devices [
5,
6,
7] through few Hz repetition rate several TW peak power lasers [
8,
9] to shot-on demand, multi-PW peak power ones [
1,
10,
11,
12].
Our versatile laser system was designed utilizing the recent achievements in Ti:Sa-based short pulse amplification. The three-stage, 100 Hz repetition rate laser system is based on the configuration of negatively and positively chirped pulse amplification [
13], and utilizes extraction during pump [
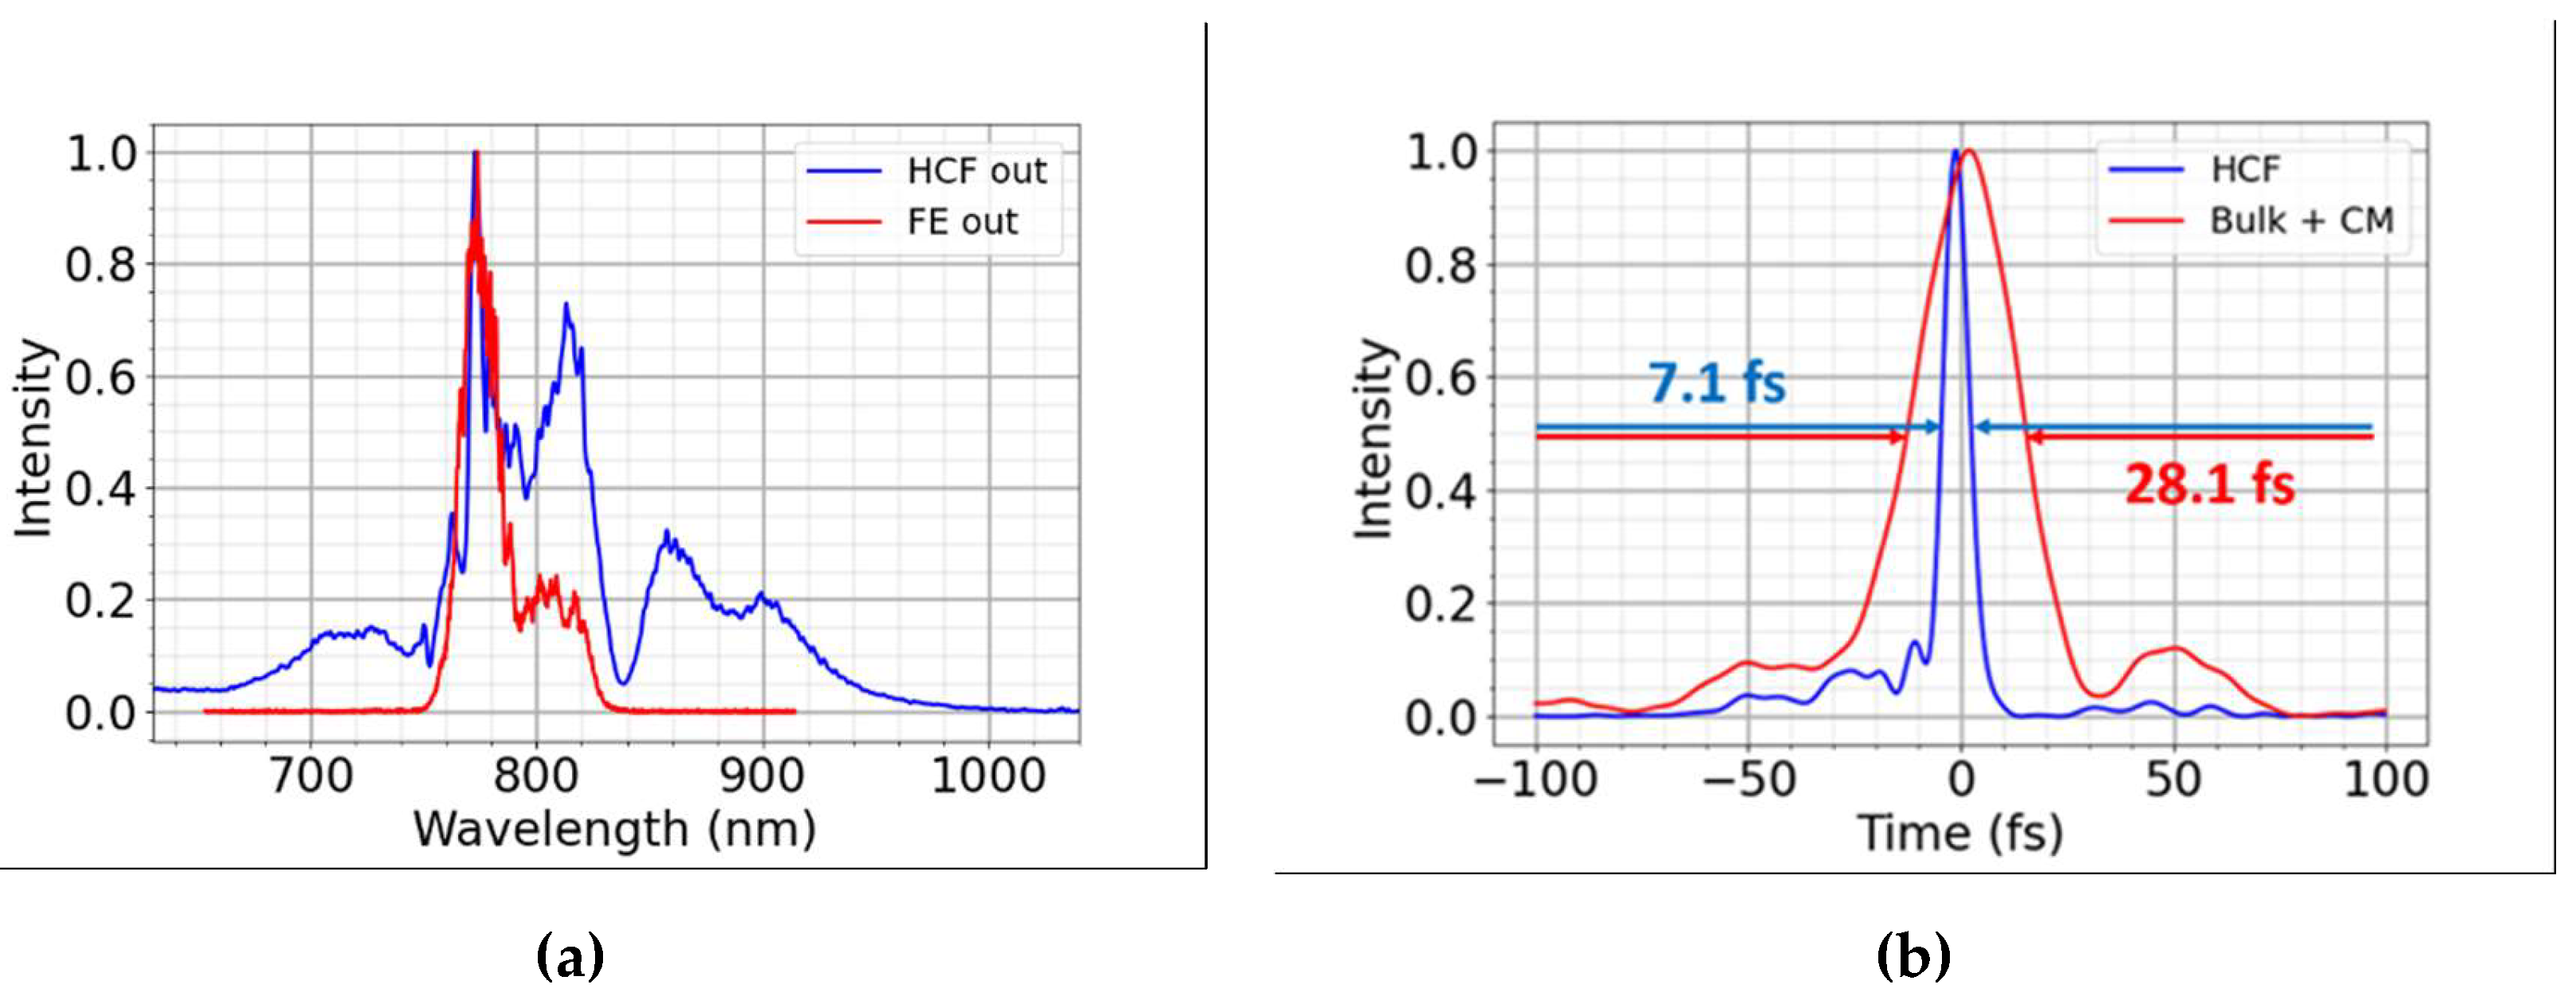
14]. The few-cycle output provides pulses with 7.1 fs and 0.25 mJ, while the power output supports 26 fs pulses with almost 50 mJ. The output energy stability is better than 0.9%. Such a system has been successfully used for the precise cutting of porous target materials, and the development of a high repetition rate liquid sheet target system.
2. Design Considerations
The major aim was to design a versatile system providing ultrashort pulses for time-resolved ultrafast spectroscopic research and high peak power applications such as target development, laser-generated X-ray source, and nonlinear optical studies. Due to the high demand, the system shall be switchable between these two modes quickly and conveniently. One of the standard methods for few-cycle pulse generation is to spectrally broaden the mJ energy short pulses in a hollow core fiber and subsequently compress them [
15]. Hence, the front end of the system called for a design which provides high efficiency and reliability. That is, the pulses with mJ level need to be stretched only to a few tens of picoseconds.
High peak power laser pulses are expected to exhibit sufficiently high temporal contrast [
8]. As is widely known, regenerative amplifiers are efficient but leaking pulses as the finite extinction ratio of the polarizers limit the achievable temporal contrast [
5]. Hence, only multipass amplifiers can be used to avoid the need for utilizing more complicated temporal cleaning methods like plasma mirrors.
A natural feature of broadband, high gain, saturated amplification is that the amplification bandwidth is substantially narrowed, hence the amplified pulse spectrum supports a pulse duration of around 50 fs. One way to overcome this limitation is changing the sign of chirp of the pulses between the amplifier units [
13]. For example, the first unit amplifies the negatively stretched pulses, where the temporally leading spectral parts, the “blue” components of the seed pulses are amplified more than the trailing edge (“red” components), making the spectrum of the amplified pulse shift to “blue”. Before the next amplifier stage(s) having similar gain, the sign of chirp is reversed, so that the “red” components would be amplified more than the trailing “blue” ones. The resulting amplified pulse spectrum would preserve more of the bandwidths than the pulses with only one sign of temporal stretching.
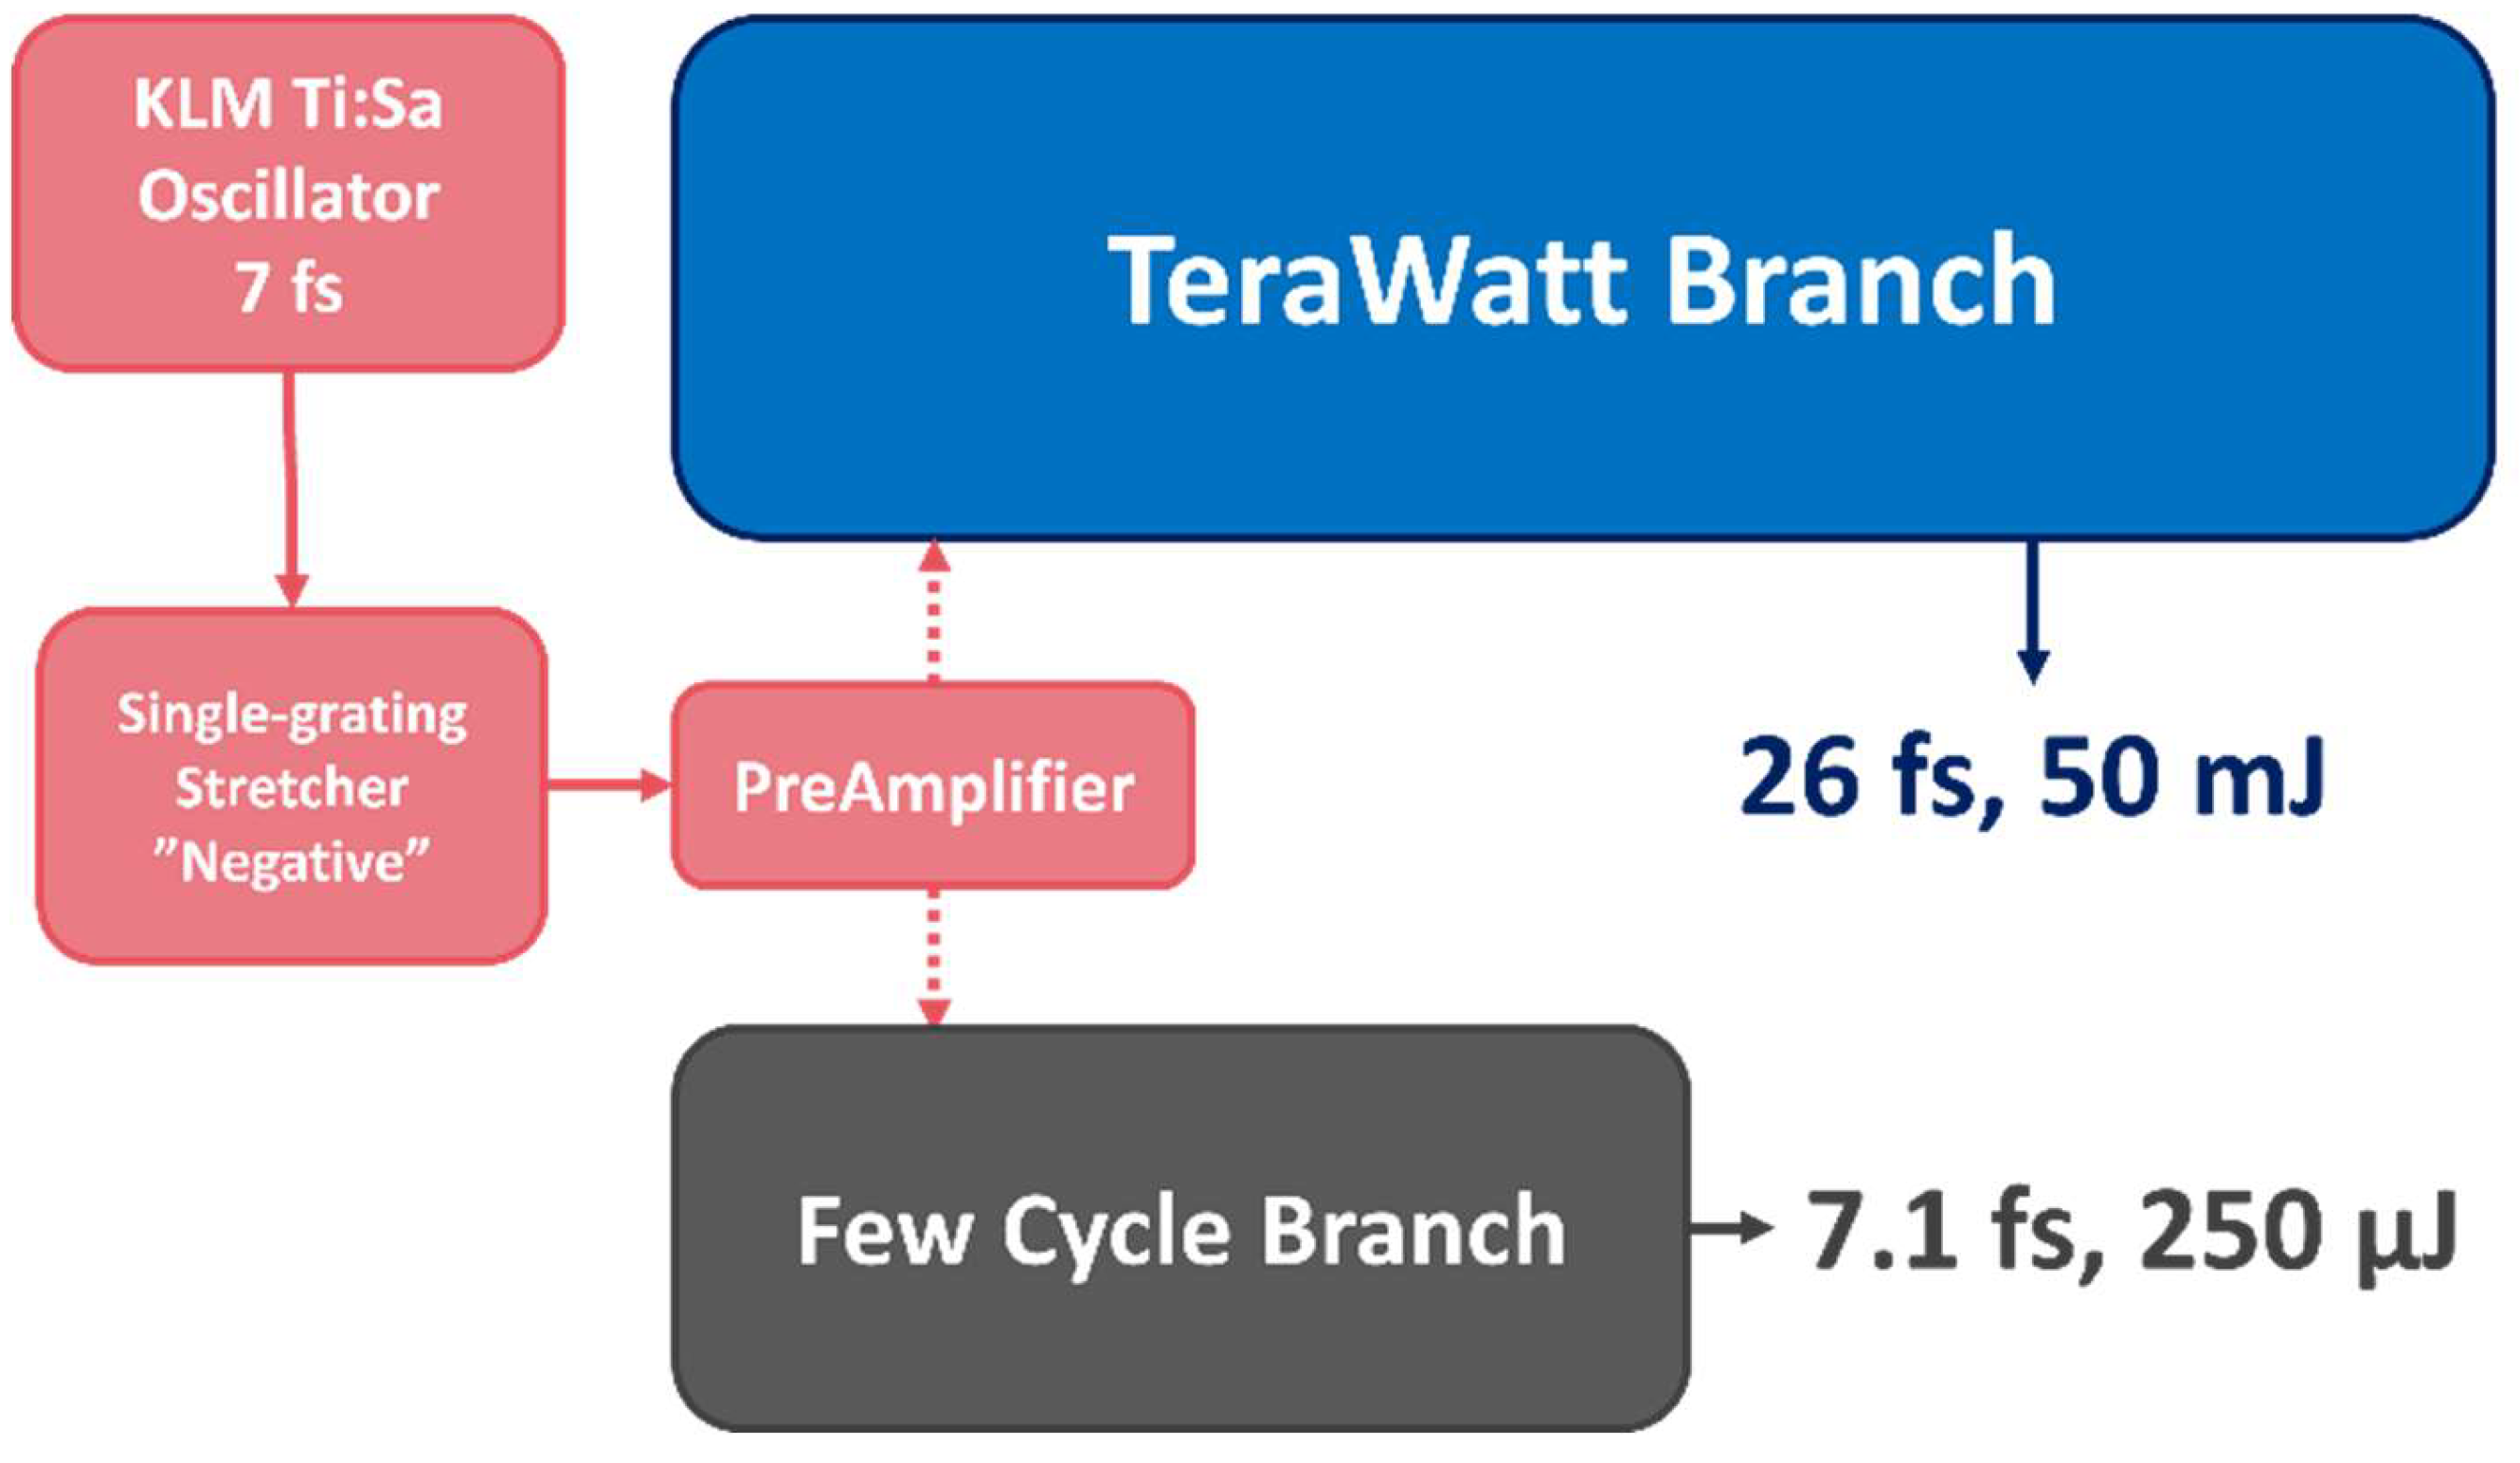
Both requirements can be simultaneously satisfied with the following scheme (
Figure 1). Let us stretch the oscillator pulses negatively in a transmission grating stretcher to about 40 ps, then make a multipass front end amplifier where an acousto-optical dispersive programmable filter (AOPDF) is embedded. Towards the few-cycle branch, the pulses are compressed in bulk and with chirped mirrors, providing a high throughput. In the TW arm, the pulses go through a grating stretcher, providing the necessary large amount of group delay dispersion to reverse the sign of the chirp and lengthen the pulse duration to hundreds of ps. The two further multipass amplifiers provide the pulses with the necessary energy.
3. Front End (FE)
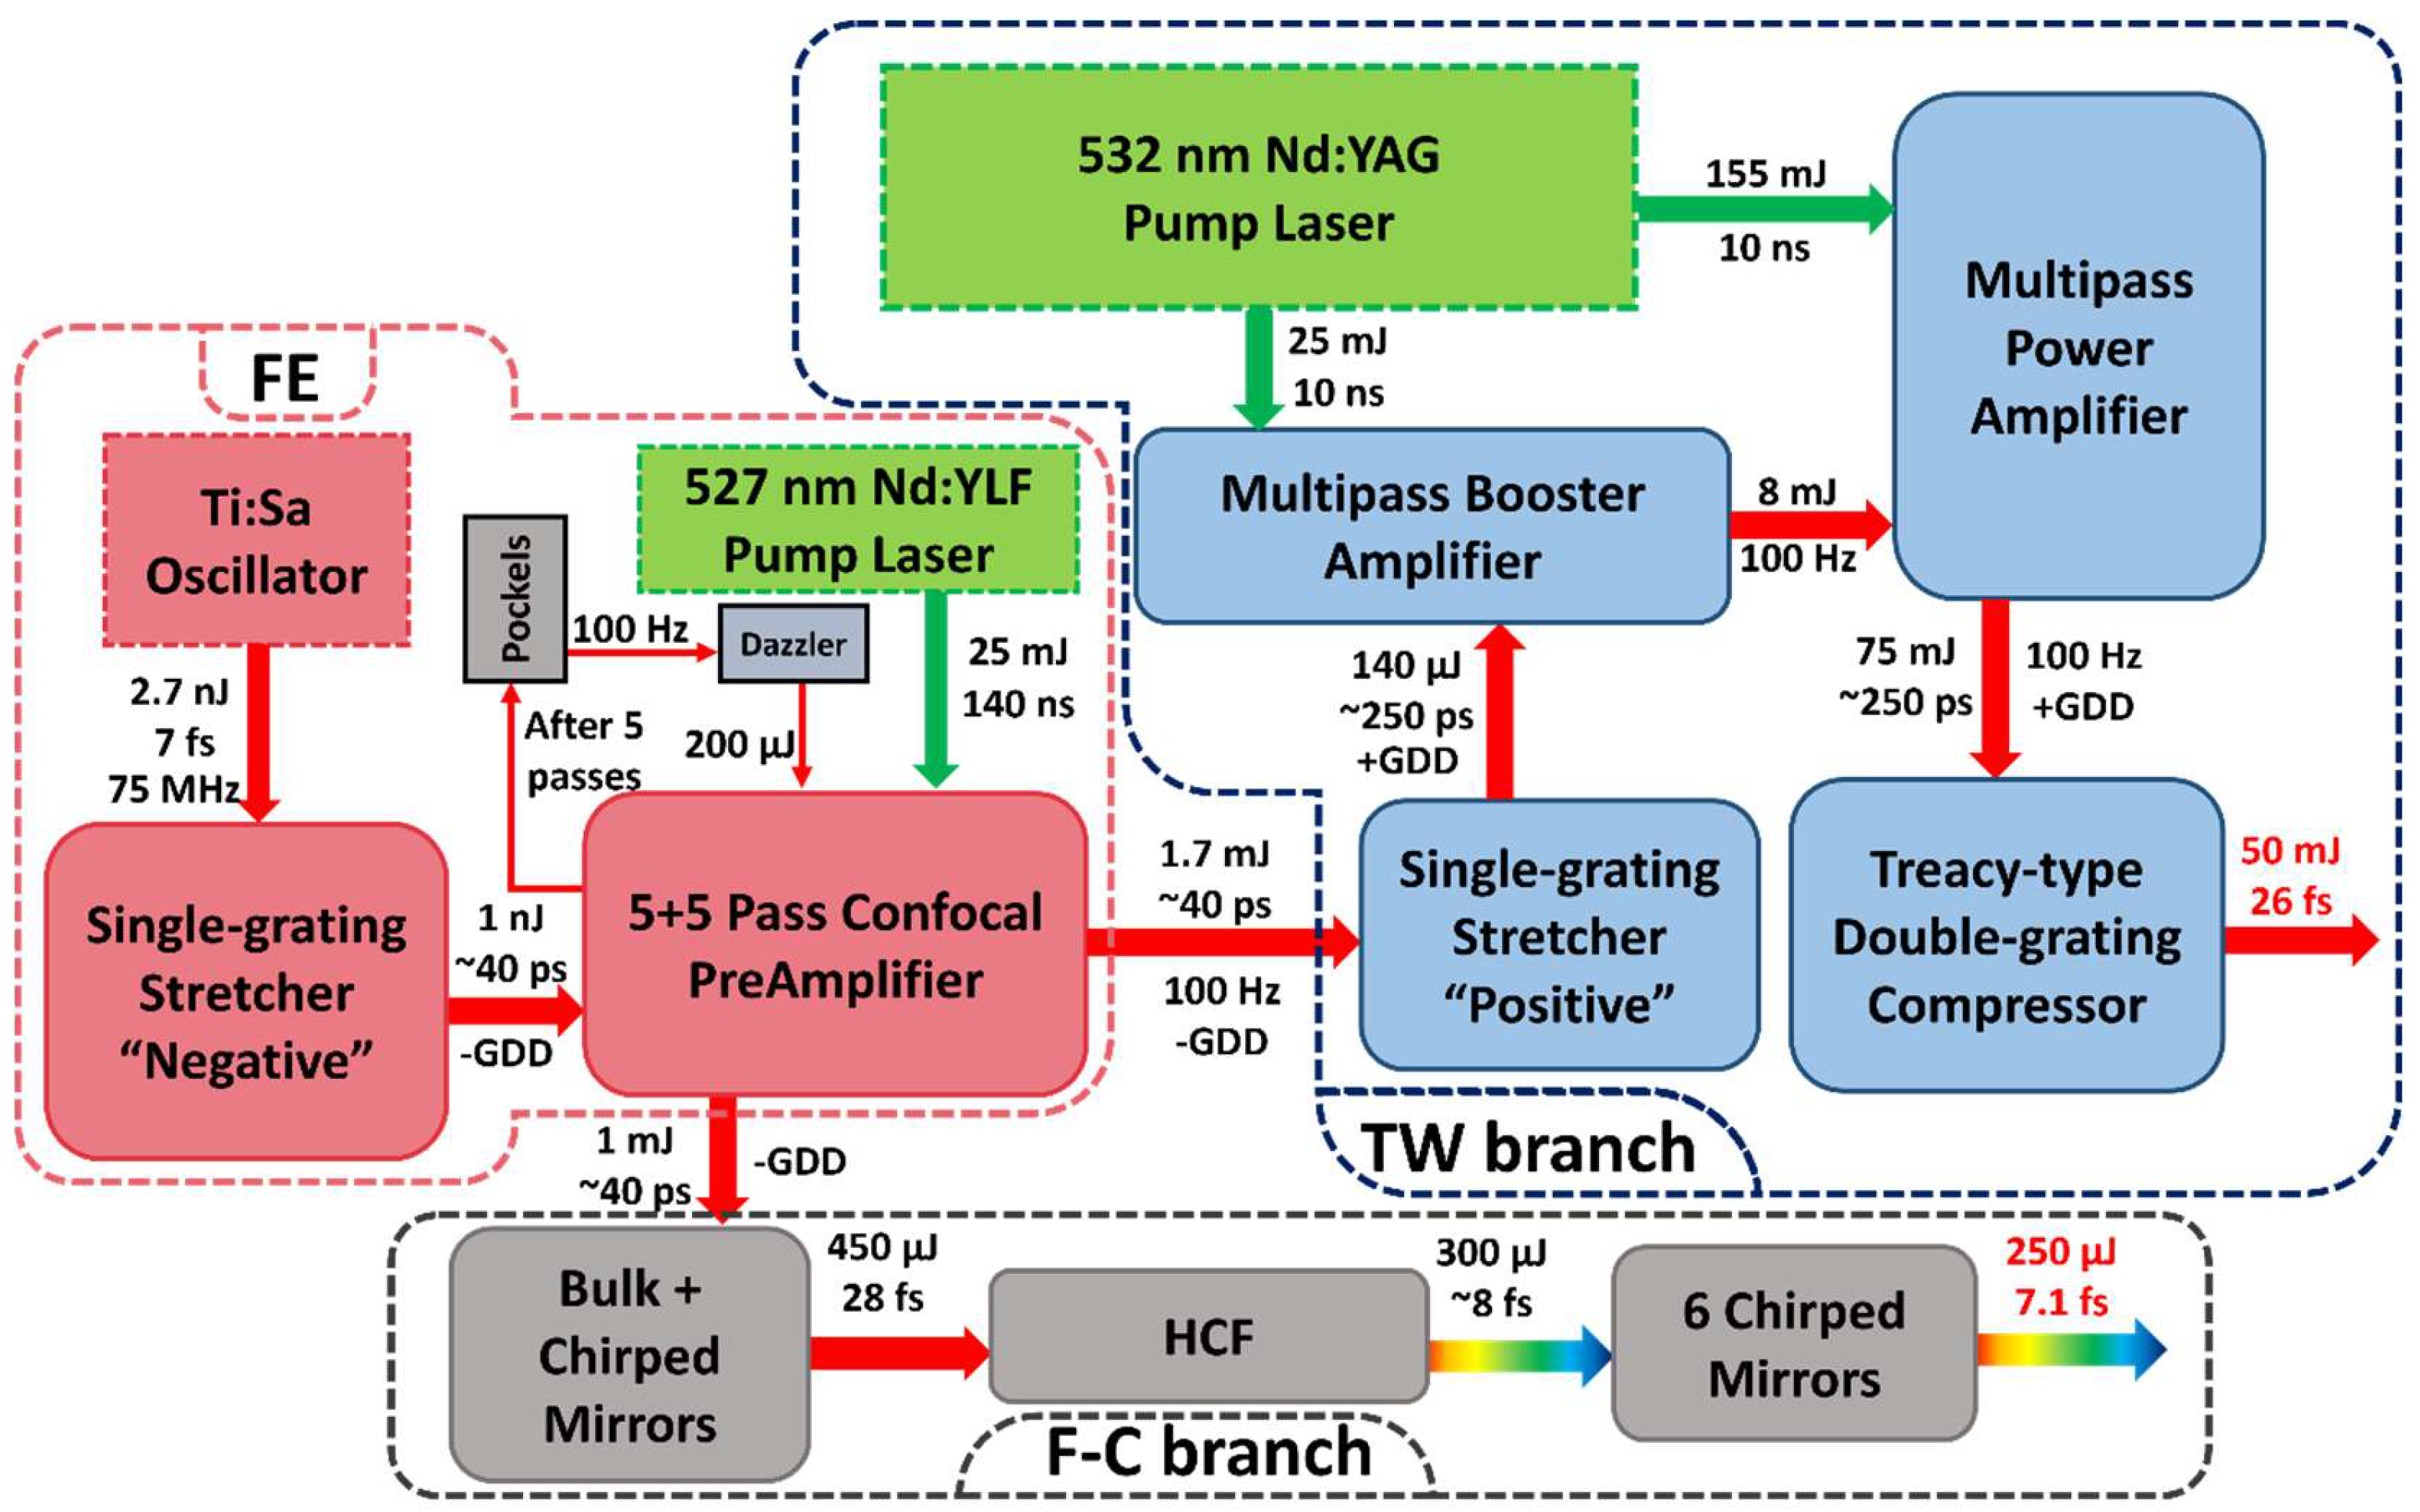
The front end consists of a Kerr-lens Mode-locked Ti:Sa oscillator, a negative stretcher, and a ten-pass preamplifier (
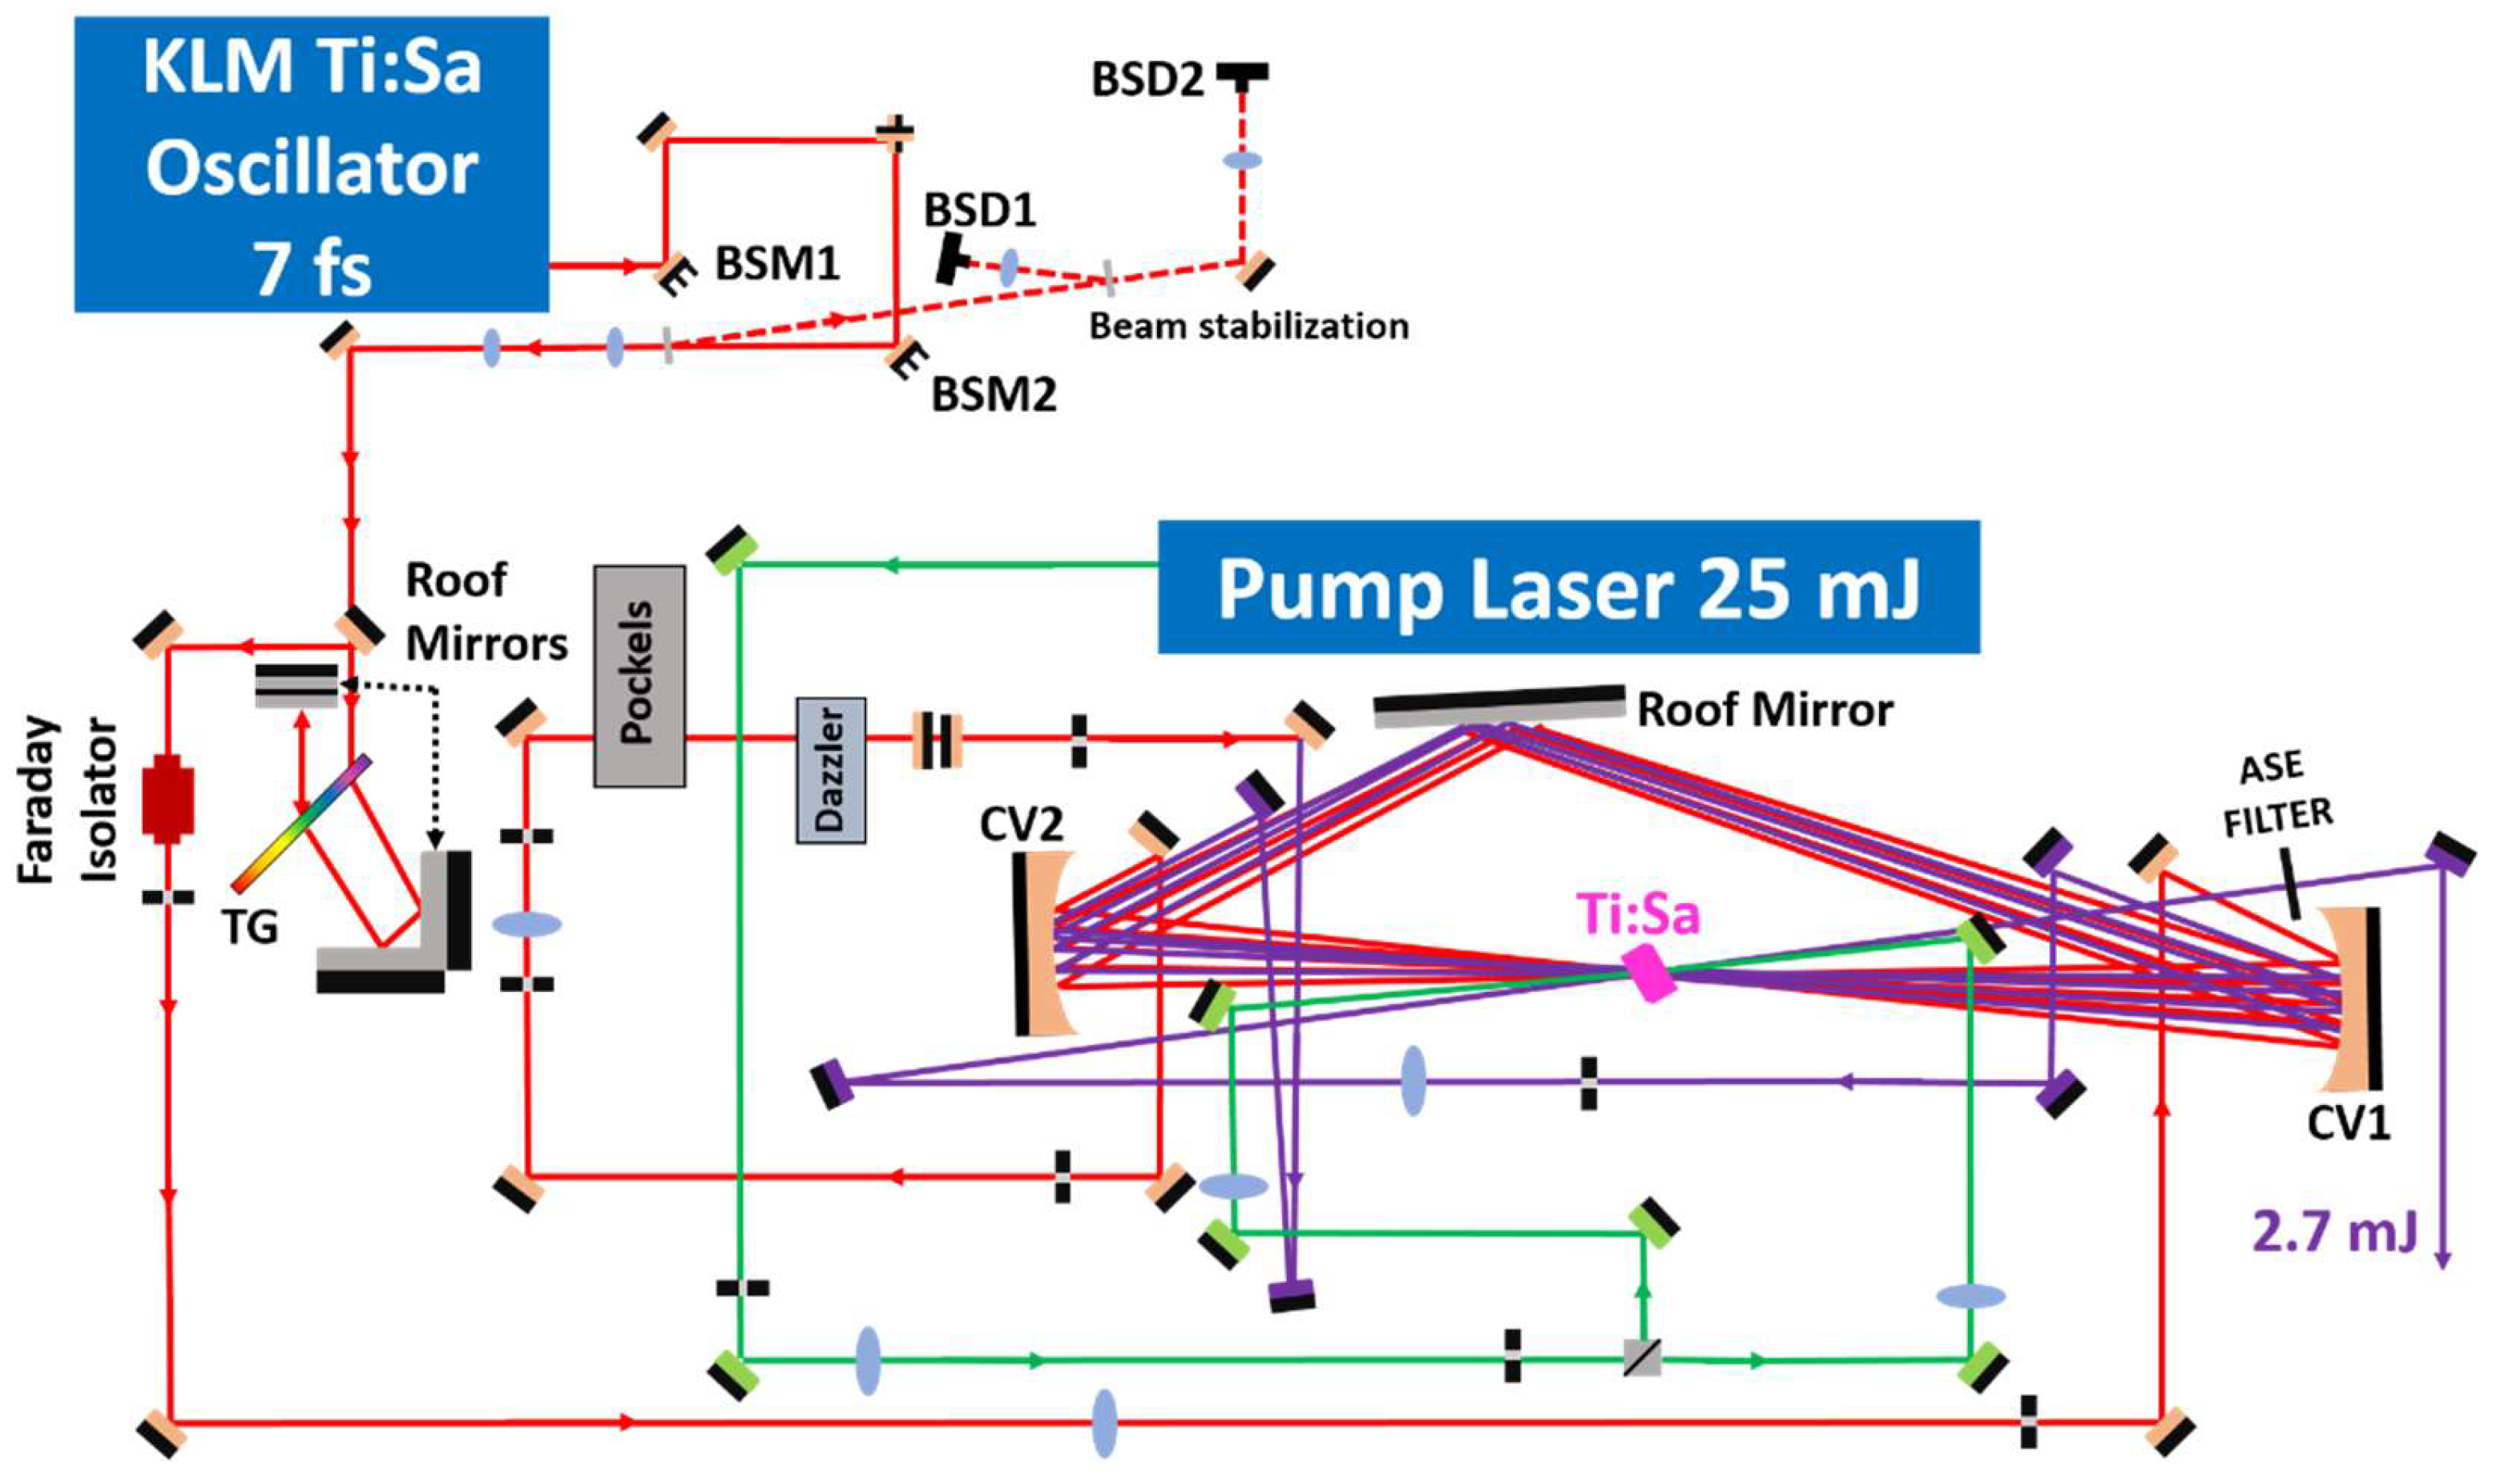
Figure 2). The ultrabroadband pulses are generated by a 7 fs Venteon Pulse One oscillator. The beam, actively stabilized for beam pointing (
Figure 3), is steered into a transmission grating version of a single-grating folded stretcher. The throughput of the stretcher is about 33%. The negatively stretched, ~40 ps pulses are sent to the multipass Ti:Sapphire amplifier pumped by ~25 mJ, 140 ns, frequency-doubled pulses from a Photonics Industries Nd:YLF diode-pumped laser.
There are two further tasks that the FE needs to fulfil. First, it must pick the pulses from the 75 MHz pulse at the pump laser’s repetition rate. Second, it must ensure proper dispersion control of the pulses prior to compression. The standard method for the latter is the use of an AOPDF (Dazzler). In a usual architecture, the AOPDF is positioned before the (first) amplifier stage. However, the throughput of an AOPDF is in the range of a few ten percent. Hence, the energy of the pulses entering the first pass of the amplifier would be in the range of hundreds of pJ, resulting in high amplified spontaneous emission (ASE) content of amplification. In many cases this requires an additional pre-amplifier with a few tens of gain.
In our design, we overcome this situation using a confocal (f=500 mm), ring-type multipass amplifier with two layers (
Figure 3). In the five passes of the upper layer, (red line) the full train of pulses is amplified to about 1.1 mJ. Then the pulses are sent through the AOPDF, and a telescope to re-adjust the beam mode to the amplifier. The shaped pulses are amplified to 2.7 mJ in the next five passes of the bottom layer (violet line), resulting in a blue-shifted spectrum with a bandwidth over 50nm and an energy stability better than 0.45% (RMS).
The additional Pockels cell, inserted just before the AOPDF, has an “open” time window, only a few ns. This, compared to the 140 ns long pump pulses, prevents the evolution of parasitic laser modes in the confocal multipass amplifier and further enhances the (ASE) temporal contrast.
4. Few-Cycle Arm
The few-cycle arm of the system is the unit that shortens the several ps, mJ level pulses below three optical cycles (
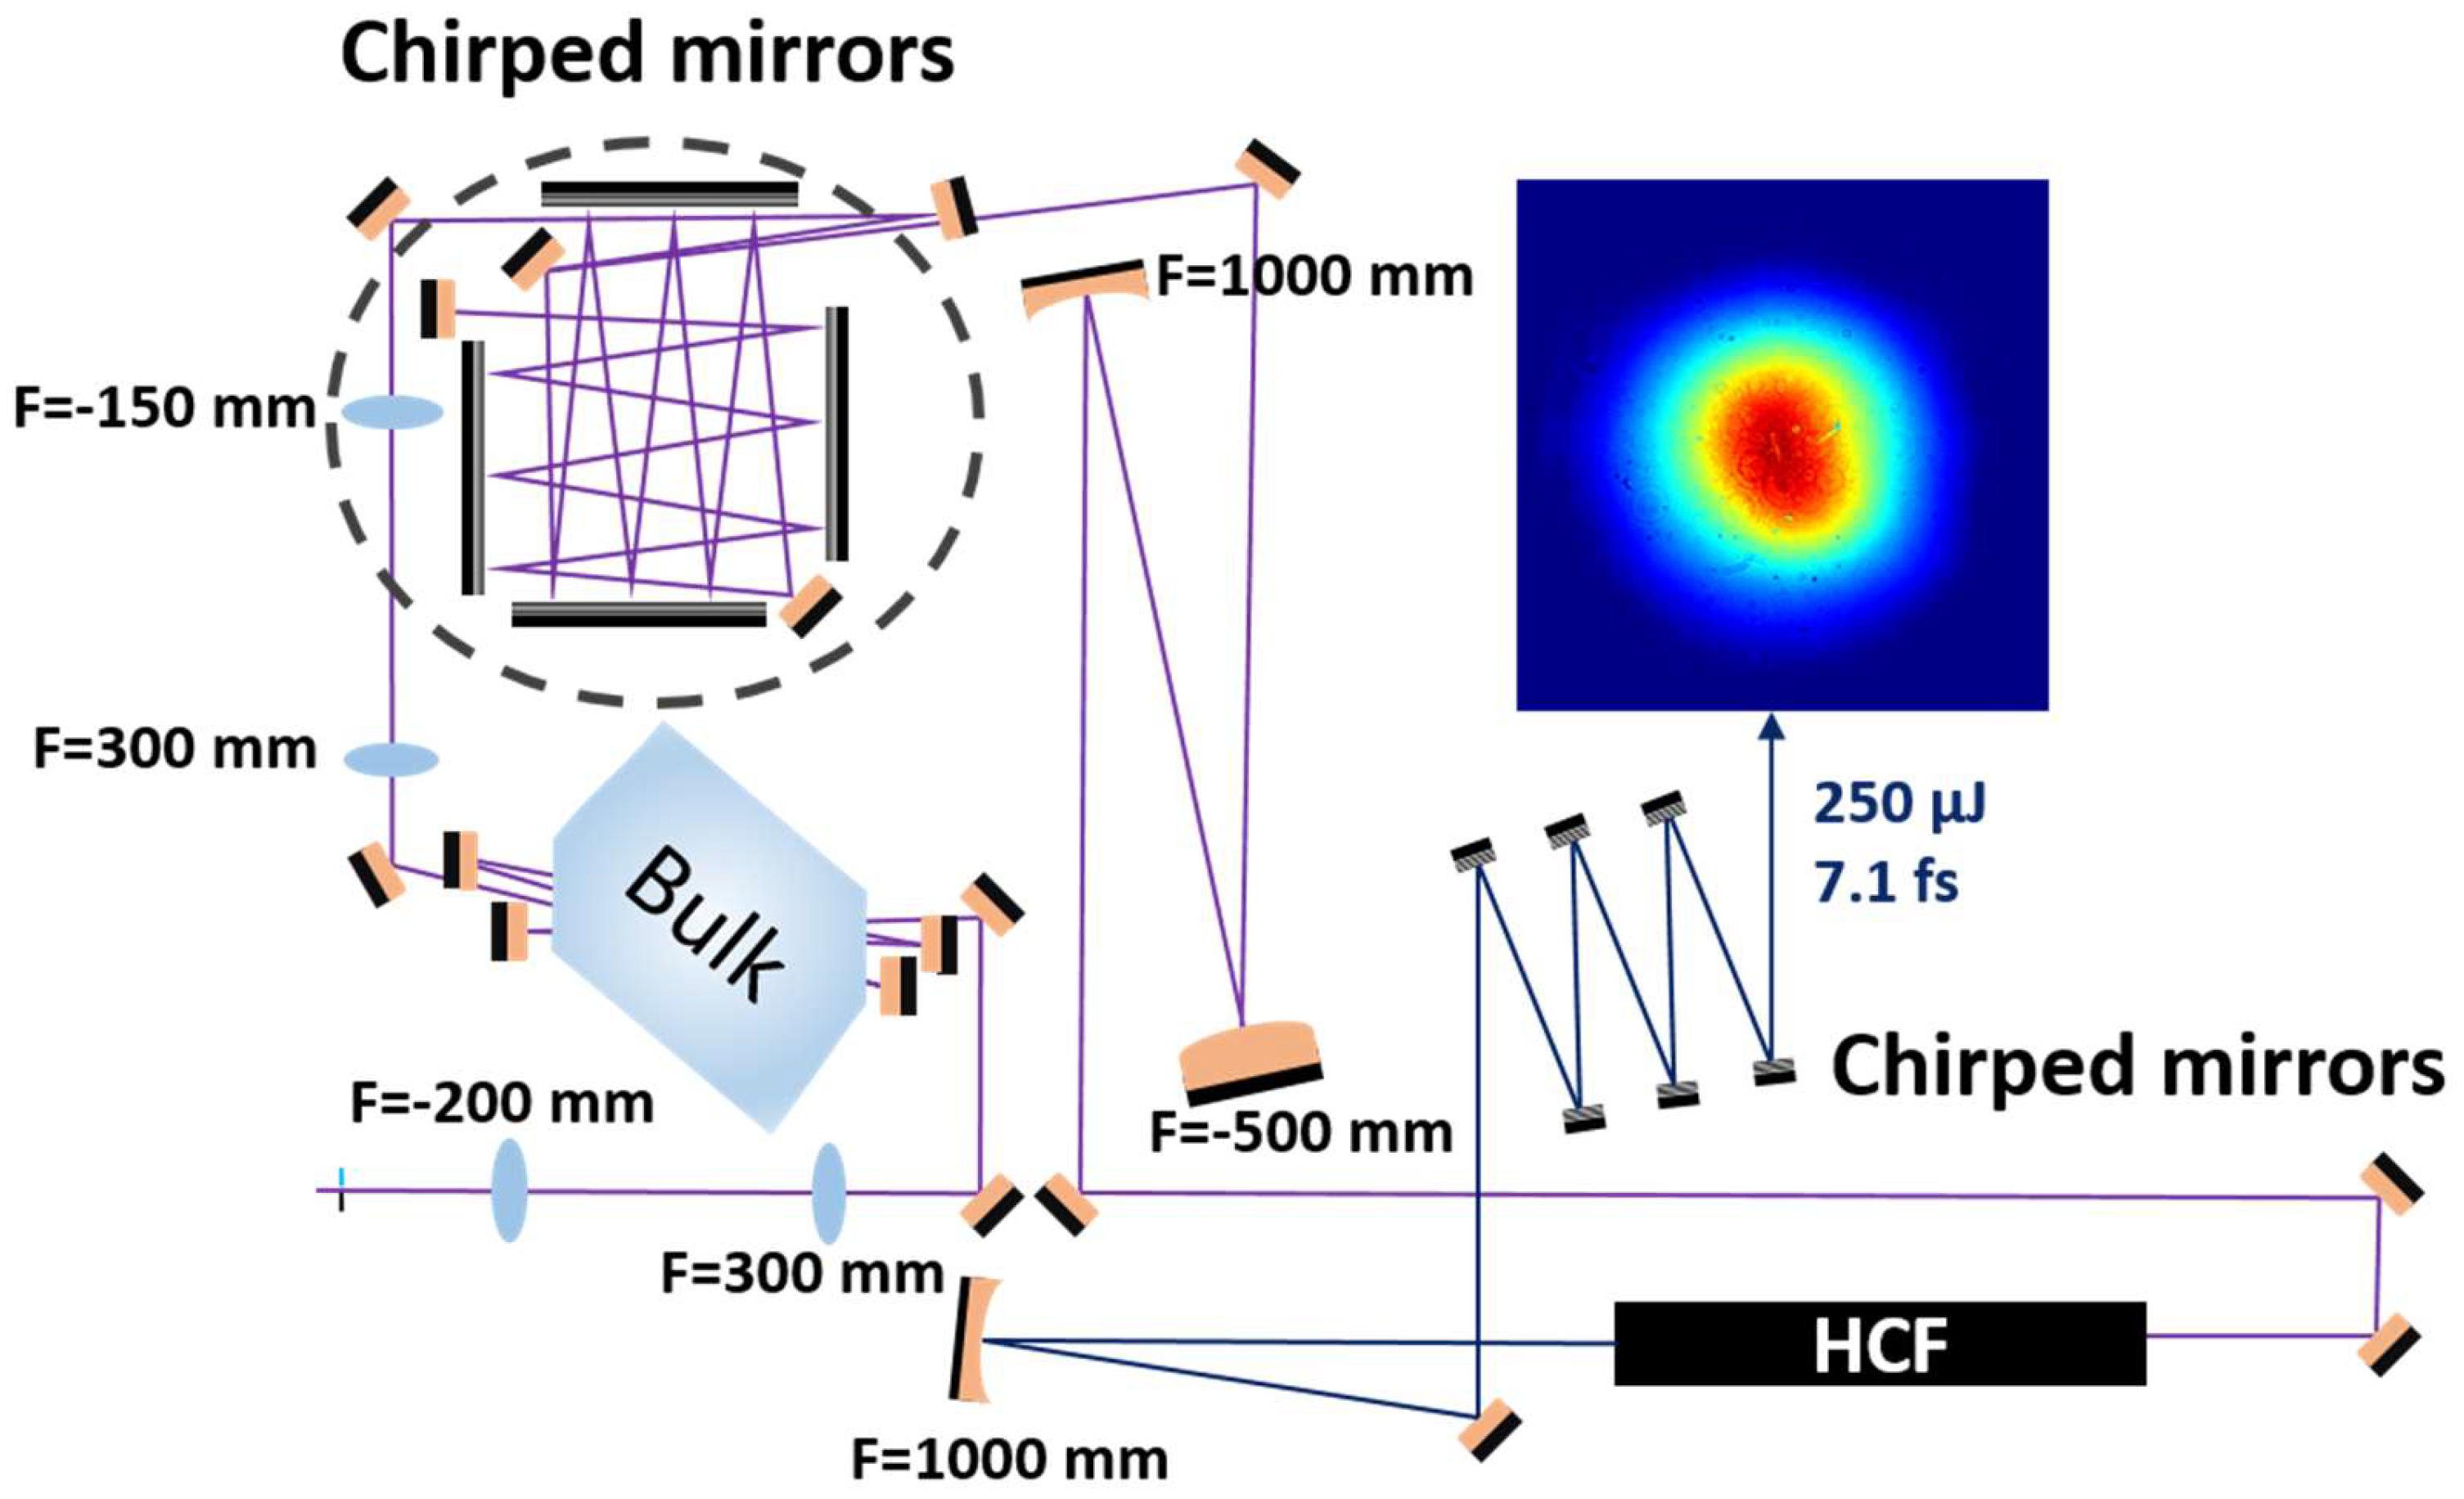
Figure 2). Part of the stretched pulses from the front end is compressed in BK7 bulk (
Figure 4) followed by 24 reflections on large aperture chirped mirrors (CM1512). For spectral broadening, the 28.1 fs pulses (
Figure 5) with 450 µJ energy were steered through a 1m long, 250 µm core diameter hollow core fiber (HCF) [
16], filled with 1.5 bar of static Ar gas. The transmission of the HCF was better than 65%. The optimal broadening was found by shaping the spectrum and fine-tuning the higher order spectral phase of the pulses with the Dazzler. After collimation, the pulses were compressed by three pairs of double-angle chirped mirrors (PC70), providing a pulse duration of 7.1 fs (measured by a SPHERE d-cycle R XR) and energy of 250 µJ, respectively. (
Figure 5). The beam profile was nearly ideal Gaussian (see insert of
Figure 4) with aberration-free caustic having a size of 3.36 mm x 2.95 mm (FWHM). The pointing stability of the compressed beam was ±34 μrad.
5. The TW Laser
5.1. Pulse Stretcher
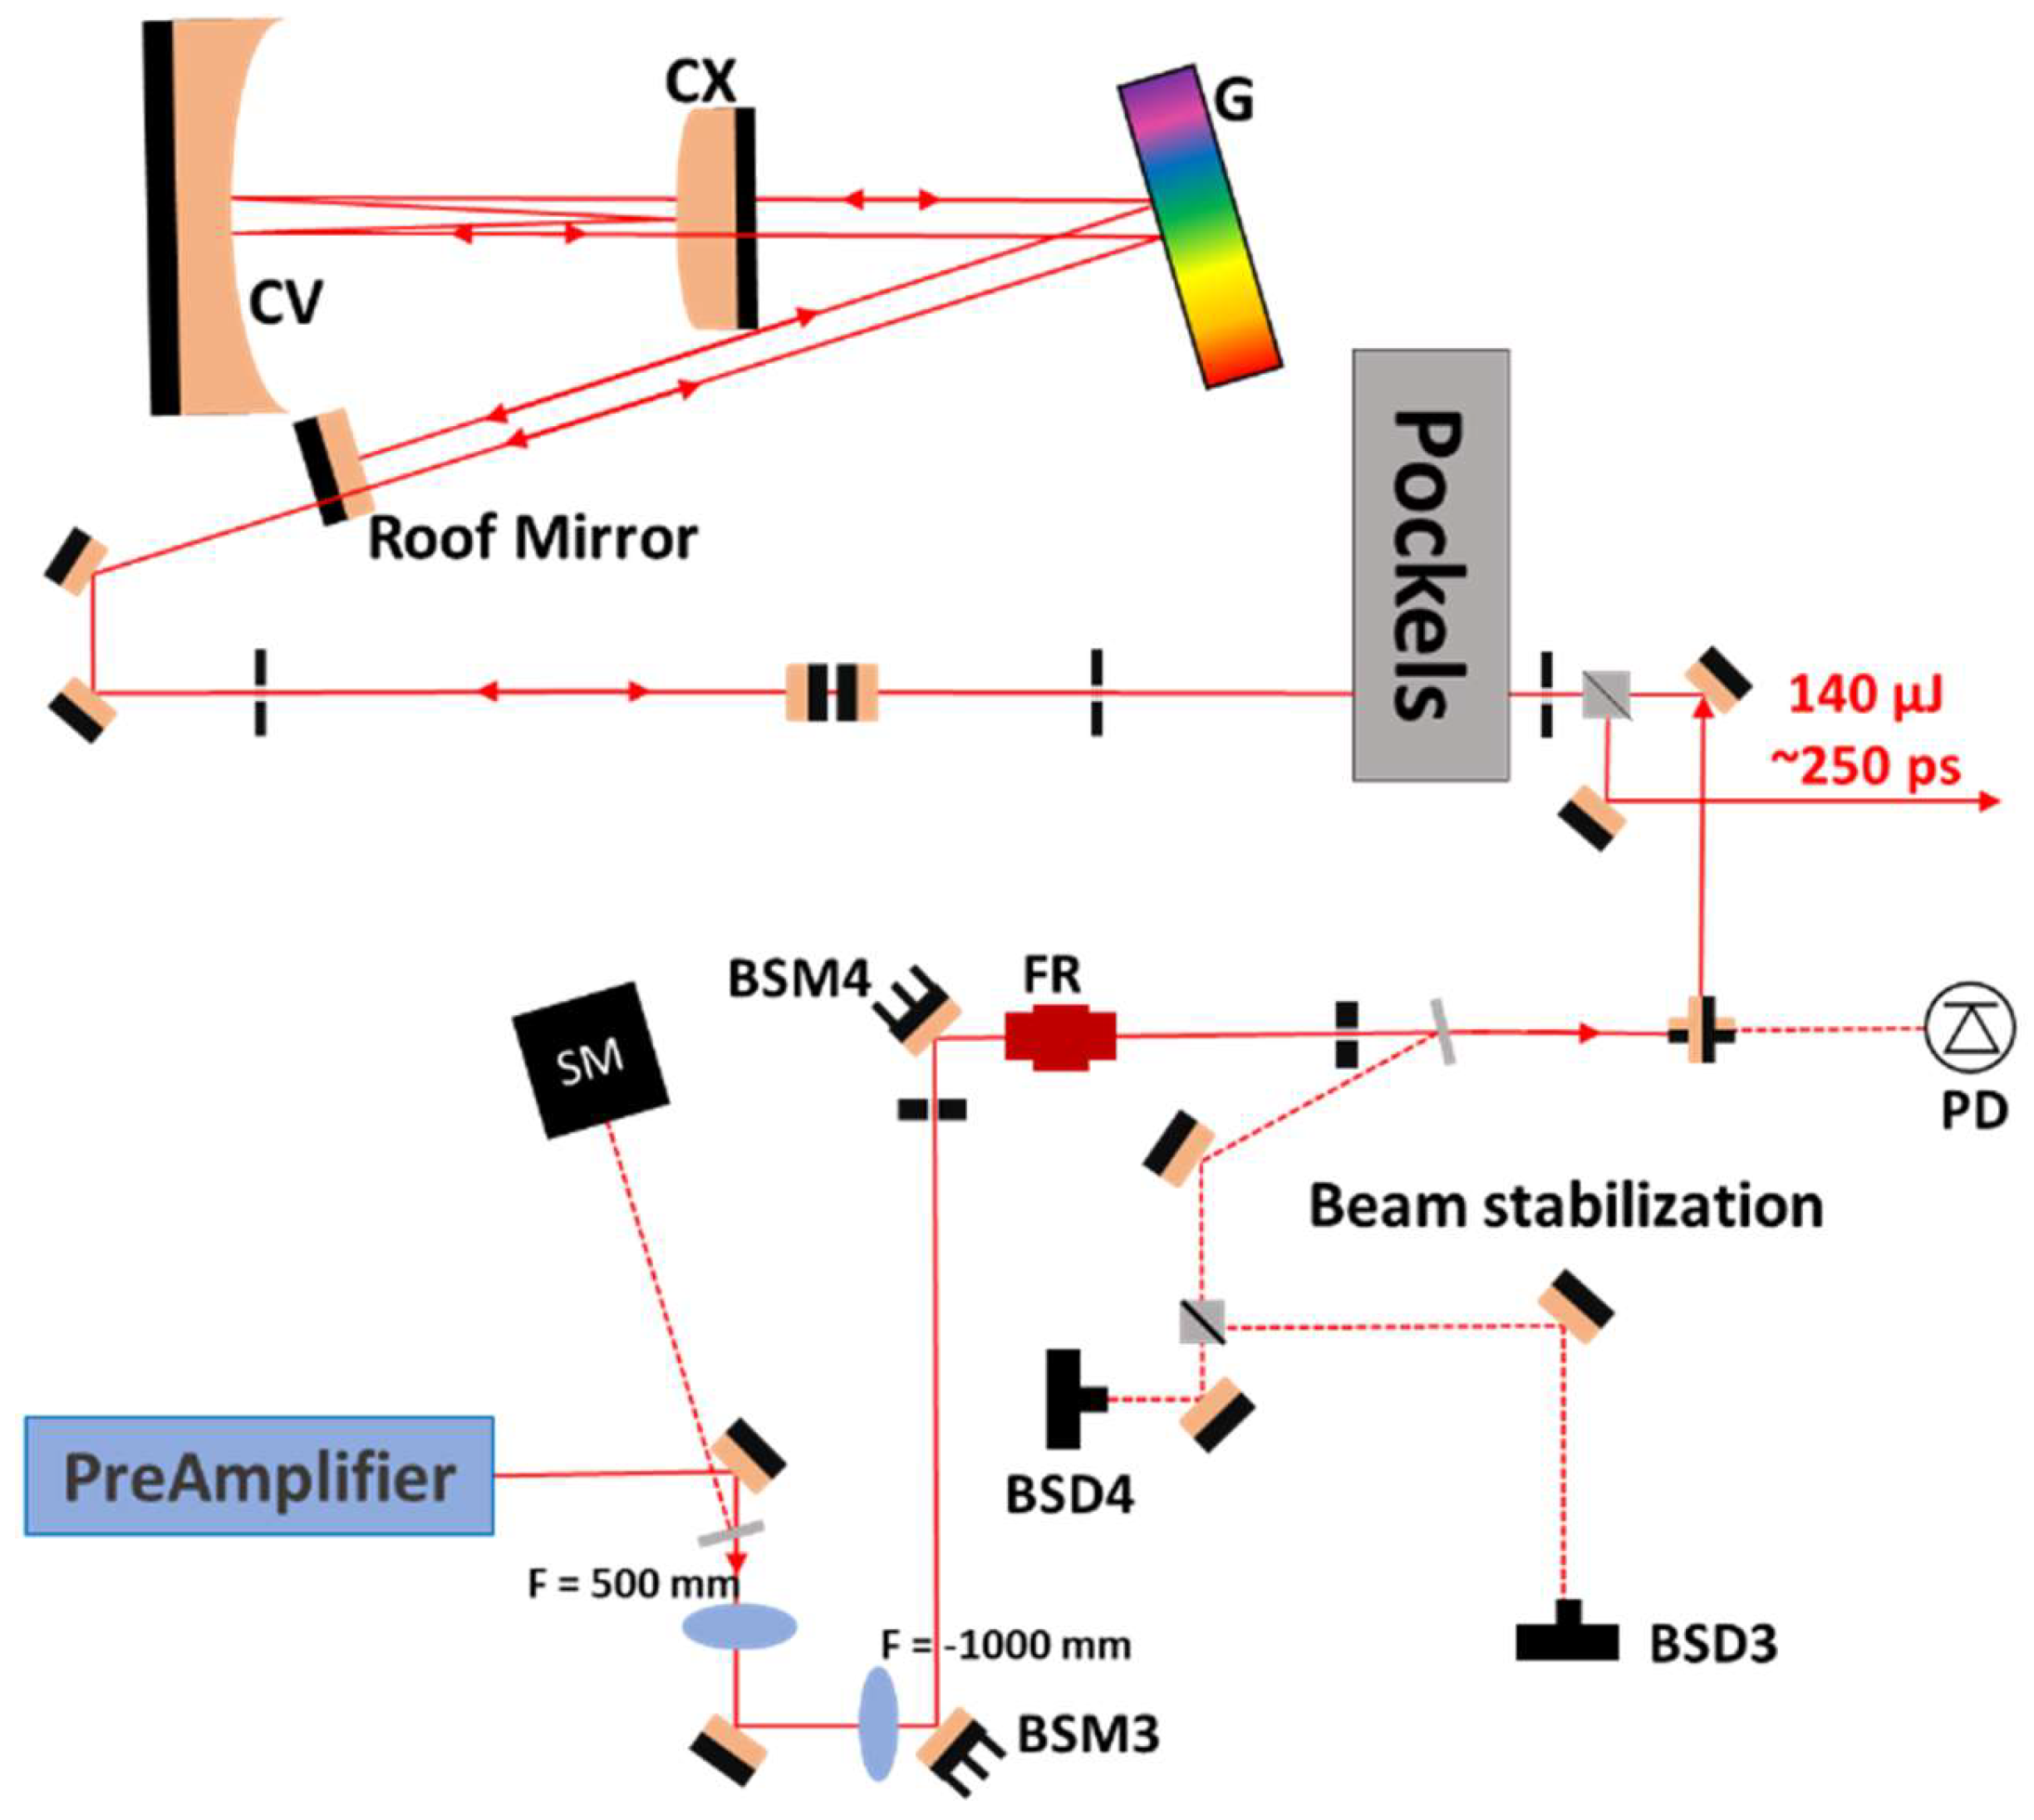
The other part of the FE laser beam is expanded, and the pulses are positively stretched in a positive chirp pulse compressor resembling an Öffner-type one (
Figure 6) [
17]. The groove density of the blazed grating is 1200 mm
-1, while the spherical mirrors have a focal length of –250 mm and +500 mm. In our case, the incoming and stretched pulses are separated not in space, as common in such cases, but by polarization with the help of a Pockels cell at the input of the assembly. The major advantage of this arrangement is that the alignment of the grating stretcher is more accurate, as the incoming and leaving beams follow the same optical path and are equal in size and divergence. To avoid leakage from the polarizator to the FE, a Faraday optical isolator (FR) is used before the Pockels cell. The overall transmission of the stretcher is around 10%.
5.2. Amplifier Stages
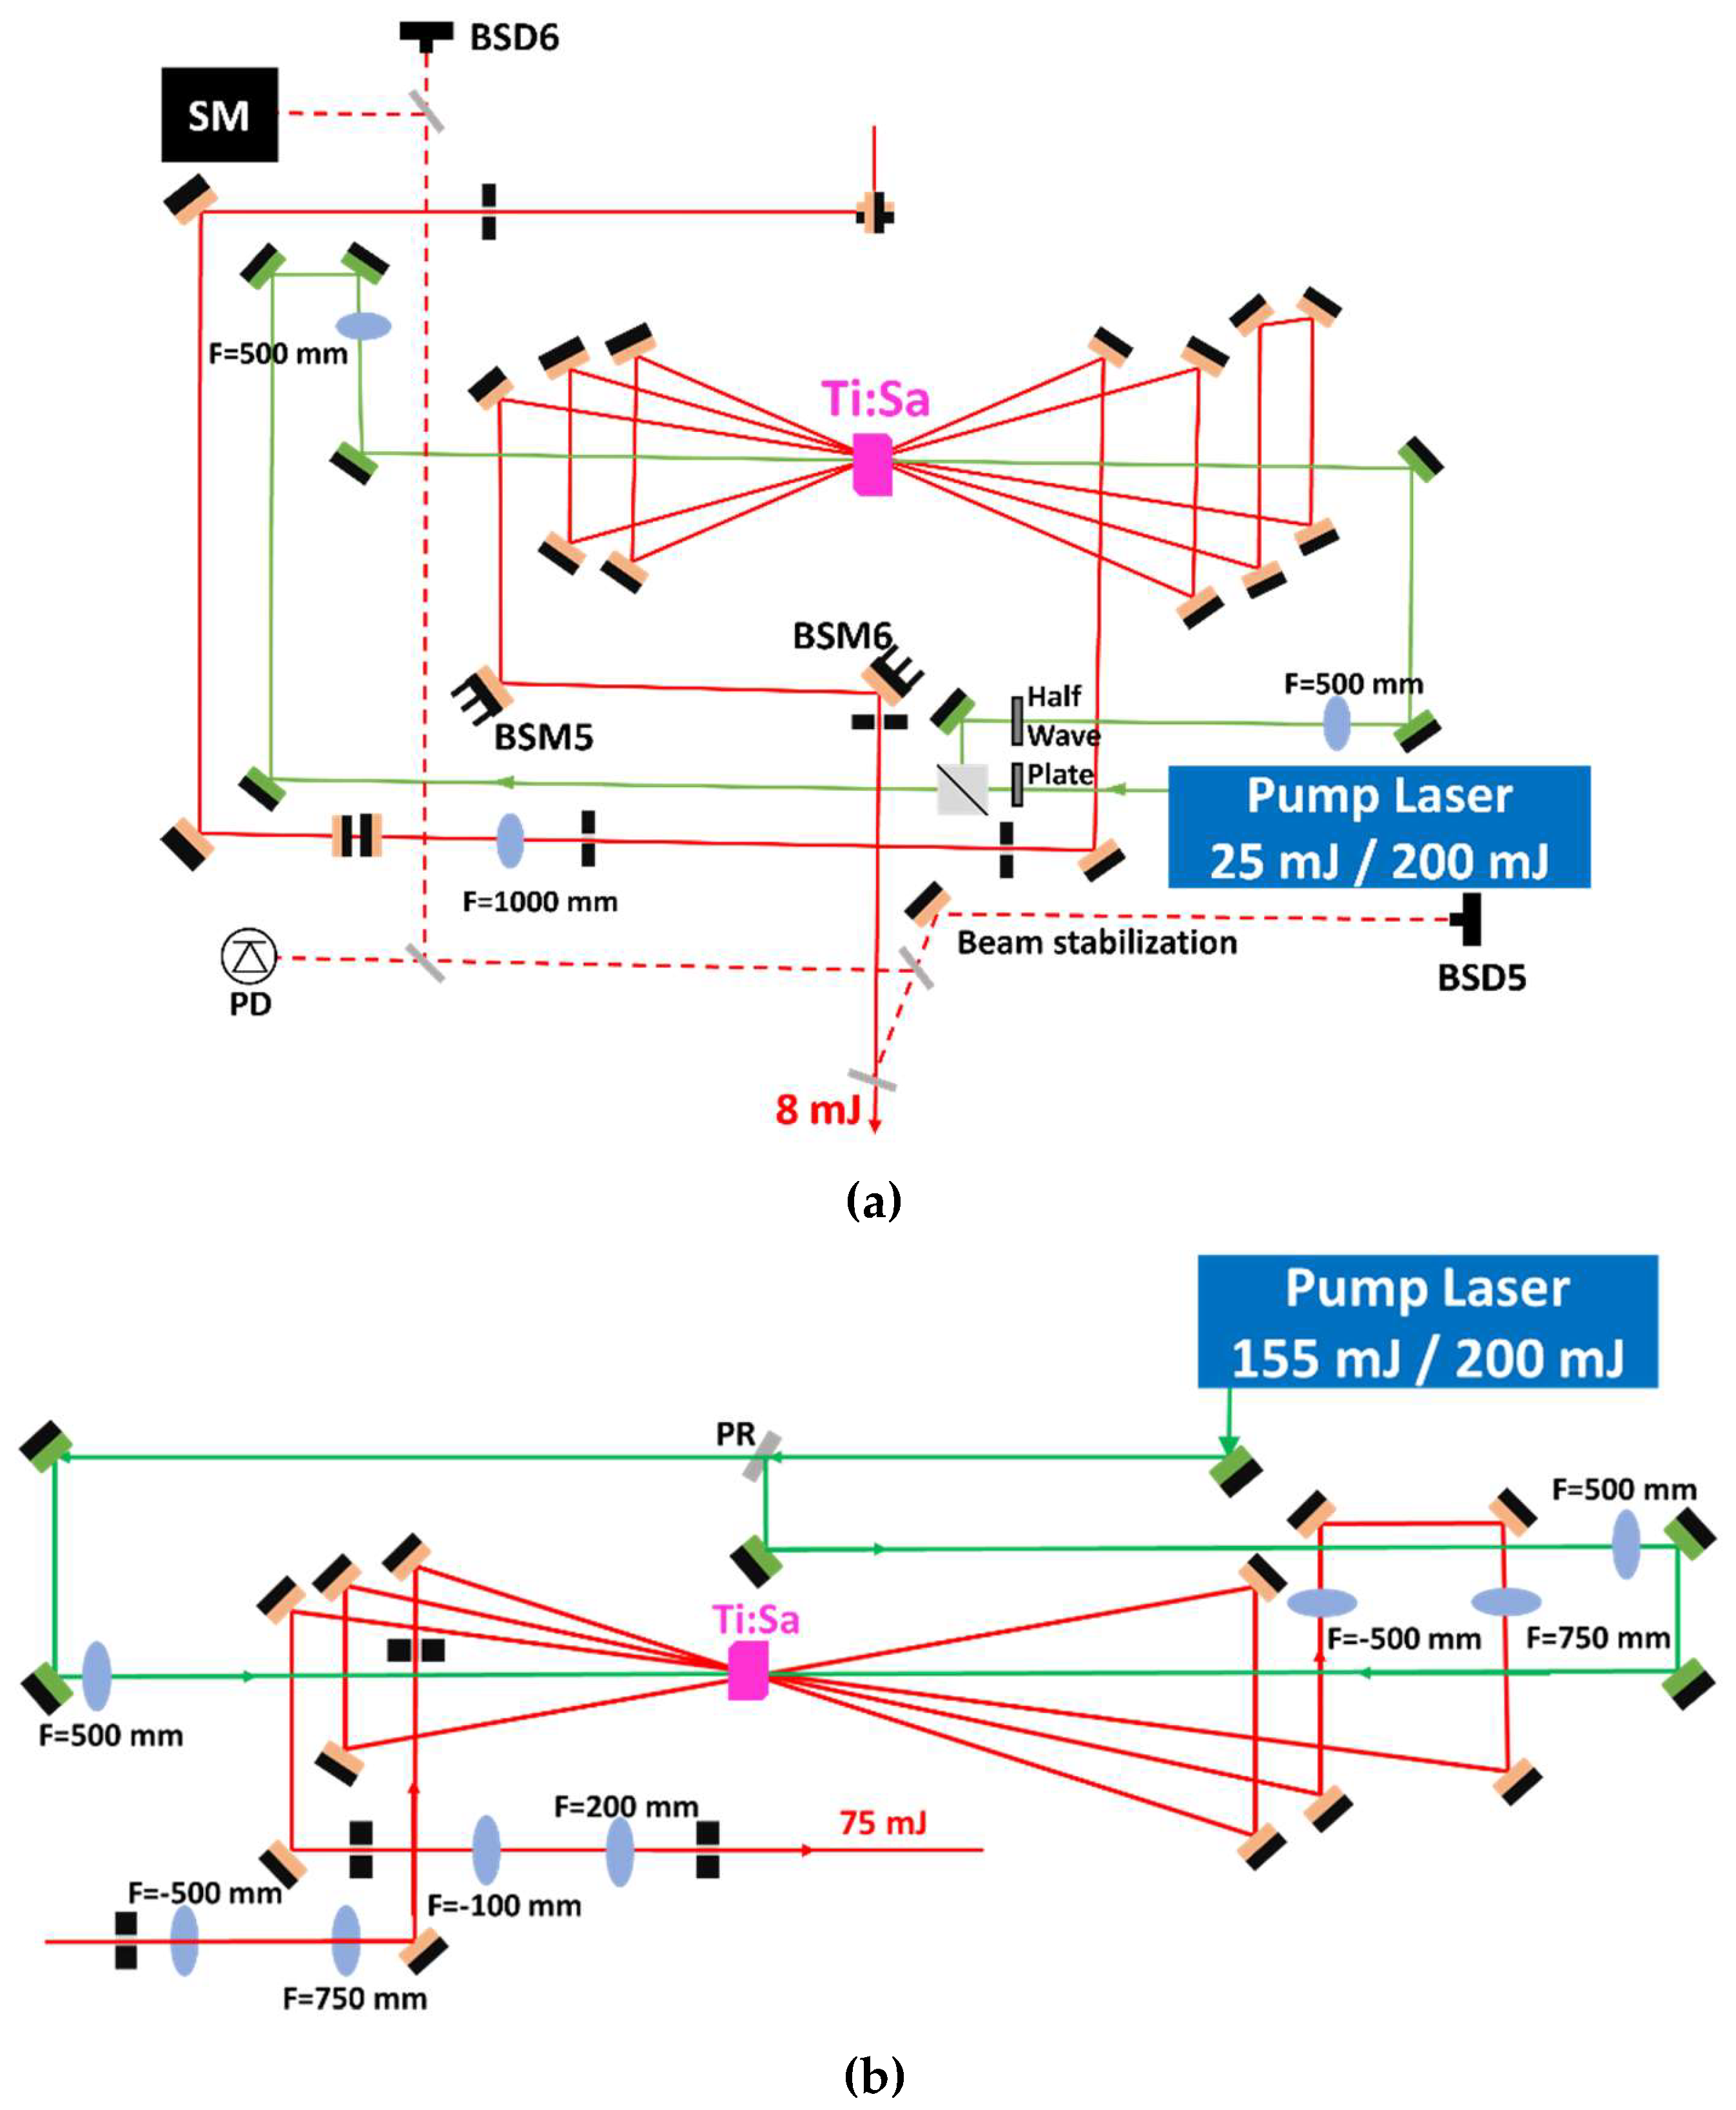
The two Ti:Sa amplifiers share the 10 ns pump pulses with an energy of 200 mJ from a Litron Plasma 450–100 diode-pumped laser. For each amplifier stage, the timing of the pump pulse from the side of the first pass seed pulse is optimized for the highest amplification, while the other pump timing from the other side is optimized for the highest overall gain. As a result, the delay between the two pump pulses is about 2 ns. This optimization method allows for the use of somewhat smaller beam sizes in the Ti:Sa crystal, hence the peak fluence on the Ti:Sa crystal is lowered, but the overall gain is maintained. The five-pass (
Figure 7a) booster amplifier (BA) increases the incoming 0.14 mJ energy to 8 mJ, with an energy stability of 1.7% (RMS). The four-pass (
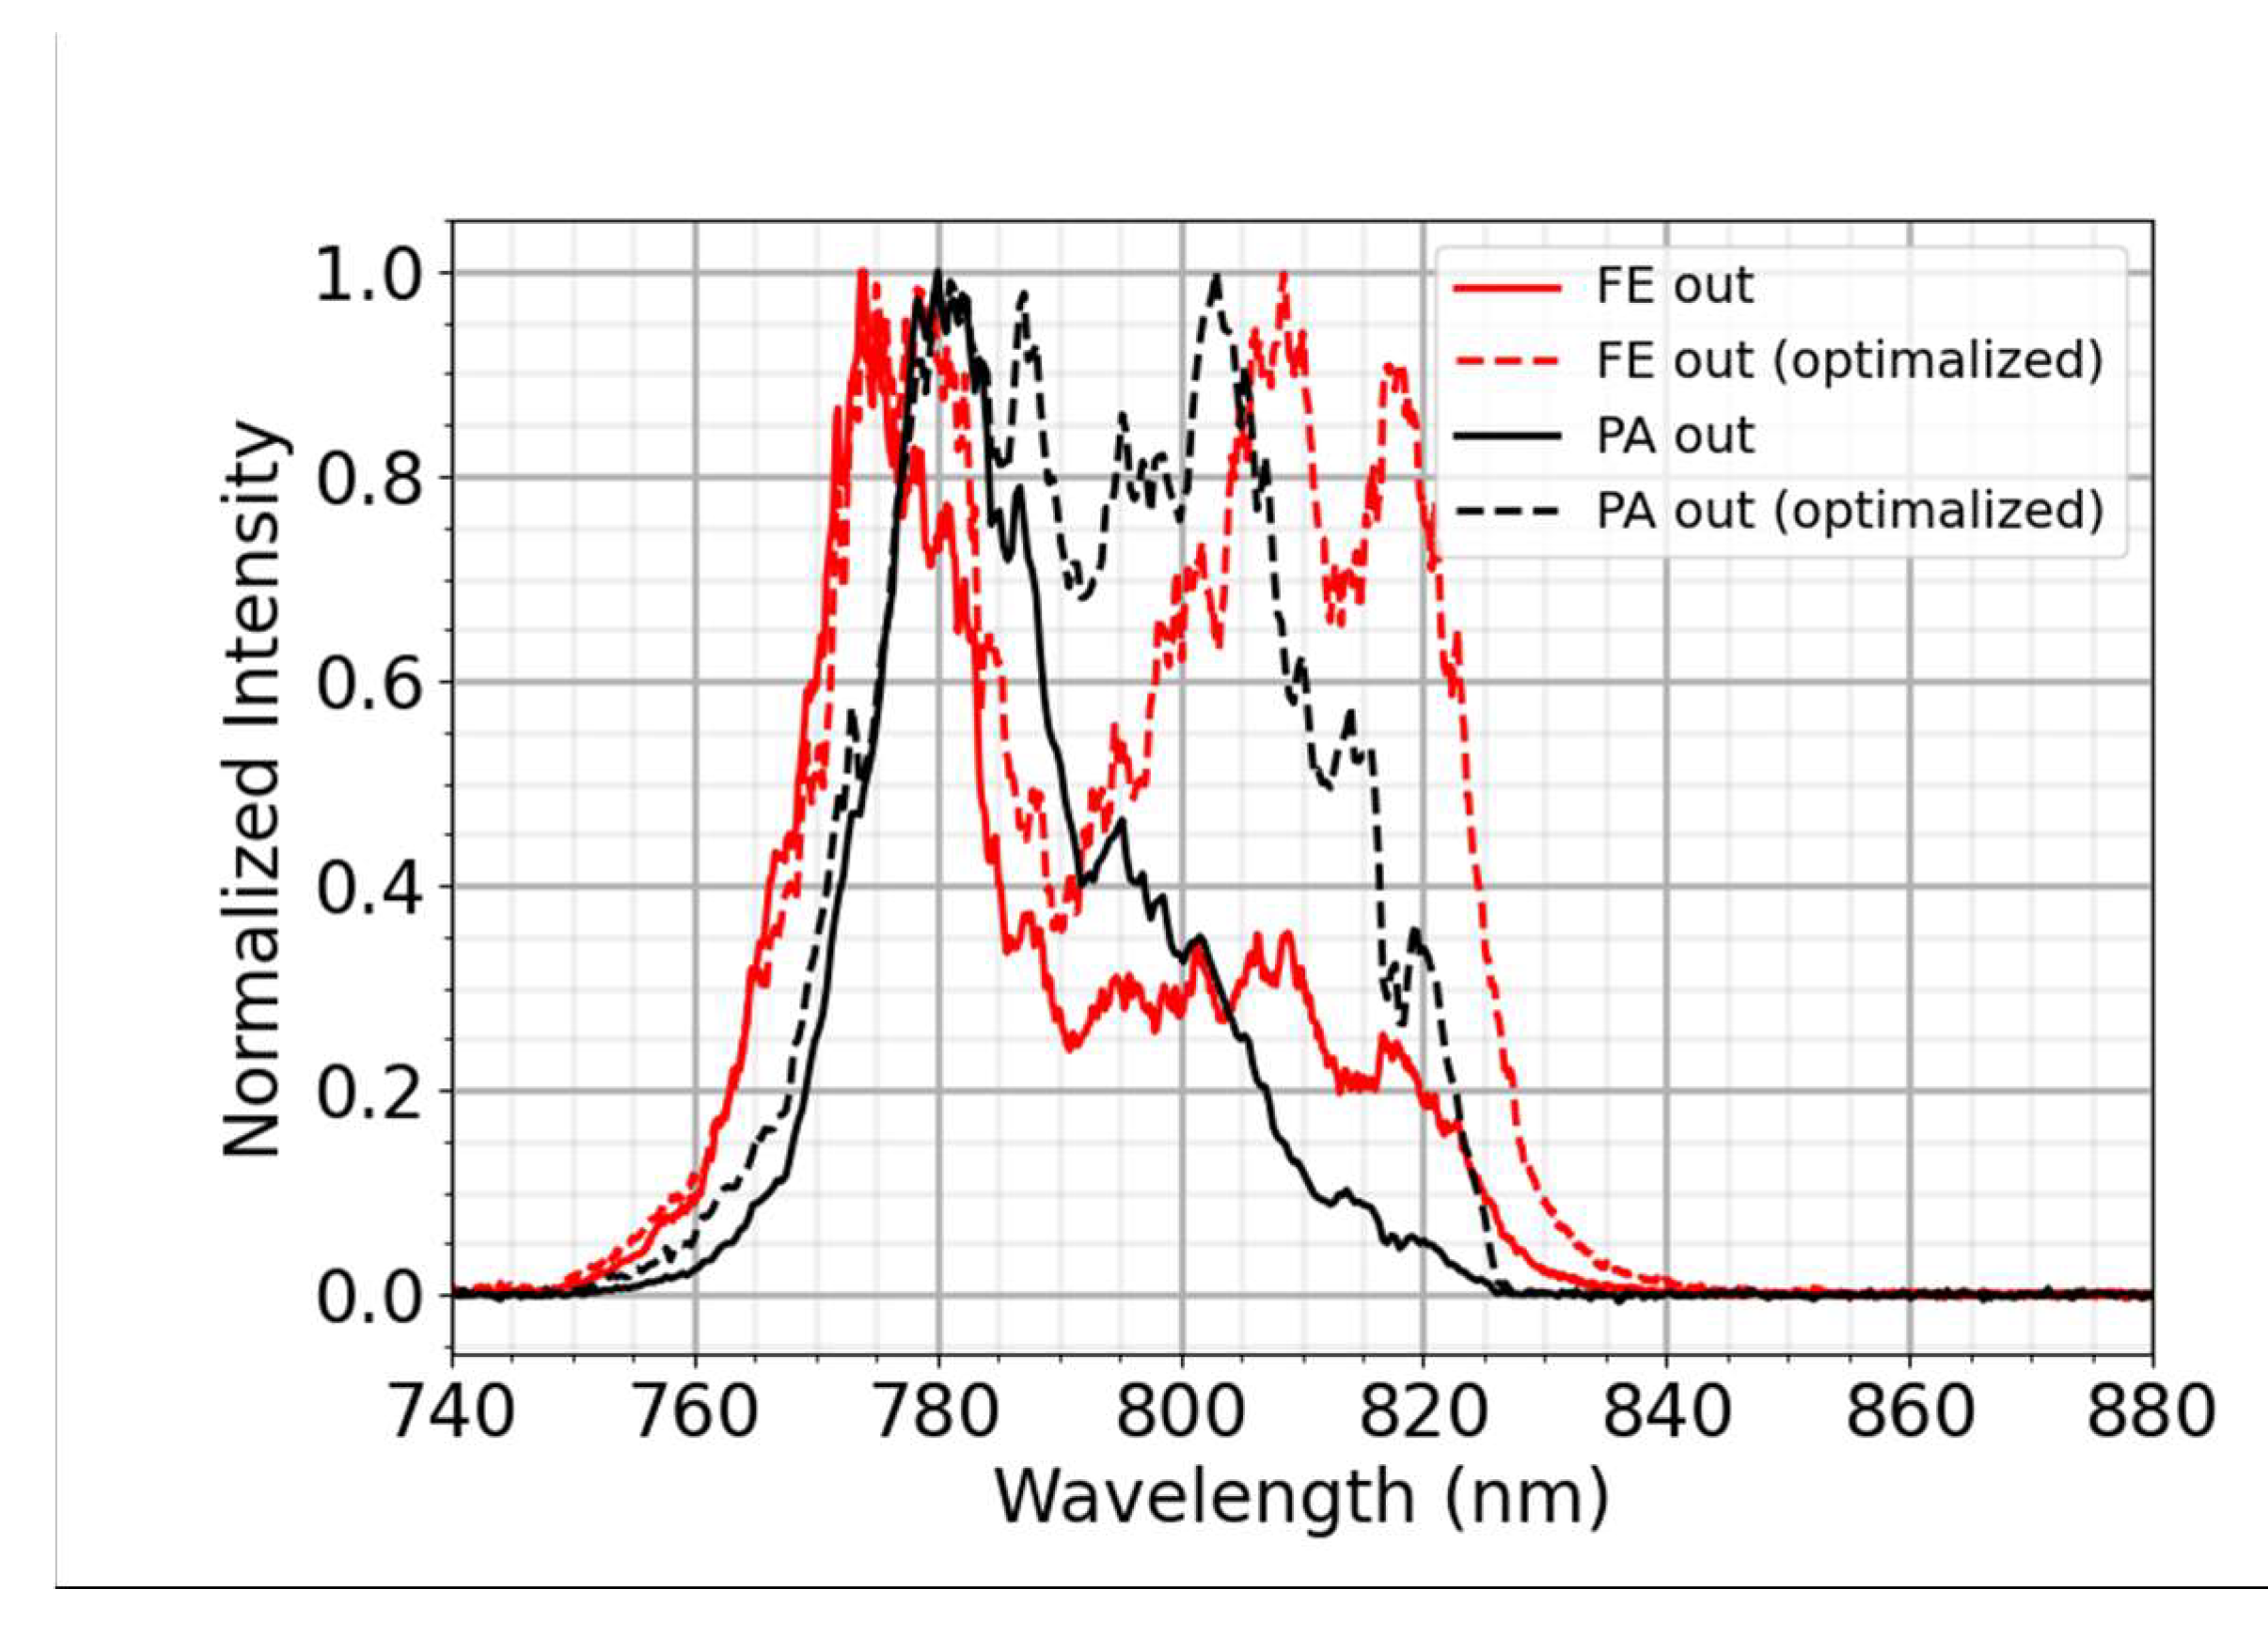
Figure 7b) power amplifier (PA) provides a gain of almost 25, resulting in a pulse energy of 75 mJ. Due to the saturated amplification of the initial blue shaped spectrum, the outcoming spectral shape is red-shifted (
Figure 8).
We also simulated the operation of the amplifier stages based on the Frantz–Nodvik model [
4,
18] adapted for broadband stretched pulses [
19,
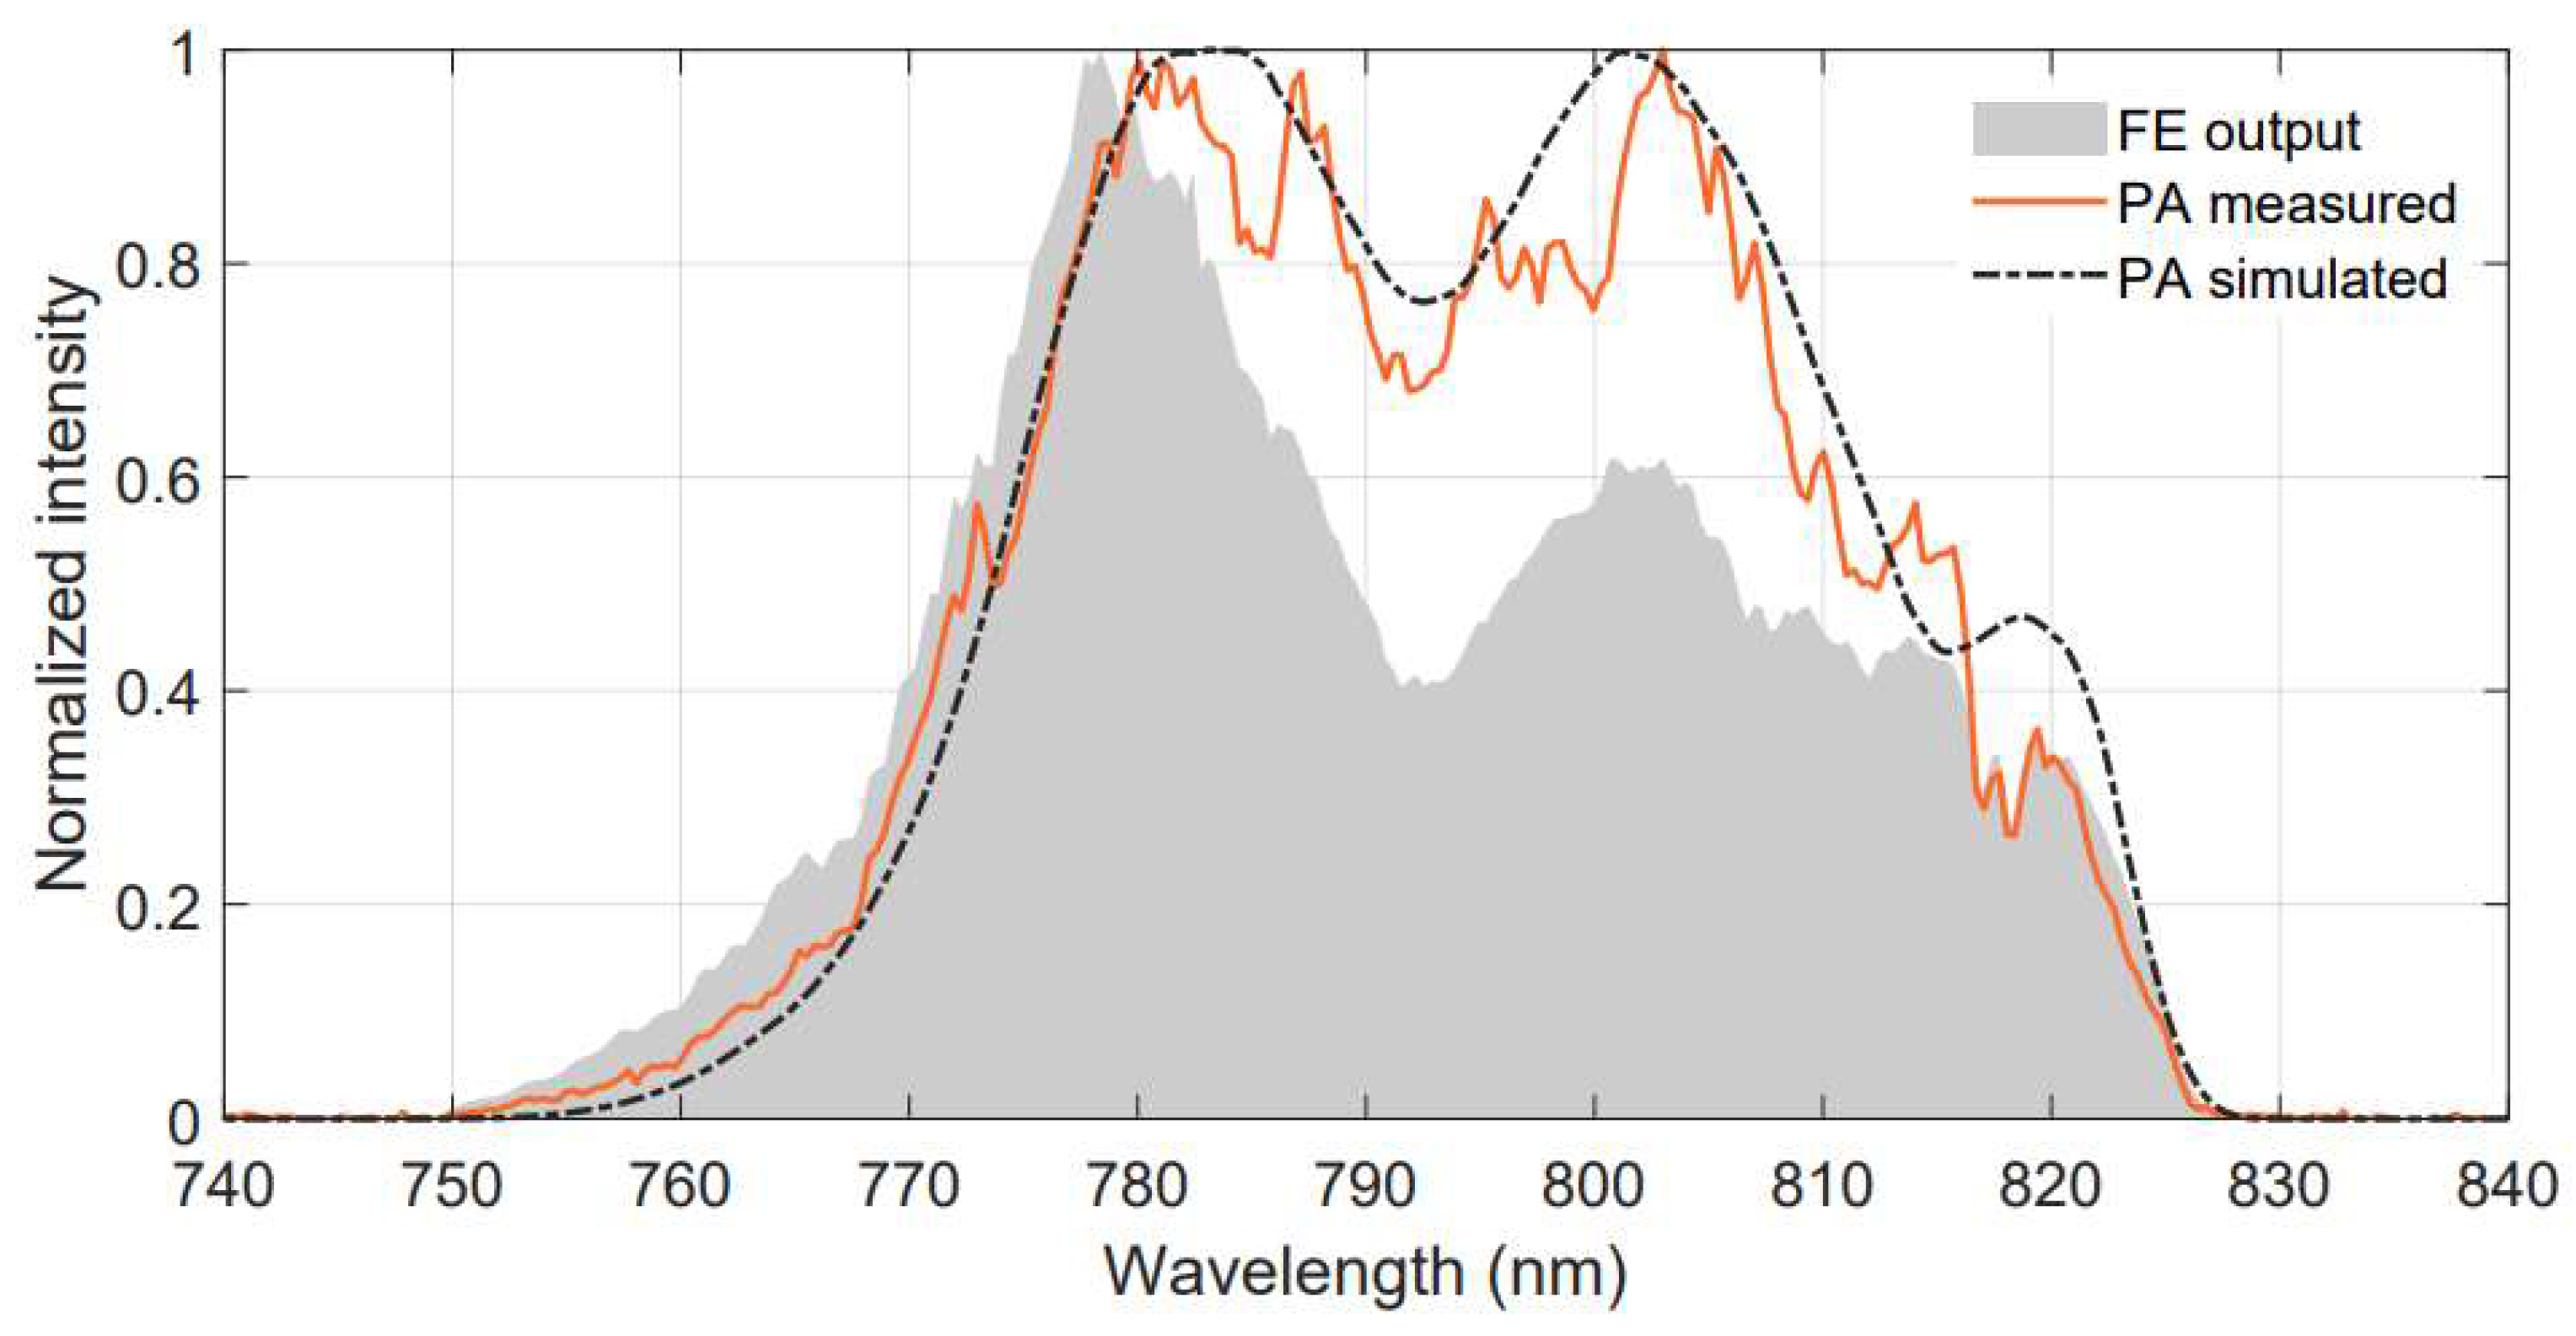
20] and we took into account the spectral dependence of the emission cross-section of Ti:Sa. The measured pump and seed pulse properties (energy, beams size, spectra) were used as input parameters. In the amplifier model, the spectral evolution was further affected by the spectral phase modulation of the seed pulses, and the spectral reflectance of the amplifier optics. The mode size of the pump and seed pulses was set according to the experimental conditions. By tuning the spatial overlap of the seed and the pump in the Ti:Sa crystal, the effective pump fluence was varied according to the experimentally observed output of each stage. We accurately reproduced both the amplified spectra and the pulse energies at the output of both the BA and PA stages with 8 mJ and 72.5 mJ output energies, respectively (
Figure 9, PA measured and PA simulated). Due to the positive temporal stretch, the initially blue-shaped spectrum shifted towards the longer wavelengths, whereas the red side of the spectrum increased, in line with the expectation under saturated amplification.
The amplified output pulses were further broadened introducing a spectral dip into the spectrum by the Dazzler in the FE, resulting in a spectral shape close to Super-Gaussian. With such a spectrally pre-shaped input pulse to the BA, the simulated amplified spectrum agrees well with the measured one. This shows not only the power of the simulation model, but also provides a possibility to find the optimum pre-shaping for the output spectrum of any application.
5.3. Compressor, and the Characteristics of the Output Beam
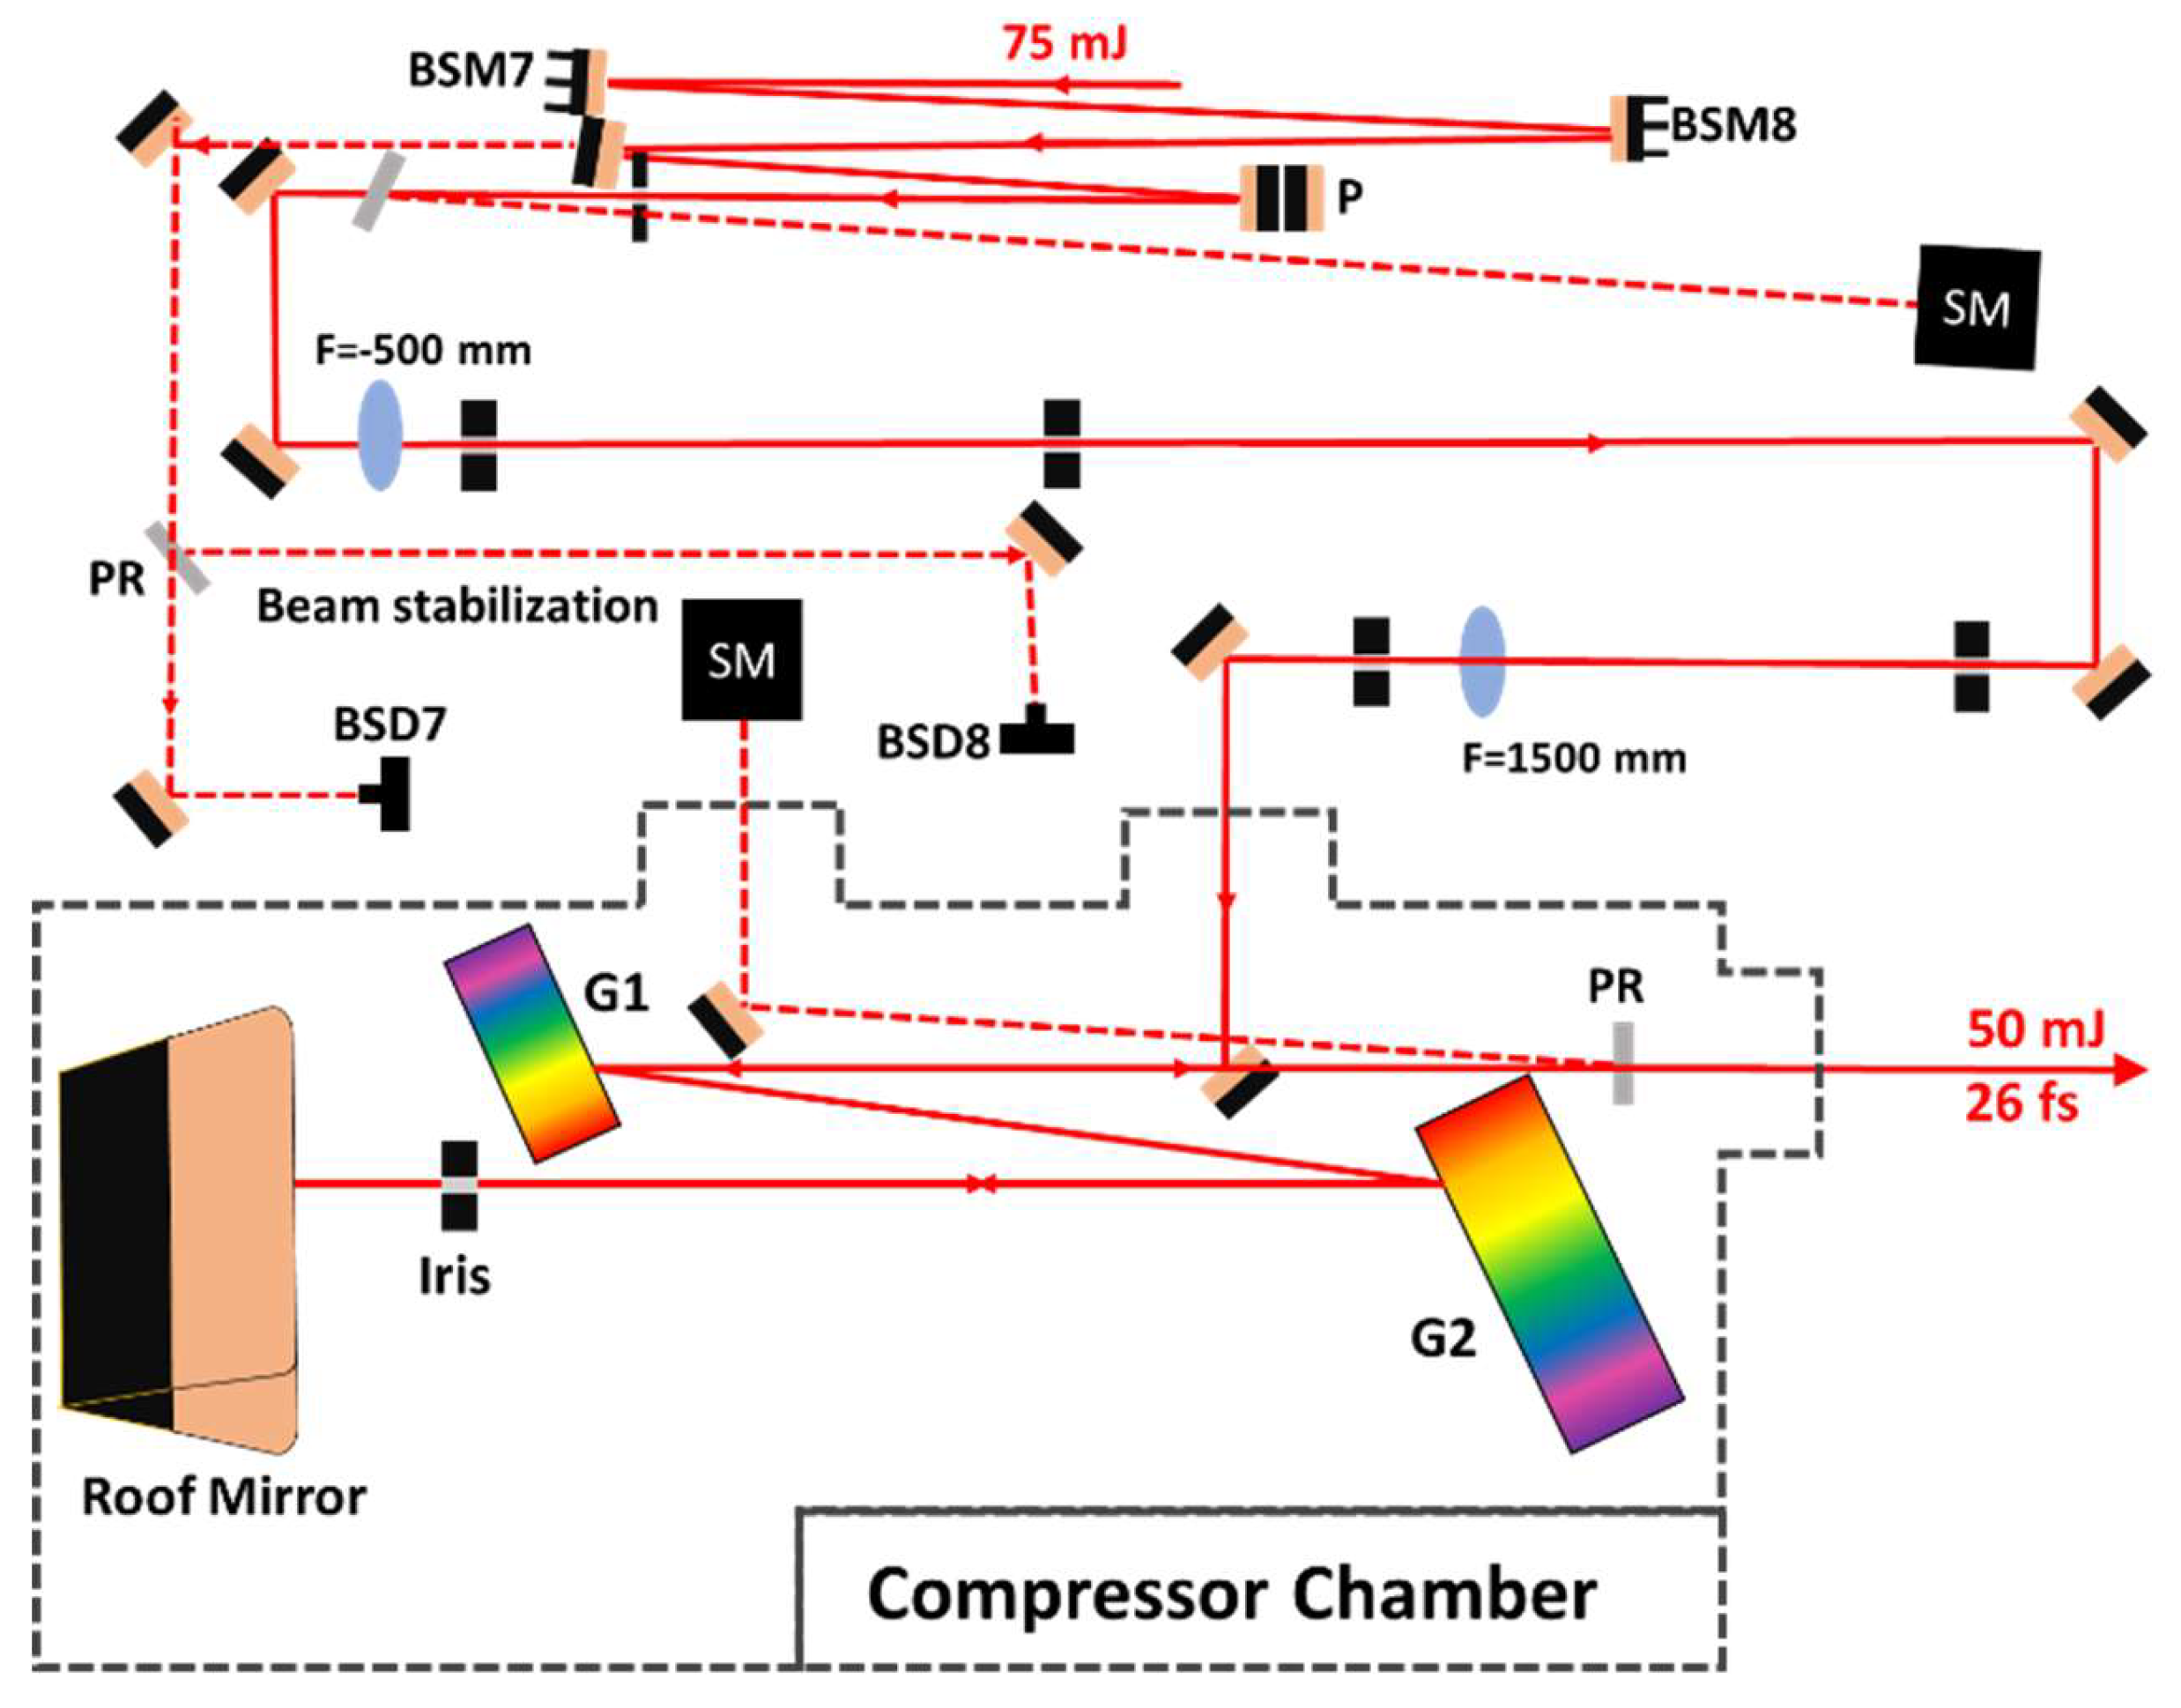
The pulses are sent to a Treacy-type two-grating compressor (
Figure 2) through a 1:2 and a 1:3 beam expander, and the last beam stabilization unit (
Figure 10). In the compressor we use reflective gratings blazed to an angle of 28.7° with a groove density of 1200 mm
-1. The angle of incidence to the gratings is 24.3°, so that the total transmission is close to 70%. The 42.5 cm distance between the gratings was optimized to compensate for the dispersion in the TW branch, with the help of the Dazzler.
Upon the alignment of the compressor, first the angular dispersion was checked with the use of an imaging spectrograph [
21]. We managed to reduce the residual angular dispersion to a value lower than 0.15 μrad/nm in both directions. The duration of the compressed pulses was measured at the compressor chamber, picking up 1% of the compressed beam. The dispersion of the output window was compensated with a pair of chirped mirrors, resulting in a pulse duration of around 26.0 fs.
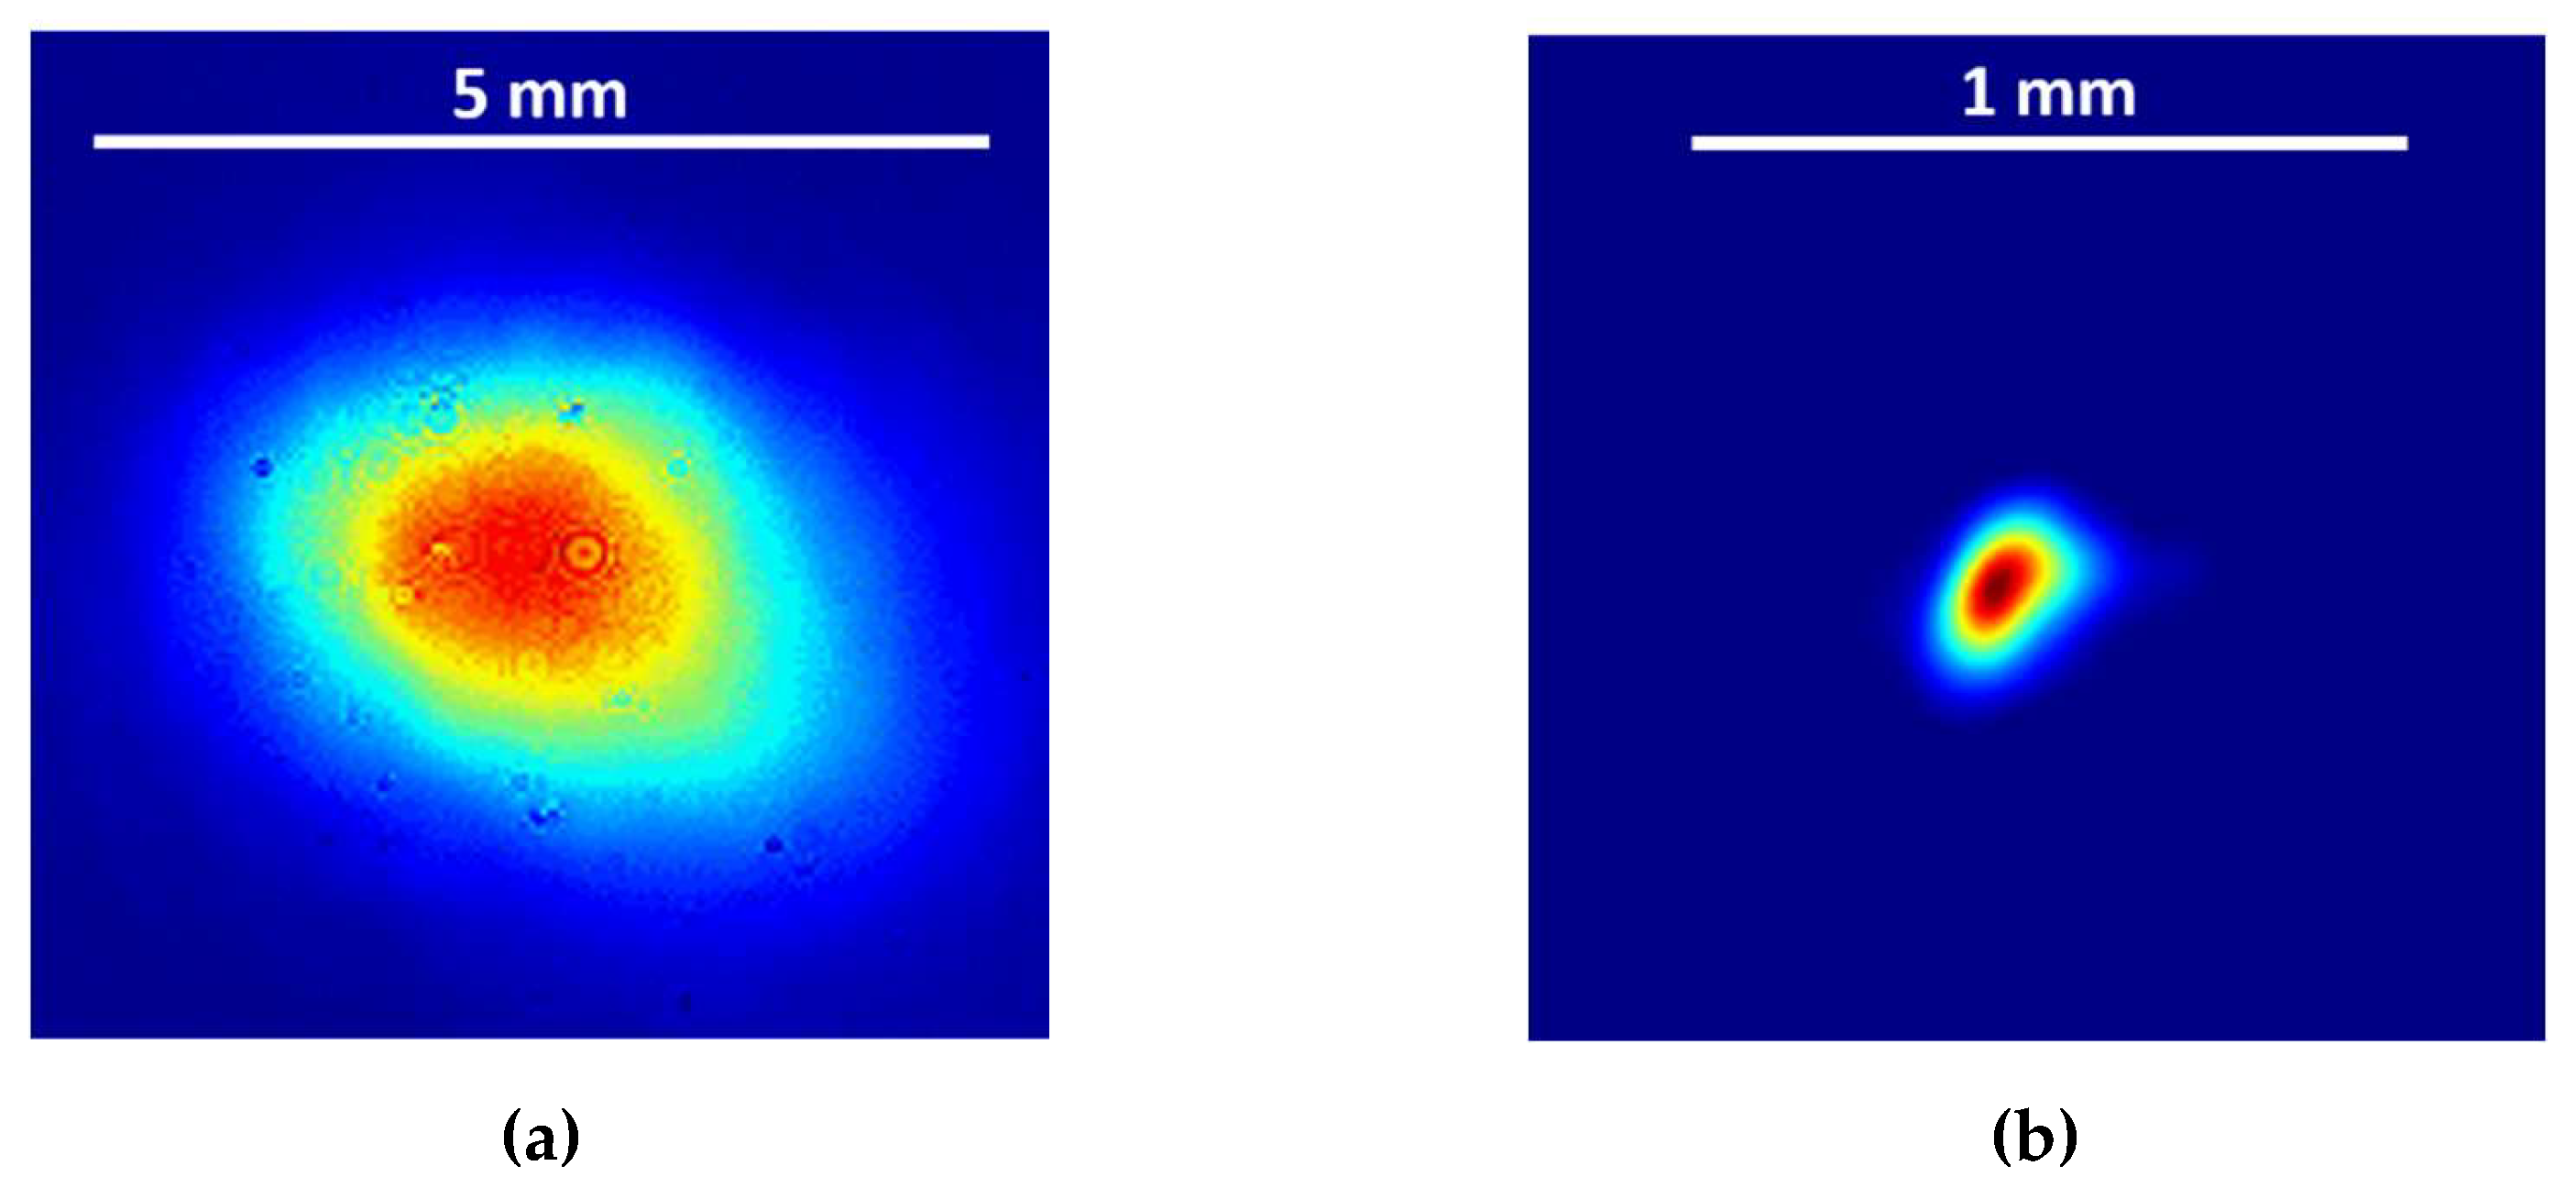
The beam leaving the compressor has a size of 8.04 mm × 5.79 mm (FWHM) with a homogeneous profile (
Figure 11a). The far-field, recorded in the focal plane of a f=2000 mm achromatic lens, has a satisfactory Strehl ratio of 0.5 (
Figure 11b).
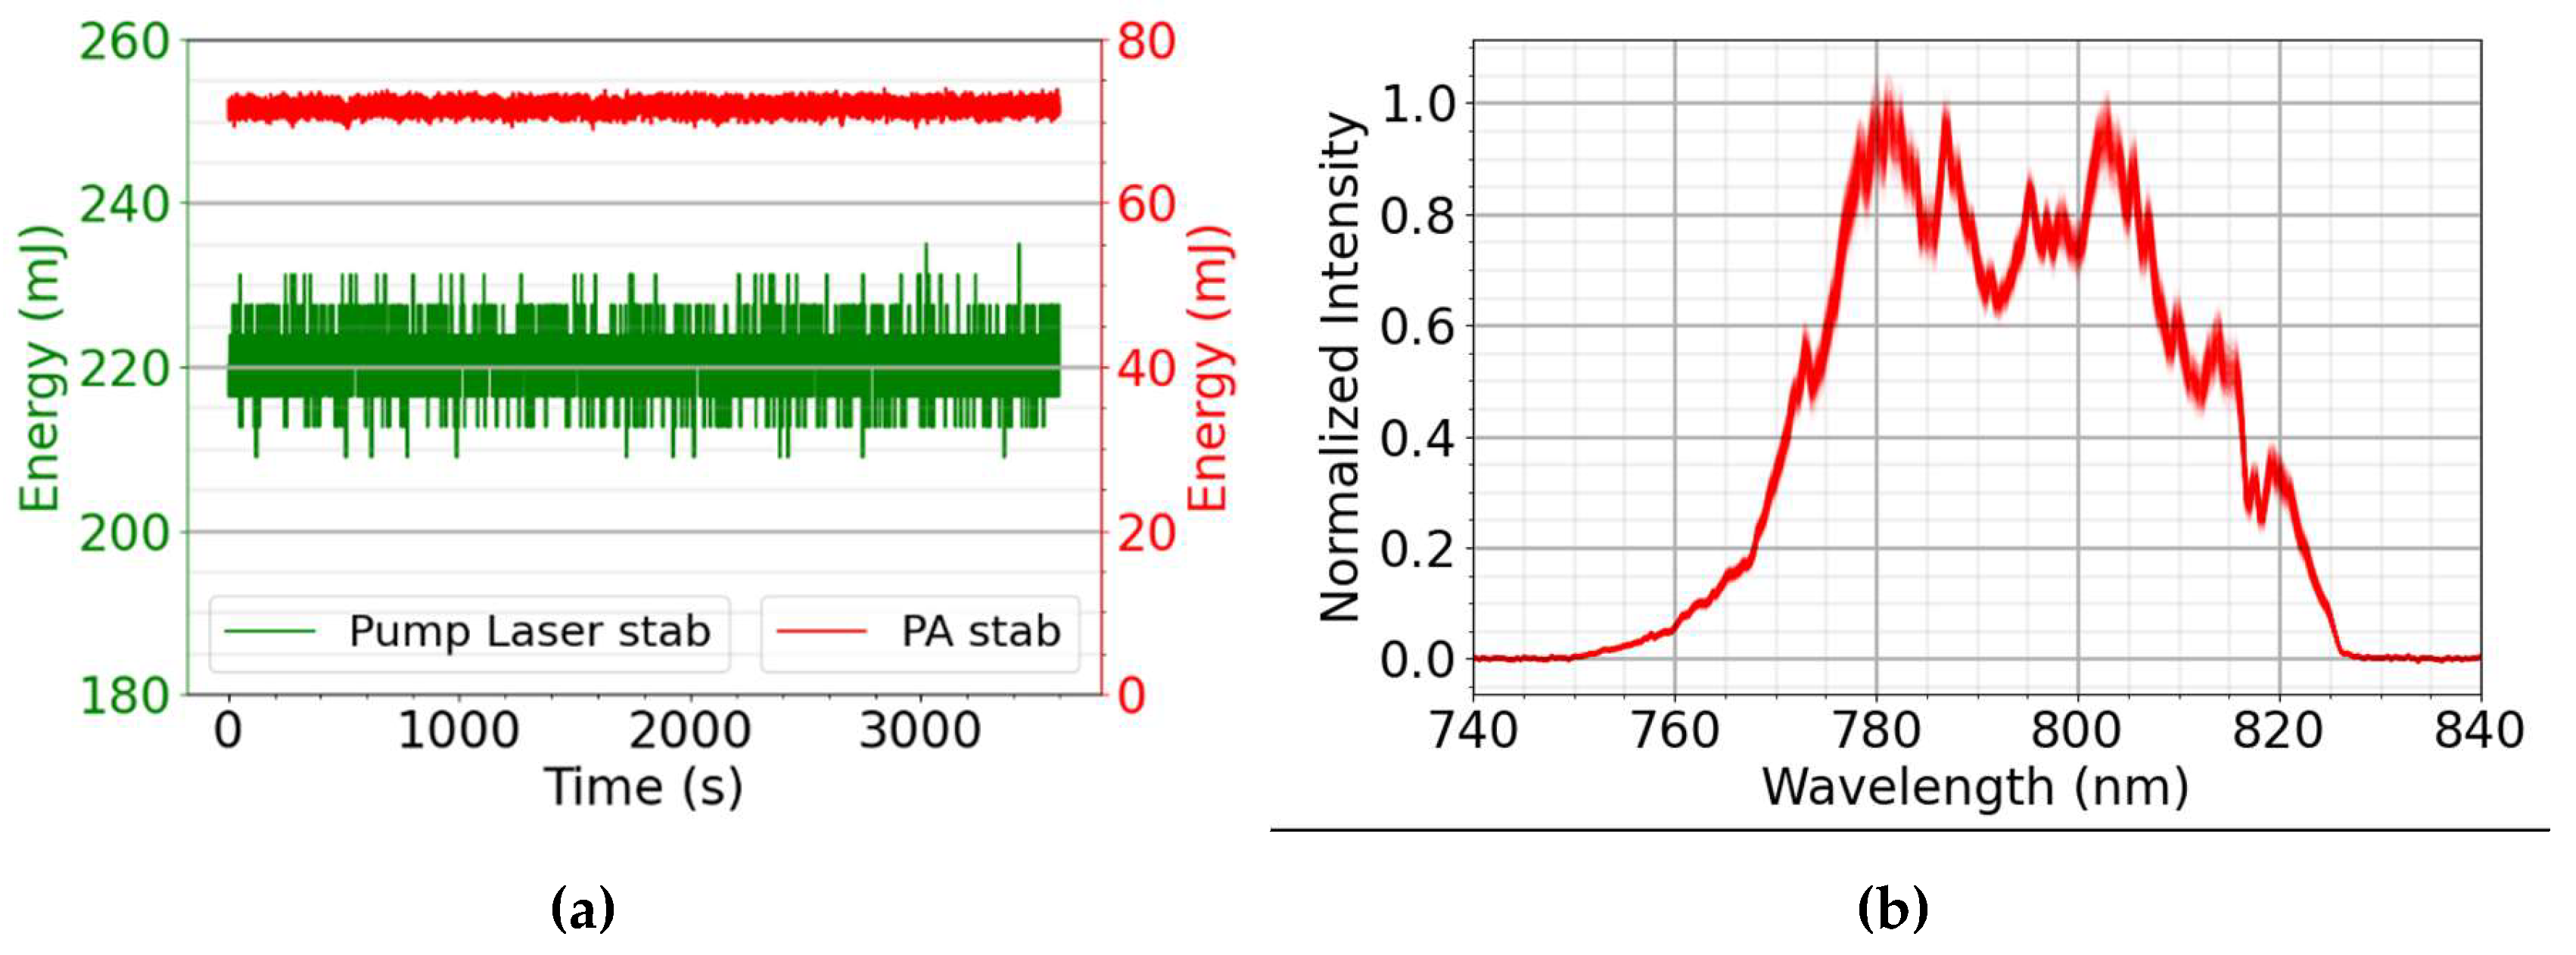
For applications, it is essential that the laser should run in a stable manner over several hours. Hence, we measured the energy, spectral and pointing stabilities for an hour. As is seen, the energy stability of the system substantially exceeds that of the pump laser (
Figure 12a), reaching a value 0.84% (RMS). The stability of the spectrum over the operation period (
Figure 12b) allows for a pulse duration stability of 0.96%. The pointing stability of the beam is ±2 μrad, which corresponds to 25% of the diffraction limited focal size.
5.4. Laser Control System
The complexity of the laser system makes it necessary to implement a monitoring system and automated control units for smooth and long-term operation. The former includes the continuous observation of the spectrum and the energy of the laser pulses after each unit with spectrometers (SM) and photodiodes (PD), respectively. The path of the monitoring elements is marked with dashed lines in
Figure 3, 6, 7, and 10. The stability of the beam is kept by four commercial stabilization systems, providing both the pointing stability and beam position stability via far-field and near-field monitoring, respectively. The stabilization system between the FE and BA has an additional machine protection feature. If the pointing of the beam from the FE deviates more than a predefined value, it stops the pump laser of the BA and PA to prevent damage to the components.
Due to the relatively short distance and to the image relay of the beam between the BA and PA amplifiers, in the absence of the seed beam, parasitic lasing can evolve, which may damage the optical components of the laser system. To avoid this, a photodiode monitors the amplified pulses after the BA. It closes a shutter in the path of the laser beam between the major amplifier stages for the pump pulse if the seed pulse is missing.
5.5. Operation at Various Repetition Rates
For practical and scientific reasons, some experiments require running the laser at a lower repetition rate than 100 Hz. Changing the repetition rate for optical parametric chirped pulse amplifiers is relatively easy [
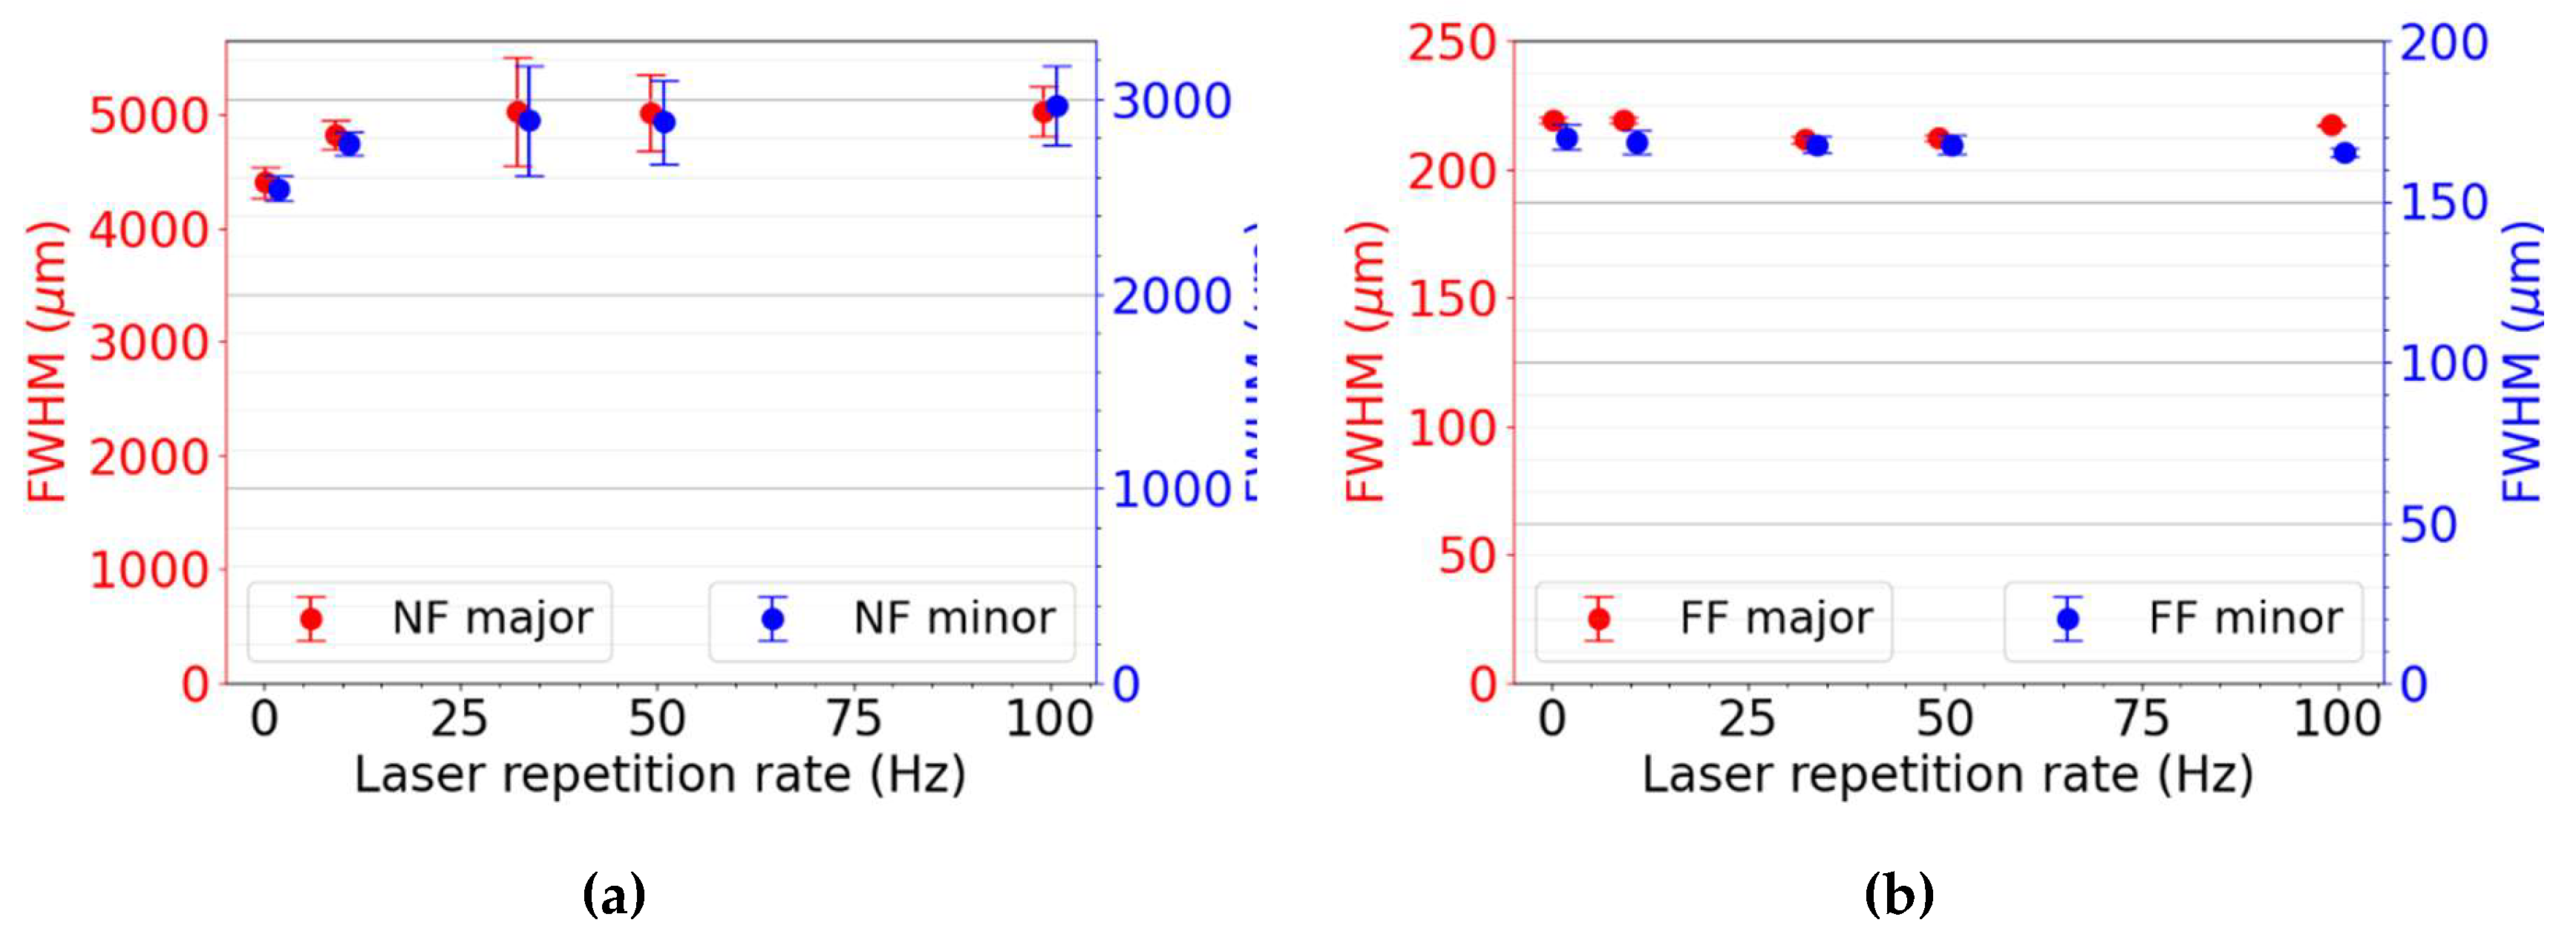
22], as there are no or negligible thermal effects in the amplifier crystals. As it is known, however, thermal lenses evolve in the Ti:Sa amplifiers during operation. The thermal equilibrium is basically determined by the energy absorbed in the amplifier crystals. To be able to run the system at various repetition rates, a shutter was inserted between the BA and PA. Both amplifiers were pumped at 100 Hz repetition rate. However, with the help of the shutter, the pulses could go through the PA only at an integer fraction of 100 Hz. As is seen (
Figure 13a), the beam size is somewhat smaller at 1 Hz, but constant within the error of the beam size measurement between 10 Hz and 100 Hz. The far-field of the beam (
Figure 13b), which is of the highest interest in experiments, has a similar tendency.
6. Applications
The system was first applied to develop a high repetition rate target system for laser-initiated neutron generation experiments [
23] to be conducted at the ELI ALPS laser facility. The neutrons are generated in a two-step process. First, ultrashort laser pulses accelerate deuterons from a primary target (pitcher). Next, the accelerated deuterium ions hit a second target (“catcher”) rich in deuterium. Neutrons are then generated through the DD fusion reaction. All such experiments are conducted in vacuum.
6.1. Development of a Liquid Sheet Target System
The intended maximum repetition rate for neutron generation is 1 kHz. To support this repetition rate, a liquid-based special target system was developed. Here two microjets with round nozzles collide and create an ultrathin layer of liquid sheet. A metal cone with a hole in the middle, heated in vacuum and cooled in air, collects the liquid beneath the jets and ensures the liquid recirculation. The shape of the liquid sheet is maintained by a pulsation damping system. The length and width of the liquid sheet, depending on the liquid’s flow rate, is less than 1.5 mm and 0.4 mm, respectively. The position of the thinnest point of the liquid sheet slightly depends on the position from the top of the sheet as well as on the flow rate, so that the minimum thickness of 200 nm can be reached, in principle, at any flow rate [
24].
Due to the tight focusing requirements with f/2 optics, the target needs to be positioned with a 10-micrometer accuracy to keep the focused peak intensity as high as possible. Therefore, the position stability of the liquid sheet is critical for providing the same accelerated ion yield shot by shot. In continuous operation, the ultrathin, consequently very light liquid sheet may behave as a swinging pendulum when hit by laser pulses with a given frequency. To reveal this interaction dynamism between our custom-made liquid jet system and the laser pulses having a certain repetition rate, a series of experiments were carried out using the TW laser arm of the system, varying the repetition rate from 1 Hz up to 100 Hz. The pendulum-like behavior depends on the momentum of the pulse, hence on its energy, but not on the intensity. Therefore, the uncompressed laser pulses with an energy of 50 mJ and a duration of few hundred ps were used. In this way we avoided the generation of particles.
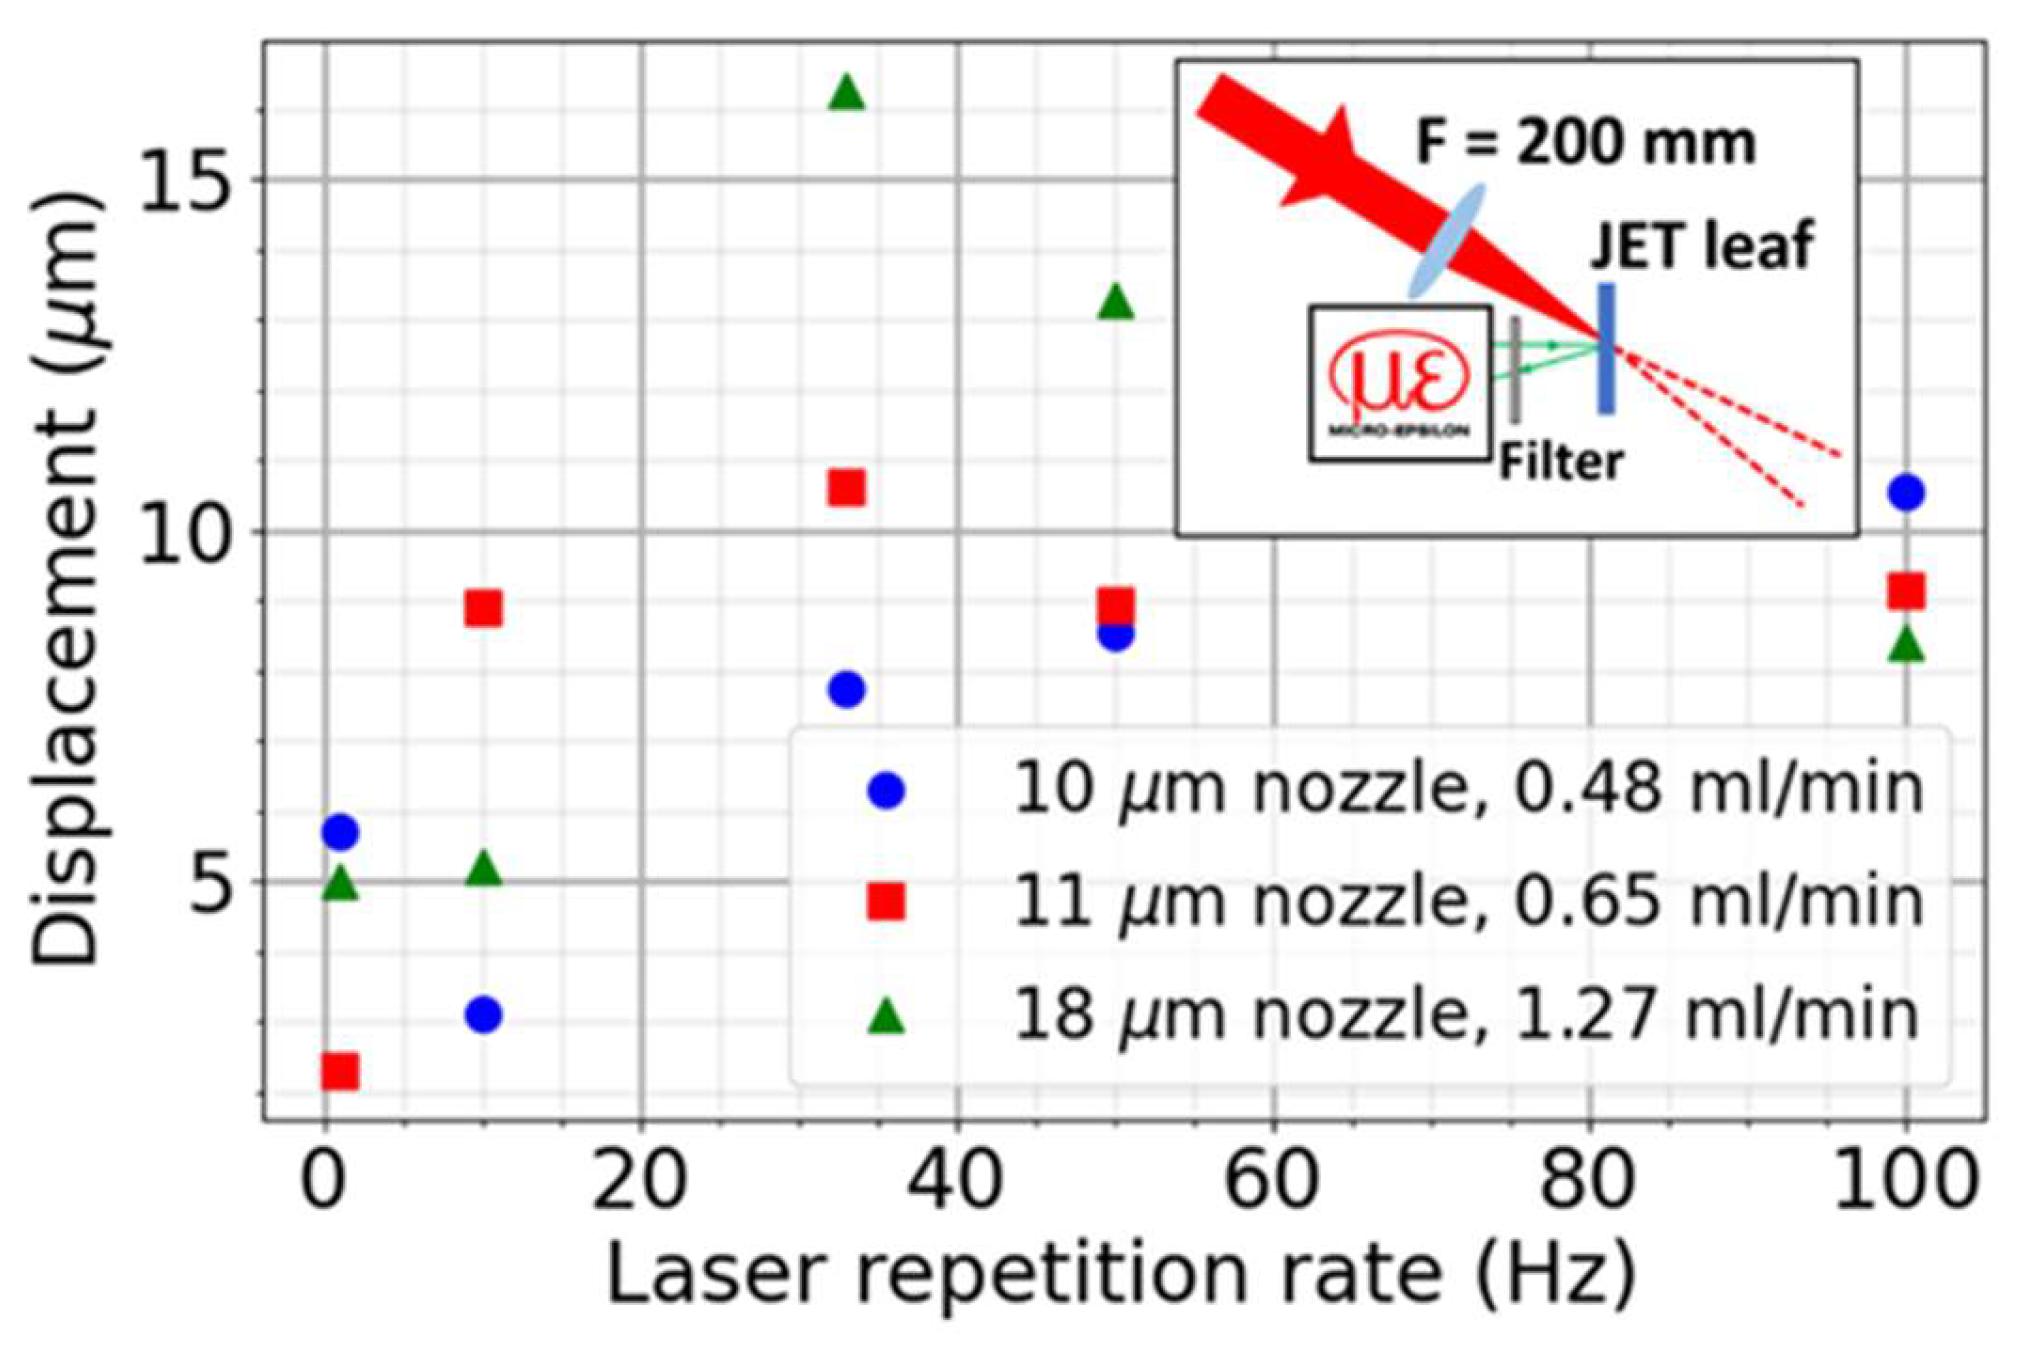
In this experiment, the liquid sheet formed by two colliding round jets from glass nozzles (10 to 18 µm diameter and 0.48 to 1.28 ml/min flowrate) was shot under 45° incidence angle by the pulses of the laser system mimicking the particle generation arrangement (insert of
Figure 14). The displacement of this sheet was measured perpendicular to the liquid sheet surface by a Micro-Epsilon (ILD2300-20) high precision laser-based ranger unit. It worked with a 1.5 kHz readout frequency and provided distance data with an accuracy of 0.24 µm. The measuring spot size was well below 100 μm diameter at the center of the liquid sheet surface. Scattered light of the exciting laser from the liquid sheet was eliminated with a colored bandpass filter for the wavelength of the laser of the ranger.
The results of the measurement series provided a detailed picture on the liquid target stability behavior during the laser’s interaction with liquid. Without any impact of the laser pulses, the stochastic motion ranged a few microns. However, the laser pulses caused a displacement of dozens of micrometers at 33 Hz repetition rate (resonant case), while any further increase of the repetition rate lowered the amplitude (
Figure 14).
6.2. Femtosecond Cutting
One of the advantages of cutting with ultrashort laser pulses is that the thermal load on the material during the process is negligible [
25,
26], therefore the edge of the trimmed surface is clean without droplets and barbs. This is especially important in case of porous solid materials, where any thermal effect would result in large, melted droplets.
The secondary target, the neutron converter, for the laser-generated neutron experiments [
23] is made of granulated C
2D
4. The powder is put into a round, stainless steel form, and pressed down with a 10 t device, resulting in a round tablet with a thickness between 0.5 mm and 1.2 mm. The accelerated deuterons hit this C
2D
4 tablet and generate neutrons through DD fusion reaction. To monitor and control deuteron acceleration from the liquid jet described above, the deuteron beam needs to be monitored and let through the tablet upon the irradiation. Hence, a sufficiently small hole, with a diameter of 0.5 mm, must be cut into the tablet. Mechanical boring and water jet cutting made this porous tablet crack into several pieces, while traditional laser cutting melted and pulverized the surroundings of the hole. Hence, we explored cutting with laser pulses from the FE. Since the diameter of the hole is relatively large, direct laser boring is out of question. Instead, an optical assembly was designed and implemented, when the hole is cut (instead of bored) with tightly focused femtosecond pulses.
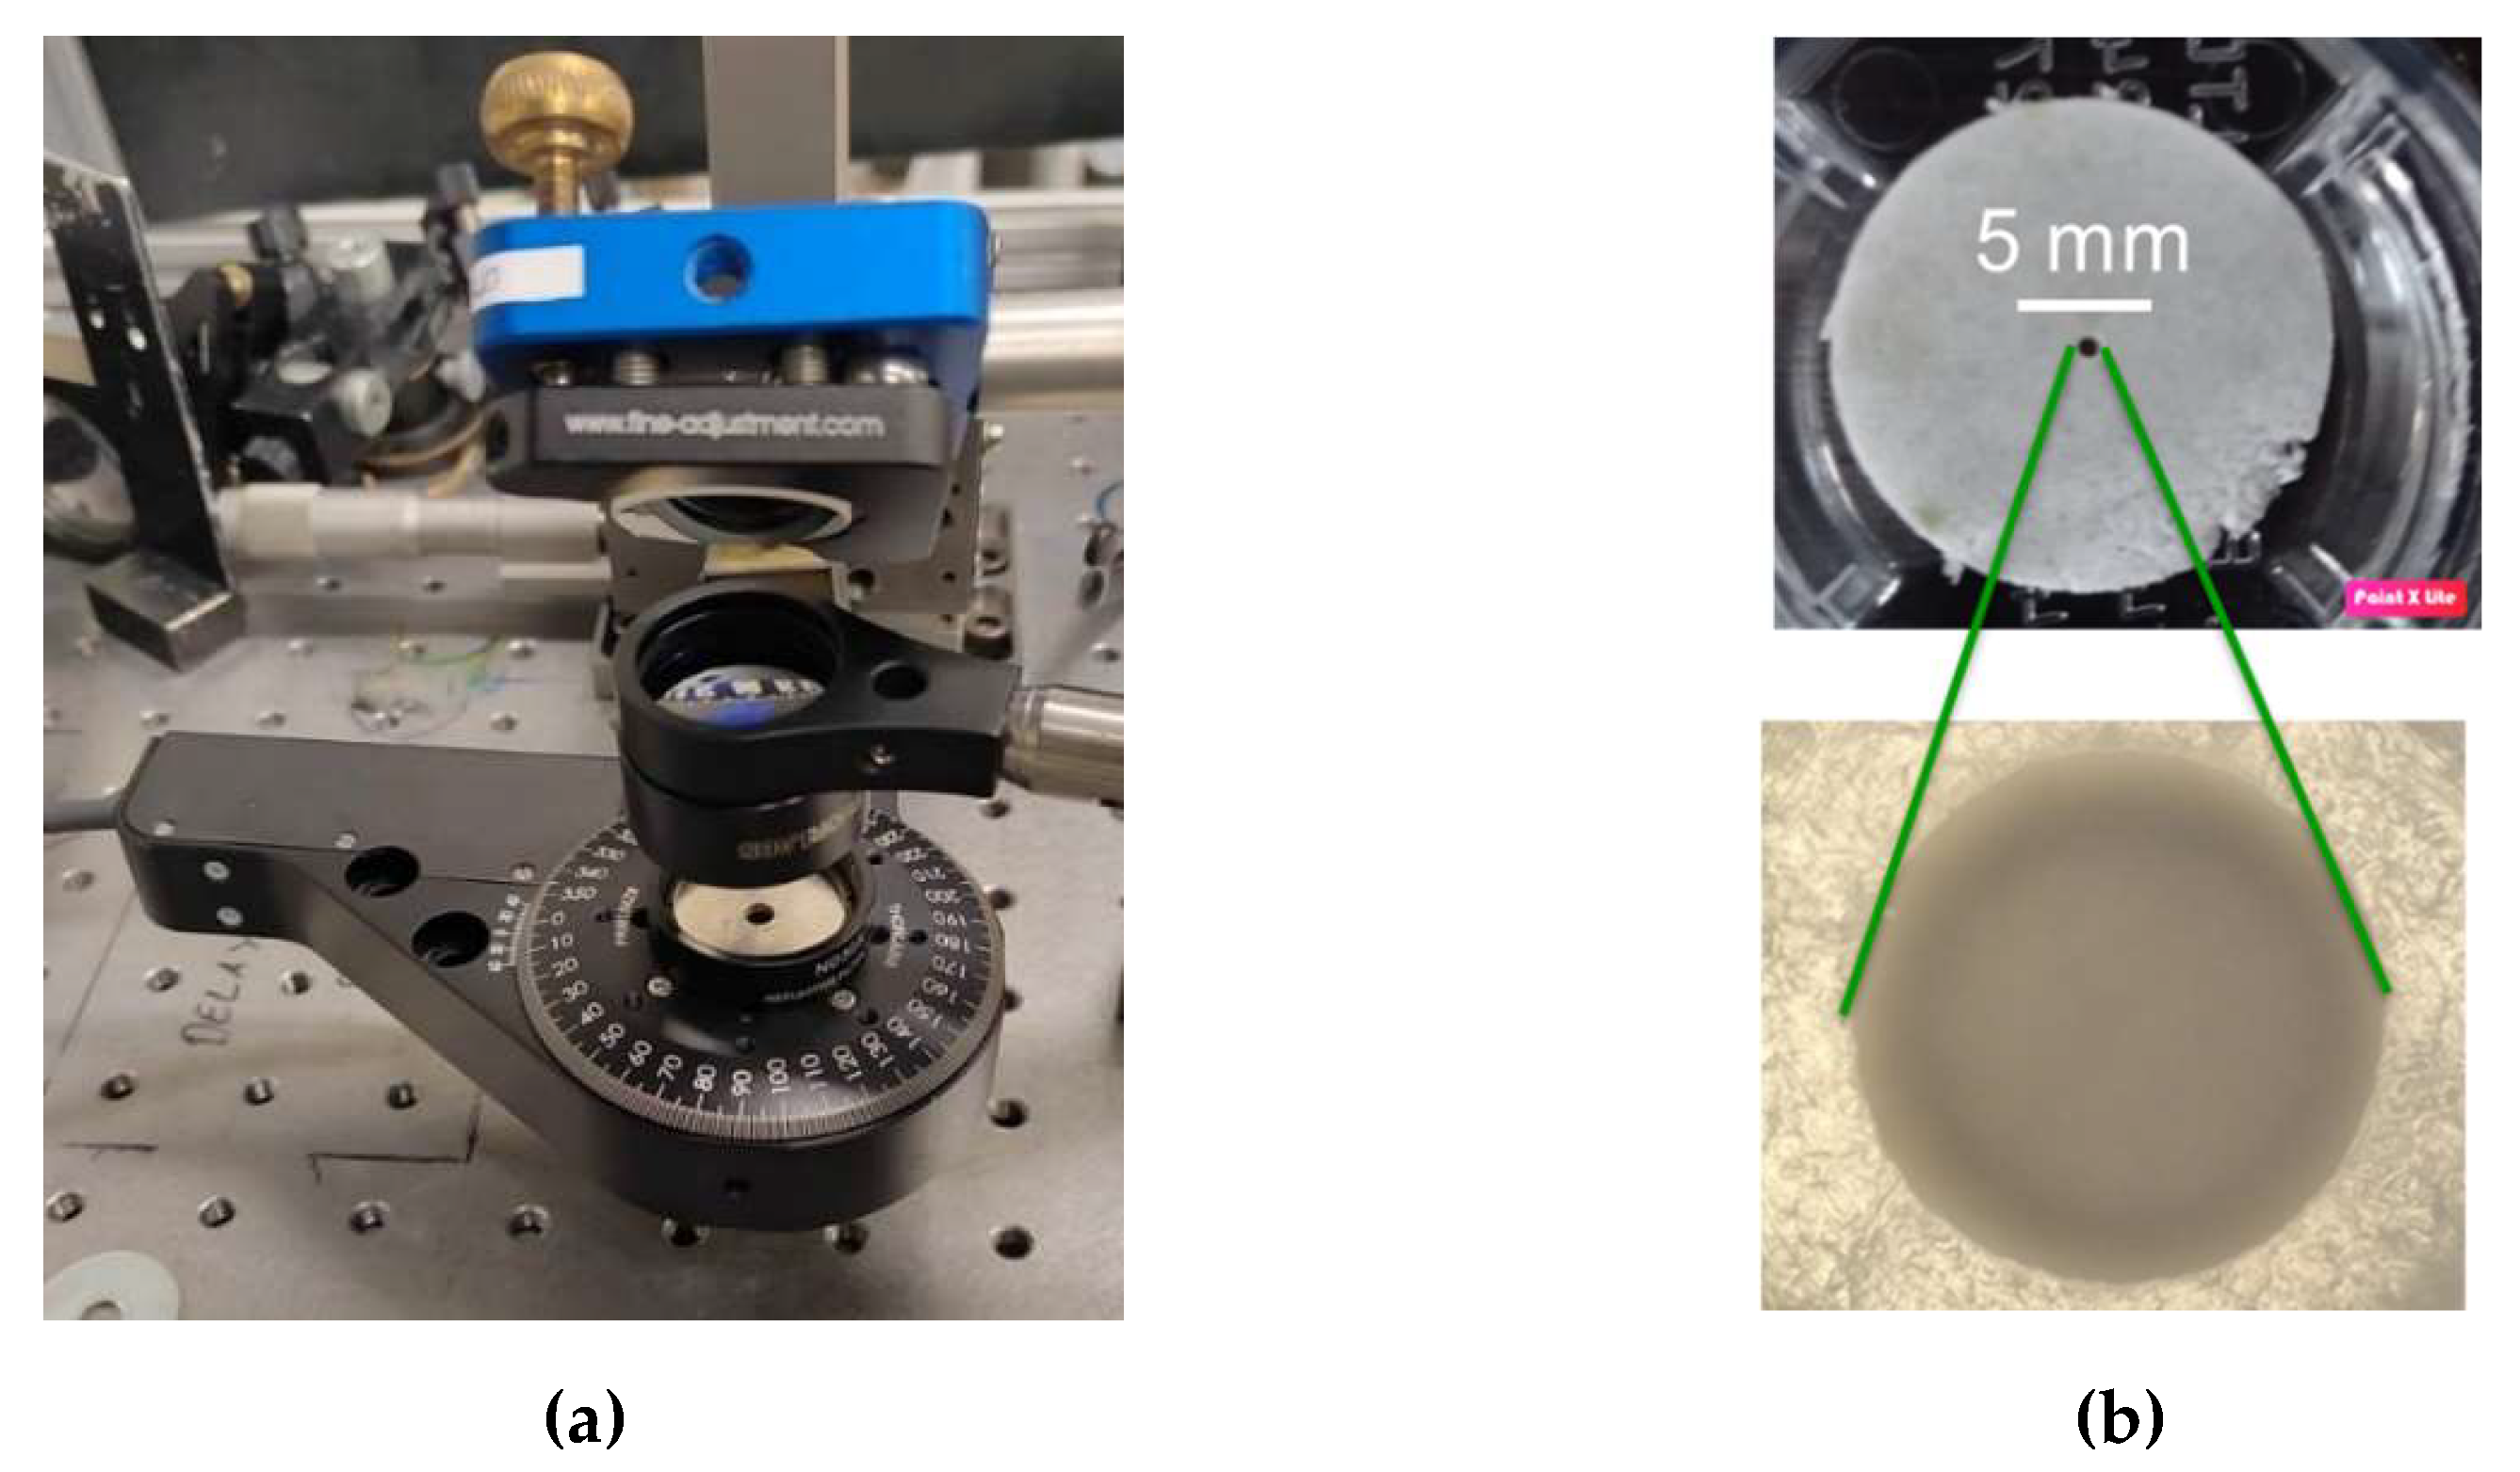
The setup consisted of an optical shutter, a motorized rotation stage mounted on a three-axis translation stage system, and a focusing element. The former enabled the regulation of the number of pulses reaching the surface during the cutting process. Focusing was performed with a 1” bi-convex lens with a focal length of 25.4 mm (
Figure 16.a), providing a focal spot of 15.1 µm 1/e
2) on the sample. For the positioning of the sample, the rotation stage was put onto a manual 3-axis stage. The horizontal positioning of the rotation axis of the sample relative to the optical axis of the lens allowed us to set the diameter of the hole. The smallest focal spot on the surface was adjusted by shifting the sample vertically, and was monitored and controlled regularly upon the cutting process. The precise, uniform, and constant-speed rotation was ensured by a DC servo motor-driven rotation stage. The optimal rotation speed and repetition rate were determined empirically.
For cutting the tablets, we used the ~450 µJ laser pulses from the FE, compressed in bulk and with chirped mirrors. We explored the cutting conditions for various hole diameters and tablet thicknesses. As the extremes, it took around 5 minutes to cut a hole with a diameter of 0.5 mm into a 0.5 mm thick sample, while the preparation of a hole with a diameter twice this size in a 1 mm thick sample took almost 30 minutes. As is seen, the hole was a regular circle with a very clean edge (
Figure 15b).
6.3. Imaging with Laser Induced X-ray
Currently, an experimental capacity is under construction, where an incoherent, point-like X-ray beam is to be generated on a tape target [
27]. The major advantage of a point-like X-ray source is that it has extremely high spatial coherence compared to conventional sources, as well as very short light pulses [
28,
29,
30]. Hence, the brightness of a laser-induced X-ray source is considerably higher than the conventional one [
31]. It makes this source very promising even for conventional applications as imaging metal barrels or engine blocks [
32,
33], as the time necessary for scanning an object is considerably shorter than with conventional sources.
In our system, the target chamber, including the tape target system, the focusing off-axis parabola, and the alignment objective are currently under testing. The image reconstruction algorithms have been developed and tested with a commercial X-ray tube (YXLON AXT-320), providing radiation in the 20 keV – 320 keV range. The linear diode array is a NTB SEZ W2-480 one, consisting of 5,566 elements with a pixel pitch of 83 µm, and having a 12 bit depth AD conversion. Because of the linear array we assume fan-beam imaging geometry. Upon imaging, the objects are moved vertically, and rotated (see
Figure 16a for the schematics of the system). The images are reconstructed with the filtered back-projection algorithm (see, e.g.
, [
34]) in MATLAB, then the 2D slices are combined and the resulted 3D volume is visualized with the 3D Slicer software. As a case study we scanned a Rubik’s cube with X-rays generated at 1.7 mA, 200 kV. The full rotation was made with a step of 0.2° in each height of 1 mm. Each recording took 0.02 s exposure time, while the total scanning process lasted for about 6 hours. The tomographic reconstruction of the Rubik’s cube (
Figure 16b) provides an impression of the robustness of the image algorithm.
To adopt the image acquisition system, Monte Carlo simulations were run to mimic the point-like x-ray source, using the Geant4 based, open-source simulation toolkit, GATE [
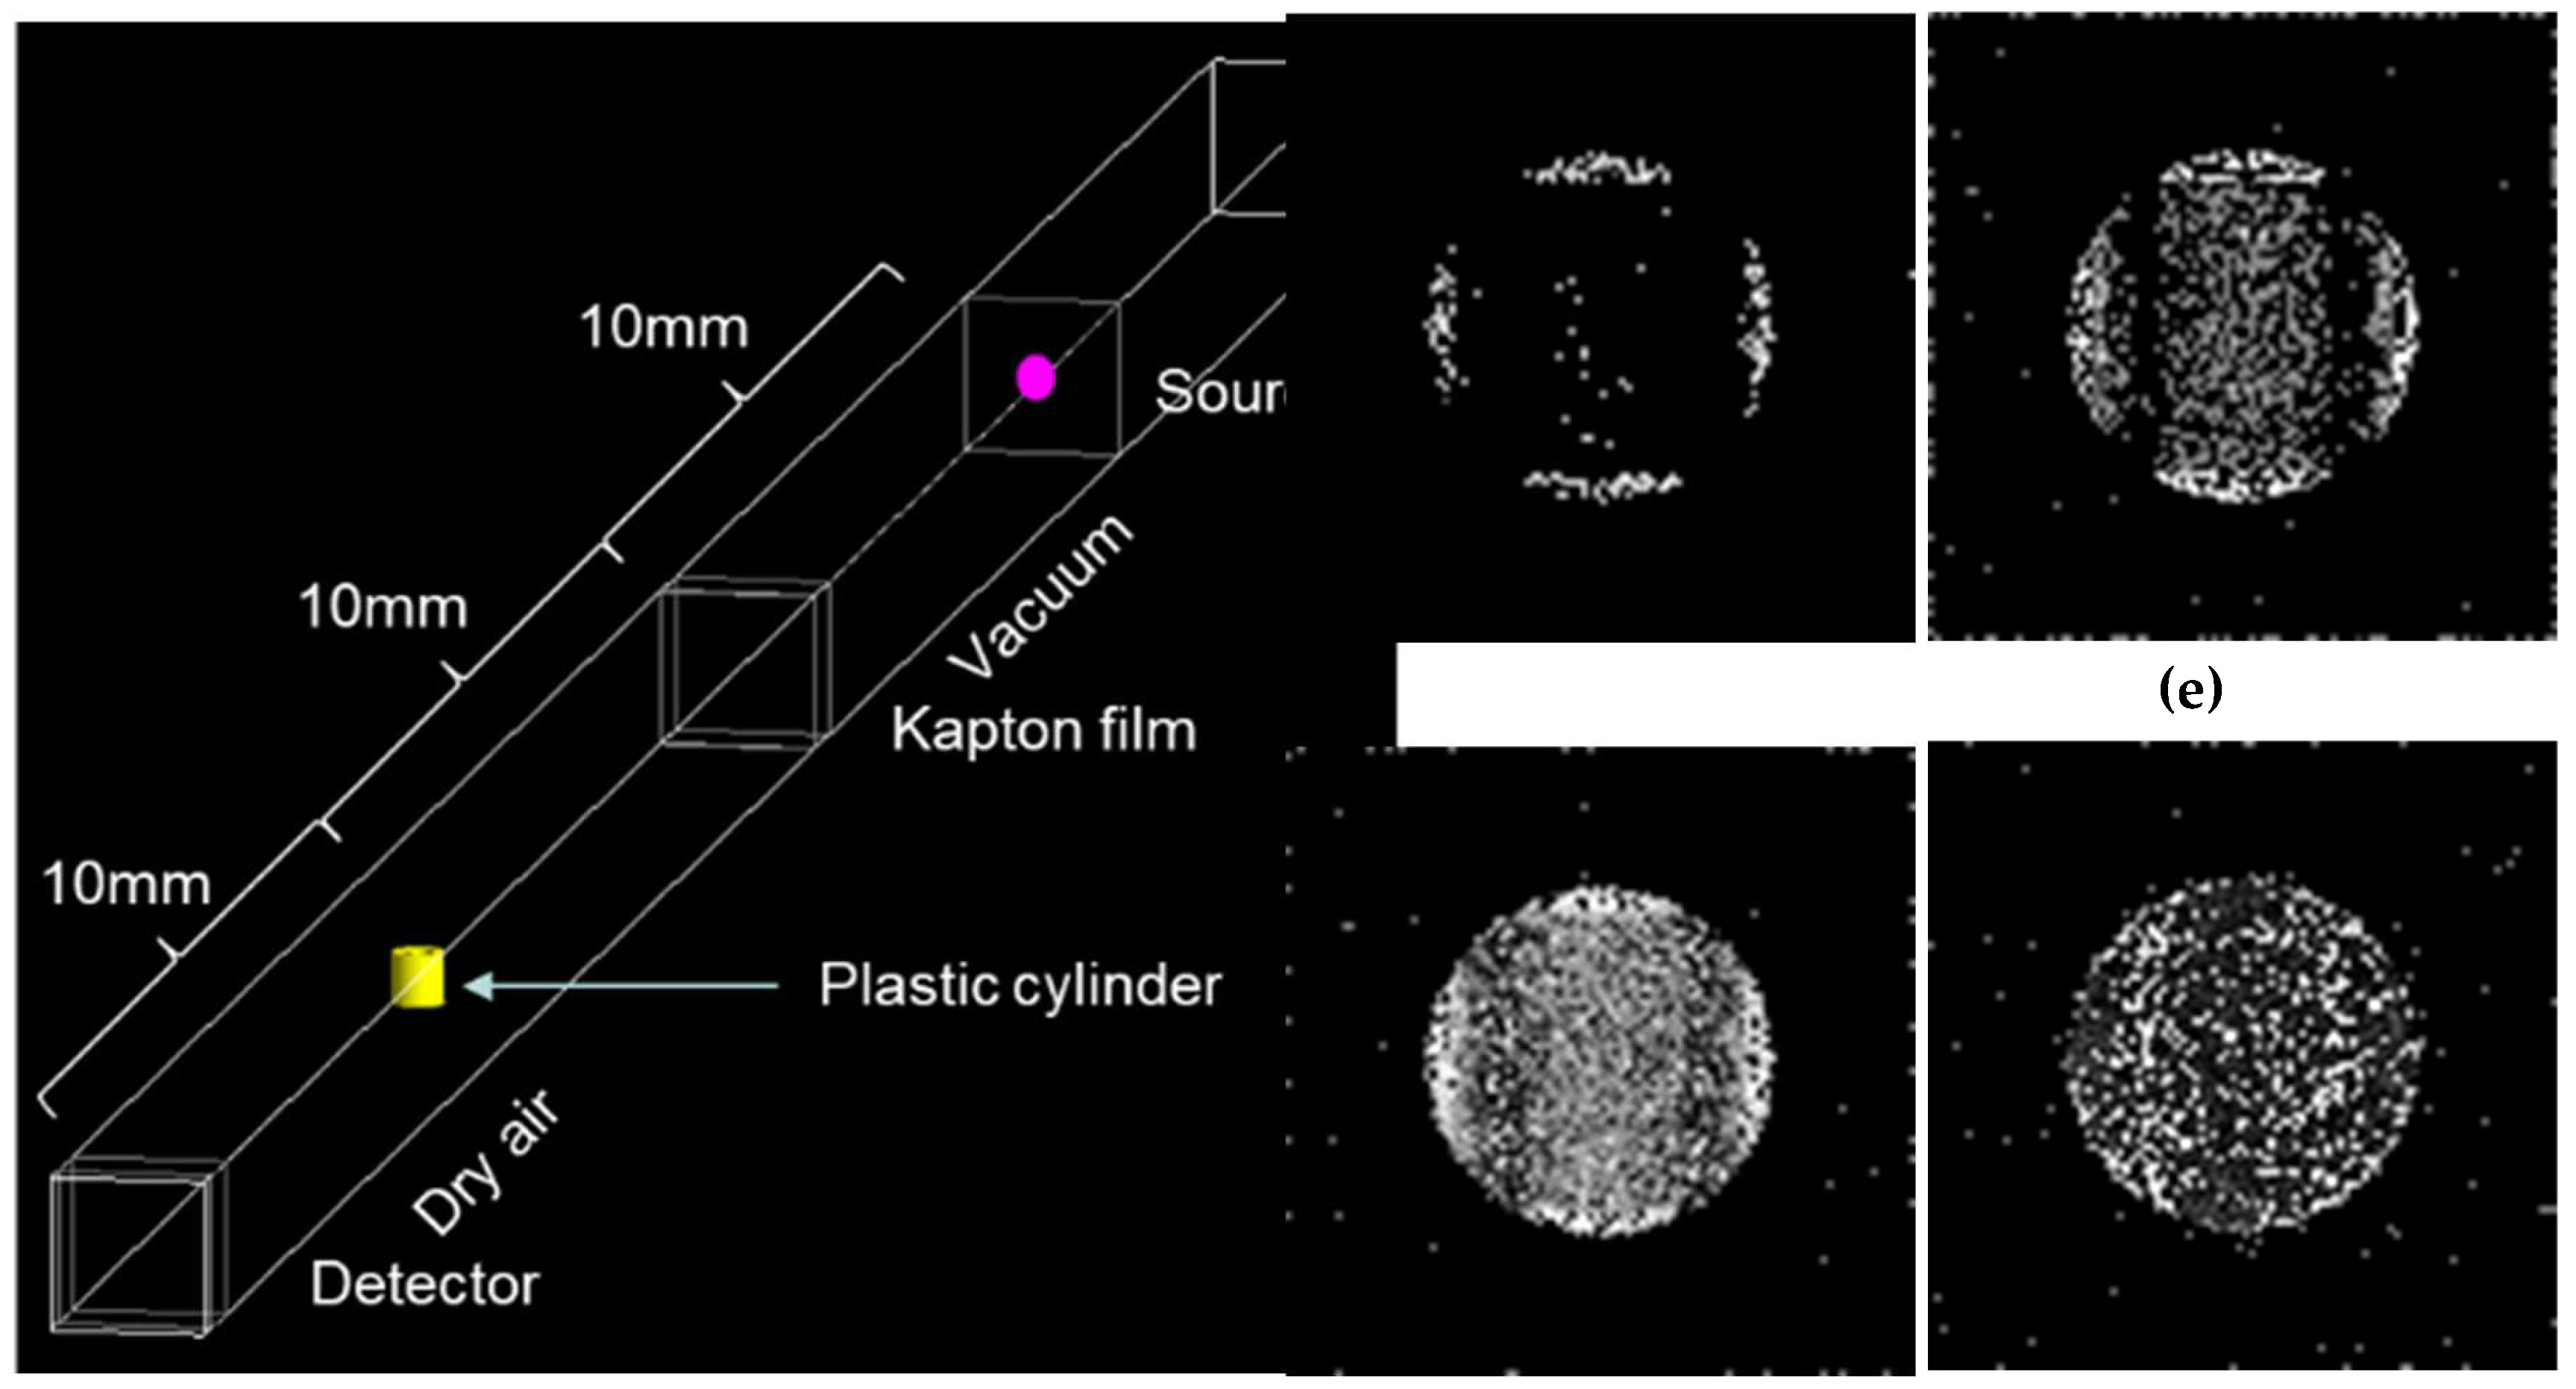
35]. To investigate transmission radiography (and such CT) possibilities, we took the proportionally reduced experimental layout (
Figure 17a). We assumed a monoenergetic X-ray source with a focal spot of 20 µm and a cone-beam angle of 10 degrees. The source was positioned in a vacuum chamber 10 mm far from a 0.5 mm thick Kapton window. Outside the chamber we assumed dry ambient air. As a test object we defined a small hollow plastic cylinder with an inner radius of 1 mm, an outer radius of 1.67 mm, and a height of 3.33 mm. We set the source-to-object and the object-to-detector distance both to 10 mm. The detector was a flat-panel array with 100×100 pixels 0.1 mm×0.1 mm in size, thus, the physical resolution was very close the one mentioned in the above experiment (the cone beam geometry and the flat panel detector were assumed to speed up the simulation process only).
Figure 17b–e show the radiographs with different energy and photon counts. It turns out that in this case 5 keV is too low, while 20 keV is too high to achieve an acceptable image quality. 10 keV seems to be a good choice for this object.
As it is seen, the visibility of the cylinder decreases with gradually increasing photon energies. One solution for this problem is propagation-based phase-contrast imaging [
36,
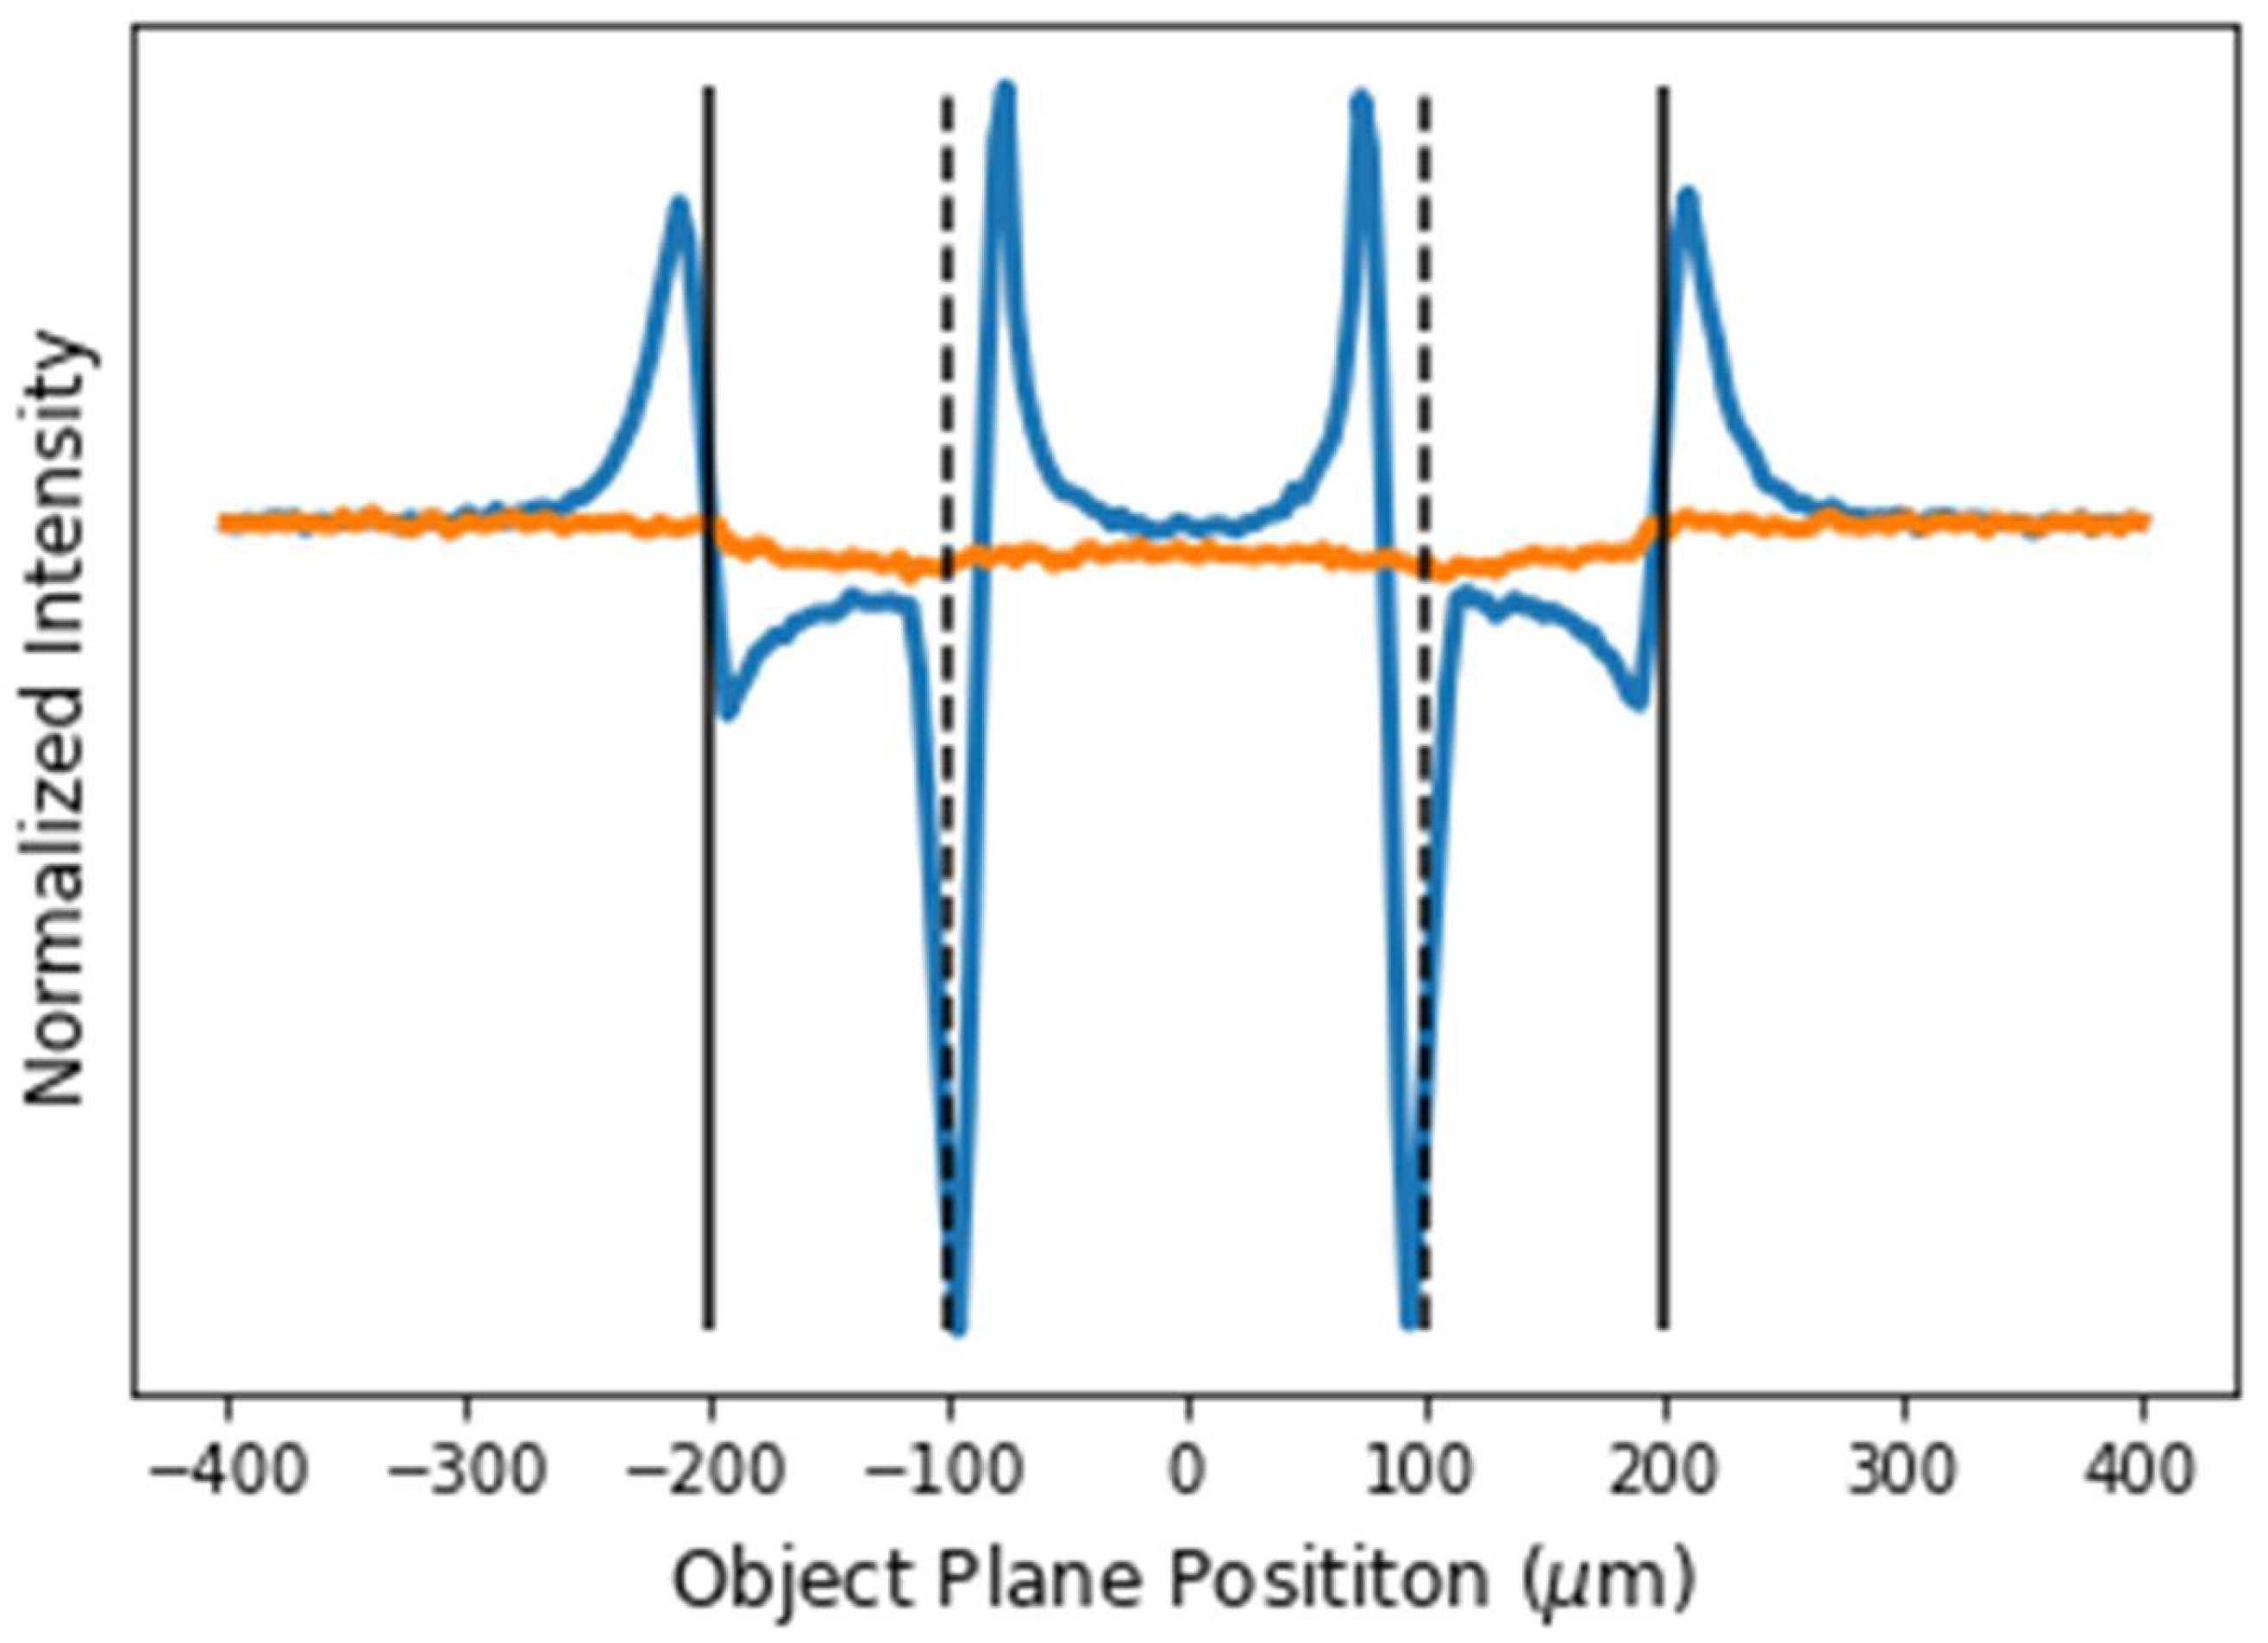
37]. The small size of the laser-generated x-ray source enables the adaptation of the technique with moderate source–sample distances that can conveniently be built in an optical laboratory. This technique allows us to investigate features of small and weakly absorbing samples that are hard to observe with conventional absorption-based methods. To demonstrate the effectiveness of the technique, we simulated and juxtaposed the phase-contrast and absorption projections of a 200 μm diameter hollow plastic fiber with an inner diameter of 100 μm (
Figure 18). The GATE simulation was performed with 1 m source–sample and sample–detector distances and 10 keV photon energies. It can be observed that the absorption image is barely discernible from the background, but the phase-contrast image is clearly visible as it has strong fringes at the inner and outer edges.
7. Summary
We have described a laser system with two outputs, optimized for different purposes. One of them provides two-cycle laser pulses with sub-mJ energy, while the other generates 2 TW peak power pulses. We successfully used the system for the development of a high repetition rate target system, as well as a stationary target for a laser-generated neutron source. The system will be used for the generation of high spatial coherence X-ray radiation for computer tomography of 3D printed objects.
As the next step of laser development, we aim to combine the two arms. Here the few-cycle pulses from the FE arm would be used for seeding the booster and power amplifiers. The amplification scheme would be slightly changed for taking advantage of the broad bandwidth of polarization encoded chirped pulse amplification [
38]. In this way, 12 fs laser pulses with 5 TW peak power are foreseen, still at 100 Hz repetition rate.
Author Contributions
The initial design of the laser and the experiments were proposed by K.O. P.G., B.N., T.G., I.S., and A.K. built the FE, FCA, and TWA. The amplifiers were simulated by R.N. The dispersion management system was built and measured by P.G., T.G., and A.P.K. The command-control system was implemented by A.K. and T.G.. The fs cutter was developed by B.N. and P.G.. The liquid jet was tested by M.F. and M.K.. The measurements with a conventional X-ray tube and simulations of laser-generated X-ray CT images were conducted by P.B. and T.N.. The implementation of the laser and the experiments were supervised by K.O. The original draft was prepared by K.O. from the contribution of all authors with their own section. The final editing, including graphs, was produced by A.K., while the final review by A.P.K. and K.O. All authors have read and agreed to the published version of the manuscript.
Funding
The project has been implemented with the support provided by the Ministry of Culture and Innovation of Hungary from the National Research, Development and Innovation Fund financed under NKFIH-877-2/2020, NKFIH-476-4/2021 and 2022-2.1.1-NL Creation of National Laboratories, Complex Development funding scheme.
Data Availability Statement
Data are available from the corresponding authors upon reasonable request.
Acknowledgments
The authors are grateful to H. Cao, Sz. Tóth and G. Tempea for their initial help in the preparation of the experiments, and to M. Kalashnikov for providing the simulation code for laser amplification analysis. We also thank J. Zelena for carefully reading this manuscript.
Conflicts of Interest
The authors declare no conflict of interest.
References
- Danson, C.N.; Haefner, C.; Bromage, J.; Butcher, T. Chanteloup, J-C.F.; Chowdhury, E.A.; Galvanauskas, A.; Gizzi, L.A.; Hein, J.; Hillier, D.I. et al. Petawatt and exawatt class lasers worldwide. HPLSE 2019, 7, e54. [Google Scholar] [CrossRef]
- Prencipe, I.; Fuchs, J.; Pascarelli, S.; Schumacher, D.W.; Stephens, R.B.; Alexander, N.B.; Briggs, R.; Büscher, M.; Cernaianu, M.O.; et al. Targets for high repetition rate laser facilities: needs, challenges and perspectives. HPLSE 2017, 5, e17. [Google Scholar] [CrossRef]
- Füle, M.; Gilinger, T.; Nagyillés, B.; Karnok, M.; Gaál, P.; Figul, S.; Marowsky, G.; Kovács, G.; Bojtos, A.; Samu, K.; et al. Development of High Repetition Rate Target Systems for Ion Acceleration with Laser Radiation. 9th International Conference on Ultrahigh Intensity Lasers (ICUIL 2022), Jeju, South Korea (18-23 September, 2022).
- Koechner, W. Solid-State Laser Engineering; Springer Science & Business Media, Inc. 2006. [Google Scholar]
- Backus, S.; Durfee, C. G.; Murnane, M. M.; Kapteyn, H. C. High power ultrafast lasers. Rev. Sci. Instrum. 1998, 69, 1207–1223. [Google Scholar] [CrossRef]
- Zhavoronkov, N.; Korn, G. Regenerative amplification of femtosecond laser pulses in Ti:sapphire at multikilohertz repetition rates, Opt. Lett. 2004, 29, 198–200. [Google Scholar]
- Hong, K.-H.; Kostritsa, S.; Yu, T. J.; Sung, J. H.; Choi, I. W.; Noh, Y.-C.; Ko, D.-K.; Lee, J. 100-kHz high-power femtosecond Ti:sapphire laser based on downchirped regenerative amplification, Opt. Express 2006, 14, 970–978. [Google Scholar] [CrossRef]
- Yamakawa, K.; Barty, C.P.J. Ultrafast, Ultrahigh-Peak, and High-Average Power Ti:Sapphire Laser System and Its Applications, IEEE J. Sel. Top. in Quant. El. 2000, 6, 658–675. [Google Scholar] [CrossRef]
- Nakamura, K.; Mao, H-S. ; Gonsalves, A.; Vincenti, H.; Mittelberger, D.E.; Daniels, J.; Magana, A.; Toth, C.; Leemans, W. et al., Diagnostics, Control and Performance Parameters for the BELLA High Repetition Rate Petawatt Class Laser. IEEE Journal of Quantum Electronics 2017, 53, 1–21. [Google Scholar] [CrossRef]
- Burdonov, K.; Fazzini, A.; Lelasseux, V.; Albrecht, J.; Antici, P.; Ayoul, Y.; Beluze, A.; Cavanna, D.; Ceccotti, T.; Chabanis, M.; et al. Characterization and performance of the Apollon short-focal-area facility following its commissioning at 1 PW level. Matter Radiat. Extremes, 2021; 6, 064402. [Google Scholar] [CrossRef]
- Radier, C.; Chalus, O.; Charbonneau, M.; Thambirajah, S.; Deschamps, G.; David, S.; Barbe, J.; Etter, E.; Matras, G.; Ricaud, S.; et al. 10 PW peak power femtosecond laser pulses at ELI-NP. HPLSE 2022, 10. [Google Scholar] [CrossRef]
- Gan, Z.; Yu, L.; Wang, C.; Liu, Y.; Xu, Y.; Li, W.; Li, S.; Yu, L.; Xinliang, W.; Liu, X.; et al. The Shanghai Superintense Ultrafast Laser Facility (SULF) Project. In: Progress in Ultrafast Intense Laser Science XVI. Topics in Applied Physics, vol 141.; Yamanouchi, K., Midorikawa, K., Roso, L. (eds); Springer, Cham. [CrossRef]
- Kalashnikov, M.P.; Osvay, K.; Lachko, I.M.; Schönnagel, H.; Sandner, W. Broadband amplification of 800-nm pulses with a combination of negatively and positively chirped pulse amplification. IEEE J.Sel.Top.Quant.Electr. 2006, 2006 12, 194–200. [Google Scholar] [CrossRef]
- Chvykov, V.; Nagymihály, R. S.; Cao, H.; Kalashnikov, M.; Osvay, K. Design of a thin disk amplifier with extraction during pumping for high peak and average power Ti:Sa systems (EDP-TD). Opt. Express 2016, 24, 3721–3733. [Google Scholar] [CrossRef]
- Nagy, T.; Simon, P.; Veisz, L. High-energy few-cycle pulses: post-compression techniques. Adv. Phys. X 2021, 6, 1845795. [Google Scholar] [CrossRef]
- Nisoli, M.; DeSilvestri, S.; Svelto, O. Generation of high energy 10 fs pulses by a new pulse compression technique. Appl. Phys. Lett. 1996, 68, 2793–2795. [Google Scholar] [CrossRef]
- Martinez, O. 3000 times grating compressor with positive group velocity dispersion: Application to fiber compensation in 1.3- 1.6 µm region. IEEE J. Quantum Electron., 1987, 23, 59–64. [Google Scholar] [CrossRef]
- Frantz, L. M.; Nodvik, J. S. Theory of pulse propagation in a laser amplifier. J. Appl. Phys. 1963, 1963 34, 2346–2349. [Google Scholar] [CrossRef]
- Le Blanc, C.; Curley, P.; Salin, F. Gain-narrowing and gain-shifting of ultra-short pulses in Ti: sapphire amplifiers. Opt. Commun. 1996, 131, 391–398. [Google Scholar] [CrossRef]
- Moulton, P. F. Spectroscopic and Laser Characteristics of Ti:Al2O3. J. Opt. Soc. Am. B 1986, 3, 125–133. [Google Scholar] [CrossRef]
- Osvay, K.; Kovács, A. P.; Heiner, Zs.; Kurdi, G.; Klebniczki, J.; Csatári, M. Angular dispersion and temporal change of femtosecond pulses from misaligned pulse compressors. IEEE J. Sel. Top. Quant. Electr. 2004, 213–220, 213–220. [Google Scholar] [CrossRef]
- Toth, S.; Stanislauskas, T.; Balciunas, I.; Budriunas, R.; Adamonis, J.; Danilevicius, R.; Viskontas, K.; Lengvinas, D.; Veitas, G.; Gadonas, D.; et al. SYLOS lasers – the frontier of few-cycle, multi-TW, kHz lasers, J. Phys. Photonics 2020, 2, 045003. [Google Scholar] [CrossRef]
- Osvay, K.; Stuhl, L.; Varmazyar, P.; Gilinger, T.; Elekes, Z.; Fenyvesi, A.; Hideghethy, K.; Szabo, R. E.; Füle, M.; Biró, B.; et al. Towards a 1010 n/s neutron source with kHz repetition rate, few-cycle laser pulses. Eur. Phys. J. Plus 2024, 139, 574. [Google Scholar] [CrossRef]
- Füle, M.; Kovács, A. P.; Gilinger, T.; Karnok, M.; Gaál, P.; Figul, S.; Marowsky, G.; Osvay, K. Development of an ultrathin liquid sheet target for laser ion acceleration at high repetition rates in the kilohertz range. HPLSE 2024, 12, e37. [Google Scholar] [CrossRef]
- Sugioka, K.; Cheng, Y. Ultrafast lasers—reliable tools for advanced materials processing, Light Sci. Appl. 2014, 3, e149. [Google Scholar]
- Phillips, K. C.; Ganghi, H.H.; Mazur, E.; Sundaram, S.K. Ultrafast laser processing of materials: a review, A. in Opt. and Phot. 2015, 7, 684. [Google Scholar] [CrossRef]
- Haney, S.J.; Berger, K.W.; Kubiak, G.D.; Rockett, P.D.; Hunter, J. Prototype high-speed tape target transport for a laser plasma soft-x-ray projection lithography source. Appl. Opt. 1993, 32, 6934–6937. [Google Scholar] [CrossRef]
- Murnane, M.M.; Kapteyn, H.C.; Rosen, M.D.; Falcone, R.W. Ultrafast X-ray Pulses from Laser-Produced Plasmas. Science 1991, 251, 531–536. [Google Scholar] [CrossRef]
- Kieffer, J.C.; Chaker, M. X-ray sources based on subpicosecond-laser-produced plasmas. Journal of X-Ray Science and Technology 1994, 4, 312–322.
- Giulietti, D.; Gizzi, L.A. X-ray emission from laser-produced plasmas. Rivista Del Nuovo Cimento 1998, 21, 1–93. [Google Scholar] [CrossRef]
- Rettig, C.L.; Roquemore, W.M.; Gord, J.R. Efficiency and scaling of an ultrashort-pulse high-repetition-rate laser-driven X-ray source. Appl Phys B 2008, 93, 365–372. [Google Scholar] [CrossRef]
- Jones, C.P.; Brenner, C.M.; Stitt, C.A.; Armstrong, C.; Rusby, D.R.; Mirfayzi, S.R.; Wilson, L.A.; Alejo, A.; Ahmed, H.; Allott, R.; et al. Evaluating laser-driven Bremsstrahlung radiation sources for imaging and analysis of nuclear waste packages. Journal of Hazardous Materials 2016, 318, 694–701. [Google Scholar] [CrossRef]
- Gruse, J.-N.; Streeter, M.J.V.; Thornton, C.; Armstrong, C.D.; Baird, C.D.; Bourgeois, N.; Cipiccia, S.; Finlay, O.J.; Gregory, C.D.; Katzir, Y.; et al. Application of compact laser-driven accelerator X-ray sources for industrial imaging. Nuclear Instruments and Methods in Physics Research Section A 2020, 983, 164369. [Google Scholar] [CrossRef]
- Kak, A.C.; Slaney, M. Principles of computerized tomographic imaging; Society for Industrial and Applied Mathematics: Philadelphia, 2001; ISBN 089871494X 9780898714944. [Google Scholar]
- Jan, S.; Santin, G.; Strul, D.; Staelens, S.; Assié, K.; Autret, D.; Avner, S.; Barbier, R.; Bardiès, M.; Bloomfield, P.M.; Brasse, D.; et al. GATE: a simulation toolkit for PET and SPECT. Phys Med Biol. 2004, 49, 4543–4561. [Google Scholar] [CrossRef]
- Snigirev, A.; Snigireva, I.; Kohn, V.; Kuznetsov, S.; Schelokov, I. On the possibilities of x-ray phase contrast microimaging by coherent high-energy synchrotron radiation, Rev. Sci. Instrum. 1995, 66, 5486–5492. [Google Scholar] [CrossRef]
- Wenz, J.; Schleede, S.; Khrennikov, K.; Bech, M.; Thibault, P.; Heigoldt, M.; Pfeiffer, F.; Karsch, S. Quantitative X-ray phase-contrast microtomography from a compact laser-driven betatron source, Nat. Commun. 2015, 6, 7568. [Google Scholar]
- Kalashnikov, M.; Cao, H.; Osvay, K.; Chvykov, V. Polarization-encoded chirped pulse amplification in Ti:sapphire: a way toward few-cycle petawatt lasers, Opt. Lett. 2016, 41, 25–28. [Google Scholar]
Figure 1.
Schematics of the laser system.
Figure 1.
Schematics of the laser system.
Figure 2.
Detailed schematics of the laser system, displaying the measured pulse energies and pulse widths between the various stages.
Figure 2.
Detailed schematics of the laser system, displaying the measured pulse energies and pulse widths between the various stages.
Figure 3.
The optical components of the front end, including the beam stabilization unit (BSM1, BSM2, BSD1, BSD2), the transmission grating (TG) stretcher, and the multipass confocal amplifier with concave mirrors (CV1, CV2).
Figure 3.
The optical components of the front end, including the beam stabilization unit (BSM1, BSM2, BSD1, BSD2), the transmission grating (TG) stretcher, and the multipass confocal amplifier with concave mirrors (CV1, CV2).
Figure 4.
Layout of the few-cycle arm. Insert: the beam profile of the compressed few-cycle pulses.
Figure 4.
Layout of the few-cycle arm. Insert: the beam profile of the compressed few-cycle pulses.
Figure 5.
The spectra of the pulses from the FE and after broadening in the HCF (a); and the corresponding measured temporal pulse shapes and pulse durations (b). The transform-limited pulse duration after the bulk and the chirped mirrors and then after the HCF and six chirped mirrors are 28.1 fs and 7.1, respectively.
Figure 6.
The layout of the pulse stretcher with a reflective diffraction grating (G), a concave and a convex spherical mirror (CV, CX), Faraday isolator (FR) together with the elements of beam conditioning and beam stabilization.
Figure 6.
The layout of the pulse stretcher with a reflective diffraction grating (G), a concave and a convex spherical mirror (CV, CX), Faraday isolator (FR) together with the elements of beam conditioning and beam stabilization.
Figure 7.
The schematics of the five-pass booster amplifier stage, including elements of continuous spectral, energy, and beam size monitoring (a); and the four-pass power amplifier (b).
Figure 7.
The schematics of the five-pass booster amplifier stage, including elements of continuous spectral, energy, and beam size monitoring (a); and the four-pass power amplifier (b).
Figure 8.
Spectral evolution of the pulses in the laser system. The spectrum of the negatively stretched FE pulses is blue shifted, while the positively chirped pulse amplification in the saturated BA and PA compensates for it, resulting in a bandwidth of 44 nm.
Figure 8.
Spectral evolution of the pulses in the laser system. The spectrum of the negatively stretched FE pulses is blue shifted, while the positively chirped pulse amplification in the saturated BA and PA compensates for it, resulting in a bandwidth of 44 nm.
Figure 9.
Spectral evolution in the amplifiers: measured seed (gray area), measured output of the power amplifier (orange), simulated power amplifier output (dark gray dashed) with spectral shaping in the frontend.
Figure 9.
Spectral evolution in the amplifiers: measured seed (gray area), measured output of the power amplifier (orange), simulated power amplifier output (dark gray dashed) with spectral shaping in the frontend.
Figure 10.
Schematics for the beamline between the power amplifier and the Treacy-type pulse compressor, including the contour of the vacuum chamber.
Figure 10.
Schematics for the beamline between the power amplifier and the Treacy-type pulse compressor, including the contour of the vacuum chamber.
Figure 11.
The near-field (a) and the far-field (b) beam profiles of the compressed beam.
Figure 11.
The near-field (a) and the far-field (b) beam profiles of the compressed beam.
Figure 12.
Long-term stability of the laser system, characterized by the output energy and the energy of the pump laser (a) and the spectrum (b).
Figure 12.
Long-term stability of the laser system, characterized by the output energy and the energy of the pump laser (a) and the spectrum (b).
Figure 13.
The beam size (a) and the size of the beam focused by a 2000 mm focal length achromatic lens (b), measured on the compressed beam reflected from a 1% sampler.
Figure 13.
The beam size (a) and the size of the beam focused by a 2000 mm focal length achromatic lens (b), measured on the compressed beam reflected from a 1% sampler.
Figure 14.
The spatial stability measurement of the liquid sheet target. Insert: the schematics of the setup.
Figure 14.
The spatial stability measurement of the liquid sheet target. Insert: the schematics of the setup.
Figure 15.
The cutting assembly (a), and the hole precision-cut onto a pressed C2D4 tablet (b).
Figure 15.
The cutting assembly (a), and the hole precision-cut onto a pressed C2D4 tablet (b).
Figure 16.
Schematics of the X-ray CT system testing the data acquisition and mechanical control systems (a). A slice of a Rubik’s cube (b), as part of the full image reconstruction.
Figure 16.
Schematics of the X-ray CT system testing the data acquisition and mechanical control systems (a). A slice of a Rubik’s cube (b), as part of the full image reconstruction.
Figure 17.
The experimental setting for the transmission tomography simulations (a). Projection images acquired with 100k photons of 5 keV energy (b), 10M photons of 5 keV energy (c), 100k photons of 10 keV energy (d), and 100k photons of 20 keV energy (e).
Figure 17.
The experimental setting for the transmission tomography simulations (a). Projection images acquired with 100k photons of 5 keV energy (b), 10M photons of 5 keV energy (c), 100k photons of 10 keV energy (d), and 100k photons of 20 keV energy (e).
Figure 18.
The blue line shows the cross-section of the phase-contrast image of a hollow plastic fiber. The orange line depicts the cross-section of the absorption image. The solid black lines mark the outer edges of the fiber, the dashed black lines mark the inner edges.
Figure 18.
The blue line shows the cross-section of the phase-contrast image of a hollow plastic fiber. The orange line depicts the cross-section of the absorption image. The solid black lines mark the outer edges of the fiber, the dashed black lines mark the inner edges.
|
Disclaimer/Publisher’s Note: The statements, opinions and data contained in all publications are solely those of the individual author(s) and contributor(s) and not of MDPI and/or the editor(s). MDPI and/or the editor(s) disclaim responsibility for any injury to people or property resulting from any ideas, methods, instructions or products referred to in the content. |
© 2024 by the authors. Licensee MDPI, Basel, Switzerland. This article is an open access article distributed under the terms and conditions of the Creative Commons Attribution (CC BY) license (http://creativecommons.org/licenses/by/4.0/).
