1. Introduction
The Moravian-Silesian Region in the Czech Republic, particularly the city of Ostrava, is recognized as a significant air pollution hot spot in Europe. This situation arises historically from a combination of industrial activity, high population density, and geographical factors that worsen air quality levels. The topography of the Moravian-Silesian Region contributes to the accumulation of pollutants, especially during winter months when temperature inversions are common. This leads to poor dispersion, resulting in elevated concentrations of air pollutants. Additionally, air pollution from neighboring areas, particularly from the Silesian Voivodeship (Poland), also plays a significant role in the given context [
1,
2,
3].
Recently, "Polish smog" was proposed as a specific type of air pollution that occurs in Poland, particularly in the winter months. It is characterized by high concentrations of particulate matter (PM), such as PM
2.5 and PM
10, as well as polycyclic aromatic hydrocarbons like benzo(a)pyrene [
4]. This type of smog is particularly prevalent in Eastern Europe, where it arises from the burning of coal and other solid fuels for heating purposes, especially during winter months. When compared with photo-chemical smog found in industrialized urban areas, which is driven mainly by volatile organic compounds (VOCs) and nitrogen oxides leading to high ozone levels, Polish smog is more closely linked to residential heating practices and industrial emissions.
Yet, another type of smog event, which is further considered through this paper is caused by particulate matter originating from Sahara desert. Dust storms can transport particles over thousands of kilometers, affecting air quality far from their source. The transport of Saharan dust poses significant challenges for air quality management and public health in Europe. Although this phenomenon is more common in the Mediterranean region, it can occasionally cause a significant deterioration in air quality for Central European countries.
Low-cost sensor (LCS) networks have emerged as a promising solution for monitoring air pollution and providing smog alerts as it can supplement data from regulatory-grade reference instruments [
5]. By filling in spatial and temporal gaps in air quality monitoring such information can provides a more comprehensive understanding of pollution patterns both at local and regional level. Citizen science projects involving the public in sensor deployment can further expand the reach of these networks [
6,
7,
8]. However proper calibration of LCS is crucial to ensure data accuracy and reliability [
9].
In principle, uncertainties of factory calibrated LCS response are studied by experiments in controlled (laboratory) or uncontrolled (field) ambient conditions [
10,
11,
12]. Such calibration procedure is followed by selection of suitable numerical correction method and estimation of parameters using reference datasets for model training or testing purposes [
13]. Co-location of the LCS node with reference instruments in real outdoor atmosphere is usually performed over the period of several weeks in order to accumulate appropriately large datasets required for the reliable outputs of the calibration process. Prolonged period of co-location enables to investigate seasonal variability of LCS performance across a wide range of environmental conditions relevant for the target locality.
Following questions are mainly addressed through the paper: Which information (e.g. in relevance to public smog alerts) can be extracted from data provided by LCS and CAMS model predictions and what is their case-specific reliability compared to reference data from air quality monitoring (AQM) station?
2. Materials and Methods
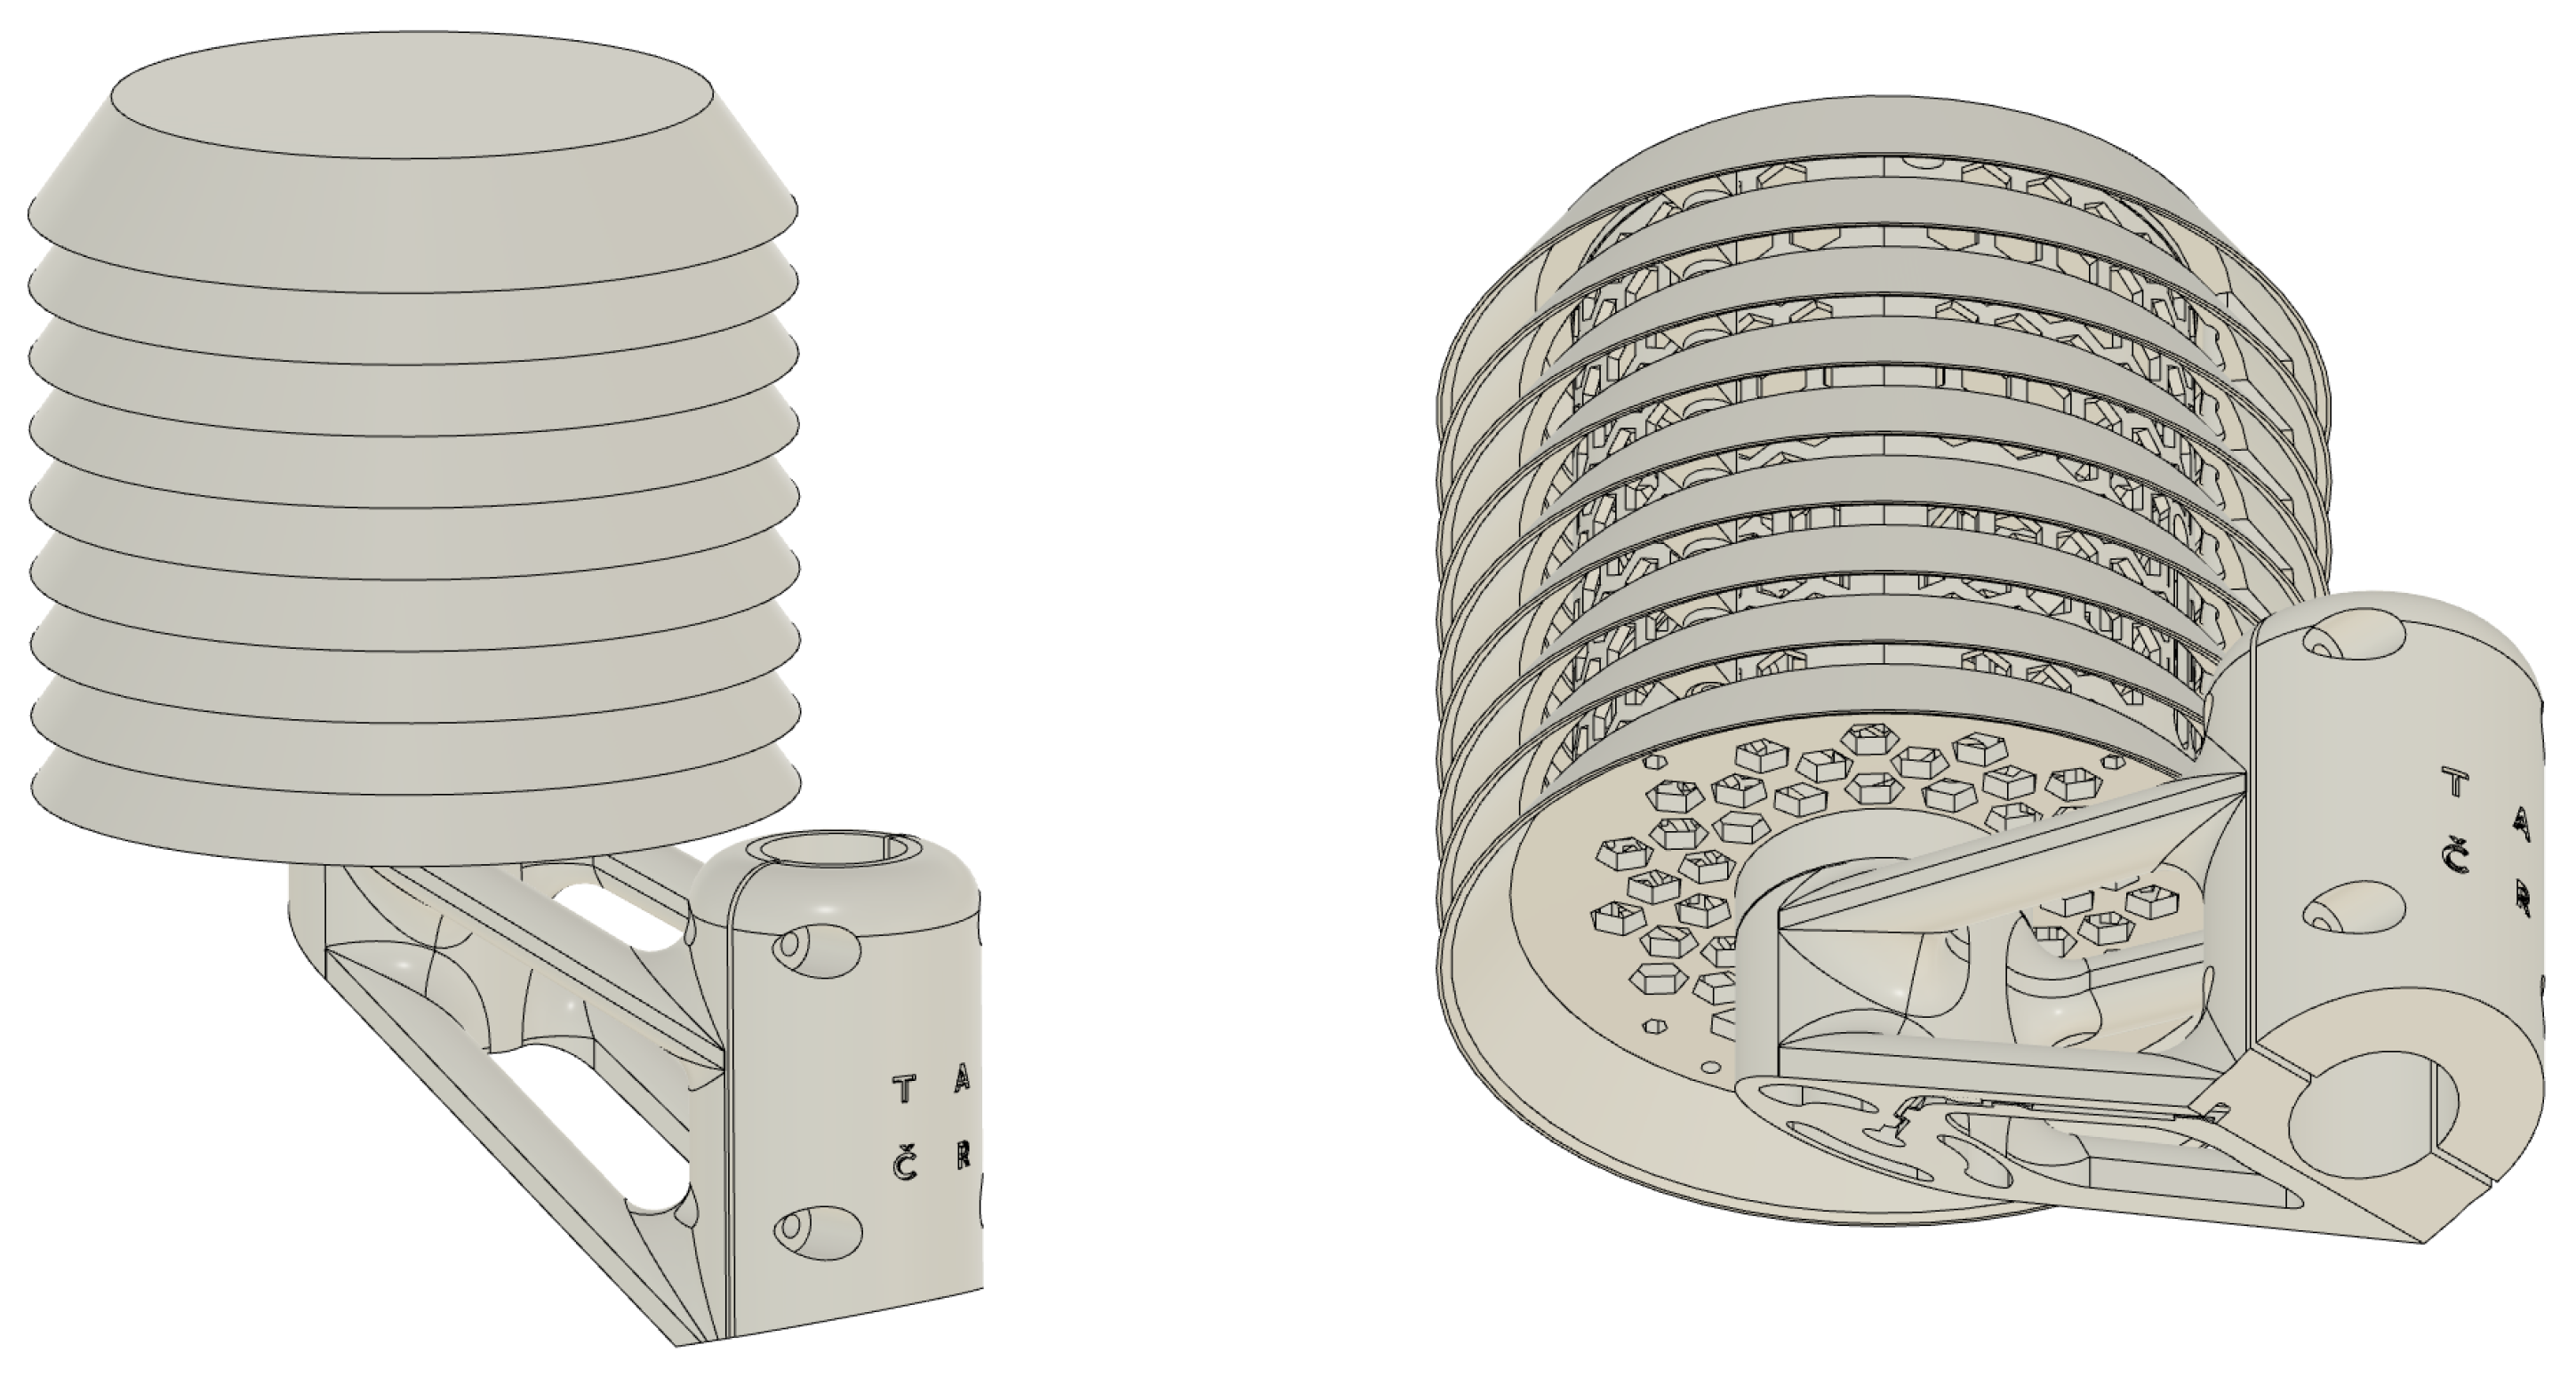
Our prototype LCS sensor node (more details described in
Appendix A) was mounted of the roof of AQM station, see
Figure 1. This setup allows for direct comparison between the outputs of the LCS node and data from reference-grade instruments.
2.1. Selection of Low-Cost Sensors
Following our goals, LCS node is equipped with a set of low-cost sensors suitable for monitoring of target air pollutants for the specific area, which is particulate matter (PM), carbon monoxide (CO). Selection of the gas and PM sensors was mainly based on the extensive literature survey and experience of previous investigators. Availability of the sensors (distribution in EU) were also taken into account as well as affordability of the entire LCS node setup and level of complexity relevant to requirements for its integration and further development.
For particulate matter (PM) measurement, the node utilizes two sensors: Sensirion SPS30 and Alphasense OPC-N3. The SPS30 is a laser-based optical sensor well-suited for measuring fine particulate matter (especially PM1) mass concentration based on the principle of light scattering. The OPC-N3 also uses optical particle counting, when detecting a wider range of particle sizes, from 0.35 µm to 40 µm, across 24 size bins enabling particle size distribution to be determined, which is critical for understanding the composition of atmospheric aerosols and determination of their origin in relevance to source apportionment.
For carbon monoxide monitoring, the LCS node incorporates the Alphasense CO-B4 electrochemical sensor. This sensor can detect CO concentrations between 0 to 1,000 ppm with a resolution of 0.1 ppm. Its sensitivity ranges from 55 to 85 nA/ppm, providing accurate detection of small changes in CO levels.
Knowledge of atmospheric pressure, temperature and humidity is essential when aiming at corrections of LCS response in various ambient conditions. For this purpose, digital module including Bosch Sensortech BME280 sensor was integrated in LCS node. This sensor should operate with pressure accuracy of hPa, temperature accuracy of , and humidity accuracy of RH.
2.2. Co-Location Site and Reference Instruments
The co-location measurements of the LCS node were conducted at an air quality monitoring (AQM) station of Health Institute located in the municipal area of the city of Ostrava, which is close to various industrial sites (e.g. metalurgical, chemical, etc.). The AQM station provides the information on meteorological conditions, i.e. wind speed, wind direction as well as reference air quality data in hourly intervals. Atmospheric pressure, temperature, and humidity are measured using the COMET T3113D sensor for temperature and humidity, and the NXP Semiconductor MPX4115A for pressure.
For CO measurement, the HORIBA APMA-370 analyzer is used, which operates on the nondispersive infrared (NDIR) spectroscopy principle. The TEOM 1400 analyzer was utilized as PM reference during entire winter evaluation period including S1 episode. This instrument measures PM10 by drawing air through a filter mounted on an oscillating balance, with the mass of collected particles altering the oscillation frequency to calculate PM concentration. At the end of March 2024, the TEOM 1400 was replaced by Palas FIDAS 200 analyzer, which employs optical scattering technology for continuous real-time reference measurement of size distribution and following quantification of PM1, PM2.5, and PM10.
2.3. Overview of Co-Location Measurement
Low-cost sensors are often collocated with reference instruments in laboratory or field conditions for period of several weeks in order to improve their performance. In our case, an evaluation measurement campaign lasting for three months (from mid-November 2023 to mid-February 2024) was initially planned to be carried out in order to verify and validate the performance of individual LCS and their variation for seasonal meteorological conditions typical in the Moravian-Silesian region.
Accidentally, smog alert events, which occurred in Ostrava during December 2023 and April 2024 were also recorded during extended period of co-location. These datasets enabled us to focus our attention on performance of LCS and CAMS data versus reference measurements during the episodes of serious air quality deterioration, see
Table 1.
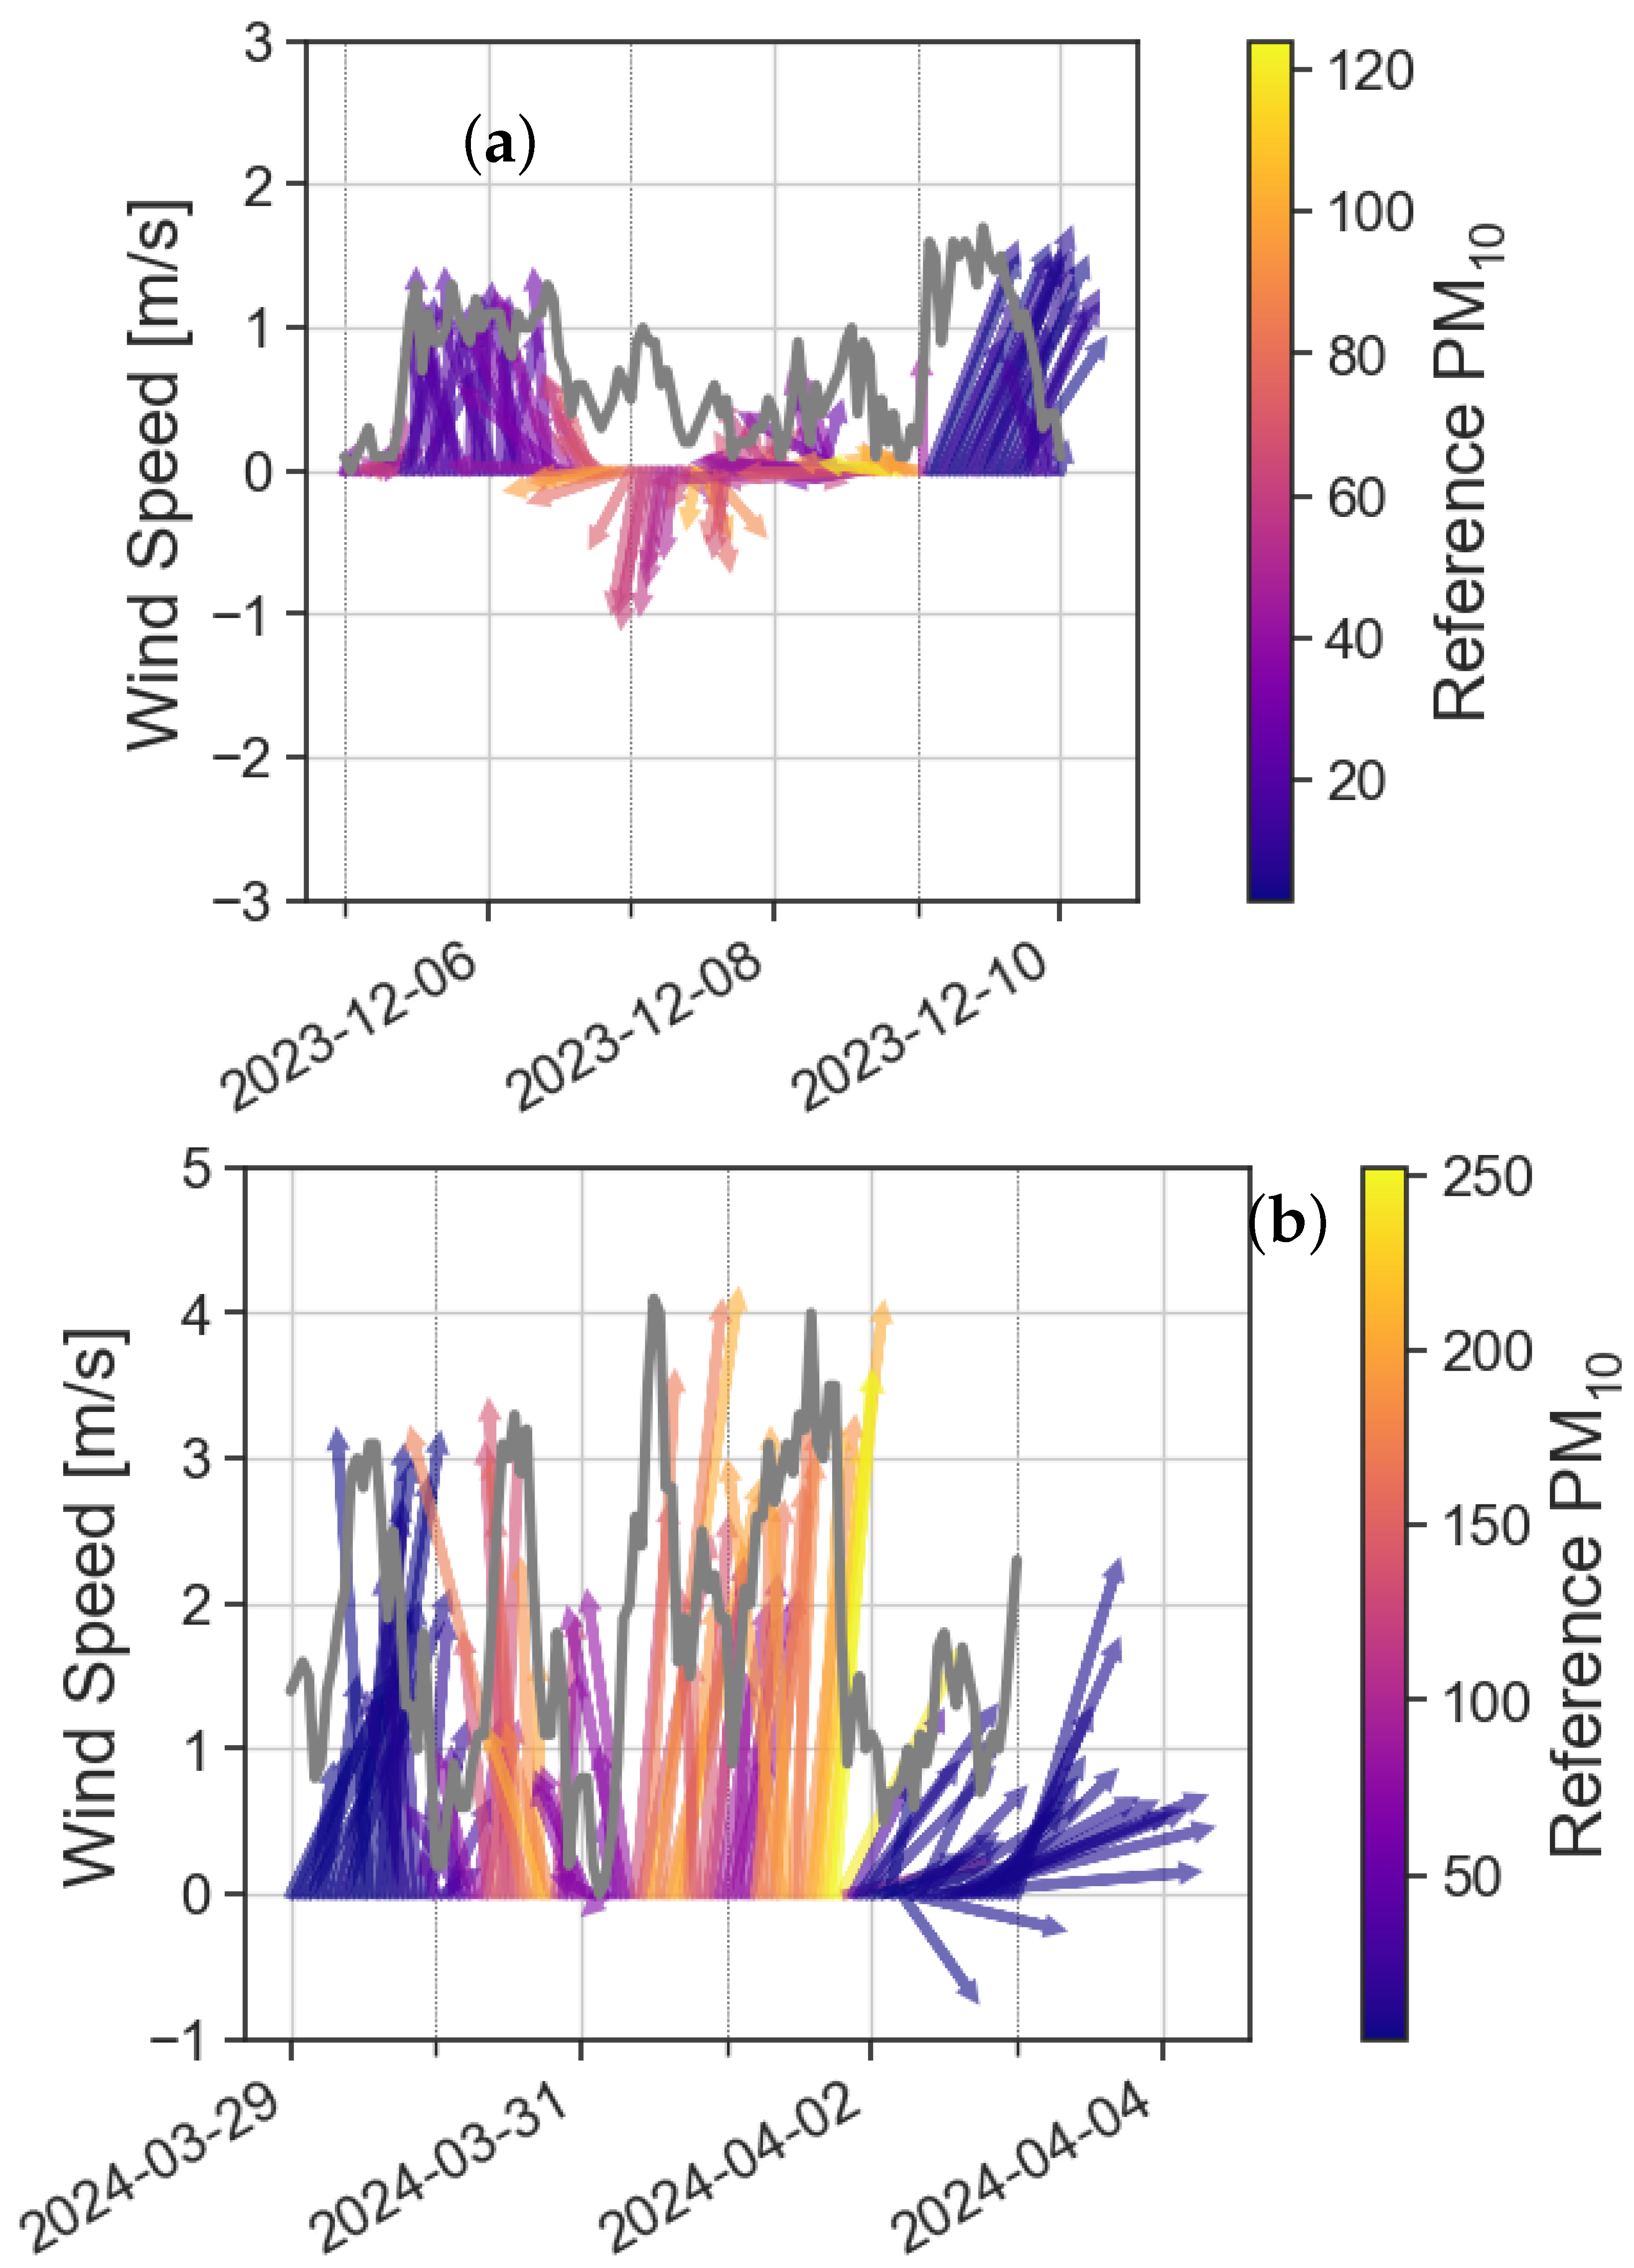
It is worth to note that atmospheric conditions for S1 episode is typical for above mentioned "Polish smog". In the given case the highest concentrations of particulate matter are generally recorded at low temperatures, specifically between -10°C and 0°C. Additionally, higher atmospheric pressure correlates with increased PM concentrations, as stable air masses inhibit vertical mixing and allow pollutants to accumulate near the surface. [
4]. Evolution of above described meteorological situation can be identified from Figure based on reference data from AQM station.
Different atmospheric conditions for S2 episode corresponds to seasonal Saharan dust storm over Central Europe
1. Moderate speed of wind blowing from south-west direction can be clearly identified during PM
10 maxima from the
Figure 2.
2.4. Datasets and Preparatory Analysis
Reference 1-hour averaged data were extracted from monthly datasets provided by the Health Institute (AQM station) after verification involving and replacement of values of measurement below limit of detection () by the value equal to .
Similarly, co-location site-specific timeseries of concentrations for selected pollutant (CO, O
3, NO
2, PM
10, PM
2.5 and Dust) based on the forcast of the CAMS ENSAMBLE model [
14] with 11 km spatial resolution were downloaded in the form of comma-separated value (CSV) files from
Open Meteo webpage. Monthly datasets extracted from LCS node (10-minute averages of sensor readings available from
SOASENSE project webpage were converted into hourly timeseries using
pandas (Python library) resample method and ordered with reference and CAMS model data according to relevant GMT timestamps. Multilinear fitting (MLR) of the carbon monoxide LCS voltage were converted into concentration using linear model form
scikit-learn (Python library). Entire dataset of winter measurements, i.e. from November 2023 to February 2024 was assumed as representative for the given step. Temperature reading form LCS node was converted into Kelvins in order to avoid numerical issues relevant to negative values. Entire dataset was splitted into training and testing subsets having 1232 and 2392 datapoints respectively. Finally, MLR model having high coefficient of determination, i.e.
and acceptable Mean Average Error (
g/m
3) for predicted CO concentration was estimated asuming only T[K] and CO-B4 sensor voltage values as predictors with presumed parametrization of the Equation
1:
where
is a working electrode voltage [V],
is an auxillary electrode voltage [V] at a given Geenwich (i.e. GMT) time
and case-specific values of relevant MLR coefficients are as follows:
,
,
.
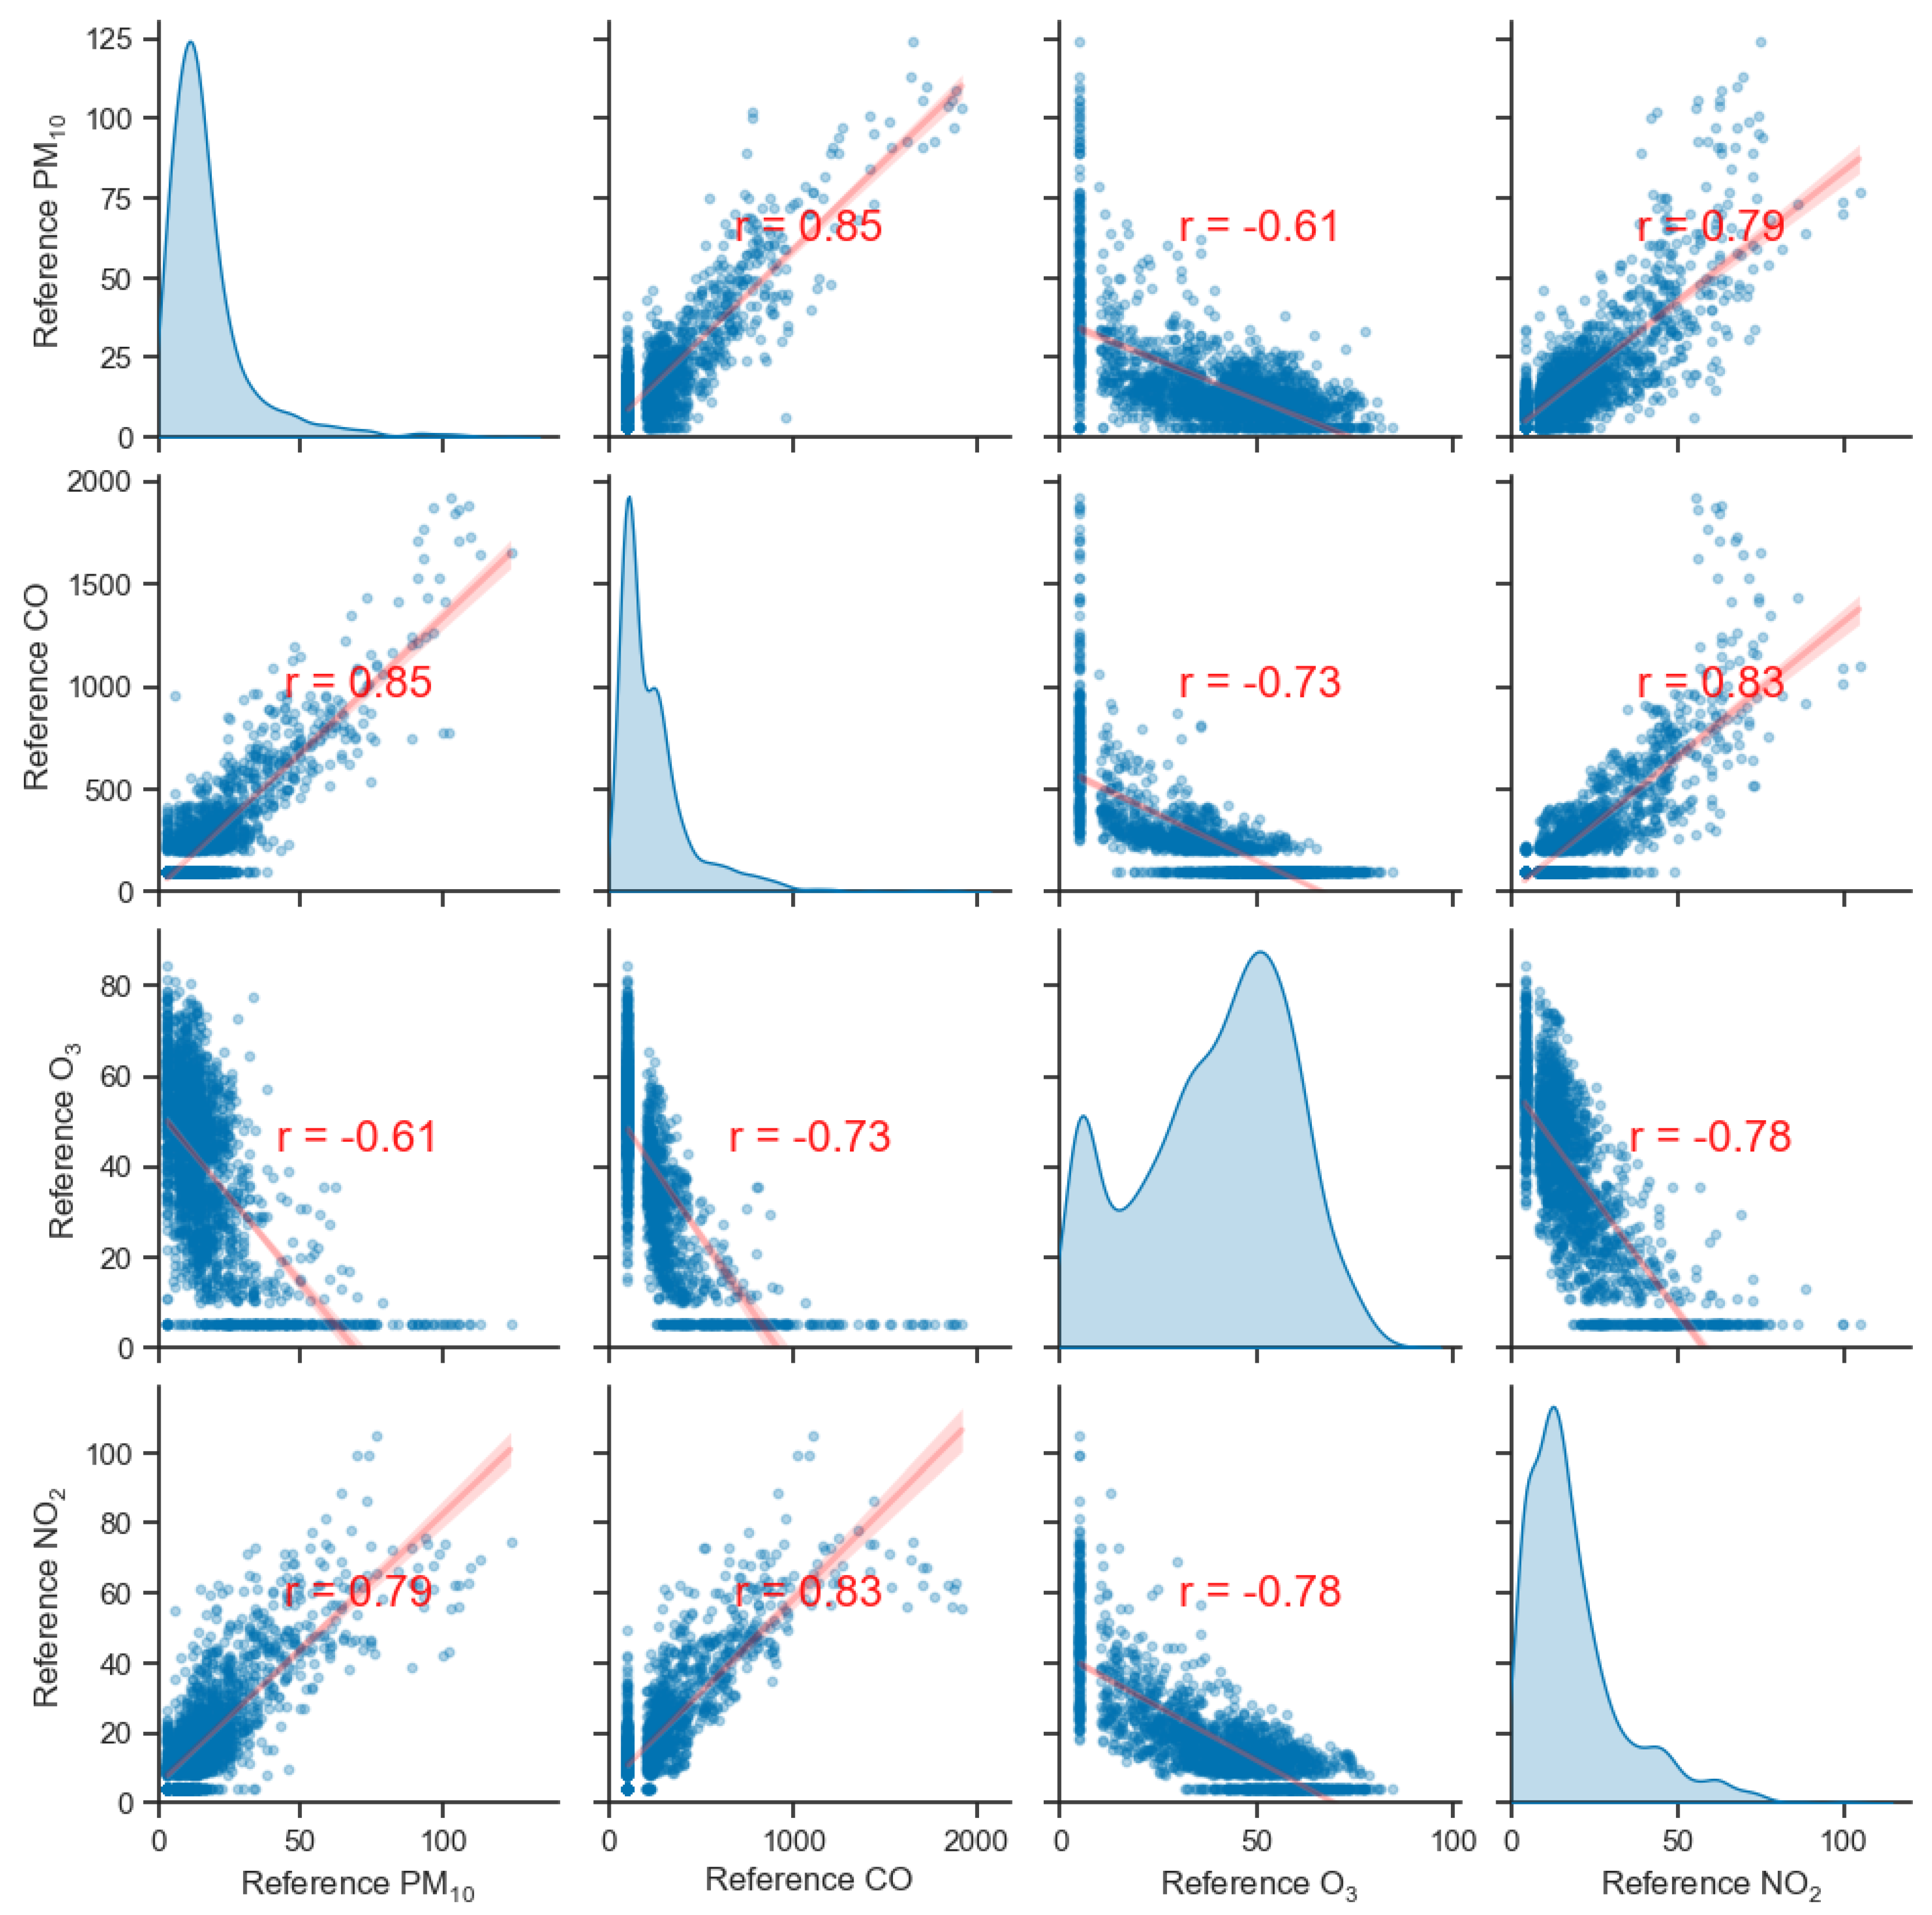
Exploratory data analysis including Correlation Matrix and Kernel Density Estimation (KDE) of dataset pairs was performed using seaborn (Python library). Subsequently, simple linear regression (SLR) and plots of diurnal variations of air pollutant concentrations were performed employing relevant methods implemented in atmospy (Python library). Particle size distribution measured by Alphasense OPC-N3 sensor were analyzed using the smps-py (Python library).
4. Discussion
We first discuss our results regarding the response of the CO-B4 sensor and compare them with the observations of previous researchers. In the work of Camprodon et al. [
8], a very high correlation (
) and low error (
ppm) of CO measurements were observed during more than two months of CO-B4 sensor deployment. The sensor was found to behave linearly with respect to the CO concentrations and its decrease during the co-location period was negligible, which is quite consistent with our measurements. Our data obtained during the winter evaluation period (3 months) show slightly higher coefficient of determination
when re-calibration according to the Equation
1 is evaluated and compared with the reference data. Similar performance of this sensor is reported in Han et al. [
11], evaluating an almost identical season with similar ranges of air pollutants but with temperatures in the range 0-20°C. Our co-location was carried out at much lower temperatures, while temperature correction following Equation
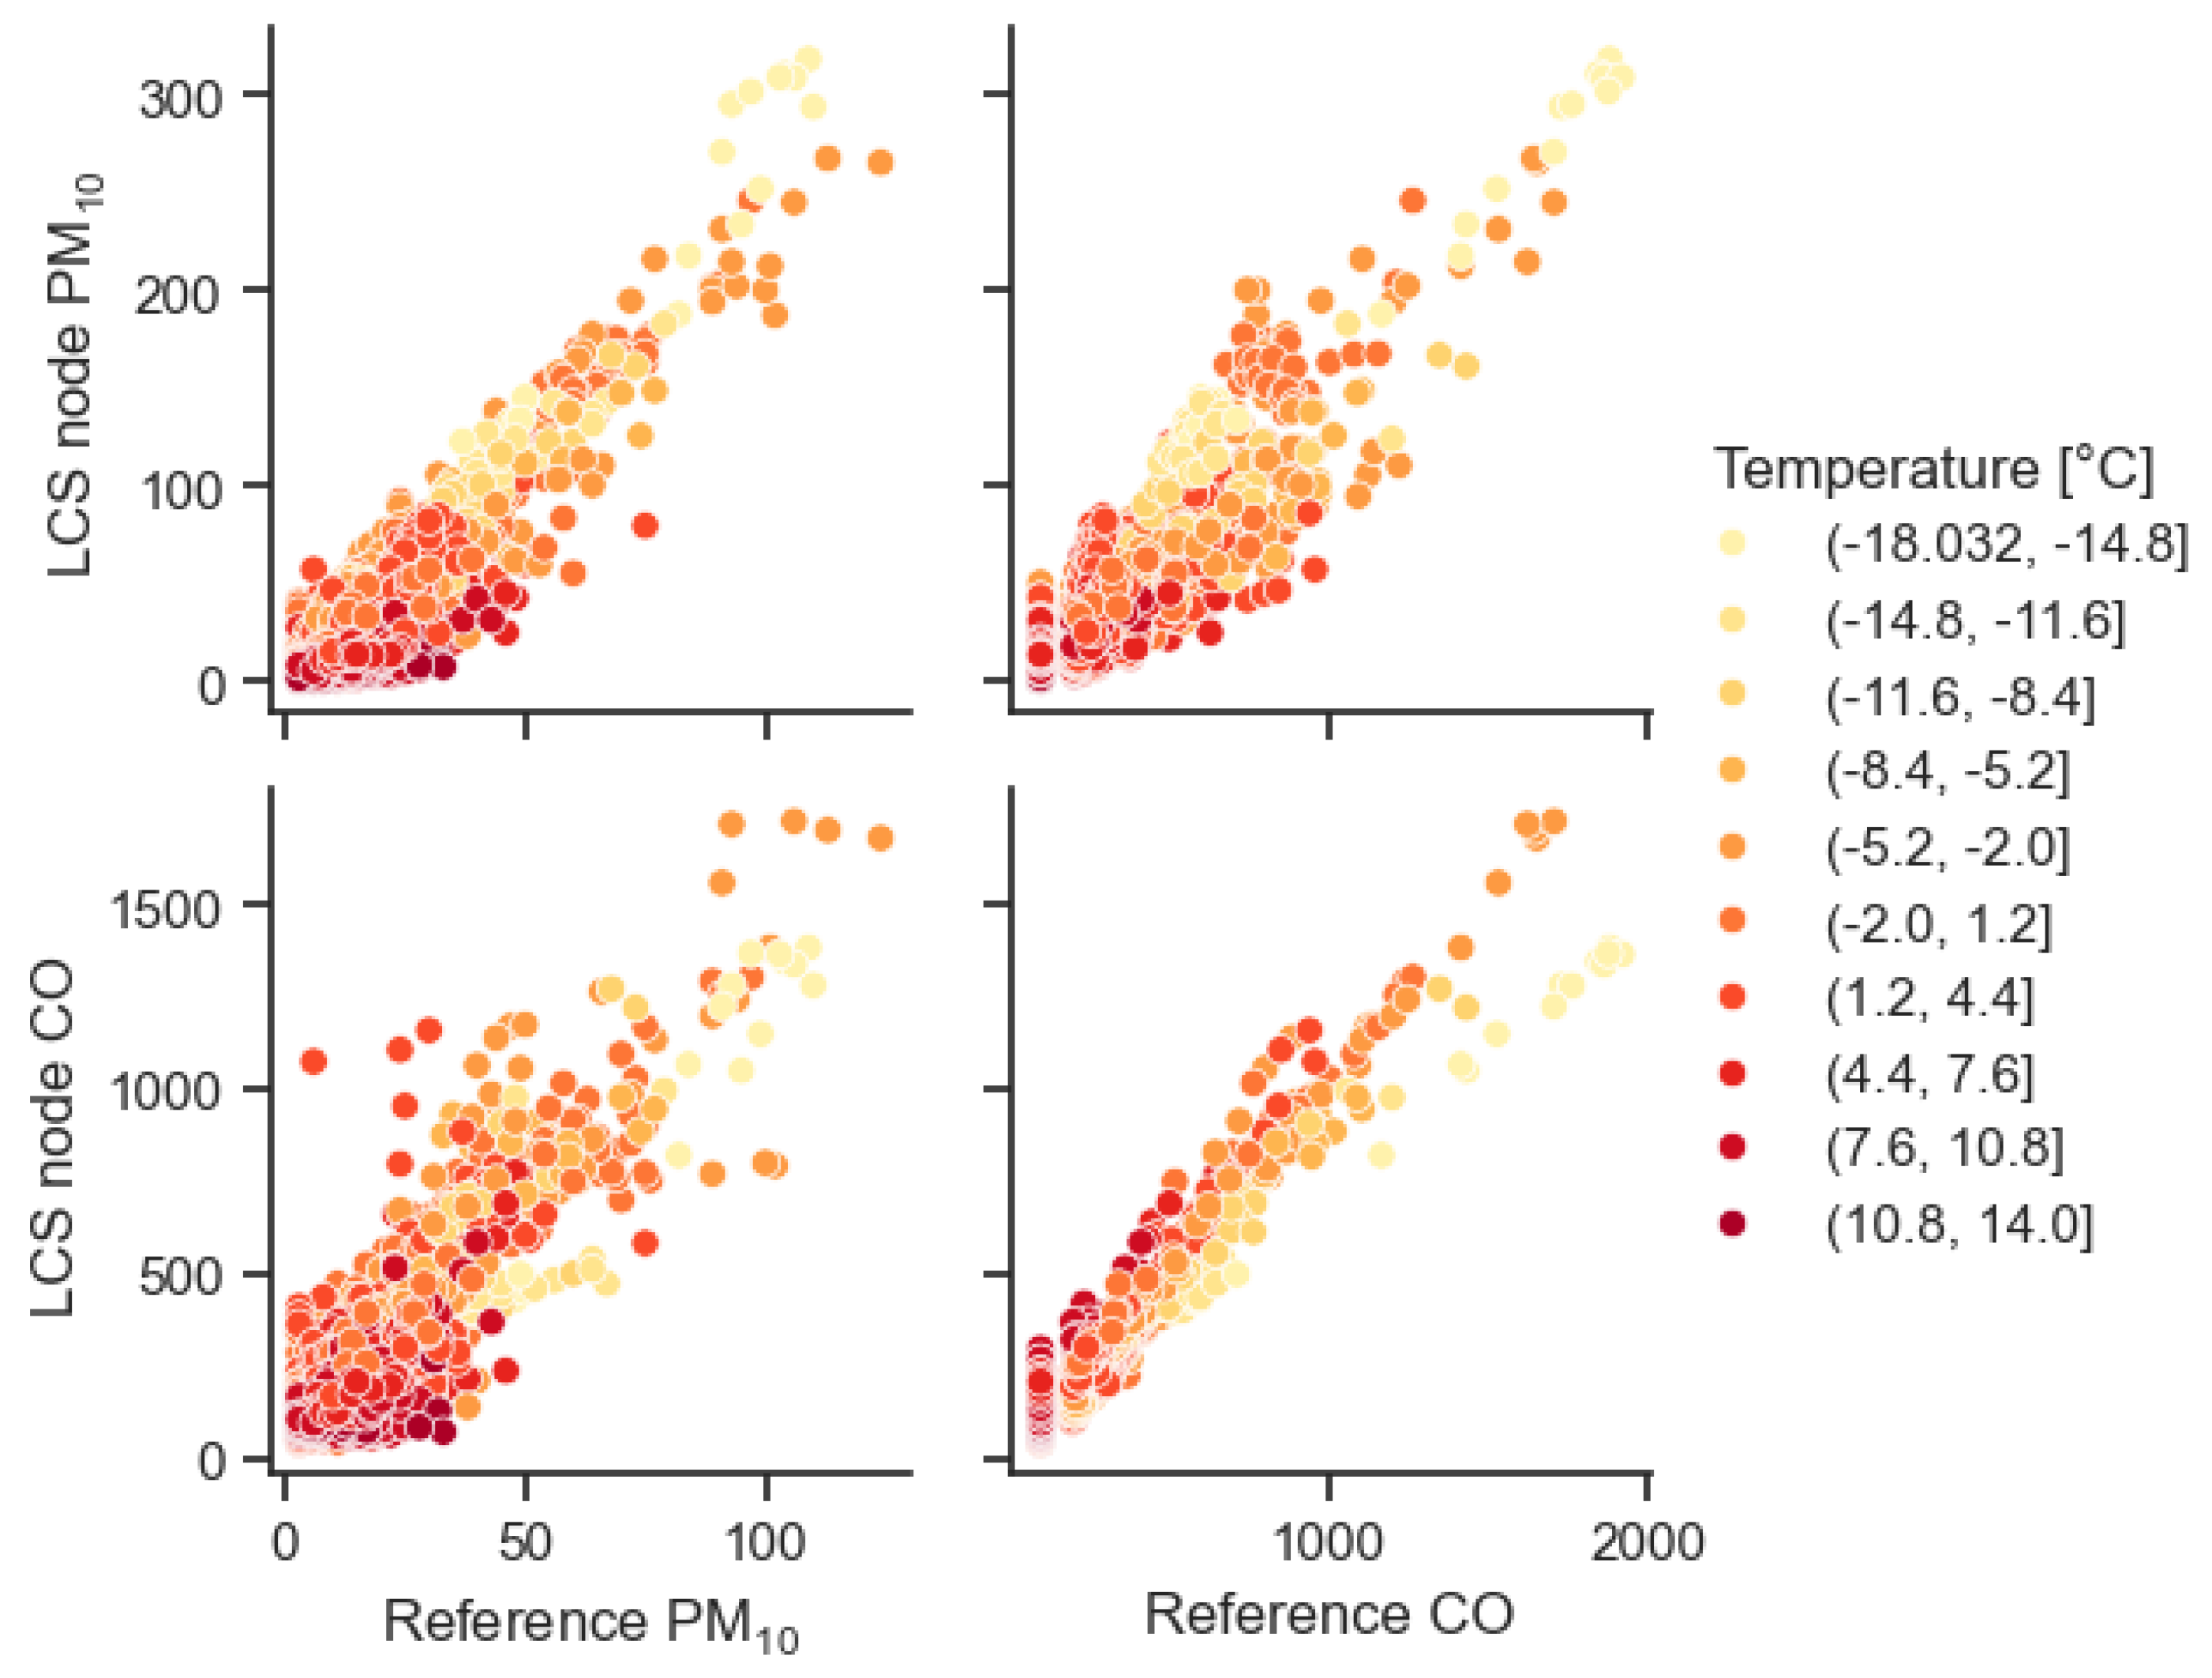
1 seems to be less effective at extremely low ambient temperatures (below -10°C) and high CO levels, see
Figure 10. Conversely, slightly overestimated values of [CO]
LCS were observed during warmer days (with
5 °C). In the given case, we can attribute biased [CO]
LCS values to direct temperature effect on sensing mechanism, i.e. reduced rate of (electro-)chemical reactions, and corresponding non-linearities.
On the other hand, as far as the influence of temperature on the response of the SPS30 sensor in our local conditions is concerned, we anticipate rather an indirect effect consisting in the change of particle size distribution due to the increased need for domestic and industrial heating at lower ambient temperatures.
This hypothesis is consistent with a number of previous publications, e.g. [
15,
16], mentioning in particular the work of Zareba et al. [
16], which show a negative correlation between ambient temperature and the air pollution in an area close to our co-location site. Their study confirms that in moderate climate zones with coal burning as the primary source of air pollution, temperature is the most significant factor influencing monthly average PM
10 concentrations.
As in the case of our co-location site, many AQM stations in the region covered by this paper are not yet equipped with reference instruments for measuring fine PM fractions. Moreover, the air quality criteria recommended by WHO, EU, or local authorities for declaring a smog alert situation usually take into account PM10 concentrations or rarely PM2.5. Therefore, our main motivation was to find a solution to reliably determine PM10 values based on LCS data.
Below we briefly summarize some of the findings from previous studies on the performance of SPS30 sensors, in particular on their reliability in measuring fine and coarse PM concentration.
In a study of Roberts et al.[
17] co-locating the SPS30 with regulatory methods, it achieved an average bias adjusted
for 24-hour averages and 0.57 for 1-hour averages, suggesting reasonable accuracy in real-time monitoring. The mean bias error was minimal, indicating that the SPS30 provides reliable data for PM
2.5 levels.
According to Kuula et al. [
18] the SPS30 sensor is suitable to be used for measuring PM
1 particles when
, indicating high accuracy and consistency. Whereas for PM
2.5 particles this value was 0.83 and for PM
10 particles it was 0.12, which is characterized by low measurement reliability and this sensor is not suitable for larger particle sizes.
Vogt et al. [
19] also confirm that the SPS30 sensor is the mostly accurate and reliable for PM
1 particles with
. For PM
2.5 particles the
value was around 0.73. The results for PM
10 particles indicate a higher value (
) compared to the results of Kuula et al. [
18], yet still not suitable for practical AQM applications.
Molino Ruada et al. [
20] confirmed the trend of the SPS30 sensor being able to measure PM
1 particles with a high accuracy of
. As particle size increases, the accuracy of the sensor decreases yielding
for PM
2.5 and
for PM
10, respectively.
The physical explanation for the unreliable measurement of larger particles is related to design of optically based LCS and principle of their operation (i.e. light-scattering). Above all, shortened viewing angles, losses occuring during particle intake and also differences in particle shape and refractive index needs to be taken into account as well as the effect of humidity and sensor aging, when these LCS are exposed to realistic outdoor conditions.
Considering these findings together with the results of our LCS node measurements against the reference data, we can conclude that the SPS30 provides a reliable response to fine dust particles, especially PM
1, even under Saharan dust storm conditions. The PM
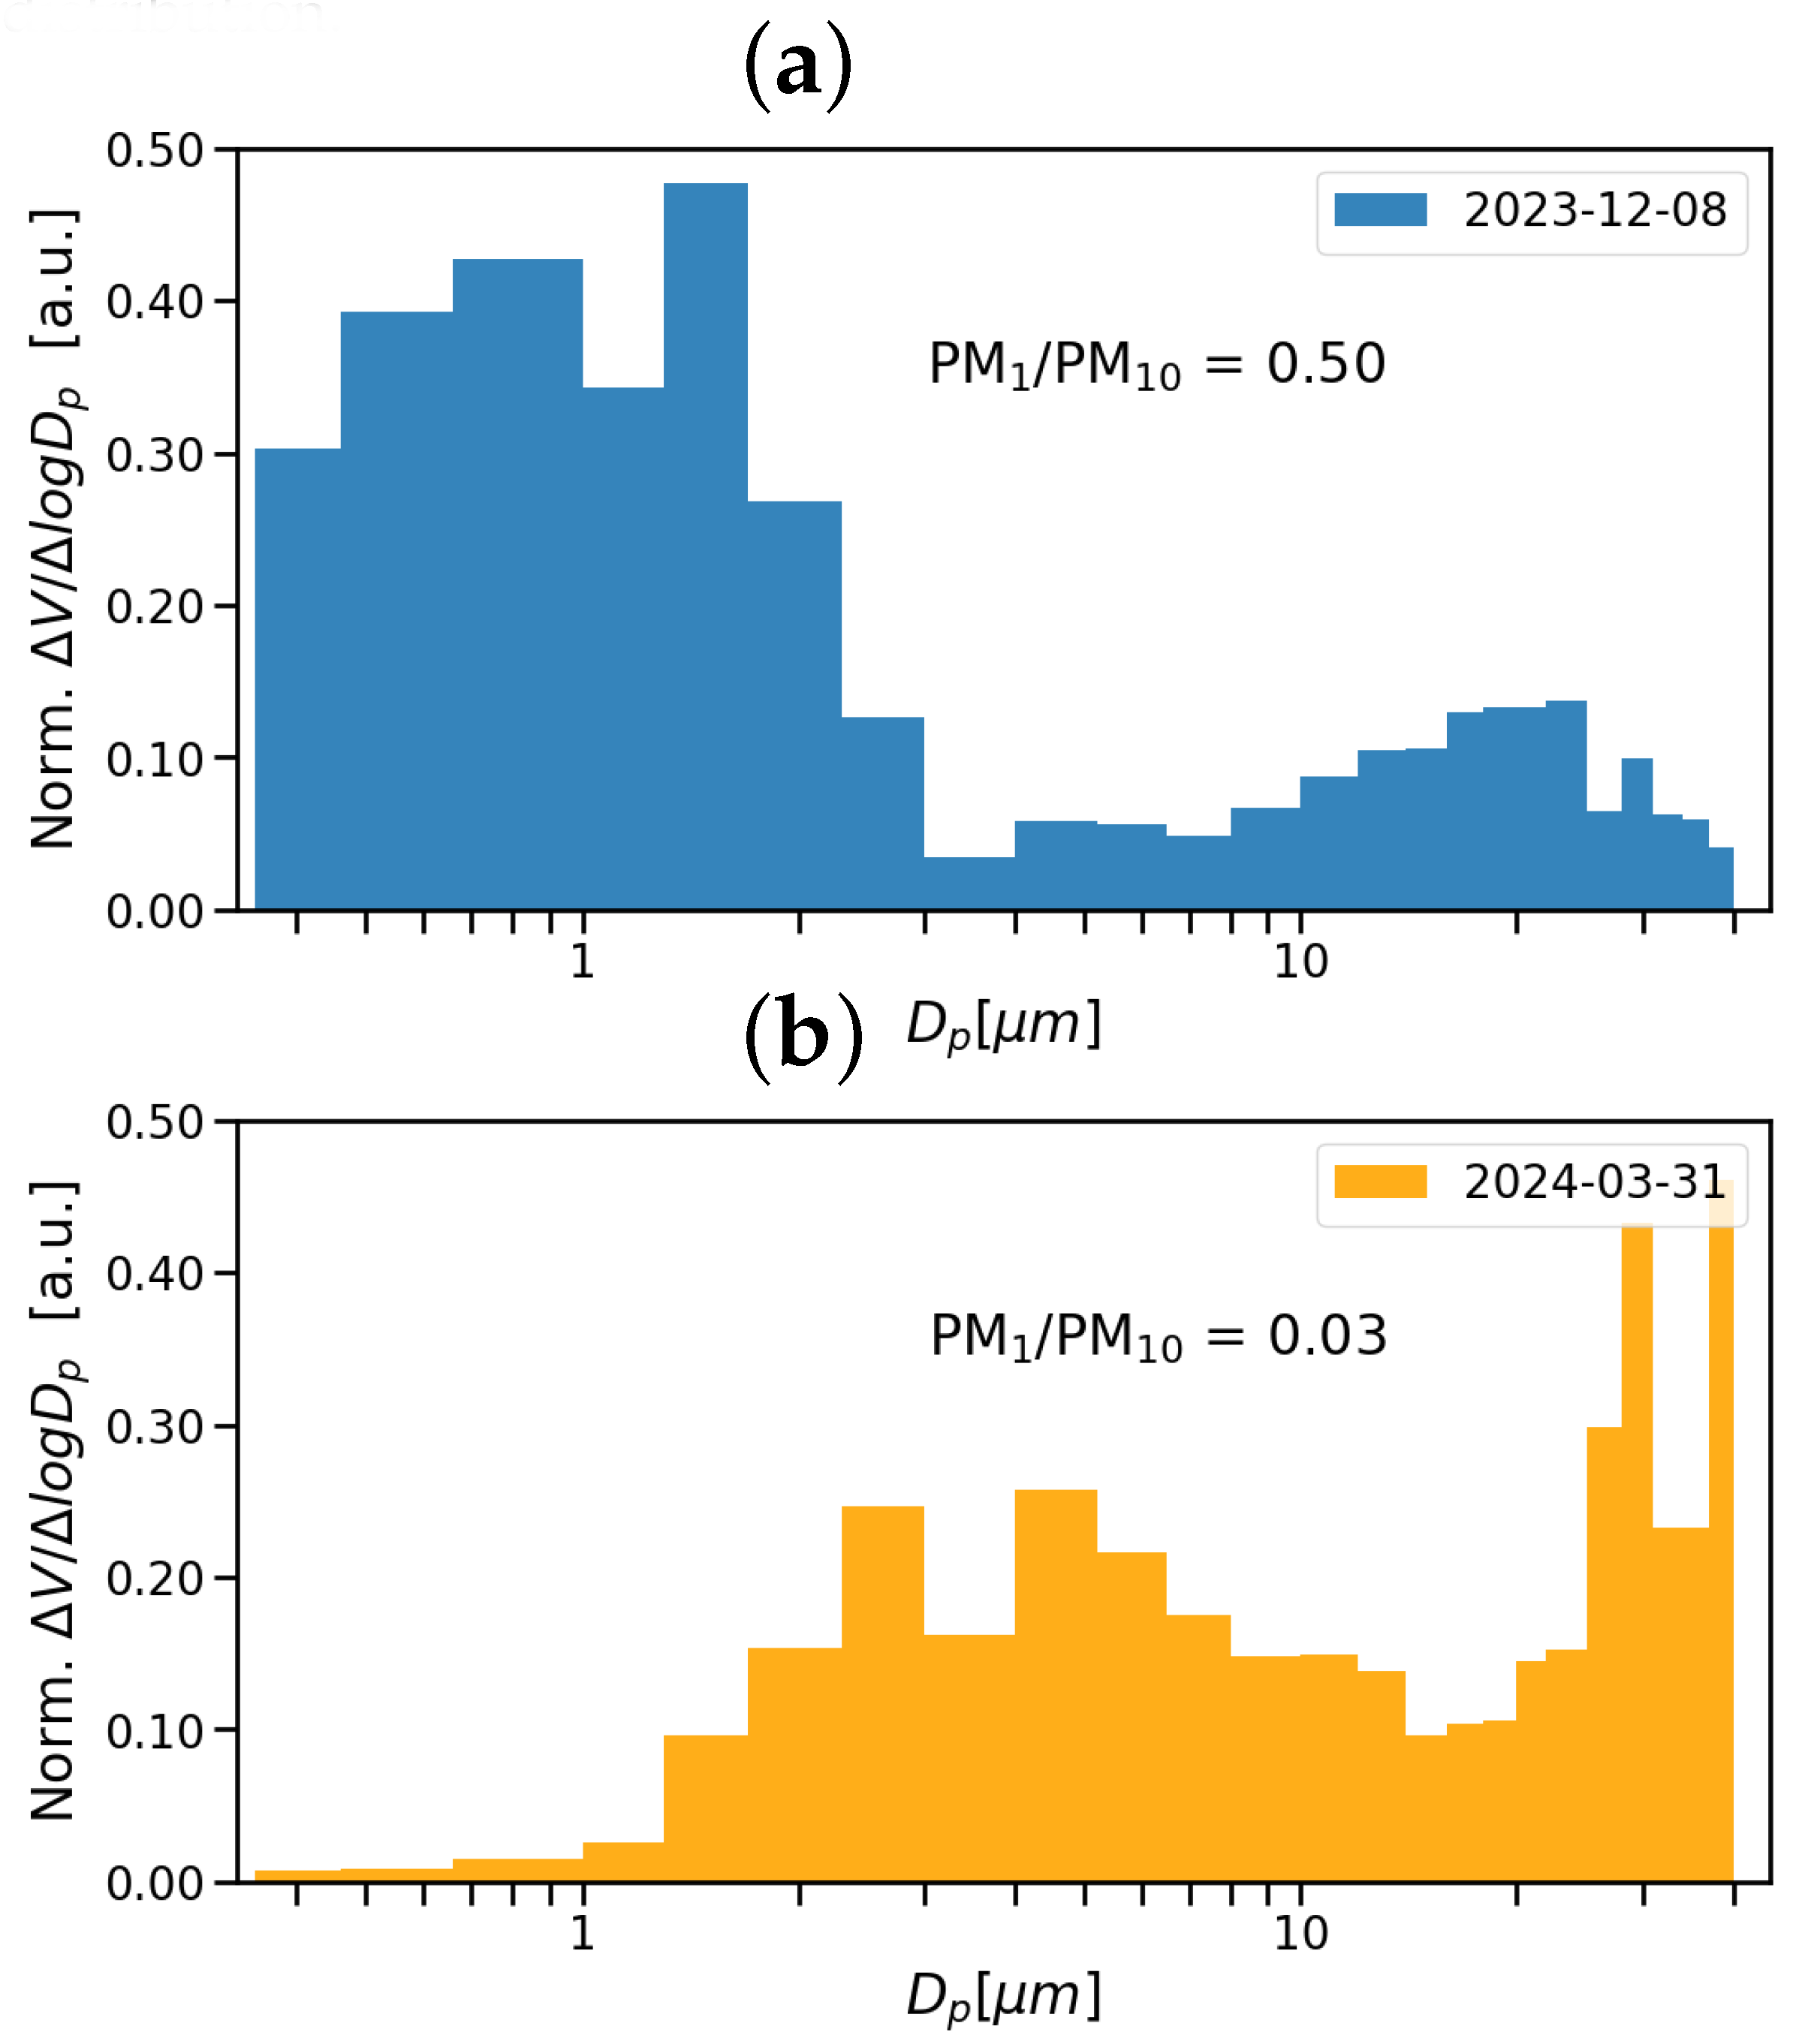
10 readings from the SPS30 sensor according to its original calibration (i.e. factory setting) are burdened with a systematic bias whose trend (negative or positive) depends on the type of smog situation. Therefore, to conclude this discussion, let us take a closer look at the size-resolved histogram of the PM volume concentration distribution obtained from the OPC-N3 sensor on days with maximum PM
10 concentration in the case of S1 and S2 episodes, see
Figure 11. The difference in particle size resolution is noticeable, with both data showing significant bimodality. In the case of the Polish smog (S1), the total volume is clearly dominated by PM
1. On the other hand, in the case of the Saharan dust storm (S2), particles with aerodynamic diameter
m have the highest volume concentration from the total PM
10 found in the size-resolved distribution.
In analogy to recent work by Kaur and Kelly [
21], we propose a strategy to derive PM
10 concentrations from the biased PM-LCS response based on correction factors obtained from the OPC-N3 sensor working in concert. Further assume an Equation
2 and Equation
3, which can be used to adjust the slope
and
respectively to ideal value
. Then we can use the inverse estimation in order to determine that the calibration of SPS30 is presumably carried out with the aerosol mixture having [PM
1/PM
10]
SPS,calibr≈0.2 ± 0.05, which corresponds to a common (traffic-related) air pollution in urban areas.
Therefore, the PM10 values measured by SPS30 are systematically biased if the actual [PM1/PM10] values differs significantly from the [PM1/PM10]SPS,calibr. In other words, it was proved, that the biased SPS30 reading of PM10 can be roughly corrected using [PM1/PM10]OPC divided by a factor (). More precise corrections will only be possible after further analysis and experimentation.
4.1. Practical applicability
This work represents a significant step towards strengthening the role of citizen science and democratizing environmental data in AQM, and demonstrates the importance of academic support for these efforts as the current state of knowledge and technology is still rather prohibitive to the straightforward deployment of commercially available LCS systems in their default (factory calibrated) setup. Therefore, careful evaluation of LCS performance (in the form of co-location measurements) and consideration of specific conditions of their deployment at local and regional level before their practical application is inevitable.
In the framework of this work, we have been able to explain the seasonal variability of the Sensirion SPS30 sensor response and a correction method increasing the reliability of its PM10 response have been established. According to our findings, we can exploit the strengths of the SPS30 sensor and overcome its previously reported limitations. Correction of biased response can be expressed based on fine-to-coarse particle ratio, e.g. as PM1/PM10 evaluated from OPC-N3 sensor. It was also found that additional temperature correction needs to be estimated for CO-B4 sensor to account for biased response at extremely low temperatures.
Our future aim is to enhanced reliablity of the regional AQM data when combining CAMS model predictions and LCS response by the means of machine-learning approaches employing parameterized (e.g. MLR or HDMR [
22]) or non-parameterized methods [
23].
4.2. Limitations
This study has several limitations, mainly due to seasonal character and the influence of weather conditions relevant to the location and the winter season. It also specifically focuses only on the response of selected LCS systems integrated into a prototype node that is still under development. In our study, only individual pieces of the selected LCSs were tested and evaluated, thus not including the influence of inter-unit variability. Due to the duration of the co-location measurement, LCS aging factors were neglected.
Author Contributions
V.N.: Writing – original draft, Resources, Methodology, Investigation, Data curation, Conceptualization. M.D.: Writing – original draft, Validation, Methodology, Investigation. P.B.: Conceptualization, Investigation, Resources. V.K.: Methodology, Investigation, Data curation. J.S.: Software, Investigation. P.P.: Software, Investigation. K.N.: Investigation. M.B.: Writing – original draft, Visualization, Investigation. R.L.: Investigation. Š.B.: Investigation. B.M.: Investigation. M.V.: Software, Data curation, Investigation. A.N.: Software, Data curation, Investigation. M.L.: Data curation, Investigation. J.Su.: Project administration, Resources, Investigation. H.C.: Investigation. D.K.: Data curation, Investigation. J.W.: Supervision, Funding acquisition.
Figure 1.
LCS sensor node placed on the roof of the reference air quality monitoring station of the Health Institute Ostrava located in the Mariánské Hory district.
Figure 1.
LCS sensor node placed on the roof of the reference air quality monitoring station of the Health Institute Ostrava located in the Mariánské Hory district.
Figure 2.
Temporal evolution of wind speed and wind orientation during S1 (a) and S2 (b) episodes respectively. Wind speed is plotted by grey solid line in positive scale. Wind orientation vectors are represented by arrows have length proportional to wind speed and color relevant to [PM10]REF concentration.
Figure 3.
Correlation matrix with scatter plots, linear regression and histograms for reference pollutant concentrations from winter evaluation period. All scales are depicted in [g/m3] units. Pearson correlation coefficients r are depicted in red for non-diagonal subplots.
Figure 3.
Correlation matrix with scatter plots, linear regression and histograms for reference pollutant concentrations from winter evaluation period. All scales are depicted in [g/m3] units. Pearson correlation coefficients r are depicted in red for non-diagonal subplots.
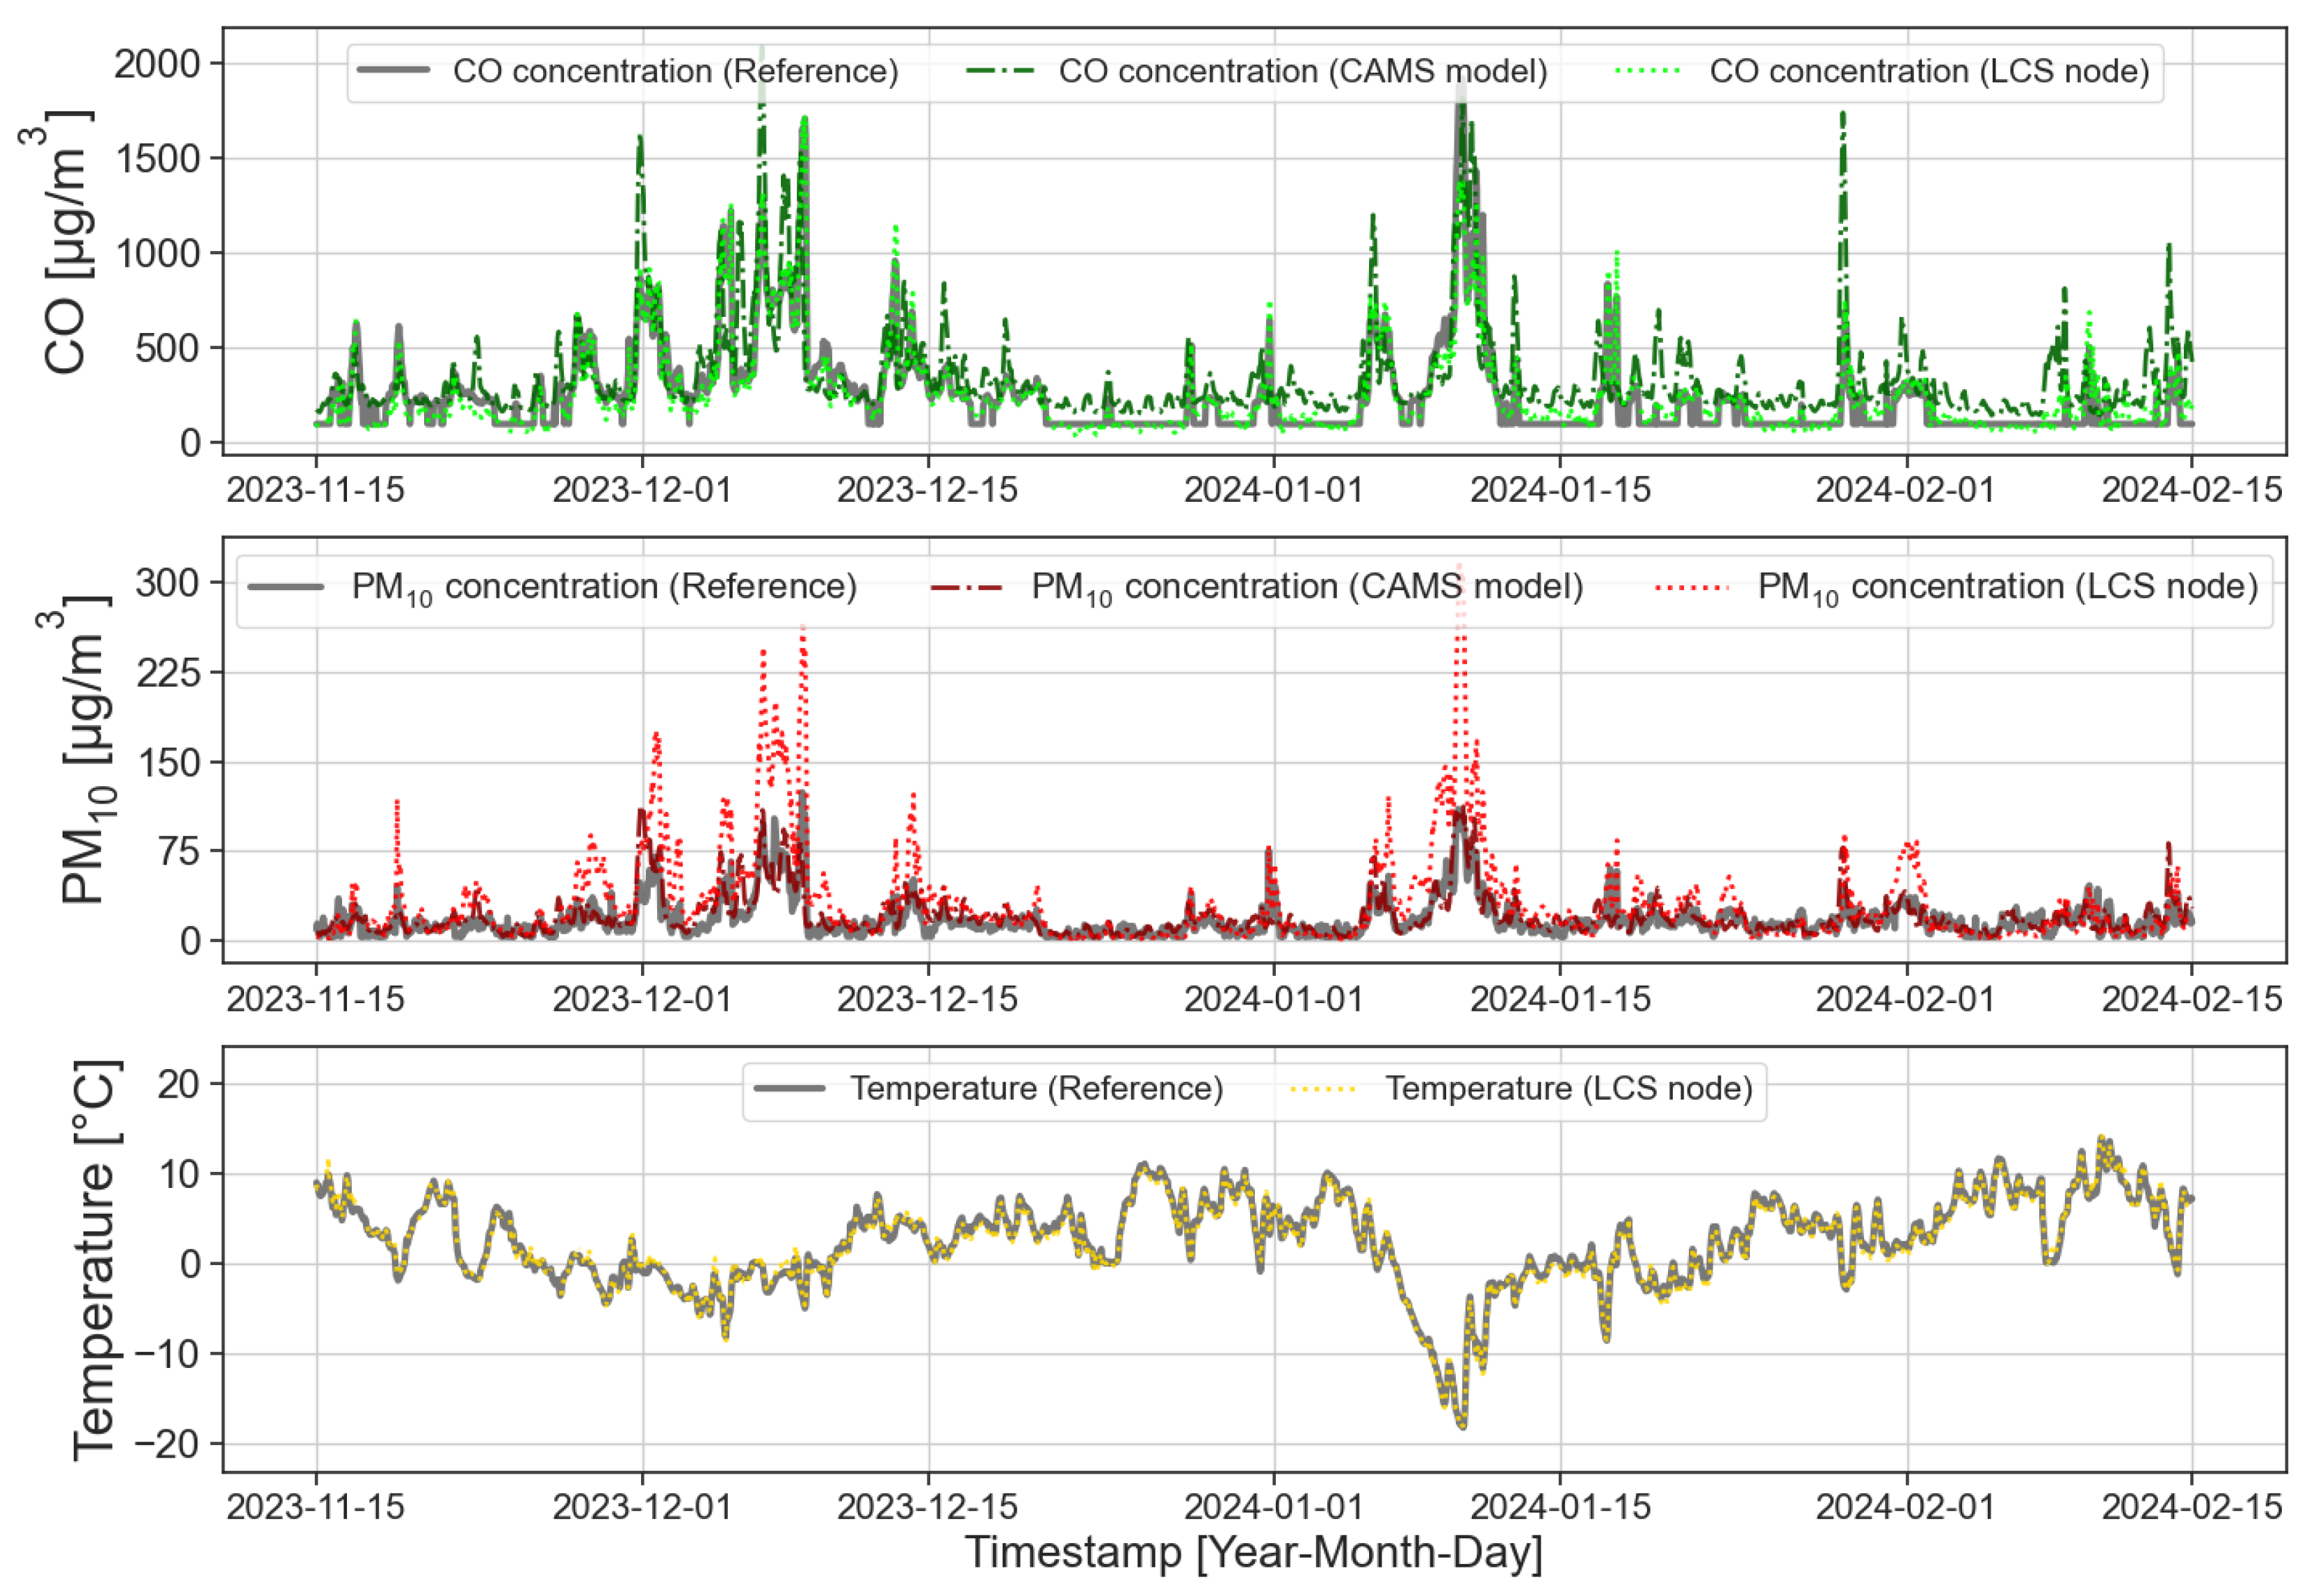
Figure 4.
Comparison of the selected hourly data series from winter evaluation period.
Figure 4.
Comparison of the selected hourly data series from winter evaluation period.
Figure 5.
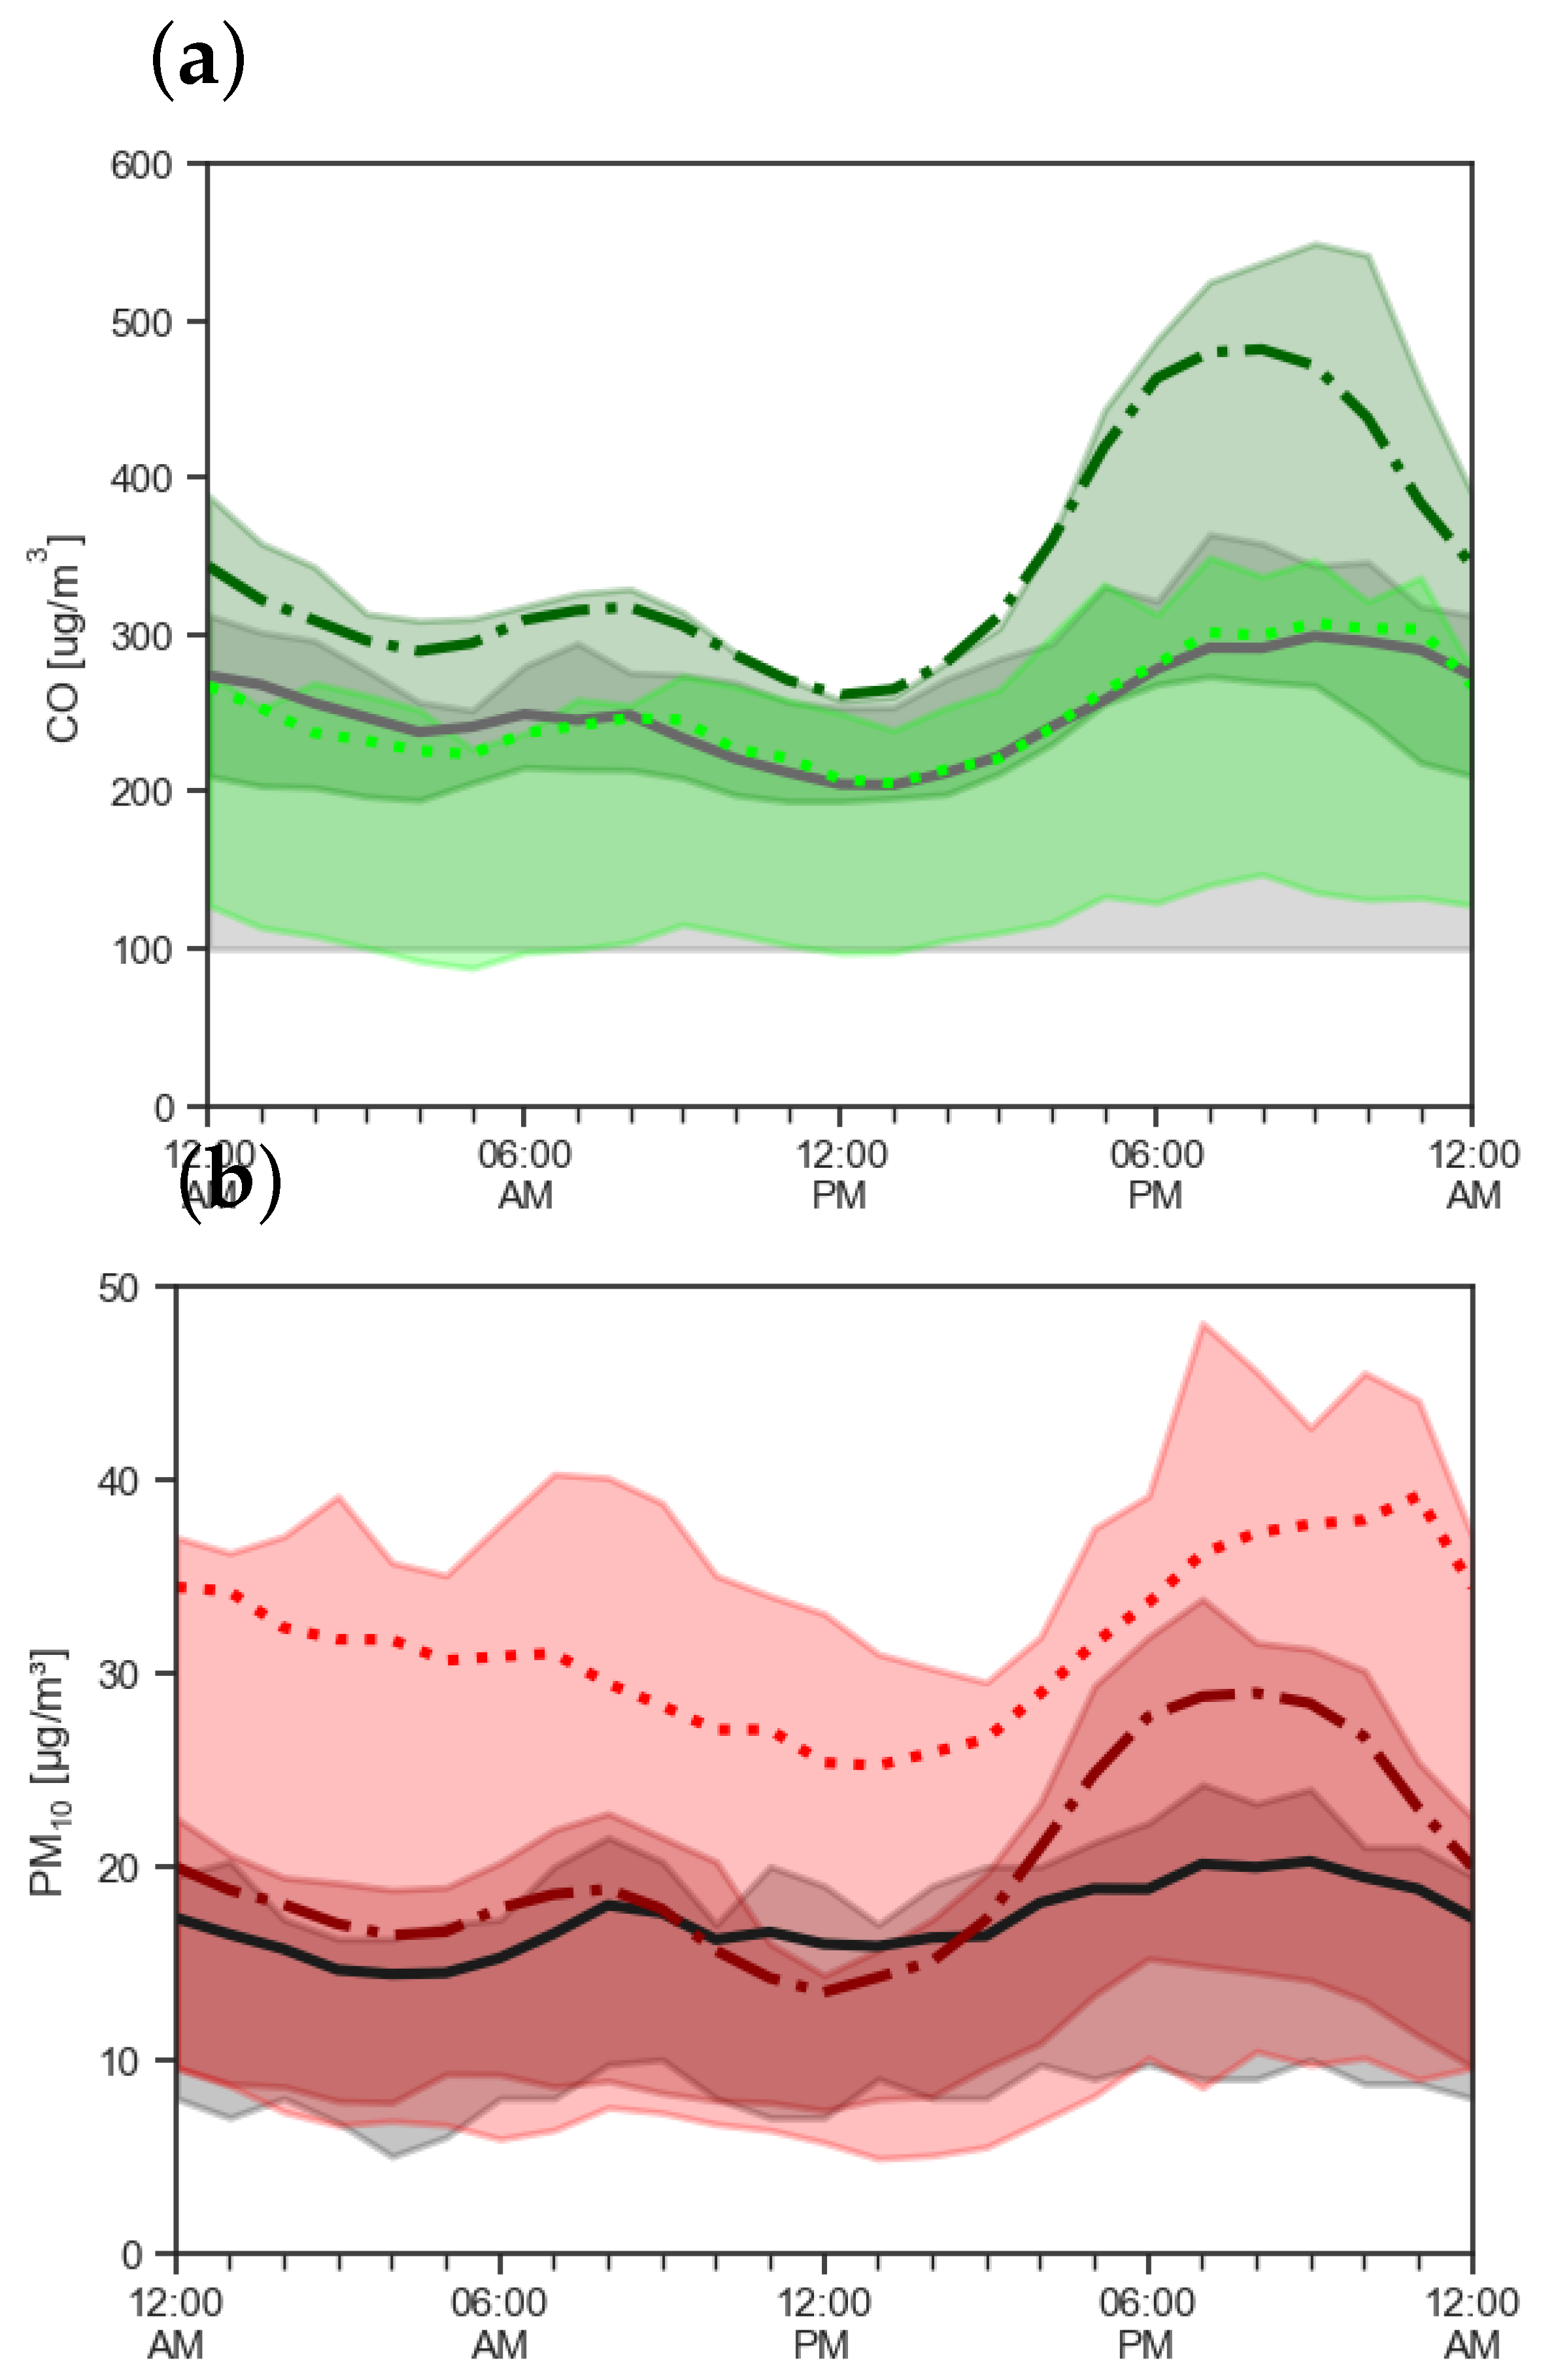
Plot of diurnal variations of CO concentration (a) and PM10 (b) during winter evaluation period extracted from reference instrument (solid line), LCS node (dotted line) and CAMS model (dash-dotted line) data with mean value (thick lines) and the interquartile range (shaded regions).
Figure 5.
Plot of diurnal variations of CO concentration (a) and PM10 (b) during winter evaluation period extracted from reference instrument (solid line), LCS node (dotted line) and CAMS model (dash-dotted line) data with mean value (thick lines) and the interquartile range (shaded regions).
Figure 6.
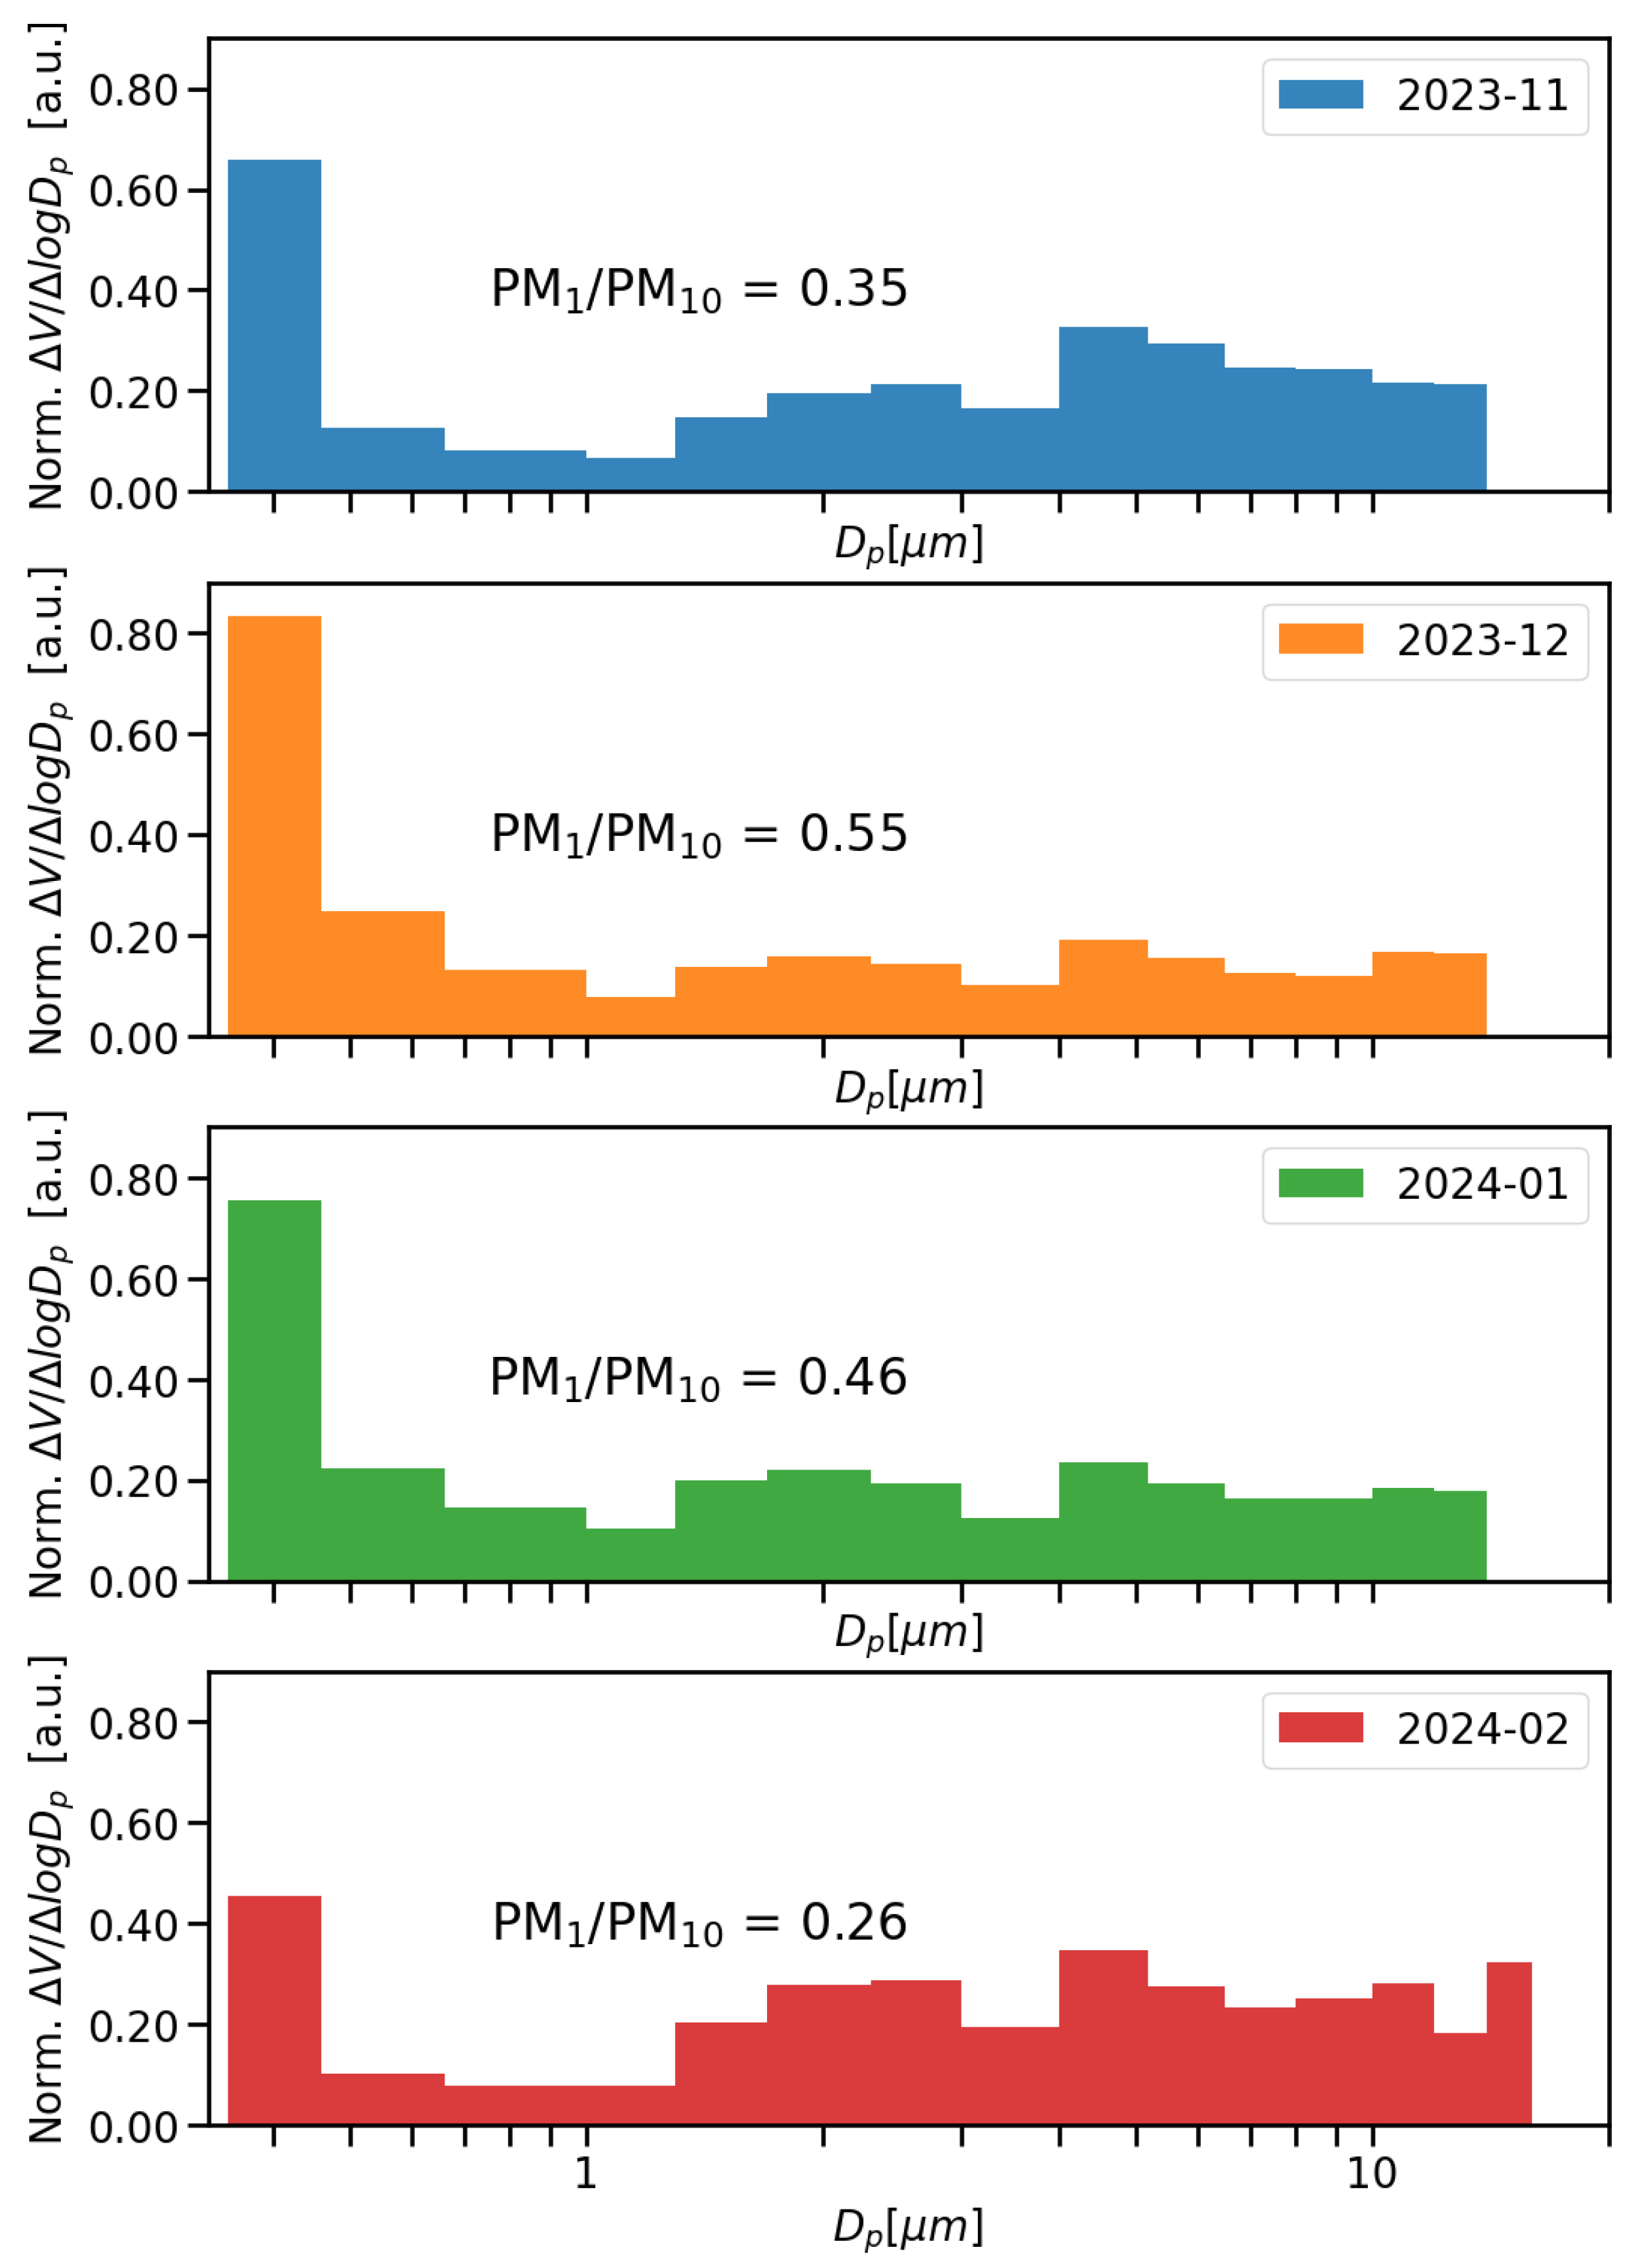
Seasonal variation of size distribution depicted as the normalized particle volume by bin of the Alphasense OPC-N3 sensor. The value of mass-weighted PM1>/PM10 ratio was estimated for each co-location month based on median value of the relevant 24-h averages.
Figure 6.
Seasonal variation of size distribution depicted as the normalized particle volume by bin of the Alphasense OPC-N3 sensor. The value of mass-weighted PM1>/PM10 ratio was estimated for each co-location month based on median value of the relevant 24-h averages.
Figure 7.
Simple linear regression of Alphasense CO-B4 sensor response versus reference instrument (HORIBA) for "Polish smog" episode S1 (a) compared with data for winter evaluation period (b). The histograms displayed adjacent to the axes illustrate the normalized frequency of the measured concentration ranges within the respective dataset.
Figure 8.
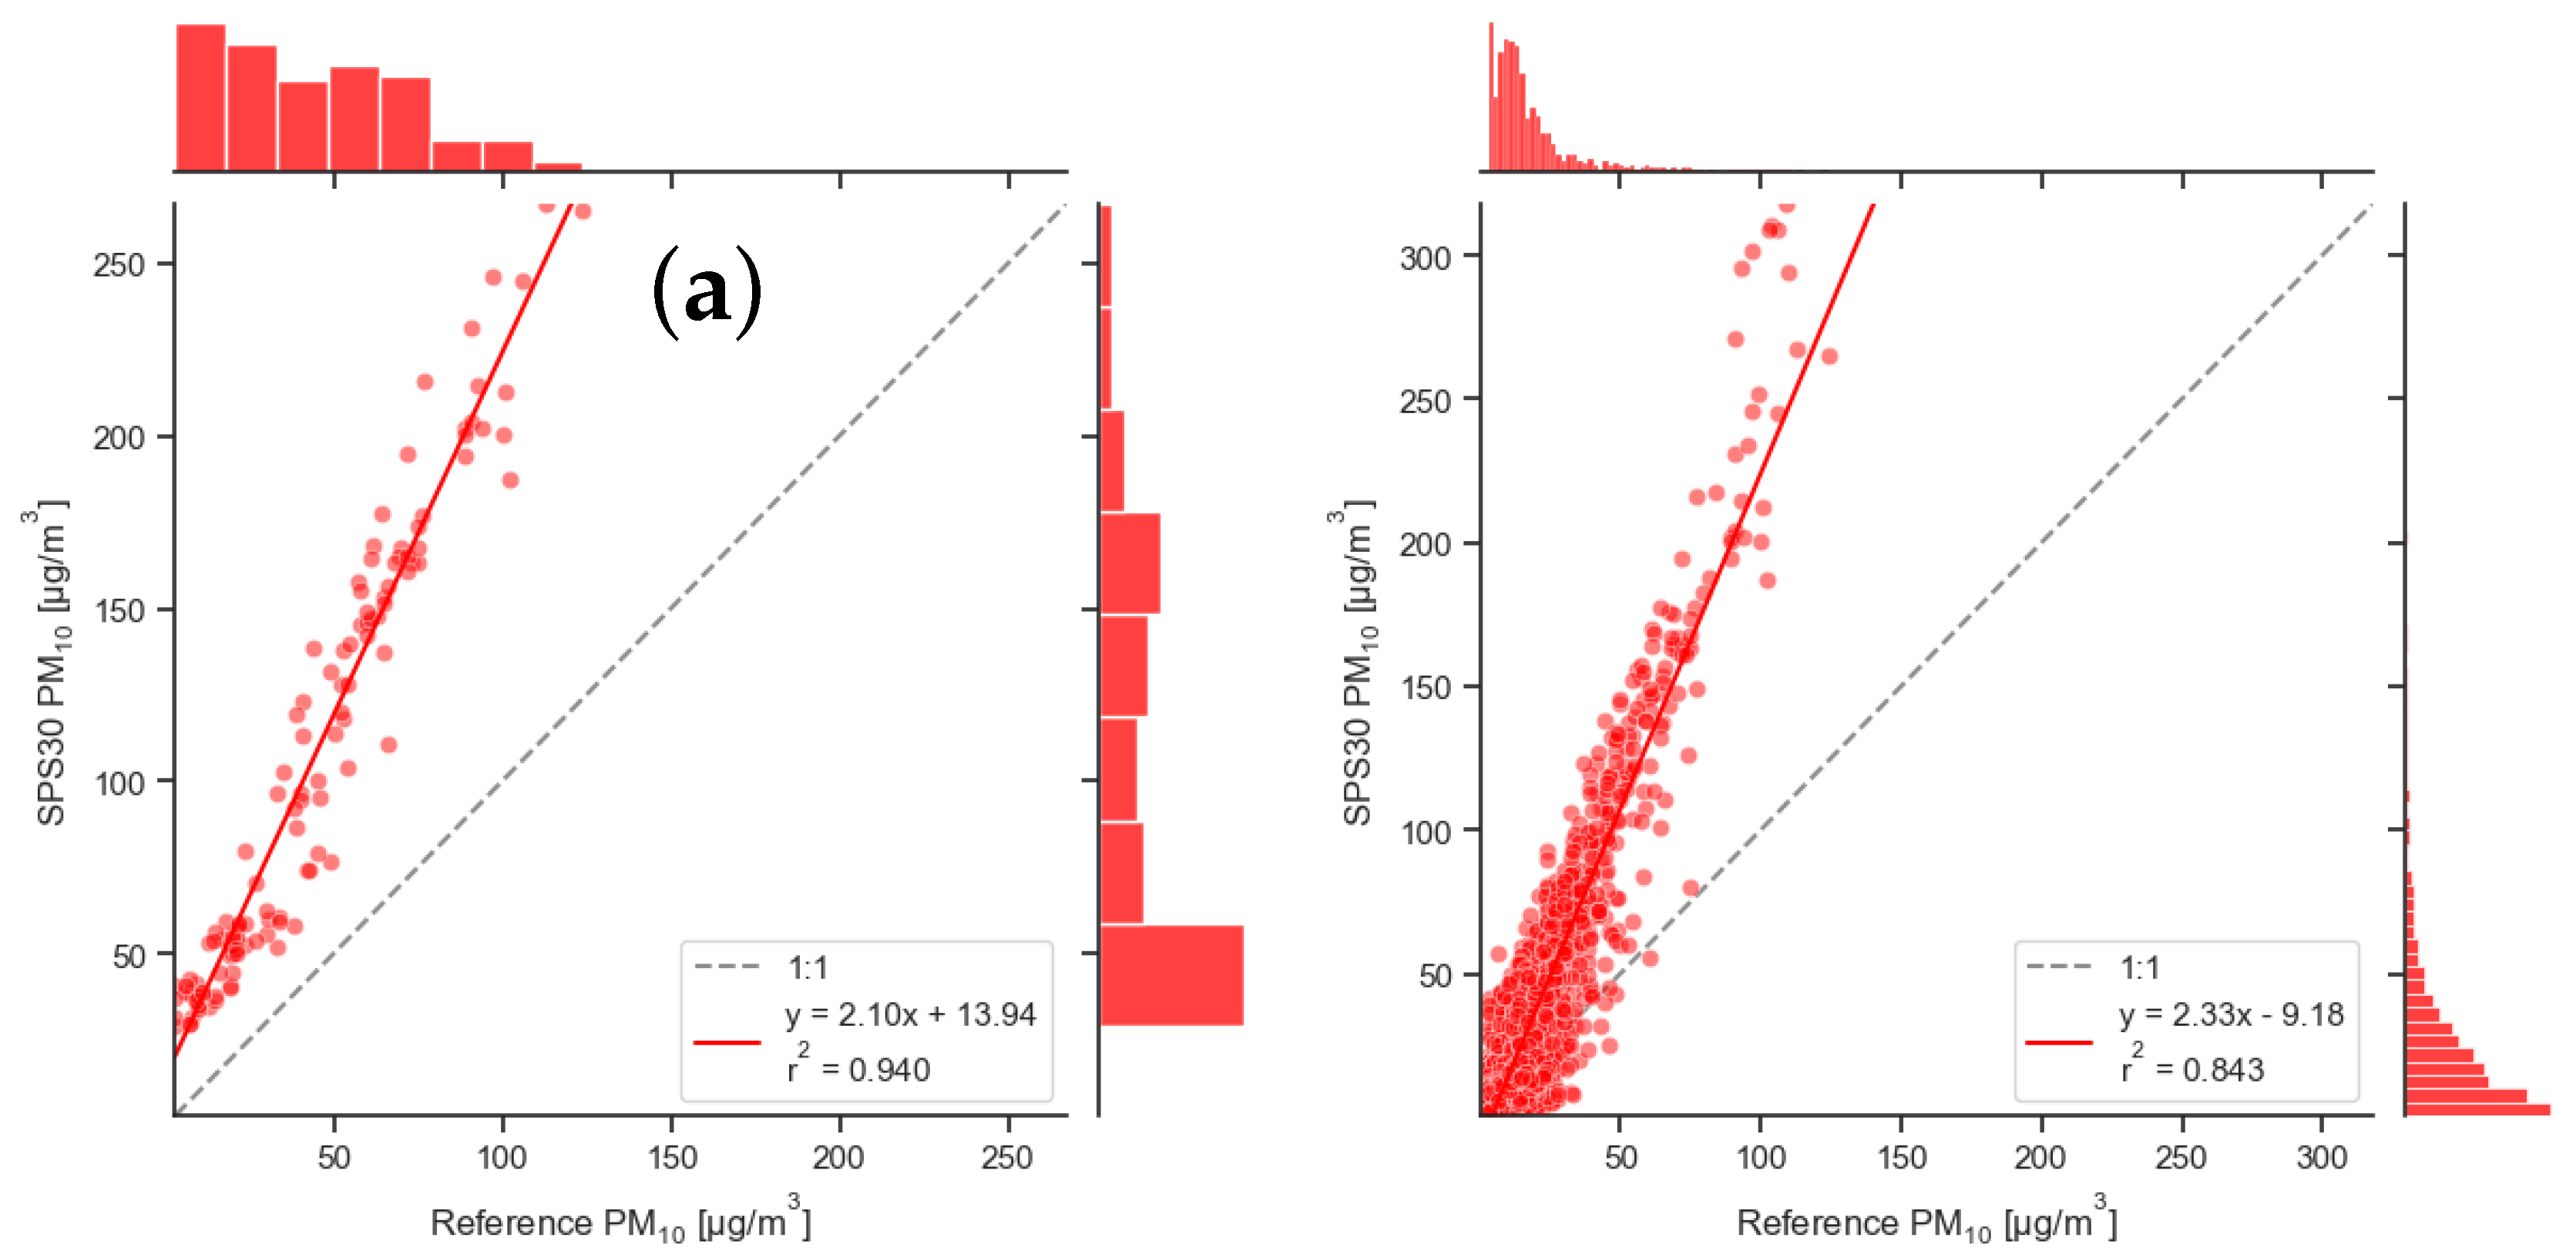
Simple linear regression of Sensirion SPS30 sensor response versus reference instrument (TEOM) for "Polish smog" episode S1 (a) compared with data for winter evaluation period (b). The histograms displayed adjacent to the axes illustrate the normalized frequency of the measured concentration ranges within the respective dataset.
Figure 9.
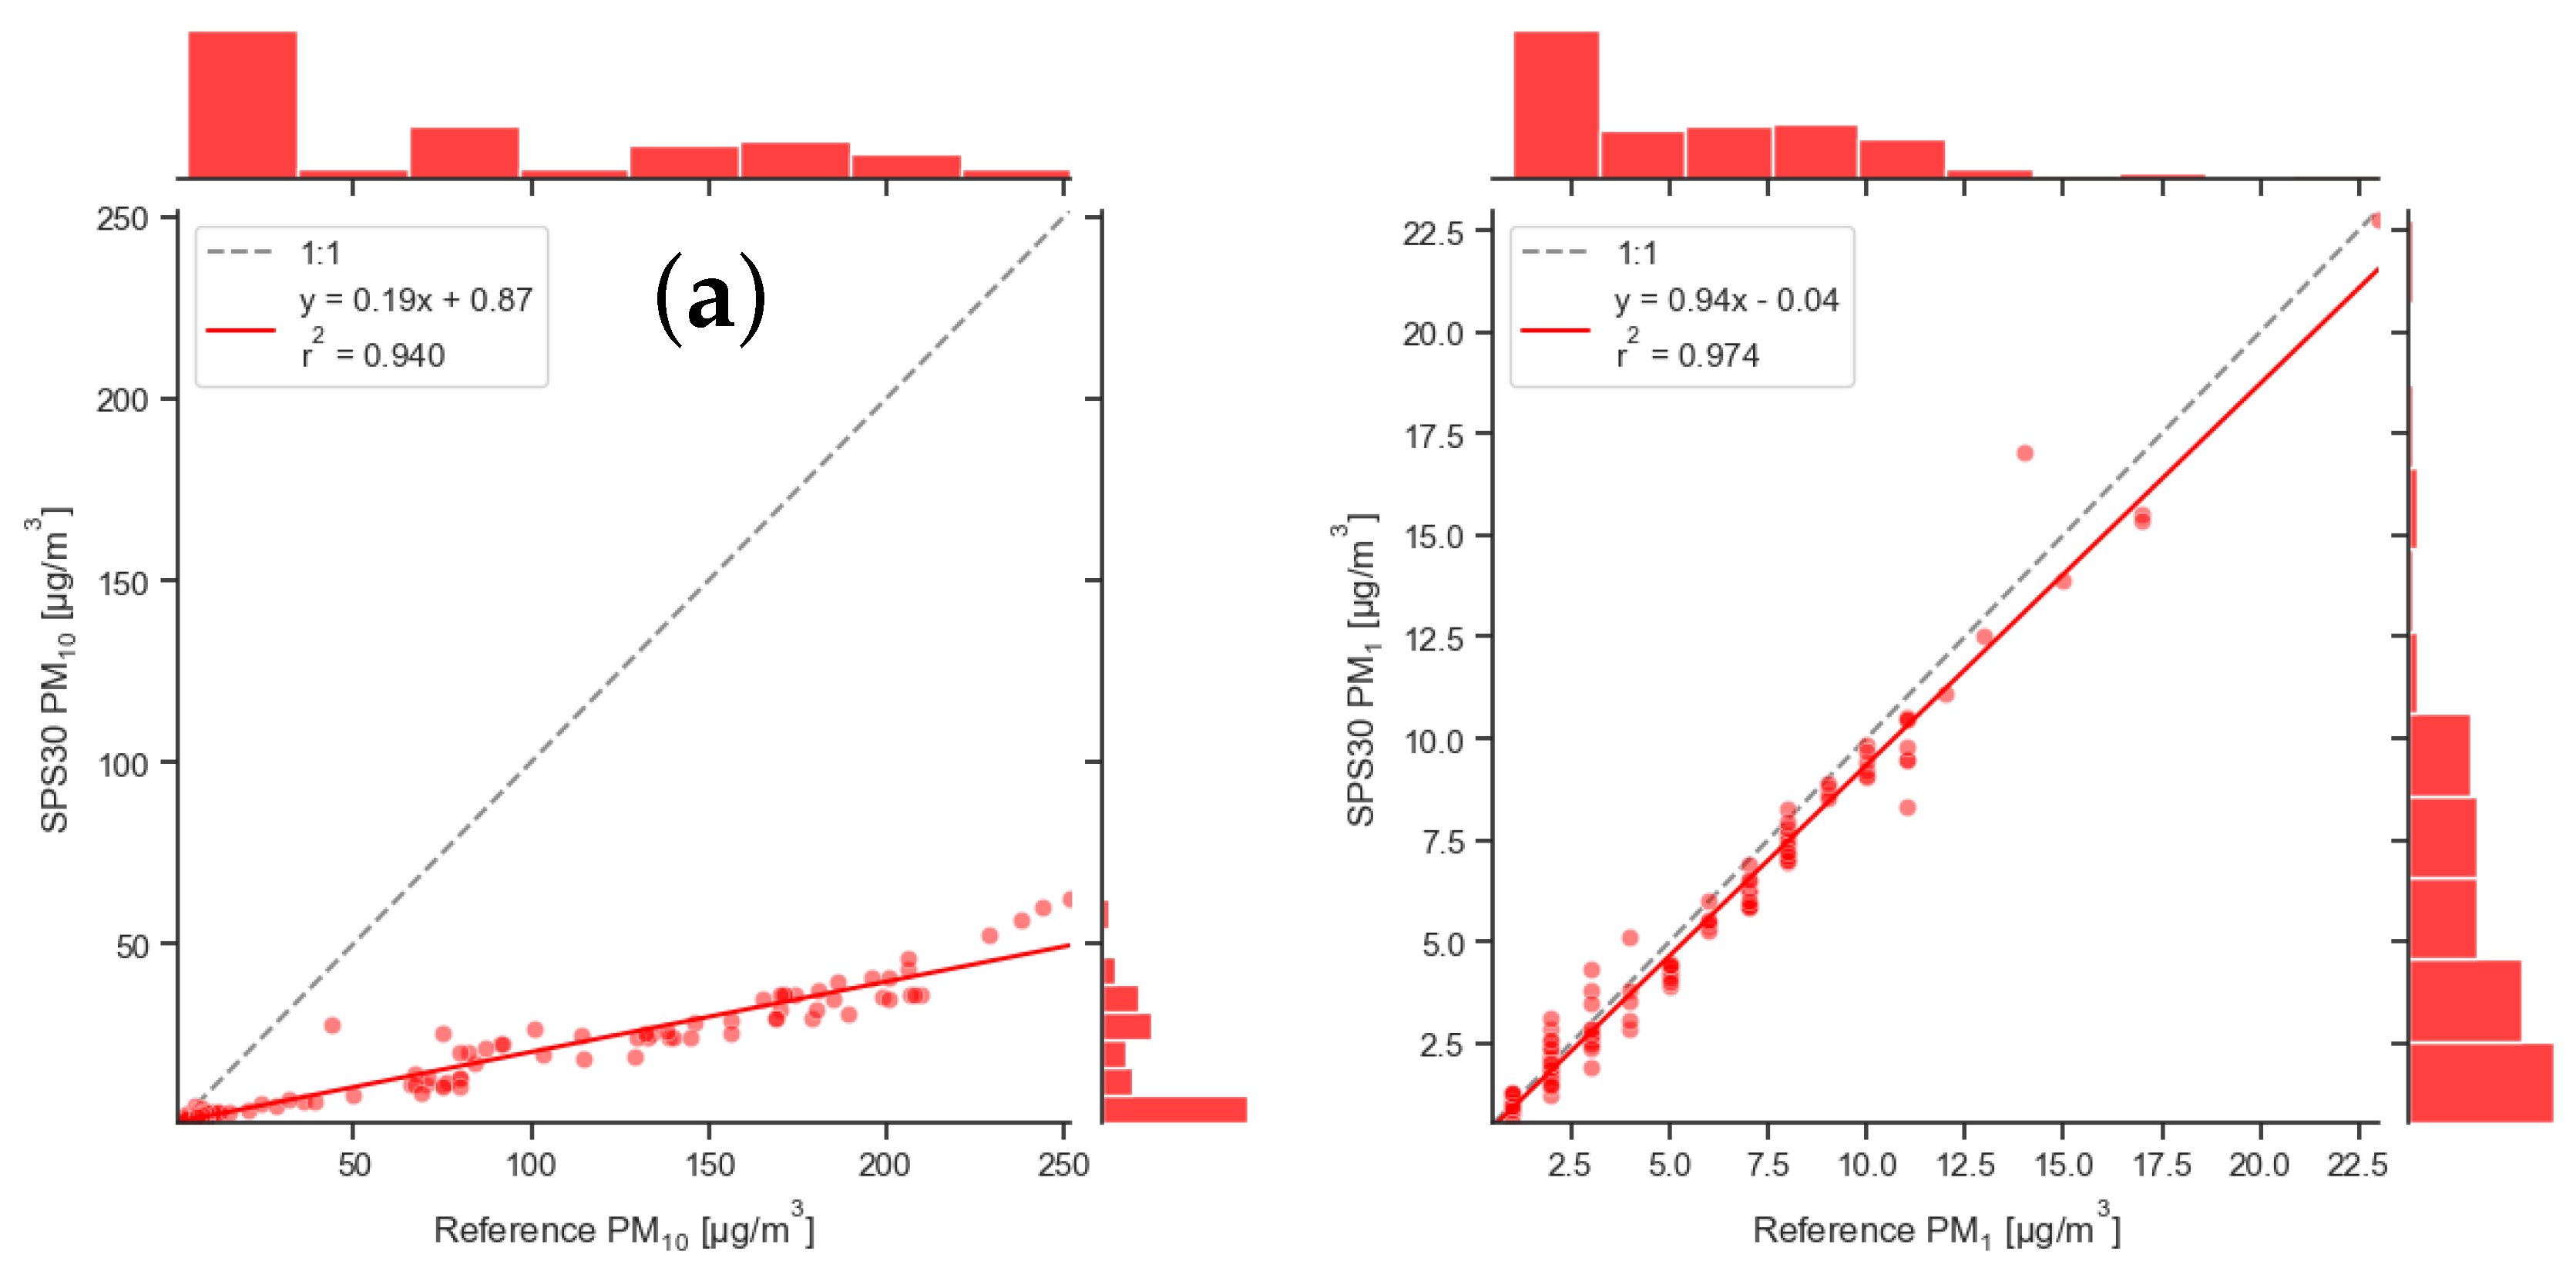
Simple linear regression of Sensirion SPS30 sensor response versus reference instrument (FIDAS) during spring "Saharan dust storm" episode S2. Performance shown for PM10 (a) and PM1 (b). The histograms displayed adjacent to the axes illustrate the normalized frequency of the measured concentration ranges within the respective dataset.
Figure 10.
Correlation of reference measurements and LCS response during the winter evaluation period and the effect of ambient temperature on sensor performance (shown by the colour of the data point).
Figure 10.
Correlation of reference measurements and LCS response during the winter evaluation period and the effect of ambient temperature on sensor performance (shown by the colour of the data point).
Figure 11.
Size distribution of the normalized particle volume by bin of the Alphasense OPC-N3 sensor. The value of mass-weighted PM1/PM10 ratio estimated from 24-hour average on selected days during S1 (a) and S2 (b) episodes.
Figure 11.
Size distribution of the normalized particle volume by bin of the Alphasense OPC-N3 sensor. The value of mass-weighted PM1/PM10 ratio estimated from 24-hour average on selected days during S1 (a) and S2 (b) episodes.
Table 1.
Smog episodes with relative humidity, temperature and pressure characterized by their mean and standard deviation values (in brackets).
Table 1.
Smog episodes with relative humidity, temperature and pressure characterized by their mean and standard deviation values (in brackets).
| Period |
Start |
End |
Hum. (%) |
Temp. (°C) |
Pres. (hPa) |
| S1 |
2023-12-05 |
2023-12-09 |
|
|
|
| S2 |
2024-03-29 |
2024-04-03 |
|
|
|
