Preprint
Article

An Oxford Nanopore Technology-Based Hepatitis B Virus Sequencing Protocol Suitable For Genomic Surveillance Within Clinical Diagnostic Settings

Altmetrics

Downloads

108

Views

75

Comments

0

A peer-reviewed article of this preprint also exists.

Submitted:

04 October 2024

Posted:

08 October 2024

You are already at the latest version

Alerts
Abstract
Chronic Hepatitis B Virus (HBV) infection remains a significant public health concern, particularly in Africa, where the burden is substantial. HBV is an enveloped virus, classified into ten phylogenetically distinct genotypes (A – J). Tests to determine HBV genotypes are based on full-genome sequencing or reverse hybridization. In practice, both approaches have limitations. Whereas diagnostic sequencing, generally using the Sanger approach, tends to focus only on the S-gene and yields little or no information on intra-patient HBV genetic diversity, reverse hybridization detects only known genotype-specific mutations. To resolve these limitations, we developed an Oxford Nanopore Technology (ONT)-based HBV diagnostic sequencing protocol suitable for clinical virology that yields both complete genome sequences and extensive intra-patient HBV diversity data. Specifically, the protocol involves tiling-based PCR amplification of HBV sequences, library preparation using the ONT Rapid Barcoding Kit, ONT GridION sequencing, genotyping using Genome Detective software, recombination analysis using jpHMM and RDP5 software, and drug resistance profiling using Geno2pheno software. We prove the utility of our protocol by efficiently generating and characterizing high-quality near full-length HBV genomes from 148 residual diagnostic samples from HBV-infected patients in the Western Cape province of South Africa, providing valuable insights into the genetic diversity and epidemiology of HBV in this region of the world.
Keywords: 
Subject: Biology and Life Sciences  -   Virology

1. Introduction

Hepatitis B Virus (HBV) infection is a significant global health concern, linked to severe outcomes such as hepatocellular carcinoma (HCC) and liver cirrhosis. It is particularly prevalent in sub-Saharan Africa, where approximately 6.1% of adults are chronically infected, contributing to a substantial portion of the 296 million global cases [1]. Approximately 1.5 million new Chronic HBV (CHB) infections occur annually across Africa, accounting for a quarter of new cases globally. In 2019, the global CHB prevalence was estimated at 4.1%, with the Western Pacific region having the highest prevalence (7.1%) and the European region the lowest (1.1%) [1,2].
HBV, a member of the Hepadnaviridae family, possesses a compact circular genome of approximately 3.2 kilobases (kb) [3]. It comprises four genes—HBx (X), Core (Pre-C/C), Surface (S), and Polymerase (P) encoded in seven overlapping reading frames. The S protein, containing the antigenicity, or "a", determinant region within the major hydrophilic region (MHR), is crucial as it is the primary target of neutralizing HBV antibodies with substitutions in and around this region being associated with immune escape and vaccine failure [4].
To date, ten HBV genotypes (A-J) with an intergroup nucleotide divergence of at least 8% at the whole genome level have been identified [5]. The most prevalent genotypes globally are C (26%), D (22%), E (18%), A (17%), and B (14%) [2]. In Africa, predominant circulating genotypes include A, D, and E, with sub-genotypes A1 and D3 predominating in southern Africa. Specifically, sub-genotype A1 remains most prevalent in South African populations (accounting for 97% of infections) and has been linked to severe liver disease and rapid progression to HCC [6,7].
While whole-genome sequencing-based surveillance is becoming a key tool for understanding the distribution, prevalence, and evolution of viral pathogens [8,9,10], it has yet to be fully leveraged in clinical diagnostic settings. In many settings, rapid point-of-care screening tests are used to detect the hepatitis B surface antigen (HBsAg) in serum or plasma as a marker of active infection. However, a major concern when using diagnostic tests is that they must possess a high degree of sensitivity and an acceptable level of specificity to reduce false results [11,12]. For more detailed characterization of HBV in patient samples, Sanger sequencing of complete or partial HBV genomes is considered the gold standard and has been used to classify HBV into its ten genotypes. It is, however, often restricted to analyzing specific genes and is rarely used for the analysis of intra-patient genetic diversity [13]. However, partial genome sequences can be somewhat misleading when characterizing recombinant HBV genomes, and Sanger sequencing yields little or no information on intra-patient HBV genetic diversity: information which would be extremely valuable with respect to monitoring the emergence of drug resistance or immune evasion mutations, estimating the durations of chronic infections, understanding the progression of pathogenesis, and tracing transmission patterns [13]. Illumina deep sequencing, while effective for genotyping and characterizing genetic diversity [14], suffers from limitations such as the inability to sequence long DNA stretches, biases introduced during amplification steps, and challenges in generating sufficient overlap between DNA fragments [15].
High-throughput sequencing (HTS) techniques are powerful tools that, in addition to diagnosing CHB infections and genotyping HBV, would both enable the accurate characterization of recombinant HBV genomes (including those with mixed genotypes) and provide detailed data on intra-patient HBV genetic diversity [16]. Among numerous other HBV-focused applications, HTS and downstream analyses have previously been used to sequence complete HBV genomes [8,10,17,18], track the demographics of HBV populations within individual CHB patients [19], and identify the prevalence of drug-resistance mutations in large patient cohorts [13,20,21,22].
Two major challenges associated with HTS workflows employed to generate viral genome sequence data are 1) the efficient and accurate barcoding of samples needed for multiplexed sequencing where multiple patient samples are simultaneously sequenced in a single run and 2) the accurate reassembly of sub-genome-length sequence reads into complete genomes. Third-generation HTS technologies, such as the Oxford Nanopore Technology (ONT) MinION, GridION, and PromethION, have largely overcome these limitations. Barcoding kits allow for cost-effective and efficient sequencing by enabling the pooling and running of multiple libraries on a single flow cell. Different types of barcoding kits are available, including ligation-based, PCR-based, and rapid chemistry-based kits, each with their own advantages and input requirements (https://community.nanoporetech.com/docs). A study by McNaughton et al. describes advancements in a sequencing protocol utilizing isothermal rolling-circle amplification and ligation-based barcoding kits [23]. The ONT rapid barcoding kit does not require individual sample washes and allows samples to be processed uniformly without quantification or normalization [24]. The sample runtime on ONT, per 96 samples, is almost half that of Illumina (14 hours compared to 26 hours) mainly due to real-time data analysis with ONT. The rapid barcoding library preparation utilized by ONT also requires fewer reagents, as everything is contained within the kit, and is thus cheaper than Illumina sequencing [25]. Further, the sequence reads generated using ONT are substantially longer than those generated by Illumina, a factor that vastly simplifies the assembly of whole genome sequences. However, ONT still exhibits a higher error rate than Illumina sequencing although this has improved with newer chemistry and the use of post-sequencing software such as Nanopolish [26].
Here we describe an optimized ONT-based HBV whole genome sequencing protocol and associated downstream computational analyses that will be applicable within a clinical HBV diagnostic setting. Using 148 samples from chronic South African CHB patients we demonstrate that the protocol enables accurate recombination-aware genotyping of patient samples and the detection of drug-resistance mutations.

2. Results

2.1. Sequencing of Samples

To evaluate the applicability of our ONT-based protocol in a clinical setting, we sequenced 148 HBV-positive samples collected between September 19, 2022, and November 5, 2023, in the Western Cape, South Africa. The average age of the patient cohort was 40 years (range: 0 - 69), with a gender distribution of 37.2% females and 60.8% males, and three samples had no gender information. The overall median viral load (VL) was 16,368 IU/ml (IQR: 1,452 - 1,445,182). Of the 148 samples sequenced, 146 HBV genomes (98.6%) were obtained. Eight samples with missing age, gender, or VL information were excluded from the analyses, and the remaining 138 sequences with available metadata were used for subsequent analyses (Table 1).
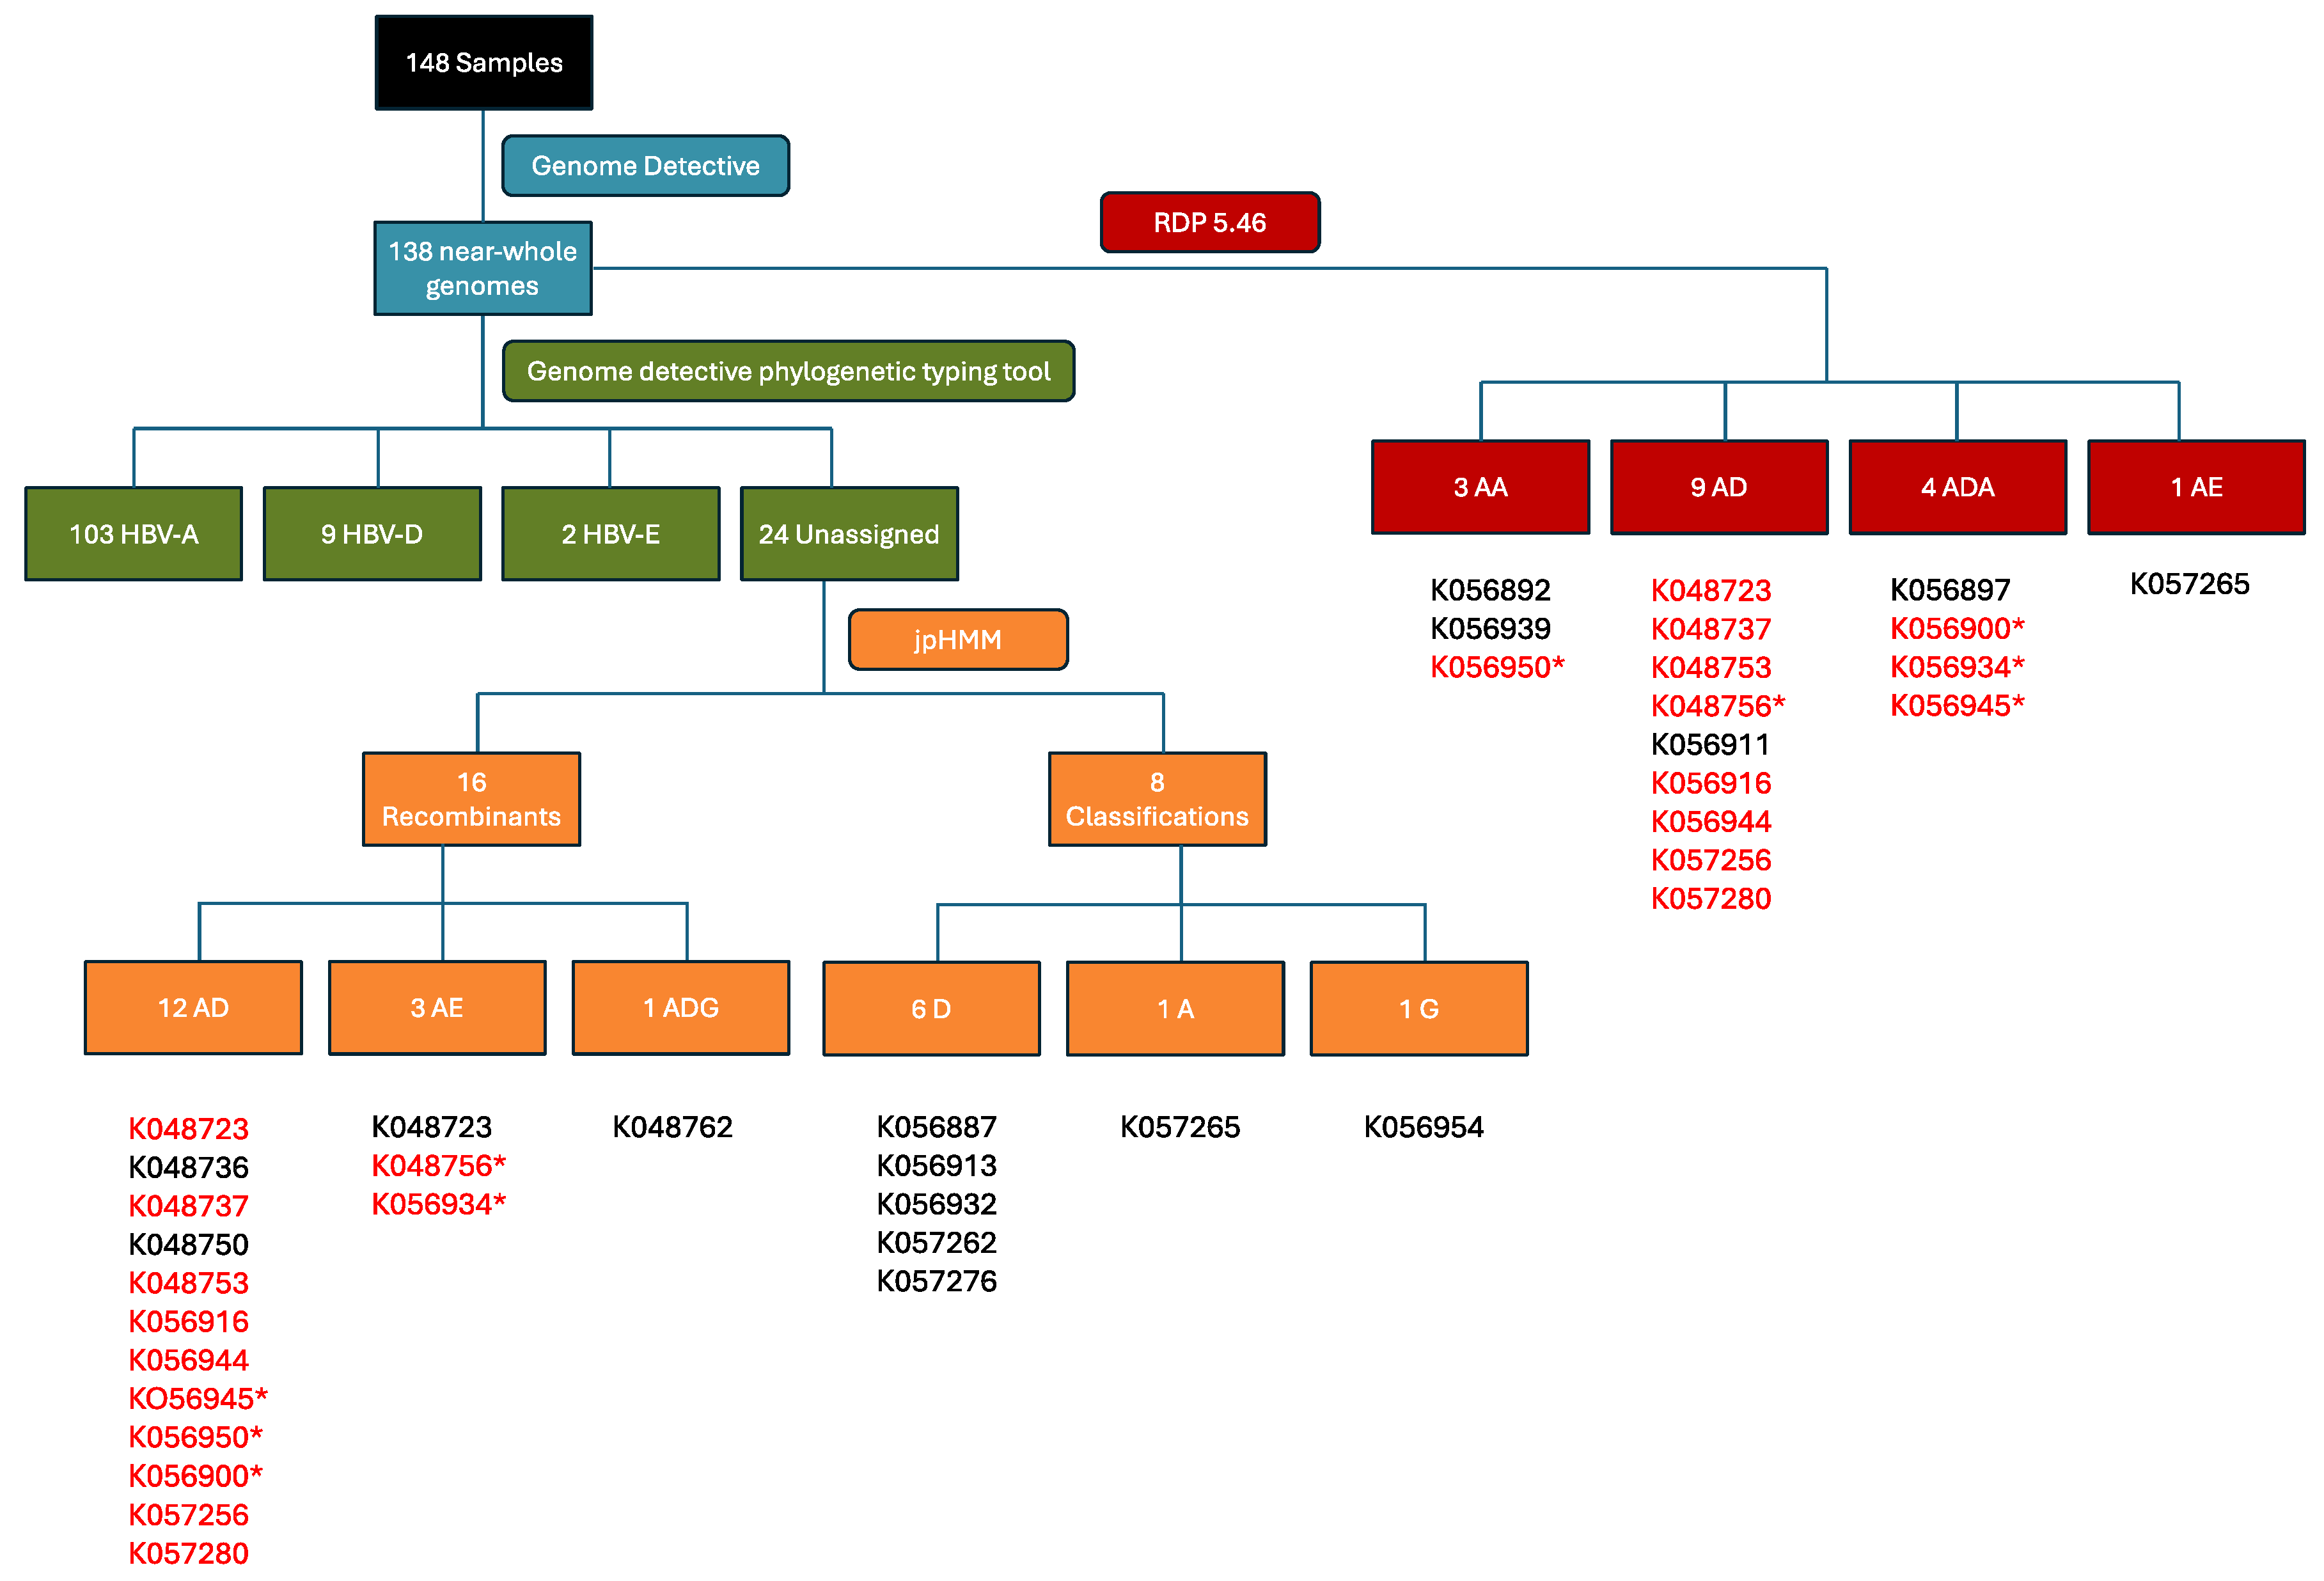
The 138 near-complete HBV genomes with available metadata had a median sequencing depth of 2,344 (IQR 584-13 497) and median genome coverage of 98.33% (IQR 92%-100%). Of the 138 sequences, 124 (89.86%) had a uniform coverage of greater than 80%. The Genome Detective (GD) Hepatitis B phylogenetic typing tool classified 114 (82.60%) of the 138 near-complete genomes and determined that the majority (n=103, 90.40%) were genotype "A," followed by "D" (n=9, 7.89%) and "E" (n=2, 1.75%). The 24 genomes (17.39%) that GD could not assign to a genotype level had a degree of genome coverage that was significantly lower than that of the genomes that could be assigned (median coverage of 92.74% vs 98.68%; p = 0.003472; Wilcoxon rank sum test). Further analysis of genome coverage revealed a significant difference in coverage between genotypes A and D (p = 0.00884) (Figure 1A). Although VL did not significantly affect the genome coverage, a weak linear association (R2 = 0.099; Pearson linear correlation) was observed between high VL and genome coverage (Figure 1B).

2.2. Recombination Detection and Breakpoint Identification

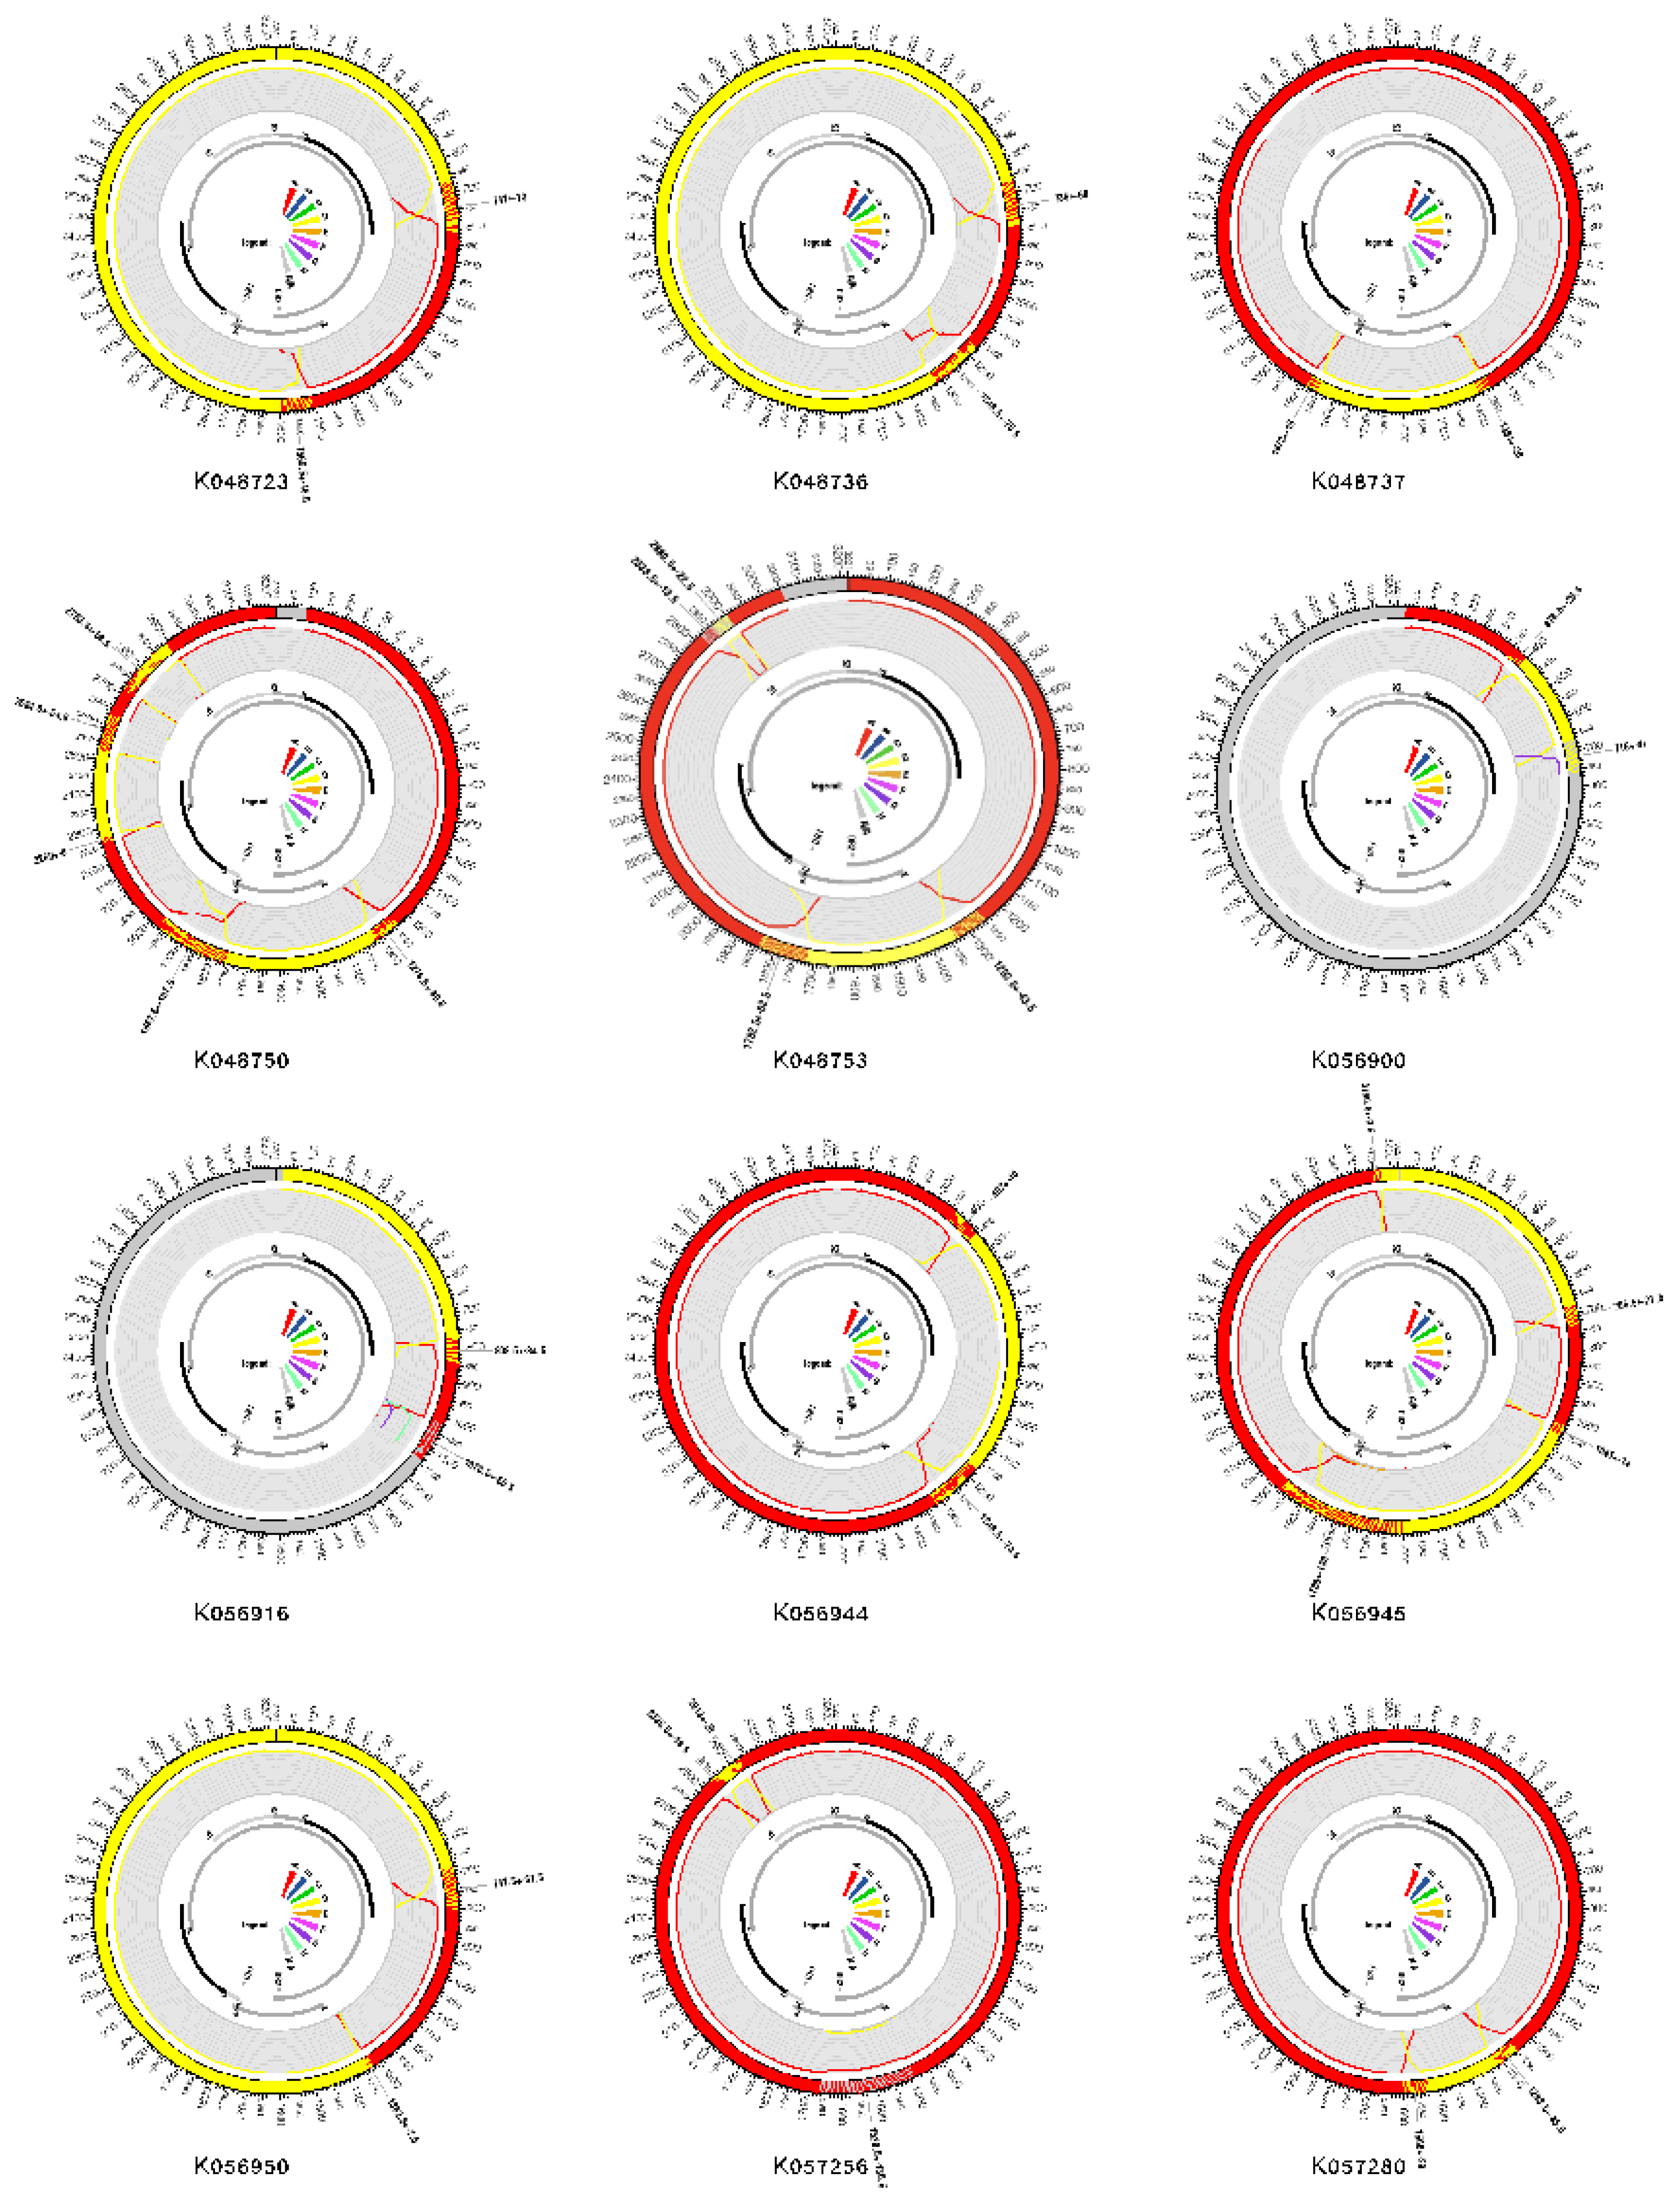
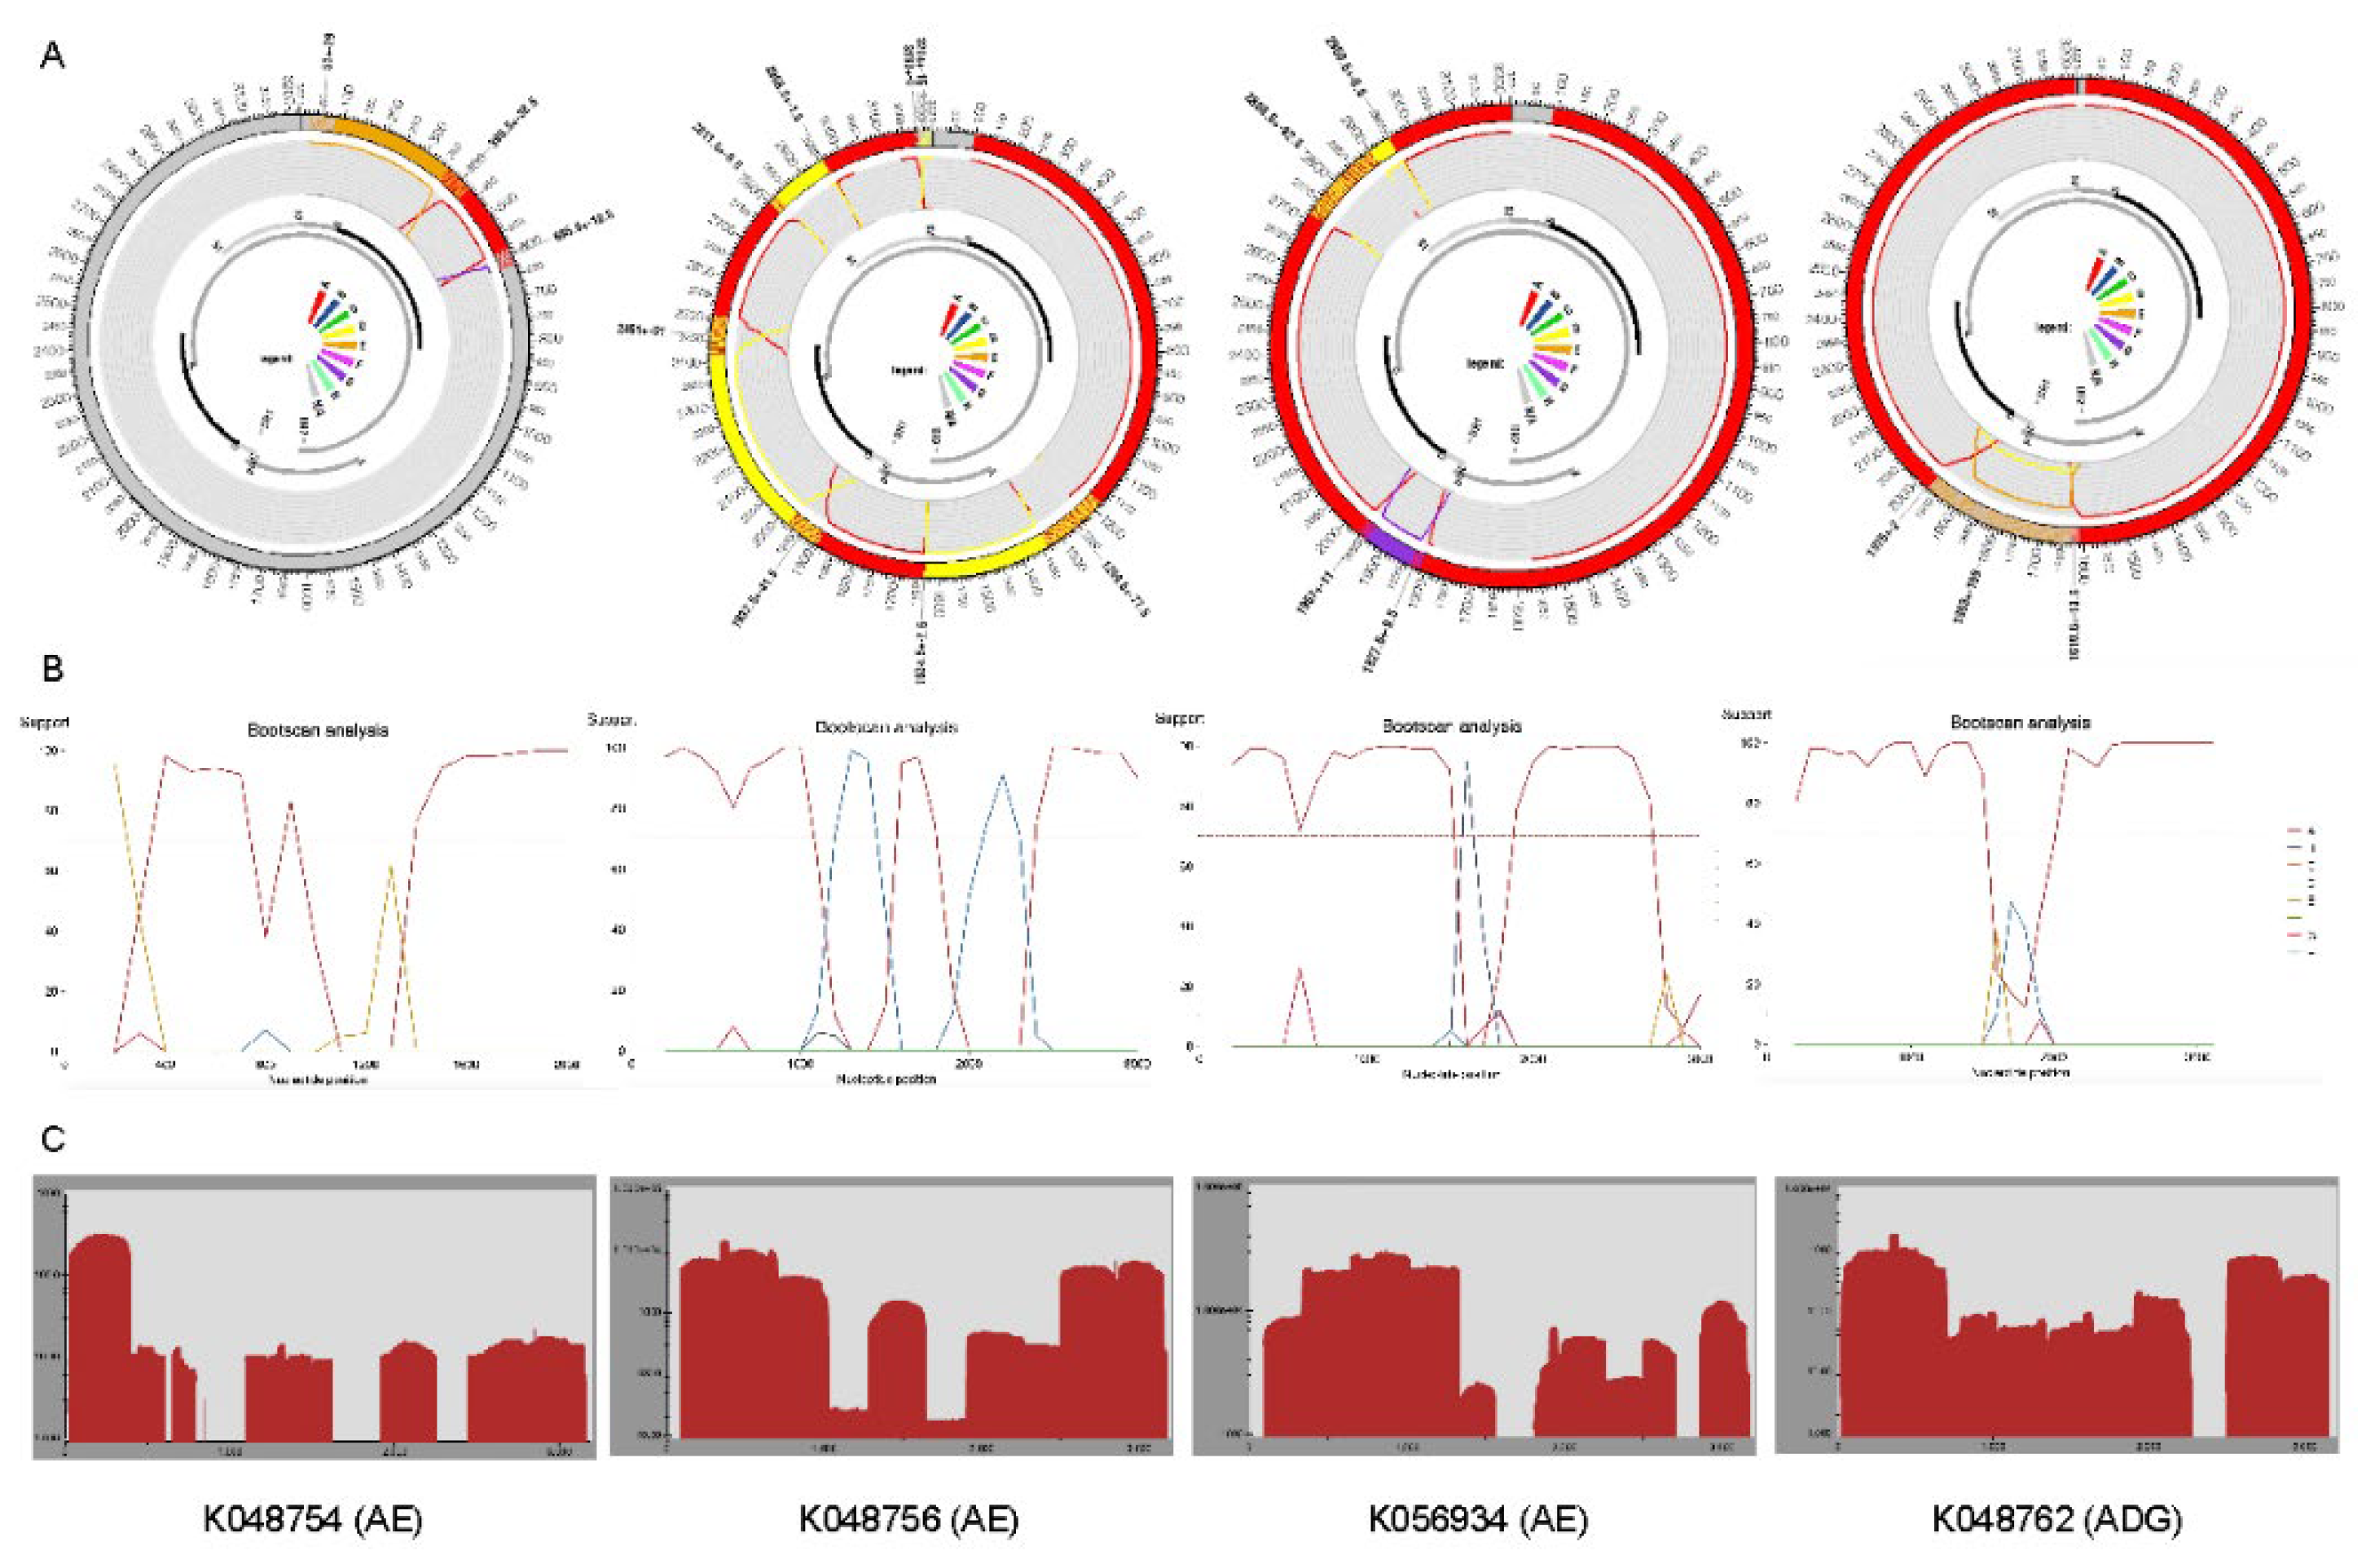
The recombination detection program (RDP) version 5.46 and the Jumping Profile Hidden Markov Model (jpHMM) HBV tool were used to identify recombinant sequences and infer breakpoints. jpHMM maps were generated for the 24 "unassigned" study sequences to infer evidence of inter-genotype recombination. Of the 24 sequences, traces of recombination were detected in 16, and the remaining eight sequences were assigned to genotypes by jpHMM (6 D, 1 A, 1 G) (Figure 2). jpHMM classified twelve sequences as A/D recombinants (i.e. the parents of the recombinants belonged to genotypes A and D) (Figure 3), three as A/E recombinants, and one as an A/D/G recombinant (Figure 4). Bootscan plots and genome coverage maps were obtained from the GD Hepatitis B phylogenetic typing tool to assess the accuracy of the non-A/D recombination classifications (Figure 4).
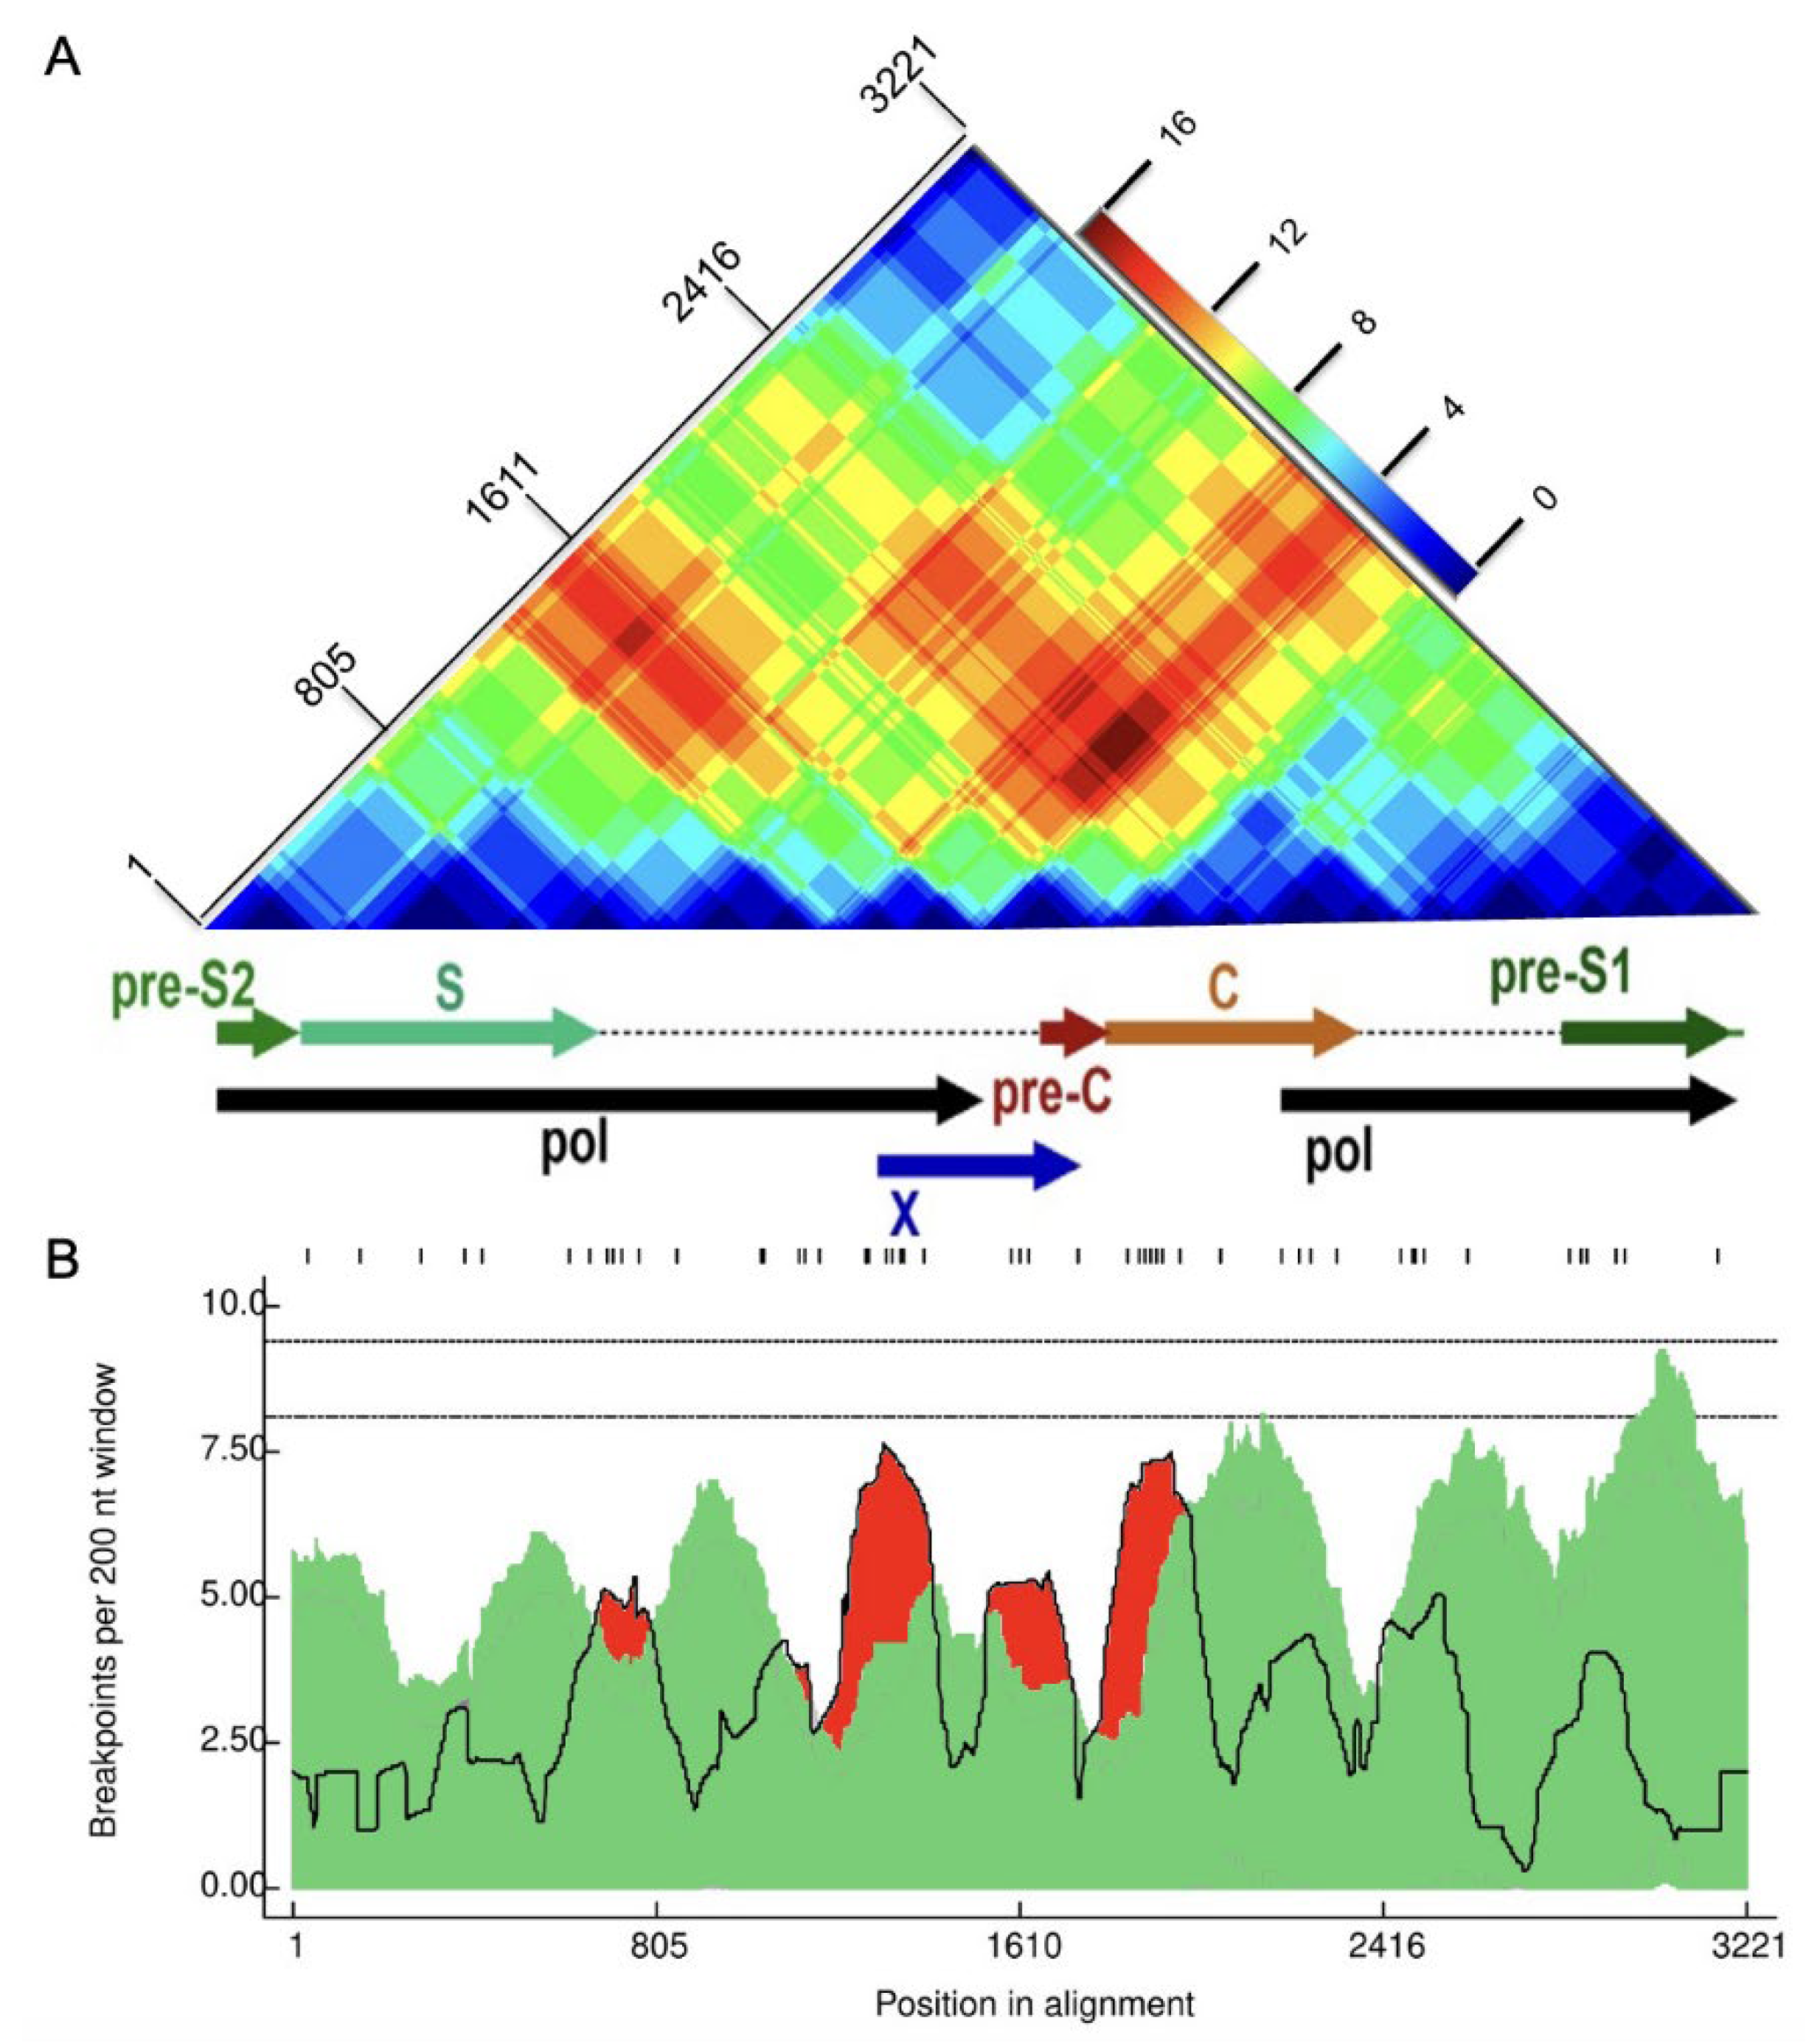
Further assessment of recombination using RDP5.46 but without assuming only recombination between subtypes (i.e. also accounting for intra-genotype recombination) confirmed that 12 of the 16 recombinants identified by jpHMM were actual recombinants (Figure 2). P-values are listed in the Appendix A, Table A1. Of the twelve sequences classified as A/D recombinants by jpHMM, RDP5.46 confirmed seven as A/D recombinants, with the remaining five classified as two A/D/A recombinants, one an A/A recombinant, and two as non-recombinants. Two A/E recombinants were classified as A/D and A/D/A recombinants by RDP5.46 (Figure 2). Recombination events were distributed variably, with recombination breakpoints concentrated towards the end of the P gene, within the X and pre-C regions, and at the start of the C region (Figure 5B). The recombination region count matrix produced by RDP5.46 illustrated heightened susceptibility for recombinational transfers of specific genomic regions, particularly the end of the pol region, the X region, the pre-C region, and the C region (Figure 5A).
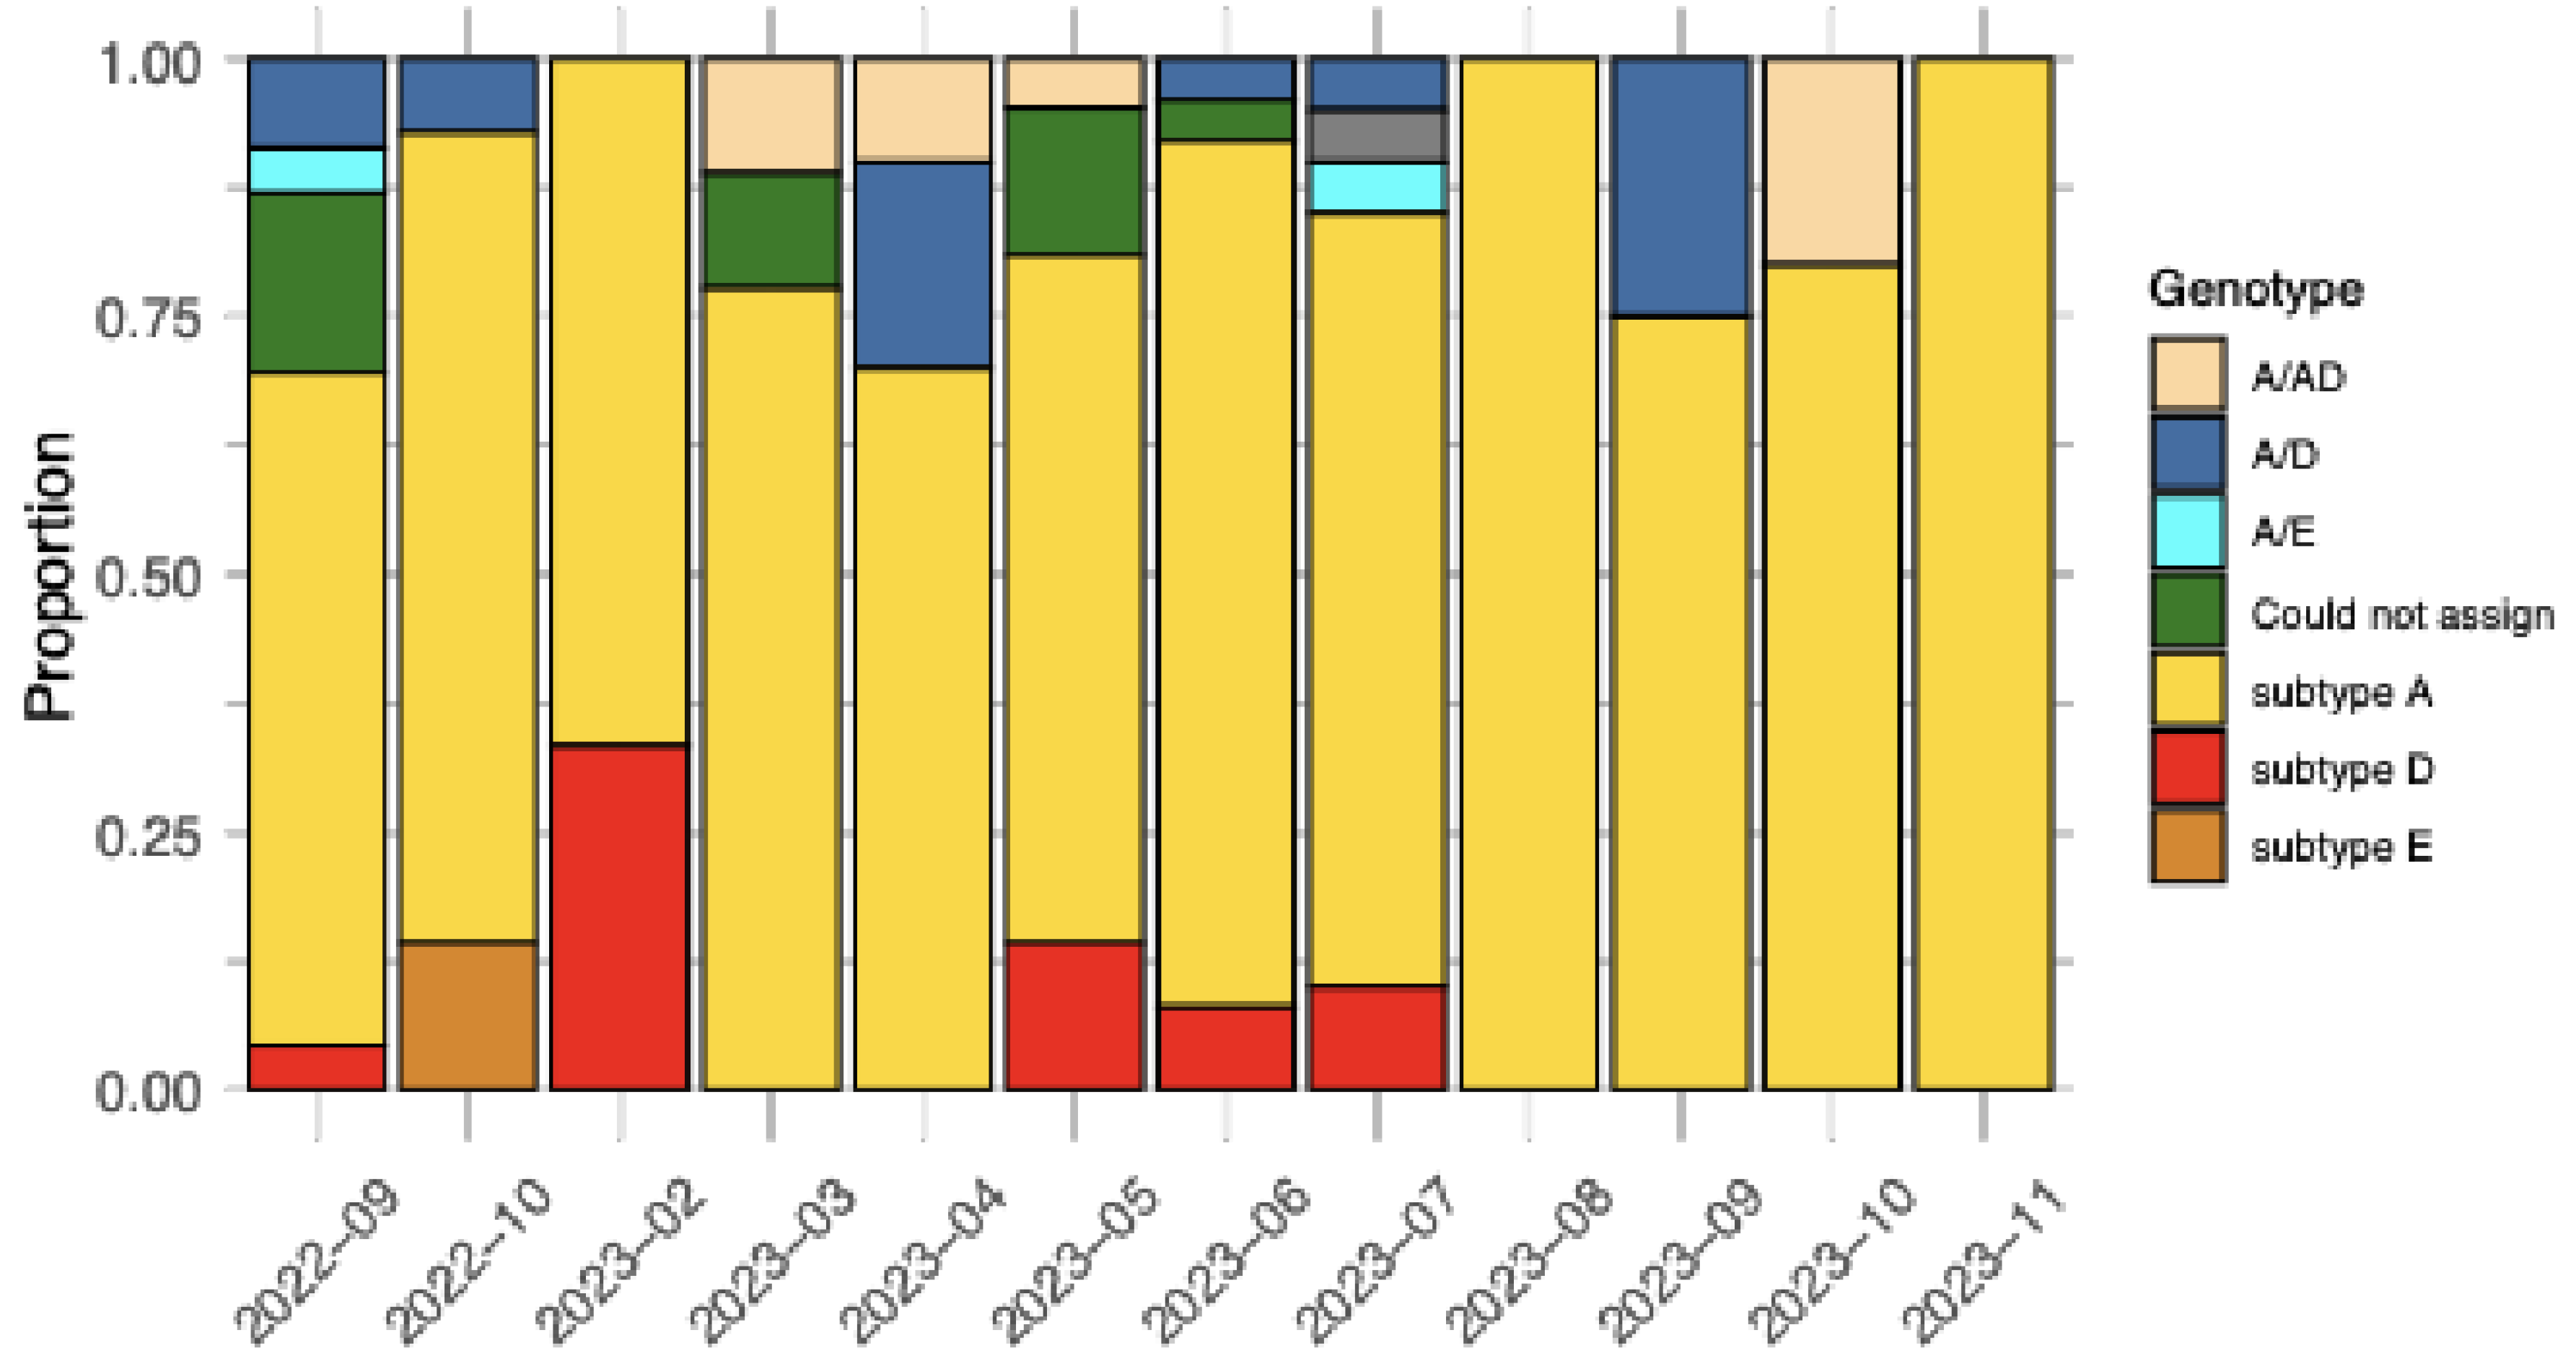
Throughout the study period (September 2022 - November 2023), subtype A (n = 103) was the most prevalent HBV genotype, while subtype D (n = 9) only occurred sporadically in September 2022 and February, May, June, and July 2023. Subtype E (n = 2) was identified only in October 2022. Recombinant genomes were sampled throughout the study period (Figure 6). This temporal variation in subtype prevalence underscores the dynamic nature of HBV transmission and the importance of continuous surveillance.

2.3. Drug Resistance and Immune-Evasion Profiling

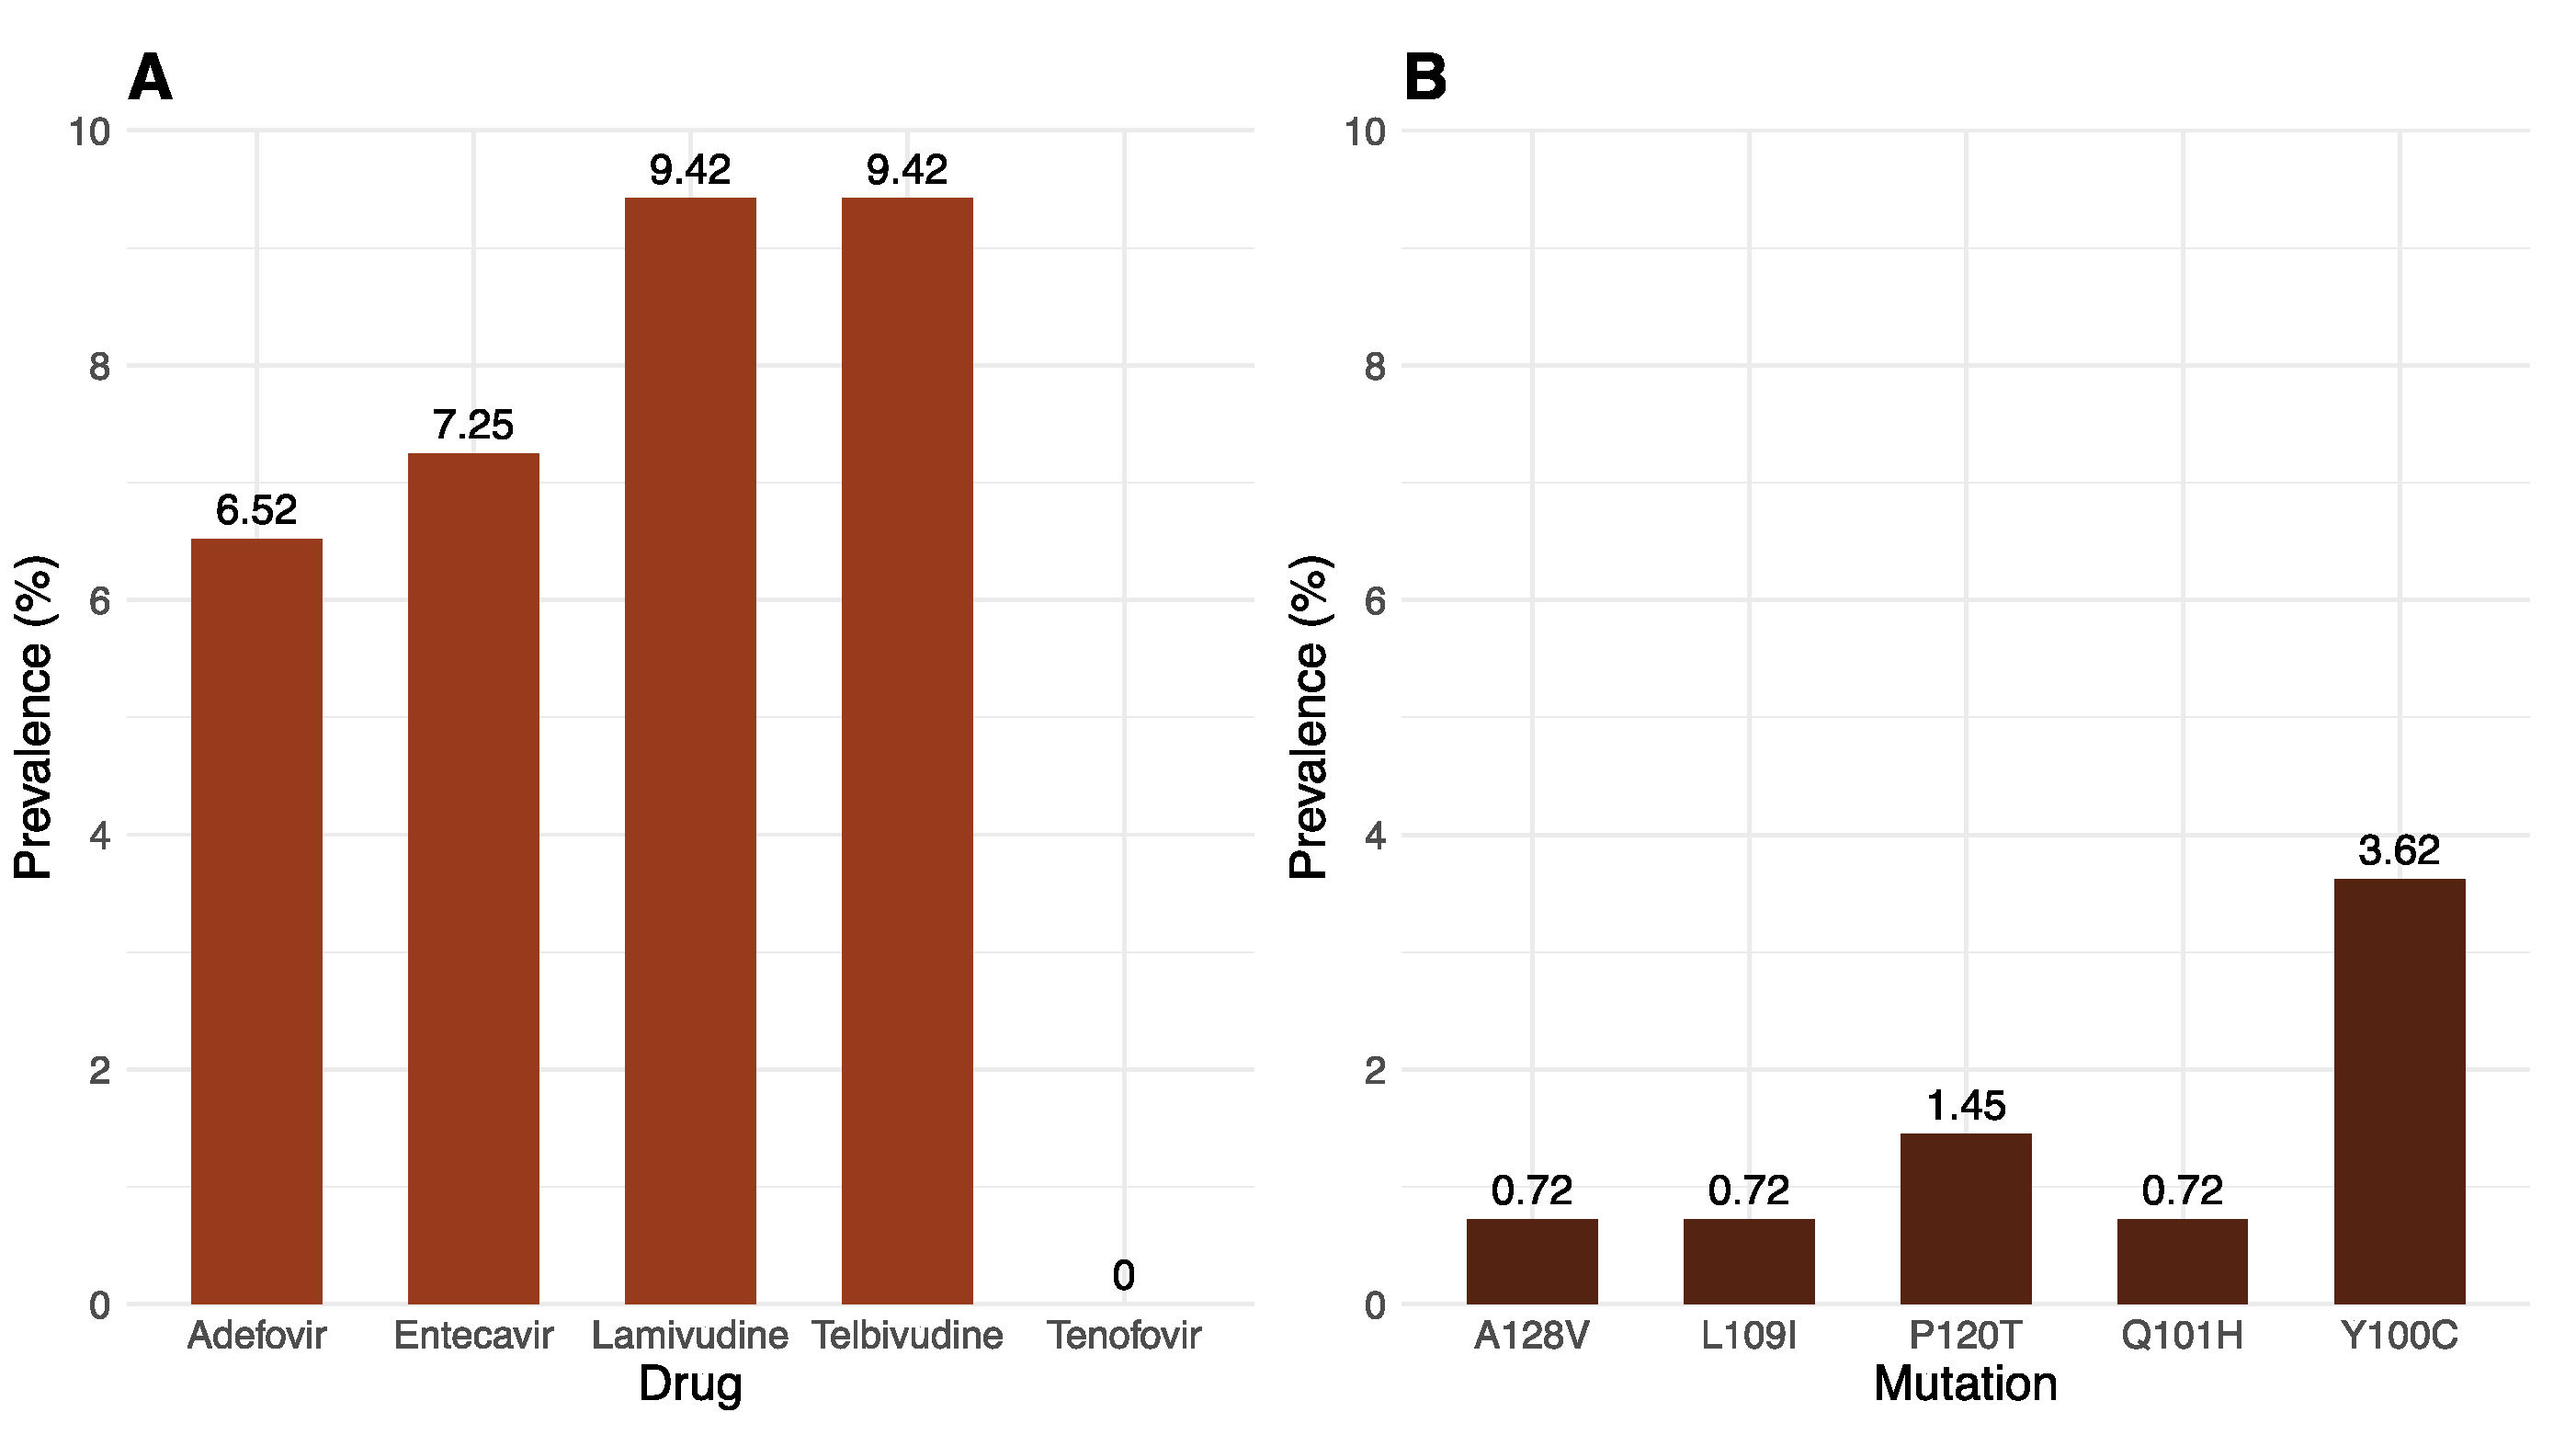
Mutations related to HBsAg escape and drug resistance in the overlapping RT/HBsAg genome region were determined using Geno2pheno-HBV. Among the 138 sequences, thirteen (9.42%) were likely resistant to lamivudine and telbivudine. Ten (7.25%) were resistant to entecavir, and nine (6.52%) were resistant to adefovir. All sequences were, however, likely susceptible to tenofovir (Figure 7A). 204V and 180M are the most prevalent drug-resistance mutations (Table 2). The most common vaccine escape HBsAg mutation is 100C, which is responsible for HBV detection failure [28], with a prevalence of five (3.62%). The second most prevalent HBsAg mutation is 120T, which is responsible for vaccine, immunotherapy, and diagnostic detection failure, with a prevalence of two (1.45%). This is followed by mutations 128V, 109I, and 101H, each with a prevalence of one (0.72%), which are responsible for vaccine escape (Figure 7B) [28].

3. Discussion

In this study, we demonstrate that ONT sequencing, utilizing the Oxford Nanopore Rapid Barcode Kit, enables the rapid and simple generation of full-length HBV genomes. Additionally, we illustrate the utility of the rich sequencing data generated by this approach in the recombination-aware genotyping of HBV genomes and the detection of mutations associated with drug resistance and vaccine/immunotherapeutic escape.
Our protocol yielded 124 genomes with uniform coverage of greater than 80% and a sequencing depth of approximately 2,343.86. We opted for ONT sequencing, which overcomes Sanger and Illumina limitations by providing long-read sequencing, eliminating the need for complex library preparation processes, and reducing the risk of biases associated with amplification steps. As the ONT rapid barcoding library preparation requires fewer reagents than the Illumina sequencing protocol, ONT sequencing was also much cheaper (Illumina cost per sample is ~150–250 USD while the ONT cost per sample is ~10–40 USD) [25].
Full-length genome and sub-genomic ONT-based sequencing approaches have previously been used for HBV [23,29,30]. In these studies, ONT sequencing only worked well for samples with high HBV loads, with one study [30] having a raw read error rate of ~12% and another unable to definitively confirm putative minority variants detected in the MinION reads [29,30]. In addition to ONT-based approaches, Dopico et al. (2021) developed an HBV sequencing protocol using the Distance-Based discrimination method (DB Rule) on Illumina MiSeq to sequence-specific, relatively short regions of the HBV genome (preS and 5′end of the HBV X gene regions), rather than generating complete genomes [31]. This method is valuable for the rapid identification of variants in targeted regions but does not offer the comprehensive genomic insights that whole-genome sequencing approaches enable. An important factor associated with the successful sequencing of viral genomes is the VL present in samples: the higher the VL in a sample, the higher the yield of amplified products to be sequenced and the easier the assembly of a complete genome [32]. One of the studies [23] developed a sequencing protocol utilizing ONT ligation-based barcoding kits that improved the accuracy of HBV nanopore sequencing for use in research and clinical applications. Our rapid, chemistry-based, barcoding kit, sequencing protocol produced complete genomes at low (<2000 IU/ml), medium (2000 - 20 000 IU/ml), and high (>20 000 IU/ml) VL and allowed for the identification of various HBV genotypes; including genotypes A, D, and E.
Genome characterization of a virus can be important for clinical diagnostics as, beyond identifying the infecting agent, it can reveal clinically relevant genetic variations [33]. HBV-A was the most prevalent genotype among our study cohort, which is consistent with this genotype's high prevalence in sub-Saharan Africa [34]. A study by Jose-Abrego et al. (2021) explored the possible influence of HIV-HBV co-infection, which is likely to be prevalent in South Africa, on HBV genomes [35]. They observed that co-infection could lead to genotype mixtures, increased viral load, and more severe liver damage, suggesting that HIV co-infection may have important implications for HBV genome diversity and clinical outcomes. Recombination analysis also revealed complex viral replication/recombination dynamics, with 16 identified recombinants, primarily between genotypes A and D (A/D). This was to be expected due to the high prevalence of genotypes A and D in Southern Africa [6,7]. While RDP5.46 analysis confirmed eight of these recombinants, discrepancies were noted, highlighting the challenges in precisely classifying recombinant strains. Although recombination can be easily detected using phylogenetic trees and recombination software, it is much more difficult to determine whether detected recombinants exist or whether they are detection artifacts arising from 1) primer jumping during Polymerase Chain Reaction (PCR) of samples that are either from mixed infections or have been accidentally cross-contaminated, 2) “backfilling” of failed amplicons with contaminating sequence reads or 3) incorrectly assembled genomes where reads from multiple different genetically distinct viruses get assembled into a single genome. In general, the only way to confirm the existence of a recombinant is to independently amplify and re-sequence samples or to detect multiple genomes of the same recombinant lineage in different patients (i.e. by identifying circulating recombinants). Of the 16 recombinants detected, only three were identified by RDP5.46 as circulating recombinants. Therefore, until the other 13 are independently amplified and sequenced, it cannot be definitively stated that they are not simply either sequence amplification or sequence assembly artifacts.
Nevertheless, the fact that HBV recombinants have been so widely and frequently detected suggests that the recombinants detected in this study are likely real. Genotype B/E recombinants identified in Nigeria and Eritria are the most common in Africa [36]. Genotype D/E recombinants are also common, having been identified in eight countries, namely Kenya, Niger, Egypt, Ghana, Libya, Mali, Eretria, and Uganda [36], followed by genotype A/E, identified in five countries, namely Uganda, Eretria, Ghana, Niger, and Mozambique [36,37], and genotype A/D, reported in Egypt, Eretria, and Uganda [36].
Others have also detected recombination hotspots within the C region, pre-C, P, and X genes [38]. These regions were also frequently transferred during recombination events and, as a result, may impact the diagnosis and treatment of HBV since coinfection and viral recombination can trigger greater virulence and result in a worsened patient clinical status [32].
The Geno2pheno-HBV tool for identifying HBsAg vaccine escape and drug-resistant mutations [39,40] identified various potential drug resistance, HBsAg vaccine/immunotherapeutic escape, and diagnostic failure-associated mutations in our study population. Mutations, such as the triple mutation 173L + 180M + 204I/V, and 133L/T, found in the Pol gene, have been identified as major vaccine escape mutations. An HBV study in Bangladesh identified HBsAg mutant 128V as their most common mutant [28] while mutant 100C was the most prevalent in our study. This may be due to the difference in genotype prevalence between the two study populations as HBV-C was the most prevalent genotype in Bangladesh whilst genotype A is the most prevalent among our study population. One of the most prevalent resistance-associated mutations for HBV is 204V/I for both treatment-experienced and treatment-naive individuals. This mutation can either occur alone or can occur in combination with other mutations such as 80I/V, 173L, 180M, 181S, 184S, 200V, and/or 202S [41]. Our study also notes a high prevalence of 204V/I in combination with other drug-resistance mutations.
First-line treatment for CHB includes PEGylated interferon and nucleoside/nucleotide analogs such as Tenofovir, Entecavir, and Lamivudine [7]. In South Africa, over 1.9 million people are chronically infected with HBV and the most used first-line treatment is Tenofovir in the form of tenofovir disoproxil fumarate (TDF) [7]. In this study, we note that all sequences suggested susceptibility to Tenofovir. TDF treatment is long-term and is frequently given indefinitely due to the risk of infections reactivating when therapy is terminated as such treatments do not entirely remove the replication-competent viral genomes [7,42]. A CHB functional cure, characterized by loss of HBsAg and reduced risk of HCC, can be achieved by treatment regimens including TDF [7]. Resistance to TDF has been noted in patients harboring mutations; 80M, 180M, 204V/I, 200V, 221Y, 223A, 184A/L, 153Q, and 191I [43]. The absence of drug-resistance mutations in genotype E genomes and their presence in genotype A and D genomes highlight the importance of monitoring drug resistance as treatment with TDF may not be successful for these patients.
A major limitation of the current study is that HBV samples were only sequenced using the proposed protocol. The sequencing data was not compared to results generated using Illumina sequencing protocols. Moreover, efforts have been invested in optimizing the analysis pipeline to enhance accessibility and enable clinical laboratory staff to execute the entire process from start to end seamlessly. This initiative seeks to empower non-specialist bioinformaticians and streamline workflows, making genomic analysis more user-friendly and ensuring that valuable insights can be obtained without a dependency on specialized expertise. The aim is to make the application of these advanced sequencing technologies accessible to all, allowing broader adoption and application in clinical settings.
While short-read sequencing is the most used form of NGS [27], despite ONT having a slightly higher error rate, ONT appears to generate high-quality data at a very affordable cost. Therefore, ONT-based sequencing is presently the most cost-effective, HTS technology, especially well-suited for countries with limited resources for monitoring shifting viral demographics and tracking the prevalence and spread of drug resistance and vaccine evasion mutations.
The high value of genome surveillance was excellently demonstrated during the COVID-19 pandemic. Although whole genome sequencing was primarily used to monitor virus evolution and was only carried out on ~2.12% of all diagnosed COVID-19 cases (https://data.who.int/dashboards/covid19/cases?n=c, https://gisaid.org/), the prospect of agnostically diagnosing any viral pathogen (whether known or unknown) through HTS-based whole genome sequencing is likely to be realized within the coming decade. Diagnosis-augmenting protocols that are applicable in a clinical virology setting, such as the one we present here, are an important first step toward this objective.

4. Materials and Methods

4.1. Study Design

The 148 anonymized residual diagnostic plasma/serum samples analyzed in this cross-sectional study were obtained from the National Health Laboratory Service (NHLS) based at the Division of Medical Virology, Tygerberg Hospital, South Africa. These samples had been sent for HBV DNA load measurement and all samples were confirmed HBV DNA-positive. The study was approved by the Stellenbosch University Health Research Ethics Committee (HREC: N22/08/089).

4.2. HBV DNA Extraction

DNA was extracted from 1 ml of patient serum using the Qiagen DNA extraction kit, following the manufacturer's instructions (QIAGEN, Hilden, Germany). Extracted DNA was eluted in a volume of 50 μl. The extracts were stored at −80 °C until use.

4.3. Primer Design

Primers were designed using Primal scheme (https://primalscheme.com) using the HBV sequences of genotypes A-J obtained from GenBank (https://www.ncbi.nlm.nih.gov/labs/virus/vssi/#/). These primers were designed to target the full length of the HBV genome (Table 3) and were used to obtain tiling PCR products for ONT library preparation.

4.4. Tiling-Based Polymerase Chain Reaction

For HBV whole-genome amplification using a multiplex PCR approach, we designed primers that would generate 1,200 base pair (bp) amplicons with 70 bp overlaps, spanning the 3,200 HBV genome. Since HBV has a relaxed circular DNA genome, we modified the ARTIC SARS-CoV-2 amplification protocol with proven applicability in clinical settings [44] by excluding the synthesis of complementary DNA (cDNA). Instead, we prepared master mixes using two pools of HBV primers. The ARTIC protocol utilizes these primer pools to amplify tiled amplicons of approximately 400 bp [45]. Randomly generated PCR products were quantified using the Qubit double-strand DNA (dsDNA) High Sensitivity assay kit on a Qubit 4.0 instrument (Life Technologies). Amplicons were purified using 1x AMPure XP beads from Beckman Coulter and quantified using the Qubit dsDNA HS assay kit from ThermoFisher. DNA library preparation was carried out using the SQK-RBK110.96 ligation sequencing kit from ONT, and rapid barcoding using SLK RBK109. The resulting sequencing libraries were loaded into an R9.4 flow cell from ONT.

4.5. Raw-Read Assessment and Genotyping

Whole genome sequencing of samples was performed using the GridION platform (ONT, Oxford, UK) using the primers listed in Table 3, and the samples were sequenced in three runs. Subsequently, raw sequencing files underwent base calling using Guppy v3.4.5, and barcode demultiplexing was performed using qcat (demultiplexing tool) incorporated in MinKNOW Release (version 22.05.12). De novo genome assembly was carried out using GD v1.132/1.133 (https://www.genomedetective.com/ last accessed 03 August 2023). Briefly, GD utilizes DIAMOND to identify and classify potential viral reads within broad taxonomic units. The viral subset of the SwissProt UniRef protein database was used for this classification. Subsequently, reads were assigned to candidate reference sequences using the National Center for Biotechnology Information (NCBI) nucleotide database to implement a Basic Local Alignment Search Tool analyses (BLAST) and aligned using AGA (Annotated Genome Aligner) and MAFFT (v7.490) [46]. The resulting contigs and consensus sequences were then exported in FASTA file format. Raw read files were deposited in the NCBI SRA database (SRR26038114-SRR26038214, SRR2746800-SRR2746843).

4.6. Recombination Analysis

All sequences in the study were assessed for inter-genotype recombination using thejpHMM-HBV online tool, available at http://jphmm.gobics.de/submission_hbv, and intra- and inter-genotype recombination using RDP5.46 [47]. The jpHMM-HBV online tool was used to plot and visualize inter-genotype recombination breakpoints. A full exploratory automated scan for recombination with RDP5.46 was performed with the RDP [48], GENECONV [49], and MaxChi [50] methods as “primary scanning methods” to detect recombination signals and the Bootscan [51], Chimaera [52], SiScan [53], and 3Seq [54] methods to verify the signals (secondary scanning methods). The RDP5.46 general setting for sequence type was set as circular, the bootscan window size was set to 500 bp with a step size of 20 bp, and the SiScan window size was set to 200 bp with a step size of 20 bp. The remaining analysis options were kept at their default values. To ensure reliability, the HBV sequences identified as potential recombinants by RDP5.46 were only considered to be recombinant when the recombination signal was supported by at least four recombination detection methods with P-values of ≤0.05 after Bonferroni correction for multiple comparisons [55–57].

4.7. Genotyping and the Identification of Drug-Resistance and Immune-Escape Mutations

The GD HBV phylogenetic typing tool, available at https://www.genomedetective.com/app/typingtool/hbv/, was used to infer genotypes, sub-genotypes, and serotypes of HBV genomes and Geno2pheno software, available at http://hbv.geno2pheno.org/, was used to identify potential drug resistance and antibody escape mutations. Briefly, the HBV phylogenetic typing tool utilizes phylogenetic methods to identify the HBV genotype of a nucleotide sequence. Geno2pheno is an online platform that applies an algorithm that is widely used to predict phenotypic drug resistance mutations in the P open reading frames and antibody escape mutations in the S open reading frames of HBV genomes. The sequences from this study were deposited in GenBank under the accession numbers PP123755 - PP123892.

4.8. Statistical Analyses

All numerical data were analyzed using RStudio version 4.1.3 (Posit team (2023). RStudio: Integrated Development Environment for R. Posit Software, PBC, Boston, MA. URL http://www.posit.co/). Baseline characteristics were presented as proportions for categorical data, as means for normally distributed continuous data, or as medians for skewed normally distributed variables. Kruskal Wallis tests (for skewed continuous variables) were used to test for differences in age and viral load groupings. A Chi-square test was used to determine the significant difference in the gender classes. A Pearson linear correlation test was used to test for a correlation between viral loads and genome coverage of viral sequences and a pairwise t-test was used to test for differences in genome coverage between the different HBV genotypes.

Author Contributions

Conceptualization, TdO, DPM, DT, WC, SEJ, and TM.; methodology, TdO, DPM, DT, WC, SEJ, TM, WP, GvZ, JG, SP, UJA, TJS, and YN.; software, TdO and DPM.; validation, TdO, DPM, DT, WC, SEJ, TM.; formal analysis, TdO, DPM, DT, WC, SEJ, TM; investigation, TdO, DPM, DT, WC, SEJ, TM; resources, TdO and DPM.; data curation, TdO, DT, WC, SEJ, and TM.; writing—original draft preparation, DT, WC, and SEJ.; writing—review and editing, DT, WC, and SEJ., CB visualization, DPM, DT, WC, and SEJ.; supervision, TdO and DPM.; project administration, TdO.; funding acquisition, TdO, CB. All authors have read and agreed to the published version of the manuscript.

Funding

This research received no external funding.

Institutional Review Board Statement

The study was approved by the Stellenbosch University Health Research Ethics Committee (HREC: N22/08/089).

Informed Consent Statement

Not applicable.

Data Availability Statement

The raw read files generated during this study have been deposited in the NCBI SRA (SRR26038114 - SRR26038214, SRR2746800 - SRR2746843). The processed sequences have been submitted to GenBank and are accessible under accession numbers PP123755 - PP123892.

Acknowledgments

Sequencing activities at KRISP and CERI are supported in part by grants from the Rockefeller Foundation (HTH 017), the Abbott Pandemic Defense Coalition (APDC), the National Institute of Health USA (U01 AI151698) for the United World Antivirus Research Network (UWARN) the SAMRC South African mRNA Vaccine Consortium (SAMVAC), Global Health EDCTP3 Joint Undertaking and its members as well as Bill & Melinda Gates Foundation (101103171), European Union’s Horizon Europe Research and Innovation Programme (101046041) and the Health Emergency Preparedness and Response Umbrella Program (HEPR Program), managed by the World Bank Group (TF0B8412). We want to thank Professors Wolfgang Preiser and Gert van Zyl from the Division of Medical Virology, Faculty of Medicine and Health Sciences, Stellenbosch University, Cape Town, South Africa, and the National Health Laboratory Service for providing the samples used in this study. We also thank Dr. Richard J. Lessells from the KwaZulu-Natal Research Innovation and Sequencing Platform (KRISP), University of KwaZulu-Natal, Durban, South Africa, for his valuable contributions. Special thanks to Drs. Monika Moir, Tomasz Janusz Sanko, Eduan Wilkinson, and Houriiyah Tegally, from the Centre for Epidemic Response and Innovation (CERI), for their insightful review and editing of the manuscript.

Conflicts of Interest

The authors declare no conflicts of interest.

Appendix A

Table A1. Verification of HBV recombinants using RDP5.56.
Sequence RDP GeneConv BootScan MaxChi Chimaera Sister scan TOPAL
K048723* 1.08x10-15 5.51x10⁻¹⁰ 4.61x10-02 7.31x10-09 1.15x10-07 1.58x10-04 6.45x10⁻¹³
K048737* 1.66x10-11 3.93x10⁻¹¹ NS 6.41x10-07 2.02x10-05 1.79x10-08 8.29x10⁻¹¹
K048753* 3.09x10-10 3.43x10-06 NS 5.64x10-06 4.17x10-05 1.26x10-09 8.07x10-09
K048756* 1.59x10-11 2.21x10-08 1.95x10-02 1.00x10⁻¹⁰ 1.00x10⁻¹⁰ 1.45x10⁻¹³ 1.50x10⁻²¹
K056892 2.30x10-07 1.76x10-05 7.24x10-05 2.94x10-04 2.01x10-04 8.16x10-06 9.75x10-07
K056897 1.89x10⁻²¹ 1.24x10⁻¹⁹ 1.67x10-07 2.60x10⁻¹² 6.11x10⁻¹³ 1.21x10⁻¹⁵ 3.58x10⁻²⁵
K056900* 1.47x10-16 8.36x10⁻¹³ 2.77x10⁻¹³ 4.40x10⁻¹¹ 4.37x10⁻¹⁰ 1.64x10⁻¹³ 3.32x10⁻¹⁵
K056911 2.61x10⁻¹⁰ 3.51x10-09 5.81x10-05 NS NS 3.33x10-02 1.75x10-04
K056916* 2.16x10-10 1.92x10-08 NS 1.74x10-03 1.54x10-03 1.14x10-04 3.00x10-07
K056934* 7.56x10-16 1.39x10-05 1.06x10-04 3.93x10-03 NS NS 1.74x10-04
K056939 1.86x10-06 1.17x10-03 7.42x10-05 2.05x10-05 1.41x10-04 3.82x10-08 5.02x10-04
K056944* 4.52x10-18 3.36x10⁻¹⁵ NS 1.04x10⁻¹⁰ 5.47x10⁻¹¹ 1.38x10-04 1.77x10⁻²³
K056945* 3.42x10-20 1.26x10⁻¹⁷ 1.83x10-02 1.88x10⁻¹⁸ 1.48x10-05 2.92x10⁻²⁶ 2.53x10⁻²⁷
K056950* 5.16x10-08 1.87x10-06 NS 7.51x10-06 2.34x10-06 8.20x10-03 4.75x10-09
K057256* 1.47x10-17 9.40x10⁻¹⁷ 4.14x10-04 4.17x10⁻¹¹ 1.31x10⁻¹¹ 4.29x10⁻¹² 4.52x10⁻²⁶
K057265 7.53x10⁻¹¹ 1.72x10-09 1.03x10-03 4.03x10-08 9.05x10-05 1.10x10-02 1.10x10⁻¹⁰
K057280* 6.92x10-21 2.63x10⁻²² 2.12x10⁻¹⁹ 3.78x10-06 3.29x10-06 1.28x10-07 8.01x10⁻²¹
Recombinant IDs marked with a "*" were also classified as recombinants by jpHMM.

References

  1. Coste, M. , et al., Burden and impacts of chronic hepatitis B infection in rural Senegal: study protocol of a cross-sectional survey in the area of Niakhar (AmBASS ANRS 12356). BMJ Open, 2019. 9(7): p. e030211. [CrossRef]
  2. Global, regional, and national burden of hepatitis B, 1990-2019: a systematic analysis for the Global Burden of Disease Study 2019. Lancet Gastroenterol Hepatol, 2022. 7(9): p. 796-829. [CrossRef]
  3. Carman, W.F. , The clinical significance of surface antigen variants of hepatitis B virus. J Viral Hepat, 1997. 4 Suppl 1: p. 11-20. [CrossRef]
  4. Inoue, J., T. Nakamura, and A. Masamune, Roles of Hepatitis B Virus Mutations in the Viral Reactivation after Immunosuppression Therapies. Viruses, 2019. 11(5). [CrossRef]
  5. Kurbanov, F., Y. Tanaka, and M. Mizokami, Geographical and genetic diversity of the human hepatitis B virus. Hepatol Res, 2010. 40(1): p. 14-30. [CrossRef]
  6. Kramvis, A. , Molecular characteristics and clinical relevance of African genotypes and subgenotypes of hepatitis B virus. S Afr Med J, 2018. 108(8b): p. 17-21. [CrossRef]
  7. Maepa, M.B. , et al., Hepatitis B Virus Research in South Africa. Viruses, 2022. 14(9). [CrossRef]
  8. Abe, H. , et al., Genetic Diversity of Hepatitis B and C Viruses Revealed by Continuous Surveillance from 2015 to 2021 in Gabon, Central Africa. Microorganisms, 2023. 11(8). [CrossRef]
  9. Giandhari, J. , et al., Early transmission of SARS-CoV-2 in South Africa: An epidemiological and phylogenetic report. Int J Infect Dis, 2021. 103: p. 234-241. [CrossRef]
  10. Ingasia, L.A.O. , et al., Global and regional dispersal patterns of hepatitis B virus genotype E from and in Africa: A full-genome molecular analysis. PLOS ONE, 2020. 15(10): p. e0240375. [CrossRef]
  11. Al-Matary, A.M. and F.A.S. Al Gashaa, Comparison of different rapid screening tests and ELISA for HBV, HCV, and HIV among healthy blood donors and recipients at Jibla University Hospital Yemen. J Med Life, 2022. 15(11): p. 1403-1408. [CrossRef]
  12. Parekh, B.S. , et al., Diagnosis of Human Immunodeficiency Virus Infection. Clin Microbiol Rev, 2019. 32(1). [CrossRef]
  13. Solmone, M. , et al., Use of massively parallel ultradeep pyrosequencing to characterize the genetic diversity of hepatitis B virus in drug-resistant and drug-naive patients and to detect minor variants in reverse transcriptase and hepatitis B S antigen. J Virol, 2009. 83(4): p. 1718-26. [CrossRef]
  14. Soleimani, B. , et al., Comparison Between Core Set Selection Methods Using Different Illumina Marker Platforms: A Case Study of Assessment of Diversity in Wheat. Frontiers in Plant Science, 2020. 11. [CrossRef]
  15. Adewale, B.A. , Will long-read sequencing technologies replace short-read sequencing technologies in the next 10 years? Afr J Lab Med, 2020. 9(1): p. 1340. [CrossRef]
  16. Quiñones-Mateu, M.E. , et al., Deep sequencing: becoming a critical tool in clinical virology. J Clin Virol, 2014. 61(1): p. 9-19. [CrossRef]
  17. Liu, W.C. , et al., Aligning to the sample-specific reference sequence to optimize the accuracy of next-generation sequencing analysis for hepatitis B virus. Hepatol Int, 2016. 10(1): p. 147-57. [CrossRef]
  18. Makondo, E., T. G. Bell, and A. Kramvis, Genotyping and molecular characterization of hepatitis B virus from human immunodeficiency virus-infected individuals in southern Africa. PLoS One, 2012. 7(9): p. e46345. [CrossRef]
  19. Caballero, A. , et al., Complex Genotype Mixtures Analyzed by Deep Sequencing in Two Different Regions of Hepatitis B Virus. PLOS ONE, 2016. 10(12): p. e0144816. [CrossRef]
  20. Han, Y. , et al., Analysis of hepatitis B virus genotyping and drug resistance gene mutations based on massively parallel sequencing. J Virol Methods, 2013. 193(2): p. 341-7. [CrossRef]
  21. Jones, L.R. , et al., Hepatitis B virus resistance substitutions: long-term analysis by next-generation sequencing. Arch Virol, 2016. 161(10): p. 2885-91. [CrossRef]
  22. Lowe, C.F. , et al., Implementation of Next-Generation Sequencing for Hepatitis B Virus Resistance Testing and Genotyping in a Clinical Microbiology Laboratory. J Clin Microbiol, 2016. 54(1): p. 127-33. [CrossRef]
  23. McNaughton, A.L. , et al., Illumina and Nanopore methods for whole genome sequencing of hepatitis B virus (HBV). Sci Rep, 2019. 9(1): p. 7081. [CrossRef]
  24. Radukic, M.T. , et al., Nanopore sequencing of native adeno-associated virus (AAV) single-stranded DNA using a transposase-based rapid protocol. NAR Genom Bioinform, 2020. 2(4): p. lqaa074. [CrossRef]
  25. Ranasinghe, D. , et al., Comparison of different sequencing techniques for identification of SARS-CoV-2 variants of concern with multiplex real-time PCR. PLOS ONE, 2022. 17(4): p. e0265220. [CrossRef]
  26. Loman, N.J., J. Quick, and J.T. Simpson, A complete bacterial genome assembled de novo using only nanopore sequencing data. Nature Methods, 2015. 12(8): p. 733-735. [CrossRef]
  27. Krzywinski, M. , et al., Circos: an information aesthetic for comparative genomics. Genome Res, 2009. 19(9): p. 1639-45. [CrossRef]
  28. Hossain, M.G. and K. Ueda, A meta-analysis on genetic variability of RT/HBsAg overlapping region of hepatitis B virus (HBV) isolates of Bangladesh. Infect Agent Cancer, 2019. 14: p. 33. [CrossRef]
  29. Astbury, S. , et al., Extraction-free direct PCR from dried serum spots permits HBV genotyping and RAS identification by Sanger and minION sequencing. bioRxiv, 2019: p. 552539. [CrossRef]
  30. Sauvage, V. , et al., Early MinION™ nanopore single-molecule sequencing technology enables the characterization of hepatitis B virus genetic complexity in clinical samples. PLOS ONE, 2018. 13(3): p. e0194366. [CrossRef]
  31. Dopico, E. , et al., Genotyping Hepatitis B virus by Next-Generation Sequencing: Detection of Mixed Infections and Analysis of Sequence Conservation. Int J Mol Sci, 2024. 25(10). [CrossRef]
  32. Gionda, P.O. , et al., Analysis of the complete genome of HBV genotypes F and H found in Brazil and Mexico using the next generation sequencing method. Ann Hepatol, 2022. 27 Suppl 1: p. 100569. [CrossRef]
  33. Chotiyaputta, W. and A.S. Lok, Hepatitis B virus variants. Nat Rev Gastroenterol Hepatol, 2009. 6(8): p. 453-62. [CrossRef]
  34. Kimbi, G.C., A. Kramvis, and M.C. Kew, Distinctive sequence characteristics of subgenotype A1 isolates of hepatitis B virus from South Africa. J Gen Virol, 2004. 85(Pt 5): p. 1211-1220. [CrossRef]
  35. Jose-Abrego, A. , et al., Hepatitis B Virus (HBV) Genotype Mixtures, Viral Load, and Liver Damage in HBV Patients Co-infected With Human Immunodeficiency Virus. Front Microbiol, 2021. 12: p. 640889. [CrossRef]
  36. Kafeero, H.M. , et al., Mapping hepatitis B virus genotypes on the African continent from 1997 to 2021: a systematic review with meta-analysis. Sci Rep, 2023. 13(1): p. 5723. [CrossRef]
  37. Tyler, B. , et al., Hepatitis B Virus Genotype E/A Recombinants from Blood Donors in Beira, Mozambique. Microbiol Resour Announc, 2023. 12(6): p. e0018223. [CrossRef]
  38. Chen, B.F. , et al., High prevalence and mapping of pre-S deletion in hepatitis B virus carriers with progressive liver diseases. Gastroenterology, 2006. 130(4): p. 1153-68. [CrossRef]
  39. Beggel, B. , et al., Genotyping hepatitis B virus dual infections using population-based sequence data. J Gen Virol, 2012. 93(Pt 9): p. 1899-1907. [CrossRef]
  40. Neumann-Fraune, M. , et al., Hepatitis B virus drug resistance tools: one sequence, two predictions. Intervirology, 2014. 57(3-4): p. 232-6. [CrossRef]
  41. Mokaya, J. , et al., A systematic review of hepatitis B virus (HBV) drug and vaccine escape mutations in Africa: A call for urgent action. PLOS Neglected Tropical Diseases, 2018. 12(8): p. e0006629. [CrossRef]
  42. Spearman, C.W. , et al., South African guideline for the management of chronic hepatitis B: 2013. S Afr Med J, 2013. 103(5 Pt 2): p. 337-49.
  43. Lee, H.W. , et al., Viral evolutionary changes during tenofovir treatment in a chronic hepatitis B patient with sequential nucleos(t)ide therapy. J Clin Virol, 2014. 60(3): p. 313-6. [CrossRef]
  44. Tegally, H. , et al., Detection of a SARS-CoV-2 variant of concern in South Africa. Nature, 2021. 592(7854): p. 438-443. [CrossRef]
  45. Tyson, J.R. , et al., Improvements to the ARTIC multiplex PCR method for SARS-CoV-2 genome sequencing using nanopore. bioRxiv, 2020. [CrossRef]
  46. Katoh, K. and D.M. Standley, MAFFT Multiple Sequence Alignment Software Version 7: Improvements in Performance and Usability. Molecular Biology and Evolution, 2013. 30(4): p. 772-780. [CrossRef]
  47. Martin, D.P. , et al., RDP5: a computer program for analyzing recombination in, and removing signals of recombination from, nucleotide sequence datasets. Virus Evol, 2021. 7(1): p. veaa087. [CrossRef]
  48. Martin, D. and E. Rybicki, RDP: detection of recombination amongst aligned sequences. Bioinformatics, 2000. 16(6): p. 562-3. [CrossRef]
  49. Padidam, M., S. Sawyer, and C.M. Fauquet, Possible emergence of new geminiviruses by frequent recombination. Virology, 1999. 265(2): p. 218-25. [CrossRef]
  50. Smith, J.M. , Analyzing the mosaic structure of genes. J Mol Evol, 1992. 34(2): p. 126-9. [CrossRef]
  51. Martin, D.P. , et al., A modified bootscan algorithm for automated identification of recombinant sequences and recombination breakpoints. AIDS Res Hum Retroviruses, 2005. 21(1): p. 98-102. [CrossRef]
  52. Posada, D. and K.A. Crandall, Evaluation of methods for detecting recombination from DNA sequences: computer simulations. Proc Natl Acad Sci U S A, 2001. 98(24): p. 13757-62. [CrossRef]
  53. Gibbs, M.J., J. S. Armstrong, and A.J. Gibbs, Sister-Scanning: a Monte Carlo procedure for assessing signals in recombinant sequences. Bioinformatics, 2000. 16(7): p. 573-582. [CrossRef]
  54. Lam, H.M., O. Ratmann, and M.F. Boni, Improved Algorithmic Complexity for the 3SEQ Recombination Detection Algorithm. Mol Biol Evol, 2018. 35(1): p. 247-251. [CrossRef]
  55. Kiwelu, I.E. , et al., Frequent intra-subtype recombination among HIV-1 circulating in Tanzania. PLoS One, 2013. 8(8): p. e71131. [CrossRef]
  56. Martin, D.P. , et al., RDP3: a flexible and fast computer program for analyzing recombination. Bioinformatics, 2010. 26(19): p. 2462-3. [CrossRef]
  57. Sentandreu, V. , et al., Evidence of Recombination in Intrapatient Populations of Hepatitis C Virus. PLOS ONE, 2008. 3(9): p. e3239. [CrossRef]
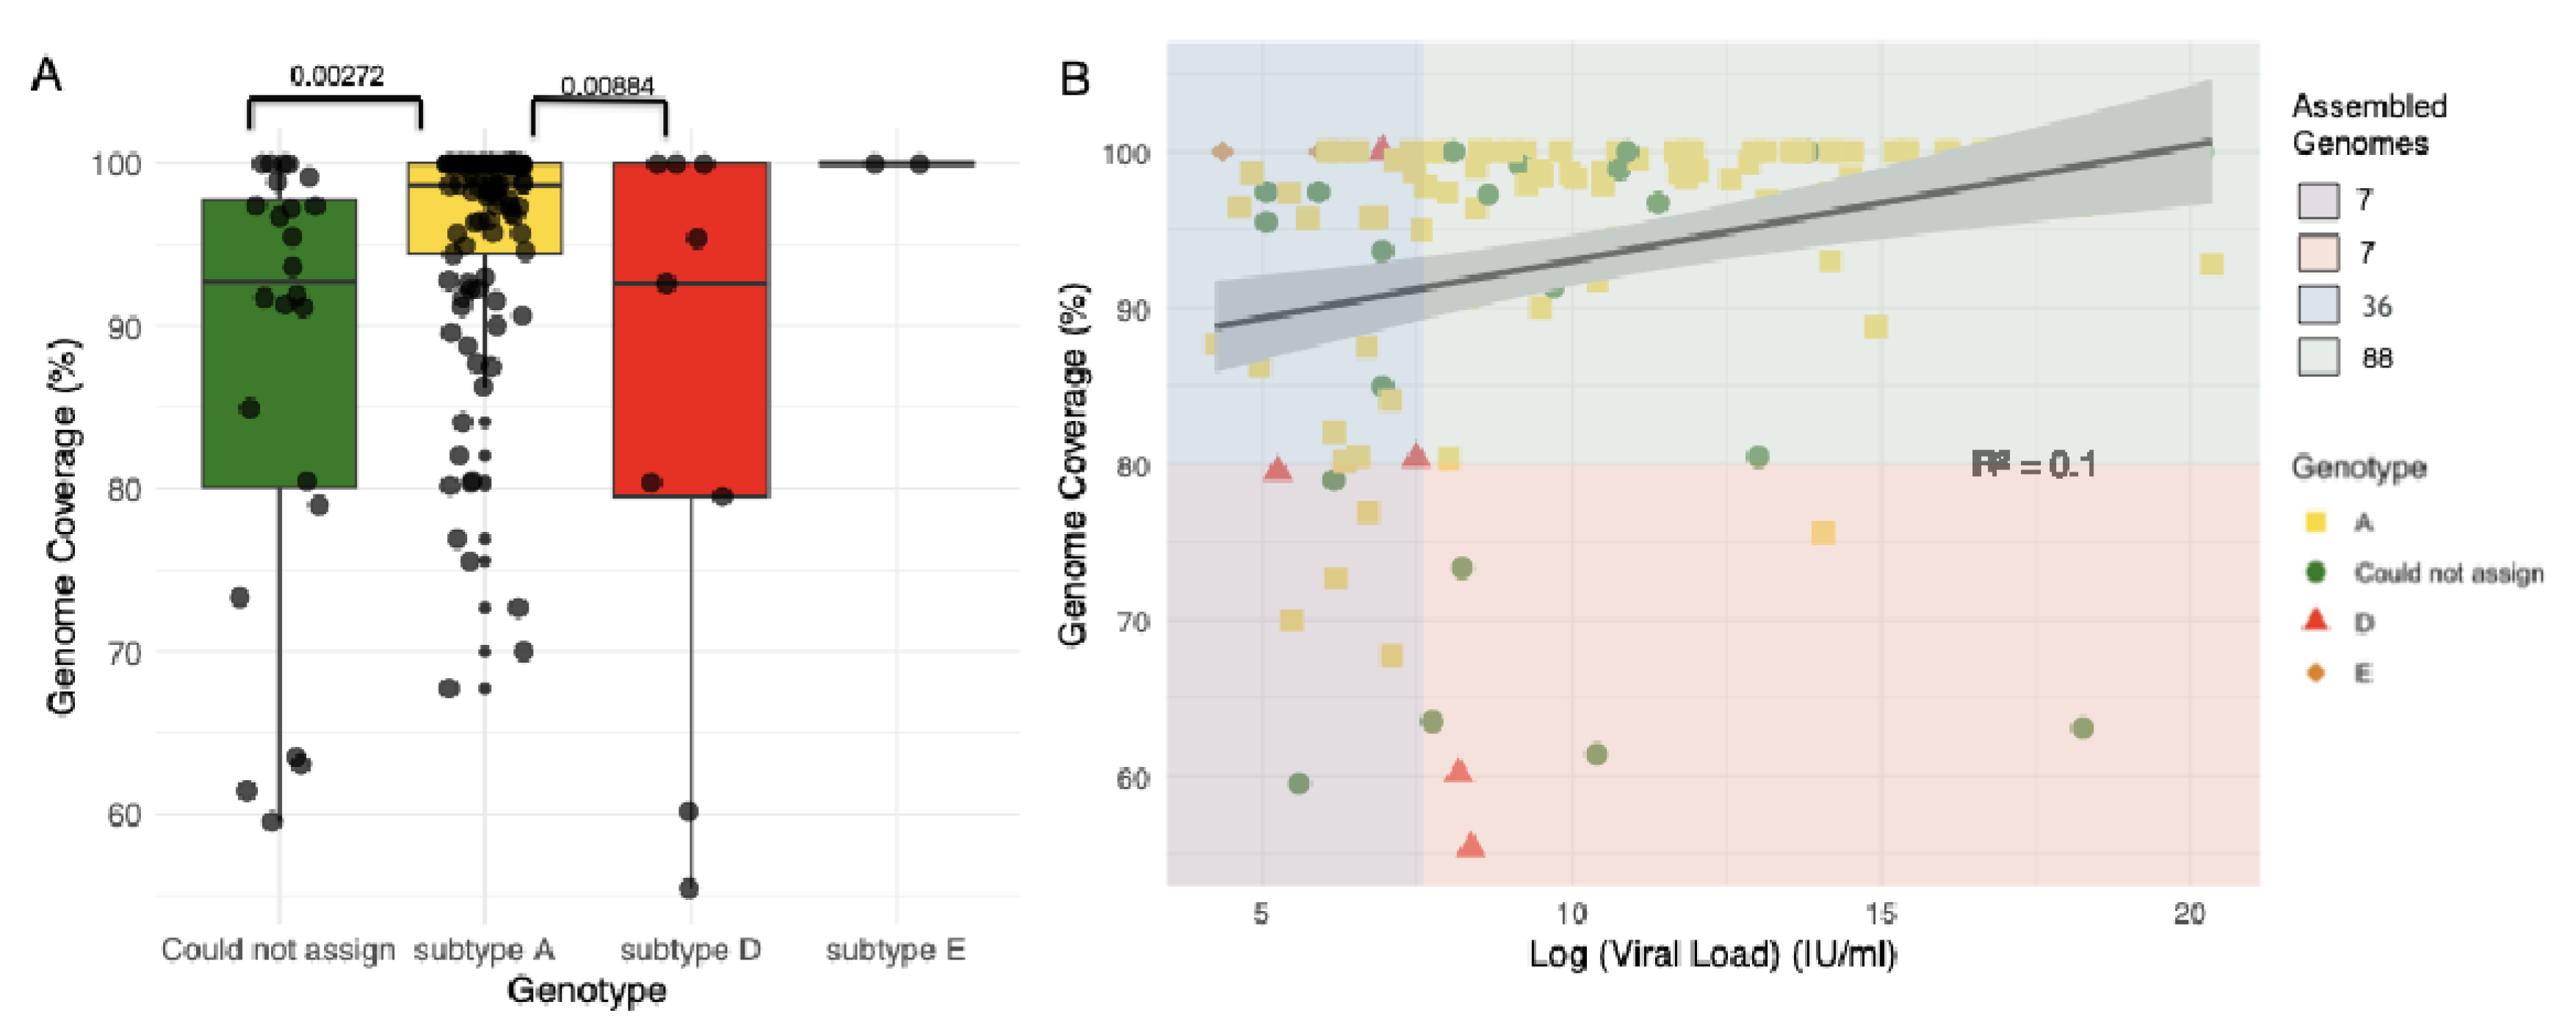
Figure 1. (A) Comparison of genome coverage for different detected HBV genotypes. The boxes indicate the lower quartile, median, and upper quartile minimum and maximum values by the whiskers. Significant differences between genome coverage (paired Wilcoxon test) values between each genotype are denoted above the box and whisker plots. (B) Scatter plot for log viral load against the genome coverage for detected HBV genotypes. A total of 124 genomes with >80% coverage were produced (36 with a log viral load of <7.6 IU/ml and 88 with a log viral load of >7.6 IU/ml). HBV genotypes are represented by different colors and shapes. The different background color shades represent different quality control groups. The blue and purple shades represent ≤7.6 IU/ml log viral load and coverage of ≥80% and <80%, respectively. The green and pink shades represent a log viral load of >7.6 IU/ml and coverage of ≥80% and <80%, respectively.
Preprints 120243 g001
Figure 2. Flowchart showing the identification of recombinants using the jpHMM HBV-tool and RDP5.46. The blue section shows the number of genomes produced by Genome Detective, the green section shows genotype variation as assessed by the Genome Detective Hepatitis B phylogenetic typing tool; the orange section highlights the jpHMM recombination classifications of the unclassified sequences, and the red section shows the RDP5.46 recombination analysis. Sample IDs are shown below the flowchart sections and IDs that are shown in red highlight recombinants that both jpHMM and RDP5.46 detected. Sample IDs marked with a "*" were classified as different recombinants by jpHMM and RDP5.46.
Preprints 120243 g002
Figure 3. jpHMM genome maps for A/D recombinant viruses. The query isolates identifier names are listed below each jumping profile map. Genome maps presented here were created using the software package Circos [27]. The colored shadings represent different HBV genotypes (red = A, yellow = D, grey = unknown). Regions of orange shading represent recombination breakpoint intervals, e.g. region 405 ± 40 (outer ring). All sequence position numbers are given relative to the HBV reference genome AM282986. Positions of genes in the genome are marked with grey and black bars (inner ring). The color legend is in the middle, and the "NA" denotes "not assigned".
Preprints 120243 g003
Figure 4. (A) jpHMM genome maps and (B) Genome Detective bootscan plots for non-A/D recombinant viruses. Bootscan analysis was performed with a window size of 400 and a step size of 100. (C) Genome coverage maps highlighting HBV sequencing depth. The query isolates are listed below each genome coverage map.
Preprints 120243 g004
Figure 5. Recombination region and breakpoint distributions (A) recombinant region count matrix highlighting areas of the genome that are most and least commonly transferred during recombination events. Unique recombination events were mapped onto a region count matrix based on determined breakpoint positions. Each cell in the matrix represents a pair of genome sites with the colors of cells indicating the number of times recombination events separated the represented pairs of sites. (B) Breakpoint distribution across HBV genomes. All detectable breakpoint positions are represented as black lines above the graph. The green areas show the 99% confidence interval for breakpoint clustering under random recombination. The upper dotted line represents the global 99% confidence interval for a breakpoint clustering under random recombination and the lower dotted line is the global 95% confidence interval for breakpoint clustering under random recombination. The black line represents the number of breakpoints within a 200-nucleotide window moved along the genome. Areas in red where the black line emerges above the green area are considered recombination warm spots and those that traverse the dotted global 95% confidence interval line are considered statistically supported recombination hotspots. An HBV gene map is plotted between the figures.
Preprints 120243 g005
Figure 6. Frequency and distribution of HBV genotypes circulating in South Africa between September 2022 and November 2023. Genotyping was performed using the GD HBV phylogenetic typing tool and recombination analysis was performed using RDP5.46.
Preprints 120243 g006
Figure 7. (A) Prevalence of predicted drug resistance based on mutation patterns in the RT/HBsAg overlapping region for HBV genomes sampled in South Africa between September 2022 and November 2023. (B) Prevalence of HBsAg vaccine escape mutations in the RT/HBsAg overlapping region for these same genomes.
Preprints 120243 g007
Table 1. Demographic characteristics for the 138 patient samples.
Characteristic Total N=138 (%)
Gender
Male 86 (62.32)
Female 52 (37.68)
Age
<18 2 (1.45)
18 - 24 6 (4.35)
25 - 34 30 (21.74)
35 - 44 44 (31.88)
≥45 56 (40.58)
HBV viral load (IU/ml)
<2000 39 (28.26)
2000 - 20 000 31 (22,46)
>20 000 68 (49.28)
Table 2. Prevalence of drug-resistant mutations in the RT/HBsAg overlapping region.
Mutation Adefovir Entecavir Lamuvidine Telbivudine
180M 0 4 4 0
204V 0 5 5 5
181T 1 0 0 0
202K 0 2 0 0
250S 0 1 0 0
250N 0 1 0 0
Table 3. The primer sequences and genomic targets used for the tiling PCR and library preparation for ONT sequencing1,2.
Primer Name Sequence Genomic positions (bp)
SC_1_LEFT TTC CAC CAA GCT CTG CAA GATC 11 - 32
SC_1_RIGHT AGAGGAATATGATAAAACGCCGCA 384-407
SC_2_LEFT CATCATCATCAT CACCA CCTCC 325-346
SC_2_RIGHT AAAGCCCTACGAACCACTGAAC 692-713
SC_3_LEFT AAATACCTATGGGAGTGGGCCT 632-653
SC_3_RIGHT TTGTGTAAATGGAGCGGCAAAG 1 655-1 676
SC_4_LEFT AGAAAACTTCCTGTTAACAGACCTATTG 949-976
SC_4_RIGHT GGACGACAGAATTATCAGTCCCG 1 326-1 348
SC_5_LEFT TCCATACTGCGGAACTCCTAGC 1 265-1 286
SC_5_RIGHT TGTAAGACCTTGGGCAGGATTTG 1 632-1 654
SC_6_LEFT CTTCTCATCTGCCGGTCCGTGT 1 559-1580
SC_6_RIGHT AGAAGTCAGAAGGCAAACGAGA 1 947-1 970
SC_7_LEFT GGCTTTGGGGCATGGACATT 1 890-1 909
SC_7_RIGHT ATCCACACTCCGAAAGAGACCA 2 256-2 277
SC_8_LEFT GACAACTATTGTGGTTTCATATTTCT 2 193-2 218
SC_8_RIGHT TTGTTGACACCTATTAATAATGTCCTCA 2 576-2 594
SC_9_LEFT TGGGCTTTATTCCTCTACTGTCCC 2 492-2 515
SC_9_RIGHT GGGAACAGAAAGATTCGTCCCC 2 889-2 910
SC_10_LEFT TTGCGGGTCACCATATTCTTGG 2 816-2 837
SC_10_RIGHT GGCCTGAGGATGACTGTCTCTT 3 189-3 210
1See the following link for details: (https://dx.doi.org/10.17504/protocols.io.5qpvo3xxzv4o/v1); 2Primers for Pools 1 and 2. Pool one primers are represented by odd numbers (SC_1, SC_3, ...), and pool two are represented by even numbers (SC_2, SC_4, etc.).
Disclaimer/Publisher’s Note: The statements, opinions and data contained in all publications are solely those of the individual author(s) and contributor(s) and not of MDPI and/or the editor(s). MDPI and/or the editor(s) disclaim responsibility for any injury to people or property resulting from any ideas, methods, instructions or products referred to in the content.
Copyright: This open access article is published under a Creative Commons CC BY 4.0 license, which permit the free download, distribution, and reuse, provided that the author and preprint are cited in any reuse.
Prerpints.org logo

Preprints.org is a free preprint server supported by MDPI in Basel, Switzerland.

Subscribe

© 2024 MDPI (Basel, Switzerland) unless otherwise stated