
Submitted:
03 October 2024
Posted:
04 October 2024
You are already at the latest version
Abstract
The Chinese stock market, marked by rapid growth and significant volatility, presents unique challenges for investors and analysts. A-share stocks, traded on the Shanghai and Shenzhen exchanges, are crucial to China’s financial system and offer opportunities for both domestic and international investors. Accurate stock recommendation tools are vital for informed decision-making, especially given the ongoing regulatory changes and economic reforms in China. Current stock recommendation methods often fall short, as they typically fail to capture the complex inter-company relationships and rely heavily on financial reports, neglecting the potential of unlabeled data and historical price trends. In response, we propose a novel approach that combines graph-based structures with historical price data to develop self-learned stock embeddings for A-share recommendations. Our method leverages self-supervised learning, bypassing the need for human-generated labels and autonomously uncovering latent relationships and patterns within the data. This dual-input strategy enhances the understanding of market dynamics, leading to more accurate stock predictions. Our contributions include a novel framework for label-free stock recommendations with modeling stock connections and pricing information, and empirical evidence demonstrating the robustness and adaptability of our approach in the volatile Chinese stock market.
Keywords:
Stock Recommendation
; Graph Neural Network
; Gated Recurrent Network
; Self-supervised Learning
1. Introduction
The Chinese stock market [1,2,3] holds an increasingly pivotal role within the global financial landscape, distinguished by its rapid expansion, significant trading volumes, and pronounced volatility [4,5]. These unique attributes present a combination of both challenges and opportunities for investors and analysts seeking to maximize returns while managing risks. As the market becomes more intricate, driven by diverse factors ranging from global economic conditions to domestic policy shifts, the demand for sophisticated stock recommendation systems has never been higher. These systems must be capable of navigating the unpredictable nature of the market while providing investors with actionable and precise insights.
A-share stocks, primarily traded on the Shanghai and Shenzhen exchanges, form the backbone of China’s financial ecosystem. They play a crucial role in providing both domestic and international investors with access to China’s economic engine. These stocks represent companies in sectors ranging from technology and manufacturing to finance and consumer goods, offering a broad spectrum of opportunities for portfolio diversification. Effective recommendation tools for A-share stocks are indispensable for ensuring that investors make informed decisions based on market realities and evolving trends. Such tools are not only vital for portfolio optimization but also for sustaining overall market liquidity and stability. Moreover, as China continues to introduce regulatory reforms and implement structural economic adjustments, having the ability to forecast A-share market movements with accuracy becomes even more critical for investors aiming to capitalize on market changes.
A unique aspect of the A-share market is its concept-based trading approach [6,7,8], where stocks are often grouped and evaluated based on broader thematic concepts rather than traditional industry classifications. For instance, stocks linked to emerging technologies such as artificial intelligence or clean energy are bundled together based on their shared potential to drive future growth, regardless of their specific sector. This concept-based trading adds another layer of complexity to stock recommendation systems, as it necessitates an understanding of both sector-specific dynamics and broader macroeconomic themes driving investor sentiment.
However, current stock recommendation methods face several notable shortcomings in capturing these intricacies. First, they often fail to account for the complex, interdependent relationships between companies, such as competitive pressures or cooperative ventures within or across sectors [9]. Second, many traditional models rely too heavily on financial reports and historical performance metrics, which limits their ability to extract valuable insights from alternative data sources, such as company filings, news reports, or investor sentiment analysis [10,11]. These models typically overlook the added value that comes from integrating document-based data with historical price trends [12,13] to provide a more comprehensive view. Third, traditional approaches are constrained by their reliance on explicitly labeled data, which is often provided by financial experts or mutual fund managers [14]. This dependency can limit the scope of the model, as it fails to capitalize on the potential insights hidden within the vast amount of unlabeled data that the market generates.
To address these challenges, we propose a novel framework that leverages two core perspectives: 1) graph-based neural network [15,16,17], which are designed to capture the intricate interconnections and relationships between companies within the stock market, and 2) recurrent neural network [18,19,20], which helps to identify patterns and trends of historical price data over time. By employing self-supervised learning, our model autonomously uncovers hidden relationships and subtle patterns within these two streams without the need for human-generated labels. This enables a more flexible and adaptive recommendation system that is capable of learning from both structured and unstructured data sources.
Our dual-input strategy provides a comprehensive analysis by combining the structural insights obtained from stock graphs with the temporal signals derived from price movements. The integration of these two perspectives offers a more nuanced understanding of the market, capturing both the overt and subtle factors that influence stock prices. This approach not only enhances the accuracy of stock recommendations but also provides investors with deeper insights into the underlying factors driving market trends, enabling more informed and timely decision-making in the volatile and fast-evolving A-share market.
In summary, this paper offers several key contributions to the field of financial analytics. First, it introduces an innovative framework for generating stock recommendations that integrates graph-based structures with historical price trends, eliminating the need for labeled data. Second, our model improves the understanding of inter-company relationships within the stock market, offering a multidimensional view of the market that surpasses the limitations of traditional models. Finally, we provide empirical evidence demonstrating that our approach not only delivers robust and accurate stock recommendations but also adapts effectively to the inherent volatility of the Chinese stock market, empowering investors with tools to make more confident and data-driven investment decisions.
2. Related Work
This section provides a comprehensive review of the pertinent literature across three main areas: stock recommendation systems, the application of graph learning in financial markets, and the deployment of self-learning techniques in financial analytics.
2.1. Stock Recommendation Systems
Stock recommendation systems [21,22] are essential tools that help investors make well-informed decisions. Initially, these systems relied heavily on fundamental and technical analyses conducted by human experts [23]. However, recent methodologies have started integrating machine learning to handle vast datasets and unveil patterns not easily discernible by humans [24]. Particularly within China’s A-share market, known for its high volatility and susceptibility to rapid changes due to policy adjustments, these systems encounter distinctive challenges. Research by Gali et al. [25] discusses how shifts in policy can significantly influence stock recommendations, underscoring the necessity for models that can swiftly adapt to such changes.
2.2. Graph Neural Network Learning in Financial Markets
The adoption of graph learning to map out intricate relationships and interactions is on the rise across various fields, including the financial sector. A comprehensive survey by Wang et al. [26] highlights how graph-based models can uncover latent structures within financial data, providing deeper insights into market dynamics and interdependencies. Specifically, these models are adept at depicting stocks and their interconnections, thereby illustrating the mutual influences and dependencies that govern them [27]. This approach is exceptionally beneficial for navigating complex environments such as the A-share market, offering a refined perspective on market behaviors.
2.3. Self-Learning in Stock Recommendations
Self-supervised learning learning has emerged as a potent strategy for exploiting unlabeled data, thereby minimizing reliance on expensive labeled datasets [15,16,28]. This approach proves invaluable in fields where extracting features from large volumes of unstructured data is paramount [29]. In the context of financial markets, SL is instrumental in identifying latent features in market data that forecast future trends [30]. The application of SL in stock recommendations is relatively embryonic but holds considerable promise for enhancing the predictive capabilities of models by learning directly from the intrinsic structure of financial data without significant human oversight.
3. Problem Definition
Our system is designed to provide tailored stock recommendations by linking stocks with financial concepts derived from a diverse array of text-based resources, including news articles, tweets, and corporate financial reports. Consider the following sets: 1) D: a collection of documents; 2) C: a set of identified financial concepts; and 3) S: a set of stocks
We utilize advanced natural language processing, graph neural network and sequence modeling techniques to construct vector representations for each concept and for each stock . The cornerstone of our recommendation engine is the similarity function . This function assesses the relevance of each stock s to a given concept c, enabling the system to recommend stocks that most closely align with the user’s specified financial interests. As a result, the system dynamically ranks stocks based on their calculated similarity to the chosen concept. This ranking mechanism ensures that our recommendations adapt in real-time to both fluctuations in market conditions and updates in the content of the source documents.
4. Method
Our method first extracts graph-based representations [31] for stock recommendation by analyzing the relationships and interconnections between companies. Next, we derive temporal representations based on historical pricing data. Finally, we integrate these two representations and apply self-supervised learning to refine them, enabling accurate stock recommendations. The overall framework of our approach is illustrated in Figure 1.
4.1. Construction of Stock-Stock Graph
The Stock-Stock Graph [32] is a streamlined representation specifically designed to analyze relationships between different stocks.
In our graph, we use only one type of node: Stock Nodes: symbolize different stocks or financial entities discussed within the documents. Each stock node represents an individual stock, capturing its unique characteristics and market behavior.
The edges in our graph are defined solely to capture the relationships between stock nodes, which are determined as follows: Stock-Stock Edges: To uncover potential correlations and interactions between stocks, we calculate the Pointwise Mutual Information (PMI) scores based on their co-occurrence within the same documents. The PMI score [33] for a pair of stocks and is computed using the formula:
where is the probability of co-occurrence of stocks and , and and are the individual probabilities of occurrence of and , respectively. This metric helps in identifying stocks that frequently appear together, suggesting a potential linkage or dependency that could be of interest for market analysis and investment strategies.
By focusing on the construction of the Stock-Stock Graph, we can directly analyze the interconnectedness and dynamics between different stocks, making it a valuable tool for financial analysts and investors aiming to understand market trends and develop informed investment decisions. This targeted approach allows for a deeper exploration of stock interactions without the complexity of additional node types and edge relationships.
4.2. Initializing Stock Embeddings with FastText
To initialize high-quality embeddings for the stock nodes in our graph, we utilize FastText [34], a powerful word embedding [35] technique designed to capture both syntactic and semantic nuances of text. This approach ensures that our stock embeddings are contextually rich, providing a robust foundation for our analysis.
FastText Overview: FastText extends the Word2Vec model by representing words as bags of character n-grams, enabling it to generate better embeddings for rare words and capture subword information. This feature is particularly beneficial in our domain, where financial terminology frequently includes specific jargon and technical terms.
Stock Embeddings Process: For each stock node, we derive embeddings from textual data such as news articles, financial reports, and analyst comments related to the stock. Let S be the set of all stocks, and let be the set of words associated with stock . The embedding for stock s is calculated as:
where represents the FastText embedding of word w.
Training FastText: The FastText model is trained on a comprehensive corpus comprising texts related to various stocks. We employ the skip-gram model with negative sampling, aiming to maximize the log-likelihood:
where denotes a word-context pair in the corpus D, and are the embeddings for the word and context, respectively, is the sigmoid function, and represents the set of negative samples for word w.
By focusing solely on generating initial stock embeddings with FastText, we ensure that our analysis is grounded in detailed and context-aware vector representations of each stock, forming a crucial element of our financial modeling framework.
4.3. Generating Graph Embeddings with Graph Attention Networks
To enhance the representation of stocks in a relational context, we employ Graph Attention Networks (GAT) [28], which effectively aggregate features from neighborhood nodes through attention mechanisms. This step is pivotal for capturing the dynamic relationships among stocks, thus enriching the initial FastText embeddings with relational insights from the stock market graph.
GAT Overview: GAT introduces an attention-based architecture that assigns different importances to nodes in a neighborhood, allowing for a more flexible and powerful aggregation of features. This is particularly advantageous for stock market analysis, where the influence of one stock on another can vary significantly.
Feature Transformation Process: Let denote the graph with nodes representing stocks and edges depicting the relationships between them (e.g., co-movement, sector similarity). Each node is initially embedded using FastText as . The updated embedding after applying GAT is computed as follows:
where includes the neighbors of stock s, are the attention coefficients determining the importance of node i’s features to node s in the k-th attention head, is a learnable linear transformation applied to the neighbors’ features, is a non-linear activation function, and ⨁ denotes concatenation of the outputs from multiple attention heads. The attention [36] coefficients are computed as:
where is a learnable weight vector, and ∥ denotes concatenation. This formulation allows the network to focus more on important neighbors, adapting to the context-specific relationships inherent in the financial domain.
By integrating GAT into our model, we obtain graph embeddings , enabling them to reflect not only the intrinsic properties of stocks but also their contextual relationships. This dual approach—leveraging both textual data and graph structures—provides a comprehensive framework for stock analysis, enhancing the predictive power of our financial modeling tools.
4.4. Generating Temporal Embeddings with Gated Recurrent Units
To capture the temporal dynamics inherent in stock market data, we utilize Gated Recurrent Units (GRU) [37], designed to process sequential data by efficiently managing information flow over time. This approach enables us to transform sequences of technical indicators into meaningful, time-sensitive embeddings for each stock.
GRU Overview: GRU is a type of recurrent neural network that uses gating mechanisms to control the flow of information. These gates—update and reset—help the model to decide how much of the past information needs to be passed along to the future, making GRUs particularly adept at handling issues like vanishing gradients and dependencies of varying time lengths.
Technical Features: For each stock s, we consider a sequence of technical indicators over time, denoted by , where T is the number of time steps and represents the vector of technical features at time t. These features include:
- Open price (): The price at which a stock first trades upon the opening of an exchange on a given trading day.
- Close price (): The last price at which a stock trades during a regular trading session.
- High price (): The highest price at which a stock traded during the course of the trading day.
- Low price (): The lowest price at which a stock traded during the course of the trading day.
- Additional derived technical indicators, such as moving averages, relative strength index (RSI), and volume-weighted average price (VWAP), which provide further insights into price trends and momentum.
Embedding Generation with GRU: The GRU network processes the sequence , updating its hidden state at each time step as follows:
where is the hidden state from the previous time step, and is the input at the current time step. The final embedding for stock s is obtained by taking the hidden state at the last time step T:
This process ensures that each stock’s embedding captures not only the static characteristics inferred from its price movement but also the dynamic changes over time, reflecting short-term fluctuations and long-term trends. By leveraging GRU for embedding generation, our model effectively incorporates historical price movements and technical indicators, offering a deeper understanding of each stock’s behavior.
4.5. Integrating Graph and Temporal Embeddings for Comprehensive Stock Representation
To form a comprehensive embedding for each stock, we integrate the graph-based embeddings from the Graph Attention Network and the temporal embeddings from the Gated Recurrent Units. This simple yet effective concatenation approach captures both the spatial relationships and temporal dynamics of stock behavior.
Combination Strategy: We concatenate the graph-based and temporal embeddings to leverage the contextual information from the stock’s relational environment and its historical performance patterns. This method ensures a straightforward fusion of information without introducing additional complexity into the embedding space.
We fuse graph embeddings with temporal embeddings by:
where ⊕ denotes the concatenation operation. This results in an integrated embedding that retains all significant features from both the graph and temporal representations.
4.6. Self-Learning Strategy for Stock and Concept Embeddings
To effectively train the integrated stock embeddings alongside the concept embeddings obtained from FastText, we implement a training regime that employs two self-learning loss functions. These functions are designed to reconstruct the Pointwise Mutual Information (PMI) between concepts and stocks, and to model the relationships between stocks as represented in the stock graph.
Concept and Stock Embeddings: Concept embeddings, , are derived from FastText, capturing the semantic nuances of financial concepts. The stock embeddings, , combine graph-based and temporal data to provide a comprehensive representation of each stock.
PMI Reconstruction Loss: This loss function reconstructs the PMI between concepts and stocks, quantifying the association strength based on their co-occurrence probabilities:
where includes concept-stock pairs, and denotes the sigmoid function, mapping the dot product of concept and stock embeddings to a probability-like score that models their likelihood of meaningful association.
Stock-Stock Edge Reconstruction Loss: The second loss function aims to maintain the integrity of the relationships between stocks as defined in the stock graph. This loss helps in preserving the structural connections which are critical for analyzing market behaviors:
where represents the set of edges between stocks in the graph. This loss function penalizes the model when stock embeddings do not reflect their actual market relationships, ensuring that the learned embeddings represent true market connections effectively.
Combined Training Objective: The total loss is computed as a weighted sum of both losses, allowing the model to optimize for a balanced embedding space that considers both conceptual relevance and market dynamics:
where and are hyperparameters that control the influence of each loss function. Adjusting these parameters provides flexibility in focusing on either aspect depending on specific financial modeling objectives.
This dual-loss training strategy ensures that the embeddings not only reflect individual stock and concept characteristics but also the complex interdependencies and structural relationships within the financial market. Such a comprehensive approach enhances the predictive power and analytical depth of financial models, facilitating more informed decision-making in market analysis and investment strategies.
5. Experiments
To rigorously evaluate our proposed graph-based recommendation system, we have conducted extensive experiments using meticulously curated datasets derived from authoritative sources in the Chinese financial sector. Here, we detail the datasets employed and the structure of our experimental framework.
5.1. Stock Candidate Data
Our stock candidate pool comprises a comprehensive dataset of individual stocks extracted directly from the official websites of the Shanghai Stock Exchange and the Shenzhen Stock Exchange. This dataset includes a total of 3,326 individual stocks, each featuring detailed trading information and historical performance metrics. The richness of this dataset provides a robust basis for assessing the efficacy of our recommendation system across a diverse array of stock profiles.
5.2. Finance Documents Data
The finance document data serves as a foundational element in constructing our recommendation model’s knowledge graph. We have collected a vast corpus of 452,569 financial news articles spanning from 2018 to 2023, sourced from the reputable Jinrongjie financial news website. This dataset includes diverse financial documents, such as analyst reports, news articles, and earnings summaries, which are crucial for extracting nuanced financial sentiments and trends that influence stock movements.
5.3. Technical Pricing Data
To obtain the technical pricing features for each stock from 2018 to 2023, we use Yahoo Finance, a reliable platform for accessing stock market data. 1 By navigating to the historical data section, we can download key trading metrics such as open price, close price, high price, and low price for each stock over this period. Additionally, Yahoo Finance offers tools to calculate important technical indicators like moving averages, relative strength index (RSI), and volume-weighted average price (VWAP). This data provides a comprehensive view of stock trends and momentum, which is crucial for our recommendation system.
5.4. Concept Recommendation Data
Our concept recommendation datasets are derived from two prominent Chinese financial websites, Jinrongjie and Tonghuashun. These sites are noted for their expertly curated lists of concept stocks, compiled by experienced financial analysts. These datasets are pivotal for our study as they encapsulate the collective wisdom of financial experts, reflecting nuanced market insights. Samples are shown in Table 1.
The Jinrongjie dataset includes 356 unique investment concepts, with each concept comprising an average of 23 stocks. These stocks are manually selected based on their relevance to the specific investment theme, providing a targeted framework for our recommendation model.
In contrast, the Tonghuashun dataset is broader, containing 1023 distinct investment concepts with an average of 16.2 stocks per concept. This dataset offers a more extensive exploration of market trends and stock correlations, enriching our model’s predictive capacity.
5.5. Data Splitting
We partition the concept recommendation dataset into training, development, and testing subsets with a distribution ratio of 70%, 10%, and 20%, respectively. This structured partitioning ensures that our model is exposed to comprehensive training scenarios, refined through the development phase, and rigorously evaluated on unseen data. This approach facilitates robust training and provides a reliable measure of the model’s performance and its generalization capability across diverse market conditions.
Through these experiments, we aim to demonstrate the effectiveness of our graph-based approach in harnessing complex relationships and dynamics within the financial market, significantly enhancing the accuracy of stock recommendations.
5.6. Baselines and Parameter Settings
To rigorously evaluate the efficacy of our proposed recommendation system, we compare it against several established baselines that represent a spectrum of techniques from simple retrieval to advanced concept expansion strategies. The following are the baseline models against which our method was benchmarked:
- BM25 [38]: As a naive information retrieval baseline, this model leverages the BM25 scoring metric to rank stocks. For each stock s and concept c, it queries an inverted index to retrieve the top-k ranked documents based on their relevance to the stock-concept pair. Stocks are then ranked by averaging the BM25 scores from these top documents, providing a straightforward, non-contextual baseline for comparison.
- Rank [39]: This baseline improves upon simple retrieval by incorporating a two-step process. Initially, for each concept c, the model retrieves the top-5 documents from the finance documents data. Subsequently, it integrates these documents with the concept to rank stocks across the two major exchanges, providing a basic framework for assessing stock relevance based on recent financial literature.
- Word2Vec [40]: Utilizes the Word2Vec embedding model to directly rank stocks by measuring the naive semantic relatedness between concepts and stocks. This method assesses how closely the embedded representations of stocks and concepts align, offering a simple yet effective measure of semantic similarity.
- Word2Vec+: This model extends the basic Word2Vec approach by including the eight most semantically similar words to the original concept in the analysis. This expansion aims to capture broader semantic fields and nuanced meanings associated with each concept, potentially enhancing the model’s ability to discern relevant stocks.
- Word2Vec++: Further develops the Word2Vec+ method by incorporating additional words that exhibit a similarity score higher than 0.65. On average, this method considers 6.3 concepts for expansion. This extensive expansion is designed to thoroughly explore the semantic space around each concept, thereby improving the precision of stock recommendations.
- MineEvidence [7]: Previously established as the state-of-the-art, this model employs reinforcement learning techniques to dynamically expand the concept representation before ranking stocks. By iteratively refining the concept expansion based on reinforcement feedback, MineEvidence aims to optimize the selection of stocks that best match the refined concepts, offering a sophisticated comparison point for our proposed method.
These baseline models provide a comprehensive set of comparisons that range from basic to advanced methodologies, enabling us to thoroughly evaluate the performance improvements offered by our approach. Through these comparisons, we aim to demonstrate the superior capability of our model in leveraging complex, dynamic relationships within the financial domain to deliver more accurate and relevant stock recommendations.
5.7. Training Parameters
Our model, sets the window size to 5 in training FastText, the embedding size to 300, and the vocabulary size to 100,000. The mini-batch size is 50. We set the learning rate for Adam to 0.01 and apply gradient clipping to prevent gradient explosion and vanishing during training.
5.8. Metrics
We evaluated the algorithms using four key performance metrics to assess the effectiveness and precision of our recommendation system across different aspects:
First, we use the Mean Average Precision (MAP), which provides a single-figure measure of quality across recall levels. It involves averaging the precision obtained after each relevant document is retrieved, and then computing the mean of these average precisions across all queries. This metric is crucial for understanding the average effectiveness of our algorithm at retrieving relevant items across all possible recall levels.
Second, we report Precision at K (P@K), specifically precision at 5 and 10 (P@5, P@10). This metric evaluates the proportion of recommended items in the top-k set that are relevant. P@5 and P@10 are important as they help us understand the accuracy of the algorithm in its topmost recommendations, which is essential for ensuring user satisfaction in practical applications where only the top few recommendations are typically considered.
Third, we use Recall at 30 (R@30) to measure the proportion of relevant items that are retrieved in the top 30 recommendations. This metric assesses the capability of the algorithm to retrieve a larger set of relevant items, which is important for scenarios where offering a wider array of potential interests is necessary.
These metrics collectively provide a thorough evaluation of both the precision and the recall capabilities of our algorithms, offering a balanced view of their performance in practical scenarios. This suite of metrics is integral to our continuous optimization processes for enhancing recommendation effectiveness.
5.9. Recommendation Accuracy
To effectively assess our new recommendation system’s performance, we juxtapose it with a range of established baselines, from simple information retrieval methods like BM25 to more sophisticated models incorporating concept expansion and semantic analysis. This comprehensive comparative analysis highlights our approach’s nuanced improvements and overall efficacy across various evaluation metrics. The results are shown in Table .
The main results from Table 2 demonstrate that our proposed method significantly outperforms existing baselines in the domain of concept stock recommendation. The baseline models, ranging from simple information retrieval methods like BM25 to more advanced models such as MineEvidence, provide a broad spectrum of comparison points that allow us to evaluate the effectiveness of our approach comprehensively.
For the Jinrongjie Concepts dataset, our method achieves a P@5 of 0.601, outperforming the best-performing baseline, MineEvidence, which achieves a P@5 of 0.524. Similarly, our method shows superior results across other metrics, with a P@10 of 0.472, R@30 of 0.478, and MAP of 0.435, compared to MineEvidence’s 0.427, 0.428, and 0.398, respectively. The consistent improvements across all evaluation metrics indicate the robustness of our model in delivering more accurate and relevant stock recommendations.
In the Tonghuashun Concepts dataset, our method also leads with a P@5 of 0.562, significantly higher than the MineEvidence’s P@5 of 0.507. The gains in P@10, R@30, and MAP further reinforce the superiority of our approach, with values of 0.441, 0.452, and 0.430, compared to MineEvidence’s 0.402, 0.422, and 0.378, respectively.
Overall, these results clearly illustrate that our method leverages the complex, dynamic relationships within the financial domain more effectively than existing baselines, offering a more precise and accurate recommendation system for concept stocks. This superiority is evident across multiple datasets and performance metrics, underscoring the value of our model’s innovative approach.
5.10. Ablation
This section presents an ablation study to evaluate the impact of key components in our multi-relation graph self-learning model designed for concept stock recommendation. The results, detailed in Table 3, are derived from experiments conducted on two distinct datasets: Jinrongjie Concepts and Tonghuashun Concepts. The ablations considered include: 1) removing graph embeddings, 2) removing temporal embeddings, 3) omitting the RSI feature from the temporal module, 4) omitting the VWAP feature from the temporal module, and 5) replacing the graph attention mechanism by assigning equal weights to all neighbors (effectively canceling attention).
Analyzing the results across both datasets, it is evident that each component contributes significantly to the model’s overall performance. Removing graph embeddings results in the most noticeable decline in performance across both datasets, particularly in Precision at 5 (P@5) and Mean Average Precision (MAP), highlighting the importance of graph-based features in capturing the complex relationships between stocks. Similarly, eliminating the temporal embeddings slightly reduces performance, though less dramatically, suggesting that temporal dynamics are also crucial but perhaps less so than the graph structure.
The ablations that remove the RSI and VWAP features lead to marginal decreases in performance, with slightly greater impacts observed in the Jinrongjie dataset, which may indicate that these features are more informative for that particular dataset. Notably, disabling the attention mechanism shows mixed effects: while it causes a decrease in MAP for the Tonghuashun dataset, it surprisingly improves Precision at 10 (P@10) and Recall at 30 (R@30) in the Jinrongjie dataset, suggesting that the benefit of attention may vary depending on the specific characteristics of the dataset.
Overall, our full model, which includes all components, consistently achieves the best performance across both datasets, underscoring the effectiveness of integrating graph embeddings, temporal features, and attention mechanisms in our approach.
5.11. Case Study
To gain deeper insights into the effectiveness of our method, we analyze the top-5 selected recommended stocks as shown in Table 4.
The recommended stocks in Table 4 illustrate the strength of our method in identifying key stocks within the "New Energy Vehicles" and "Intelligent Logistics" sectors. For example, within the "New Energy Vehicles" category, our method highlights companies like Founder Motor and Jiangling Motors, which are significant due to their strong presence in the industry and continuous innovation. The consistency observed in the selections, such as the recurrent appearance of Tianjin Motor Dies Company, further validates the robustness of our approach. Similarly, in the "Intelligent Logistics" sector, our method identifies YTO Express and Fiyta, both of which play crucial roles in logistics and supply chain management. The comparison with the MineEvidence baseline reveals that our method is more adept at uncovering less obvious yet strategically important companies, as seen in our selection of companies like Meiling and China Railway Tielong. These findings underscore the potential of our approach to not only align with established market leaders but also to discover emerging opportunities that might be overlooked by other methods.
5.12. Visualization of Embedding
Shown in Figure 2, our method demonstrates a high level of precision in calculating the relationships between different stocks by leveraging advanced attention mechanisms that capture subtle dependencies within the data. For example, our approach accurately identifies the strong relationship between Ping An Insurance and Jiangsu Hengrui Medicine, as highlighted by the significant attention value between these two stocks in the attention map. This precision allows us to detect and quantify the influence that one stock may have on another, ensuring that even nuanced interactions, such as the correlation between Ping An and Jiangsu Hengrui Medicine, are thoroughly captured and represented. This capability not only enhances the interpretability of our results but also provides a solid foundation for more informed and effective financial analysis and investment strategies.
5.13. Influence of Training Data
As shown in Figure 3, the Precision@5 scores for both the Jinrongjie and Tonghuashun datasets increase as the proportion of training data rises. This demonstrates that the performance of both models improves with more extensive training data.
For the Jinrongjie dataset, the Precision@5 score shows a steady increase from 0.436 at 20% training data to 0.591 at 100% training data. This trend indicates that the model benefits significantly from additional data, leading to better precision and retrieval effectiveness.
Similarly, the Tonghuashun dataset exhibits a consistent upward trend in precision score, starting at 0.410 with 20% training data and reaching 0.551 at 100% training data. Although the improvement is slightly less pronounced compared to Jinrongjie, it still underscores the positive impact of increased training data on model performance.
These observations reveal the benefits of using more data in our method.
5.14. Training Efficiency
Figure 4 illustrates the training time for our method on the Jinrongjie and Tonghuashun datasets as the proportion of training data increases. The training time for the Jinrongjie dataset scales linearly, starting at approximately 1 hour for 20% of the data and reaching around 2 hours for 100% of the data. This suggests that the Jinrongjie dataset is computationally efficient and exhibits predictable scalability. On the other hand, the Tonghuashun dataset shows a more significant increase in training time, from about 2 hours at 20% of the data to over 7 hours at 100%. This steeper curve indicates that the Tonghuashun dataset likely involves greater model complexity or computational demands. The contrasting trends between the two datasets highlight that while Jinrongjie offers better scalability, Tonghuashun may require advanced optimization strategies to mitigate its higher computational costs. These insights are vital for effective resource allocation and model deployment in real-world scenarios.
6. Conclusions and Future Work
In this study, we have introduced a novel approach to stock recommendation for the Chinese A-share market, combining graph-based structures with historical price data to develop self-learned stock embeddings. By leveraging self-supervised learning, our method effectively captures the intricate inter-company relationships and temporal patterns that are often overlooked by traditional models. This approach not only eliminates the reliance on human-generated labels but also enhances the accuracy of stock predictions by integrating both structural and temporal insights.
Our empirical results demonstrate that this method is robust and adaptable, effectively navigating the complexities and volatility of the Chinese stock market. The findings suggest that incorporating graph structures and unlabeled data can significantly improve stock recommendation systems, offering investors a more comprehensive tool for making informed decisions. As the Chinese stock market continues to evolve, our approach provides a solid foundation for future advancements in financial analytics and stock recommendation technologies.
The future work includes extending this work to the U.S. stock market further exploration and refinement. The U.S. market, characterized by a broader array of sectors, higher liquidity, and more diversified trading dynamics, shares some similarities with the Chinese A-share market but also presents unique challenges. By applying our graph-based and temporal data integration approach to U.S. stocks, we could capture the inter-company relationships and sectoral dynamics that are especially prominent in industries such as technology, healthcare, and energy. Furthermore, the wealth of publicly available data, including financial filings, news reports, and market sentiment, could provide additional layers of insights when incorporated into the self-supervised learning framework. Adapting the model to account for these factors could potentially enhance the precision of stock recommendations in the highly competitive and volatile U.S. market, demonstrating its versatility and broader applicability across different financial environments.
Author Contributions
Conceptualization, H.C. and Y.Y.; methodology, H.C.; software, H.C.; validation, T.W., J.K. and A.S.; formal analysis, H.C.; investigation, H.C.; resources, H.C.; data curation, H.C.; writing—original draft preparation, H.C.; writing—review and editing, H.C.; visualization, H.C.; supervision, A.S.; project administration, J.K.; funding acquisition, T.W. All authors have read and agreed to the published version of the manuscript.
Funding
This research received no external funding.
Institutional Review Board Statement
Not applicable.
Informed Consent Statement
Not applicable.
Data Availability Statement
Data are contained within the article.
Conflicts of Interest
The authors declare no conflicts of interest.
References
- Leippold, M.; Wang, Q.; Zhou, W. Machine learning in the Chinese stock market. Journal of Financial Economics 2022, 145, 64–82. [Google Scholar] [CrossRef]
- Chong, T.T.L.; Lam, T.H.; Yan, I.K.M. Is the Chinese stock market really inefficient? China Economic Review 2012, 23, 122–137. [Google Scholar] [CrossRef]
- Carpenter, J.N.; Lu, F.; Whitelaw, R.F. The real value of China’s stock market. Journal of Financial Economics 2021, 139, 679–696. [Google Scholar] [CrossRef]
- Seddighi*, H.; Nian, W. The Chinese stock exchange market: operations and efficiency. Applied Financial Economics 2004, 14, 785–797. [Google Scholar] [CrossRef]
- Stoll, H.R.; Whaley, R.E. Stock market structure and volatility. The Review of Financial Studies 1990, 3, 37–71. [Google Scholar] [CrossRef]
- Dizon, A.E.; Lockyer, C.; Perrin, W.F.; Demaster, D.P.; Sisson, J. Rethinking the stock concept: a phylogeographic approach. Conservation Biology 1992, 24–36. [Google Scholar] [CrossRef]
- Liu, Q.; Zhang, Y. Mining evidences for concept stock recommendation. Proceedings of the 2018 Conference of the North American Chapter of the Association for Computational Linguistics: Human Language Technologies, Volume 1 (Long Papers), 2018, pp. 2103–2112.
- Waldman, J.R. Definition of stocks: an evolving concept. In Stock identification methods; Elsevier, 2005; pp. 7–16.
- Li, Q.; Yang, J.; Hsiao, C.; Chang, Y.J. The relationship between stock returns and volatility in international stock markets. Journal of Empirical Finance 2005, 12, 650–665. [Google Scholar] [CrossRef]
- Matsunaga, S.R. The effects of financial reporting costs on the use of employee stock options. Accounting Review, 1995; 1–26. [Google Scholar]
- Pervan, I. Voluntary financial reporting on the internet: analysis of the practice of stock-market listed croatian and slovene joint stock companies. Financial theory and practice 2006, 30, 1–27. [Google Scholar]
- Fama, E.F. Session topic: stock market price behavior. The Journal of Finance 1970, 25, 383–417. [Google Scholar] [CrossRef]
- Tang, J.; Chen, X. Stock market prediction based on historic prices and news titles. Proceedings of the 2018 international conference on machine learning technologies, 2018, pp. 29–34.
- Fang, Y.; Wang, H. Fund manager characteristics and performance. Investment Analysts Journal 2015, 44, 102–116. [Google Scholar] [CrossRef]
- Wu, Z.; Pan, S.; Chen, F.; Long, G.; Zhang, C.; Philip, S.Y. A comprehensive survey on graph neural networks. IEEE transactions on neural networks and learning systems 2020, 32, 4–24. [Google Scholar] [CrossRef]
- Zhou, J.; Cui, G.; Hu, S.; Zhang, Z.; Yang, C.; Liu, Z.; Wang, L.; Li, C.; Sun, M. Graph neural networks: A review of methods and applications. AI open 2020, 1, 57–81. [Google Scholar] [CrossRef]
- Scarselli, F.; Gori, M.; Tsoi, A.C.; Hagenbuchner, M.; Monfardini, G. The graph neural network model. IEEE transactions on neural networks 2008, 20, 61–80. [Google Scholar] [CrossRef] [PubMed]
- Grossberg, S. Recurrent neural networks. Scholarpedia 2013, 8, 1888. [Google Scholar] [CrossRef]
- Salehinejad, H.; Sankar, S.; Barfett, J.; Colak, E.; Valaee, S. Recent advances in recurrent neural networks. arXiv preprint arXiv:1801.01078, arXiv:1801.01078 2017.
- Medsker, L.; Jain, L.C. Recurrent neural networks: design and applications; CRC press, 1999.
- Geva, T.; Zahavi, J. Empirical evaluation of an automated intraday stock recommendation system incorporating both market data and textual news. Decision support systems 2014, 57, 212–223. [Google Scholar] [CrossRef]
- Hernández-Nieves, E.; Bartolomé del Canto, Á.; Chamoso-Santos, P.; de la Prieta-Pintado, F.; Corchado-Rodríguez, J.M. A machine learning platform for stock investment recommendation systems. Distributed Computing and Artificial Intelligence, 17th International Conference. Springer, 2021, pp. 303–313.
- Barber, B.M.; Lehavy, R.; Trueman, B. Comparing the stock recommendation performance of investment banks and independent research firms. Journal of financial economics 2007, 85, 490–517. [Google Scholar] [CrossRef]
- Patel, J.; Shah, S.; Thakkar, P.; Kotecha, K. Predicting stock and stock price index movement using trend deterministic data preparation and machine learning techniques. Expert systems with applications 2015, 42, 259–268. [Google Scholar] [CrossRef]
- Galí, J.; Gambetti, L. The effects of monetary policy on stock market bubbles: Some evidence. American Economic Journal: Macroeconomics 2015, 7, 233–257. [Google Scholar] [CrossRef]
- Wang, J.; Zhang, S.; Xiao, Y.; Song, R. A review on graph neural network methods in financial applications. arXiv preprint arXiv:2111.15367, arXiv:2111.15367 2021.
- Chen, W.; Jiang, M.; Zhang, W.G.; Chen, Z. A novel graph convolutional feature based convolutional neural network for stock trend prediction. Information Sciences 2021, 556, 67–94. [Google Scholar] [CrossRef]
- Veličković, P.; Cucurull, G.; Casanova, A.; Romero, A.; Lio, P.; Bengio, Y. Graph attention networks. arXiv preprint arXiv:1710.10903, arXiv:1710.10903 2017.
- Raina, R.; Battle, A.; Lee, H.; Packer, B.; Ng, A.Y. Self-taught learning: transfer learning from unlabeled data. Proceedings of the 24th international conference on Machine learning, 2007, pp. 759–766.
- Ying, Z.; Cheng, D.; Chen, C.; Li, X.; Zhu, P.; Luo, Y.; Liang, Y. Predicting stock market trends with self-supervised learning. Neurocomputing 2024, 568, 127033. [Google Scholar] [CrossRef]
- Chen, F.; Wang, Y.C.; Wang, B.; Kuo, C.C.J. Graph representation learning: a survey. APSIPA Transactions on Signal and Information Processing 2020, 9, e15. [Google Scholar] [CrossRef]
- Saha, S.; Gao, J.; Gerlach, R. A survey of the application of graph-based approaches in stock market analysis and prediction. International Journal of Data Science and Analytics 2022, 14, 1–15. [Google Scholar] [CrossRef]
- Xian, R.; Wang, X.; Kothandaraman, D.; Manocha, D. Pmi sampler: Patch similarity guided frame selection for aerial action recognition. Proceedings of the IEEE/CVF Winter Conference on Applications of Computer Vision, 2024, pp. 6982–6991.
- Bojanowski, P.; Grave, E.; Joulin, A.; Mikolov, T. Enriching word vectors with subword information. Transactions of the association for computational linguistics 2017, 5, 135–146. [Google Scholar] [CrossRef]
- Wang, B.; Wang, A.; Chen, F.; Wang, Y.; Kuo, C.C.J. Evaluating word embedding models: Methods and experimental results. APSIPA transactions on signal and information processing 2019, 8, e19. [Google Scholar] [CrossRef]
- Vaswani, A.; Shazeer, N.; Parmar, N.; Uszkoreit, J.; Jones, L.; Gomez, A.N.; Kaiser. ; Polosukhin, I. Attention is all you need. Advances in neural information processing systems 2017, 30. [Google Scholar]
- Chung, J.; Gulcehre, C.; Cho, K.; Bengio, Y. Empirical evaluation of gated recurrent neural networks on sequence modeling. arXiv preprint arXiv:1412.3555, arXiv:1412.3555 2014.
- Robertson, S.; Zaragoza, H.; others. The probabilistic relevance framework: BM25 and beyond. Foundations and Trends® in Information Retrieval 2009, 3, 333–389. [Google Scholar] [CrossRef]
- Singhal, A.; others. Modern information retrieval: A brief overview. IEEE Data Eng. Bull. 2001, 24, 35–43. [Google Scholar]
- Mikolov, T. Efficient estimation of word representations in vector space. arXiv preprint arXiv:1301.3781, arXiv:1301.3781 2013.
| 1 |
Figure 1.
Our framework models the stock graph and pricing information jointly and use self-supervised learning to label stock embedding without labels.
Figure 1.
Our framework models the stock graph and pricing information jointly and use self-supervised learning to label stock embedding without labels.
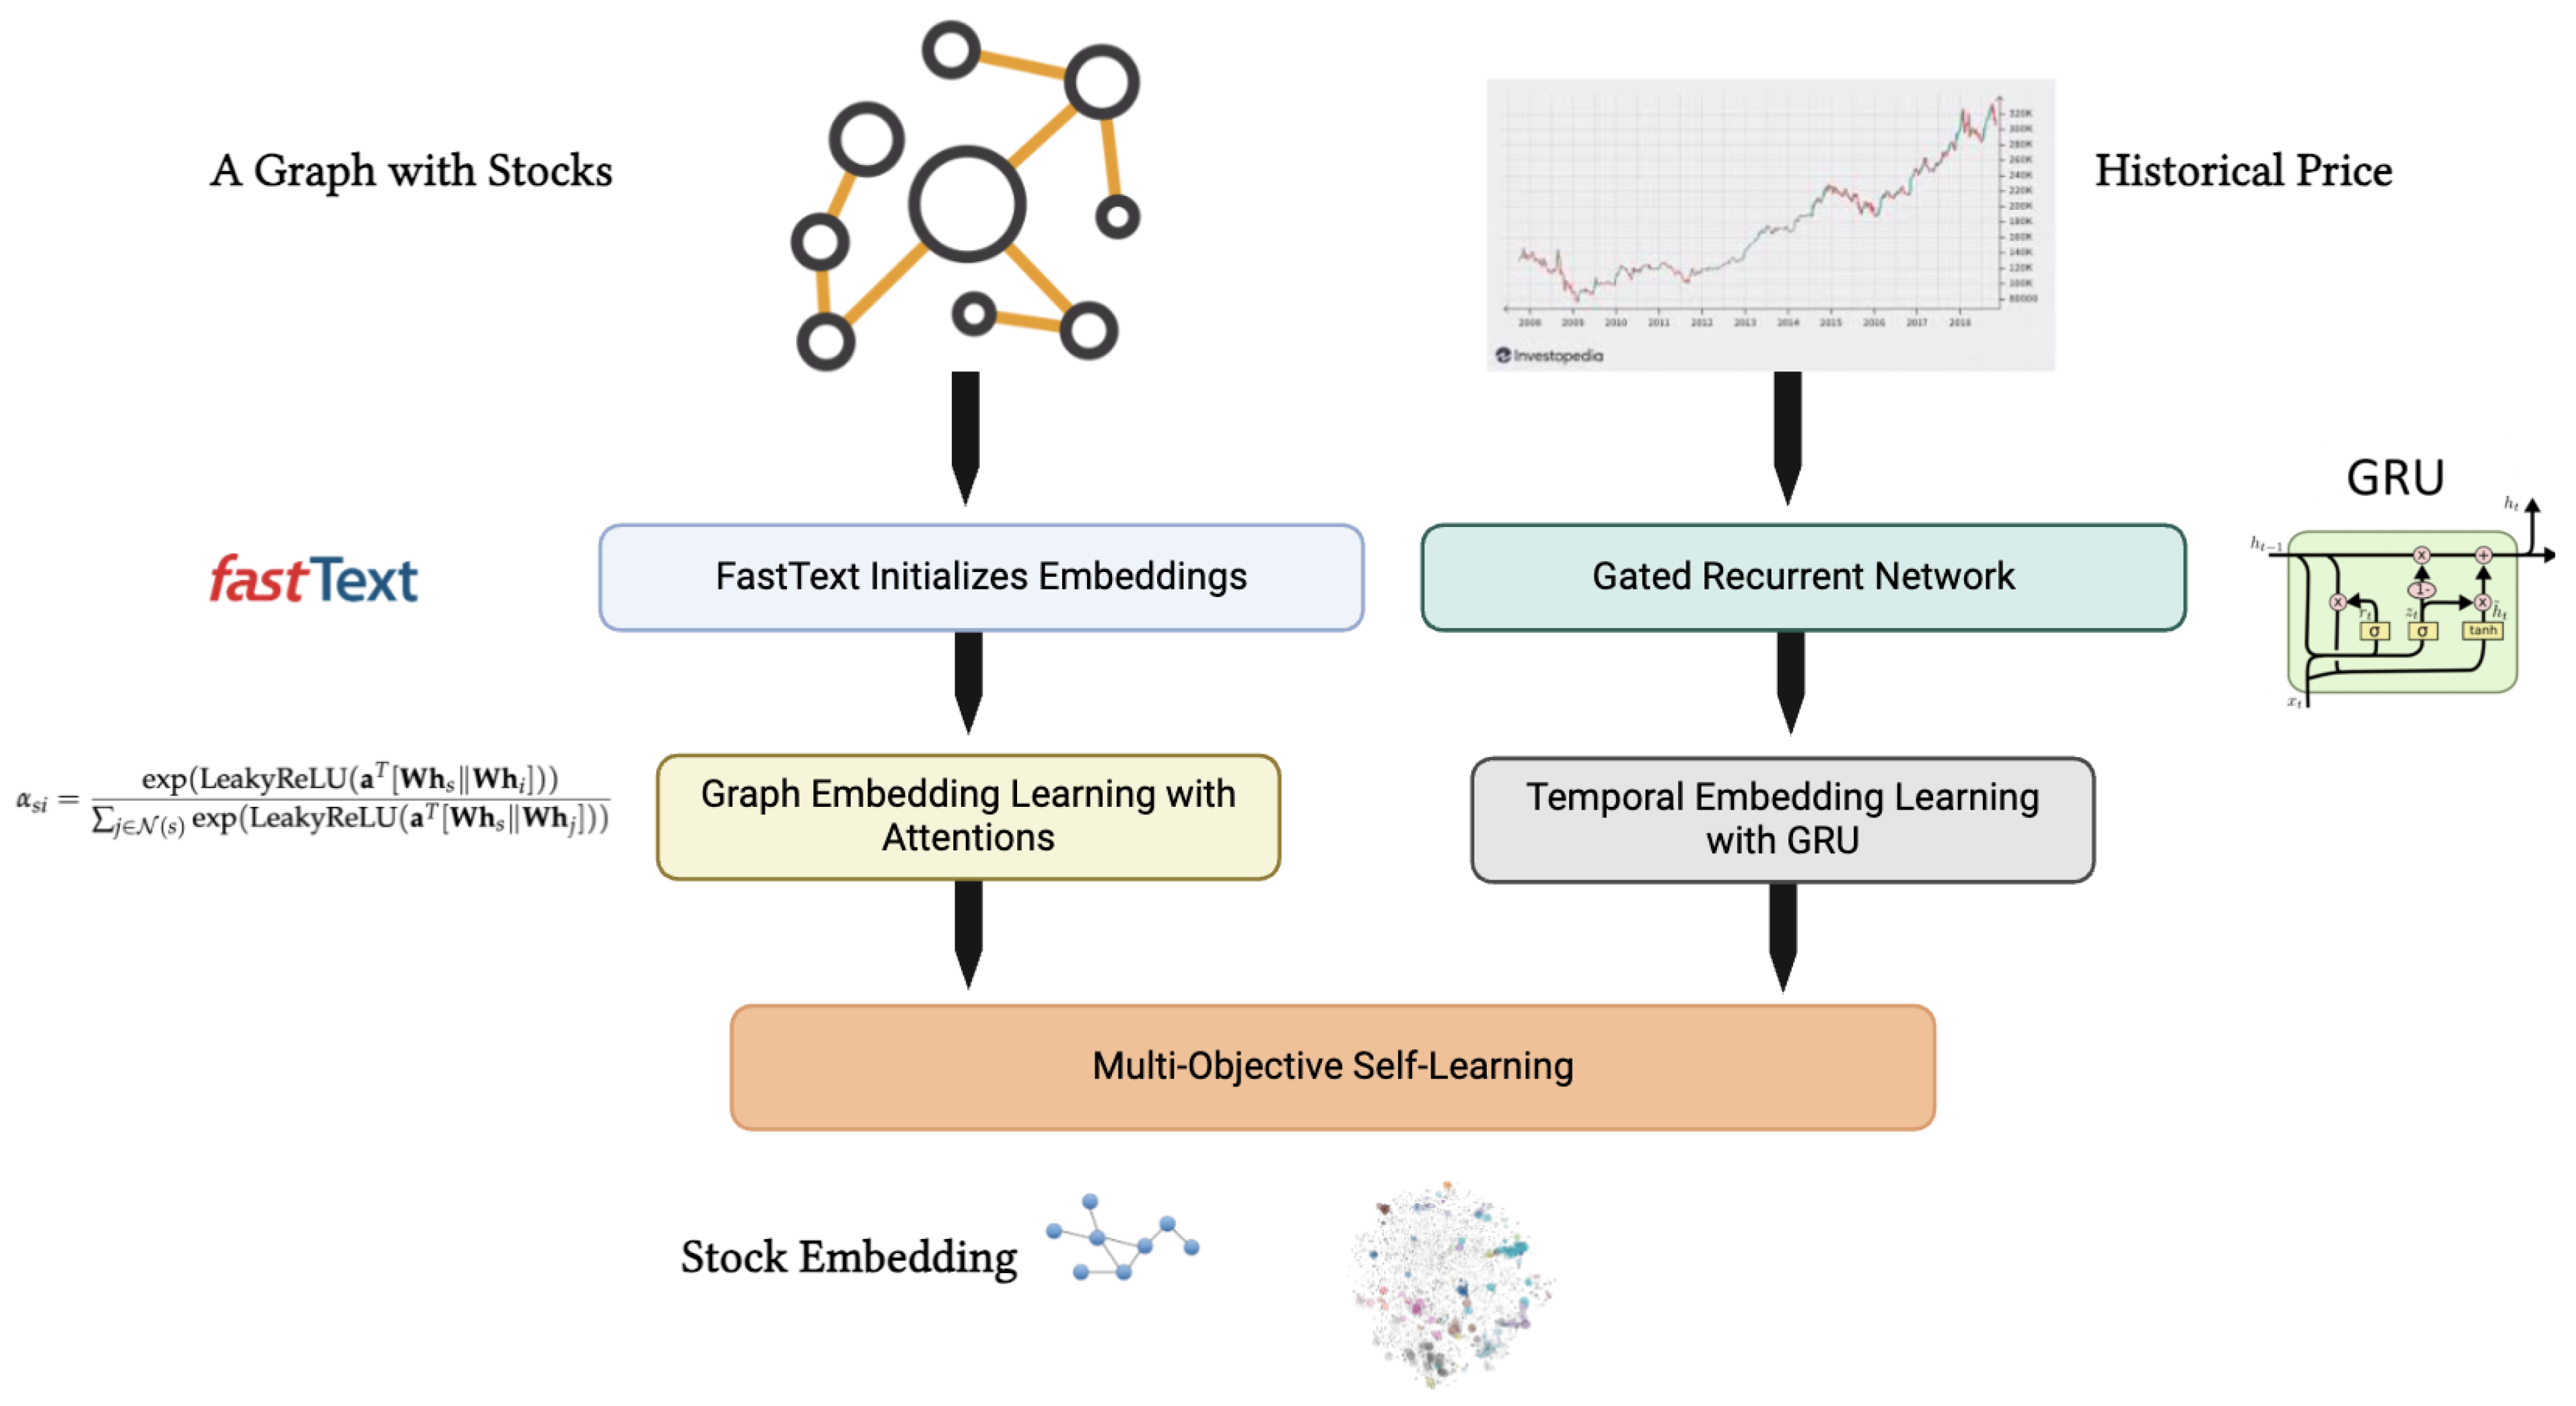
Figure 2.
Attention Map between Stocks
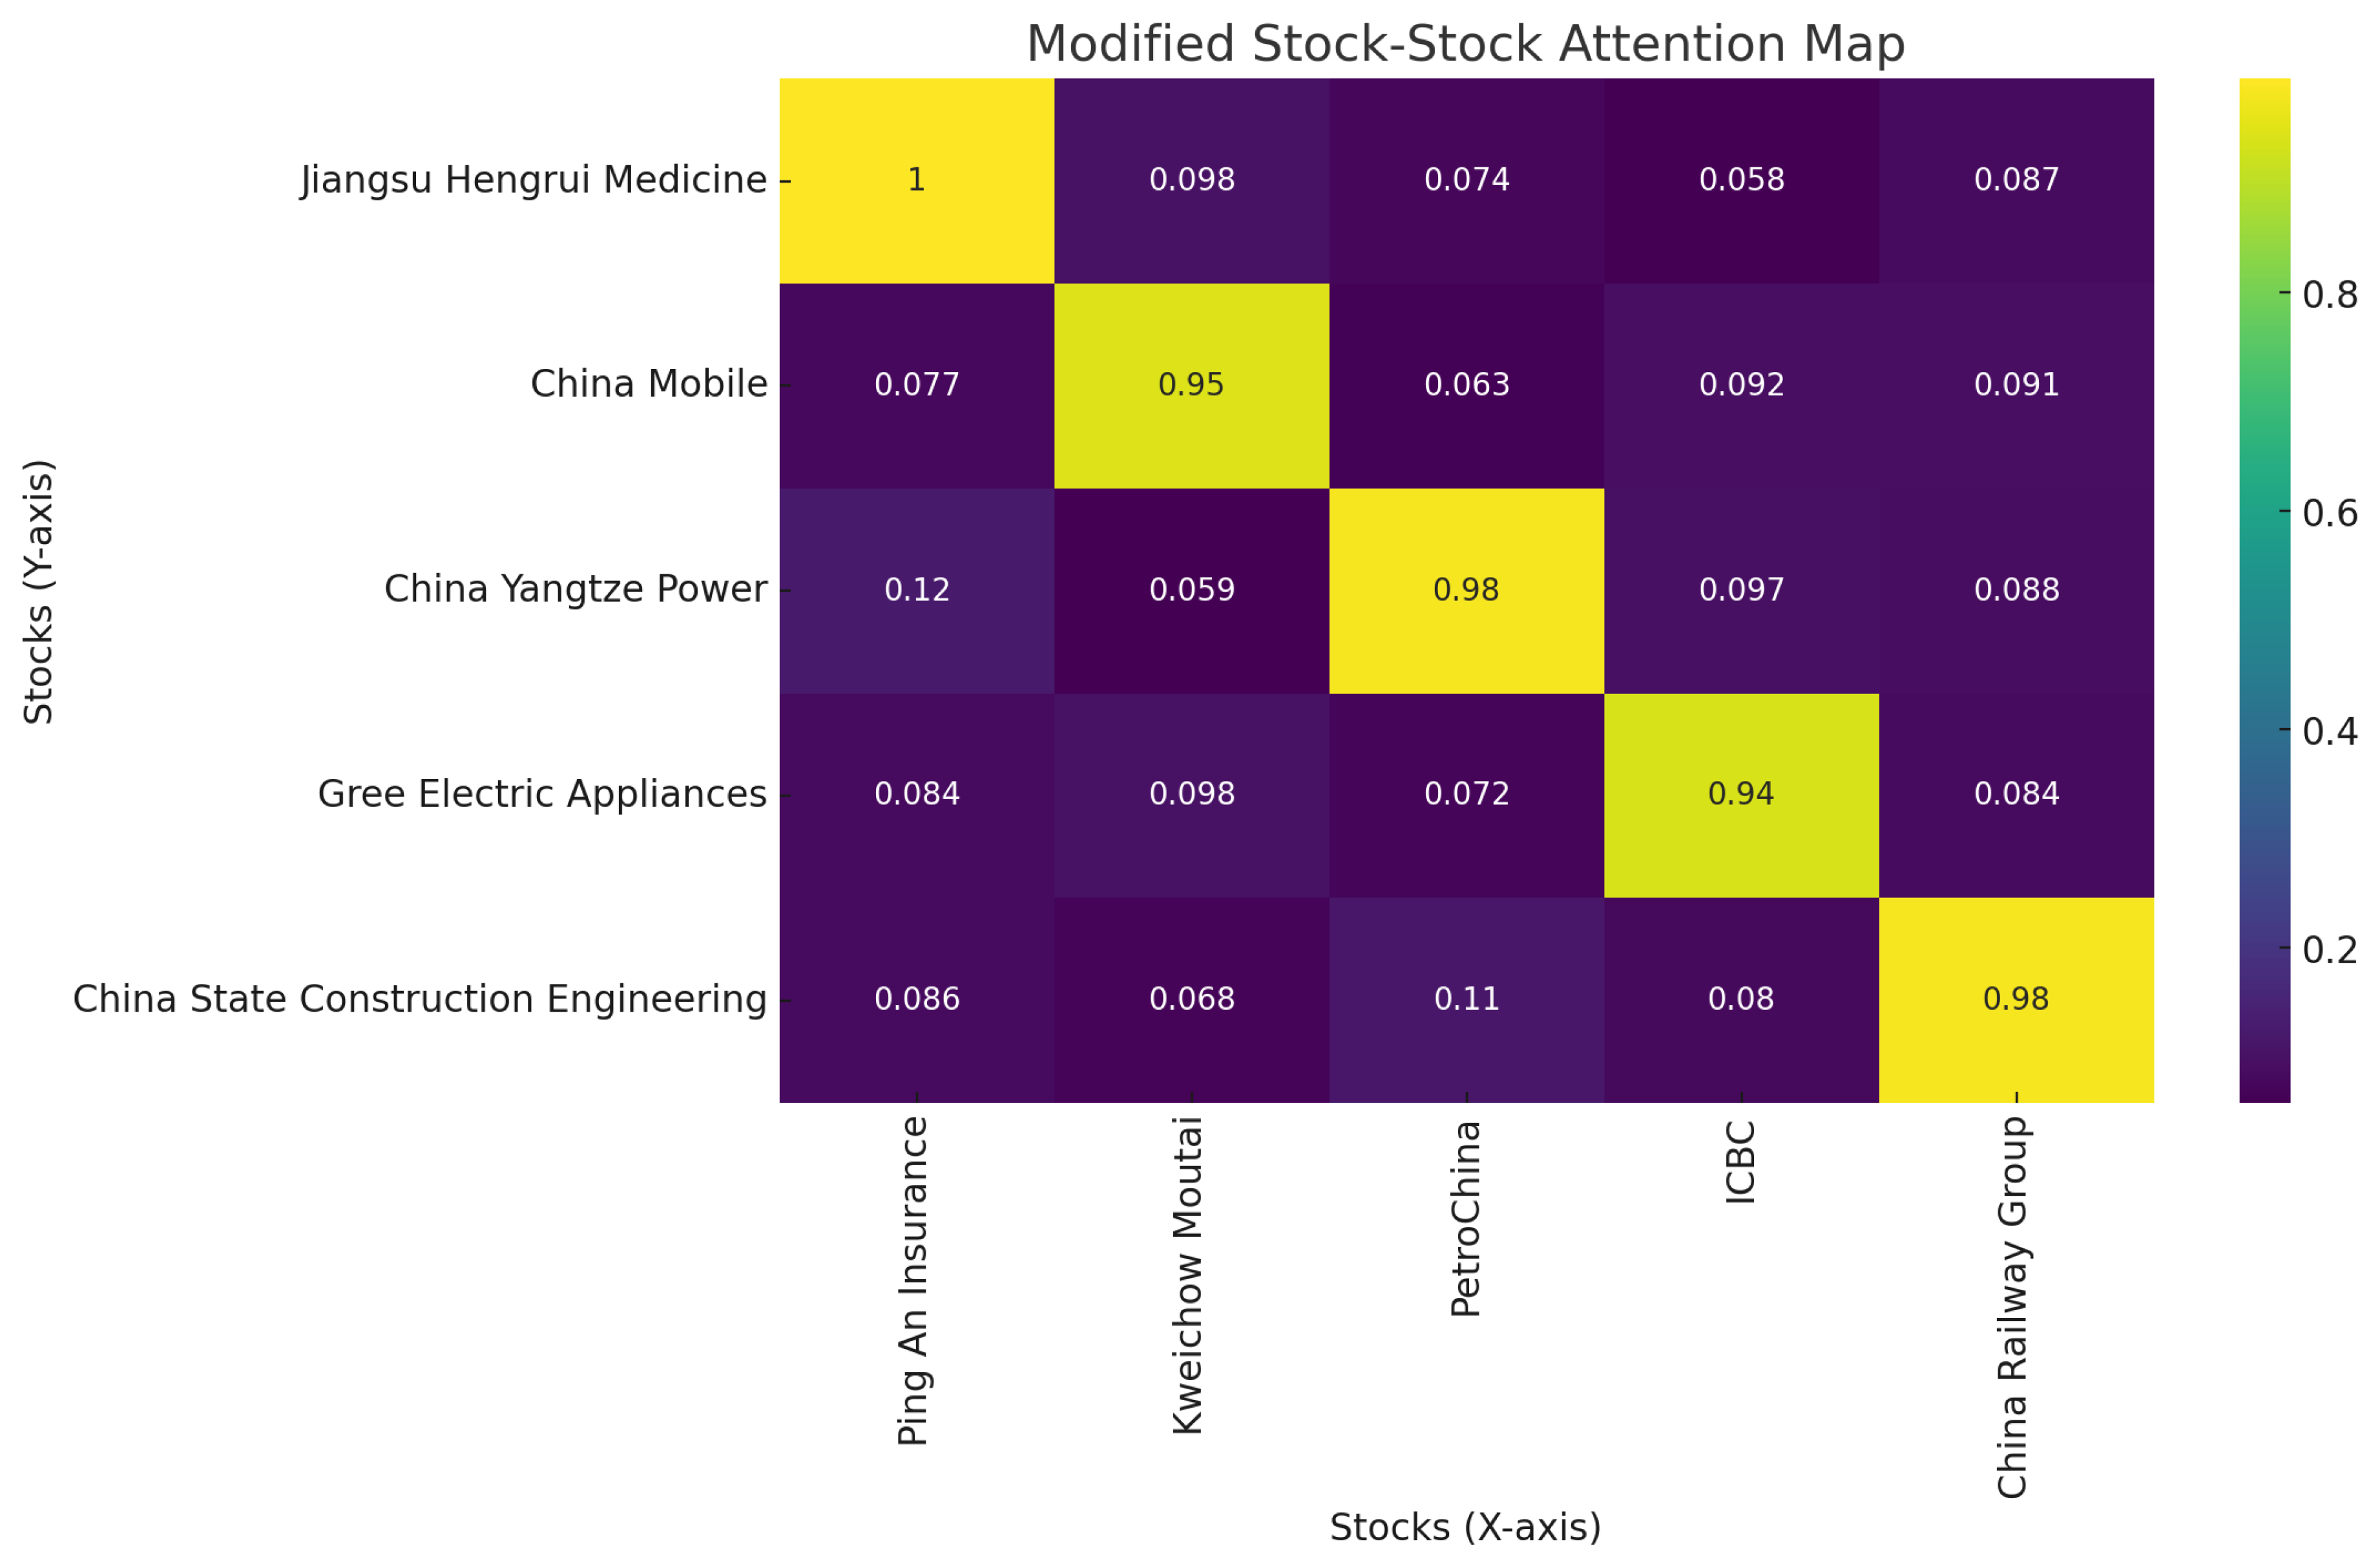
Figure 3.
Influence of Training data
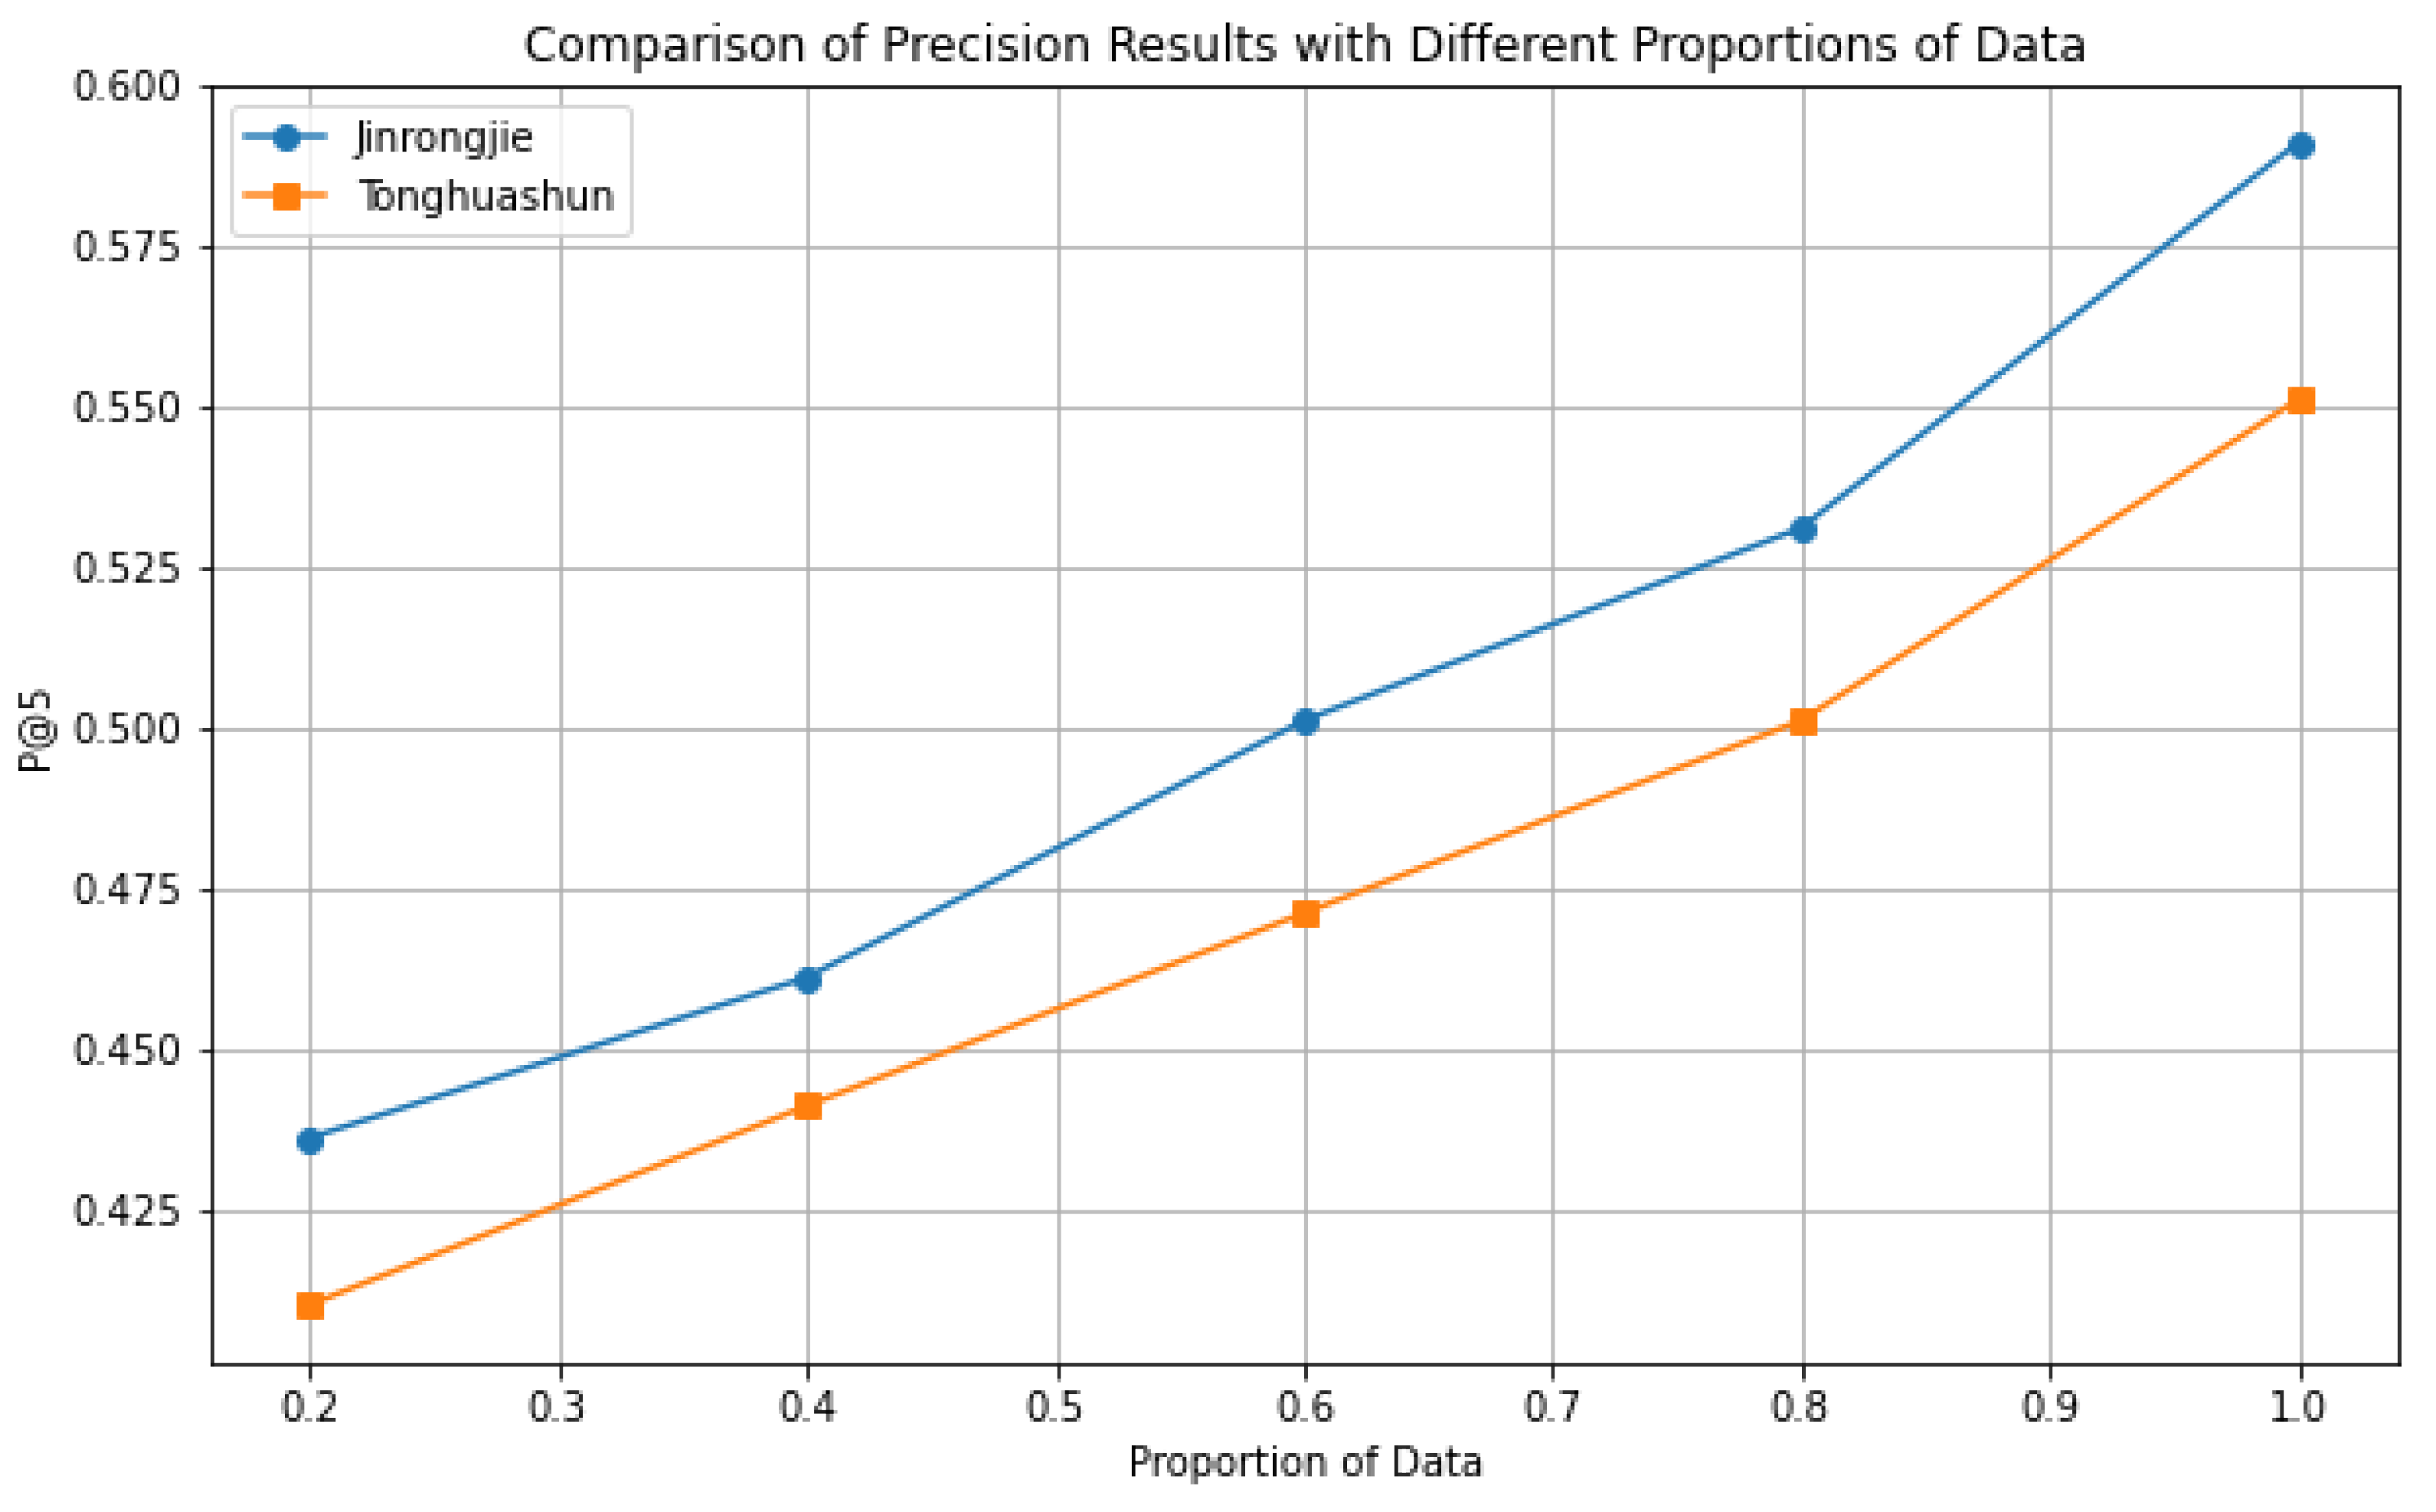
Figure 4.
Influence of Training data
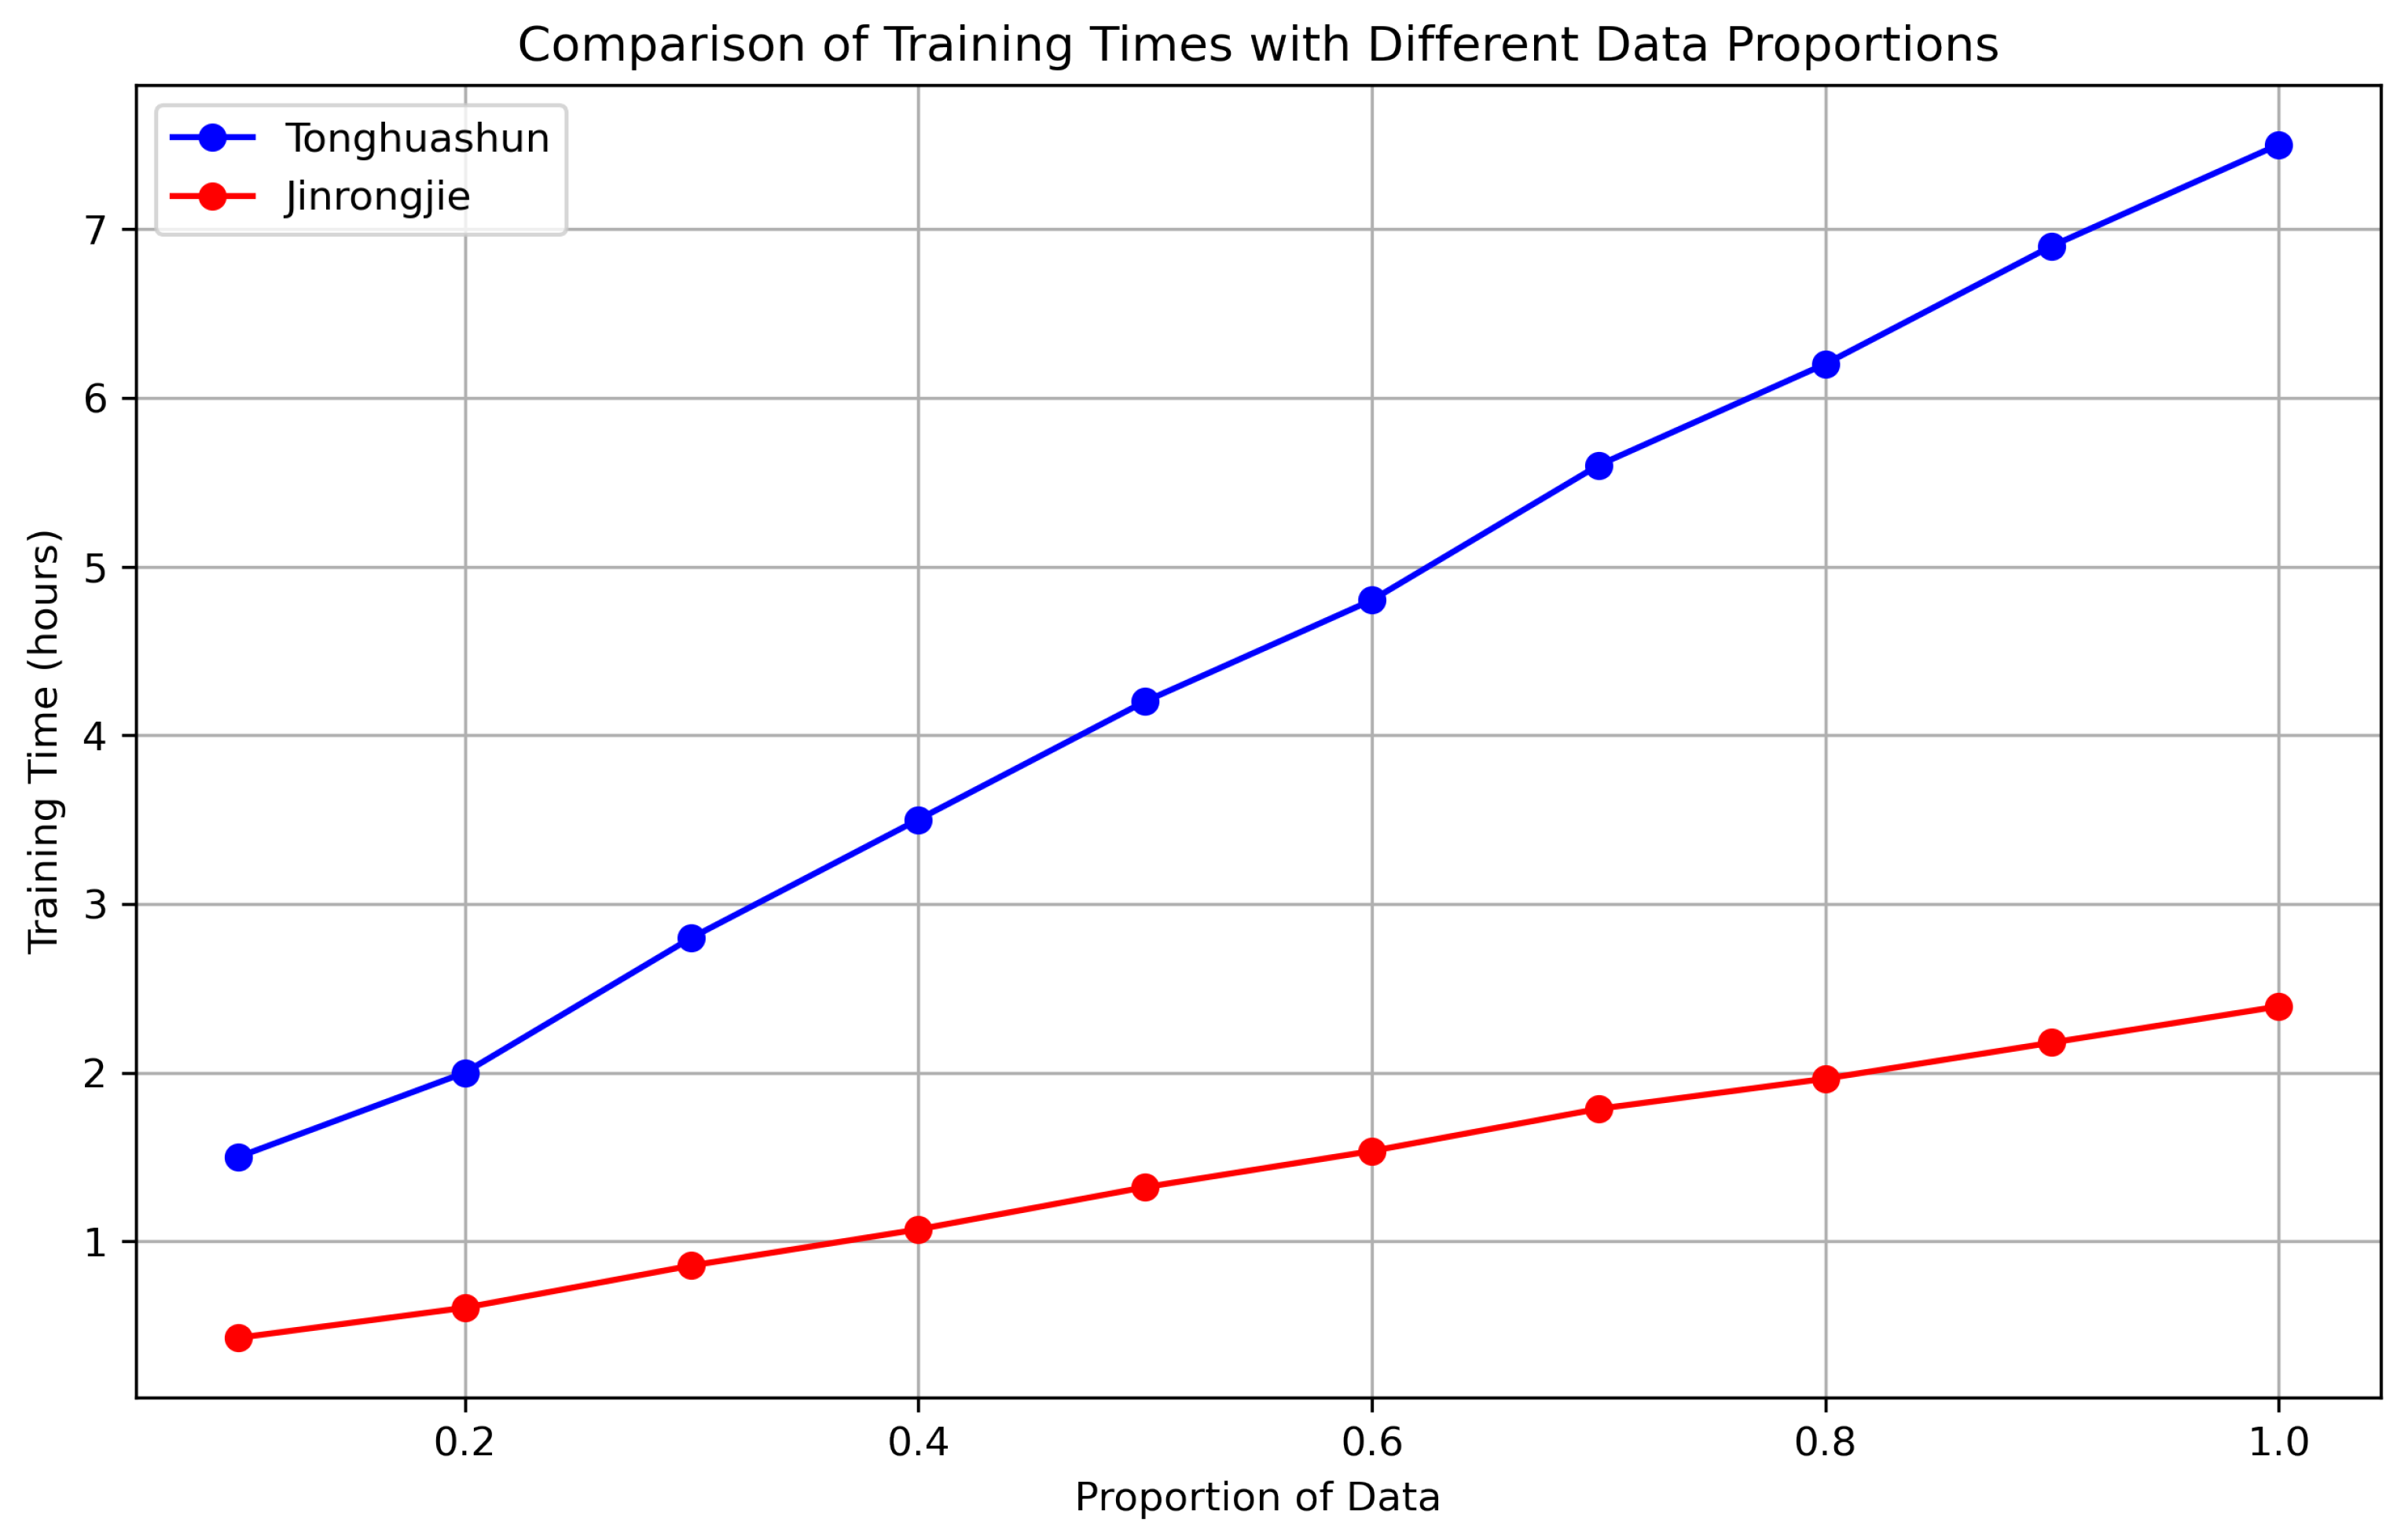

Table 1.
Examples of Concepts and Related Companies
| Concept | Company Code | Company Description |
|---|---|---|
| 3D Glass | 300083 | As of June 1, 2016, the company stated in an interaction that its wholly-owned subsidiary Genesis Glass Machines is mainly used for processing 2D and 2.5D glass products, with the 3D glass prototype still under development. |
| Security Monitoring | 300150 | The company’s main products belong to the "post-station project," holding a monopolistic position in certain sub-markets such as railway security monitoring systems. |
| 5G | 002364 | In March 2014, the company used its funds to increase the capital of its wholly-owned subsidiary Dinglian Science Communication. The purpose of the capital increase was to meet the qualification review requirements for bidding business participants and to align with Dinglian’s current production and operational needs. |
| 5G Messaging/RCS | 300608 | The company has been actively laying out industries related to integrated communications, based on Yixin, in addition to traditional 5G text messaging business opening and billing. |
| 4D Printing | 002473 | The company invested 79.83 million yuan in a high-precision titanium-nickel alloy memory temperature control device automation production line for technological expansion and production increase. |
| Heavy Stock Holding | 000423 | As of March 31, 2019, China Pacific Life Insurance Co., Ltd. - Dividend - Individual Dividend holds a 1.2423% share, and China Pacific Life Insurance Co., Ltd. - Traditional - Ordinary Insurance Product holds a 0.9582% share. |
| CAR-T Therapy | 300109 | In January 2018, the company signed a strategic cooperation agreement with Yongtai Biology, which is at a leading level in domestic cell immunology research. EAL has been successfully applied in clinical settings and is researching CAR-T. |
Table 2.
Concept stock recommendation results.
| Method | P@5 | P@10 | R@30 | MAP |
|---|---|---|---|---|
| Jinrongjie Concepts | ||||
| BM25 | 0.402 | 0.315 | 0.338 | 0.296 |
| Word2Vec | 0.450 | 0.367 | 0.380 | 0.332 |
| Word2Vec+ | 0.471 | 0.370 | 0.391 | 0.352 |
| Word2Vec++ | 0.478 | 0.375 | 0.396 | 0.359 |
| Rank | 0.467 | 0.376 | 0.402 | 0.365 |
| MineEvidence | 0.524 | 0.427 | 0.428 | 0.398 |
| Our Method | 0.601 | 0.472 | 0.478 | 0.435 |
| Tonghuashun Concepts | ||||
| BM25 | 0.387 | 0.302 | 0.315 | 0.278 |
| Word2Vec | 0.437 | 0.347 | 0.360 | 0.327 |
| Word2Vec+ | 0.448 | 0.356 | 0.374 | 0.345 |
| Word2Vec++ | 0.453 | 0.362 | 0.380 | 0.351 |
| Rank | 0.458 | 0.373 | 0.381 | 0.356 |
| MineEvidence | 0.507 | 0.402 | 0.422 | 0.378 |
| Our Method | 0.562 | 0.441 | 0.452 | 0.430 |
Table 3.
Concept stock recommendation results.
| Method | P@5 | P@10 | R@30 | MAP |
|---|---|---|---|---|
| Jinrongjie Concepts | ||||
| No Graph Embeddings | 0.571 | 0.455 | 0.439 | 0.410 |
| No Temporal Embeddings | 0.586 | 0.448 | 0.448 | 0.408 |
| No RSI Feature | 0.590 | 0.452 | 0.451 | 0.414 |
| No VWAP Feature | 0.595 | 0.455 | 0.450 | 0.419 |
| No Attention | 0.582 | 0.461 | 0.446 | 0.421 |
| Our Method | 0.601 | 0.472 | 0.478 | 0.435 |
| Tonghuashun Concepts | ||||
| No Graph Embeddings | 0.543 | 0.421 | 0.441 | 0.381 |
| No Temporal Embeddings | 0.548 | 0.430 | 0.440 | 0.406 |
| No RSI Feature | 0.553 | 0.438 | 0.441 | 0.412 |
| No VWAP Feature | 0.556 | 0.436 | 0.442 | 0.415 |
| No Attention | 0.550 | 0.428 | 0.448 | 0.389 |
| Our Method | 0.562 | 0.441 | 0.452 | 0.430 |
Table 4.
Recommended concept stocks
| Ours | MineEvidence |
|---|---|
| New Energy Vehicles | |
| Founder Motor | Wanxiang Qianchao |
| Jiangling Motors | China National Machinery Industry Corporation |
| Tianjin Motor Dies Company | Tianjin Motor Dies Company |
| Shanghai Automobile & Electrical | Asia-Pacific Mechanical & Electrical |
| Great Wall Motors | Shanghai Lingang |
| Intelligent Logistics | |
| YTO Express | Fiyta |
| Fiyta | China Chengtong Holdings |
| Meiling | Eastcompeace |
| China Railway Tielong | YTO Express |
| STO Express | Hubei Feilihua Fiber |
Disclaimer/Publisher’s Note: The statements, opinions and data contained in all publications are solely those of the individual author(s) and contributor(s) and not of MDPI and/or the editor(s). MDPI and/or the editor(s) disclaim responsibility for any injury to people or property resulting from any ideas, methods, instructions or products referred to in the content. |
© 2024 by the authors. Licensee MDPI, Basel, Switzerland. This article is an open access article distributed under the terms and conditions of the Creative Commons Attribution (CC BY) license (http://creativecommons.org/licenses/by/4.0/).
Copyright: This open access article is published under a Creative Commons CC BY 4.0 license, which permit the free download, distribution, and reuse, provided that the author and preprint are cited in any reuse.


