1. Introduction
Nowadays, the topic of green cities is being increasingly discussed, and attempts are made to answer the question of how green a city should be [
1], emphasizing the positive impact on citizens and their quality of life. There is a widespread belief that such areas are important for urban heat management, providing shelter on hot days [
2], as well as for reducing the negative impact of climate change on the functioning of cities and its inhabitants [
3]. Green spaces are recognized as key natural resources in the city [
4] and also offer safe play areas for children, which contributes to their proper development [
5]. Research also shows the importance of the green city on its sustainability [
6]
Subject literature indicates that the presence of greenery in residential areas significantly impacts the health of residents. Maas et al. [
7] examined the relationship between proximity to green spaces and the occurrence of illnesses among residents. They sought to verify whether previous studies suggesting a positive effect of green surroundings on self-assessed physical and mental health could be confirmed by objective medical data. The results showed that the strongest connection with green areas was observed in cases of anxiety and depression. Another significant finding was that children and individuals of lower socioeconomic status benefited the most from the presence of greenery in their surroundings.
Similar findings were presented by Dadvand et al. [
8], who aimed not only to confirm the relationship between green spaces and health but also to understand the mechanisms that mediate these relationships. Their research underscores that green areas can significantly improve the quality of life for city dwellers, positively affecting both their physical and mental health. The authors suggest that urban policies and planning strategies should focus on increasing the availability of green spaces, which would significantly enhance the standard of living for citizens. They also emphasize that understanding this need is crucial for creating healthy and sustainable urban environments. In addition, a study carried out by another group of researchers, analyzing the existing works [
9], also found that green spaces have an additional significant effect on stress reduction, improved mood or increased feelings of happiness, which may have an impact on their health.
The issue of living without access to greenery became particularly evident during the COVID-19 pandemic. Many people realized that being confined at home, they only saw the grayness of a concrete city outside their windows, which might have exacerbated mental health issues and fears related to the pandemic. To confirm these observations, an analysis was conducted on the impact of green spaces on reducing COVID-19-related fears, general anxiety, and depression [
10]. The results showed that depending on the age group, green spaces brought different benefits. In older participants, they reduced depression, while in younger groups, they were associated with decreased concerns about the pandemic and its consequences.
Despite the numerous advantages of green spaces and their positive impact on health, many cities still lack sufficient green areas, often deemed adequate nonetheless. To raise awareness among decision-makers and the public, it is necessary to clarify the concept of a "green city," which is not clearly defined and therefore is interpreted differently. This ambiguity leads to low interest in the topic and a lack of clear guidelines for implementation. Ann Van Herzele and Torsten Wiedemann [
11] present an example of such an approach, arguing that a green city is one where every home is within a defined maximum distance from the nearest green space. They categorize green spaces into several types, with the maximum distance to them varying depending on size, quality, and type. Although this approach seems comprehensive, understanding all aspects of the analysis may be difficult and time-consuming due to its complexity and detailed guidelines.
Another example is the research presented by Kabisch et al. [
12], which aimed to examine the availability of green spaces in 299 EU cities. The results indicate that cities in southern Europe have fewer accessible green areas due to low forest cover, while cities in northern Europe have more. This issue is further complicated by the uneven distribution of green spaces in many metropolises. Ayala-Azcárraga et al. [
13] focus on Mexico City as an example of a city with significant social and locational inequalities. Their analysis revealed an asymmetry in the distribution of green spaces. It was also noted that less affluent municipalities have less access to green areas, which might lead to various health issues for residents. The authors highlight the need for a more equitable distribution of green spaces and the necessity to integrate them into urban planning, especially in currently marginalized areas. This problem is also raised in other studies relating to other cities, e.g. Chicago, where it would seem that such problems are not experienced by residents [
14]
Subsequent studies address the topics of diminishing green spaces and deteriorating quality of urban life [
15]. They use satellite imagery and data and GIS tools [
16] to develop , among others, a spatial accessibility model that assesses the accessibility of green spaces from different points in the city. The results show that the accessibility of green spaces decreases as one moves away from the city center. In the central parts of Fuzhou, residents have better access to green spaces, while on the outskirts of the city, accessibility is limited. The spatial equity analysis further revealed significant inequalities in access to green spaces. In some districts of the city, green spaces are over-concentrated, while other areas, especially on the outskirts, suffer from a shortage.
The above review of research on the issue of green cities shows that the studies focus mainly on the impact of greenery on residents' health. Although there are certain attempts to study the mere presence of greenery in cities, these studies are rather selective, considering only individual factors, primarily the distance to the nearest green space, whose definition is also differently understood. This approach seems insufficient for a comprehensive assessment of whether the residents of a given city live amidst greenery. With this in mind, research was undertaken to propose a method for evaluating when a city can be considered green. The basic assumption was that a city is green if various forms of greenery are evenly distributed across the inhabited area of the city, meaning that practically every resident has close access to greenery in its various forms. Since the idea of a green city concerns every resident, it was assumed that the conditions of a green city should be met for at least every residential building in the city. Ideally, greenery should be accessible to every apartment, considering the possibility of apartments being located on different sides of the building and the associated varying access to the nearest forms of greenery. Only then can it be assumed that residents live in a friendly green environment.
Thus, two main research questions were posed:
The research questions stem from the assumption that the situation may vary in different parts of the city, i.e. that some areas may be considered green, while others may not. In such cases, the pursuit of a green city requires intervention only in certain regions, rather than the entire city. Therefore, it is essential to indicate what the spatial distribution of areas meeting the adopted conditions looks like. Ensuring a green city depends on whether these areas are evenly distributed across the entire city or form clusters or enclaves. This may also reflect the spatial factors affecting the presence of green spaces or the coherence of policies pursued by city authorities.
2. Materials and Methods
2.1. Methodological Foundations
The proposed methodology was based on the 3-30-300 [
17] concept, which thoroughly analyzes cities in terms of the accessibility of green areas. This idea assumes that from every window of a building, at least three trees should be visible. Additionally, each district should have at least 30% of its area covered by greenery, and every building should be within a maximum distance of 300 meters from the nearest park or forest. This concept was developed by a professor from the University of British Columbia in Vancouver, and its practical application was demonstrated by a group of researchers [
18]. The aim of their study was to assess the accessibility of green spaces for residents of Florida based on a survey conducted among 1,716 residents. The research confirmed that green cities are crucial for the quality of life of their residents, but it did not specify how exactly one can determine whether a part of a city or a specific residential building actually meets its criteria. The results were based solely on residents’ opinions, rather than on specific, measurable, and verifiable conditions.
Given these factors, this study proposed refining all the conditions of the 3-30-300 concept and utilizing spatial analysis methods to precisely, repeatably, and unambiguously determine which buildings meet the criteria of a green city.
First, the condition of being able to see three trees from a window was clarified. This criterion should involve the distance between the window and the trees, ensuring that the trees are visible in the immediate vicinity of the home, rather than kilometers away. Therefore, it was assumed that "three trees visible from the window" should only include those within a distance of no more than 20 meters from the building. This is a fairly large value, assuming that the trees do not have to be in the immediate vicinity of the building, they can be a bit distant.
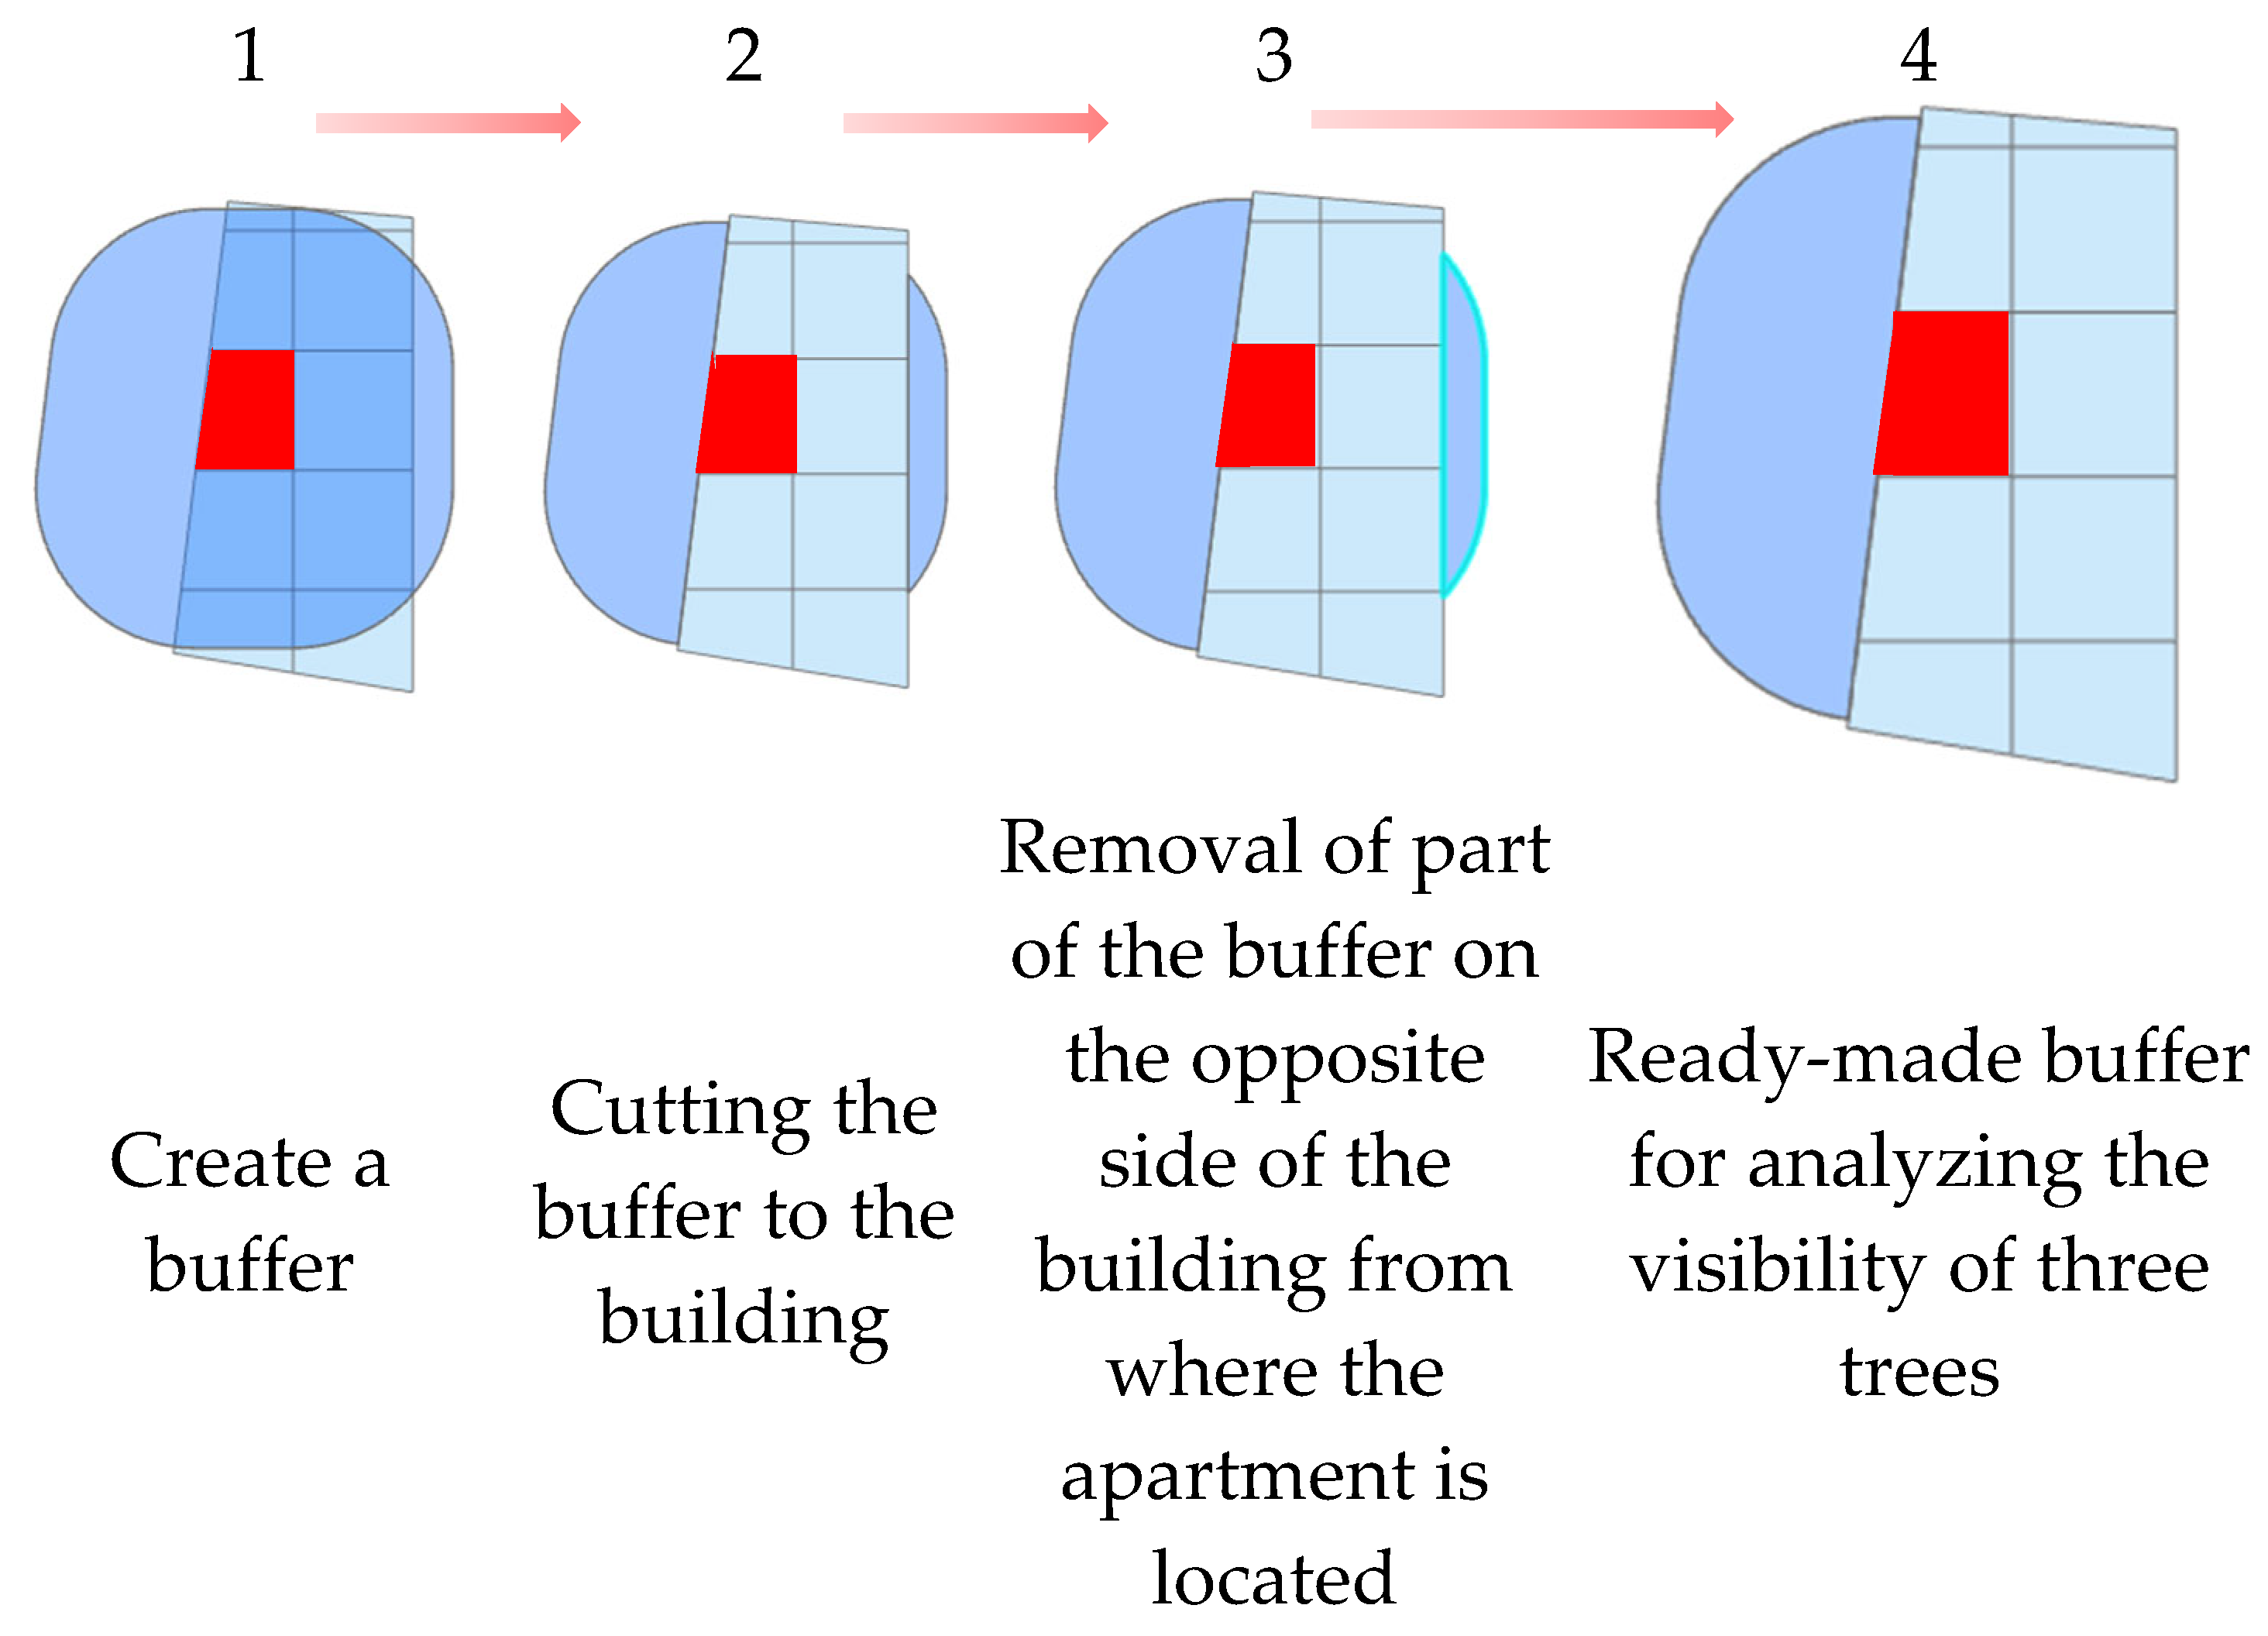
The second parameter that was refined was the definition of "from every window." This means that the study should not only consider the building as a whole but also its various sections, as apartments located on different sides of the building may have different access to greenery, particularly trees visible from windows. Due to the lack of detailed data on the placement of windows in buildings, it was assumed that the distribution of apartments should be simulated. This simulation was conducted by dividing each residential structure into squares with sides of 15 meters, representing apartments in multi-family buildings. From each square/apartment, a visibility buffer for three trees within 20 meters was drawn. Additionally, the part of the buffer on the opposite side of the building from the simulated apartment was excluded from the analysis. The operation of the adopted algorithm is illustrated in
Figure 1.
The third issue that was clarified was determining which green areas should be included in the 30% green space requirement. It was assumed that this condition would be considered in two variants. The first variant assumes that green areas are only those with tall vegetation, such as forests and parks. The second variant considers all green areas, regardless of what is on them—this includes parks and forests, as well as squares, lawns, etc.
The final condition that was detailed concerned the distance to the nearest park or forest. To ensure a high quality of life for residents, it was proposed to consider only parks and forests larger than 1 hectare. This is based on guidelines from the European Regional Office of the World Health Organization, which suggests that smaller areas do not significantly impact human regeneration and rest [
19]. Therefore, these smaller areas were excluded from the analysis.
Spatial analyses were employed to carry out the study, including:
Buffer Analysis to determine the visibility area of three trees.
Iteration to assess how many trees are within the specified buffer.
Select by Attributes to identify single-family and multi-family buildings.
Select by Location to perform analyses for individual districts and determine which buildings meet the second and third conditions.
To analyze the impact of each condition on the overall results, the study was conducted separately for each individual condition of the 3-30-300 concept, as well as collectively for all conditions combined.
2.2. Case Study
2.2.1. Test Area
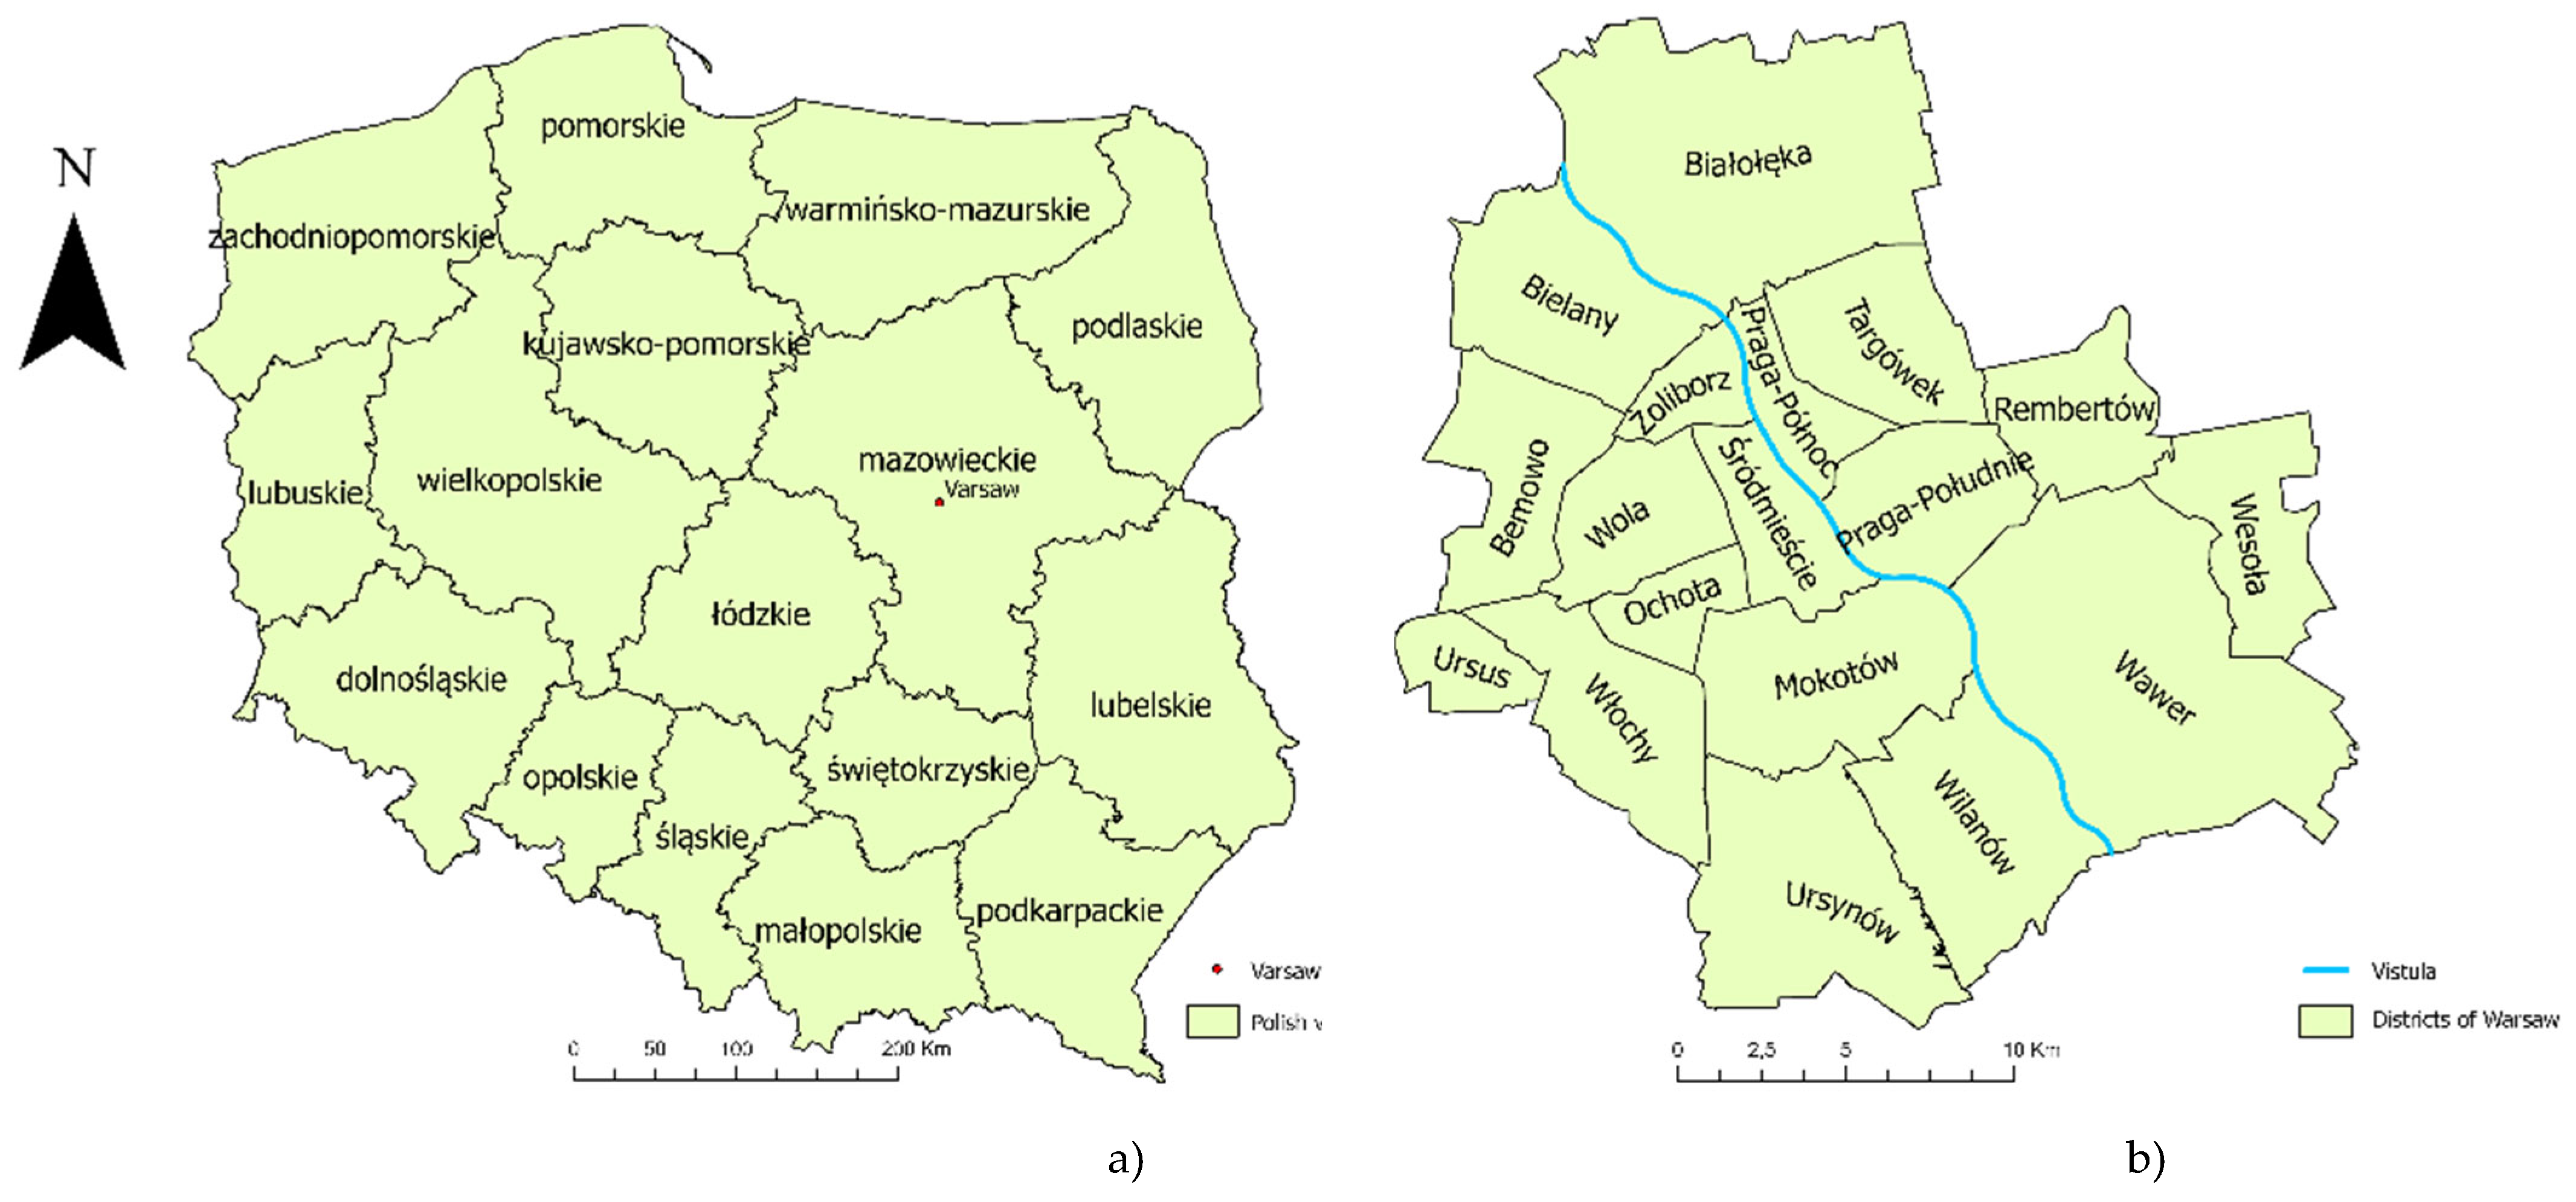
The methodological assumptions were verified using the example of Warsaw, the capital of Poland. Warsaw is located in the central part of the country (
Figure 2a), within the Masovian Voivodeship. It is the largest city in Poland, covering an area of 512 square kilometers and is divided into 18 districts (
Figure 2b). According to demographic analyses from 2023, the city has a population of 1,861,644 people [
20]. The most populous district is Mokotów, with 225,916 residents, while the least populous is Rembertów, with 24,670 residents
Warsaw is a complex city in terms of urban structure and diversity of ecosystems. The choice of Warsaw as a research object is justified by several key aspects, including:
Population Density: As the largest city in Poland, Warsaw has a high population density of 3,600 people per square kilometer [
21]. This presents a significant challenge for urban planners and designers to ensure an adequate amount of urban greenery for its residents. The intensive development often limits space for green areas, making the analysis of existing green spaces and the planning of new ones crucial for improving the quality of life in the city.
Diversity of Green Areas: The city boasts numerous parks, urban forests, squares, and other forms of greenery that can serve as model examples for studying the accessibility and quality of green spaces. Parks such as Łazienki Królewskie, Pole Mokotowskie, and Park Skaryszewski are located in the central part of the city, providing an opportunity to verify whether their prime locations translate into adequate accessibility for residents.
Urban Policy: Warsaw has numerous projects and initiatives related to ecology and sustainable development. One example is a project called ‘Million Trees’ [
22], which involves planting one million trees in Warsaw. The program involves residents, who can indicate locations for planting using a mobile application. The main goal of the program is to plant trees along the city's main streets, in parks, squares and other accessible places, i.e. where residents expect them to be. Another example of a similar activity is the Zielone Ulice (Green Streets) project [
23], which focuses on changing the appearance of the city's main arteries and involves creating new plantings and rebuilding existing greenery arrangements along dozens of streets in Warsaw. The process includes consultations with residents and the creation of concepts that will be implemented in stages over several years. Another example is the program involving the de-concretization of urban space, i.e. the removal of concrete pavements in the city, allowing for the creation of new green areas. In 2022, almost 3,000m2 of space was transformed in this way [
24];
New housing estates - a large number of new housing estates and housing blocks provide the opportunity to observe how the urban landscape is being developed in newly created housing estates.
2.2.2. Data
The data used in the study were obtained from the geoportal.pl portal [
25]. It is an online platform providing access to the state geodetic and cartographic data resource made available by the Central Office of Geodesy and Cartography [
26]. It allows users to browse maps and search for specific locations. It also provides the possibility to download spatial data free of charge. The Geoportal is a tool that is widely used by offices, businesses, researchers, students or ordinary citizens. Thanks to the integration of multiple data sources and analytical functions, the portal supports decision-making and planning processes, contributing to sustainable development and effective spatial management.
To analyze the visibility of trees from individual squares (simulating dwellings), data called ‘3D Tree Models’ were used. These are data containing 3D Tree Models which are representations of trees over 4m in height. This data is provided free of charge in City GML format. It is worth noting that the standard in which they are represented is LoD1[
27]. The 3D models of the trees have been generated automatically on the basis of current data in the state geodetic and cartographic resource. Each model provided has the same attributes (object identifier, data source, validity of source material, tree height, tree ground level height).
For the remaining analyses, BDOT10k data was used [
28]. This is a dataset containing the spatial locations of topographic objects together with their basic descriptive characteristics. Examples of data contained in this collection include: communication networks, forests, buildings, etc. The content and detail of this database correspond to a topographic map at a scale of 1:10000.
The use of OpenStreetMap (OSM) data has also been investigated ([
29];[
30]). The aim of this project is to provide a free, editable map of the world. Data collection and updating is based on a collaborative community of users who create and update map data. Each user can add information about roads, buildings and other geographical features, so that the map is constantly updated and relatively accurate. A detailed analysis showed, however, that this data is not as accurate as the BDOT10k data and was eventually abandoned.
3. Results
The results obtained refer to every building in Warsaw and every simulated flat, but for the sake of transparent presentation of spatial distribution of buildings meeting the set criteria, the results are referred to Warsaw districts.
3.1. Visibility of 3 Trees
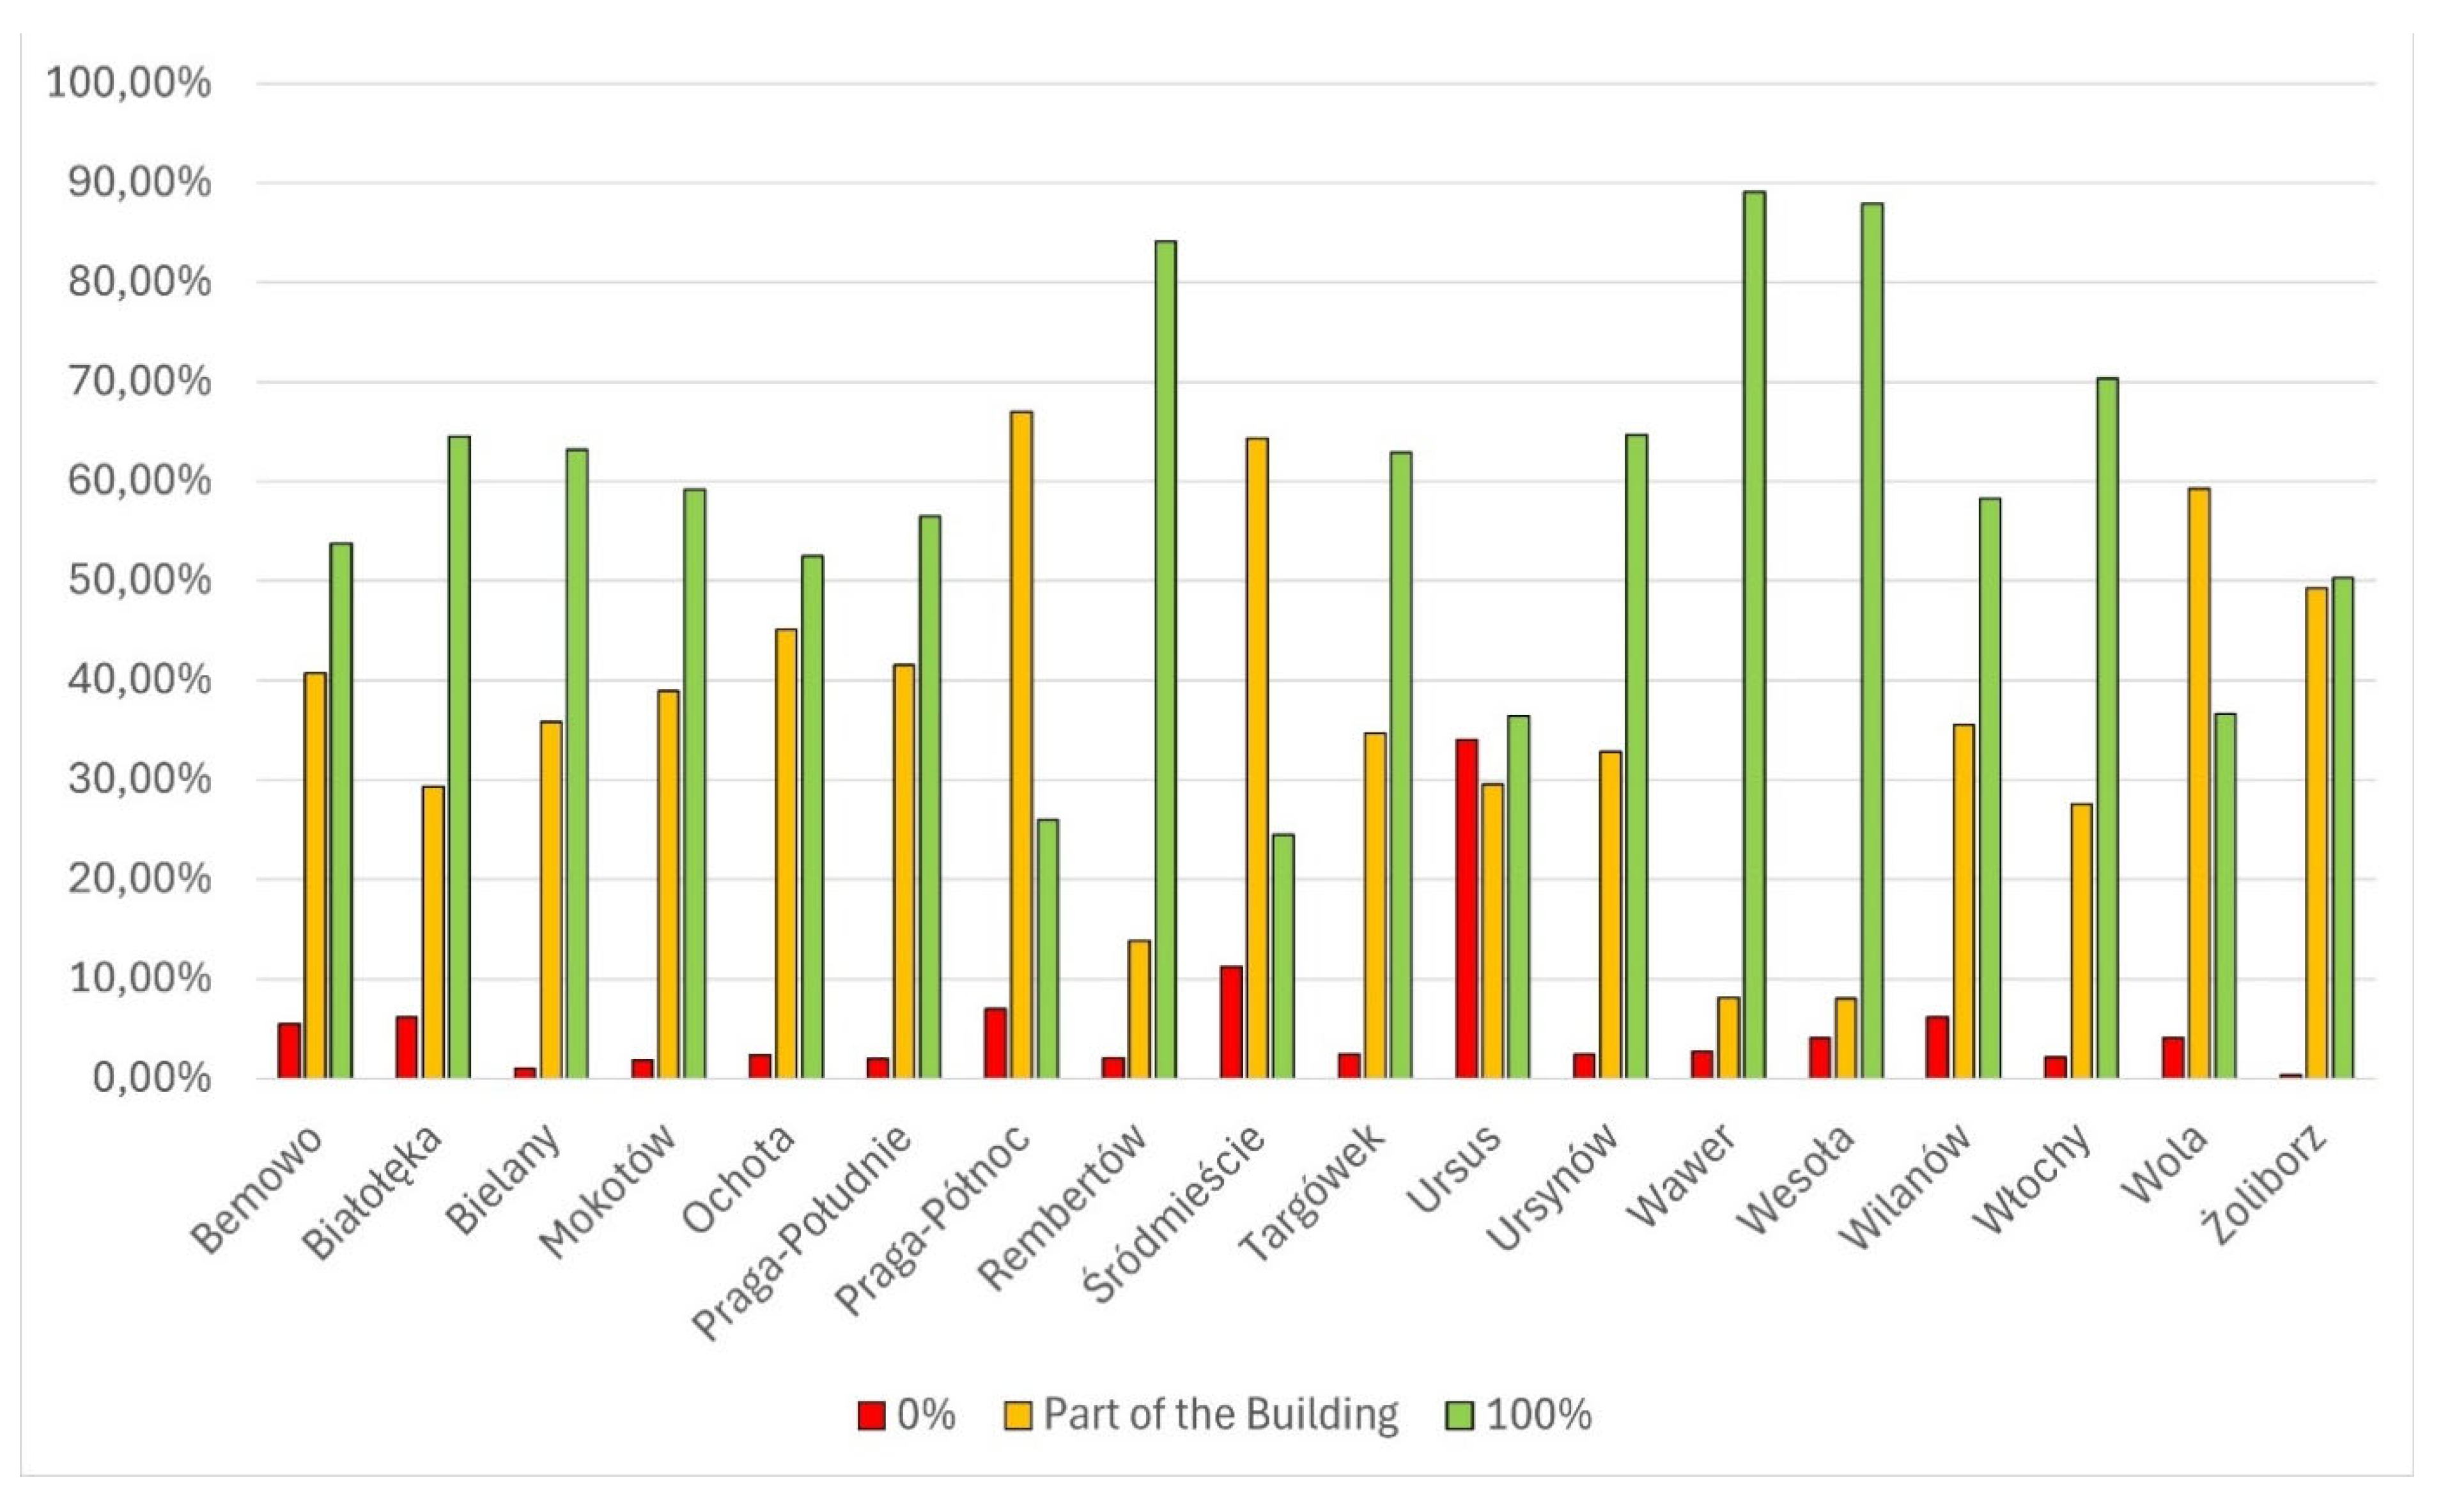
Figure 3 shows the results of the analysis of the visibility of the 3 trees from different sides of the building for the different districts of Warsaw. This graph shows three values. The first one (red) tells what percentage of buildings have no flats from which at least 3 trees can be seen. The second value (yellow) tells how many buildings have a proportion of flats from which 3 trees can be seen. The last value (green) represents the percentage of buildings in which at least 3 trees can be seen from each potential flat, i.e. the entire building meets the adopted condition.
Analyzing the spatial distribution of the results obtained, one may see that districts such as Wawer, Wesoła and Rembertów have the highest percentage of buildings with a minimum of 3 trees visible. This condition is met by more than 80% of the buildings in each of these districts, suggesting that in these districts trees are most scattered between buildings. This is probably due to the peculiarities of the districts, as these are areas with a predominance of detached houses that have gardens with vegetation, among which there are also many trees.
The Ursus district has the highest number of houses with zero tree visibility (over 30%). This may be due to the large number of new buildings being built on brownfield sites. They make maximum use of the land for housing, but do not secure spaces for green areas, even as small as individual trees.
The results of the tree visibility analysis also show that the highest percentage of buildings, from which only a part of three trees can be seen, is located in the districts of Praga Północ, Śródmieście, Wola, and Żoliborz (60% and more). These are rather old districts, with fairly dense buildings. There are quite a lot of squares and trees in these parts of Warsaw, but probably the dense housing development makes them visible only from some parts of the buildings.
Figure 3.
Visibility of 3 trees from the buildings by districts.
Figure 3.
Visibility of 3 trees from the buildings by districts.
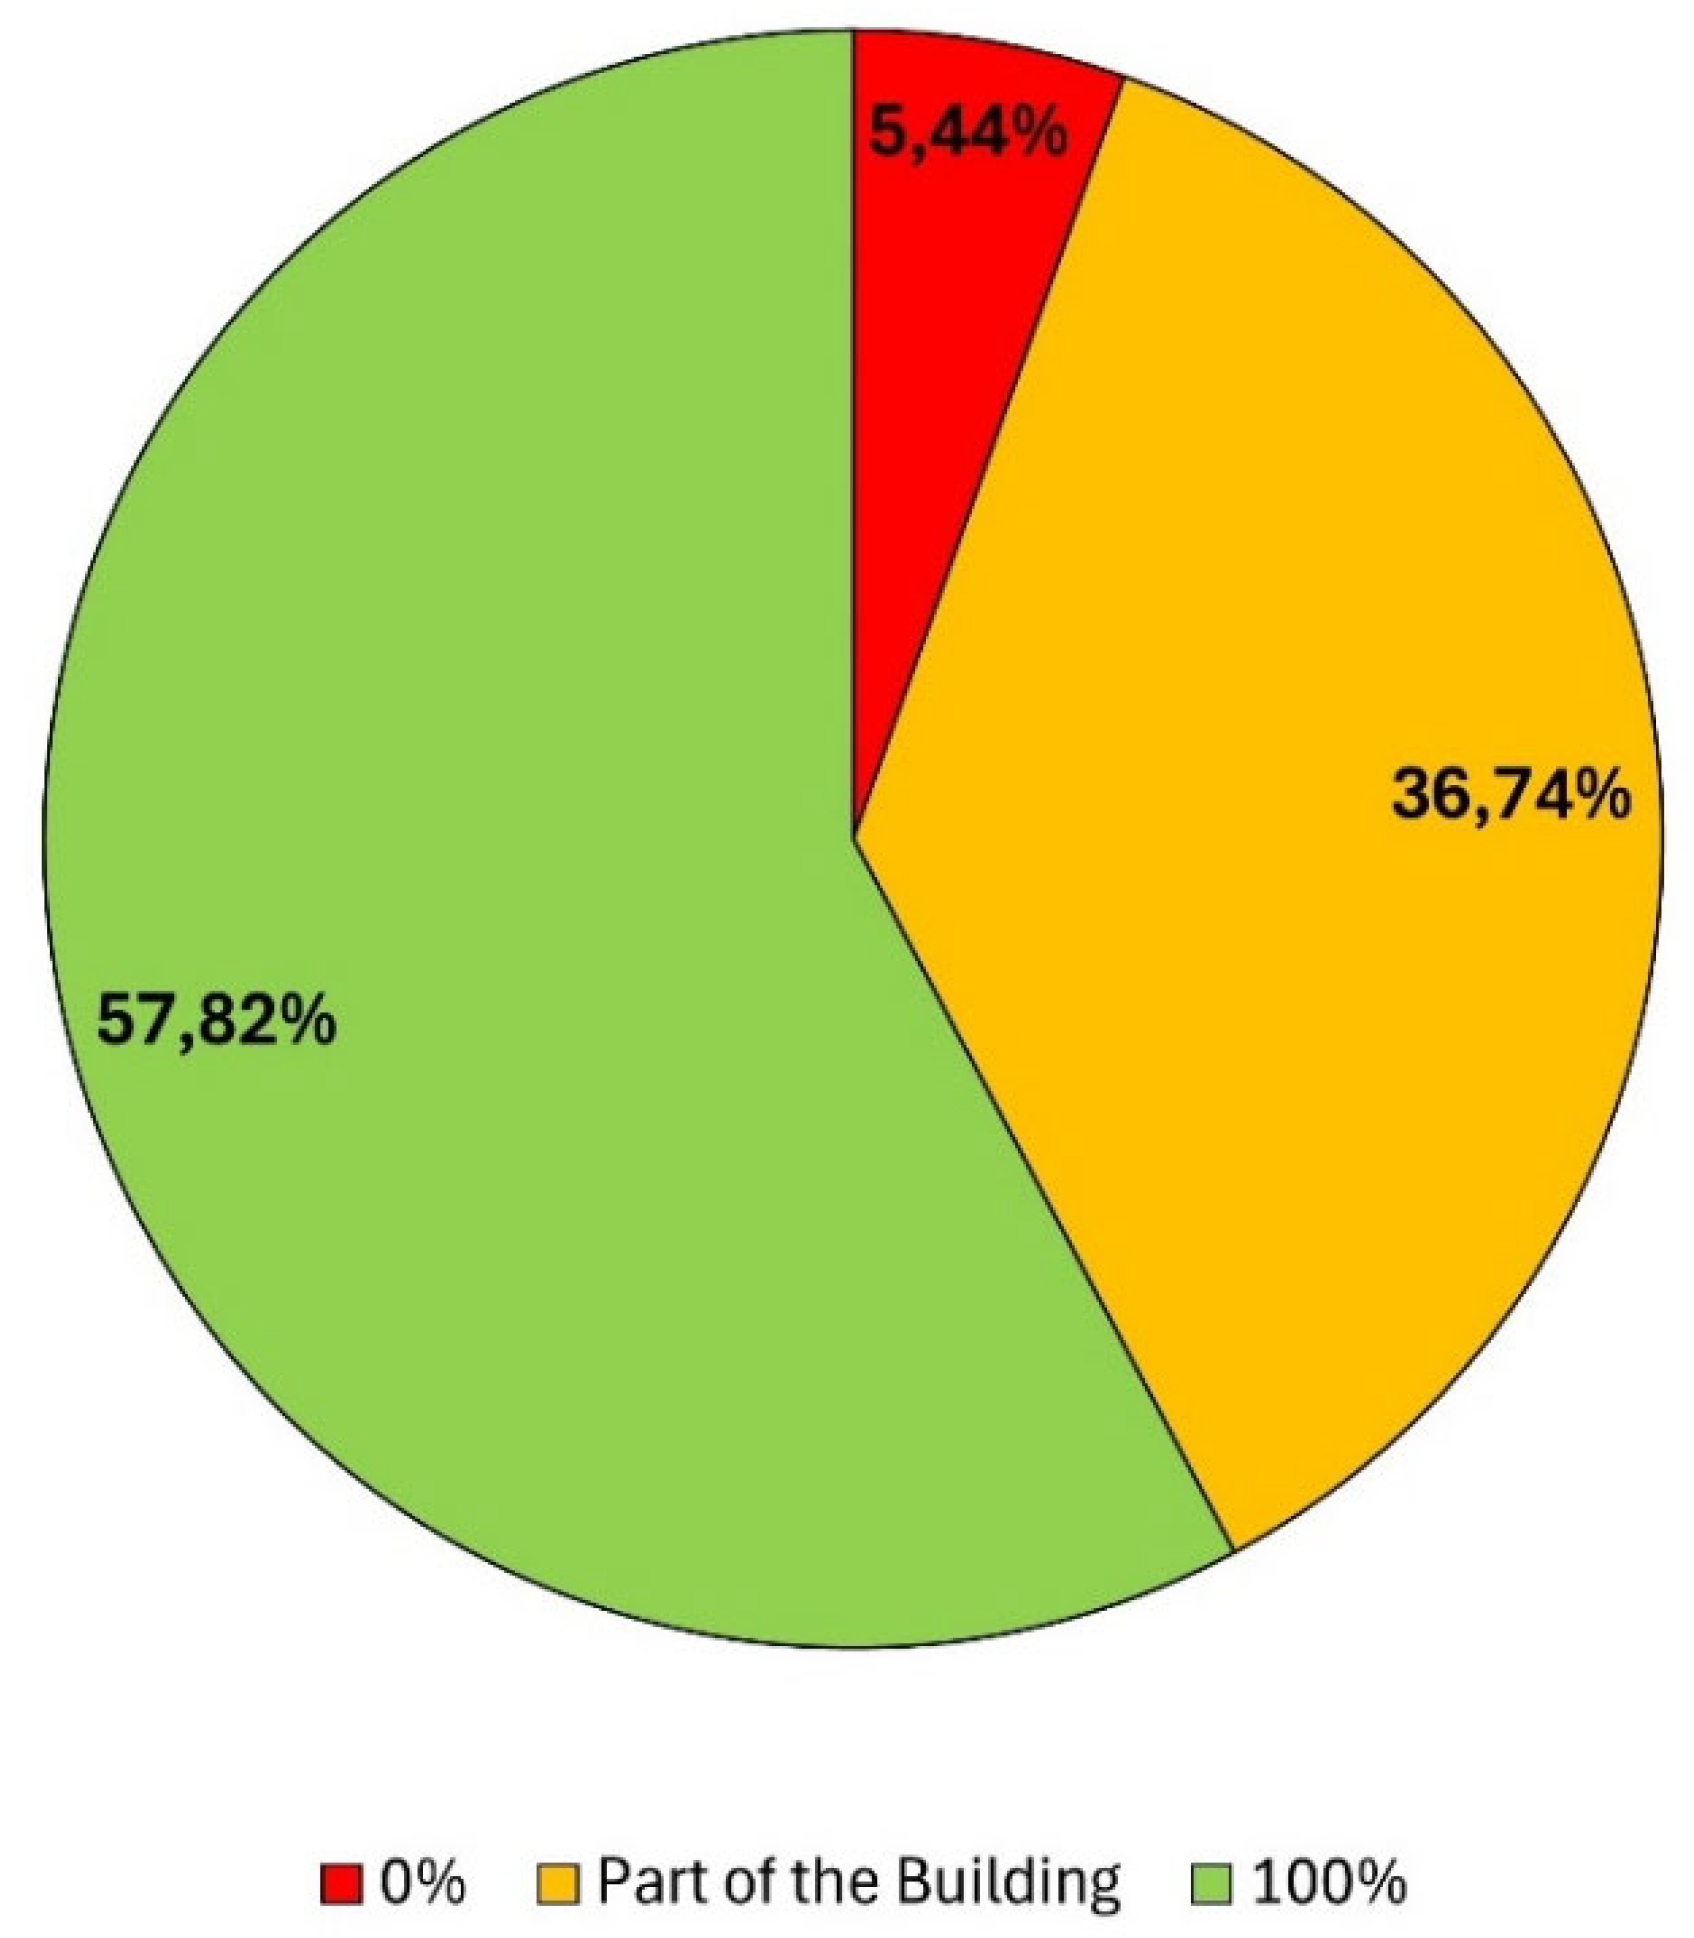
The visibility of 3 trees for the whole city is presented in
Figure 4. It shows that 57.82% of the houses in Warsaw offer a view of a minimum of three trees from any part of their building, while 36.74% only from some parts of the building. Only 5.44% of residential buildings do not offer a view of 3 trees from any side of the building, which means that the number of buildings in Warsaw without any trees around them at all is very small.
3.2. 30% Green Coverage of the Area
The graph presented in
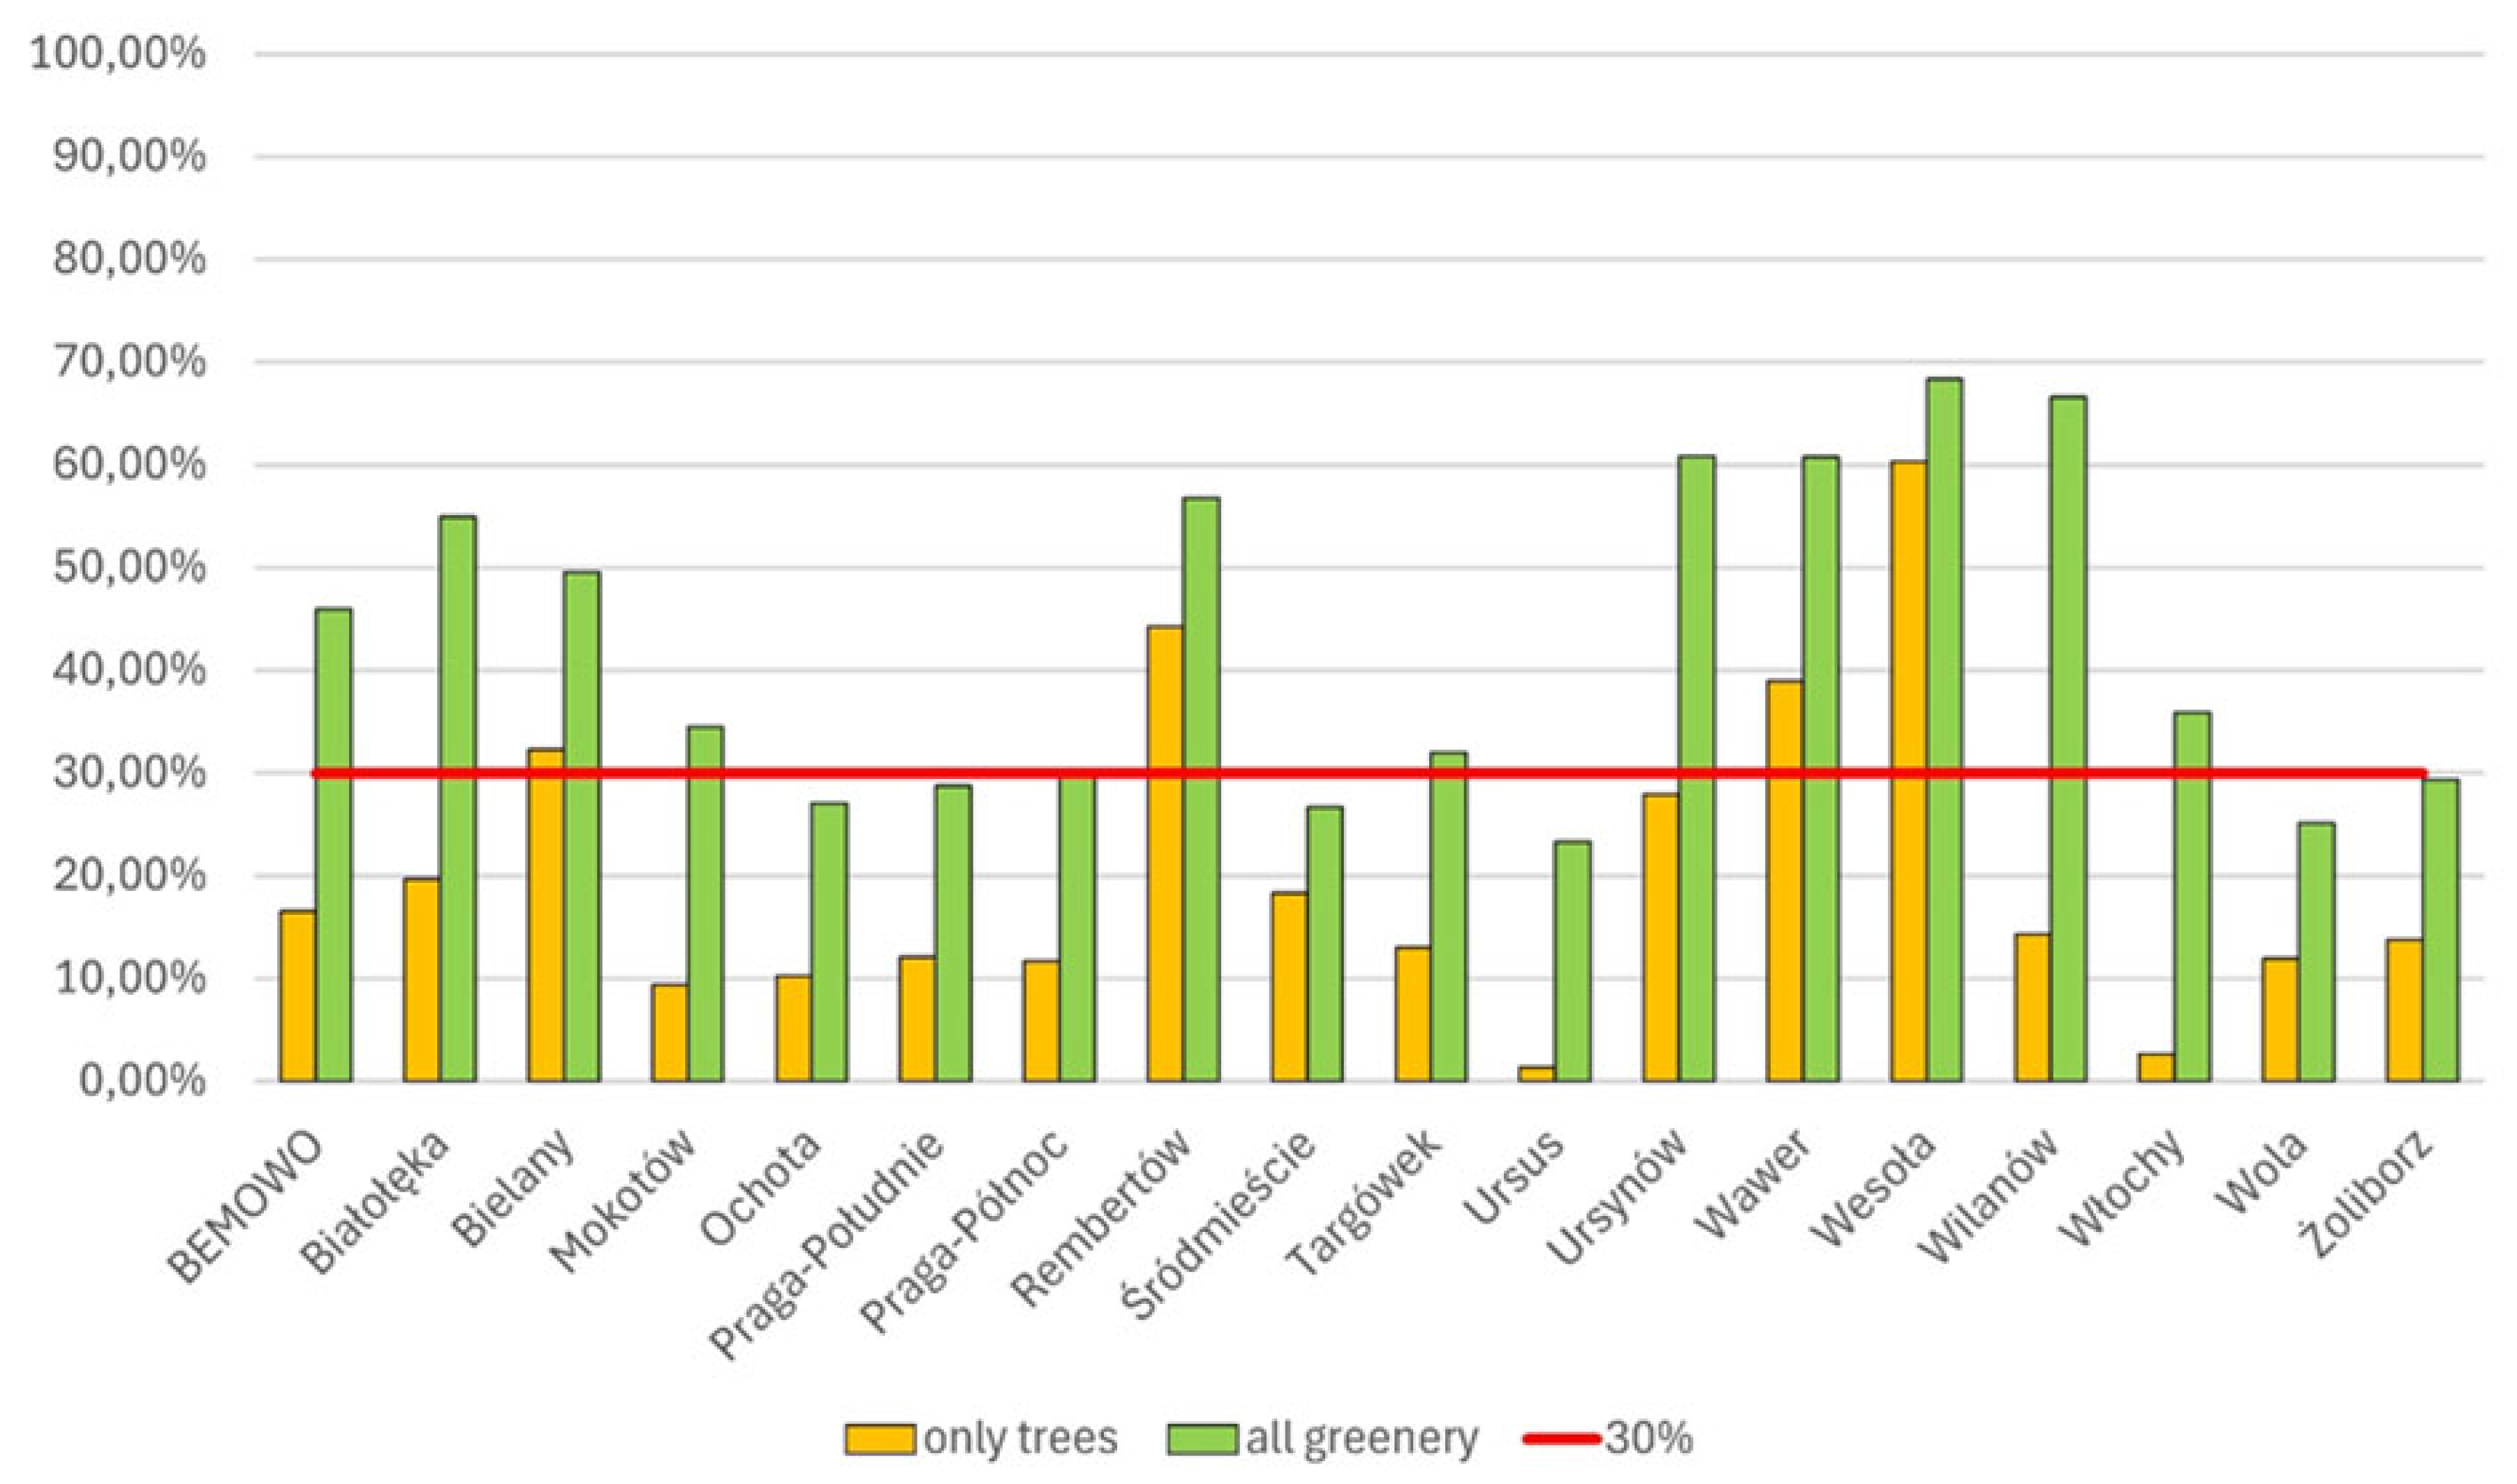
Figure 5 shows the percentage of districts occupied by green areas. In addition, the coverage threshold required by the concept guidelines, which is the assumed 30%, is highlighted. Due to the lack of clear guidance on what should be considered as green areas, two variants of this condition were analyzed.
The first variant, marked in yellow, represents green areas, including only woodlands and parks. In this case, the districts of Wesoła, Rembertów, Wawer, and Bielany have the highest percentage of greenery and exceed the adopted threshold of 30%. The second variant, marked in green in the figure, includes areas covered with all forms of greenery, including lawns etc. The results show that in this case the percentage of green areas in each district increases greatly; in some of them even by half of the original value. Comparing the two variants, it is clear that with tree-covered areas, only four districts meet the 30% condition, while in variant two there are as many as 12 such districts.
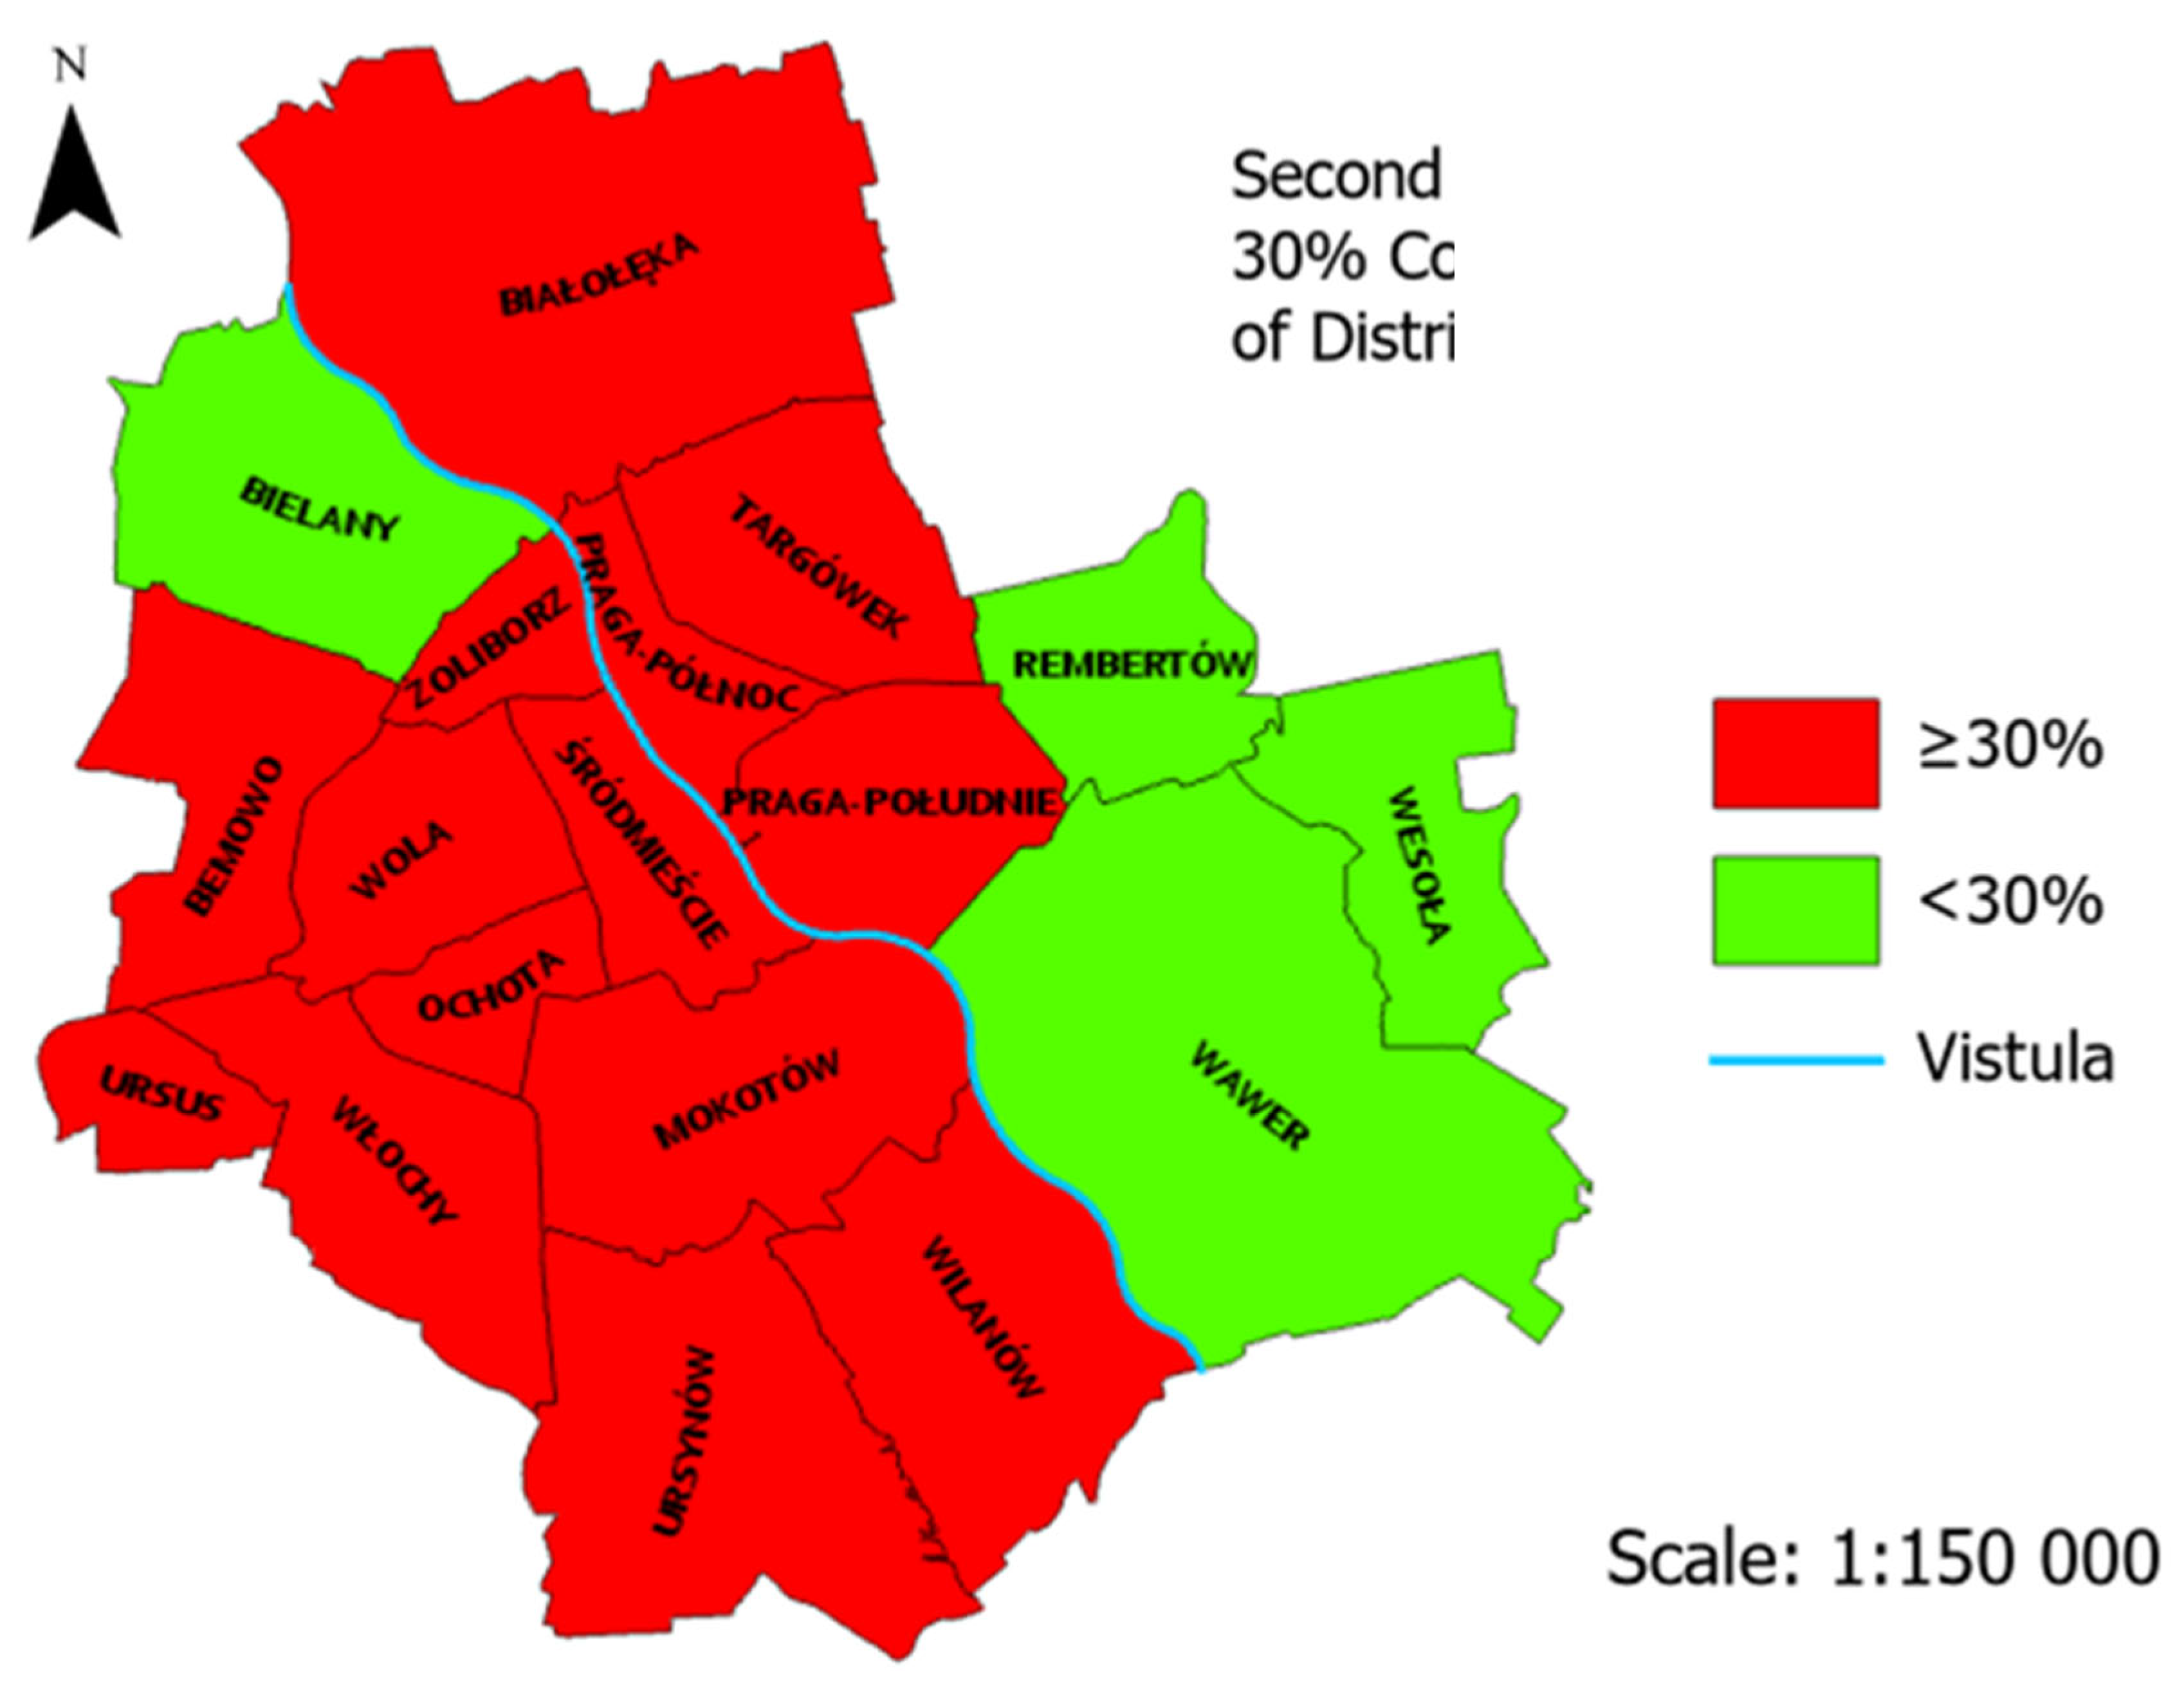
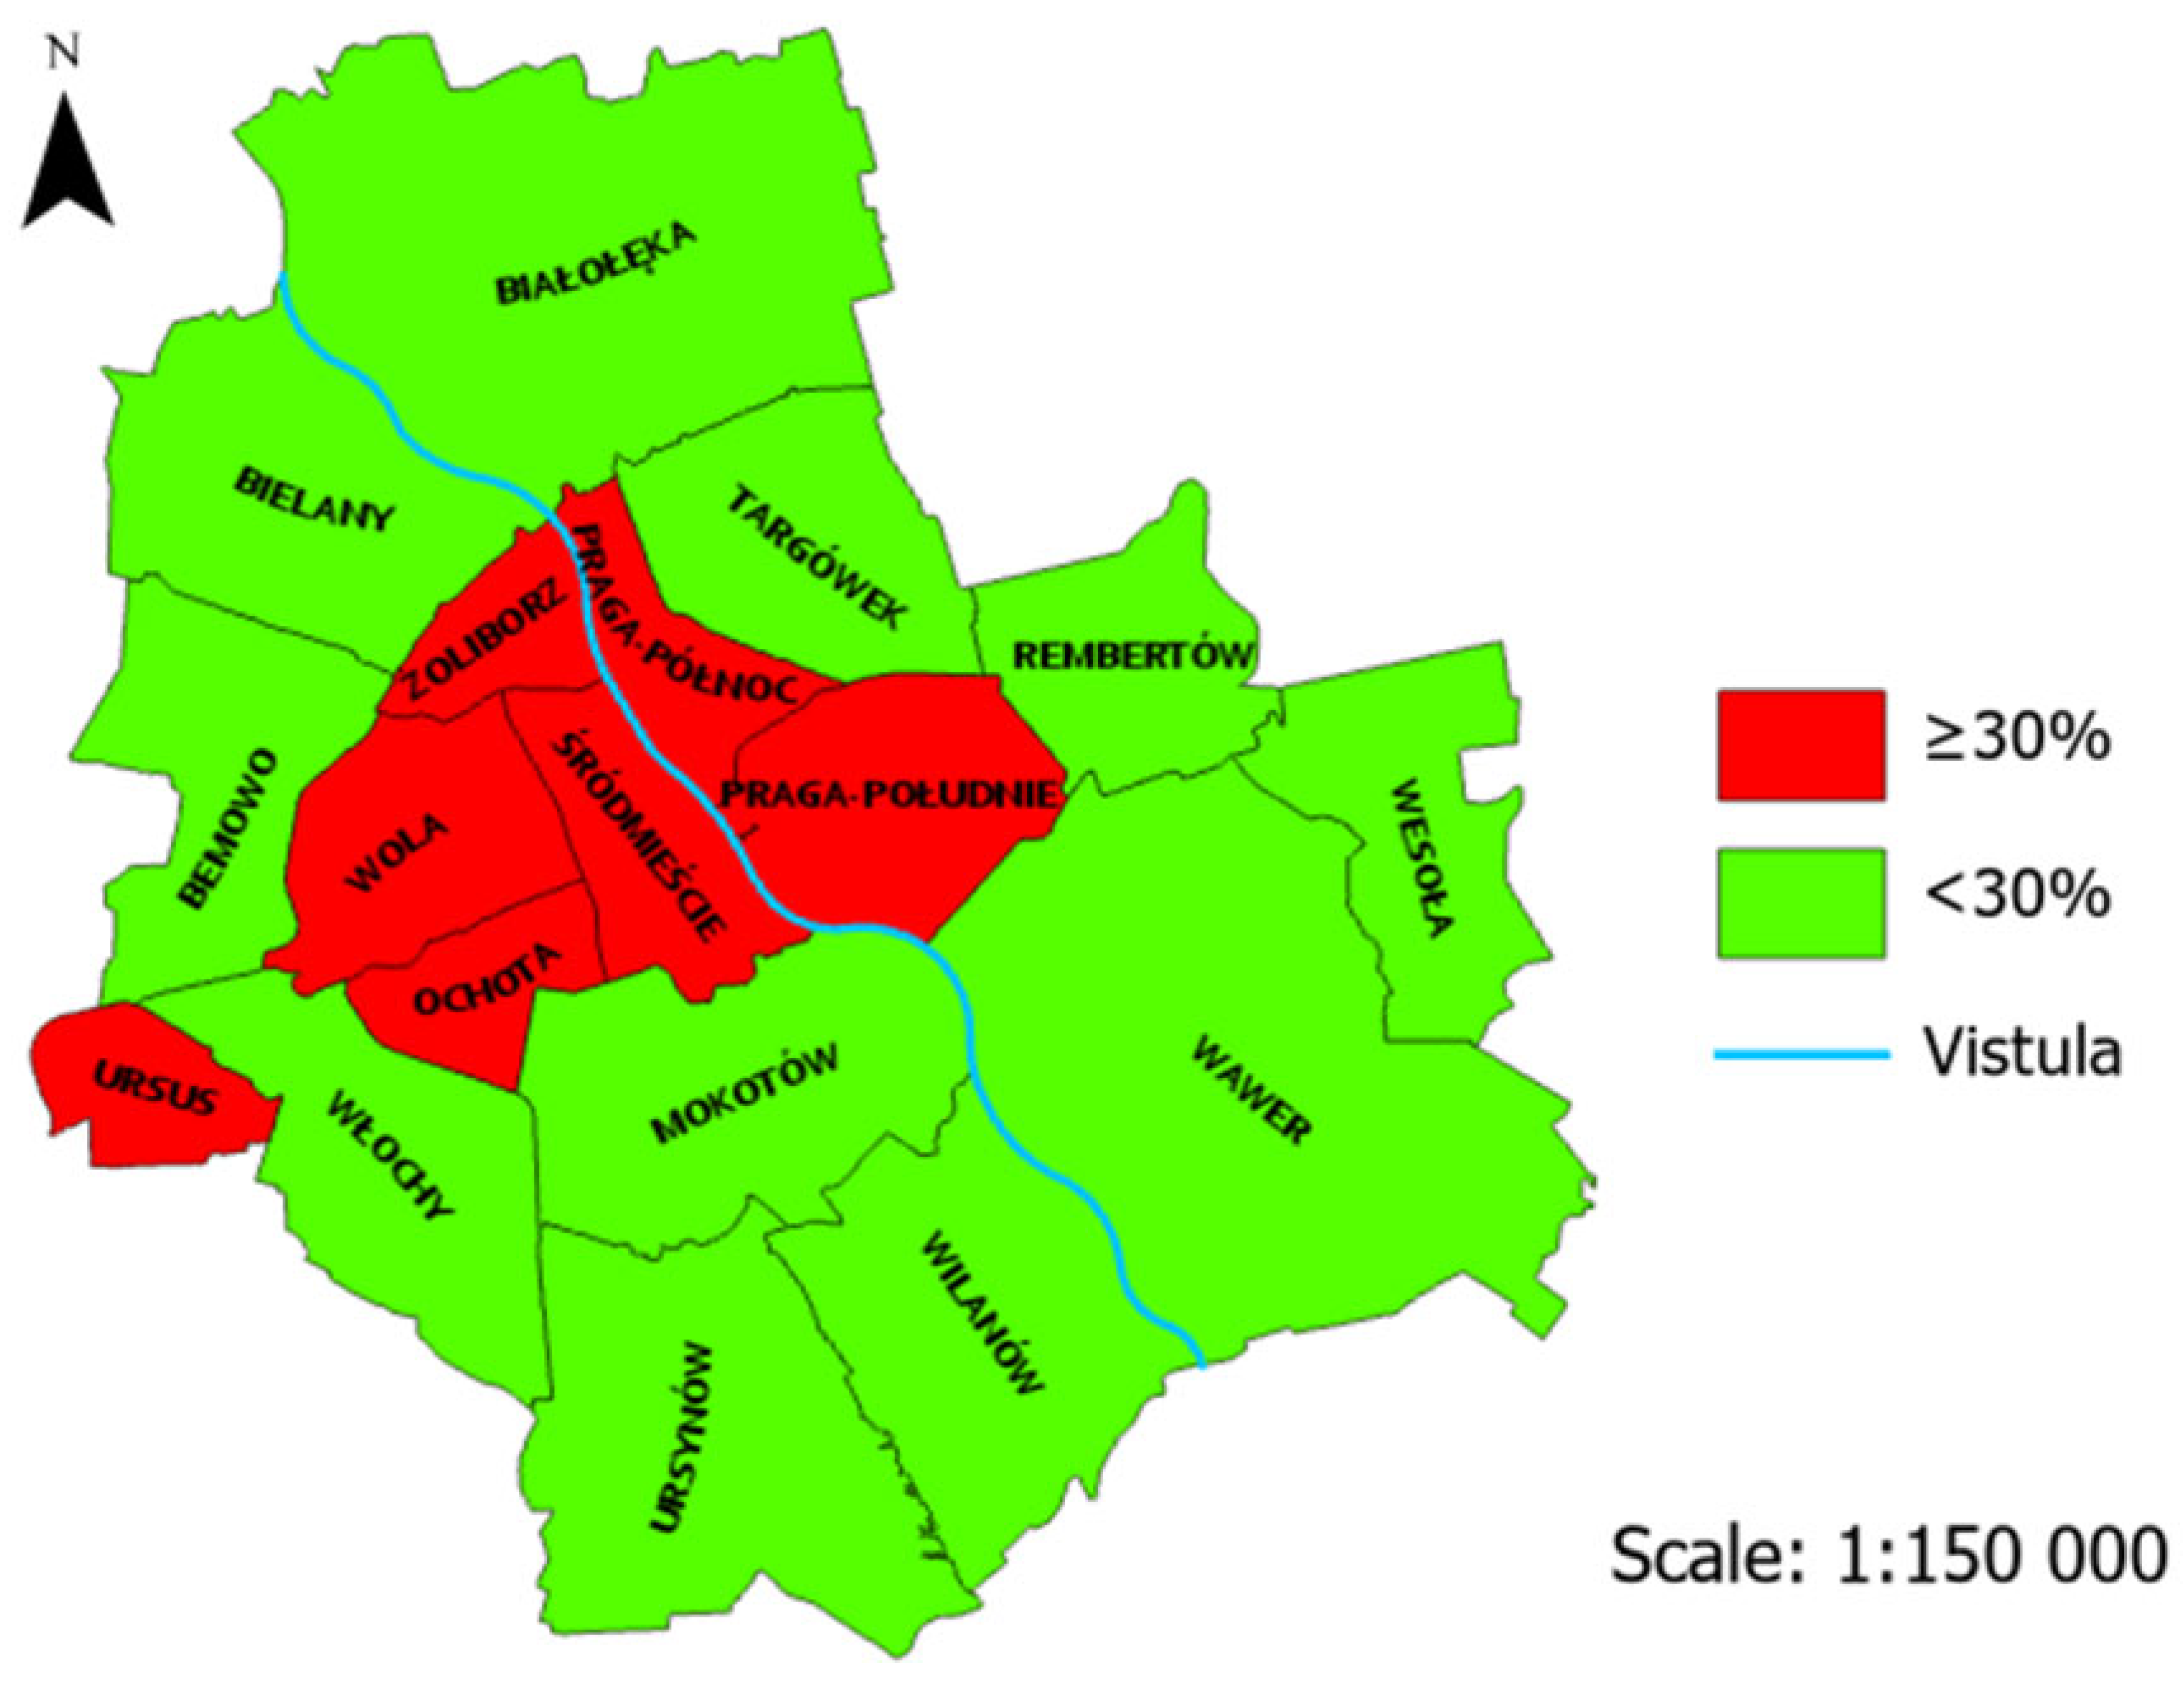
These results show how important it is to clarify what is meant by green areas, as this definition is crucial for meeting the criterion adopted in the 3-30-300 concept. The differences in the spatial distribution of the results can be seen perfectly in
Figure 6 and
Figure 7, where the results are presented on maps using the cartogram method.
Figure 6 shows the results of covering Warsaw's districts with forests and parks only. The red color in the cartogram represents districts that do not meet the condition of 30% coverage, meaning that there is not enough greenery in their area. The green color represents districts that meet the condition. The map shows that mainly peripheral districts, located in the eastern part of the city, have 30% or more of their area covered by parks or forests. These areas have suburban forests, which influences the result of the study. Bielany, located in the north-western part of Warsaw, also has a forest on its territory, the Bielany Forest, which influences the result. The remaining districts, including not only the central ones, do not reach the target threshold, indicating an insufficient amount of wooded green areas in most areas of the city.
Figure 7 shows the result of the analysis regarding the coverage of Warsaw's districts with all types of vegetation. In this case, only the districts that are located in the central part of the city, do not meet the set condition. The remaining districts meet the criterion of 30% greenery coverage. The exception is the Ursus district, which, despite including all forms of vegetation, does not reach the 30% level. The reason is similar to the analysis of the visibility of 3 trees. This was historically an industrial district, with a significant share of factory areas. Nowadays, these areas are being developed with dense housing, which unfortunately is not accompanied by the development of green areas.
3.3. Distance of 300m to the Park
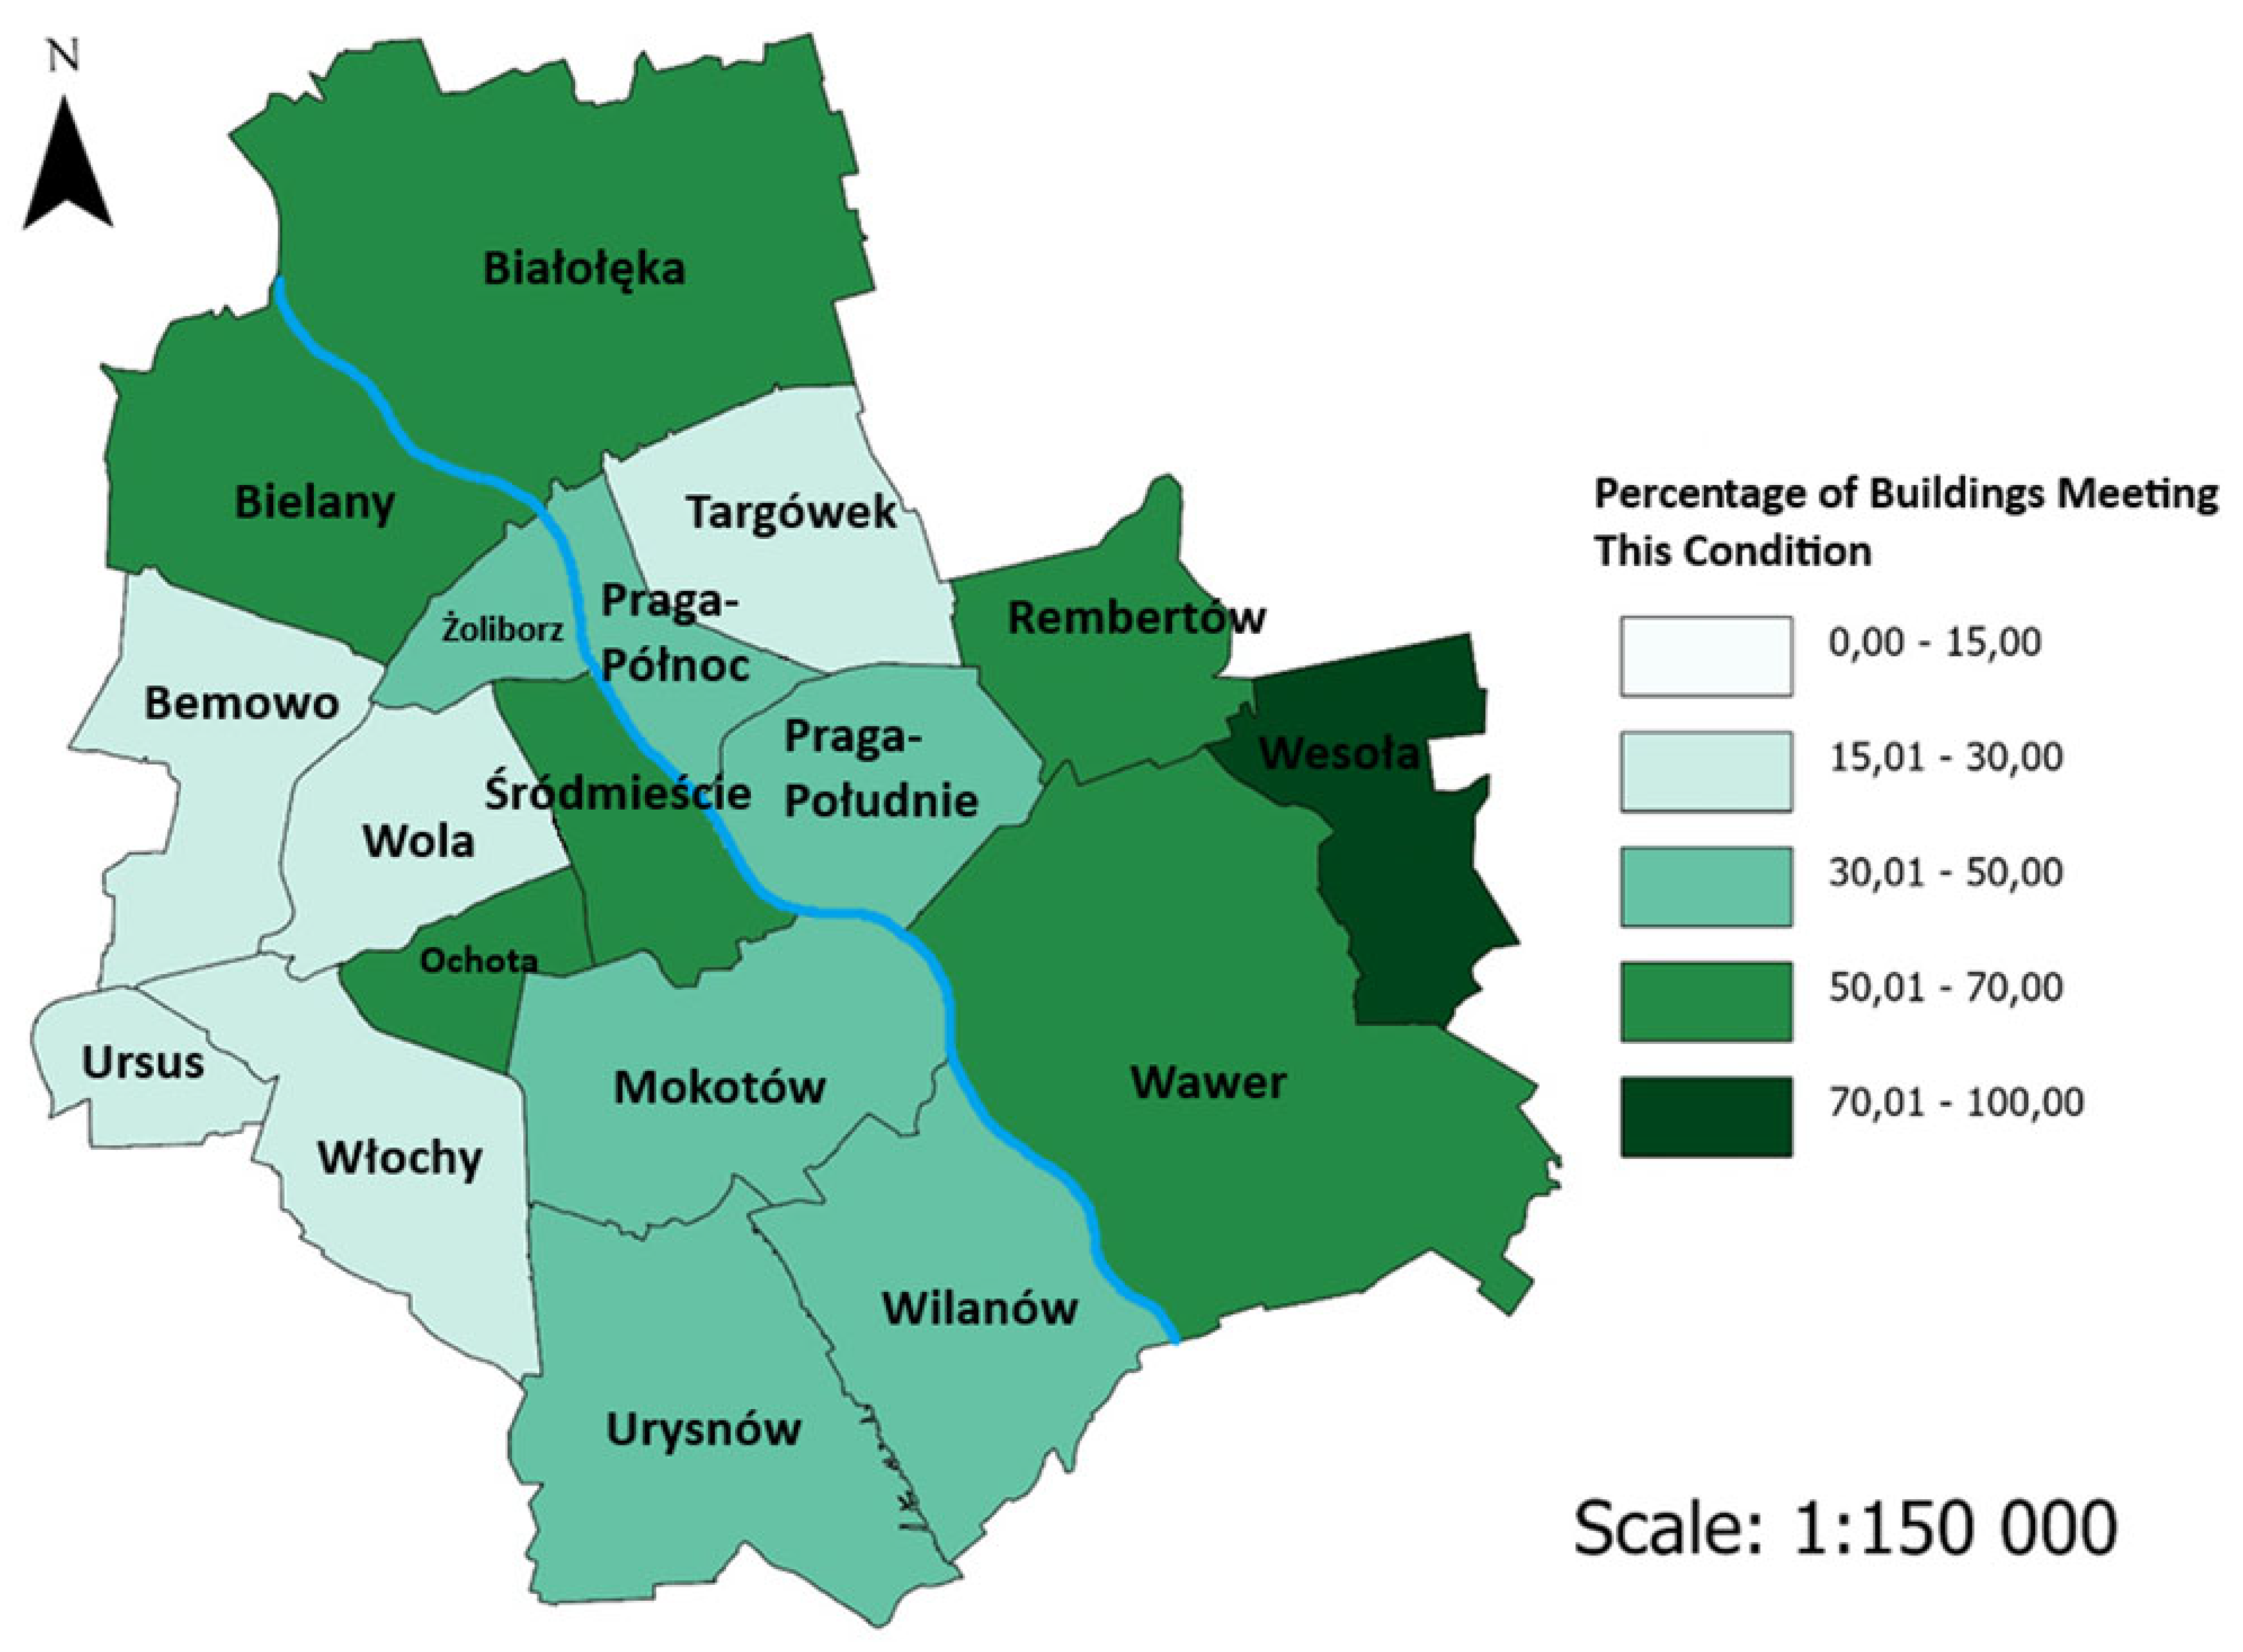
The percentage of buildings that are within 300 meters from a park or forest is shown in
Figure 8. Unfortunately, there are more buildings in Warsaw that do not meet this condition. Only about 45% of buildings are located no more than 300 meters from a park or forest.
Figure 9 shows the spatial distribution of buildings that are within 300 meters from the nearest park or forest. The map shows that the best situation (over 50% of buildings) is in districts located in the north (Bielany, Białołęka) and east of the city (Rembertów, Wawer, and Wesoła). What may seem surprising, this group of districts also includes central districts - Ochota and Śródmieście. This is probably due to the fact that these districts have several large parks, such as Łazienkowski Park, Saski Garden or Szczęśliwicki Park. In the Wesoła district, more than 70% of the buildings meet this condition.
It is also worth noting that on the western side of the Vistula there are as many as four districts (Bemowo, Wola, Ursus, and Włochy) where only 15 to 30% of buildings meet the condition, while on the eastern bank of the Vistula there is only one such district (Targówek).
3.4. Visibility of 3 Trees and 300m Distance to Park
Analyzing the individual criteria, one might get the impression that Warsaw is a fairly green city and that the inhabitants of significant areas of the city have fairly good access to various forms of nature. However, the situation seems a little more complicated when the conditions of the adopted concept are analyzed together.
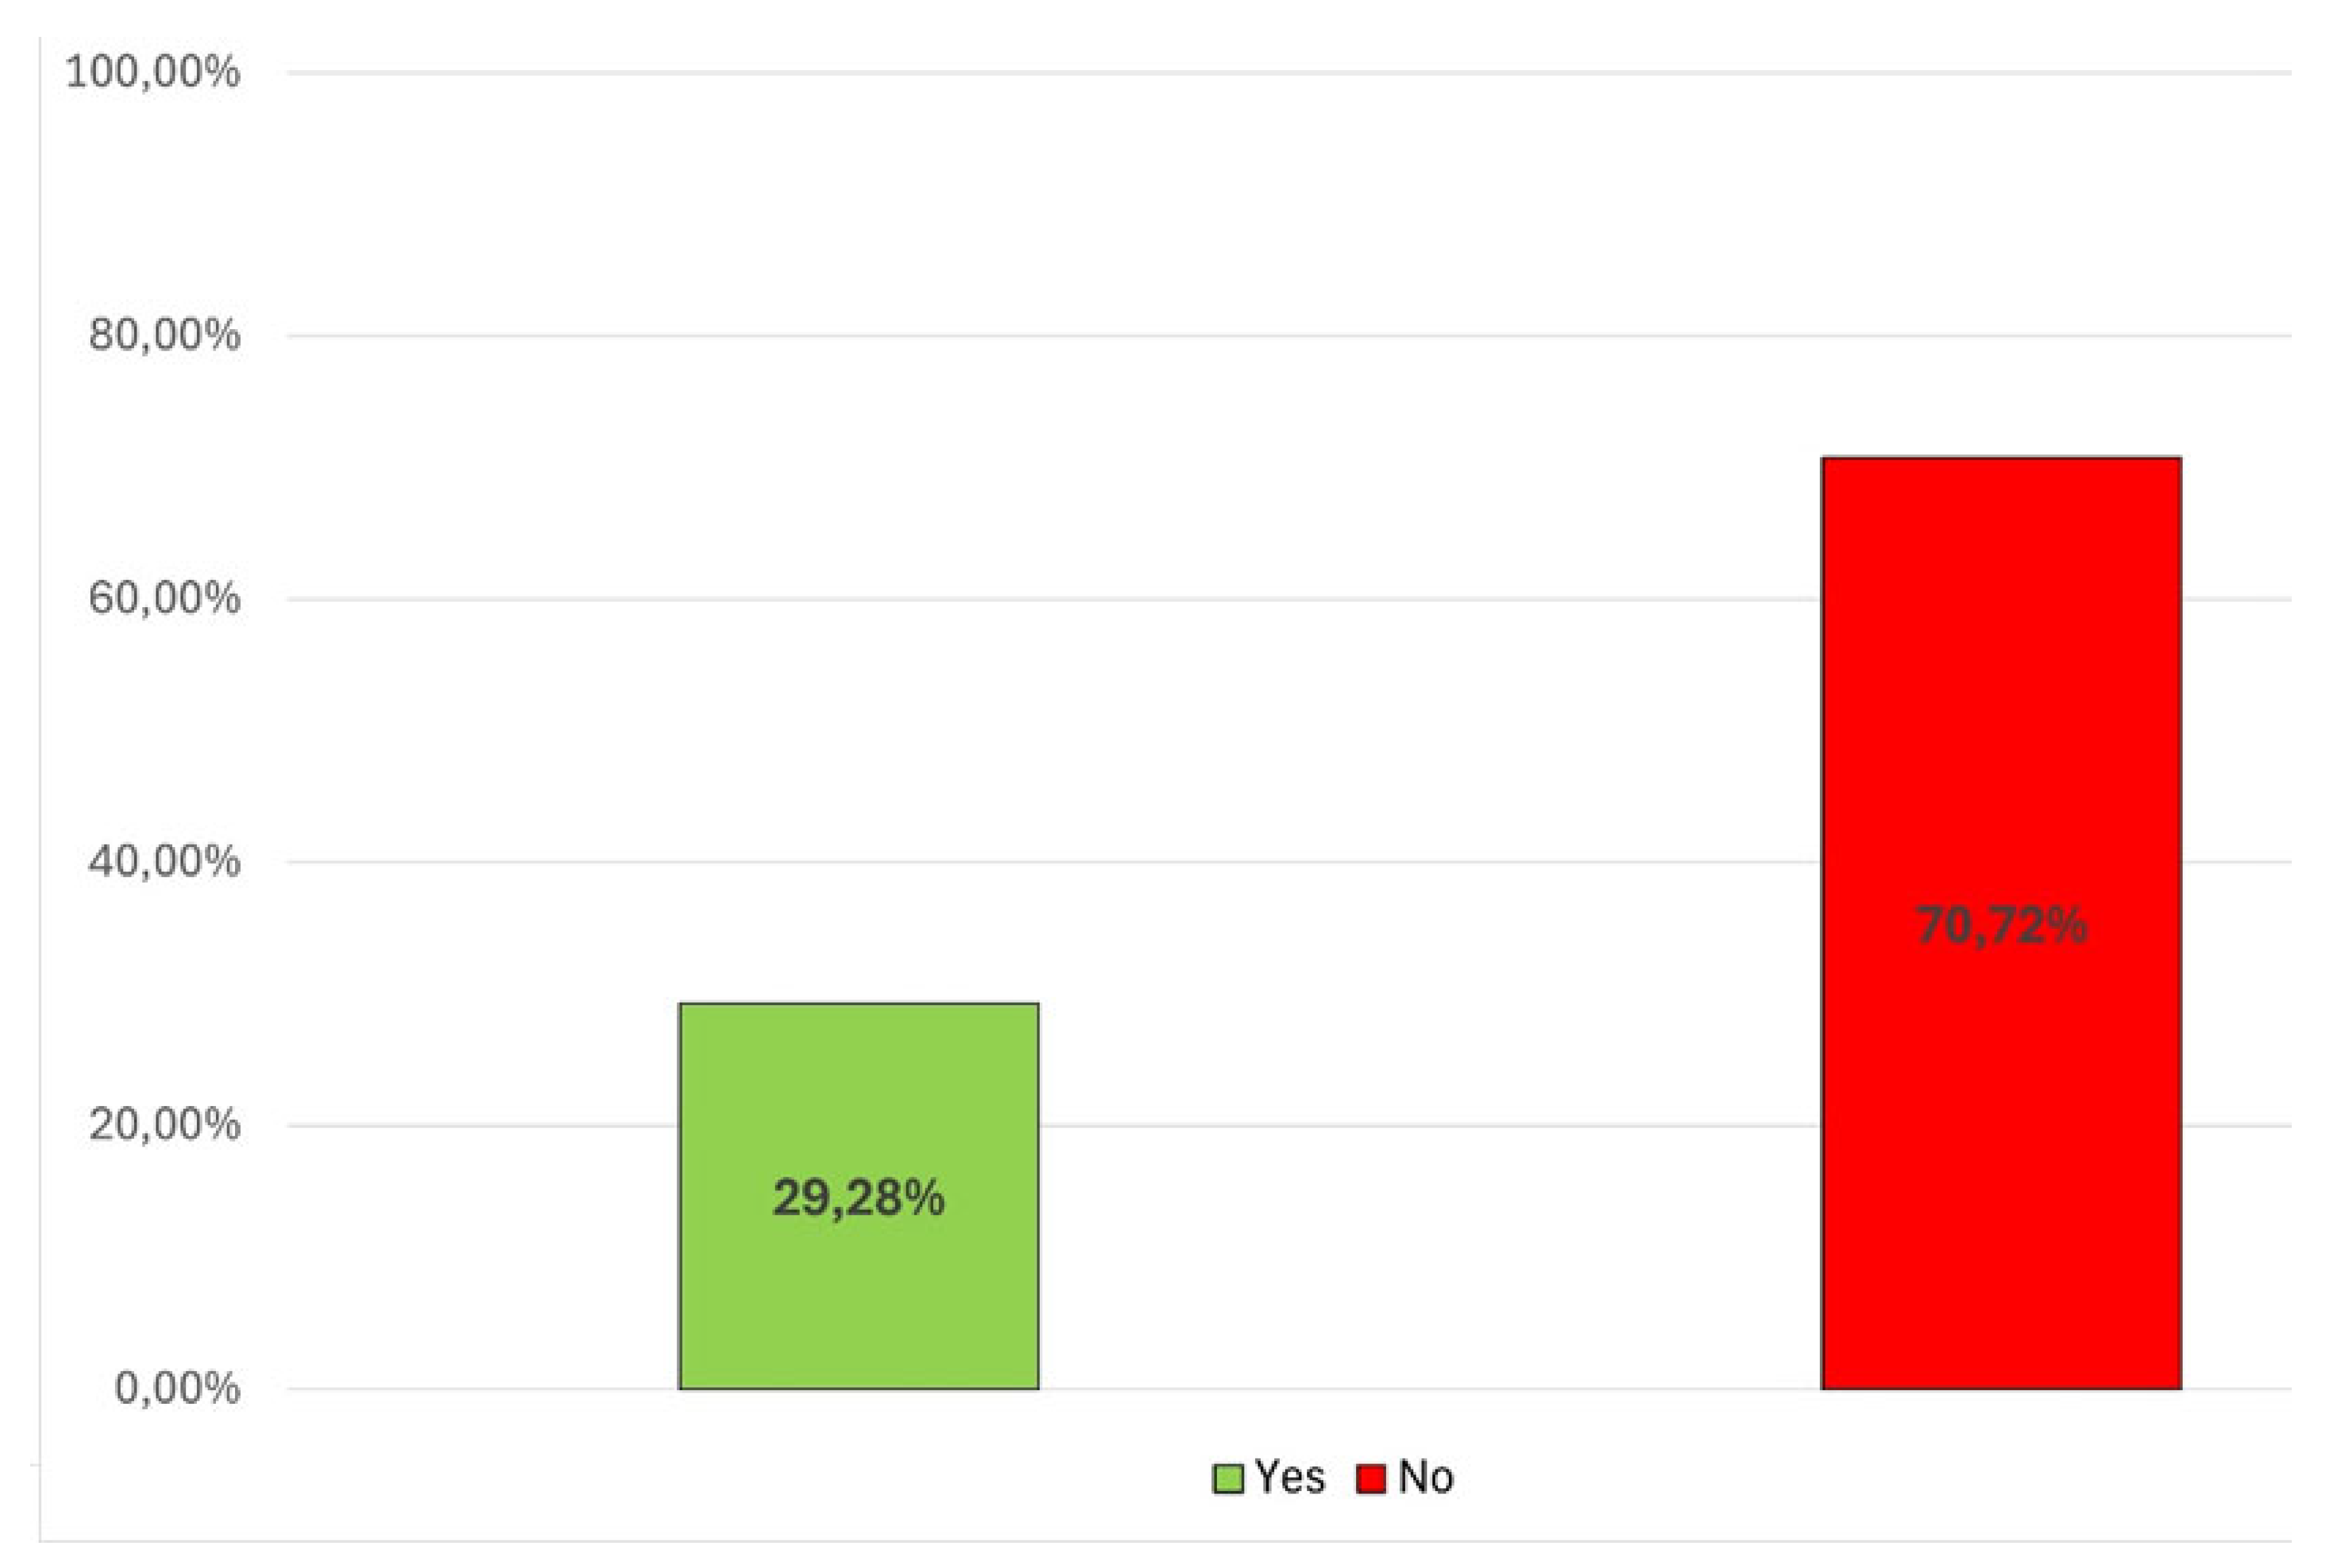
Figure 10 shows the percentage of buildings with 100 percent visibility of 3 trees and at the same time located at a maximum distance of 300 meters from the nearest forest or park. In this case, almost 71 per cent of buildings in the city do not meet these two criteria at the same time.
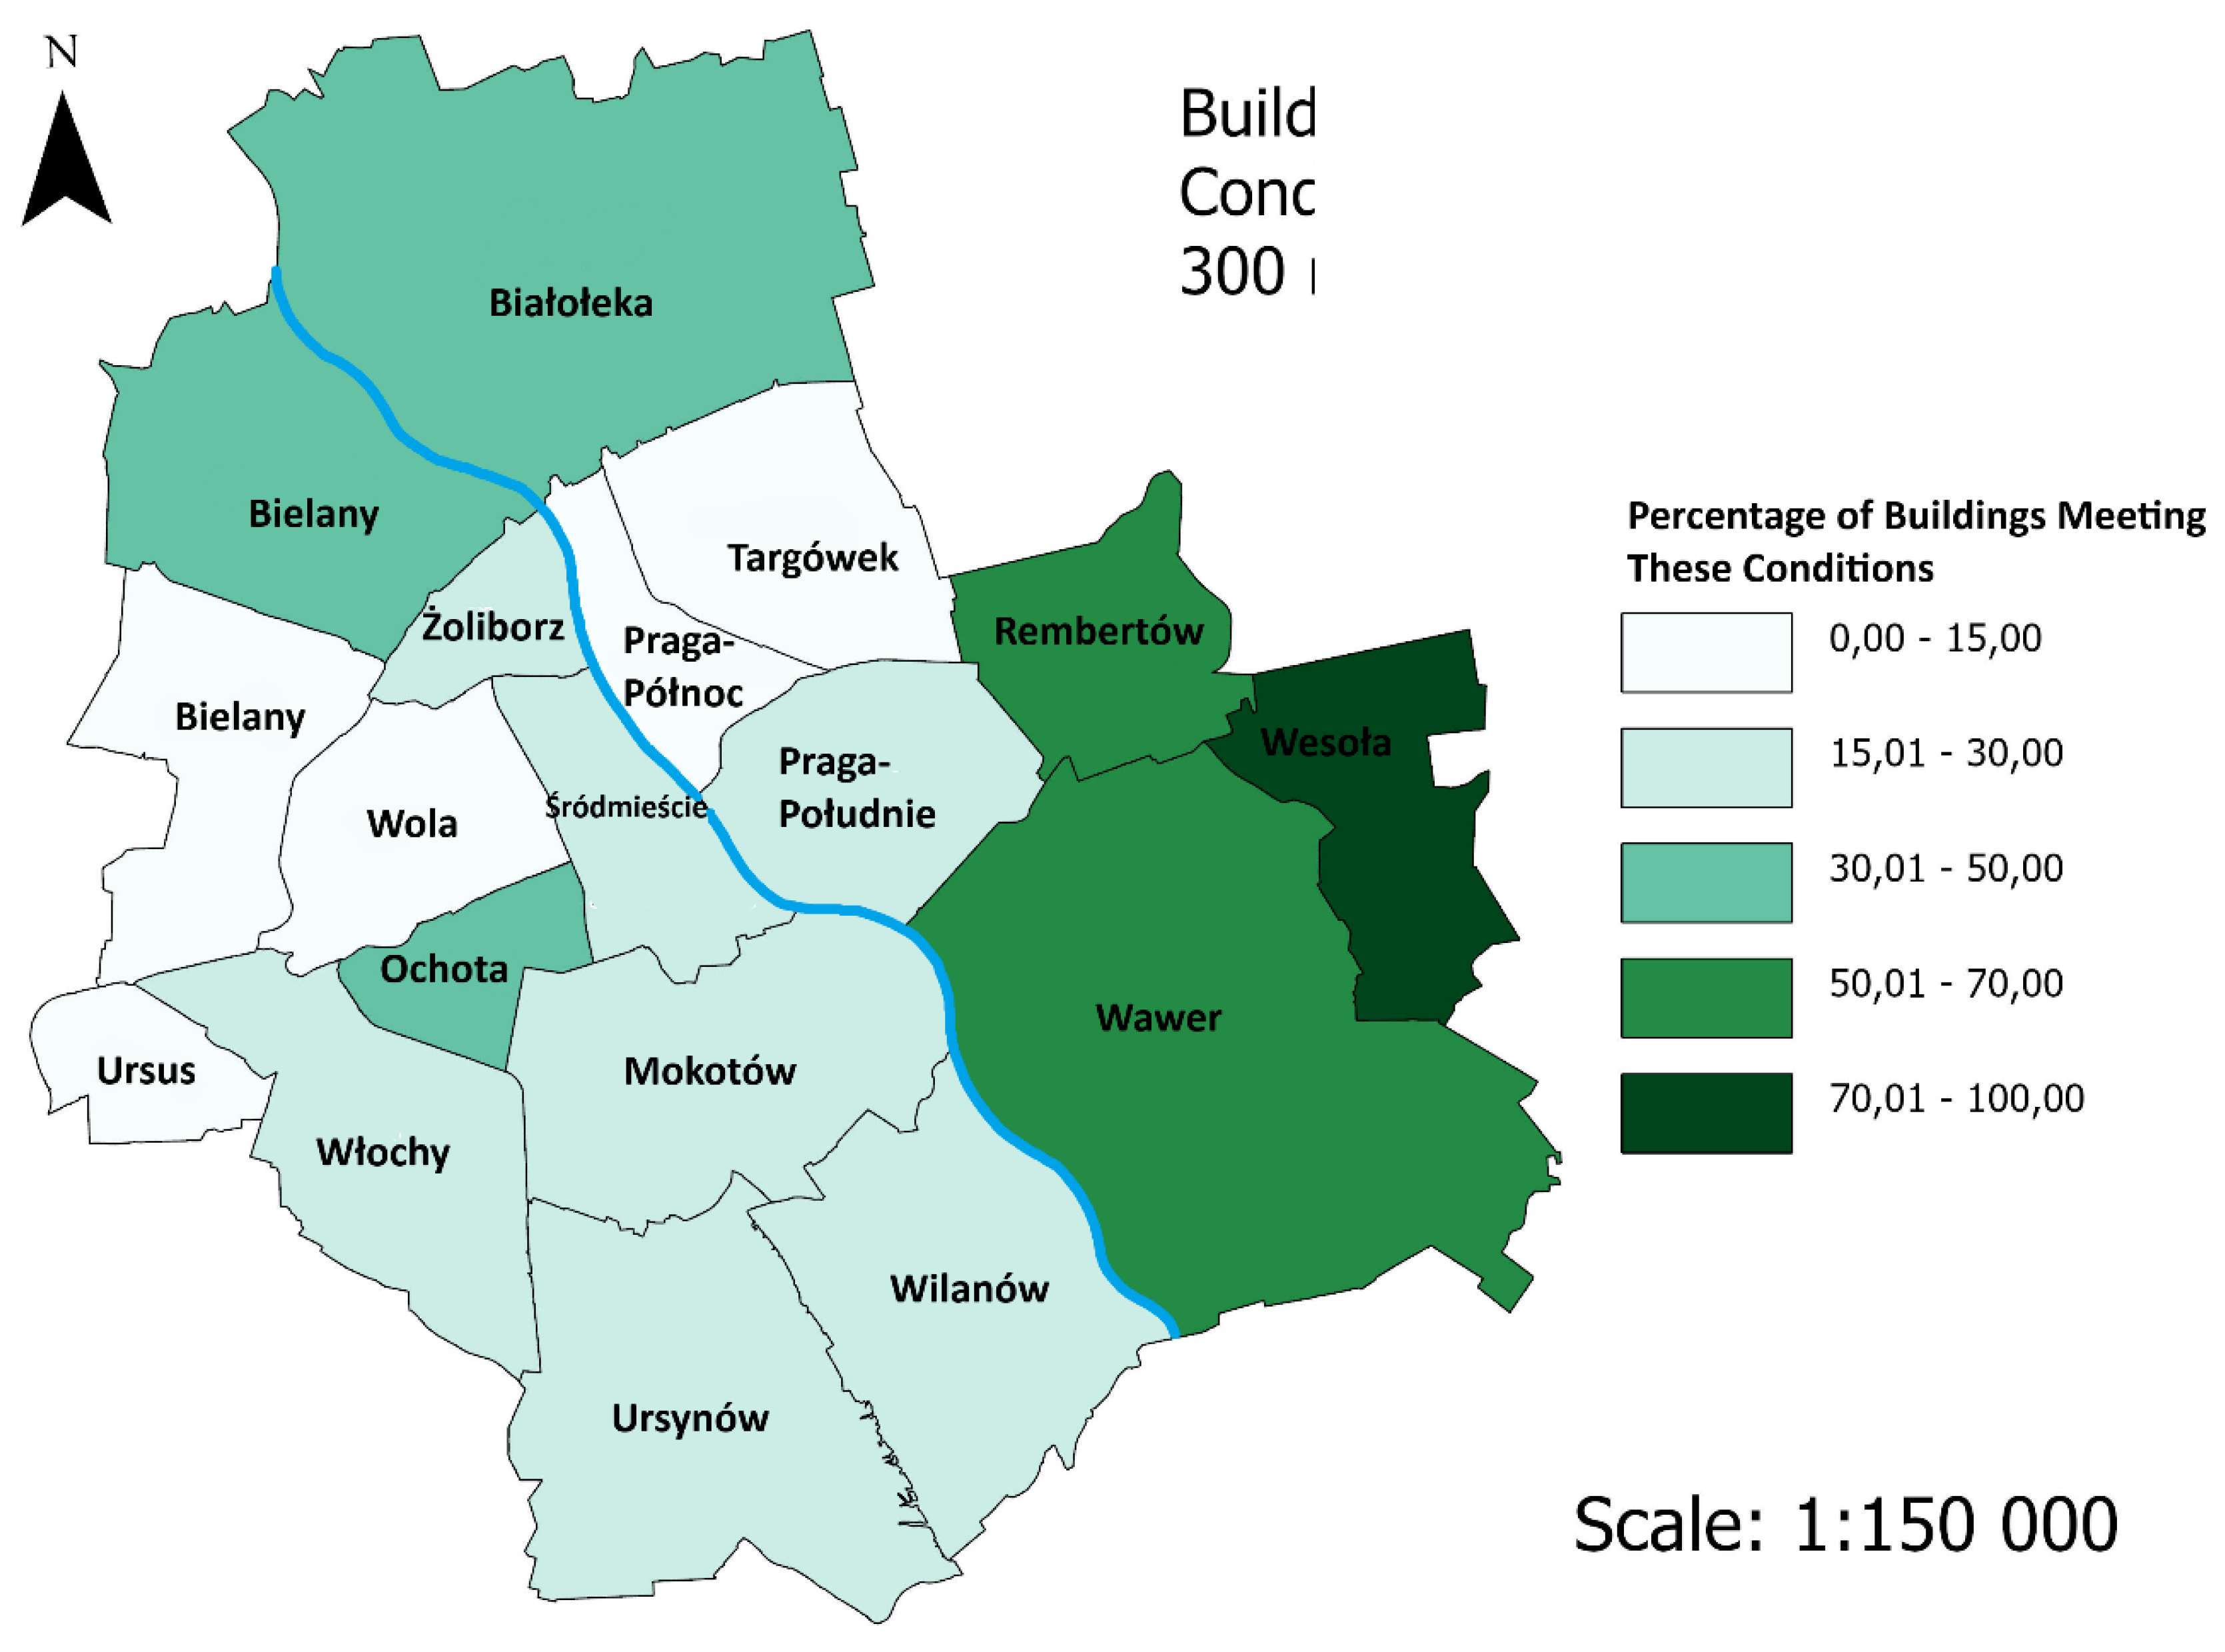
The spatial distribution of buildings meeting the two conditions is presented in
Figure 11. The cartogram shows that five districts - three on the western side of the Vistula (Bemowo, Wola, and Ursus) and two on the eastern side (Targówek, Praga Północ) have a very low percentage of buildings that meet the two criteria together - less than 15%. The highest percentage of buildings meeting both conditions at the same time is in the Wesoła district, located in the south-east of the city, again above 70%. Most districts have between 15 and 30% of buildings meeting the two criteria together.
3.5. Three Conditions of the Concept
The designation of buildings that meet the total of all three given criteria of the 3-30-300 concept was determined in two variants: for all green areas and for park and forest areas only.
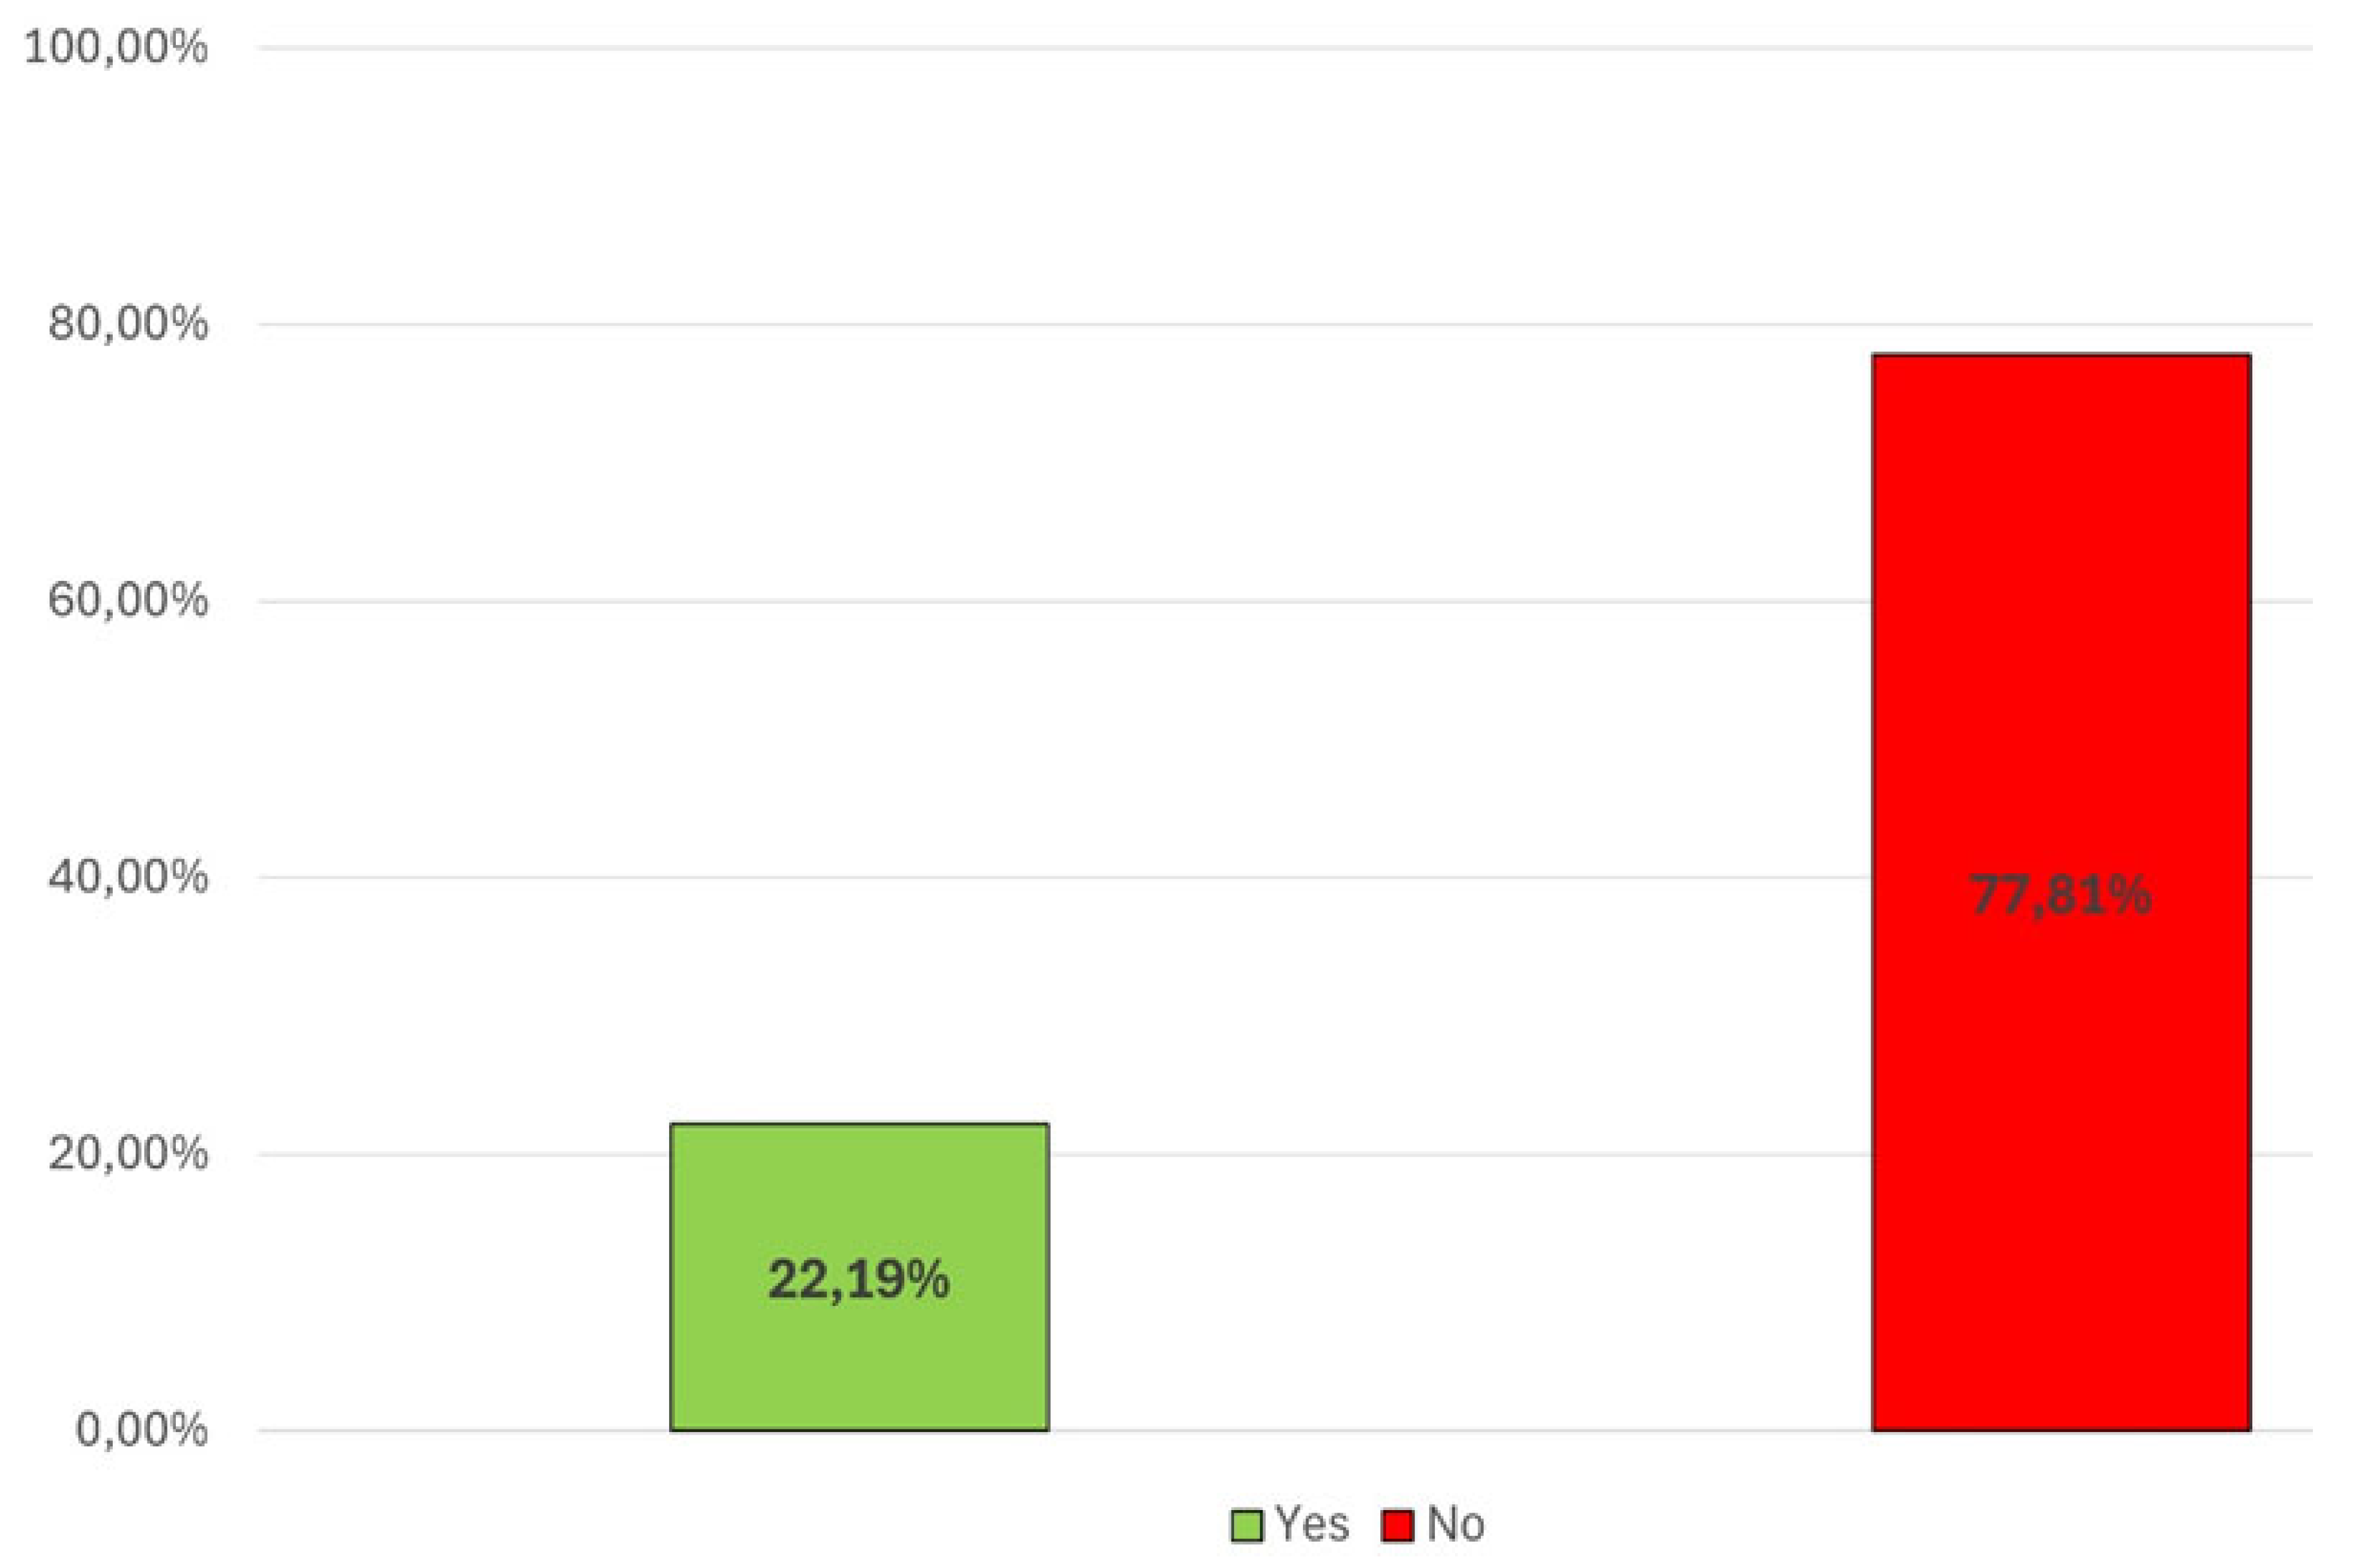
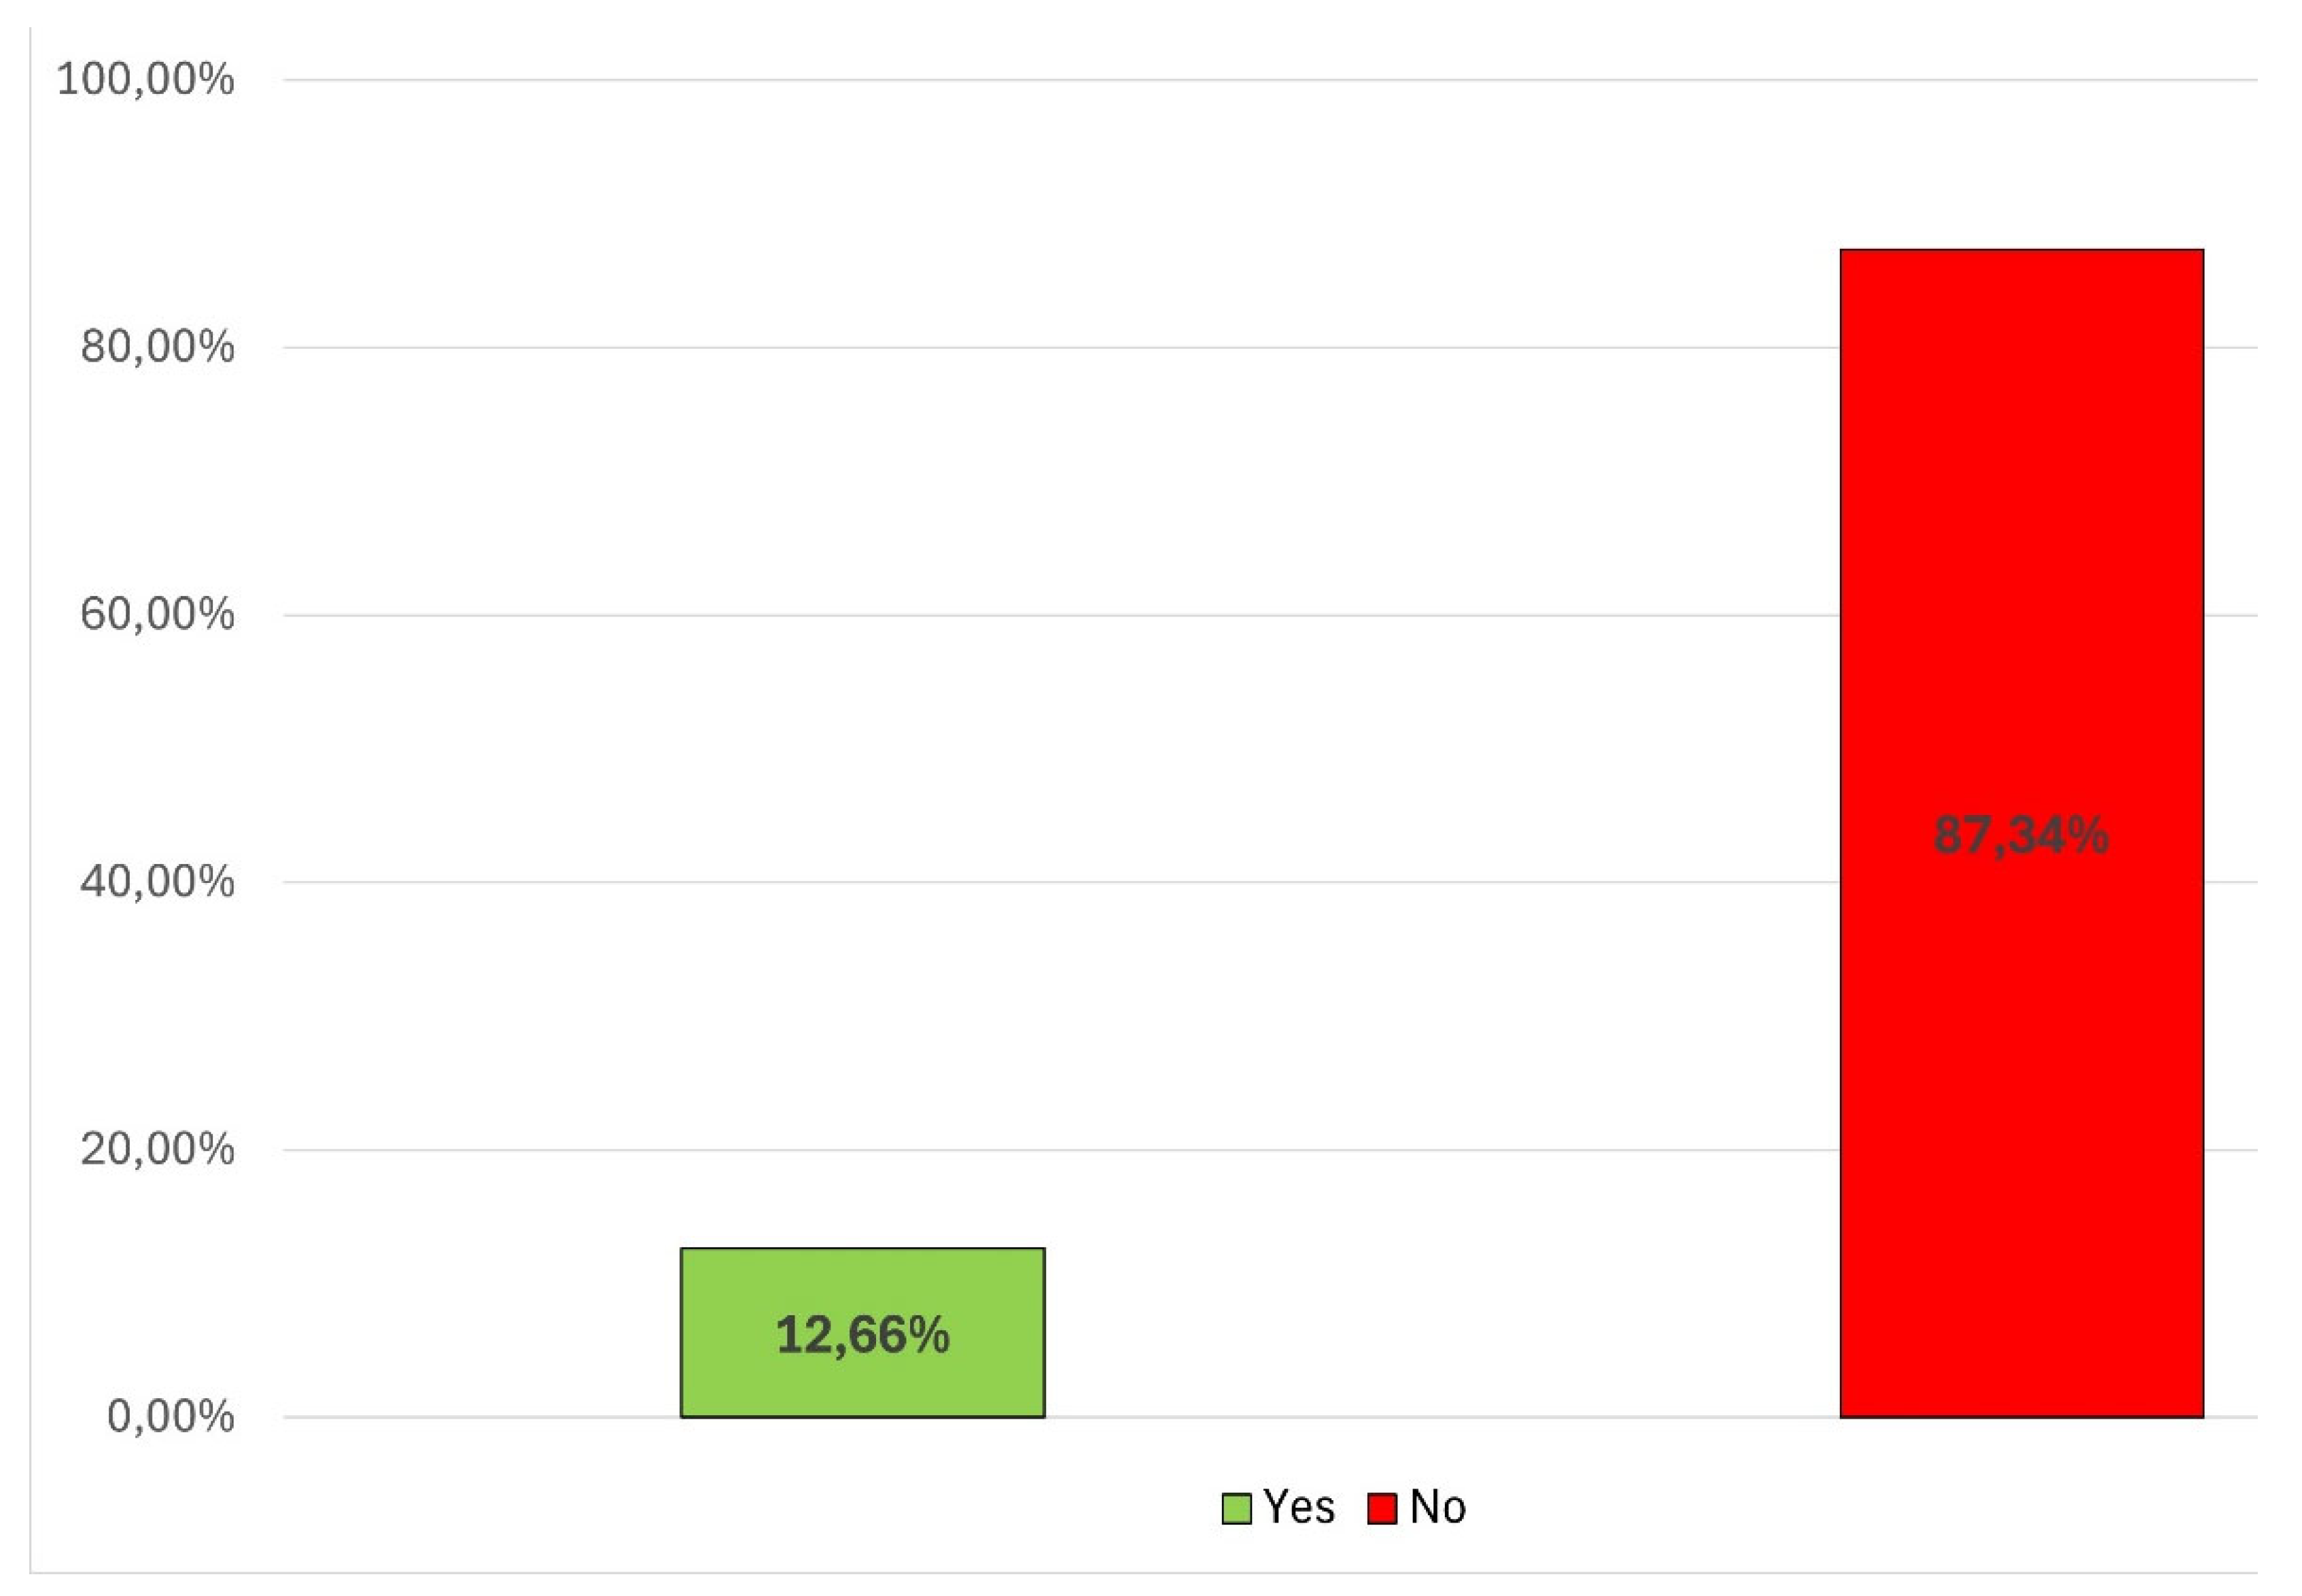
Figure 12 shows the percentage of buildings in Warsaw that meet all three conditions for a green city, taking into account all green areas. The chart shows that just over 22% of buildings in the Polish capital meet all the assumptions, while as many as 78% of buildings do not. The situation is even worse when only forest and park areas are taken into account. Here, the percentage of buildings that meet all three criteria falls to only 12.66% (
Figure 13), making it possible to conclude that practically only one in 10 buildings in Warsaw meets the criteria of the 3-30-300 concept.
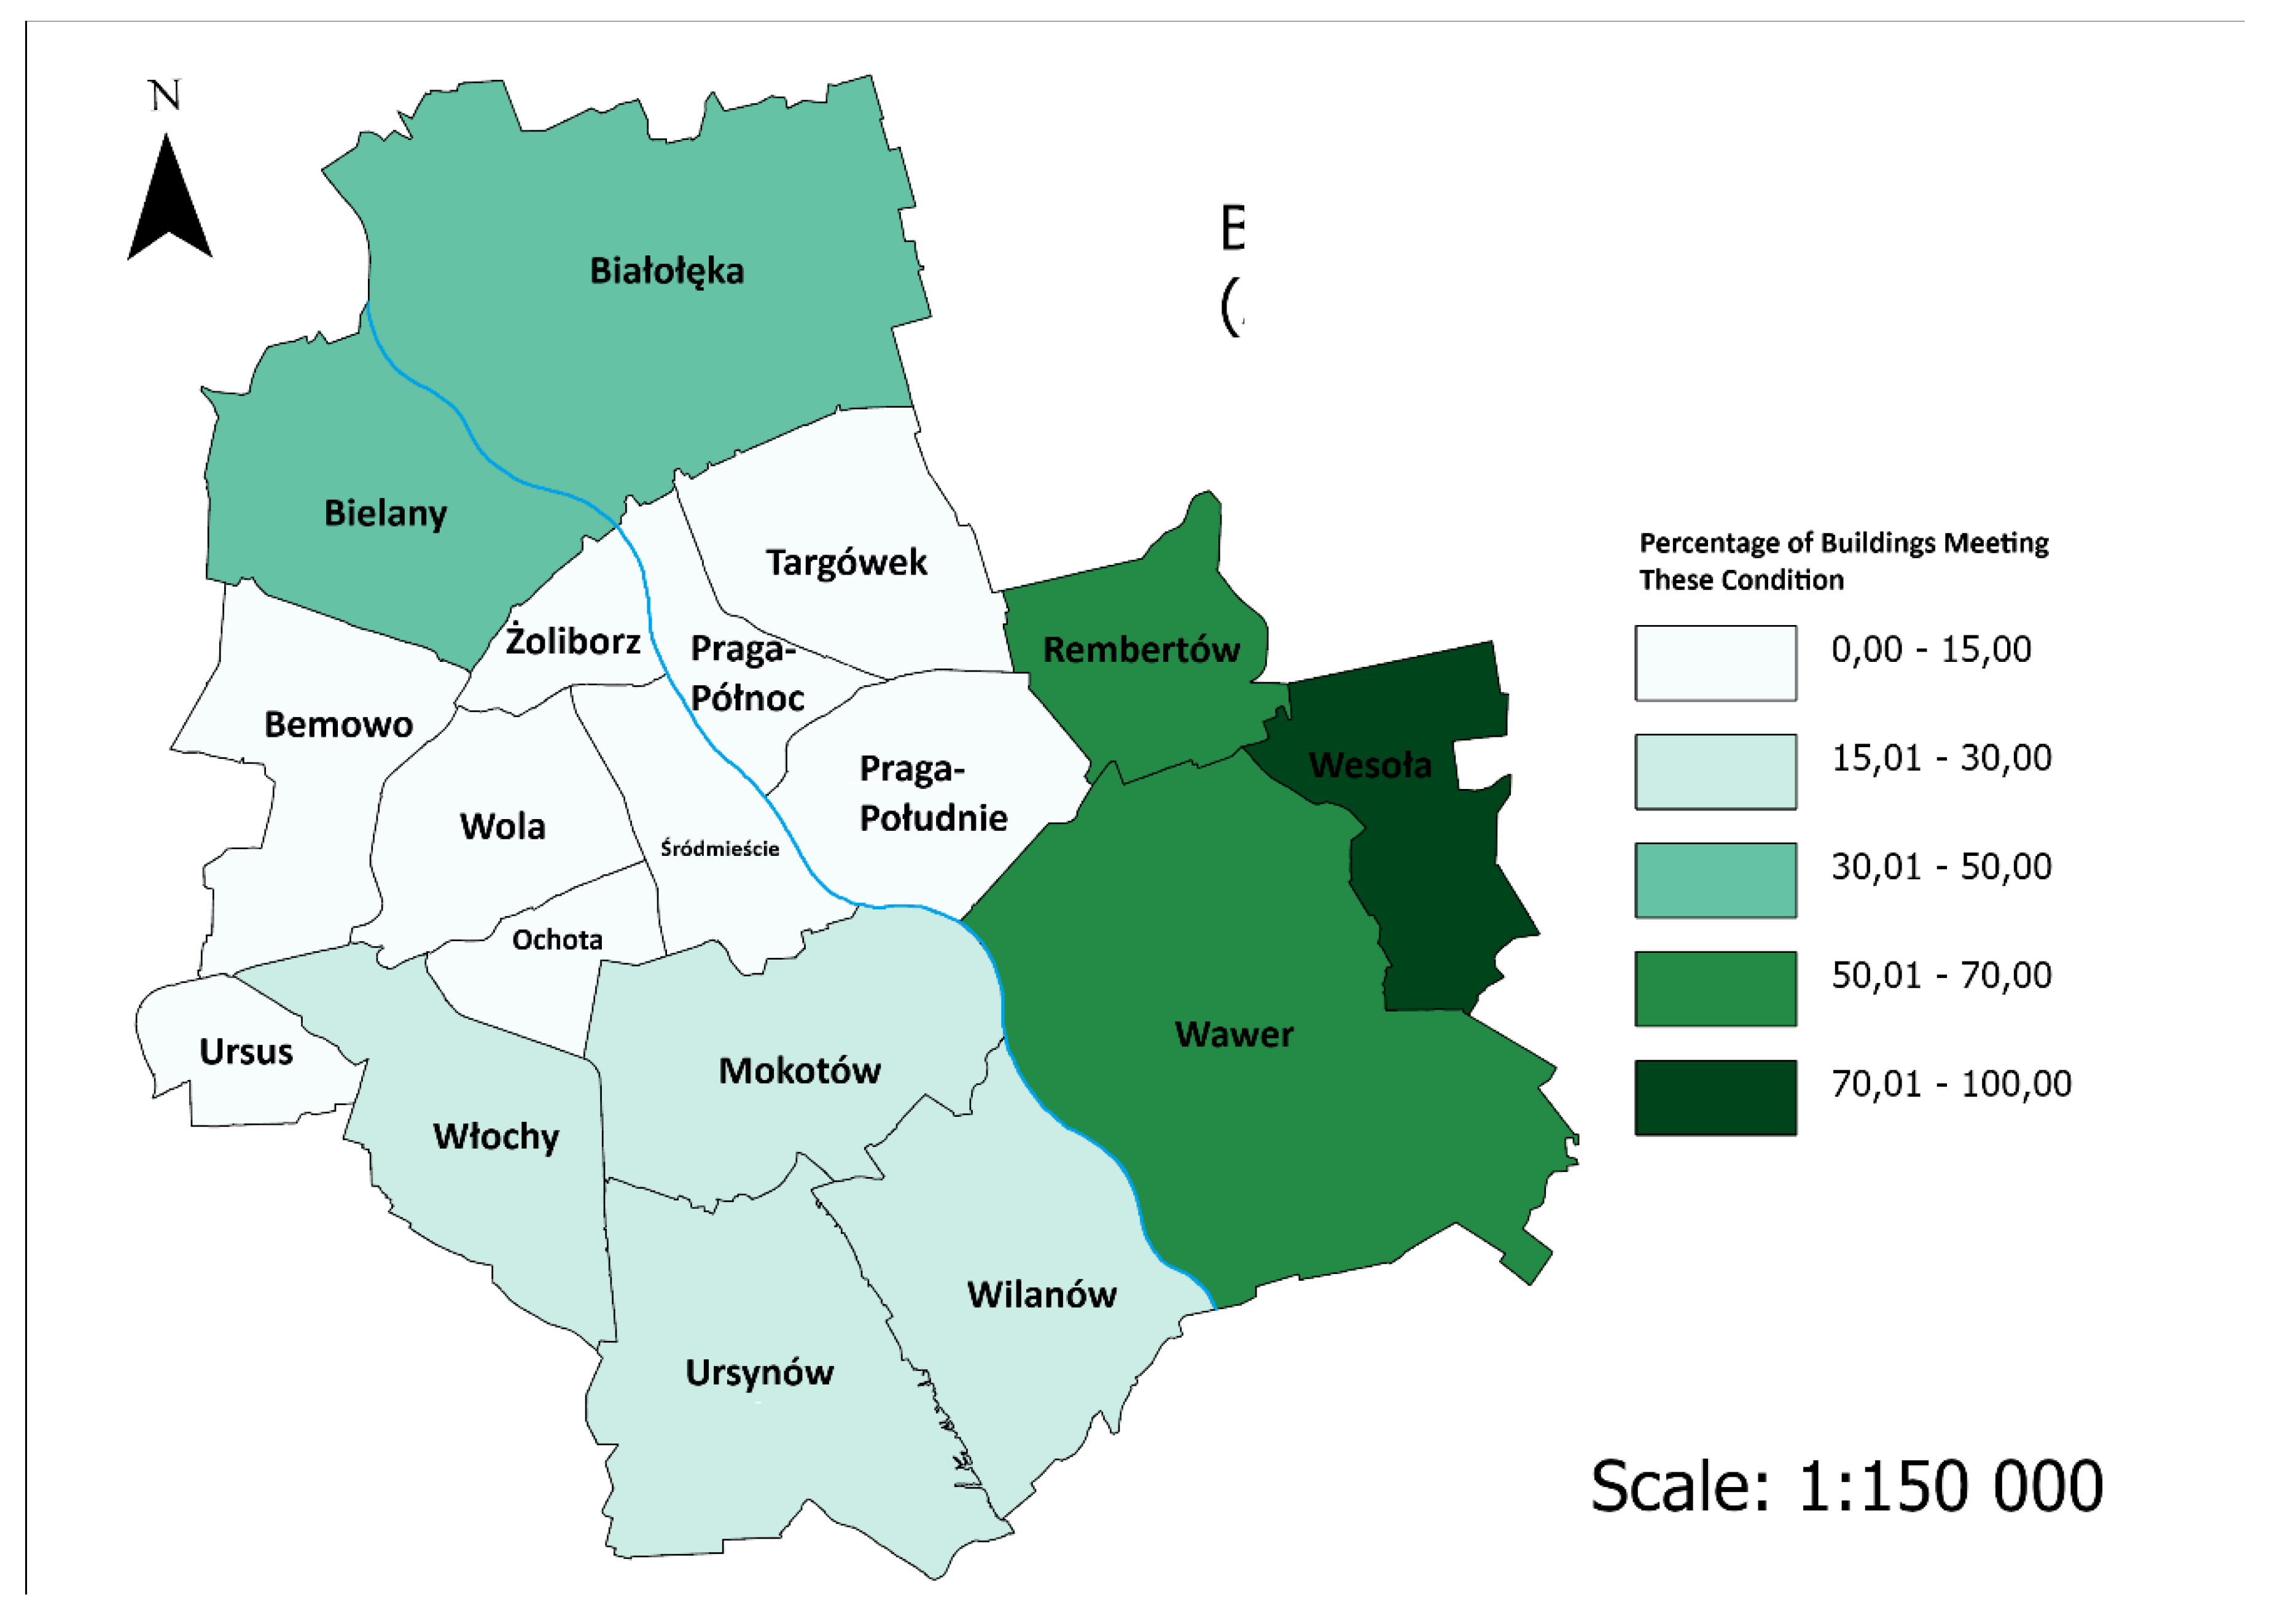
The spatial distribution of districts with the highest percentage of buildings meeting the three conditions of the concept is shown in
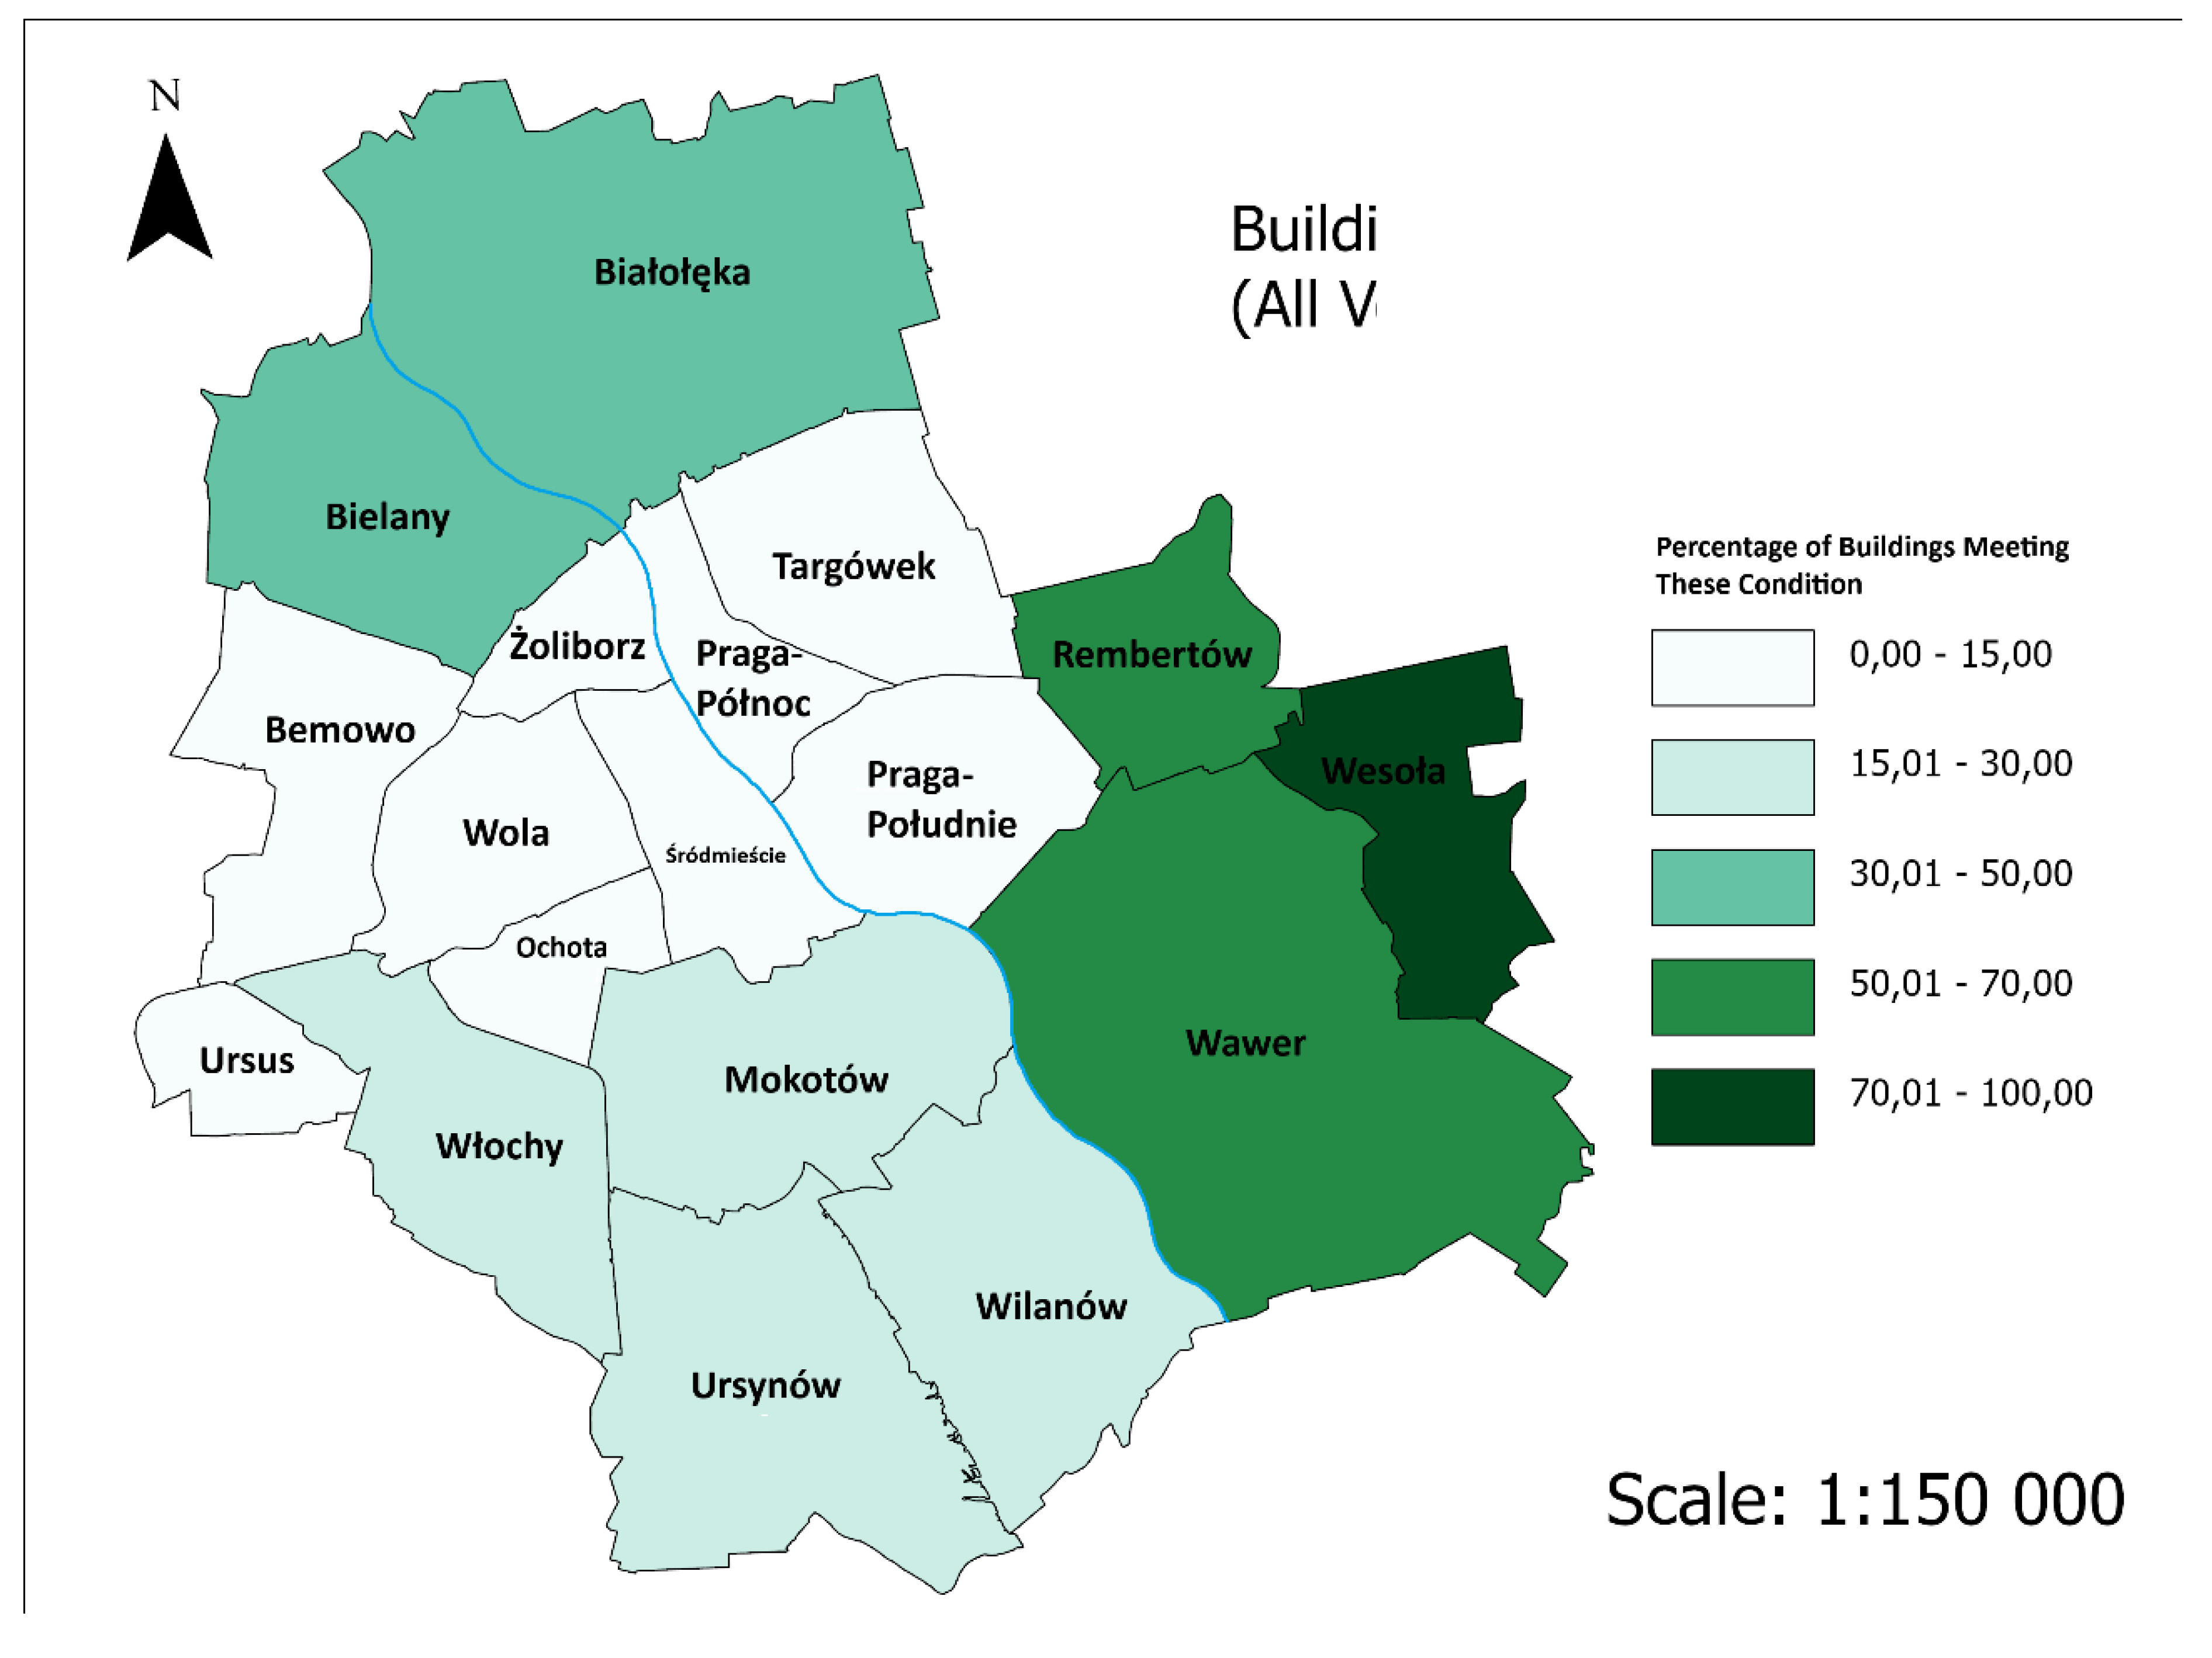
Figures 14 (all green areas) and 15 (only forests and parks).
Figure 14 shows that only a few districts in the northern and eastern parts of the city have more than 30% of buildings meeting all three conditions. The closer to the center, the lower the percentage of such buildings, mostly ranging between 0 and 15%. It is worth noting that half of the districts have more than 15% of buildings meeting the three criteria, while the other half fall between 0 and 15%. The districts with the lowest values are usually the oldest ones in Warsaw.
The situation taking into account only parks and forests is even worse.
Figure 15 shows that most districts have a negligible proportion of buildings meeting these criteria (between 0 and 15%). Only four districts - Bielany, Rembertów, Wesoła, and Wawer - have a higher percentage of buildings that meet all three conditions. The values here range from 15% to 100%. Interestingly, three of the districts - Rembertów, Wesoła, and Wawer - have a percentage of over 50% of buildings meeting the set conditions. Again, Wawer is dominant here with over 70% of buildings meeting the 3-30-300 concept. The districts with the best results are the peripheral districts, which were the latest to be incorporated into the city. They are dominated by single-family housing and have a number of home gardens and forests.
Figure 12.
Buildings that meet all 3 conditions combined (All greenery).
Figure 12.
Buildings that meet all 3 conditions combined (All greenery).
Figure 13.
Buildings that meet all conditions (only trees considered).
Figure 13.
Buildings that meet all conditions (only trees considered).
Figure 14.
Buildings that meet all 3 conditions (all greenery).
Figure 14.
Buildings that meet all 3 conditions (all greenery).
Figure 15.
Buildings that meet all 3 conditions (all greenery).
Figure 15.
Buildings that meet all 3 conditions (all greenery).
4. Discussion
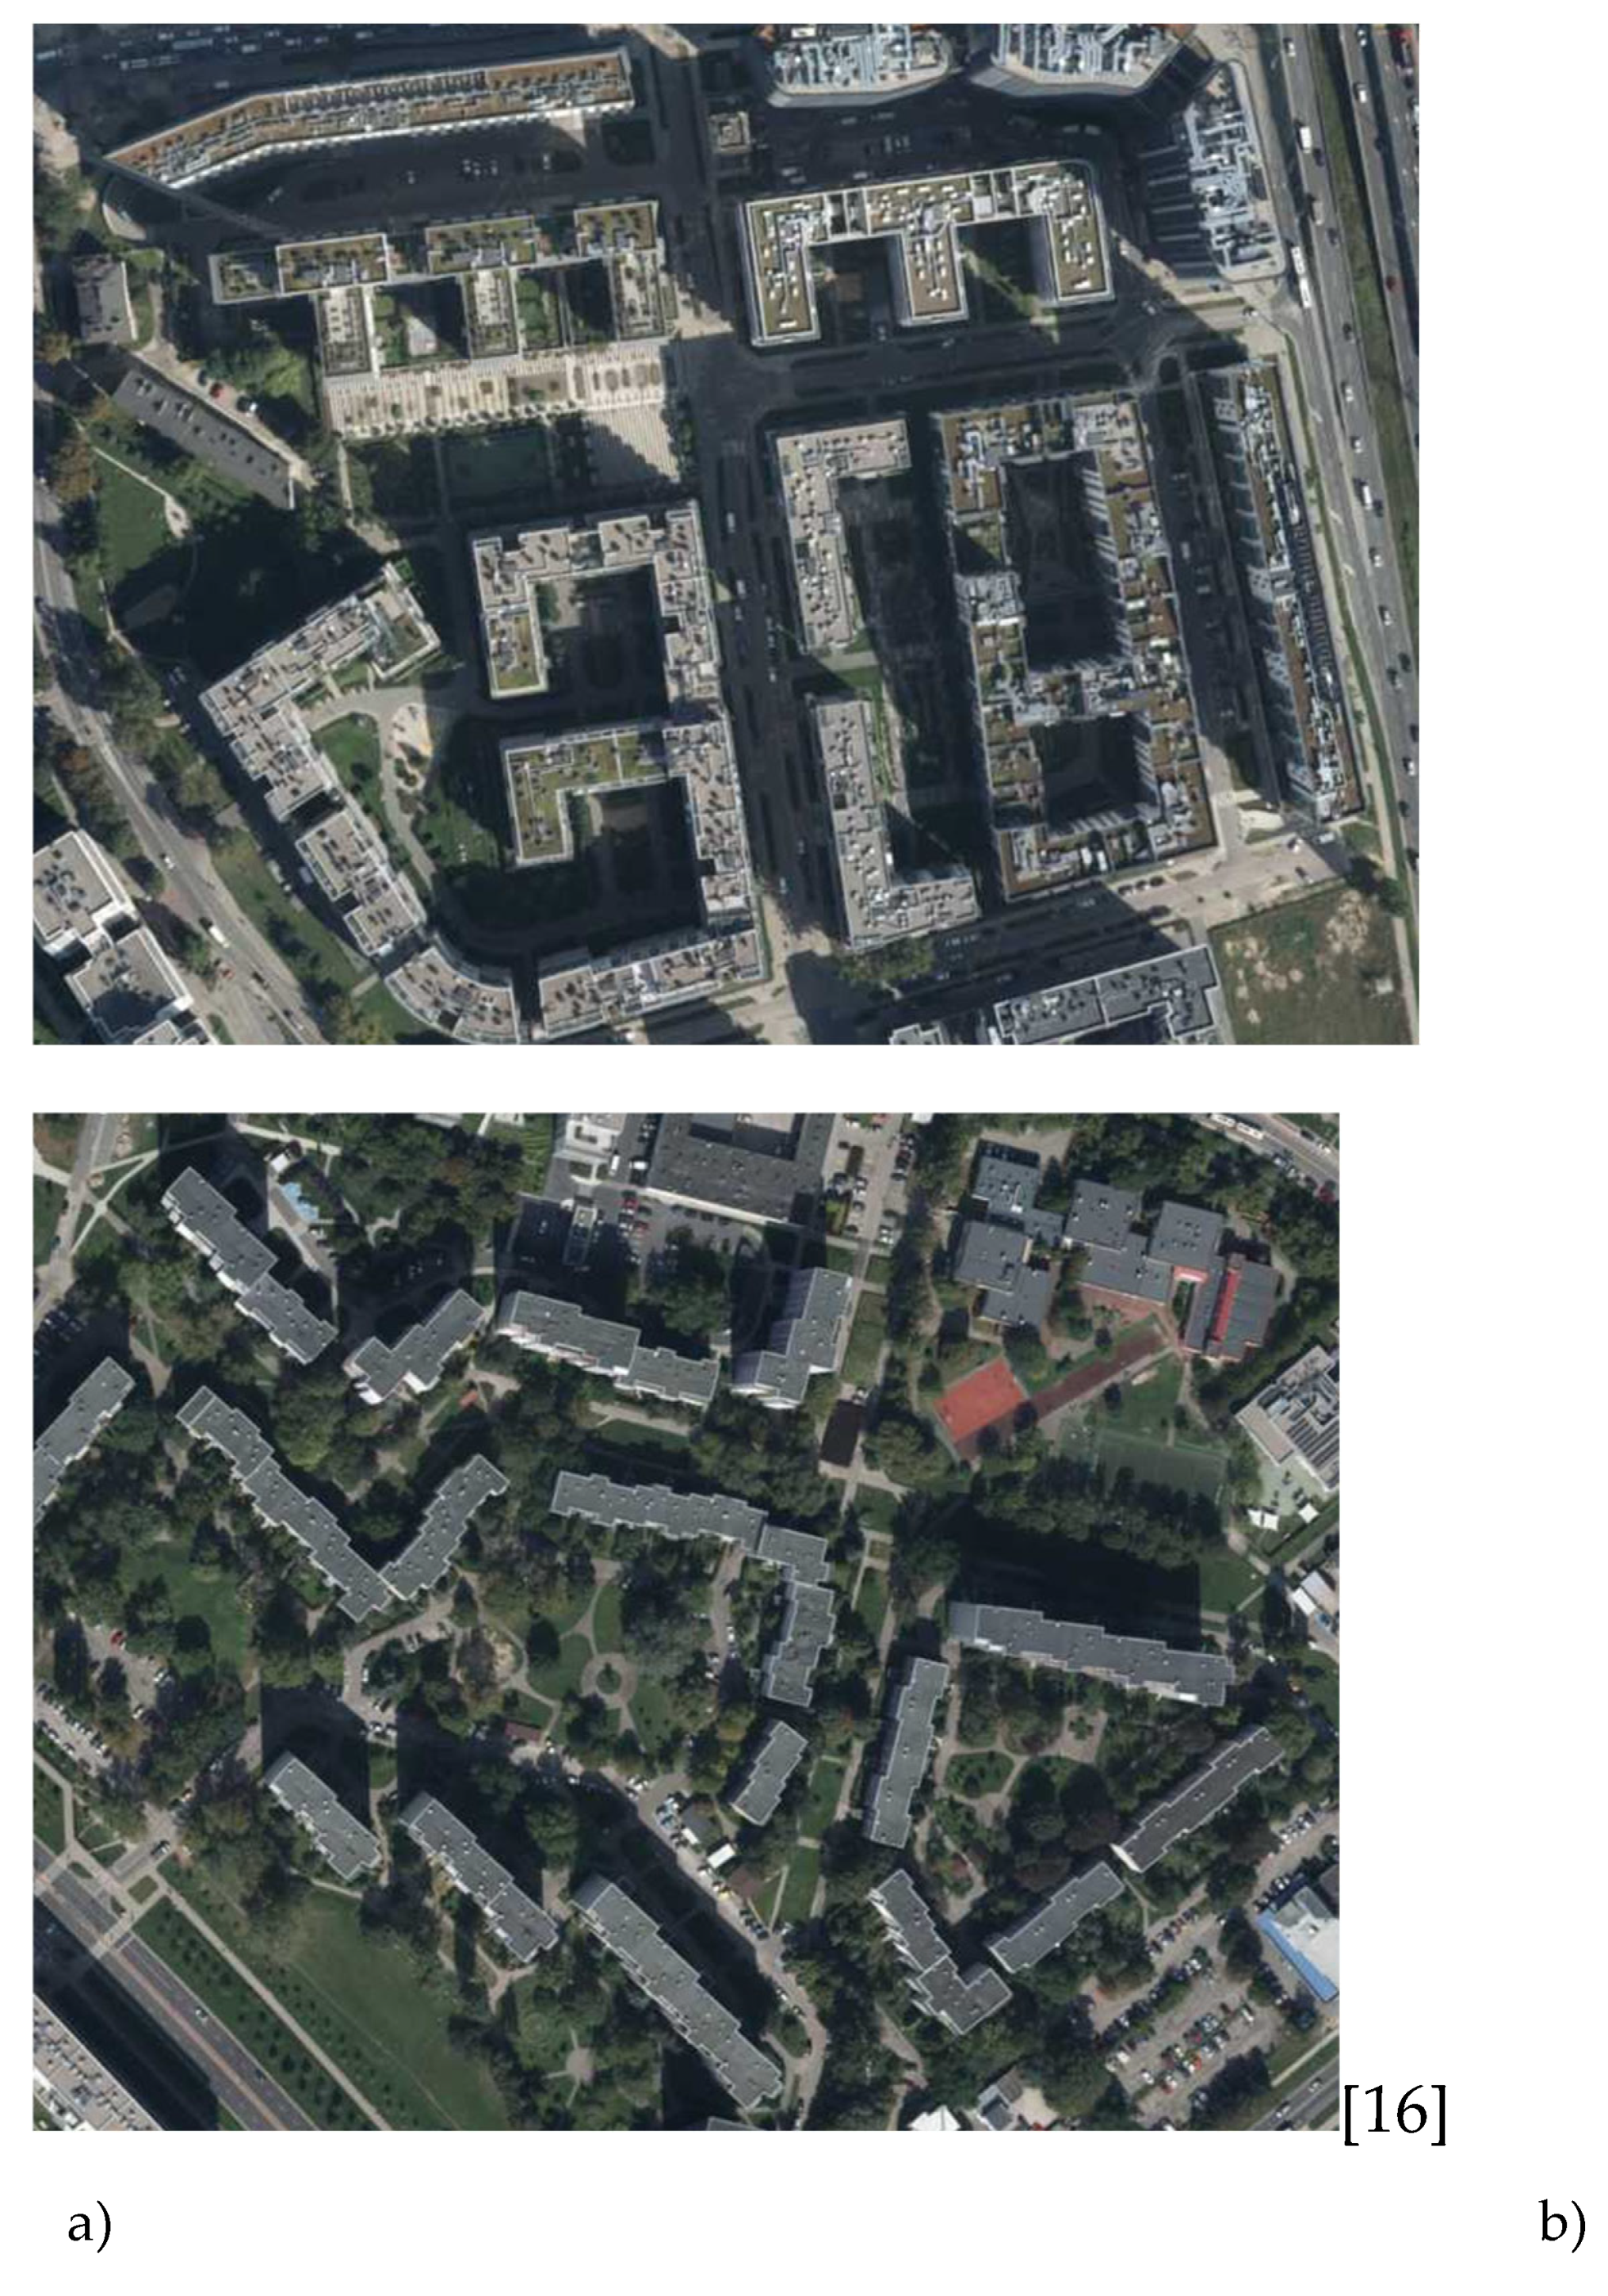
In the research carried out, analyses were implemented to answer the question whether Warsaw can be considered a green city, as envisaged by the 3-30-300 concept. As part of the research, the concept's assumptions regarding the visibility of the three trees were refined. In addition, a subdivision of the buildings into flats was simulated in order to check whether it is possible to see the three trees from each side of the buildings. It was also clarified what type of land is considered green space. Due to the lack of clear definitions, two green space options were analyzed. The results showed that when single conditions of the studied concept are taken into account, both in the whole city and in individual districts the situation of access to greenery is not as bad as one might think. However, taking into account several conditions at the same time, only a few eastern districts of Warsaw can be considered largely green. The rest of the city cannot be called a green city, and consequently it is not legitimate to call the whole of Warsaw a green city, either. This brings us to the answer to the first of the research questions posed. The whole of Warsaw, despite the presence of many trees and green areas in it, unfortunately cannot be considered a green city, according to the 3-30-300 concept. The districts of Rembertów, Wesoła, and Wawer are the closest to meeting the conditions of the concept. The results of the study showed that the mere visibility from the flats of 3 trees or not too far from a park/forest gives not the worst results (almost 58% and 45% respectively), suggesting that vegetation is generally present in Warsaw's housing estates. However, the very poor final result is definitely negatively influenced by the coverage of districts below 30% greenery in the form of parks/forests. This brings us to the answer to the second research question and suggests that there are far too few green areas in the city and that they are distributed unevenly across Warsaw. This confirms the fairly common opinion that while there are quite a lot of parks and even forests in the city, they are only found in certain districts. The capital definitely lacks smaller squares and parks. This situation applies to most of Warsaw's districts, but in areas of very intensive new development, where many blocks of flats are now being built without any recreational infrastructure, including no green areas, it is downright alarming (
Figure 16). Such a situation is encountered in Ursus, Bemowo, Włochy, and Mokotów, to mention only a few. The results of the analysis of residents' access to urban greenery in Warsaw, according to the 3-30-300 concept, can make a valuable contribution to urban planning and urban ecology. An approach that takes into account different criteria for access to green space can not only improve the aesthetics of the city, but also has a direct impact on the mental and physical health of residents. Green spaces promote physical activity, reduce stress and improve wellbeing. A multifaceted approach to the analysis of urban greenery also shows that surveying and evaluating only on the basis of a single criterion, such as distance to a park, gives a false picture of accessibility to greenery and cannot be a measure to assess whether a city is green. The proposed implementation of the 3-30-300 concept is universal and can be applied to studies in other cities. Thanks to spatial analyses, in the future it will become possible both to compare Warsaw with other cities and to develop effective strategies for increasing the accessibility and quality of green areas. It is worth emphasizing that the use of spatial analyses and showing the spatial distribution of different aspects of access to greenery in the city enables local intervention, precisely in those places where access to specific forms of greenery is unsatisfactory.
5. Summary
While in recent years the policy of Warsaw's administrators has placed greater emphasis on green areas, this has tended to involve the planting of individual trees or green tracks, but not necessarily the creation of new parks. The results of our research show the great importance of an even distribution of green areas in the city and the need for a differentiated approach to urban planning that takes into account local conditions and the needs of residents. The uneven distribution of green space in different districts points to the need for more balanced urban planning. In particular, districts such as Ochota, Praga Południe, Praga Północ, Śródmieście, Ursus, Wola, and Żoliborz, which do not have sufficient green areas, require additional attention and taking actions to improve the availability of green space for their residents. The need for a differentiated approach to urban planning means that each district should be analyzed individually, taking into account local needs and opportunities. In practice, this may mean a greater emphasis on public consultations and working with local communities in the planning process. Taking their opinions and needs into account may lead to developing more acceptable and effective solutions that will better serve the residents.
The research presented here is a first step towards developing a comprehensive method of assessing the city in terms of residents’ access to nature. The work presented has the merit of clarifying the assumptions of the 3-30-300 concept and proposing a measurable assessment of the city from this angle. However, the research has shown the need to clarify the concepts and its assumptions, and it is advisable to conduct further work in this area.
For this reason, it is planned to survey a large number of respondents in the next research project in order to gather the opinions of residents and to clarify, for example, from what distance trees should be visible from their windows. Such data will make it possible to better adapt the analytical models to the actual feelings and needs of the residents, which in turn will increase the practical aspect of future studies. Another thing that needs to be clarified is the question of what green spaces mean. Based on residents’ comments, it will be possible to better determine which green spaces should be included in the condition of 30% green coverage of the district. Thirdly, it would be useful to investigate how residents respond to questions about the different conditions of the concept. This perception has a significant impact on the perception of the results of the analyses carried out, as, for example, the distance conditions will be perceived differently in compact European cities and sprawling American cities.
It would also be worth investigating the visibility of the three trees from different floors of the building, as it is clear that the view from the lower floors differs from the view from the upper floors. Such detailed studies will enable a more precise understanding of how the height of the building affects the perception of greenery by the residents, which may be important for urban designers. Comprehensive research results of the green city concept may inform recommendations for sustainable urban development, improving the quality of life for residents and strategies for increasing the amount of green space in future urban plans.
Author Contributions
Conceptualization, A.M. and B.W.; methodology, B.W.; formal analysis, B.W.; writing—original draft preparation, B.W.; writing—review and editing, A.M.; visualization, B.W.; supervision, A.M. All authors have read and agreed to the published version of the manuscript.
Funding
This research and publication process was funded within the statutory project No. UGB/22-705/2024, titled “Acquisition and processing of spatial data for the needs of geospatial reconnaissance”, realised in 2024 at the Faculty of Civil Engineering and Geodesy, Military University of Technology, Warsaw, Poland.
Institutional Review Board Statement
Not applicable.
Informed Consent Statement
Not applicable.
Data Availability Statement
Not applicable.
Conflicts of Interest
The authors declare no conflict of interest.
References
- Pace, R.; Churkina, G.; Rivera, M.A. How green is a 'Green City'? A review of existing indicators and approaches, Institute for Advanced Sustainability Studies(IASS WorkING paper). 2016. [CrossRef]
- Giannopoulou, M. Bioclimatic Principles and Urban Open Spaces: The Case of Xanthi. International journal of humanities and social sciences. 2012, 6, 1845–1848. [Google Scholar] [CrossRef]
- Wong, N.H.; Tan, C.L.; Kolokotsa, D.D. Greenery as a mitigation and adaptation strategy to urban heat. Nat Rev Earth Environ. 2021, 2, 166–181. [Google Scholar] [CrossRef]
- Aram, F. Resources of Urban Green Spaces and Sustainable Development. Resources. 2024, 13, 10. [Google Scholar] [CrossRef]
- Islam, M.Z.; Johnston, J.; Sly, P. D. Green space and early childhood development: a systematic review. Reviews on Environmental Health. 2020, 35, 189–200. [Google Scholar] [CrossRef] [PubMed]
- Azizi, L.; Kouddane, N. The green city as a driver of sustainable development. J. Umm Al-Qura Univ. Eng.Archit. 2024. [Google Scholar] [CrossRef]
- Maas, J.; Verheij, R.A; Vries, S.; Spreeuwenberg, P.; Schellevis, F.G; Groenewegen, P.P. Morbidity is related to a green living environment. Journal of epidemiology and community health. 2009, 63, 967–73. [Google Scholar] [CrossRef] [PubMed]
- Dadvand, P.; Bartoll, X.; Basagaña, X.; Dalmau-Bueno, A.; Martinez, D.; Ambros, A.; Cirach, A.; Triguero-Mas, M.; Gascon, M. Green spaces and General Health: Roles of mental health status, social support, and physical activity. Environment International. 2016, 91, 161–167. [Google Scholar] [CrossRef] [PubMed]
- Zhang, Y.; Mavoa, S.; Zhao, J.; Raphael, D.; Smith, M. The Association between Green Space and Adolescents’ Mental Well-Being: A Systematic Review. Int. J. Environ. Res. Public Health. 2020, 17, 6640. [Google Scholar] [CrossRef] [PubMed]
- Wortzel, J.D; Wiebe, D.J; DiDomenico, G.E; Visoki, E.; South, E.; Tam, V.; Greenberg, D.M; Brown, L.A; Gur, R.C; Gur, R.E; Barzilay, R. Association Between Urban Greenspace and Mental Wellbeing During the COVID-19 Pandemic in a U.S. Cohort. 2021; 3, ISBN 2624-9634. [Google Scholar] [CrossRef]
- Herzele, A.V; Wiedemann, T. A monitoring tool for the provision of accessible and attractive urban green spaces. Landscape and Urban Planning. 2003, 63, 109–126. [Google Scholar] [CrossRef]
- Kabisch, N.; Strohbach, M.; Haase, D.; Kronenberg, J. Urban green space availability in European cities. Ecological Indicators. 2015, 70, 586–596. [Google Scholar] [CrossRef]
- Ayala-Azcarraga, C.; Diaz, D.; Fernandez, T.; Cordova-Tapia, F.; Zambrano, L. Uneven Distribution of Urban Green Spaces in Relation to Marginalization in Mexico City. Sustainability. 2023, 15, 12652. [Google Scholar] [CrossRef]
- Liu, D.; Kwan, M.P.; Kan, Z. Analysis of urban green space accessibility and distribution inequity in the City of Chicago. Urban Forestry & Urban Greening. 2021; 59, ISBN 1618-8667. [Google Scholar] [CrossRef]
- Huang, B.-X.; Li, W.-Y.; Ma, W.-J.; Xiao, H. Space Accessibility and Equity of Urban Green Space. Land. 2023, 12, 766. [Google Scholar] [CrossRef]
- ESRI, Geographic Information Systems. Available online: https://www.esri.com/en-us/what-is-gis/overview?srsltid=AfmBOopJGtulUzqUWyooC3vDXY9yciVGj3h7FRwdo1S8C0Pb05AJ_prn (accessed on 23 August 2024).
- Konijnendijk, C.C. Evidence-based guidelines for greener, healthier, more resilient neighbourhoods: Introducing the 3–30–300 rule. J. For. Res. 2023, 34, 821–830. [Google Scholar] [CrossRef] [PubMed]
- Koeser, A.K.; Hauer, R.J.; Andreu, M.G.; Northrop, R.; Clarke, M.; Diaz, J.; Hilbert, D.R.; Konijnendijk, C.C.; Landry, S.M.; Thompson, G.L.; Zarger, R. Using the 3-30-300 Rule to Assess Urban Forest Access and Preferences in Florida (United States). Arboriculture & Urban Forestry. 2024; 50, 241–257. [Google Scholar] [CrossRef]
- World Health Organization. Regional Office for Europe, 2017. Urban green spaces: a brief for action. World Health Organization. Regional Office for Europe. Available online: https://iris.who.int/handle/10665/344116.
- Bieńkowska, M.; Błaszczak, E.; Czyżkowska, A.; Kaźmierczak, E.; Kotowoda, J.; Kwiecień, T.; Pasterkowska, A.; Podolska, J.; Sońta, I.; Suchecka, M. Przegląd statystyczny Warszawy – 3 kwartał 2023; Główny Urząd Statystyczny: Warszawa, 2023. [Google Scholar]
- Kacperczyk, E.; Ciesielska, K.; Hernik, G.; Matysek-Zdun, U. Powierzchnia i ludność w przekroju terytorialnym w 2023 r; Główny Urząd Statystyczny: Warszawa, 2023. [Google Scholar]
- The Greenery Board of the Capital City of Warsaw, 2017. A Million Trees for Warsaw. [In Polish: Zarząd Zieleni m.st. Warszawy, 2017. Milion Drzew Dla Warszawy]. 2017; 10. Available online: https://zzw.waw.pl/2017/03/28/milion-drzew-dla-warszawy/ (accessed on 10 August 2024).
- The Greenery Board of the Capital City of Warsaw, 2018. Green Streets. [In Polish: Zarząd Zieleni m.st. Warszawy, 2017. Zielone Ulice]. https://zzw.waw.pl/zieloneulice/.
- The Greenery Board of the Capital City of Warsaw, 2022. In 2022, we paved almost 3,000 m2 - the appearance of greenery in Warsaw [In Polish: Zarząd Zieleni m.st. Warszawy, 2017. W 2022 r. rozpłytnęliśmy niemal 3000 m2 – pojawienie się zieleni w Warszawie]. Available online: https://zzw.waw.pl/2023/08/09/w-2022-r-rozplytowalismy-niemal-3000-m2-przybylo-zieleni-w-warszawie/?projekt=1&b=75 (accessed on 10 August 2024).
- The Main Office of Geodesy and Cartography, 2024. Geoportal. Available online: https://www.geoportal.gov.pl/ (accessed on 10 August 2024).
- The Main Office of Geodesy and Cartography, 2024. Main Page. Available online: www.gugik.gov.pl (accessed on 10 August 2024).
- Cisło-Lesicka, U. Acquiring 3D information about buildings for the needs of a 3D multi-resolution topographic database [In Polish: Pozyskiwanie informacji 3D o budynkach dla potrzeb trójwymiarowej wielorozdzielczej bazy topograficznej]. Archiwum Fotogrametrii, Kartografii i Teledetekcji, 2010; 21, 2083–2214. [Google Scholar]
- The Main Office of Geodesy and Cartography, 2024. Database of General Geographic Objects (BDOO) [In Polish: Baza Danych Obiektów Ogólnogeograficznych (BDOO(]. Available online: https://www.geoportal.gov.pl/pl/dane/baza-danych-obiektow-ogolnogeograficznych-bdoo/ (accessed on 10 August 2024).
- Open Street Map, Main Page. Available online: https://wiki.openstreetmap.org/wiki/Pl:Main_Page?uselang=pl accessible (accessed on 16 August 2024).
- Open Street Map, Map. Available online: https://www.openstreetmap.org/#map=19/52.25400/20.90410 (accessed on 16 August 2024).
|
Disclaimer/Publisher’s Note: The statements, opinions and data contained in all publications are solely those of the individual author(s) and contributor(s) and not of MDPI and/or the editor(s). MDPI and/or the editor(s) disclaim responsibility for any injury to people or property resulting from any ideas, methods, instructions or products referred to in the content. |
© 2024 by the authors. Licensee MDPI, Basel, Switzerland. This article is an open access article distributed under the terms and conditions of the Creative Commons Attribution (CC BY) license (http://creativecommons.org/licenses/by/4.0/).
