1. Introduction
It is well-known that Fossil Based Plastics (FBP) exhibit many positive features: low cost, easy availability, easy processing of raw materials, good mechanical properties. These aspects have determined a real explosion in the use of FBPs starting from the 1950s, replacing traditional materials such as glass or metals that presented problems of fragility, heaviness, or corrosion [
1]. Unfortunately, FBPs are non-biodegradable materials and have a very long lifespan (hundreds or thousands of years) [
2].
Current data [
3] indicate that FBP production is of the order of about 500 million tons in 2025. The lack of recycling and poor management of plastic waste due to the linear economy model [
4] of the past decades, have led to the well-known environmental pollution problems throughout the world. Furthermore, excessive industrial production is one of the main causes of global warming with climate consequences that we are already experiencing [
5]. The huge amount of plastic waste has affected the ecosystem due to pollution in soils and oceans (through landfills), and in the atmosphere (through fumes from industrial production) [
6].
To overcome these serious problems, it has become necessary to increase the use of alternative resources with respect to fossil ones. Biological origin of bioplastic represents an alternative to fossil-based plastics for their biodegradability [
7]. Biodegradable and Bio-based Polymers (BBPs) from renewable resources are an interesting alternative to traditional FBPs, due to their much faster biodegradation in the soil compared to FBPs [[
8,
9,
10]. This feature is crucial to eliminate the serious problem of FBP pollution and so contribute to the protection of the ecosystem and the health of the entire planet [
10]
. Although the production cost of bioplastics is progressively decreasing, it is still higher than that of plastics derived from fossil fuels. [
7].
Anyway, to satisfy the production of millions of tons of bioplastic, it would be necessary to convert a large part of the production of natural resources which could no longer be used for the food needs of the world population [
11,
12,
13].
Bio-polybutylene succinate (PBS), obtained from renewable sources, is a white, ductile, semi-crystalline material that behaves like a thermoplastic (like low-density polyethylene (LDPE)) and is also biodegradable. Thus, it represents a valid alternative to FBPs because of its physical/mechanical properties [
14]. Moreover, low production costs and the possibility of obtaining both succinic acid and 1,4-butanediol from renewable sources, makes PBS a completely biobased polymer [
1]. In detail, PBS has a density of 1.25 g/cm
3, a melting point (Tm) in the range [90°C,120 °C], and a glass transition temperature (Tg) in the range [-45 °C, -10 °C] [
15].
For the issues above discussed (reduction of the use of virgin polymers, increasing of the biodegradability, and reduction of the production costs), a promising strategy is to mix polymeric materials with Ligno-Cellulosic Fillers (LCF), such as wheat bran, jute, bamboo, rice straw, hemp. Because these fillers are production agri-food waste, they are practically zero-cost materials [
16,
17,
18,
19,
20].
The presence of an inert filler in the bio-composite has two main consequences: on one hand it reduces the consumption of bioplastic, on the other hand it is responsible for changing both the mechanical and physical properties of the thermoplastic material [
21].
The bio-composite does not contain any chemical additive (potential dangerous or toxic) to lower the interfacial tension between the PBS (which is non-polar) and the BSGF (which is polar).
To describe the mechanical behavior of the PBS mixture with LCF, we performed a series of experimental tests accompanied by a modeling analysis. The mechanical parameters (temperature, pressure, and processing parameters being constant) are strictly linked to the composition of the polymer/filler mixture, and therefore depend both on the degree of dispersion of the filler within the polymeric material and the chemical affinity between the two components of the mixture [
22,
23].
To avoid both the lengthy experimental preparations of all possible combinations of the PBS/LCF mixtures, and therefore limiting to a minimum the experimental characterization test, we analyzed the stress-strain data obtained for a small (although significant) number of different compositions of the PBS/LCF mixtures by using the same fitting function independently of the filler concentration. The fitting function we explored in the analysis of data can be useful to describe the general mechanical behavior of the PBS/LCF composite and hopefully give good predictions for compositions of the mixtures different from those used in the experiments.
In the literature, there are a lot of contributions related to the mathematical modeling of composite materials. Fundamental results about the elastomers [
24,
25,
26] are worth of being quoted; these materials have had, and still have, a relevant importance especially in the automotive and transport industry, but also in the mechanical, textile and chemical industries. Even more in detail, in-depth studies of mathematical modeling have been carried out to analyze the macromolecular structure of polymer chains [
27,
28,
29].
A complete analysis of the literature is impossible. Hereafter, we quote some papers that in some sense share some features with our work. Alasfar et al. [
30] developed a mathematical model of porous polymer nanocomposites, which examines how mechanical properties can be influenced by temperature, material porosity, operating conditions and loading rate. Potluri et al. [
31] used finite element methos (FEM) for the prediction of the elastic properties of a pineapple fiber reinforced polymer composites under unidirectional load.
Kazmer et al. [
32] modelled the process property relations of different commercially available bioplastics (a recycled polypropylene blend, polybutylene adipate terephthalate, and two grades of polylactic acid) in a pilot production environment using an instrumented two-cavity hot runner injection mold. Zhou et al.. [
33] investigated the effect of different Waste Glass Fiber-reinforced Polymer (GFRP) volume replacement ratios on the performance of concrete. They studied in detail, the failure mode, uniaxial compressive strength, modulus of elasticity, lateral dilation and stress–strain response.
It can be easily recognized that a mathematical description of the mechanical behavior of composites that can give a guide in the development of new materials, such as those based on PBS and a lignin cellulosic filler, like as the brewer spent grain filler (BSGF) that represents an agri-food waste reusable for other purposes, is very important. In this paper, we try to address some issues concerned with a simple mathematical description of the mechanical behavior of the PBS/BSGF mixtures.
The innovative feature of this paper, mainly concerned with the mathematical analysis of the experimental results, consists in the unique fitting function for describing the stress-strain data in compounds with different concentrations of the filler. The results presented in this paper, and in a forthcoming paper, will serve to construct a constitutive theory of such compounds within the framework of continuum mechanics [
34].
2. Materials and Methods
2.1. Materials
Bioplastic: Bio-PBS FZ71-(code: PBS) has been purchased from Mitsubishi Chemical Performance, FZ71PM grade, with a density of 1.260 g/cm3 and melt flow rate (MFR) of 22 g/10 min (190 °C/2.16 kg).
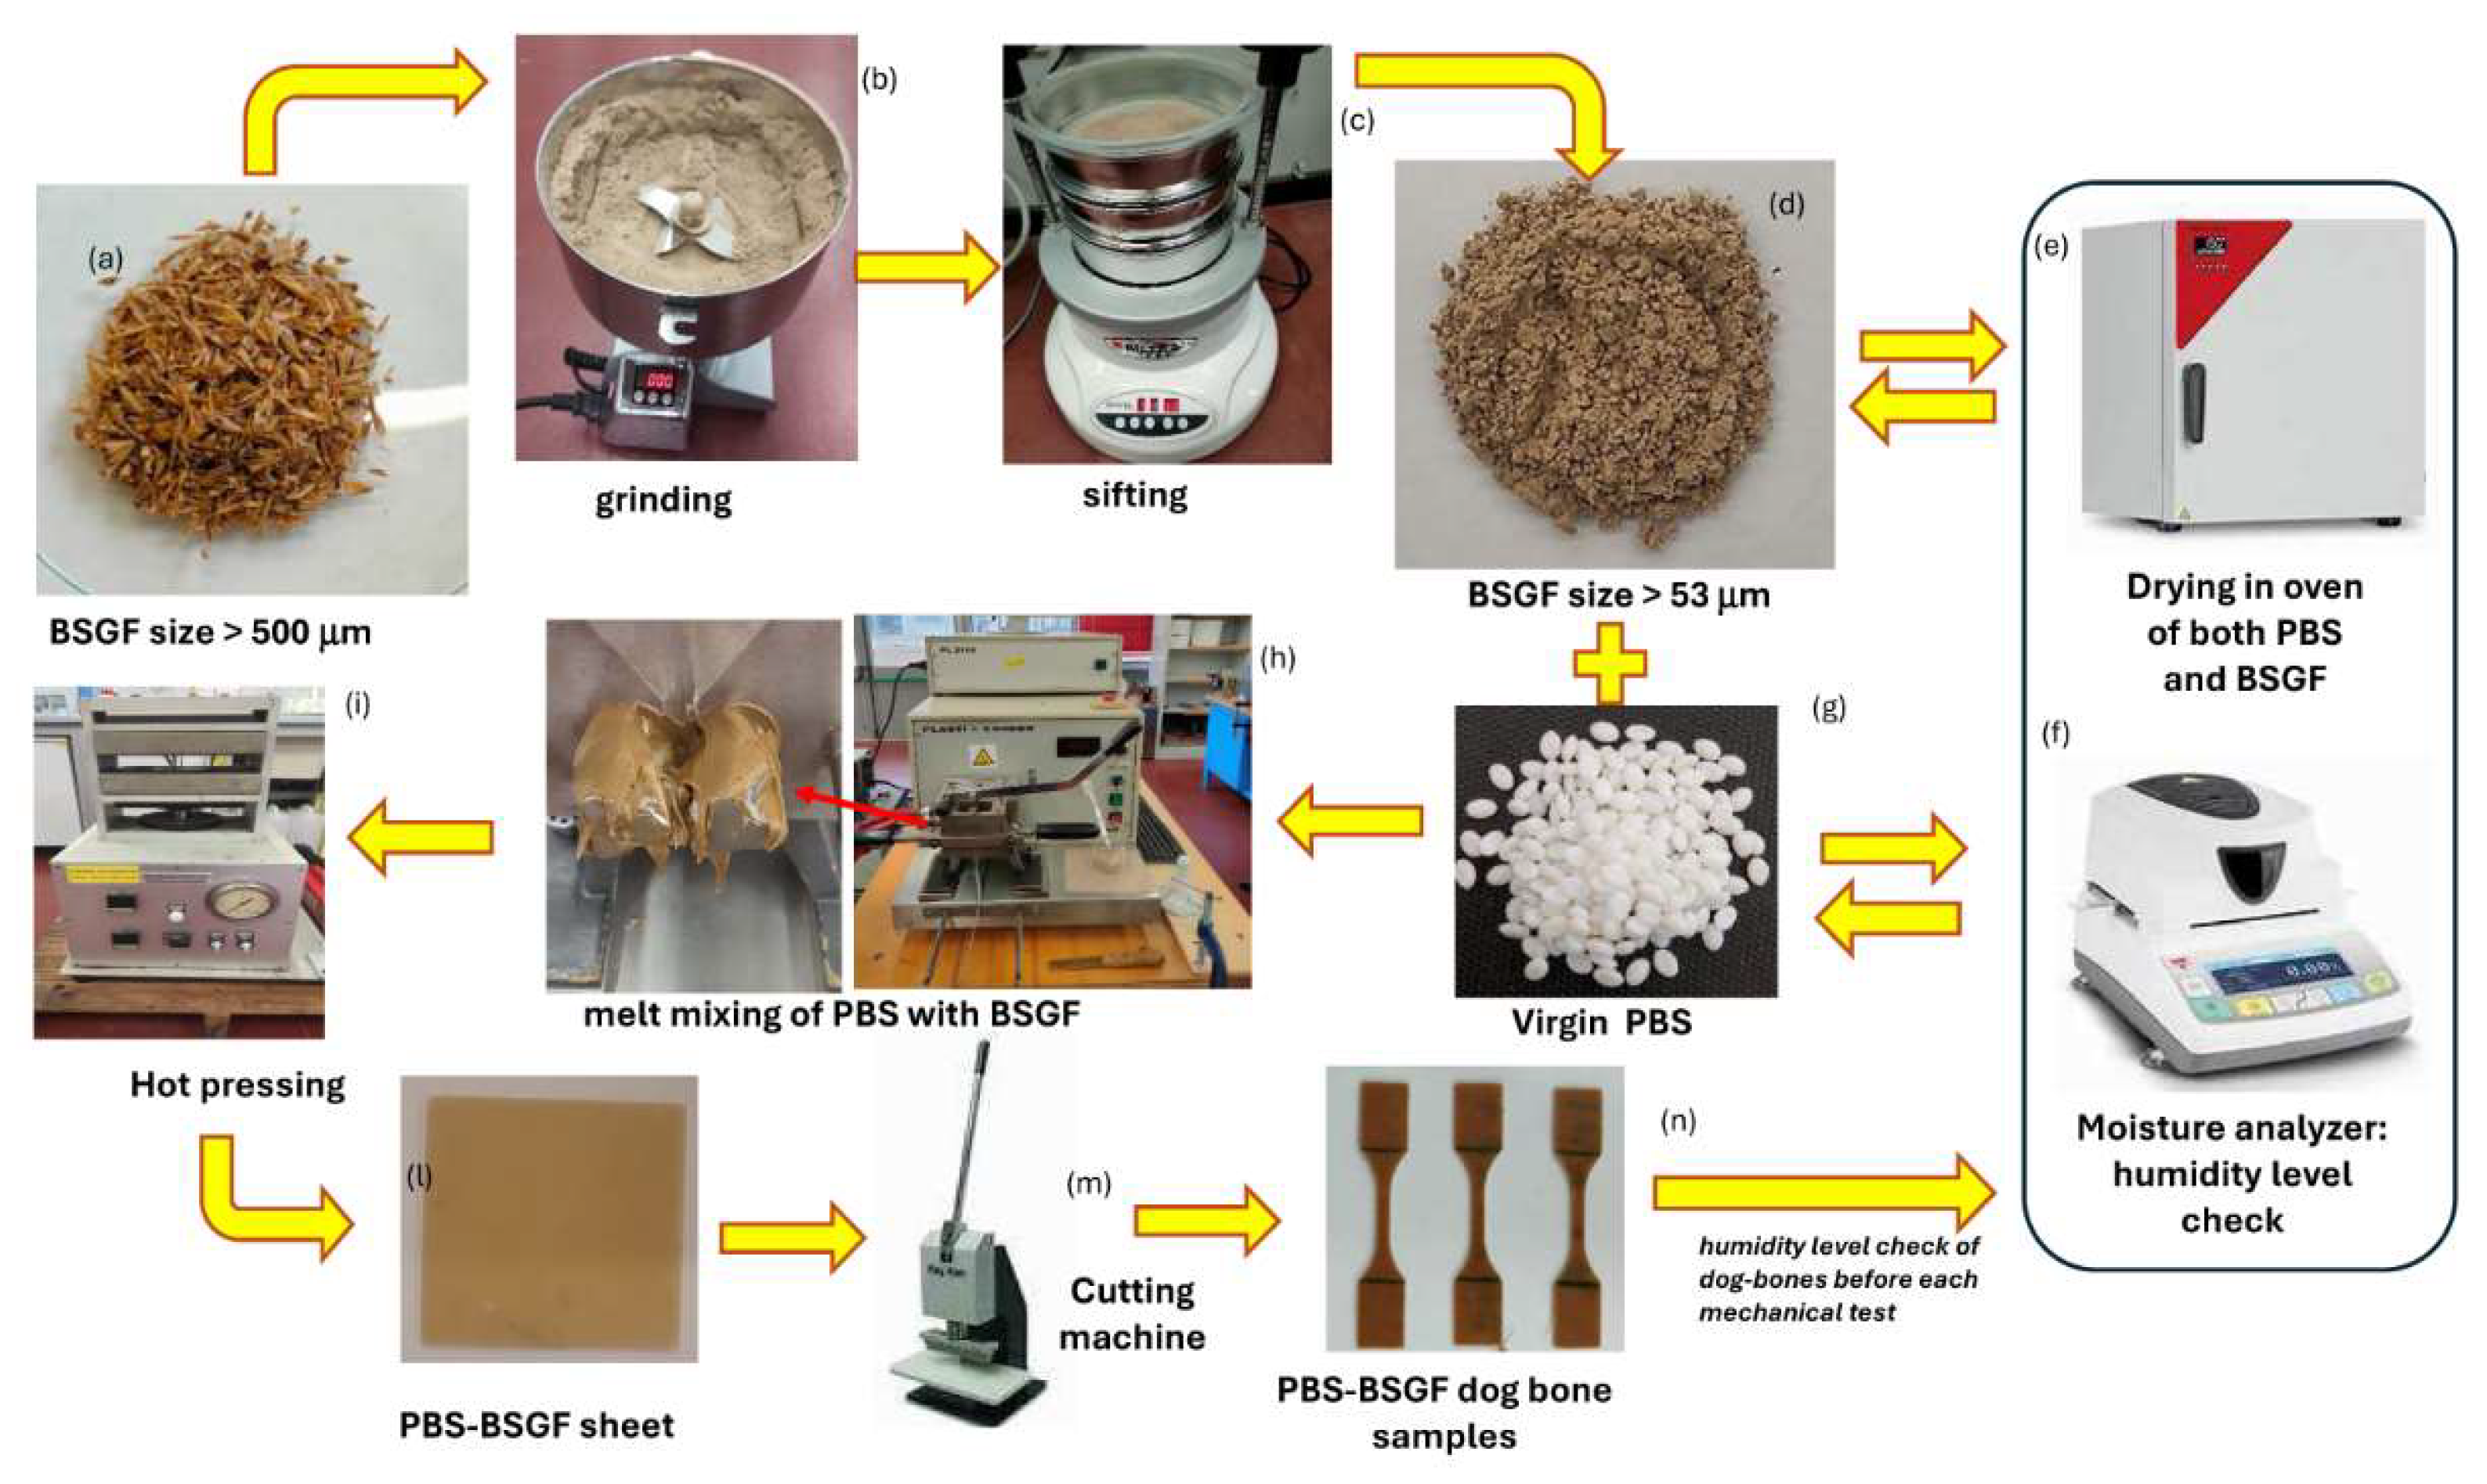
Filler: brewer spent grain (code: BSGF) has been supplied by Birrificio Messina Società Cooperativa (Larderia Inferiore, ex ASI, n.4, 98129 Messina, Italy) and was grinded with a ball milling (RETSCH mod. MM301, operative conditions: 20Hz, 30 minutes). Then BSGF has been sieved until obtaining a grain size smaller than 53µm with a Filtra Vibration apparatus, mod. Filtra IRIS FTL-0200 (see
Figure 1).
2.2. Bio-Composites Preparation
Figure 1 shows the entire long and complex process of preparing bio-composites, from the treatment of the raw materials to the treatment and control of the humidity level, to the preparation of their mixture and the shaping of the samples.
Due to the high hygroscopicity of the raw materials, especially of the BSGF, both PBS and BSGF were pre-dried (BSG overnight at 80 °C and PBS 4h at 60°C) in an oven (Binder Avantgarde line, mod. ED56) before processing and the humidity level has been checked with a moisture analyzer (ATS120) to keep the humidity level below the 2wt%. A higher level of humidity can affect negatively the creation of the product during the technological processing operations.
The BSGF must be stored in a vacuum bag to prevent them from absorbing further humidity moreover, before each processing it is necessary to recheck the humidity level as they easily absorb humidity, similarly to sponges.
The blend of PBS-BSG was prepared from a direct melting process in a melt mixer machine schematized in
Figure 1: PBS, pure and with BSGF at different weight amounts, ranging between 2 wt.% and 30 wt.%, have been mixed in a Brabender Plasticorder PL2100 chamber at 140°C, speed 40 rpm, for ten minutes.
The resulting blends (
Figure 1) were thermoformed in a uniaxial hot press (PM 20-200, supplied by DGTS s.r.l. Veduggio Con Colzano (MB) Italy) at 140°C for 15 minutes, at different pressures, with the following sequence: 7 minutes at atmospheric pressure (just putting in contact the mold with heating plates), 5 minutes at 50 bar, 3 minutes at 100 bar to obtain 6x6 cm square sheets, 1 mm thickness. Dog-bone samples have been obtained by a Ray-Ran cutter machine according to ASTM D638 M-3.
Table 1.
Composition of all the blends tested in this paper.
Table 1.
Composition of all the blends tested in this paper.
| Sample |
Composition |
| N. |
code |
PBS
(wt.%) |
BSGF
(wt.%) |
1
2 |
PBS
PBS-BSGF2 |
100
98 |
0
2 |
| 3 |
PBS-BSGF4 |
96 |
4 |
| 4 |
PBS-BSGF6 |
94 |
6 |
| 5 |
PBS-BSGF8 |
92 |
8 |
| 6 |
PBS-BSGF10 |
90 |
10 |
| 7 |
PBS-BSGF12 |
88 |
12 |
| 8 |
PBS-BSGF14 |
86 |
14 |
| 9 |
PBS-BSGF16 |
84 |
16 |
| 10 |
PBS-BSGF18 |
82 |
18 |
| 11 |
PBS-BSGF20 |
80 |
20 |
| 12 |
PBS-BSGF22 |
78 |
22 |
| 13 |
PBS-BSGF24 |
76 |
24 |
| 14 |
PBS-BSGF26 |
74 |
26 |
| 15 |
PBS-BSGF28 |
72 |
28 |
| 16 |
PBS-BSGF30 |
70 |
30 |
2.3. Mechanical Characterization Tests
Tensile tests have been performed according to ASTM D 638-03 standard with a Lloyd LR10K Universal Dynamometer machine (load cell 0.5 kN, preload 1.00 N, speed 2 mm/min) purchased from Elis–Electronic Instruments & Systems S.r.l., Rome, Italy. Tests have been carried out at 25°C and relative humidity (RH) of 21%. Mechanical parameters such as Young modulus (E [MPa]) and stress at break (σr [MPa]) were obtained as the result of the average values obtained from four samples (for each type).
2.4. Scanning Electron Microscopy (SEM) Analysis
Visual examination by scanning electron microscope (SEM) was performed inside the fracture surface of dog bone shaped specimens used for tensile testing. A ZEISS Crossbeam 540 microscope (Carl Zeiss Microscopy GmbH, 07745 Jena, Germany) was used for this analysis. The operating conditions were accelerating voltage of 5 kV, and a magnification of 300x and coating of the specimens with a thin layer of chromium (Quorum Q 150T-ES, Quorum Technologies Limited Company, West Sussex RH19 2HL, UK).
Figure 2.
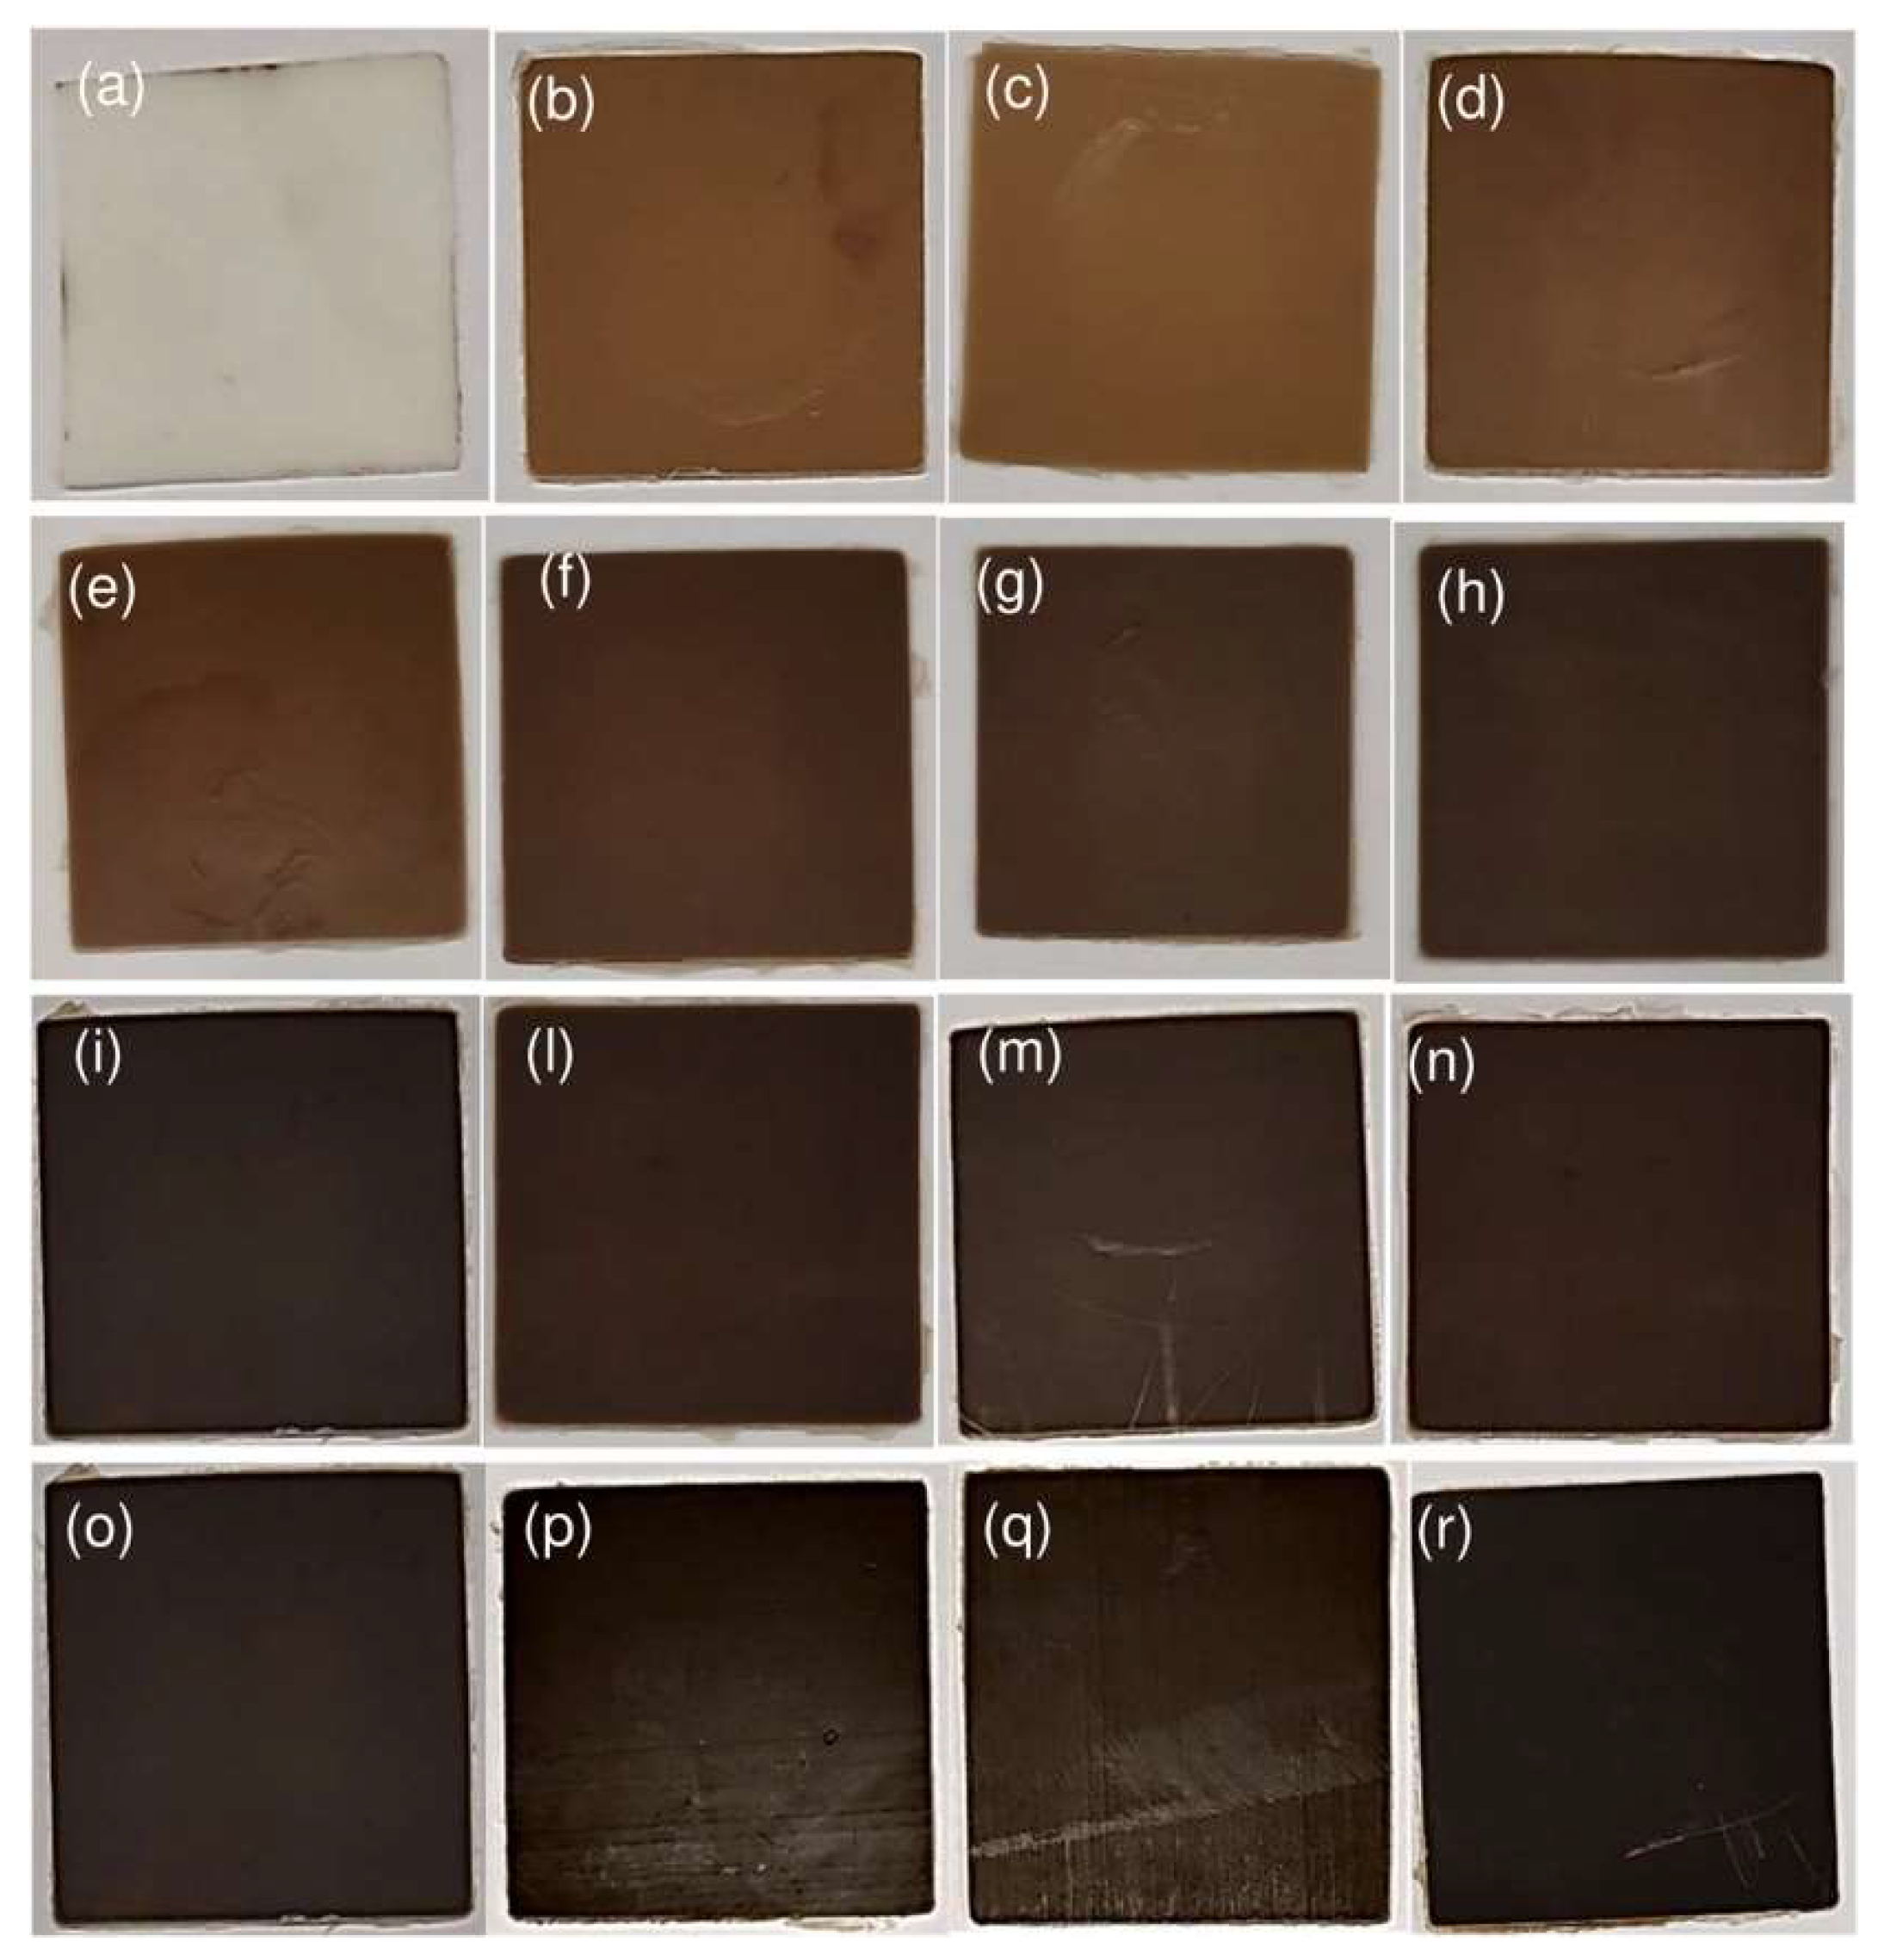
Sheets of PBS (a), PBS-BSGF2 (b), PBS-BSGF4 (c), PBS-BSGF6 (d), PBS-BSGF8 (e), PBS-BSGF10 (f), PBS-BSGF12 (g), PBS-BSGF14 (h), PBS-BSGF16 (i), PBS-BSGF18 (l), PBS-BSGF20 (m), PBS-BSGF22 (n), PBS-BSGF24 (o), PBS-BSGF26 (p), PBS-BSGF28 (q), PBS-BSGF30 (r).
Figure 2.
Sheets of PBS (a), PBS-BSGF2 (b), PBS-BSGF4 (c), PBS-BSGF6 (d), PBS-BSGF8 (e), PBS-BSGF10 (f), PBS-BSGF12 (g), PBS-BSGF14 (h), PBS-BSGF16 (i), PBS-BSGF18 (l), PBS-BSGF20 (m), PBS-BSGF22 (n), PBS-BSGF24 (o), PBS-BSGF26 (p), PBS-BSGF28 (q), PBS-BSGF30 (r).
Figure 3.
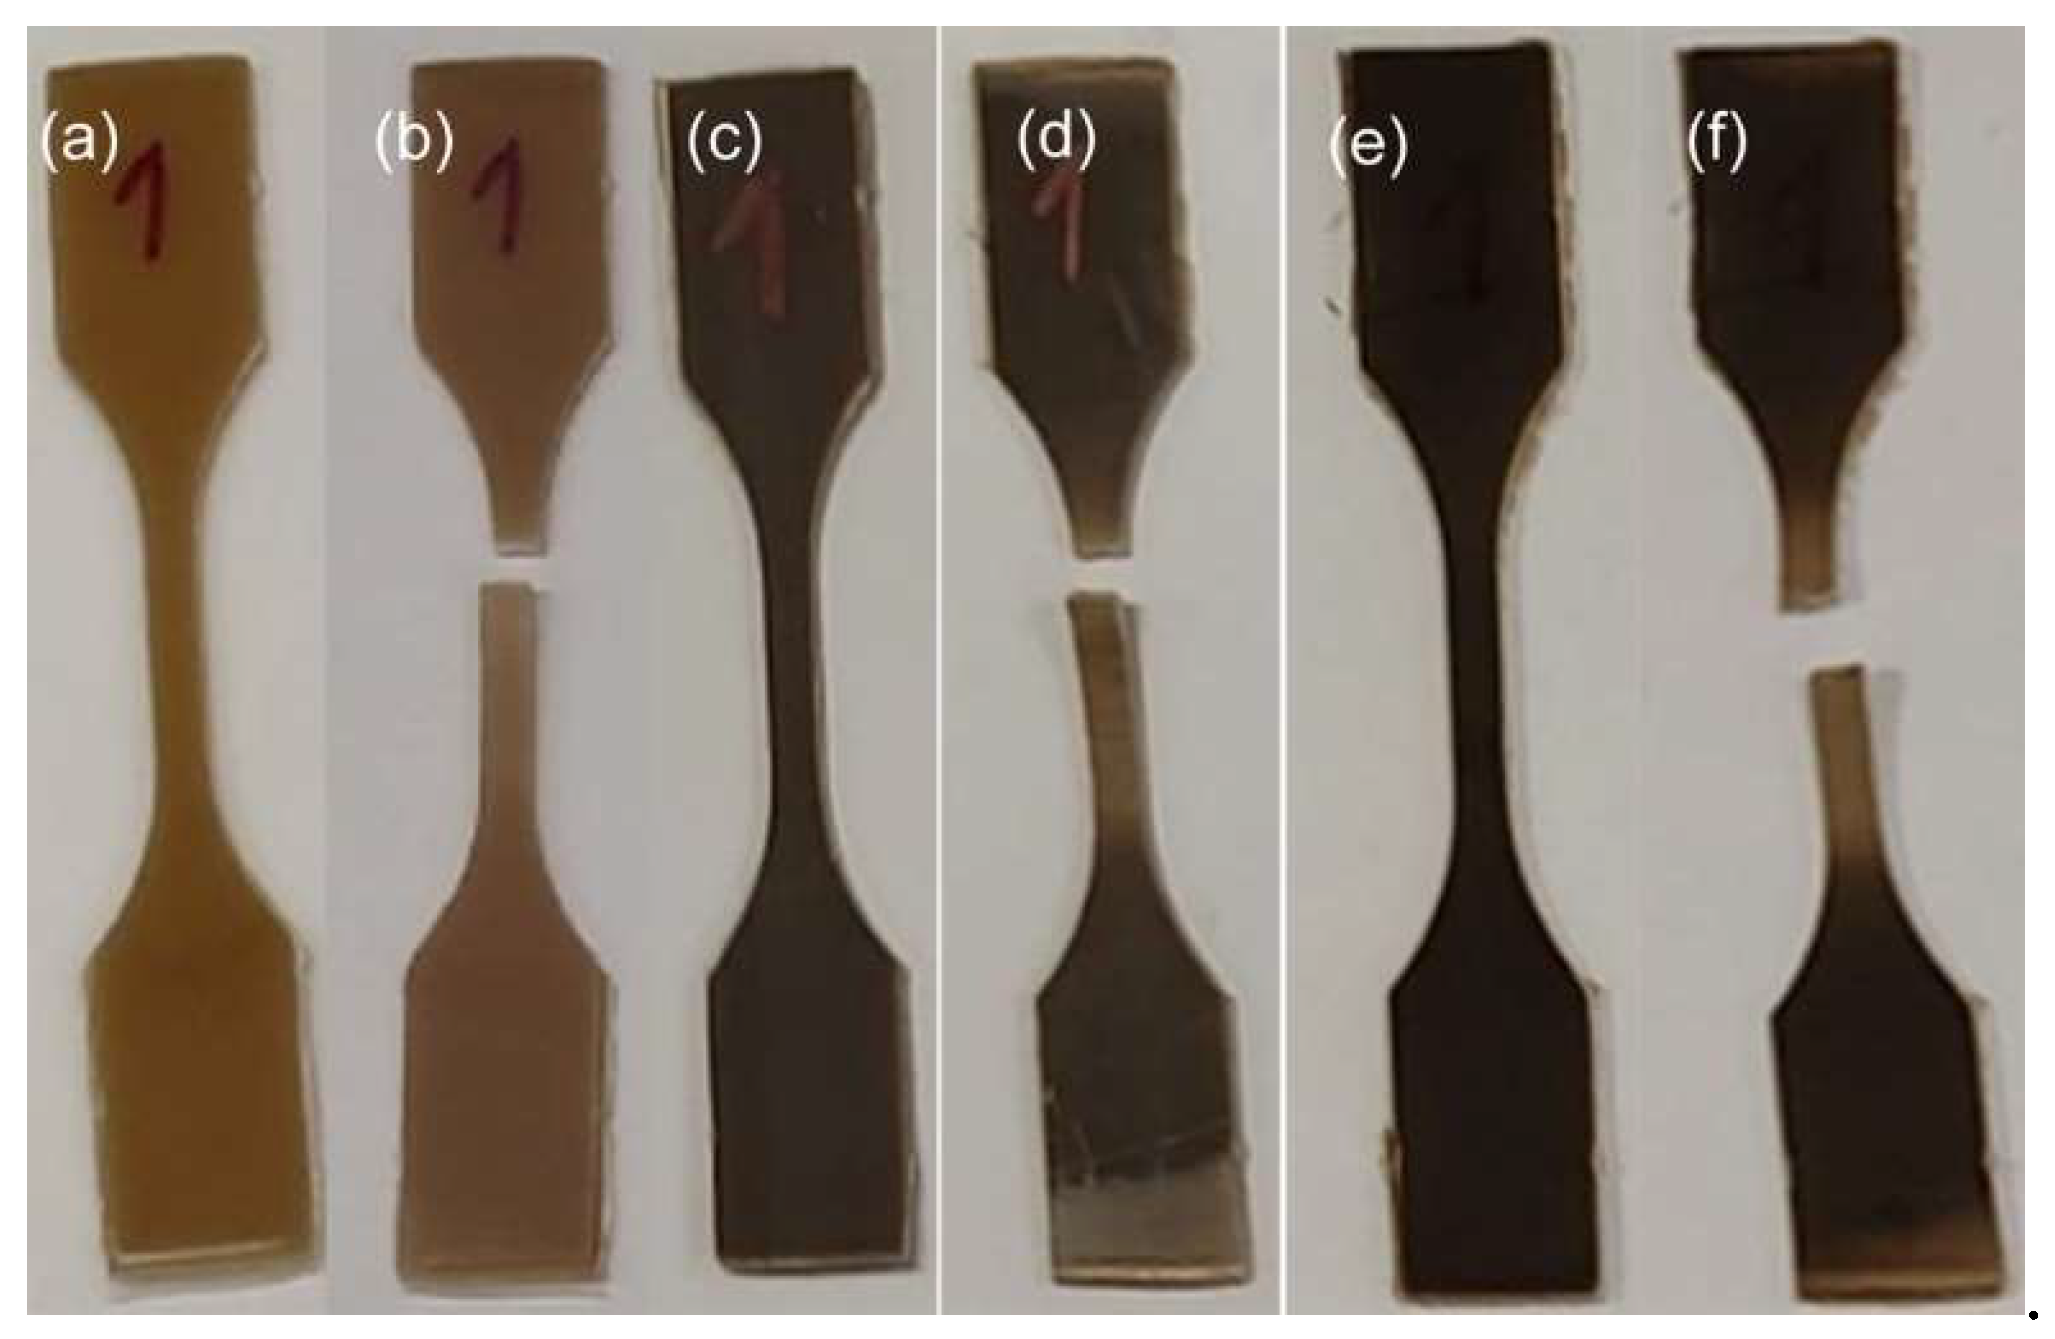
Dog-bones blends of PBS-BSGF4 (a, b), PBS-BSGF20 (c, d), PBS-BSGF30 (e, f) before, and after the tensile test.
Figure 3.
Dog-bones blends of PBS-BSGF4 (a, b), PBS-BSGF20 (c, d), PBS-BSGF30 (e, f) before, and after the tensile test.
2.5. Data Analysis
Looking at the engineering stress-strain curve of pure PBS, one can recognize different phases: proportional limit, yielding point, necking, strain hardening and rupture, underlined in red in
Figure 4a, respectively.
On the contrary, when the filler is mixed with the polymer, even at low concentration, the outcoming composite shows a totally different mechanical behavior, as can be observed from the Stress-Strain curve in
Figure 4b. In fact, there is no yield point anymore and a stress plateau arises until failure.
In the literature, a well-known model which describes the stress-strain relationship of elasto-plastic material is based on the Ramberg-Osgood relationship [
35], which is a phenomenological model requiring a check with experimental data.
In a more recent work [
36], within the framework of thermo-mechanics with internal variables, a mathematical function is used to fit the stress-strain curve of paper (bi-axial tensile test) and implement a constitutive model.
Based on these papers, our starting idea was to fit the data of the stress-strain curves with a nonlinear fitting function, and then collect the fitting parameters in order to find a relation between the fitting parameters and the concentration of the filler. In fact, when dealing with a mixture, it is convenient to describe each mixture by using the concentration of the filler expressed as a fraction (mass of filler/total mass).
As one expects, the stress-strain curves of these blends present a nonlinear behavior.
For each batch of samples at the different filler concentrations given in
Table 1, we analyzed stress-strain relationship obtained from experiments and determine the material parameters
and
involved in the fitting function. The fitting procedure is carried out with the data provided by the tensile test machine of four dog bones for each considered filler concentration using as the fitting model the function
where denotes the stress (MPa), the strain, whereas and are constants to be determined.
From the relation (2.1) one can compute Young modulus by means of the formula (2.2) and compared with the corresponding experimental value.
The latter equation represents the derivative of the equation (2.1) with respect to the strain variable evaluated at strain equal to zero.
In the next Section, the analysis of the experimental stress-strain data for the various tested concentrations of the filler is discussed.
3. Results and Discussion
In this Section, fitting the stress-strain data for all the considered samples with the same family of functions, as a result we realize that the numerical values of the fitting parameters depend on the concentration of the filler. In particular, the parameter has a decreasing trend for increasing values of the concentration of the filler, whereas has an increasing trend.
Mechanical Characterization Tests
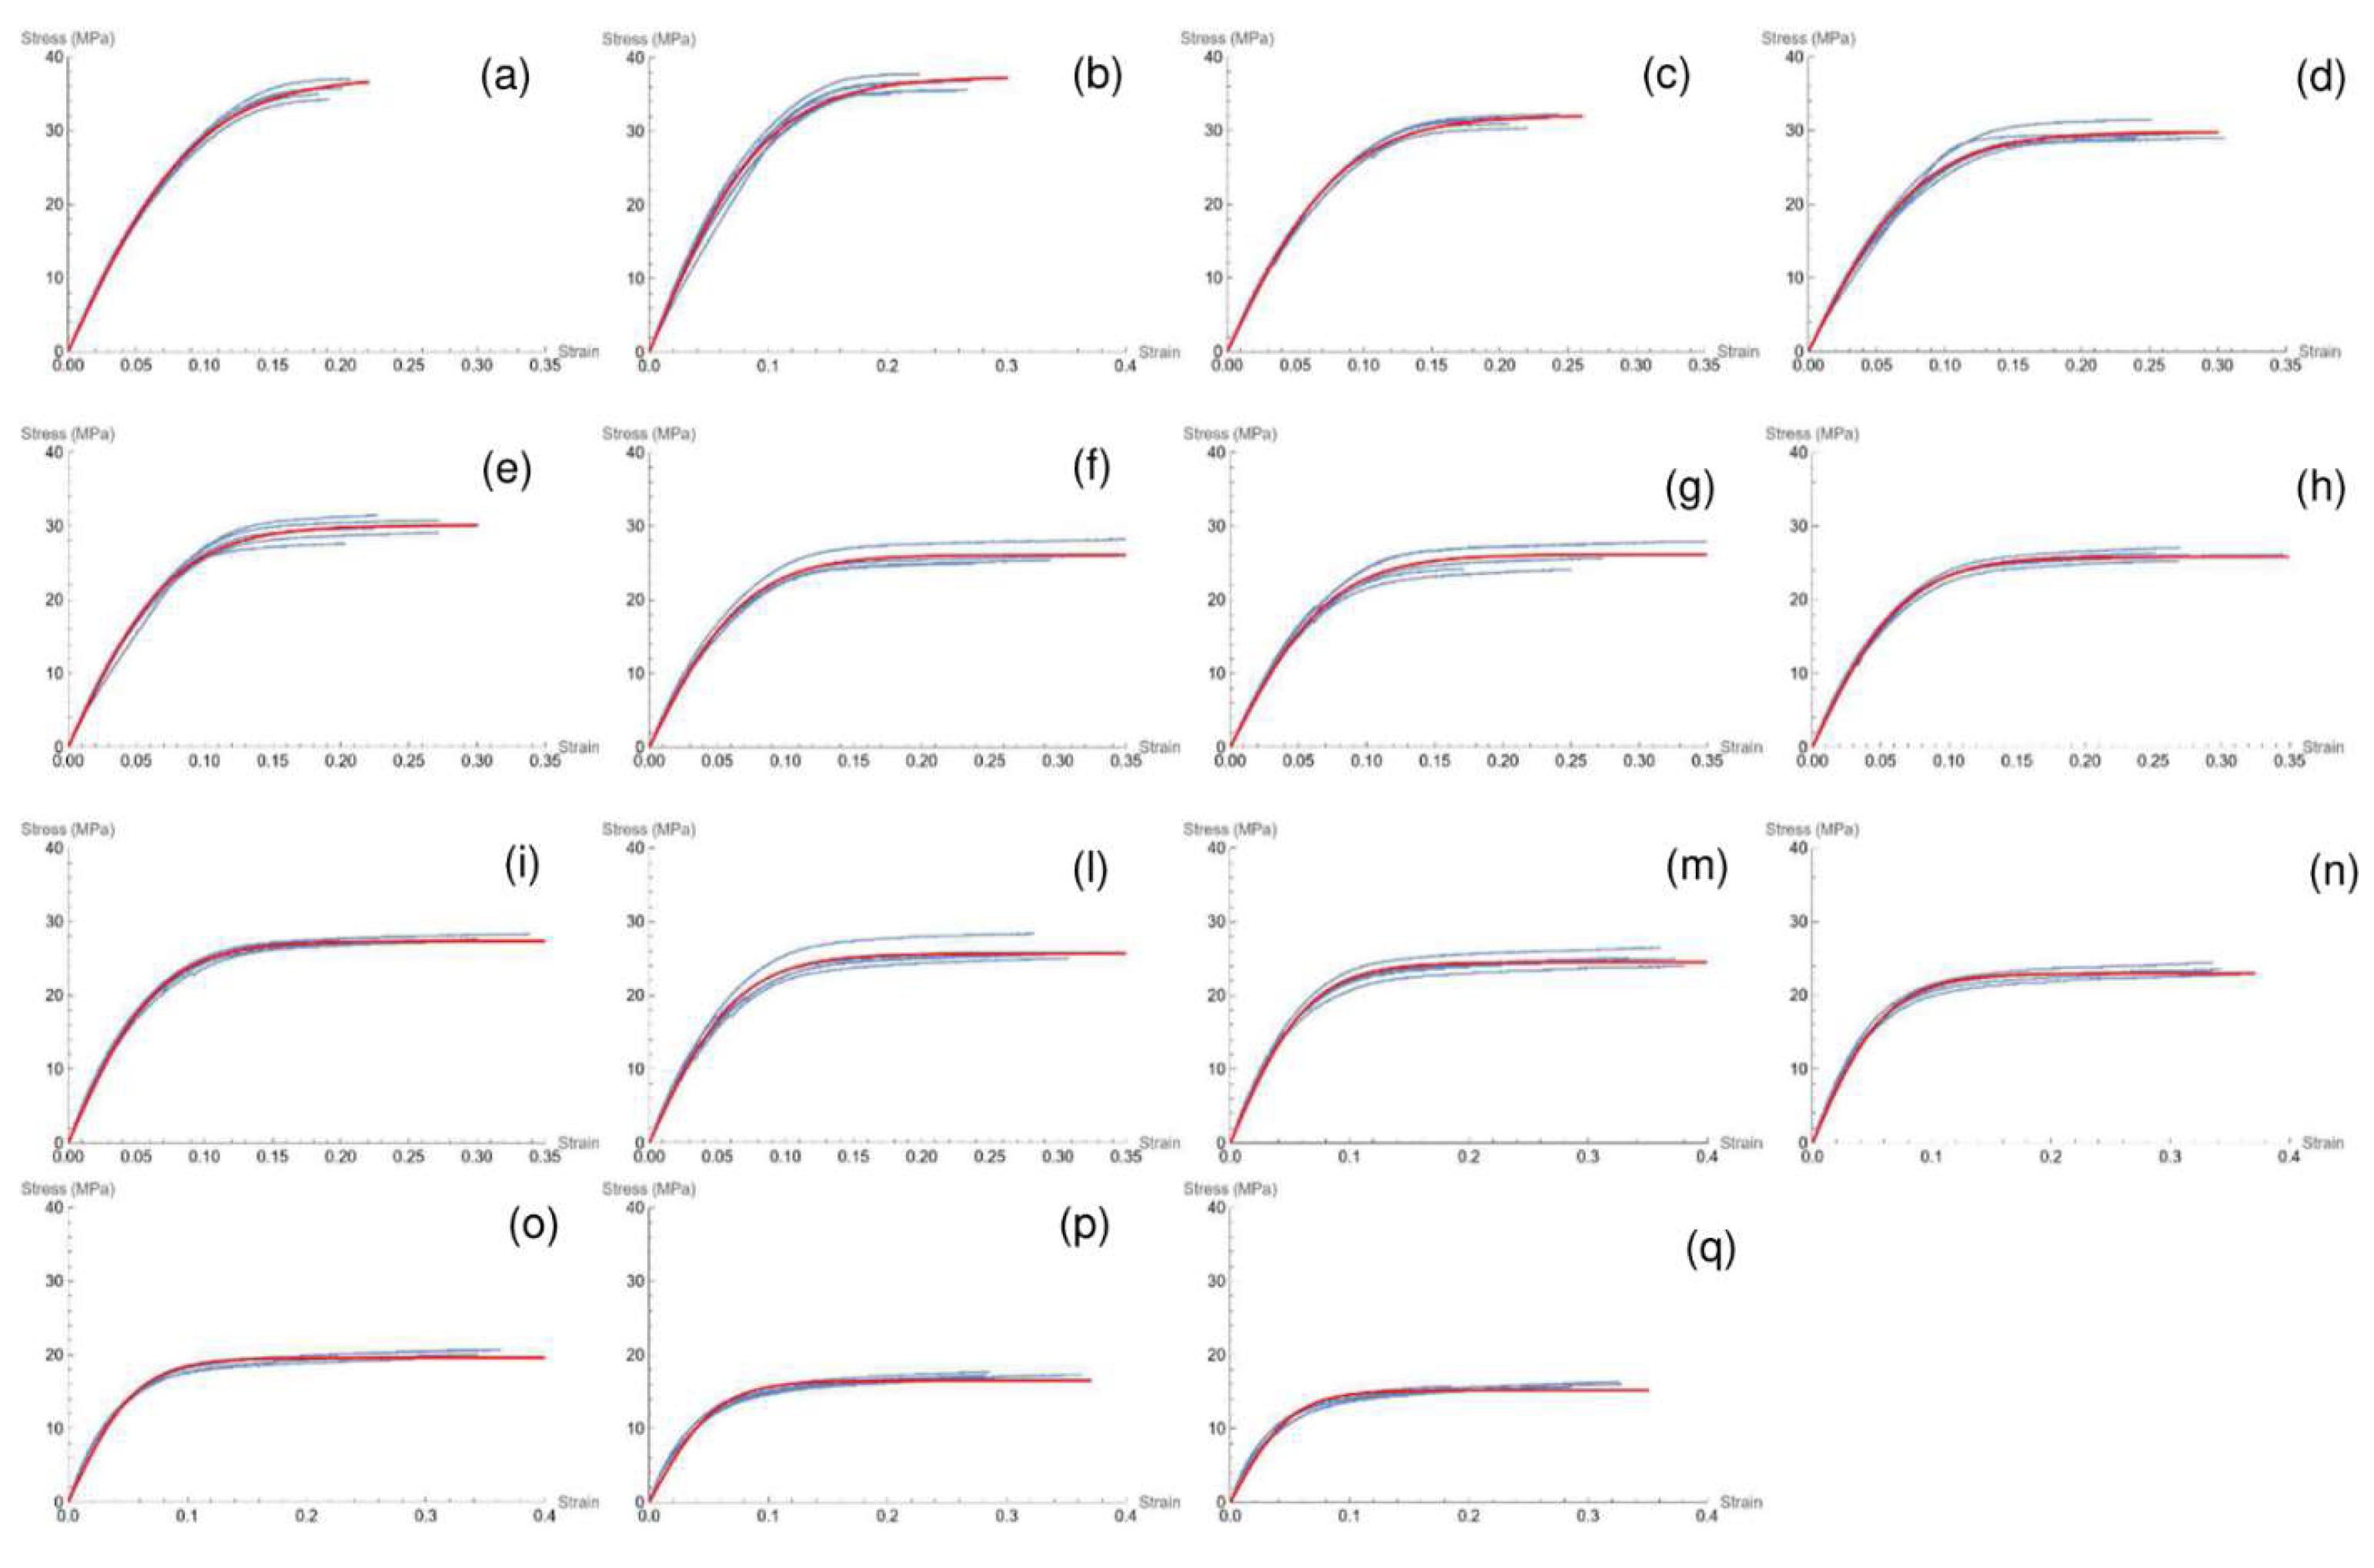
Figure 5 displays the experimental stress-strain curves of all the bio-composite materials. The curves show that the slope of the linear part (Young modulus) of the curve progressively decreases for increasing concentration of the filler, and the same trend applies also to the maximum stress.
The numerical values of the fitting parameter (
), the experimental mechanical parameter (stress at break and Young Modulus) and the Young Modulus, computed according to (2.2), are reported in
Table 2.
The plot of α vs BSG content (expressed as the fraction
) shows a linear dependence. In fact, a least square linear regression gives the following relation:
Figure 6a displays the plot of the experimental value of Stress at rupture,
and its linear regression vs. filler concentration (3.1).
The plot of β vs. BSG content shows a linear dependence, too. In fact, a least square linear regression provides the following relation:
The parameter α represents mathematically the steady state of the fitting curve, represented by (2.1). Since the stress-strain curve of the compound is almost accurately described by the latter equation, one can assume that α represents the Stress at rupture of the material, since the hyperbolic tangent for positive values of its argument approaches rapidly the value 1; this is also confirmed by the optimal match between
and the experimental value shown in
Figure 6a.
The trend of β as a function of filler content is also linear (see
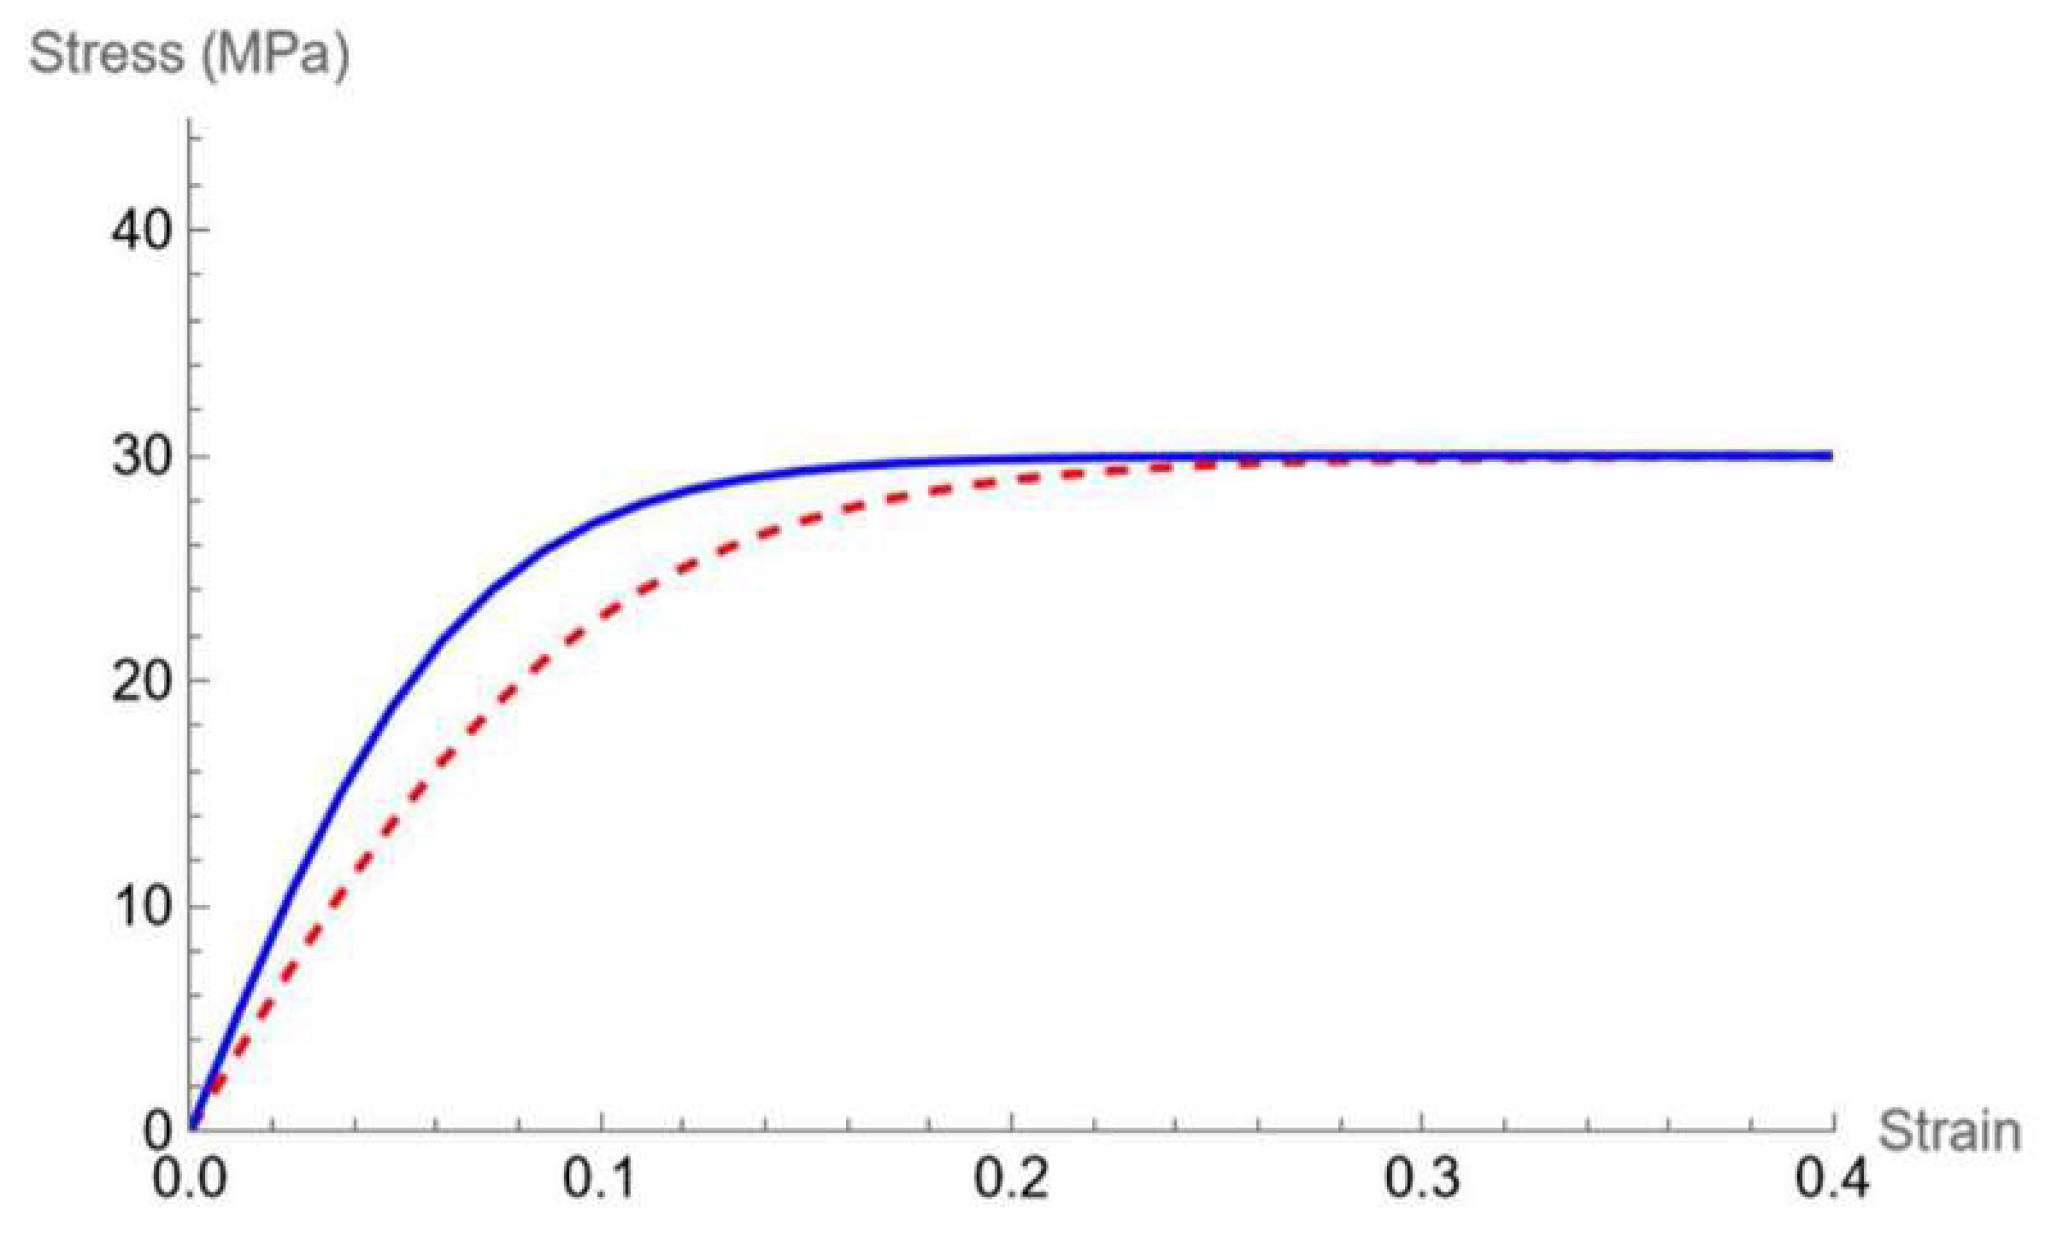
Figure 6b) and represented by the equation (3.1). The mathematical meaning of this parameter acts as a growth factor, i.e. how fast the dependent variable (Stress) reaches the saturation: greater the value of β is sooner the maximum value of Stress is attained, which means the maximum stress is reached at lower strain. This feature is displayed in
Figure 7.
The Young modulus according to equation (2.2) is directly related to the fitting parameters (α and β) which are described by means of the equations (3.1) and (3.2). As a matter of fact, the product of these two functions gives a second order polynomial:
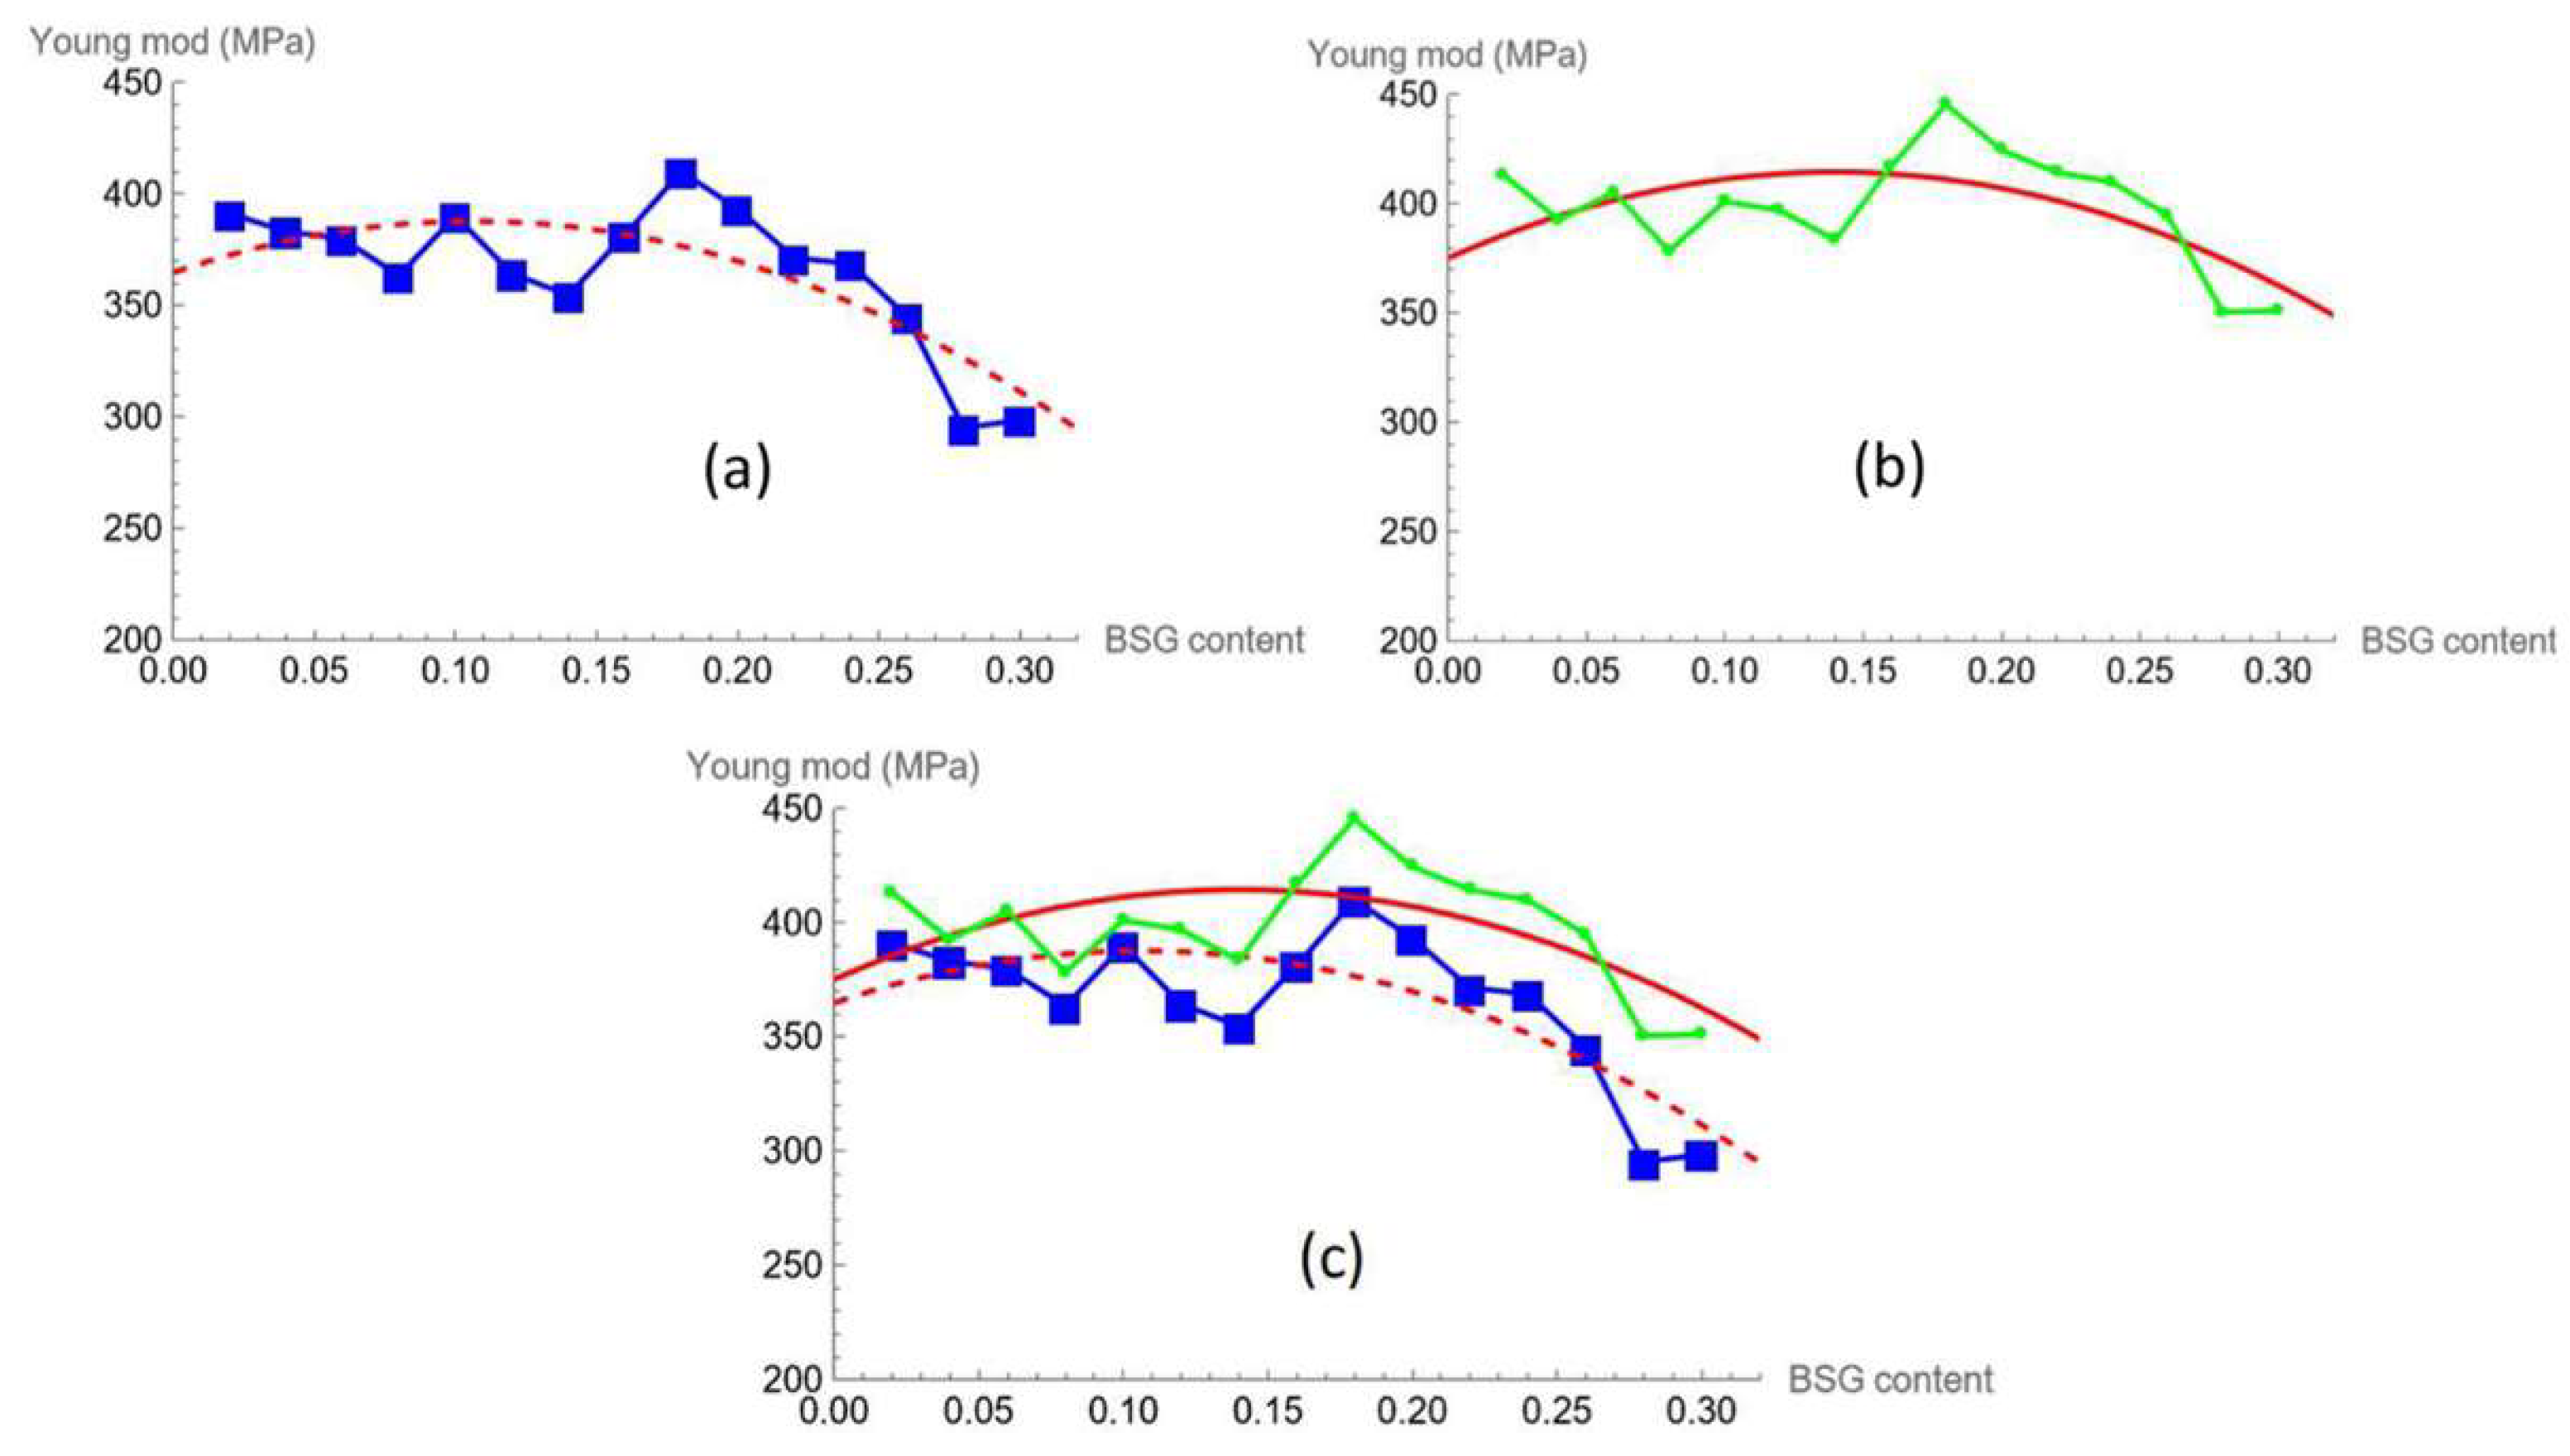
The previous equation is plotted against the filler content (
Figure 8a) to show the differences between the points (each point represents the product between
and
at the corresponding BSG content) and the function used.
To have a comparison between the experimental Young modulus (taken as the linear fitting on the initial part of the stress-strain curve) and the modelling procedure, we fit the experimental points with a polynomial of the same order of that resulting in (3.3), which gives the following equation:
The result, showed in
Figure 8b, is qualitatively the same. Instead, a global comparison which considers experimental data, α β, and equations (3.3) and (3.4) (
Figure 8c) puts in evidence the good agreement between the model and the experimental data.
The nonlinear trend of stiffness (which is instead described by a polynomial) can be related to the poor homogeneity of dispersion of the filler within the bio-composite mixture. This is because PBS and BSGF are not chemically compatible, as already discussed in
Section 1. In fact, PBS is a semi-crystalline apolar molecule while BSGF (mainly composed of cellulose and hemicellulose) is amorphous and polar [
37,
38]. New experimental stress-strain data, obtained using a different chemical formulation of the mixture, show that the Young modulus can be estimated by a linear decreasing function of the filler concentration. This will be the object of a forthcoming paper still in preparation.
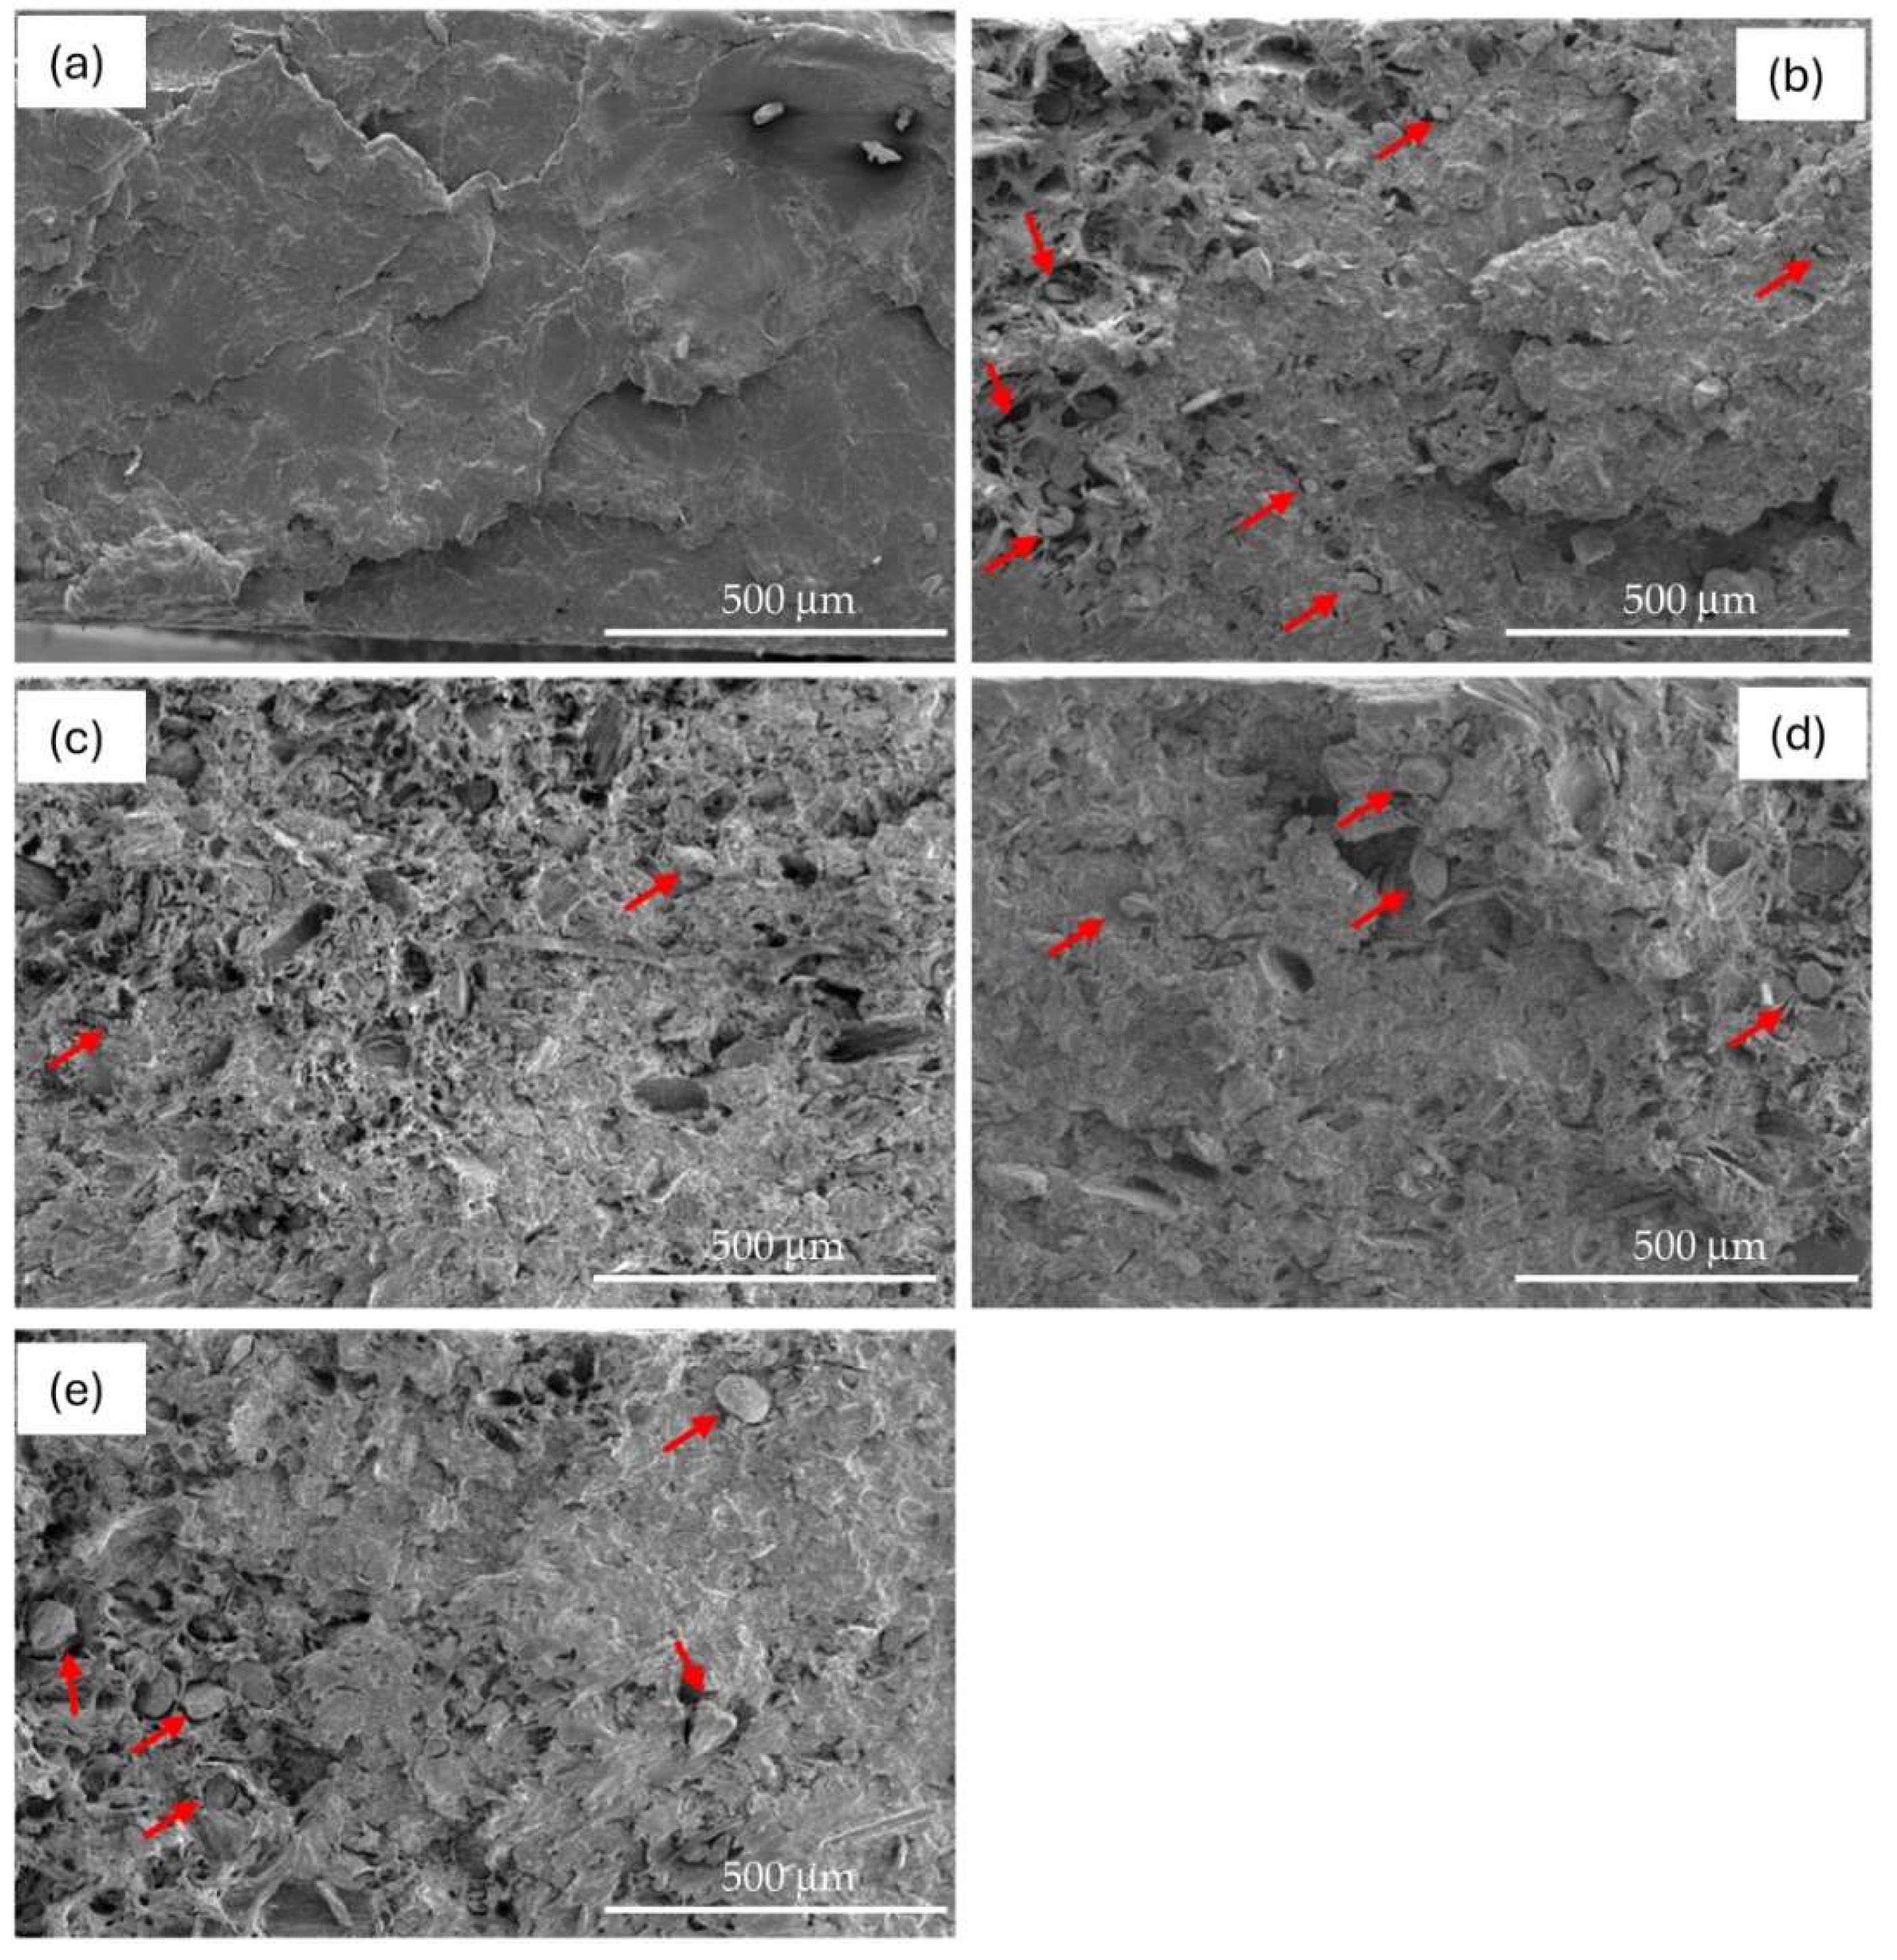
The lack of homogeneous distribution of BSGF within the PBS matrix in the PBS-BSGF10-20-25-30 bio-composites compared to the pure PBS reference sample, can be visualized through the SEM investigation in
Figure 9.
When BSGF is inserted into the PBS matrix, the smooth surface typical of the bioplastic (
Figure 9a) begins to be modified due to the presence of BSGF and their detachment after the fracture (
Figure 9b).
As the content of BSGF increases, the progressive increase of perforated areas in the fracture surface can be easily visualized (
Figure 9c,d,e). Anyway, the distribution of voids or particles attached to the matrix is not uniform, regardless the BSGF amount.
However, some BSGF particles appear to be incorporated into the PBS (see the red arrows in the images). Therefore, the BSGF and the PBS appear not to be totally unrelated to each other.
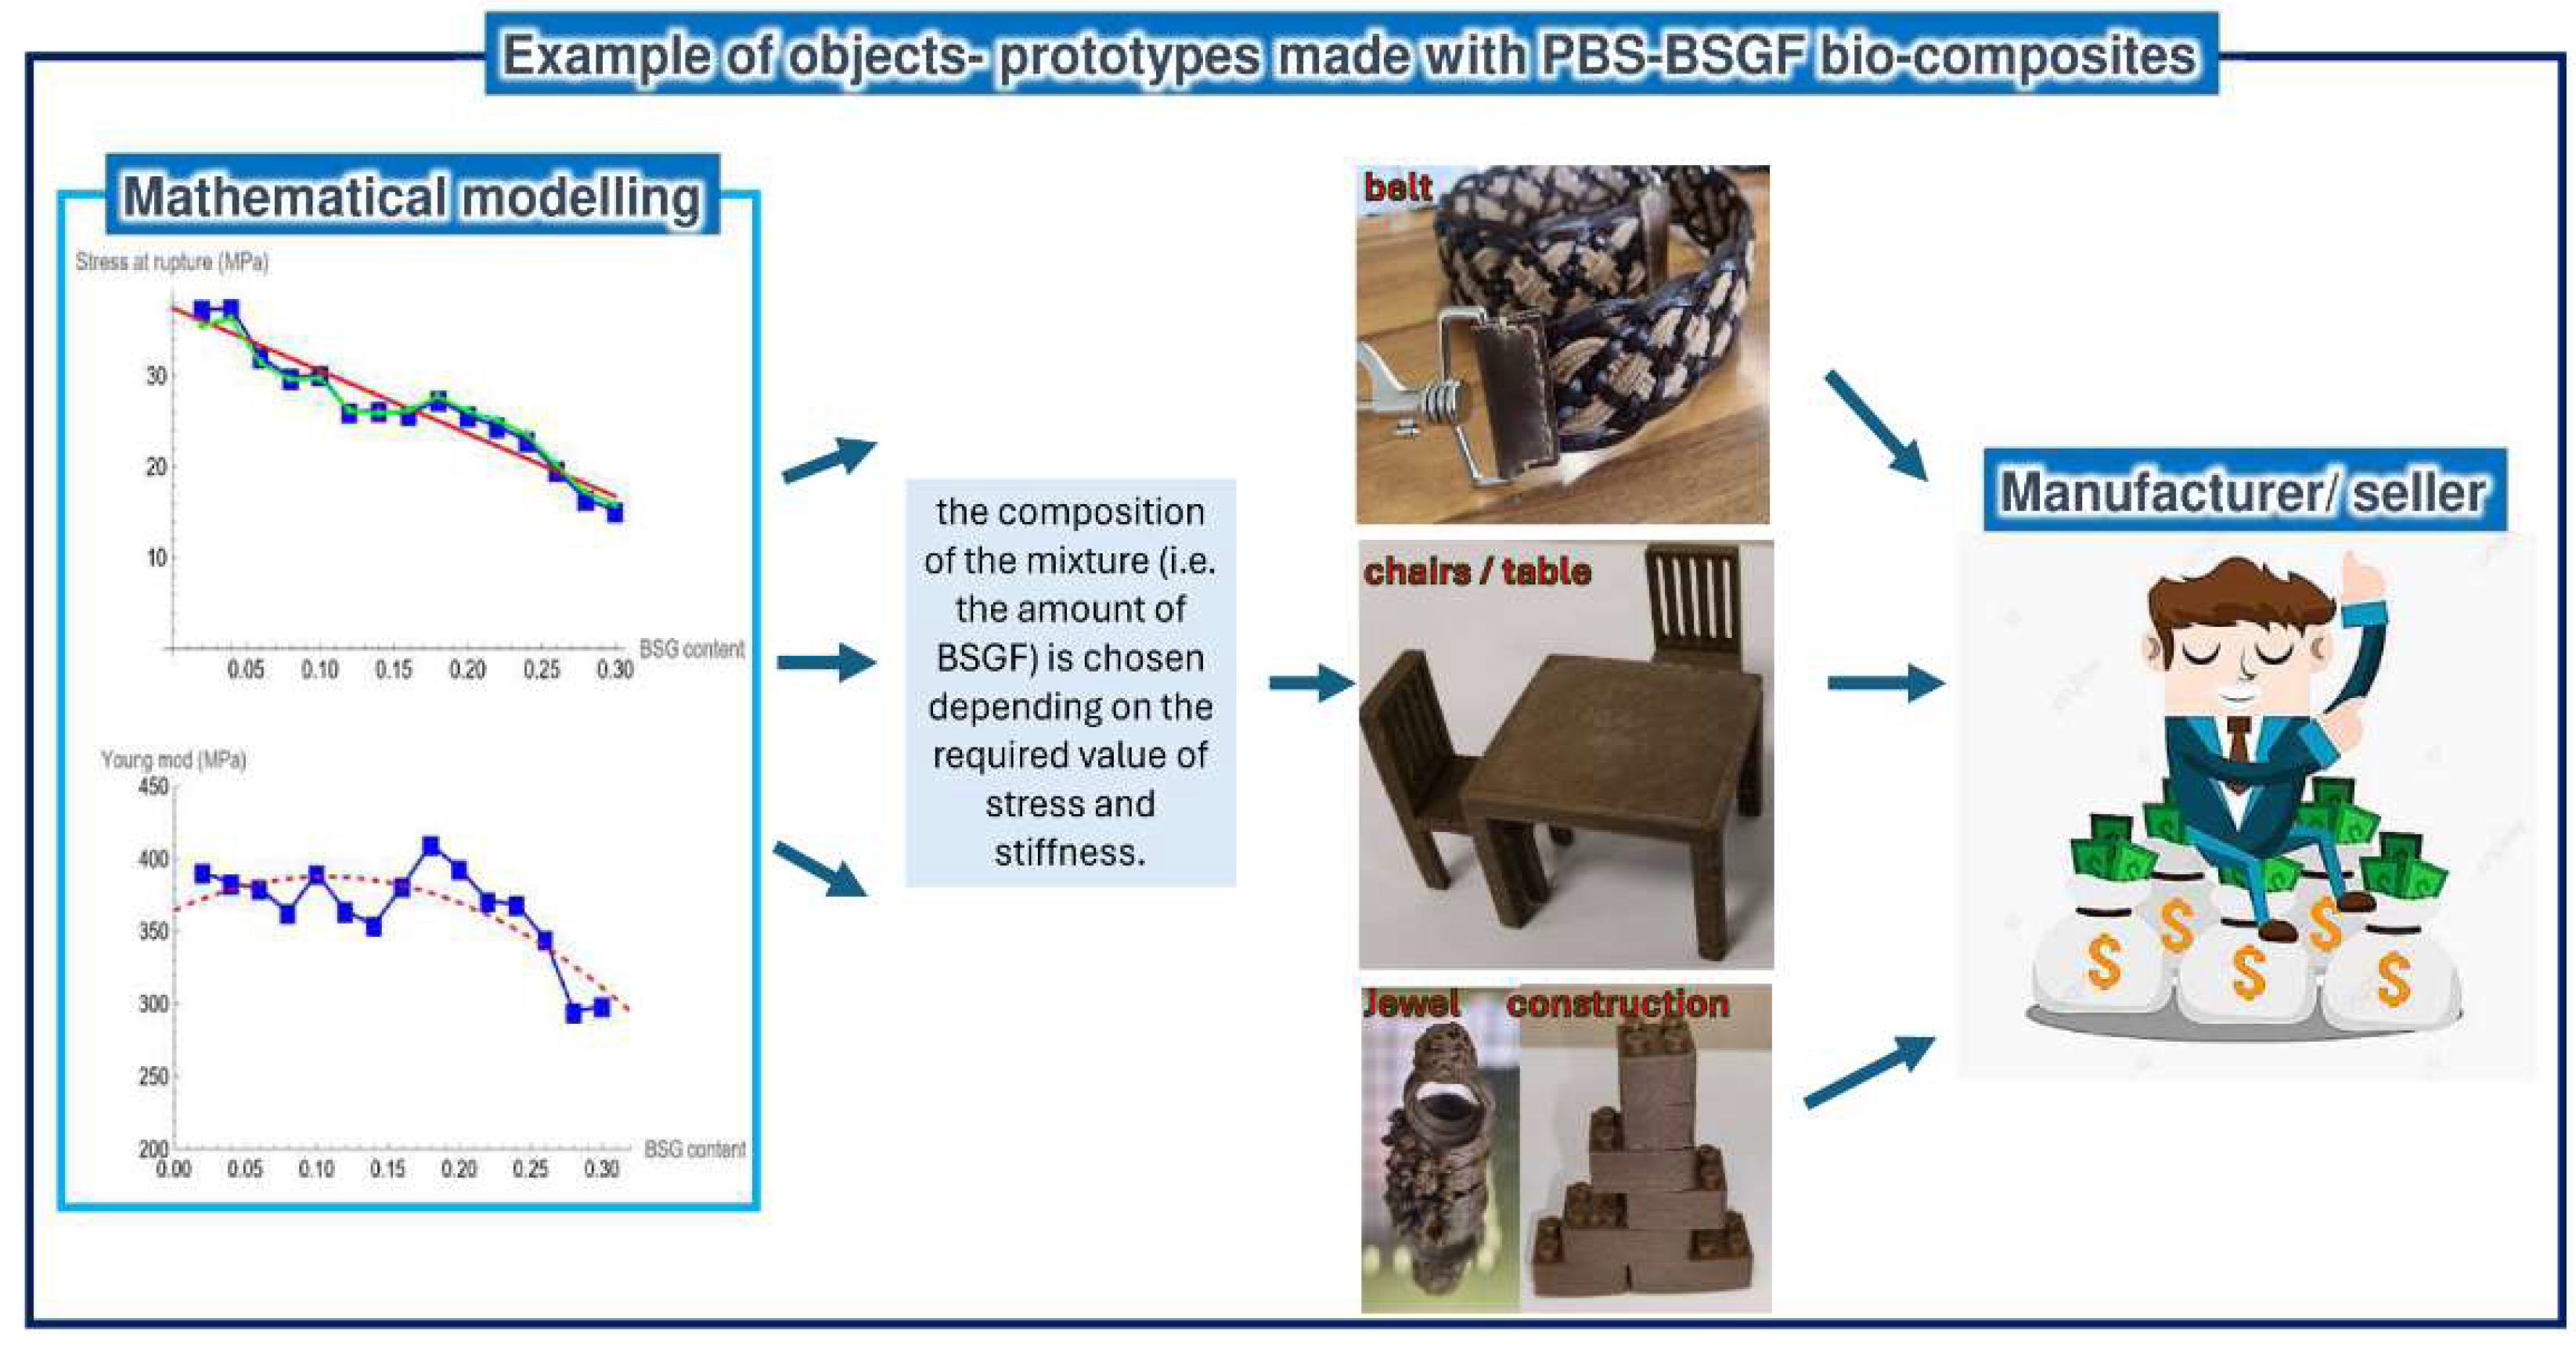
Finally, despite the poor compatibility between BSGF and PBS, several prototypes of objects have been realized with our PBS-BSGF mixtures investigated in this paper (see
Figure 10). The mathematical modeling helps to define the optimal quantity of filler to obtain the desired mechanical performance in terms of mechanical resistance and stiffness.
4. Conclusions
The problems related to both environmental pollutions caused by non-biodegradable fossil-based plastics and the necessity of disposing huge quantities of agri-food waste produced daily by the agri-food chain are well known. Based on the above premises, mixtures based on bioplastic (bio-PBS) and agri-food waste (for instance beer spent grain filler, BSGF) were prepared.
The focus of this work was the study of the mechanical tensile behavior of the mixtures with variable amounts of BSGF (from 2 to 30 percent in weight) with the aim of deriving mathematical relations that could model the mechanical behavior of these mixtures.
Despite the lack of optimal dispersion of the lignin-cellulose filler inside the polymer matrix, the mechanical resistance of mixtures was found to be effective to produce bio-composite. Remarkably, it was possible to propose a mathematical model to describe the mechanical behavior of these materials in terms of two parameters depending on the concentration of the filler.
The mathematical framework we used may effectively be useful in the production process as it allows to predict the mechanical traction parameters of a mixture with different concentrations of the filler, avoiding long and complex preparations and specific mechanical tests.
Further investigations on similar mixtures in which the chemical formulation is modified to make more homogeneous the distribution of the filler in the matrix is in their final stage. The mathematical analysis of these experimental results will be the subject of a forthcoming paper which is in preparation.
Author Contributions
Conceptualization, AV, CS, FO, AJR; methodology, AV, CS, FO, AJR; validation, AV, CS, FO, AJR; formal analysis, AV, CS, FO, AJR; investigation, AV, CS, FO, AJR; resources, AV; data curation, AJR; writing—original draft preparation, AV, CS, FO, AJR; writing—review and editing, AV, CS, FO, AJR; supervision, AV, FO. All authors have read and agreed to the published version of the manuscript.
Funding
Authors thanks LIFE project for the Environment and Climate Action” Project LIFE2021-SAP-ENV-101074314 LIFE-Reuse of bEer SpenT grAin foR bioplasTics – RESTART, co funded by European Community.
Institutional Review Board Statement
Not applicable.
Informed Consent Statement
Not applicable.
Data Availability Statement
the data presented in this study are available on request from the corresponding author.
Conflicts of Interest
The authors declare no conflicts of interest.
References
- Aliotta, L.; Seggiani, M.; Lazzeri, A.; Gigante, V.; Cinelli, P. A Brief Review of Poly (Butylene Succinate)(PBS) and Its Main Copolymers: Synthesis, Blends, Composites, Biodegradability, and Applications. Polymers 2022, 14, 844. [Google Scholar] [CrossRef]
- Wang JunDong, W.J.; Tan Zhi, T.Z.; Peng JinPing, P.J.; Qiu QiongXuan, Q.Q.; Li MeiMin, L.M. The Behaviors of Microplastics in the Marine Environment. 2016.
- Kibria, Md.G.; Masuk, N.I.; Safayet, R.; Nguyen, H.Q.; Mourshed, M. Plastic Waste: Challenges and Opportunities to Mitigate Pollution and Effective Management. Int J Environ Res 2023, 17, 20. [Google Scholar] [CrossRef]
- Gale, D. The Theory of Linear Economic Models; University of Chicago press, 1989.
- US EPA, O. Causes of Climate Change. Available online: https://www.epa.gov/climatechange-science/causes-climate-change (accessed on 23 September 2024).
- Paletta, A.; Leal Filho, W.; Balogun, A.-L.; Foschi, E.; Bonoli, A. Barriers and Challenges to Plastics Valorisation in the Context of a Circular Economy: Case Studies from Italy. Journal of Cleaner Production 2019, 241, 118149. [Google Scholar] [CrossRef]
- Jan-Georg, R.; Langer, R.; Giovanni, T. Bioplastics for a Circular Economy. Nature Reviews. Materials 2022, 7, 117–137. [Google Scholar]
- RameshKumar, S.; Shaiju, P.; O’Connor, K.E. Bio-Based and Biodegradable Polymers-State-of-the-Art, Challenges and Emerging Trends. Current Opinion in Green and Sustainable Chemistry 2020, 21, 75–81. [Google Scholar] [CrossRef]
- Samir, A.; Ashour, F.H.; Hakim, A.A.; Bassyouni, M. Recent Advances in Biodegradable Polymers for Sustainable Applications. Npj Materials Degradation 2022, 6, 68. [Google Scholar] [CrossRef]
- Xie, Y.; Gao, S.; Zhang, D.; Wang, C.; Chu, F. Bio-Based Polymeric Materials Synthesized from Renewable Resources: A Mini-Review. Resources Chemicals and Materials 2023, 2, 223–230. [Google Scholar] [CrossRef]
- Di Bartolo, A.; Infurna, G.; Dintcheva, N.T. A Review of Bioplastics and Their Adoption in the Circular Economy. Polymers 2021, 13, 1229. [Google Scholar] [CrossRef]
- Visco, A.; Scolaro, C.; Facchin, M.; Brahimi, S.; Belhamdi, H.; Gatto, V.; Beghetto, V. Agri-Food Wastes for Bioplastics: European Prospective on Possible Applications in Their Second Life for a Circular Economy. Polymers 2022, 14. [Google Scholar] [CrossRef]
- Beghetto, V.; Gatto, V.; Samiolo, R.; Scolaro, C.; Brahimi, S.; Facchin, M.; Visco, A. Plastics Today: Key Challenges and EU Strategies towards Carbon Neutrality: A Review. Environmental Pollution 2023, 122102. [Google Scholar] [CrossRef]
- Platnieks, O.; Gaidukovs, S.; Thakur, V.K.; Barkane, A.; Beluns, S. Bio-Based Poly (Butylene Succinate): Recent Progress, Challenges and Future Opportunities. European Polymer Journal 2021, 161, 110855. [Google Scholar] [CrossRef]
- Scolaro, C.; Brahimi, S.; Falcone, A.; Beghetto, V.; Visco, A. Mechanical and Physical Changes in Bio-Polybutylene-Succinate Induced by UVC Ray Photodegradation. Polymers 2024, 16, 1288. [Google Scholar] [CrossRef]
- Liu, L.; Yu, J.; Cheng, L.; Qu, W. Mechanical Properties of Poly (Butylene Succinate)(PBS) Biocomposites Reinforced with Surface Modified Jute Fibre. Composites Part A: Applied Science and Manufacturing 2009, 40, 669–674. [Google Scholar] [CrossRef]
- Alcántara, J.C.; González, I.; Pareta, M.M.; Vilaseca, F. Biocomposites from Rice Straw Nanofibers: Morphology, Thermal and Mechanical Properties. Materials 2020, 13, 2138. [Google Scholar] [CrossRef]
- Faruk, O.; Bledzki, A.K.; Fink, H.-P.; Sain, M. Biocomposites Reinforced with Natural Fibers: 2000–2010. Progress in polymer science 2012, 37, 1552–1596. [Google Scholar]
- Martijanti, M.; Juwono, A.L.; Sutarno, S. Investigation of Characteristics of Bamboo Fiber for Composite Structures. In Proceedings of the IOP Conference Series: Materials Science and Engineering; IOP Publishing, 2020; Vol. 850; p. 012028. [Google Scholar]
- Shahzad, A. Hemp Fiber and Its Composites – a Review. Journal of Composite Materials 2012, 46, 973–986. [Google Scholar] [CrossRef]
- Yadav, R.; Singh, M.; Shekhawat, D.; Lee, S.-Y.; Park, S.-J. The Role of Fillers to Enhance the Mechanical, Thermal, and Wear Characteristics of Polymer Composite Materials: A Review. Composites Part A: Applied Science and Manufacturing 2023, 175, 107775. [Google Scholar] [CrossRef]
- Brancato, V.; Visco, A.; Pistone, A.; Piperno, A.; Iannazzo, D. Effect of Functional Groups of Multi-Walled Carbon Nanotubes on the Mechanical, Thermal and Electrical Performance of Epoxy Resin Based Nanocomposites. Journal of Composite Materials 2013, 47, 3091–3103. [Google Scholar] [CrossRef]
- Fu, S.-Y.; Feng, X.-Q.; Lauke, B.; Mai, Y.-W. Effects of Particle Size, Particle/Matrix Interface Adhesion and Particle Loading on Mechanical Properties of Particulate–Polymer Composites. Composites Part B: Engineering 2008, 39, 933–961. [Google Scholar] [CrossRef]
- Treloar, L.R.G. THE ELASTICITY OF A NETWORK OF LONG- CHAIN MOLECULES. I.
- Mooney, M. A Theory of Large Elastic Deformation. Journal of applied physics 1940, 11, 582–592. [Google Scholar] [CrossRef]
- Rivlin, R.S. Large Elastic Deformations of Isotropic Materials IV. Further Developments of the General Theory. Phil. Trans. R. Soc. Lond. A 1948, 241, 379–397. [Google Scholar] [CrossRef]
- Gent, A.N. A New Constitutive Relation for Rubber. Rubber chemistry and technology 1996, 69, 59–61. [Google Scholar] [CrossRef]
- Arruda, E.M.; Boyce, M.C. A Three-Dimensional Constitutive Model for the Large Stretch Behavior of Rubber Elastic Materials. Journal of the Mechanics and Physics of Solids 1993, 41, 389–412. [Google Scholar] [CrossRef]
- Horgan, C.O.; Saccomandi, G. A Molecular-Statistical Basis for the Gent Constitutive Model of Rubber Elasticity. Journal of Elasticity 2002, 68, 167–176. [Google Scholar] [CrossRef]
- Alasfar, R.H.; Ahzi, S.; Barth, N.; Kochkodan, V.; Khraisheh, M.; Koç, M. A Review on the Modeling of the Elastic Modulus and Yield Stress of Polymers and Polymer Nanocomposites: Effect of Temperature, Loading Rate and Porosity. Polymers 2022, 14, 360. [Google Scholar] [CrossRef]
- Potluri, R.; Diwakar, V.; Venkatesh, K.; Reddy, B.S. Analytical Model Application for Prediction of Mechanical Properties of Natural Fiber Reinforced Composites. Materials today: proceedings 2018, 5, 5809–5818. [Google Scholar] [CrossRef]
- Kazmer, D.O.; Masato, D.; Piccolo, L.; Puleo, K.; Krantz, J.; Venoor, V.; Colon, A.; Limkaichong, J.; Dewar, N.; Babin, D. Multivariate Modeling of Mechanical Properties for Hot Runner Molded Bioplastics and a Recycled Polypropylene Blend. Sustainability 2021, 13, 8102. [Google Scholar] [CrossRef]
- Zhou, Y.; Weng, Y.; Li, L.; Hu, B.; Huang, X.; Zhu, Z. Recycled GFRP Aggregate Concrete Considering Aggregate Grading: Compressive Behavior and Stress–Strain Modeling. Polymers 2022, 14, 581. [Google Scholar] [CrossRef]
- Morro, A.; Giorgi, C. Mathematical Modelling of Continuum Physics; Modeling and Simulation in Science, Engineering and Technology; Springer International Publishing: Cham, 2023; ISBN 978-3-031-20813-3. [Google Scholar]
- Ramberg, W.; Osgood, W.R. Description of Stress-Strain Curves by Three Parameters. 1943.
- Castro, J.; Ostoja-Starzewski, M. Elasto-Plasticity of Paper. International Journal of Plasticity 2003, 19, 2083–2098. [Google Scholar] [CrossRef]
- Liu, H.; Ma, J.; Zhu, C.; Xu, J.; Gong, J. Miscibility and Crystallization Behavior of Poly (Ethylene Terephthalate)/Phosphate Glass Hybrids. Journal of Macromolecular Science, Part B 2016, 55, 1039–1050. [Google Scholar] [CrossRef]
- Ikram, S.; Huang, L.; Zhang, H.; Wang, J.; Yin, M. Composition and Nutrient Value Proposition of Brewers Spent Grain. Journal of Food Science 2017, 82, 2232–2242. [Google Scholar] [CrossRef]
- Reuse of bEer SpenT grAin foR bioplasTics Available online: https://webgate.ec.europa.eu/life/publicWebsite/project/LIFE21-ENV-IT-LIFE-RESTART-101074314/reuse-of-beer-spent-grain-for-bioplastics.
Figure 1.
Scheme of production of PBS-BSGF, from raw materials to bio-compound: the processing of BSG to obtain fine power (size: 53 micrometer) (a, b, c, d), the drying and checking of the humidity level (e, f), the melt mixing of BSGF with PBS (g, h), the production of sheet (i, l) and of dog-bone (m, n).
Figure 4.
Engineering Stress-Strain curves of PBS (a) and PBS-BSGF4 dog-bone specimens (b).
Figure 4.
Engineering Stress-Strain curves of PBS (a) and PBS-BSGF4 dog-bone specimens (b).
Figure 5.
Stress-Strain curves (blue) and non-linear fitting curve (red) of bio-compounds at different concentration of BSGF filler, from left to right: PBS-BSGF2 (a), PBS-BSGF4 (b), PBS-BSGF6 (c), PBS-BSGF8 (d), PBS-BSGF10 (e), PBS-BSGF12 (f), PBS-BSGF14 (g), PBS-BSGF16 (h), PBS-BSGF-18 (i), PBS-BSGF20 (l), PBS-BSGF22 (m), PBS-BSGF24 (n), PBS-BSGF26 (o), PBS-BSGF 28 (p), PBS-BSGF30 (q).
Figure 6.
α, Stress at rupture vs. BSG concentration: experimental points (green line-spot), α parameter (blue line-square dot), linear regression function (red continuous line) (a). β parameters (blue spots) and the linear fitting (red continuous line) (b).
Figure 6.
α, Stress at rupture vs. BSG concentration: experimental points (green line-spot), α parameter (blue line-square dot), linear regression function (red continuous line) (a). β parameters (blue spots) and the linear fitting (red continuous line) (b).
Figure 7.
α=30, β=10 (dashed red line), α=30, β=15 (continuous blue line).
Figure 7.
α=30, β=10 (dashed red line), α=30, β=15 (continuous blue line).
Figure 8.
Model (square blue dot) and the polynomial in eq. (3.3) (continuous red line) vs BSG content (a); experimental (green line-spot) and its fitting (dashed red line) vs BSG content (b); Superposition of the plots showed in
Figure 8a and
Figure 8b (c).
Figure 8.
Model (square blue dot) and the polynomial in eq. (3.3) (continuous red line) vs BSG content (a); experimental (green line-spot) and its fitting (dashed red line) vs BSG content (b); Superposition of the plots showed in
Figure 8a and
Figure 8b (c).
Figure 9.
SEM micrographs at 300x of: PBS (a), PBS-BSGF10 (b), PBS-BSGF20 (c), PBS-BSGF25 (d), PBS-BSGF30 (e).
Figure 9.
SEM micrographs at 300x of: PBS (a), PBS-BSGF10 (b), PBS-BSGF20 (c), PBS-BSGF25 (d), PBS-BSGF30 (e).
Figure 10.
How the mathematical model can help the object production with some examples of prototypes made by some partners/stakeholder of the Life Restart Project with the PBS-BSGF material of this study [
39].
Figure 10.
How the mathematical model can help the object production with some examples of prototypes made by some partners/stakeholder of the Life Restart Project with the PBS-BSGF material of this study [
39].
Table 2.
Fitting parameters (, stress at break from experimental data (σrexp), Young Modulus from model (Emodel) and from experimental data (Eexp).
Table 2.
Fitting parameters (, stress at break from experimental data (σrexp), Young Modulus from model (Emodel) and from experimental data (Eexp).
| % filler |
α
(conf. interval)
(MPa) |
σrexp ± std dev
(MPa) |
β
(conf. interval) |
Emodel
(MPa) |
Eexp ± std dev
(MPa) |
| 2% |
37.35
(37.29, 37.40) |
35.54±1.05 |
10.47
(10.43, 10.51) |
391.17 |
413.48±11.38 |
| 4% |
37.43
(37.38-37.49) |
36.28±1.00 |
10.24
(10.20-10.29) |
383.40 |
392.63±32.80 |
| 6% |
32.09
(32.05-32.12) |
31.41±0.75 |
11.83
(11.80-11.87) |
379.73 |
405.20±11.02 |
| 8% |
29.82
(29.78-29.86) |
29.64±0.99 |
12.19
(12.14-12.24) |
363.50 |
378.52±23.61 |
| 10% |
30.13
(30.08-30.18) |
29.77±1.49 |
12.95
(12.89-13.02) |
390.26 |
401.13±27.58 |
| 12% |
26.11
(26.07-26.16) |
26.16±1.46 |
13.95
(13.86-14.05) |
364.33 |
396.99±20.88 |
| 14% |
26.17
(26.11-26.22) |
25.91±1.84 |
13.55
(13.46-13.65) |
354.66 |
383.51±11.60 |
| 16% |
25.85
(25.83-25.88) |
26.20±0.63 |
14.76
(14.71-14.81) |
381.69 |
417.00±14.68 |
| 18% |
27.36
(27.34-27.38) |
27.72±0.45 |
14.98
(14.94-15.03) |
410.00 |
445.48±16.59 |
| 20% |
25.69
(25.65-25.74) |
26.15±1.29 |
15.31
(15.20-15.42) |
393.38 |
424.67±18.93 |
| 22% |
24.48
(24.45-24.51) |
25.10±0.89 |
15.17
(15.09-15.26) |
371.44 |
414.44±10.42 |
| 24% |
22.97
(22.96-22.99) |
23.55±0.58 |
16.05
(16.00-16.11) |
368.75 |
410.00±18.34 |
| 26% |
19.61
(19.59-19.64) |
20.23±0.62 |
17.59
(17.49-17.70) |
345.06 |
394.92±12.49 |
| 28% |
16.54
(16.51-16.56) |
17.21±0.36 |
17.85
(17.75-17.95) |
295.22 |
350.41±13.81 |
| 30% |
15.20
(15.18-15.22) |
15.87±0.37 |
19.64
(19.52-19.77) |
298.62 |
351.18±22.58 |
|
Disclaimer/Publisher’s Note: The statements, opinions and data contained in all publications are solely those of the individual author(s) and contributor(s) and not of MDPI and/or the editor(s). MDPI and/or the editor(s) disclaim responsibility for any injury to people or property resulting from any ideas, methods, instructions or products referred to in the content. |
© 2024 by the authors. Licensee MDPI, Basel, Switzerland. This article is an open access article distributed under the terms and conditions of the Creative Commons Attribution (CC BY) license (http://creativecommons.org/licenses/by/4.0/).

