Preprint
Article

Metabolomics-Based Machine Learning for Predicting Mortality: Unveiling Multisystem Impacts on Health

Altmetrics

Downloads

80

Views

36

Comments

0

A peer-reviewed article of this preprint also exists.

Submitted:

04 October 2024

Posted:

07 October 2024

You are already at the latest version

Alerts
Abstract
Reliable predictors of long-term all-cause mortality are needed for middle-aged and older populations. Previous metabolomics mortality studies have limitations, a low number of participants and metabolites measured, measurements mainly using nuclear magnetic spectroscopy, and the use only of conventional statistical methods. To overcome these challenges, we applied liquid chromatography–tandem mass spectrometry and measured > 1000 metabolites in the METSIM study including 10.197 men. We applied the machine learning approach together with conventional statistical methods to identify metabolites associated with all-cause mortality. The three independent machine learning methods (logistic regression, XGBoost, Welch’test) identified 32 metabolites having the most im-pactful associations with all-cause mortality (25 increasing and 7 decreasing the risk). From these metabolites 20 were novel and encompassed various metabolic pathways, impacting cardiovascular, renal, respiratory, endocrine, and central nervous systems. In the In the Cox regression analyses (hazard rations and their 95% confidence intervals) clinical and laboratory risk factors increased the risk of all-cause mortality significantly by 1.76 (1.60-1.94), 25 metabolites by 1.89 (1.68-2.12), and 25 metabolites and clinical and labor-atory risk factors 2.00 (1.81-2.22). In our study the main causes of death were cancers (28%) and cardiovascular diseases (25%). We did not identify any metabolites associated with cancer but found 13 metabolites associated with an increased risk of cardiovascular dis-eases. Our study reports several novel metabolites associated with an increased risk of mortality and shows that these 25 metabolites improved the prediction of all-cause mor-tality beyond and above clinical and laboratory measurements.
Keywords: 
Subject: Medicine and Pharmacology  -   Clinical Medicine

1. Introduction

Identifying predictors for all-cause mortality is essential to improve the risk assessment in medical decision-making and elucidate the pathways leading to disease outcomes. Studies with detailed longitudinal clinical data surrounding death give the opportunity to better understand the risk factors of mortality. Metabolic biomarkers for all-cause mortality reflect multimorbidity among middle-aged and older people and not only for specific diseases [1]. However, our understanding of metabolic changes that underlie mortality and the aging process remains incomplete.
Previous studies on all-cause mortality have focused mainly on clinical and laboratory measurements or identification of metabolic biomarkers for specific diseases and conditions, including cardiovascular diseases, type 2 diabetes, and chronic kidney disease [2,3,4,5,6]. Three previous studies identified metabolic biomarkers for all-cause mortality by applied nuclear magnetic resonance (NMR) spectroscopy. The strength of these studies lies in their large sample sizes, which have allowed for the replication of findings in other cohorts. The limitation of these studies is that the number of metabolites measured was low, from 98 to 226 [789]. The sensitivity of NMR is low compared to the Liquid Chromatography Mass Spectrometry (LC-MS/MS) method. LC-MS/MS method detects a large pool of metabolites (> 1.000), and therefore it plays a dominant role in the metabolomics field. Mass spectrometry is intrinsically a highly sensitive method for the detection, quantitation, and structure elucidation of metabolites [10]. Wang at al. were the first to apply LC/MS approach to investigate the association of 243 metabolites with mortality in 13.512 individuals and found that higher levels of N2, N2-dimethylguanosine, pseudo uridine, N4-acetylcytidine, 4-acetamidobutanoic acid, N1-acetylspermidine, and lipids with fewer double bonds were associated with an increased risk of all-cause mortality [3].
Previous studies trying to find metabolic biomarkers for mortality have applied conventional statistics, which have limitations due to high internal correlations, class diversity, and exposure-outcome disparities. Artificial intelligence includes several technologies of Machine Learning (ML) approach, and therefore it is well suited to mortality studies. It focuses on empirical prediction of an outcome in contrast to traditional statistical methods [11]. Several methods, including ML tools have been applied to metabolomics to create clinical prediction models. ML methods can analyze thousands of predictors effectively by optimizing predictive performance while capturing complicated patterns in the data, including non-linear relationships. It is especially well suited to studies applying metabolomics in mortality data, as the mechanisms of action and interactions between the metabolites are biologically diverse and interconnected [11].
We hypothesized that identifying metabolites by the LC-MS/MS platform and applying parallel, conventional statistical methods with ML tools, improve the identification of metabolites associated with all-cause mortality. Our study is the first to apply LC-MS/MS metabolomics-based method together with ML to investigate metabolites associated with all-cause mortality in a large population-based cohort including 10.197 men.

2. Results

2.1. Baseline Characteristics of the Study Population

Table 1 shows the baseline characteristics of the participants alive (N = 8.851) and the participants who died during the follow-up (N = 1.346). Compared to the participants alive, the participants who died during the follow-up were older, had higher body mass index (BMI) and waist circumference, were more often smokers, had higher systolic blood pressure, low-density lipoprotein cholesterol (LDLC), total triglycerides, fasting glucose, high-sensitivity C-reactive protein (hs-CRP), type 2 diabetes (T2D), creatinine, urinary albumin excretion (UAE), and lower estimated glomerular filtration rate (eGFR). No difference between the two groups was observed for alanine transferase (ALT).

2.2. Most Impactful Metabolite Predictors of Mortality Identified by Machine Learning

Figure S1 shows the post-processing of the data from the original dataset (N = 1.540) to the identification of the most impactful metabolites predicting mortality based on each of the three ML methods (Welch test, XGBoost, Logistic regression). We obtained the final list of 32 metabolites shared by all three ML models. Figure S2 shows the relative importance of metabolites on mortality prediction by absolute SHAP values. SVM model for binary classification of mortality prediction yielded the following performance metrics, precision 0.87, accuracy 0.84, and ROC-AUC 0.75 (Area Under the Curve of the Receiver Operating Characteristic curve). The ROC-AUC values were evaluated from an independent test set. In the logistic regression model of 32 metabolites the performance of corresponding metrics was as follows, precision 0.78, accuracy 0.84, and ROC-AUC 0.77, and for the XGBoost binary classifier model, precision 0.64, accuracy 0.71, and ROC-AUC 0.79. Figure 1 shows the ROC-AUC curves for the three models. Results were very similar across the three models.
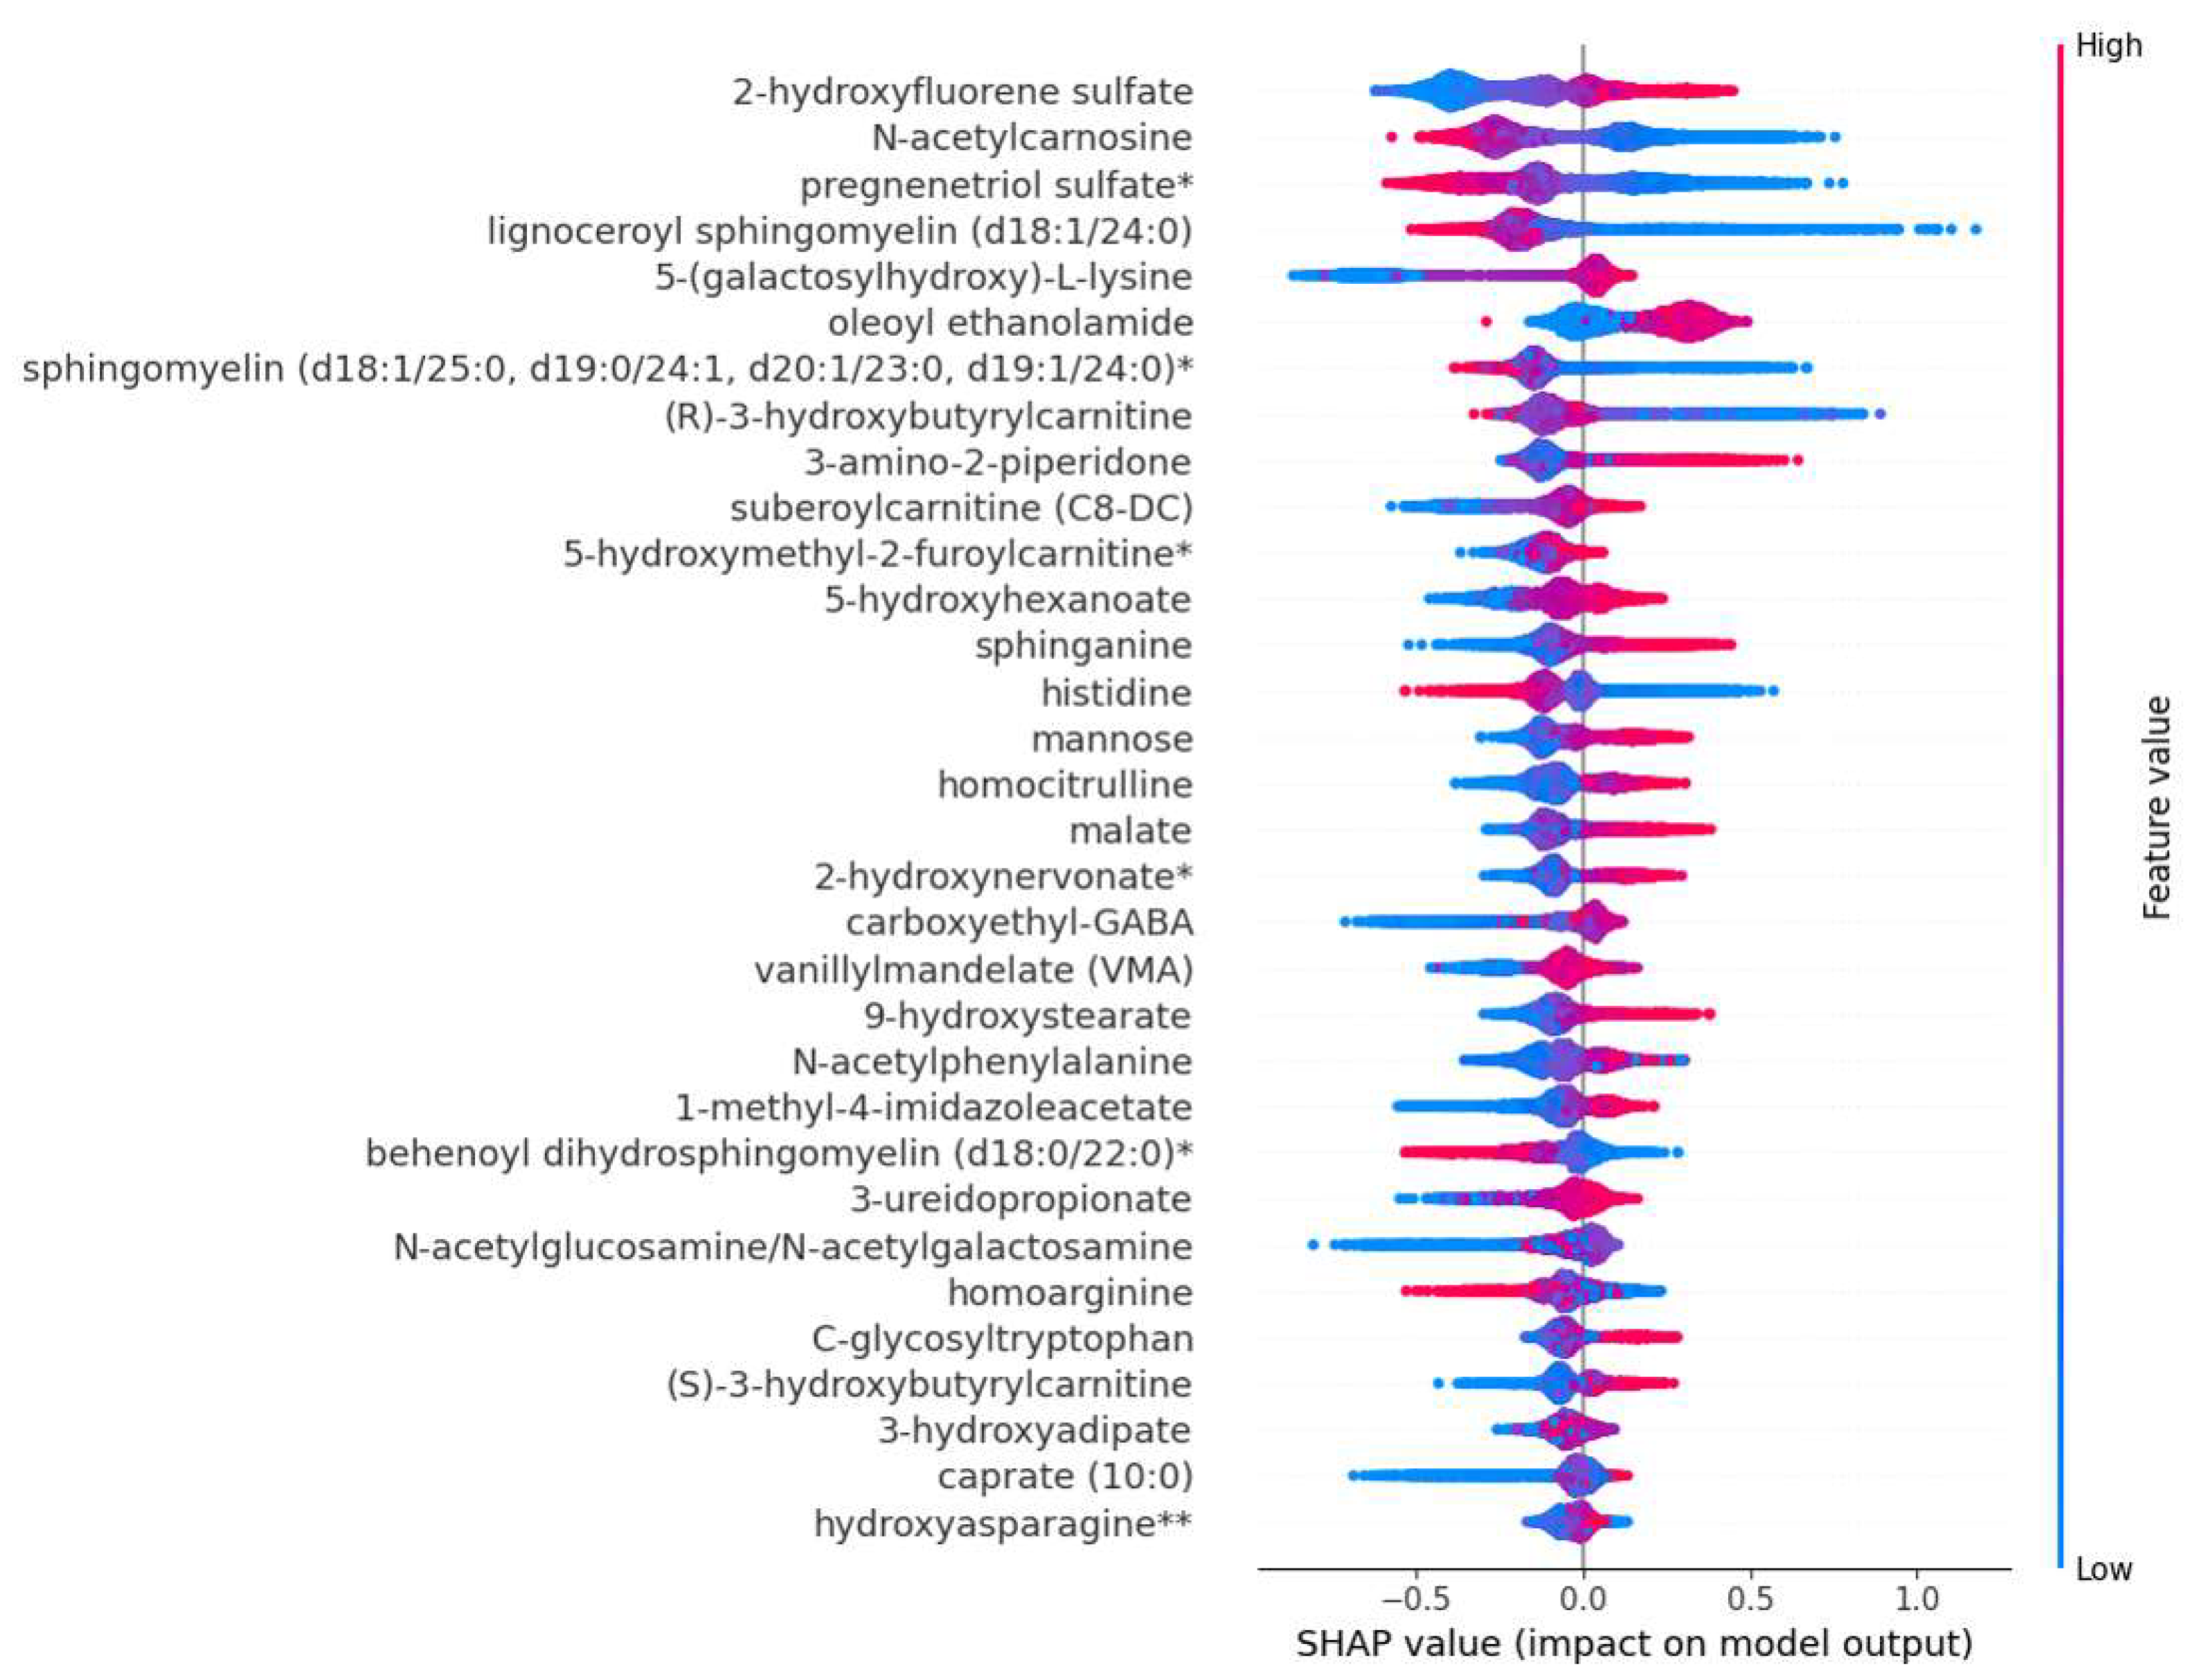
Figure 2 shows a SHAP summary plot of the 32 most impactful metabolite predictors of mortality at the population level. Positive SHAP values indicate an increased risk for mortality and negative SHAP values a protective effect. Each dot corresponds to a single observation. Increased metabolites are shown in red and decreased metabolites in blue. For example, SHAP values indicate that N-acetylcarnosine decreases the risk of mortality equally in the study population. 5-(galactosylhydroxy)-L-lysines prediction pattern plot has a long tail, where low levels indicate an increased risk of mortality, whereas increased levels indicate a similar increased risk of mortality in the whole population. The SHAP summary plot gives an explanative pattern for the prediction for each metabolite.
We applied ML methods, logistic regression, Welch’s t-test and XGBoost, to identify the most impactful metabolites for short-, intermediate-, and long-term mortality (Figure S3-Figure S5). Short-term mortality included 185 mortality cases with a follow-up time of 2.41±1.35 years, intermediate-term mortality included 495 cases with a follow-up time of 6.09±1.98 years, and long-term mortality included 666 cases with a follow-up time of 11.04±1.97 years.
In the short-term mortality group, the three most impactful metabolites were 9-hydroxystearate, N1-methyladenosine, and lactate. In the intermediate-term mortality group, the three most impactful metabolites were 3-ureidopropionate, o-cresol sulfate, and C-glycosyltryptophan. In the long-term mortality group, the three most impactful metabolites were behenoyl dihydrosphingomyelin (d18:0/22:0), dehydroepiandrosterone sulfate (DHEA-S), and malate. The Veen diagram ( Figure S6) shows that none of the metabolites were shared between the short- intermediate and long-term mortality groups. The short- and intermediate-term mortality groups shared three metabolites, intermediate- and long-term mortality shared five metabolites, and short- and long-term mortality shared three metabolites.

2.3. Clustered Heatmap of the 32 Metabolites

The heatmap shows the correlation of 32 most important metabolites in mortality prediction (Figure S7). The five most significant metabolites predicting mortality were 2-hydroxyfluorene sulfate, N-acetylcarnosine, pregnenetriol sulfate, lignoceroyl sphingomyelin, and 5-(galactosyl-hydroxy)-L-lysine. Hierarchical clustering shows that metabolites having similar biological functions cluster together, especially metabolites belonging to the amino acid pathway or sphingomyelins. Metabolites that increase the risk of mortality cluster together, suggesting similar prediction patterns for mortality. Correspondingly, metabolites decreasing the risk of mortality clustered together and had an inverse correlation with the metabolites increasing the risk of mortality.

2.4. Cox Regression Analysis of Metabolites Associated with Mortality Risk

We performed Cox proportional hazards regression analysis for the metabolites identified by the machine learning models (Table 2). The analysis was used to estimate the hazard ratios (HR) and 95% confidence intervals (CI) for each metabolite with all-cause mortality. The Cox regression model was adjusted for age. Metabolite concentrations were standardized prior to analysis.

2.5. Cox Regression Analysis of Metabolites Associated with an Increase in the Risk of Mortality

We conducted Cox regression analyses to assess the effects of the clinical and laboratory measurements, and 25 metabolites on the risk of mortality, both individually and in combination. Clinical and laboratory measurements including age, BMI, waist circumference, smoking, systolic blood pressure, LDLC, total triglycerides, fasting glucose, hs-CRP, creatinine, T2D and UAE alone significantly increased the risk of mortality (HR 1.76, 1.60-1.94, p=1.7E-29). The 25 metabolites alone increased the risk of mortality also significantly (HR 1.89, 1.68-2.12, p= 5.2E-27). In the model including both clinical and laboratory measurements and 25 metabolites the risk of mortality further increased (HR 2.00, 1.81-2.22, p=3.4E-42) suggesting that the 25 metabolites increased the risk of mortality beyond the clinical and laboratory risk factors for mortality.

3. Discussion

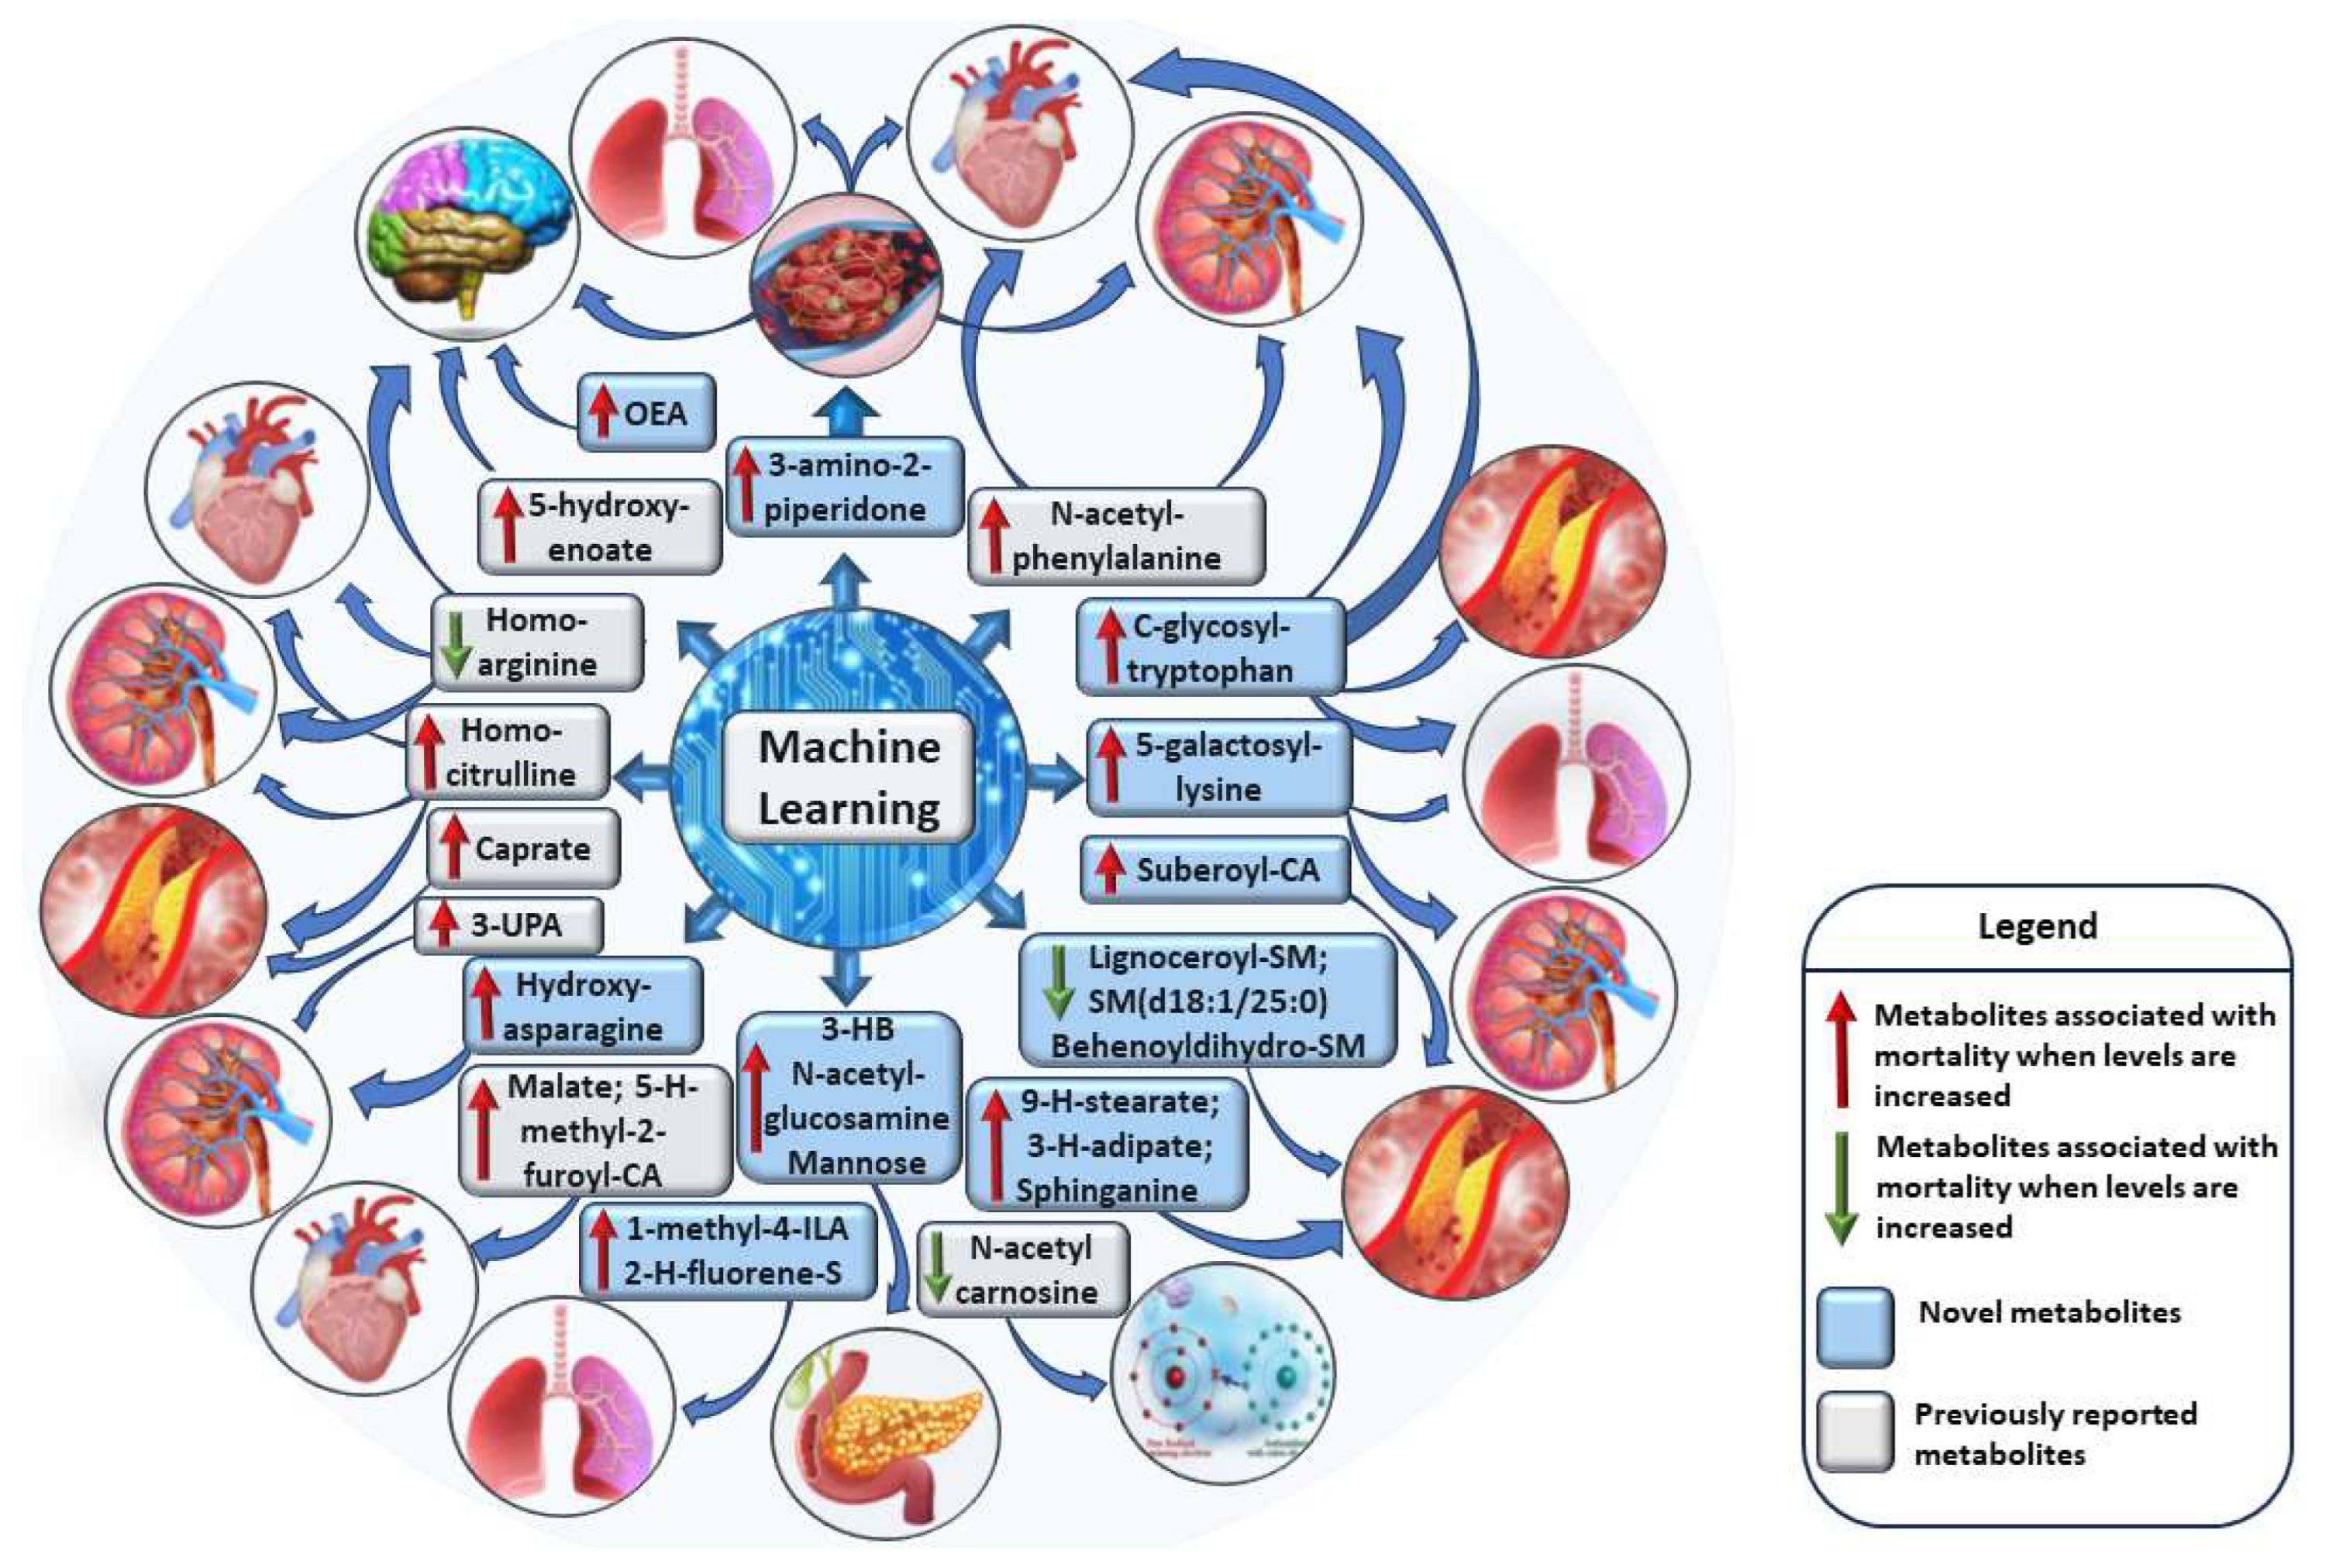
Previous studies of all-cause mortality applying metabolomics approach have been heterogeneous in the size of the studies, the number of metabolites included in the studies, the platforms to measure metabolites and statistical methods. We applied the ML tools (SVM, XGBoost, logistic regression) to identify the most impactful metabolites associated with mortality, and identified 32 metabolites, 25 metabolites increasing, and 7 metabolites decreasing the risk of mortality. Twenty of these metabolites were novel, covering several metabolic pathways, lipids, amino acids, carbohydrates, xenobiotics, energy metabolism, nucleotides, endocannabinoids, and peptides. These metabolites are known to be associated with damage in the key human body systems, including cardiovascular, renal, respiratory, endocrine, and central nervous systems (Figure 3).
When we compared our findings with the previous two large studies, we found that only one metabolite, histidine, was previously reported to be associated with decreased mortality in the study of Deelen et al. [9], and another metabolite 3-ureidopropionate associated with increased mortality in the study of Wang et al. [4]. The number of metabolites measured in these studies was very different. Our study included > 1000 metabolites whereas Deelen et al. study [9] included 226 metabolites and Wang et al. study [4] 243 metabolites.
In our study seven of the metabolites damaged multiple body systems, including three novel metabolites (3-amino-2-piperidone, C-glycosyltryptophan, 5-(galactosyl)-L-lysine), and four previously reported metabolites (N-acetylphenylalanine, homocitrulline, homoarginine, 5-hydroxyhexanoate) [12,13,14,15]. Disruptions in the ornithine cycle result in an increased abundance of 3-amino-2-piperidone (Figure S8A) resulting in enhanced coagulation [16]. Hypercoagulation increases the risk of myocardial infarction and stroke, pulmonary embolism, pulmonary infarction, and renal thrombosis [17].
N-acetylphenylalanine and C-glycosyltryptophan have been associated with albuminuria [18] and cardiovascular mortality. C-glycosyltryptophan accelerates peripheral artery disease in patients with type 2 diabetes and is associated with a decrease in kidney function, pulmonary hypertension, and impaired lung function [19,20]. Increased concentrations of 5-(galactosylhydroxyl)-L-lysine, a glycosylation product of hydroxylysine (Figure S8A), have been found in patients with pulmonary artery hypertension and in patients with impaired kidney function [2021].
Homocitrulline, a carbamylation product, has been reported to be associated with morbidity and mortality from chronic heart failure, coronary artery disease, and chronic kidney disease [22,23]. Cyanate-induced carbamylation generates homocitrulline from lysine (Figure S8A). Elevated cyanate concentrations related to impaired kidney function and inflammation increase homocitrulline concentration [24]. Carbamylation prevents LDLC binding to its receptor, resulting in cholesterol accumulation, macrophage foam-cell formation, and an increased risk of coronary artery disease [25].
Lysine can replace ornithine in the urea cycle and combine with arginine to form homoarginine (Figure S8A). An increase in homoarginine was inversely associated with mortality in our study in agreement with the findings in the LURIC and 4D studies [26]. Homoarginine acts as a nitric oxide precursor, enhancing endothelial function [26]. Elevated homocitrulline and decreased homoarginine result in disruption of the lysine pathway and increases the risk of mortality [15].
We found 22 metabolites known to impair specific body systems, seven novel metabolites contributing to coronary artery disease (9-hydroxystearate, 3-hydroxyadipate, sphinganine, lignoceroyl-SM, SM (d18:1/25:0), behenoyl dihydro-SM, suberoylcarnitine), and one previously reported metabolite caprate [15] (Figure S9). Hydrofluoroalkanes, 9-hydroxystearate and 3-hydroxyadipate can be incorporated into chylomicrons, which contribute to an increase of very low-density lipoprotein particles. Additionally, oxidized LDLC plays an important role in atherosclerosis by inducing monocyte chemotactic protein 1 and scavenger receptors [27], resulting in pro-inflammatory mechanisms.
Sphinganine, a ceramide precursor (Figure S8B), inhibits LDLC esterification and contributes to the accumulation of free cholesterol in perinuclear vesicles resulting in cellular toxicity and death [28]. Cholesterol accumulation releases proteases, cytokines, and prothrombotic molecules, contributing to plaque instability, rupture, and vascular occlusion [29]. Three sphingomyelins (lignoceroyl-sphingomyeline, sphingomyeline (d18:1/25:0), behenoyl dihydro-sphingomyeline) were associated with decreased all-cause mortality in our study. Sphingomyelins are crucial for cell membrane structure, and they prevent the deleterious effects of ceramides on endothelial dysfunction, cell apoptosis, and atherosclerosis [30].
Suberoylcarnitine, a medium-chain dicarboxylic acylcarnitine, increases the risk of coronary artery disease attributable to altered mitochondrial fatty acid oxidation and omega-oxidation [31]. Caprate, a saturated fatty acid, has been reported to be associated with increased mortality [32]. Saturated fatty acids increase coagulation, inflammation, insulin resistance, and the risk of type 2 diabetes, cardiovascular diseases, cancer, frailty, and all-cause mortality [33].
We found two metabolites linked to the cardiovascular system, one novel association with 5-hydroxymethyl-2-furoylcarnitine and one previously reported association with malate [12] (Figure S9). 5-hydroxymethyl-2-furoylcarnitine, a dietary component has been associated with ischemic heart disease [34]. Two metabolites in our study impair the renal system (Figure S10), one novel association with hydroxyasparagine and one previously reported association with 3-ureidopropionate (3-UPA) [22]. 3-UPA (Figure S8C), increases mortality independently of kidney disease in patients with liver cirrhosis [35].
We confirmed that N-acetylcarnosine and histidine decreased the risk of mortality [26,36]. N-acetylcarnosine and histidine are carnosine metabolites (Figure S8C) known for their antioxidative properties [37]. These metabolites effectively inhibit glucose-induced oxidation and glycation in human LDL, countering aging-related changes in protein oxidation, glycation, advanced glycation end-products (AGEs) formation [38].
We discovered two novel metabolites linked to respiratory system damage, 1-methyl-4-imidazoleacetate and 2-hydroxyfluorene sulfate (Figure S11). 1-methyl-4-imidazoleacetate is the main histamine metabolite (Figure S8C) and increases significantly during asthma attacks [39]. Tobacco smoking increases the concentration of 2-hydroxyfluorene sulfate, which is a potent carcinogen in tobacco [40]. We identified a novel metabolite oleoylethanolamide, an important metabolite impacting the central nervous system ( Figure S6). Oleoylethanolamide induces anorexia by stimulating vagal sensory nerves and activating PPAR-alpha [41]. Anorexia is associated with an elevated risk of all-cause mortality [42].
We found three novel metabolites impacting the endocrine system, S- and R-3-hydroxybutyrylcarnitine (S-3HB and R-3HB) and mannose (Figure S10) confirming previously reported association with N-acetylglucosamine [43]. R-3HB-carnitine contributes to insulin resistance in mice and can cause hypoketotic-hypoglycemia, metabolic acidosis, hyperammonemia, and fatty liver disease [44]. Mannose glycates proteins and enhances the formation of AGEs in several diseases, including diabetic nephropathy, atherosclerosis, and neurodegenerative diseases [45]. N-acetylglucosamine/N-acetylgalactosamine generates GlycA, which is associated with cardiovascular diseases and diabetes [46].
We found that the metabolite signatures regulating short-term, intermediate-term and long-term mortality were very different. Particularly notable is the difference between short-term and long-term mortality, as only three metabolites were shared in these groups. Metabolites associated with short-term mortality reflect acute stress and energy metabolism. N1-methyladenosine is required for RNA methylation and rapid cellular stress adaptation [47]. Lactate and succinate are involved in acute stress responses and fast metabolic energy [48]. Succinate, a key metabolite in the Krebs cycle, activates hypoxia signaling [49] whereas the metabolites associated with long-term mortality, such as dehydroepiandrosterone sulfate (DHEA-S) and beta-cryptoxanthin, regulate chronic inflammation and oxidative stress. A decrease in DHEA-S concentration increases inflammation and has an impact on long-term health [50]. Beta-cryptoxanthin has antioxidant effects and is protective against oxidative stress [51].
The main causes of death were cancers (28%) and cardiovascular diseases (25%) in our study. Interestingly, we did not find any metabolite associated with the risk of cancer but instead, 13 metabolites were associated with cardiovascular diseases (myocardial infarction, coronary artery disease, heart failure, pulmonary artery hypertension). This gives an excellent possibility to use these metabolites as markers for the risk of cardiovascular diseases.
In summary, ML successfully identified a precise set of metabolites associated with an increased risk of all-cause mortality, emphasizing the significant role of metabolism in aging and different diseases. Most of the 32 metabolites we discovered were novel and regulated coagulation, cytokine release, lipid oxidation, inflammation, cellular toxicity, insulin resistance, urea and malate-aspartate cycle dysregulation, and especially the risk of cardiovascular diseases. Many of these metabolites can simultaneously harm multiple body systems (Figure S12). These metabolites offer a more accurate representation of general health compared to traditional clinical parameters and laboratory measurements.
Our study has several strengths, including a large METSIM cohort, a validated metabolomics platform and > 1000 metabolites, a long follow-up time, several novel findings, and robust data analysis. Although ML methods, logistic regression, Welch’s test, and XGBoost offer a comprehensive approach identifying metabolites associated with all-cause mortality they also have weaknesses. The limitation of our study is that it included middle-aged and elderly Finnish men, and the applicability of our findings to women, other age groups, and diverse ethnicities remains to be investigated. Additionally, our findings do not show causality between metabolites and different diseases. In summary, our study identified potentially important metabolites and metabolic pathways for future research to reveal mechanisms leading to mortality.

4. Materials and Methods

4.1. Study Population

Our study population, the METSIM (METabolic Syndrome In Men) study, is a randomly selected population-based cohort comprising of 10.197 men, aged from 45 to 73 years at baseline, and recruited from Kuopio and surrounding communities in Eastern Finland [52]. A total of 7.090 individuals participated in a 12-year follow-up study. The mean age of death in the participants was 76.0±6.7 years (mean ± standard deviation, SD). The main causes of death were cancers (28%), cardiovascular diseases (25%), and neurological diseases (11%). The METSIM study was approved by the Ethics Committee of the University of Eastern Finland and Kuopio University Hospital and was conducted in accordance with the Declaration of Helsinki. All participants gave written informed consent.

4.2. Clinical and Laboratory Measurements

BMI was calculated as weight in kilograms divided by height in meters squared. Waist circumference was measured to the nearest 0.5 cm. LDLC and total triglycerides were measured by enzymatic colorimetric tests (Konelab System Reagents). Plasma glucose was measured by enzymatic hexokinase photometric assay (Konelab Systems reagents; Thermo Fischer Scientific, Vantaa, Finland). hs-CRP was determined by an Immulite 2000 High Sensitivity CRP assay (Diagnostic Products Corp). Creatinine was determined by the Jaffe method. ALT was assessed by enzymatic photometric test. UAE rate was determined by Immunoturbidimetric method (Konelab Albumin/Microalbuminuria system reagents, REF no 981660, Thermo Electron Corp, Vantaa, Finland) from the first urine sample in the morning (µg/minute). The eGFR was calculated with the Cockroft-Gault formula [52].

4.3. Metabolomics

Non-targeted metabolomics profiling was performed at Metabolon, Inc. (Morrisville, NC, USA) on EDTA plasma samples obtained after overnight fasting from 10.188 participants at baseline, as previously described in detail [53]. The Metabolon DiscoveryHD4 platform was applied to identify the metabolites. All samples were processed together for peak quantification and data scaling. We quantified raw mass spectrometry peaks for each metabolite using the area under the curve and evaluated overall process variability by the median relative standard deviation for endogenous metabolites present in all 20 technical replicates in each batch. We adjusted for variation caused by day-to-day instrument tuning differences and columns used for biochemical extraction by scaling the raw peak quantifications to the median for each metabolite by the Metabolon batch. Instrument variability was assessed by calculating the median relative standard deviation (RSD) for internal standards added to each sample before injection into the mass spectrometers. The acceptance criterion for instrument variability was a median RSD of 5% or lower, which was obtained in our study. Overall process variability was determined by calculating the median RSD for all endogenous metabolites in technical replicates, with an acceptance criterion of a median RSD of 15% or lower. Our study achieved a median RSD of 8% which meets Metabolon’s acceptance criteria ensuring high data quality.

4.4. Machine Learning

We included in our study 1540 metabolites ( Figure S1). We filtered out 596 metabolites, of which 416 metabolites had more than 50% of missing values, and 180 metabolites had no identification available. We included 945 normalized metabolites in statistical analyses. Missing values were set to NaN to utilize the XGBoost’s built-in function for handling missingness. We addressed the class imbalances in mortality events by reducing the size of the dataset from 10.000 to 6.683 to ensure that our machine learning models perform effectively. The final dataset consisted of 945 metabolites as variables and 6.683 samples as datapoints ( Figure S1).
We applied three distinct methods, logistic regression, Welch t-test, and XGBoost to the entire preprocessed dataset to perform feature selection and rank the most significant metabolites predicting mortality (Figure S1). This approach has previously been used to identify the most impactful metabolites associated with a disease or condition [54]. We performed Welch’s t-test for each metabolite to determine how well it discriminates between the individuals who died during the follow-up period. The 200 most discriminating metabolites with the lowest q-value according to the Welch t-test were selected. We examined all metabolites individually with logistic regression for their discrimination ability. Metabolites were ranked based on the magnitude of the ROC-AUC curve (area under the receiver operating characteristic curve) with logistic regression, and the top 200 metabolites were selected. We performed XGBoost tree binary classification for the entire dataset of 945 metabolites ( Figure S1). We sorted the metabolites in the order of magnitude according to their importance value produced by the XGboost model. A total of 154 metabolites were selected having more than 0.012 SHAP feature importance value.
We built the three prediction models to evaluate the predictive power of 32 selected metabolites for all-cause mortality, support vector machine (SVM) model, logistic regression model, and XGBoost binary classifier model. Feature selection process, implementation and evaluation of the ML models were performed by Python 3.8.10 version. Python XGBoost function (version 1.3.3) XGBClassifier and shap version (0.38.1) were used to build the explainable ML model of mortality. XGBoost is an implementation of gradient boosted decision tree, and the algorithm is designed for speed and performance. Shapley Additive exPlanation (SHAP) values are based on classic game-theoretic Shapley values [55] which are used to explain predictions generated by machine learning models [55]. The final set of hyperparameters used in the XGBoost mortality prediction model is presented in Table S1.
We applied hyperparameter tuning to regulate the overfitting caused by complex tree-based algorithms with numerous variables. Model complexity was reduced by restricting maximum tree depth (max depth) and increasing minimum sum of instance weights (min_child_weight) which both lead to more conservative model. The randomness of the model was evaluated by the colsample bytree parameter which restricts the number of variables used in one tree to make training more robust. We used Python seaborn clustermap function with clustering method Nearest Point Algorithm “single” and Euclidean distance to perform the hierarchical clustering algorithm.

4.5. Statistical Analyses

We conducted statistical analyses using IBM SPSS Statistics, version 25. We log-transformed all continuous variables having skewed distribution. We applied the Cox regression analysis to associate the metabolites with all-cause mortality and present the results as hazard ratios (HRs) and their 95% confidence intervals (CIs). When analyzing 25 metabolites as a predictor of a mortality score was derived by adding metabolites weighted by their regression coefficients. We tested Cox proportionality assumption for the metabolites using survival and survminer packages in R and found that a fitted Cox regression model adequately described the data. p < 4.06x10⁻⁵ (Bonferroni correction for 1.232 metabolites) was considered statistically significant. We used one-way ANOVA and Chi-square test to assess the differences in clinical traits and metabolites between the cases (deceased) and the controls (alive).

5. Conclusions

In conclusion, our study used machine learning and Cox regression to identify 32 metabolites associated with all-cause mortality, most of which are novel. These metabolites regulate key processes like coagulation, lipid oxidation, and inflammation, highlighting the role of metabolism in aging and disease, particularly cardiovascular health. Despite focusing on middle-aged Finnish men, our findings offer valuable insights into metabolic pathways and potential biomarkers for future research.

Supplementary Materials

The following supporting information can be downloaded at the website of this paper posted on Preprints.org, Table S1; Figure S1-S12.

Author Contributions

Conceptualization: LFS and ML; Methodology: AO, JV, LFS, and ML; Investigation: LFS, JV, AO and ML; Visualization: LFS and AO; Funding acquisition: ML; Project administration: ML and LFS; Supervision: ML and LSF; Writing – original draft: LFS, JV, AO, and ML.

Funding

The research leading to these results has received support from the Innovative Medicines Initiative Joint Undertaking under grant agreements no. 115372 EMIF (to M.L), and no. 115974 BEAt-DKD (to M.L.). This Joint Undertaking received support from the European Union’s 7th Framework (EMIF) resp. Horizon 2020 (BEAt-DKD) research and innovation programmes and EFPIA, with JDRF (BEAt-DKD). Academy of Finland grant no. 321428 (ML). Centre of Excellence of Cardiovascular and Metabolic Diseases, the Academy of Finland grant no. 271961 (ML). Sigrid Juselius Foundation grant (ML). Finnish Foundation for Cardiovascular Research grant (ML). Kuopio University Hospital grant (ML).

Institutional Review Board Statement

The METSIM study was approved by the Ethics Committee of the Kuopio University Hospital, Finland. All participants provided written informed consent.

Informed Consent Statement

Informed consent was obtained from all subjects involved in the study.

Data Availability Statement

The data that support the findings of this study are available from the corresponding authors, [ML and LFS] upon reasonable request.

Acknowledgments

In this section, you can acknowledge any support given which is not covered by the author contribution or funding sections. This may include administrative and technical support, or donations in kind (e.g., materials used for experiments).

Conflicts of Interest

The authors declare no conflicts of interest.

References

  1. Shang, X.; Peng, W.; Hill, E.; Szoeke, C.; He, M.; Zhang, L. Incidence, progression, and patterns of multimorbidity in community-dwelling middle-aged men and women. Front. Public Health 2020, 8, 404. [Google Scholar] [CrossRef] [PubMed]
  2. Hippisley-Cox, J.; Coupland, C. Development and validation of mortality risk prediction algorithm to estimate short term risk of death and assess frailty: cohort study. BMJ 2017, 358, j4208. [Google Scholar] [CrossRef] [PubMed]
  3. Paynter, N.P.; Balasubramanian, R.; Giulianini, F.; Wang, D.D.; Tinker, L.F.; Gopal, S.; et al. Metabolic predictors of incident coronary heart disease in women. Circulation 2018, 137, 841–853. [Google Scholar] [CrossRef] [PubMed]
  4. Wang, F.; Tessier, A.-J.; Liang, L.; Wittenbecher, C.; Haslam, D.E.; Fernandez-Duval, G.; et al. Plasma metabolic profiles associated with mortality and longevity in a prospective analysis of 13,512 individuals. Nat. Commun. 2023, 14, 5744. [Google Scholar] [CrossRef] [PubMed]
  5. Ottosson, F.; Smith, E.; Fernandez, C.; Melander, O. Plasma metabolites associate with all-cause mortality in individuals with type 2 diabetes. Metabolites 2020, 10, 315. [Google Scholar] [CrossRef]
  6. Hu, J.-R.; Coresh, J.; Inker, L.A.; Levey, A.S.; Zheng, Z.; Rebholz, C.M.; et al. Serum metabolites are associated with all-cause mortality in chronic kidney disease. Kidney Int. 2018, 94, 381–389. [Google Scholar] [CrossRef]
  7. Balasubramanian, R.; Paynter, N.P.; Giulianini, F.; Manson, J.E.; Zhao, Y.; Chen, J.-C.; et al. Metabolomic profiles associated with all-cause mortality in the Women’s Health Initiative. Int. J. Epidemiol. 2020, 49, 289–300. [Google Scholar] [CrossRef]
  8. Fischer, K.; Kettunen, J.; Würtz, P.; Haller, T.; Havulinna, A.S.; Kangas, A.J.; et al. Biomarker profiling by nuclear magnetic resonance spectroscopy for the prediction of all-cause mortality: An observational study of 17,345 persons. PLoS Med. 2014, 11, e1001606. [Google Scholar] [CrossRef]
  9. Deelen, J.; Kettunen, J.; Fischer, K.; van der Spek, A.; Trompet, S.; Kastenmüller, G.; et al. A metabolic profile of all-cause mortality risk identified in an observational study of 44,168 individuals. Nat. Commun. 2019, 10, 3346. [Google Scholar] [CrossRef]
  10. Gowda, G.A.N.; Djukovic, D. Overview of mass spectrometry-based metabolomics: opportunities and challenges. Methods Mol. Biol. 2014, 1198, 3–12. [Google Scholar] [CrossRef]
  11. Qiu, W.; Chen, H.; Dincer, A.B.; Lundberg, S.; Kaeberlein, M.; Lee, S.-I. Interpretable machine learning prediction of all-cause mortality. Commun. Med. 2022, 2, 125. [Google Scholar] [CrossRef] [PubMed]
  12. Huang, J.; Weinstein, S.J.; Moore, S.C.; Derkach, A.; Hua, X.; Liao, L.M.; et al. Serum metabolomic profiling of all-cause mortality: A prospective analysis in the alpha-tocopherol, Beta-Carotene Cancer Prevention (ATBC) Study Cohort. Am. J. Epidemiol. 2018, 187, 1721–1732. [Google Scholar] [CrossRef] [PubMed]
  13. Jaisson, S.; Kerkeni, M.; Santos-Weiss, I.C.R.; Addad, F.; Hammami, M.; Gillery, P. Increased serum homocitrulline concentrations are associated with the severity of coronary artery disease. Clin. Chem. Lab. Med. 2015, 53, 103–110. [Google Scholar] [CrossRef]
  14. Drechsler, C.; Meinitzer, A.; Pilz, S.; Krane, V.; Tomaschitz, A.; Ritz, E.; et al. Homoarginine, heart failure, and sudden cardiac death in haemodialysis patients. Eur. J. Heart Fail. 2011, 13, 852–859. [Google Scholar] [CrossRef]
  15. Pappa, V.; Seydel, K.; Gupta, S.; Feintuch, C.M.; Potchen, M.J.; Kampondeni, S.; et al. Lipid metabolites of the phospholipase A2 pathway and inflammatory cytokines are associated with brain volume in paediatric cerebral malaria. Malar. J. 2015, 14, 513. [Google Scholar] [CrossRef]
  16. Li, T.; Ning, N.; Li, B.; Luo, D.; Qin, E.; Yu, W.; et al. Longitudinal metabolomics reveals ornithine cycle dysregulation correlates with inflammation and coagulation in COVID-19 severe patients. Front. Microbiol. 2021, 12, 723818. [Google Scholar] [CrossRef] [PubMed]
  17. Huisman, M.V.; Barco, S.; Cannegieter, S.C.; Le Gal, G.; Konstantinides, S.V.; Reitsma, P.H.; et al. Pulmonary embolism. Nat. Rev. Dis. Primers 2018, 4, 18028. [Google Scholar] [CrossRef]
  18. Fernandes Silva, L.; Vangipurapu, J.; Smith, U.; Laakso, M. Metabolite signature of albuminuria involves amino acid pathways in 8661 Finnish men without diabetes. J. Clin. Endocrinol. Metab. 2021, 106, 143–152. [Google Scholar] [CrossRef]
  19. Morita, S.; Inai, Y.; Minakata, S.; Kishimoto, S.; Manabe, S.; Iwahashi, N.; et al. Quantification of serum C-mannosyl tryptophan by novel assay to evaluate renal function and vascular complications in patients with type 2 diabetes. Sci. Rep. 2021, 11, 1946. [Google Scholar] [CrossRef]
  20. Peng, H.; Liu, X.; Aoieong, C.; Tou, T.; Tsai, T.; Ngai, K.; et al. Identification of metabolite markers associated with kidney function. J. Immunol. Res. 2022, 2022, 6190333. [Google Scholar] [CrossRef]
  21. Sanders, J.L.; Han, Y.; Urbina, M.F.; Systrom, D.M.; Waxman, A.B. Metabolomics of exercise pulmonary hypertension are intermediate between controls and patients with pulmonary arterial hypertension. Pulm. Circ. 2019, 9, 2045894019882623. [Google Scholar] [CrossRef] [PubMed]
  22. Tang, W.H.W.; Shrestha, K.; Wang, Z.; Borowski, A.G.; Troughton, R.W.; Klein, A.L.; et al. Protein carbamylation in chronic systolic heart failure: relationship with renal impairment and adverse long-term outcomes. J. Card. Fail. 2013, 19, 219–224. [Google Scholar] [CrossRef] [PubMed]
  23. Wang, Z.; Nicholls, S.J.; Rodriguez, E.R.; Kummu, O.; Hörkkö, S.; Barnard, J.; et al. Protein carbamylation links inflammation, smoking, uremia and atherogenesis. Nat. Med. 2007, 13, 1176–1184. [Google Scholar] [CrossRef]
  24. Kalim, S.; Karumanchi, S.A.; Thadhani, R.I.; Berg, A.H. Protein carbamylation in kidney disease: Pathogenesis and clinical implications. Am. J. Kidney Dis. 2014, 64, 793–803. [Google Scholar] [CrossRef]
  25. Verbrugge, F.H.; Tang, W.H.W.; Hazen, S.L. Protein carbamylation and cardiovascular disease. Kidney Int. 2015, 88, 474–478. [Google Scholar] [CrossRef]
  26. März, W.; Meinitzer, A.; Drechsler, C.; Pilz, S.; Krane, V.; Kleber, M.E.; et al. Homoarginine, cardiovascular risk, and mortality. Circulation 2010, 122, 967–975. [Google Scholar] [CrossRef]
  27. Lehr, H.A.; Krombach, F.; Münzing, S.; Bodlaj, R.; Glaubitt, S.I.; Seiffge, D.; et al. In vitro effects of oxidized low-density lipoprotein on CD11b/CD18 and L-selectin presentation on neutrophils and monocytes with relevance for the in vivo situation. Am. J. Pathol. 1995, 146, 218–227. [Google Scholar] [PubMed]
  28. Wishart, D.S.; Guo, A.; Oler, E.; Wang, F.; Anjum, A.; Peters, H.; et al. HMDB 5. 0: the Human Metabolome Database for 2022. Nucleic Acids Res. 2022, 50, D622–631. [Google Scholar] [CrossRef]
  29. Mitchinson, M.J.; Hardwick, S.J.; Bennett, M.R. Cell death in atherosclerotic plaques. Curr. Opin. Lipidol. 1996, 7, 324–329. [Google Scholar] [CrossRef]
  30. Bismuth, J.; Lin, P.; Yao, Q.; Chen, C. Ceramide: A common pathway for atherosclerosis? Atherosclerosis 2008, 196, 497–504. [Google Scholar] [CrossRef]
  31. Gander, J.; Carrard, J.; Gallart-Ayala, H.; Borreggine, R.; Teav, T.; Infanger, D.; et al. Metabolic impairment in coronary artery disease: elevated serum acylcarnitines under the spotlights. Front. Cardiovasc. Med. 2021, 8, 792350. [Google Scholar] [CrossRef]
  32. Titan, S.M.; Venturini, G.; Padilha, K.; Goulart, A.C.; Lotufo, P.A.; Bensenor, I.J.; et al. Metabolomics biomarkers and the risk of overall mortality and ESRD in CKD: Results from the Progredir Cohort. PLoS ONE 2019, 14, e0213764. [Google Scholar] [CrossRef] [PubMed]
  33. Kane, A.E.; Gregson, E.; Theou, O.; Rockwood, K.; Howlett, S.E. The association between frailty, the metabolic syndrome, and mortality over the lifespan. Geroscience 2017, 39, 221–229. [Google Scholar] [CrossRef] [PubMed]
  34. Fromentin, S.; Forslund, S.K.; Chechi, K.; Aron-Wisnewsky, J.; Chakaroun, R.; Nielsen, T.; et al. Microbiome and metabolome features of the cardiometabolic disease spectrum. Nat. Med. 2022, 28, 303–314. [Google Scholar] [CrossRef] [PubMed]
  35. Mindikoglu, A.L.; Opekun, A.R.; Putluri, N.; Devaraj, S.; Sheikh-Hamad, D.; Vierling, J.M.; et al. Unique metabolomic signature associated with hepatorenal dysfunction and mortality in cirrhosis. Transl. Res. 2018, 195, 25–47. [Google Scholar] [CrossRef] [PubMed]
  36. Watanabe, M.; Suliman, M.E.; Qureshi, A.R.; Garcia-Lopez, E.; Bárány, P.; Heimbürger, O.; et al. Consequences of low plasma histidine in chronic kidney disease patients: associations with inflammation, oxidative stress, and mortality. Am. J. Clin. Nutr. 2008, 87, 1860–1866. [Google Scholar] [CrossRef]
  37. Babizhayev, M.A.; Seguin, M.C.; Gueyne, J.; Evstigneeva, R.P.; Ageyeva, E.A.; Zheltukhina, G.A. L-carnosine (beta-alanyl-L-histidine) and carcinine (beta-alanylhistamine) act as natural antioxidants with hydroxyl-radical-scavenging and lipid-peroxidase activities. Biochem. J. 1994, 304, 509–516. [Google Scholar] [CrossRef]
  38. Hipkiss, A.R. Would carnosine or a carnivorous diet help suppress aging and associated pathologies? Ann. N. Y. Acad. Sci. 2006, 1067, 369–374. [Google Scholar] [CrossRef]
  39. Löwhagen, O.; Granerus, G.; Wetterqvist, H. Studies on histamine metabolism in intrinsic bronchial asthma. Allergy 1979, 34, 395–404. [Google Scholar] [CrossRef]
  40. Ifegwu, O.C.; Anyakora, C. Polycyclic aromatic hydrocarbons. Adv. Clin. Chem. 2016, 75, 159–183. [Google Scholar] [CrossRef]
  41. Rodríguez de Fonseca, F.; Navarro, M.; Gómez, R.; Escuredo, L.; Nava, F.; Fu, J.; et al. An anorexic lipid mediator regulated by feeding. Nature 2001, 414, 209–212. [Google Scholar] [CrossRef] [PubMed]
  42. Landi, F.; Liperoti, R.; Lattanzio, F.; Russo, A.; Tosato, M.; Barillaro, C.; et al. Effects of anorexia on mortality among older adults receiving home care: An observational study. J. Nutr. Health Aging 2012, 16, 79–83. [Google Scholar] [CrossRef]
  43. Lawler, P.R.; Akinkuolie, A.O.; Chandler, P.D.; Moorthy, M.V.; Vandenburgh, M.J.; Schaumberg, D.A.; et al. Circulating N-linked glycoprotein acetyls and longitudinal mortality risk. Circ. Res. 2016, 118, 1106–1115. [Google Scholar] [CrossRef]
  44. Kompare, M.; Rizzo, W.B. Mitochondrial fatty-acid oxidation disorders. Semin. Pediatr. Neurol. 2008, 15, 140–149. [Google Scholar] [CrossRef]
  45. Sharma, V.; Ichikawa, M.; Freeze, H.H. Mannose metabolism: More than meets the eye. Biochem. Biophys. Res. Commun. 2014, 453, 220–228. [Google Scholar] [CrossRef]
  46. Akinkuolie, A.O.; Buring, J.E.; Ridker, P.M.; Mora, S. A novel protein glycan biomarker and future cardiovascular disease events. J. Am. Heart Assoc. 2014, 3, e001221. [Google Scholar] [CrossRef] [PubMed]
  47. Xiong, W.; Zhao, Y.; Wei, Z.; Li, C.; Zhao, R.; Ge, J.; Shi, B. N1-methyladenosine formation, gene regulation, biological functions, and clinical relevance. Mol. Ther. 2023, 31, 308–330. [Google Scholar] [CrossRef]
  48. Brooks, G.A. The science and translation of lactate shuttle theory. Cell Metab. 2020, 31, 692–705. [Google Scholar] [CrossRef] [PubMed]
  49. Tretter, L.; Patocs, A.; Chinopoulos, C. Succinate, an intermediate in metabolism, signal transduction, ROS, hypoxia, and tumorigenesis. Biochim. Biophys. Acta Bioenerg. 2016, 1857, 1086–1101. [Google Scholar] [CrossRef]
  50. Weiss, E.P.; Villareal, D.T.; Fontana, L.; Han, D.H.; Holloszy, J.O. Dehydroepiandrosterone (DHEA) replacement decreases insulin resistance and lowers inflammatory cytokines in aging humans. Aging 2011, 3, 533–542. [Google Scholar] [CrossRef]
  51. Burri, L.; La Frano, M.R.; Parker, R.S. Absorption, Metabolism, and Functions of β-Cryptoxanthin. Nutr. Rev. 2016, 74, 69–82. [Google Scholar] [CrossRef] [PubMed]
  52. Laakso, M.; Kuusisto, J.; Stančáková, A.; Kuulasmaa, T.; Pajukanta, P.; Lusis, A.J.; et al. The Metabolic Syndrome in Men study: a resource for studies of metabolic and cardiovascular diseases. J. Lipid Res. 2017, 58, 481–493. [Google Scholar] [CrossRef] [PubMed]
  53. Yin, X.; Chan, L.S.; Bose, D.; Jackson, A.U.; VandeHaar, P.; Locke, A.E.; et al. Genome-wide association studies of metabolites in Finnish men identify disease-relevant loci. Nat. Commun. 2022, 13, 1644. [Google Scholar] [CrossRef] [PubMed]
  54. Thomas, I.; Dickens, A.M.; Posti, J.P.; Czeiter, E.; Duberg, D.; Sinioja, T.; et al. Serum metabolome associated with severity of acute traumatic brain injury. Nat. Commun. 2022, 13, 2545. [Google Scholar] [CrossRef]
  55. Lundberg, S.M.; Erion, G.; Chen, H.; DeGrave, A.; Prutkin, J.M.; Nair, B.; et al. From local explanations to global understanding with explainable AI for trees. Nat. Mach. Intell. 2020, 2, 56–67. [Google Scholar] [CrossRef]
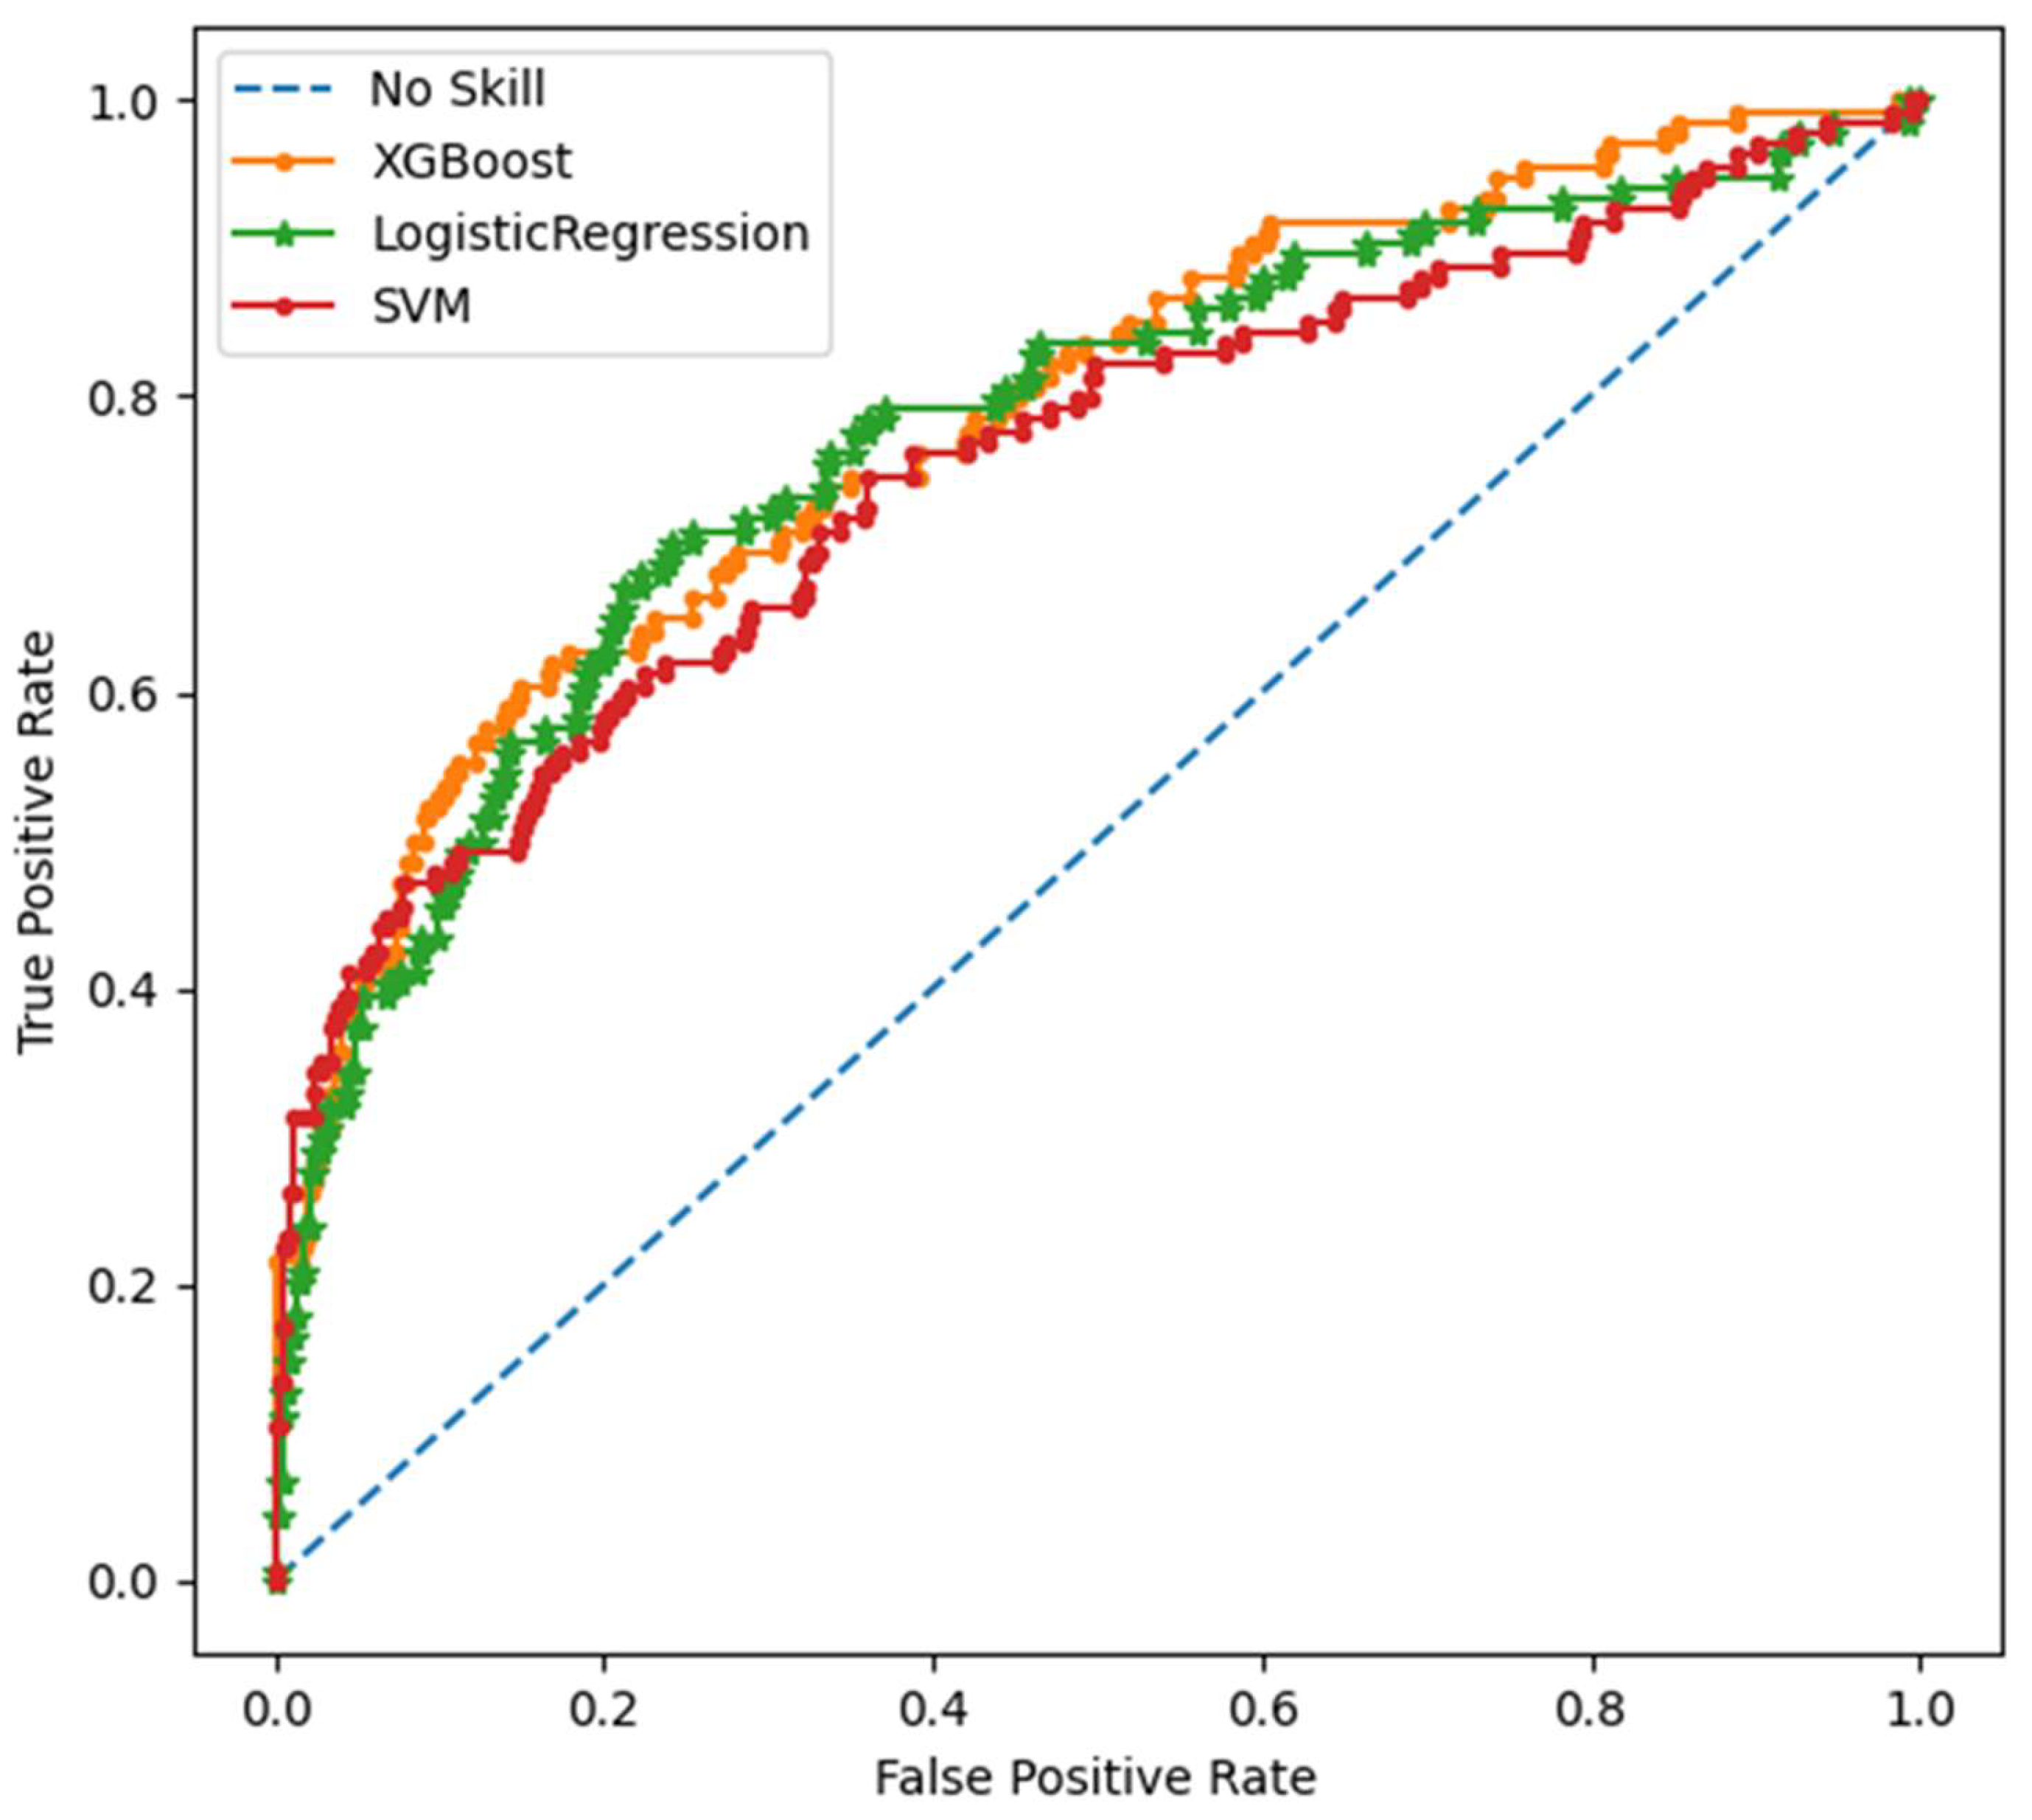
Figure 1. ROC-AUC curve for XGBoost, Logistic Regression, and SVM models.
Preprints 120268 g001
Figure 2. SHAP summary plot of the 32 most important predictors of mortality*. *Positive SHAP value means an increased risk prediction on mortality and negative SHAP value indicate protective effect. Each dot corresponds to single observation and higher value of the variable is shown in red and lower value in blue, respectively.
Preprints 120268 g002
Figure 3. The impact of machine learning-identified metabolites on multiple body systems. Metabolites damaging cardiovascular system when levels are decreased: lignoceroylsphingomyelin, sphingomyelin (d18:1/25:0), behenoyldihydrosphingomyelin and homoarginine. Metabolites damaging renal system when levels are increased: 3-amino-2-piperidone, N-acetylphenylalanine, C-glycosyltryptophan, 5-galactosyllysine, hydroxyasparagine, 3-ureidopropionate and homocitrulline. Metabolites damaging renal system when levels are decreased: homoarginine. Metabolites damaging respiratory system when levels are increased: 3-amino-2-piperidone, C-glycosyltryptophan, 5-galactosyllysine, 1-methyl-4-imidazoleacetate and 2-hydroxyfluorene sulfate. Metabolites damaging central nervous system system when levels are increased: 3-amino-2-piperidone, oleoylethanolamide and 5-hydroxyhexanoate. Metabolites damaging endocrine system system when levels are increased: (S) /(R)-hydroxybutyrate, N-acetylglucosamine and mannose. Metabolites damaging antioxidant system when levels are decreased: N-acetylcarnosine. Detailed information about mechanisms exerted by these metabolites can be found in Figure S10-S13. Abbreviations: CA, carnitine; H, hydroxy; HM, hydroxybutyrate; ILA, imidazoleacetate; OEA, oleylethanolamide; SM, sphingomyelin; UPA, ureidopropionate. Metabolites damaging cardiovascular system when levels are increased: 3-amino-2-piperidone, N-acetylphenylalanine, C-glycosyltryptophan, subeoylcarnitine, 9-hydroxystearate, 3-hydroxyadipate, sphinganine, malate, 5-hydroxymethyl-2-furoylcarnitine, caprate and homocitrulline.
Preprints 120268 g003
Table 1. Baseline characteristics of the participants of the METSIM study.
Alive Deceased
Variable N Mean ± SD N Mean ± SD P
Age (years) 8851 56.9 (6.9) 1346 62.5 (6.5) 2.0E-161
Body mass index (kg/m2) 8849 27.2 (4.0) 1344 28.2 (5.0) 3.1E-15
Waist (cm) 8848 98.2 (11.1) 1343 102.3 (11.5) 3.4E-31
Smoking (%)* 8851 16.8 1344 26.4 1.5E-16
Systolic blood pressure (mmHg) 8851 137.5 (16.4) 1345 (143.3 (18.0) 7.0E-31
Type 2 diabetes (%)* 8851 11.9 1345 27.2 1.3E-44
LDL-C (mmol/l) 8847 3.34 (0.89) 1346 3.1 (0.92) 2.0E-19
Triglycerides (mmol/l) 8850 1.45 (0.97) 1346 1.58 (1.23) 4.8E-07
Fasting glucose (mmol/l) 8851 5.92 (0.98) 1346 6.3 (1.70) 6.5E-27
hS-CRP (mg/l) 8850 2.01 (4.27) 1345 3.44 (5.62) 2.5E-43
Creatinine (umol/l) 8851 83.5 (13.4) 1346 86.7 (24.5) 5.1E-08
Urinary albumin excretion rate (ug/min) 8740 17.7 (95.5) 1311 69.1 (31.9) 1.0E-33
eGFR (mL/min/1.73m2) 8850 88.7 (12.1) 1345 83.4 (14.9) 6.4E-52
ALT (U/l) 8851 32.5 (21.2) 1346 32.1 (22.0) 0.562
*Chi-square test
Table 2. Cox Regression Analysis of Metabolites Associated with the Risk of Mortality.
HMDB Cases Total HR (95% CI) P Novel
Amino acids
HMDB0341329 Hydroxyasparagine 1345 10169 1.23 (1.16-1.29) 2.13E-15 Yes
HMDB0000177 Histidine 1345 10188 0.85 (0.81-0.88) 3.28E-15 No
HMDB0000670 Homoarginine 1345 10188 0.87 (0.82-0.91) 1.83E-08 No
HMDB0002820 1-methyl-4-imidazoleacetate 1333 10125 1.25 (1.19-1.19) <1.0E-20 Yes
HMDB0000600 5-(galactosylhydroxy)-L-lysine 1165 8180 1.17 (1.10-1.24) 3.84E-07 Yes
HMDB0000512 N-acetylphenylalanine 1317 9959 1.26 (1.19-1.32) 3.00E-17 No
HMDB0240296 C-glycosyltryptophan 1345 10188 1.26 (1.20-1.33) <1.0E-20 Yes
HMDB0000679 Homocitrulline 1304 9837 1.19 (1.13-1.26) 5.58E-11 No
HMDB0000323 3-amino-2-piperidone 1344 10180 1.15 (1.10-1.21) 4.42E-09 Yes
HMDB0002201 Carboxyehtyl-GABA 1308 9898 1.14 (1.08-1.21) 4.2E-06 Yes
Peptide
HMDB0012881 N-acetylcarnosine 1340 10162 0.87 (0.83-0.92) 2.36E-07 No
Nucleotides
HMDB0000026 3-ureidopropionate 1236 9104 1.27 (1.12-1.33) <1.0E-20 No
Lipids
Fatty acids
HMDB0000345 3-hydroxyadipate 1054 7933 1.25 (1.18-1.18) 1.16E-13 Yes
HMDB0061661 9-hydroxystearate 1191 9011 1.37 (1.30-1.44) <1.0E-20 Yes
- 2-hydroxynervonate 1317 9773 1.37 (1.28-1.46) <1.0E-20 Yes
HMDB0000409 5-hydroxyhexanoate 1125 7220 1.23 (1.16-1.31) 3.46E-12 No
HMDB0000511 Caprate (10:0) 1345 10188 1.22 (1.16-1.28) 1.33E-14 No
Sphingolipids
HMDB0000269 Sphinganine 1257 8796 1.22 (1.15-1.29) 1.68E-11 Yes
HMDB0011697 Lignoceroyl sphingomyelin 1136 7896 0.88 (0.31-0.93) 9.93E-06 Yes
HMDB0240671 Sphingomyelin (d18:1/25:0) 1136 7893 0.85 (0.80-0.90) 6.81E-09 Yes
HMDB0012091 Behenoyl dihydrosphingomyelin 1337 10008 0,89 (0.51-0.94) 1,09E-05 Yes
HMDB Metabolite Cases Total HR (95% CI) P Novel
Acylcarnitines
- Suberoylcarnitine (C8-DC) 1163 8684 1.31 (1.24-1.39) <1.0E-20 No
HMDB0013127 (R)-3-hydroxybutyrylcarnitine 1292 9620 1.22 (1.15-1.38) 8.94E-13 Yes
- (S)-3-hydroxybutyrylcarnitine 1334 10014 1.20 (1.14-1.26) 1.02E-11 Yes
Steroids
- Pregnenetriol sulfate 1345 10187 0.89 (0.85-0.94) 9.81E-06 Yes
Carbohydrates
HMDB0000212HMDB0000215 N-acetylglucosamine/N N-acetylgalactosamine 1334 10053 1.30 (1.23-1.38) <1.0E-20 No
HMDB0000169 Mannose 1345 10185 1.22 (1.16-1.29) 9.86E-13 Yes
Energy
HMDB0031518 Malate 1345 10188 1.33 (1.26-1.39) <1.0E-20 No
Endocannabinoidd
HMDB0002088 Oleoylethanolamide 1109 7189 1.18 (1.11-1.26) 7.19E-08 Yes
Organic compound
HMDB0304531 Vanillylmandelate 1202 8816 1.12 (1.06-1.19) 1.2E-04 No
Xenobiotics
- 5-hydroxymethyl-2-furoylcarnitine 953 7071 1.22 (1.14-1.30) 1.6E-09 Yes
- 2-hydroxyfluorene sulfate 932 6556 1.30 (1.22-1,38) 8.50E-16 Yes
Disclaimer/Publisher’s Note: The statements, opinions and data contained in all publications are solely those of the individual author(s) and contributor(s) and not of MDPI and/or the editor(s). MDPI and/or the editor(s) disclaim responsibility for any injury to people or property resulting from any ideas, methods, instructions or products referred to in the content.
Copyright: This open access article is published under a Creative Commons CC BY 4.0 license, which permit the free download, distribution, and reuse, provided that the author and preprint are cited in any reuse.
Prerpints.org logo

Preprints.org is a free preprint server supported by MDPI in Basel, Switzerland.

Subscribe

© 2024 MDPI (Basel, Switzerland) unless otherwise stated