1. Introduction
The monotonic growth of wind energy has significantly expanded the renewable energy sector, reducing reliance on fossil fuels [
1]. Efficient control of wind farms plays a crucial role in optimizing energy output and ensuring their sustainability. By effectively managing the operation, maintenance, and performance of each turbine, we can maximize energy yield, minimize downtime, and prevent component failure. This becomes increasingly important in our current era, where renewable energy is vital for mitigating climate change and ensuring energy security. A notable advancement in this field is the utilization of Light Detection and Ranging (LiDAR) technology. LiDAR enables precise measurement of wind speed and direction at greater distances ahead of the turbines, facilitating the implementation of predictive control strategies. This technology not only optimizes the performance of individual turbines but also enhances the overall efficiency and productivity of the entire wind farm, resulting in improved economic viability and better integration of wind energy into the power grid.
In single wind turbine management for maximizing power production and reducing load variation, it is aligned with the upcoming wind flow [
2]. Within wind farm arrays, wind turbines may experience significant underperformance [
3] and encounter unsteady loading, leading to increased maintenance costs. Additionally, climate change trends can cause shifts in wind roses, potentially creating unfavorable conditions for wind farms. Therefore, monitoring and control strategies are crucial for achieving optimized operations in an ever-changing environment[
4].
Extensive studies have advanced wind turbine control and optimization, resulting in significant performance and load reductions [
5]. Coupled control and position optimizations yield the best improvement, increasing power density substantially [
6]. Nacelle-mounted forward-looking LiDAR enhances turbine alignment and power performance [
7], as well as improves evaluation of flow interaction models within wind farms [
8]. Combining LiDAR with strategies like feed-forward collective pitch control shows potential for optimizing wind plant efficiency [
7]. LiDAR-based control techniques, including a model predictive controller (MPC), significantly reduce generator speed variation [
9]. Nacelle-mounted scanning LiDAR improves energy production and reduces fatigue loads [
10]. LiDAR-assisted control reduces rotor speed variation, tower loads, and power fluctuations [
11]. Optimizing LiDAR scan patterns and utilizing ground-based LiDAR improve accuracy and enable advanced control capabilities [
12,
13,
14]. Efficient LiDAR-enabled controllers outperform non-LiDAR controllers [
15]. High LiDAR data availability and consideration of wind profile and rotor area characteristics are important for effective control of large wind [
16]. Comprehensive fatigue analysis identifies efficient yaw ranges and optimal angles for increased power output and extended operational lifetime [
17].
The implementation of active yaw control has opened up possibilities for wake management, aiming to optimize the power conversion of wind turbines within wind farms while reducing unsteady loading[
18]. Yawed rotors can induce wake deflection [
19,
20]. Miao et al. [
21] conducted a study on the impact of yawing on the performance of two aligned wind turbines, observing an increase in combined power production when the up-wind turbine was yawed at a specific level. Bartl et al. [
22] investigated yaw control in two wind turbines under different turbulence intensities and inflow directions through measurements, achieving a 3.5% to 11% increase in total power through cooperative control. Fleming et al. [
23] estimated a 14% power increase for a downwind wind turbine under a 10-degree wind inflow angle (angle between wind direction and the row of turbines) and a 4% overall production increase for the wind farm using a wake steering strategy. They utilized FLORIS [
24], a model based on the works of Jensen [
25] and Jimenez [
26], which has since evolved into more complex formulations [
27]. Sinner et al. [
28] estimated a 4% increase in power production through wake steering at a specific wind inflow angle in a six-turbine wind farm. Bastankhah and Porté-Agel [
20] conducted wind tunnel experiments using a five-turbine array, exploring the effect of various yaw angles on the first turbine and reporting a significant power increase.
In conclusion, the control and optimization of wind turbines play a crucial role in maximizing energy output, minimizing maintenance costs, and improving the overall efficiency of wind farms. LiDAR technology has emerged as a valuable tool for accurate wind measurement, enabling the implementation of advanced control strategies[
29]. By incorporating LiDAR data into control algorithms, wind turbines can adapt to changing wind conditions, optimize power production, and reduce unsteady loading. Active yaw control and wake management techniques further enhance the performance of wind turbines within wind farm arrays[
30]. Ongoing research and advancements in this field continue to contribute to the development of more efficient and sustainable wind energy systems.
However, while many studies have focused on the efficiency of aligned turbines, fewer investigations have examined optimal yawing under partial wake overlap. This study aims to explore the optimized yaw angle of utility-scale wind turbines under different partial wake and overlap scenarios, considering the potential trade-offs between yaw misalignment strategy and power production.
Section 2 describes the methods and field setup,
Section 3 discusses the results, and
Section 4 summarizes the main findings.
2. Materials and Methods
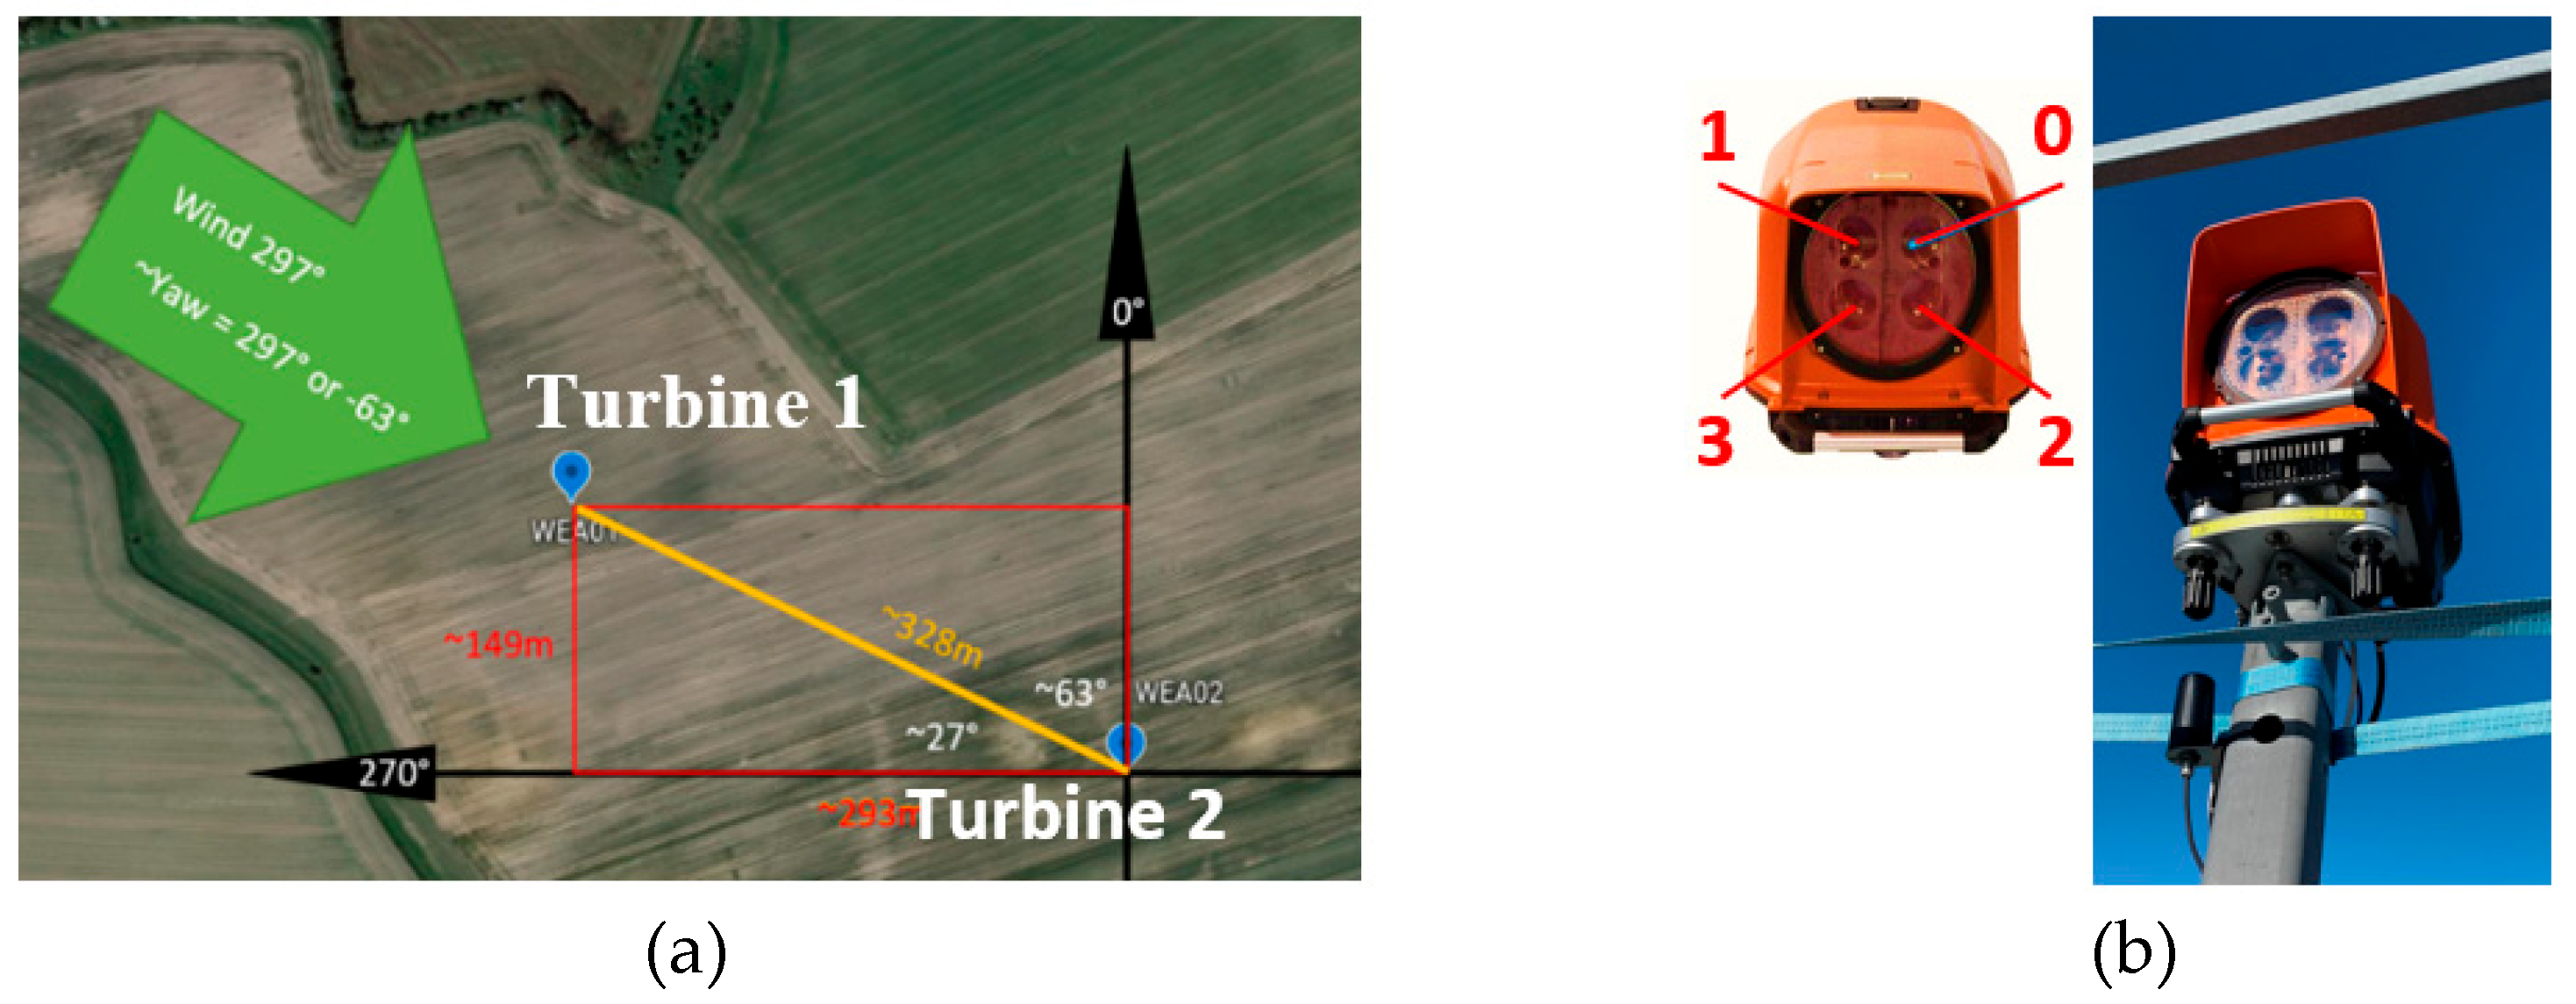
The study is carried out on a two Siemens SG3.4-175, 3.5 MW wind turbine array located in the proximity of Rostock, Germany. The turbines are aligned 297 degrees from the north; see
Figure 1. The downwind turbine (hereon No. 2) is equipped with a four-beam LiDAR system that can measure wind parameters at ten distances upwind, namely,
= 50, 75, 100, 150, 200, 250, 300, 350. 400, 450 m.
Figure 2 illustrates the basic quantities of the LiDAR and measurement planes. As indicated in reference [
31], the production of the downwind turbine can be affected by the partial momentum deficit induced by the upwind turbine when the wind is from an angle of approximately 297 or 117 degrees North. In addition to LiDAR, complementary SCADA data is used to calculate absolute wind direction,
, and speed,
, at the hub height. The relative angles
and
from the LiDAR sensor, given in
Figure 2, are 5 and 15 degrees respectively. The
and
angles are inferred from equations 1 and 2, trigonometrically, as follows.
The parameters needed to compute the wind veer are calculated from equations 3-5 and replaced in equation 6. Here,
is the so-called radial wind speed, the projection of the absolute wind speed along the sensor i-beam; see
Figure 2.
The parameters needed to calculate the horizontal component of the wind speed from the upper,
, and lower,
, beams are calculated from equations 7 and 8 and replaced in equation 9.
The direction of the horizontal component of the wind speed at hub height,
, is given by:
the shear
[
32] and the horizontal component of the wind speed at hub height,
, are given by:
Figure 3 illustrates basic parameters used to assess the turbine interaction; these include the wake expansion growth rate, K; see e.g., [
33]. The radial and axial distances between rotors are
and
. Note that for
, the downwind turbine is affected by the wake. The range of wind inflow angle for overlap,
, is:
An overlap in the range of
to about
is expected for the setup under study. Considering all wind directions, the range producing overlap in the two-turbine system is
, where each turbine takes
. The axial induction factor at the rotor plane, a, is estimated from the far-field incoming wind speed,
, and the wind speed at the rotor plane,
from the LiDAR measurements. The thrust coefficient,
, is determined from it (equation 14), for the non-yawed rotor [
34]:
A reference wake profile is approximated using the analytical approximation by e.g., Bastankhah and Port´e-Agel [
20] (equation 15) considering the full overlap inflow directions (
and
North). Then, using the parameters from Equation 16, the performance and power gain of the turbine system are estimated with Equation 17. The value of
is then calculated using the wind speed at the downwind rotor plane and
, which is between 1.3 and 2.5 [
35].
Effects of turbulent intensity, thrust coefficient, and wind inflow angle on the optimal yaw and the power gain of the wind farm for achieving a yaw control strategy and for a possible wake steering application are discussed in the next section.
3. Results and Discussion
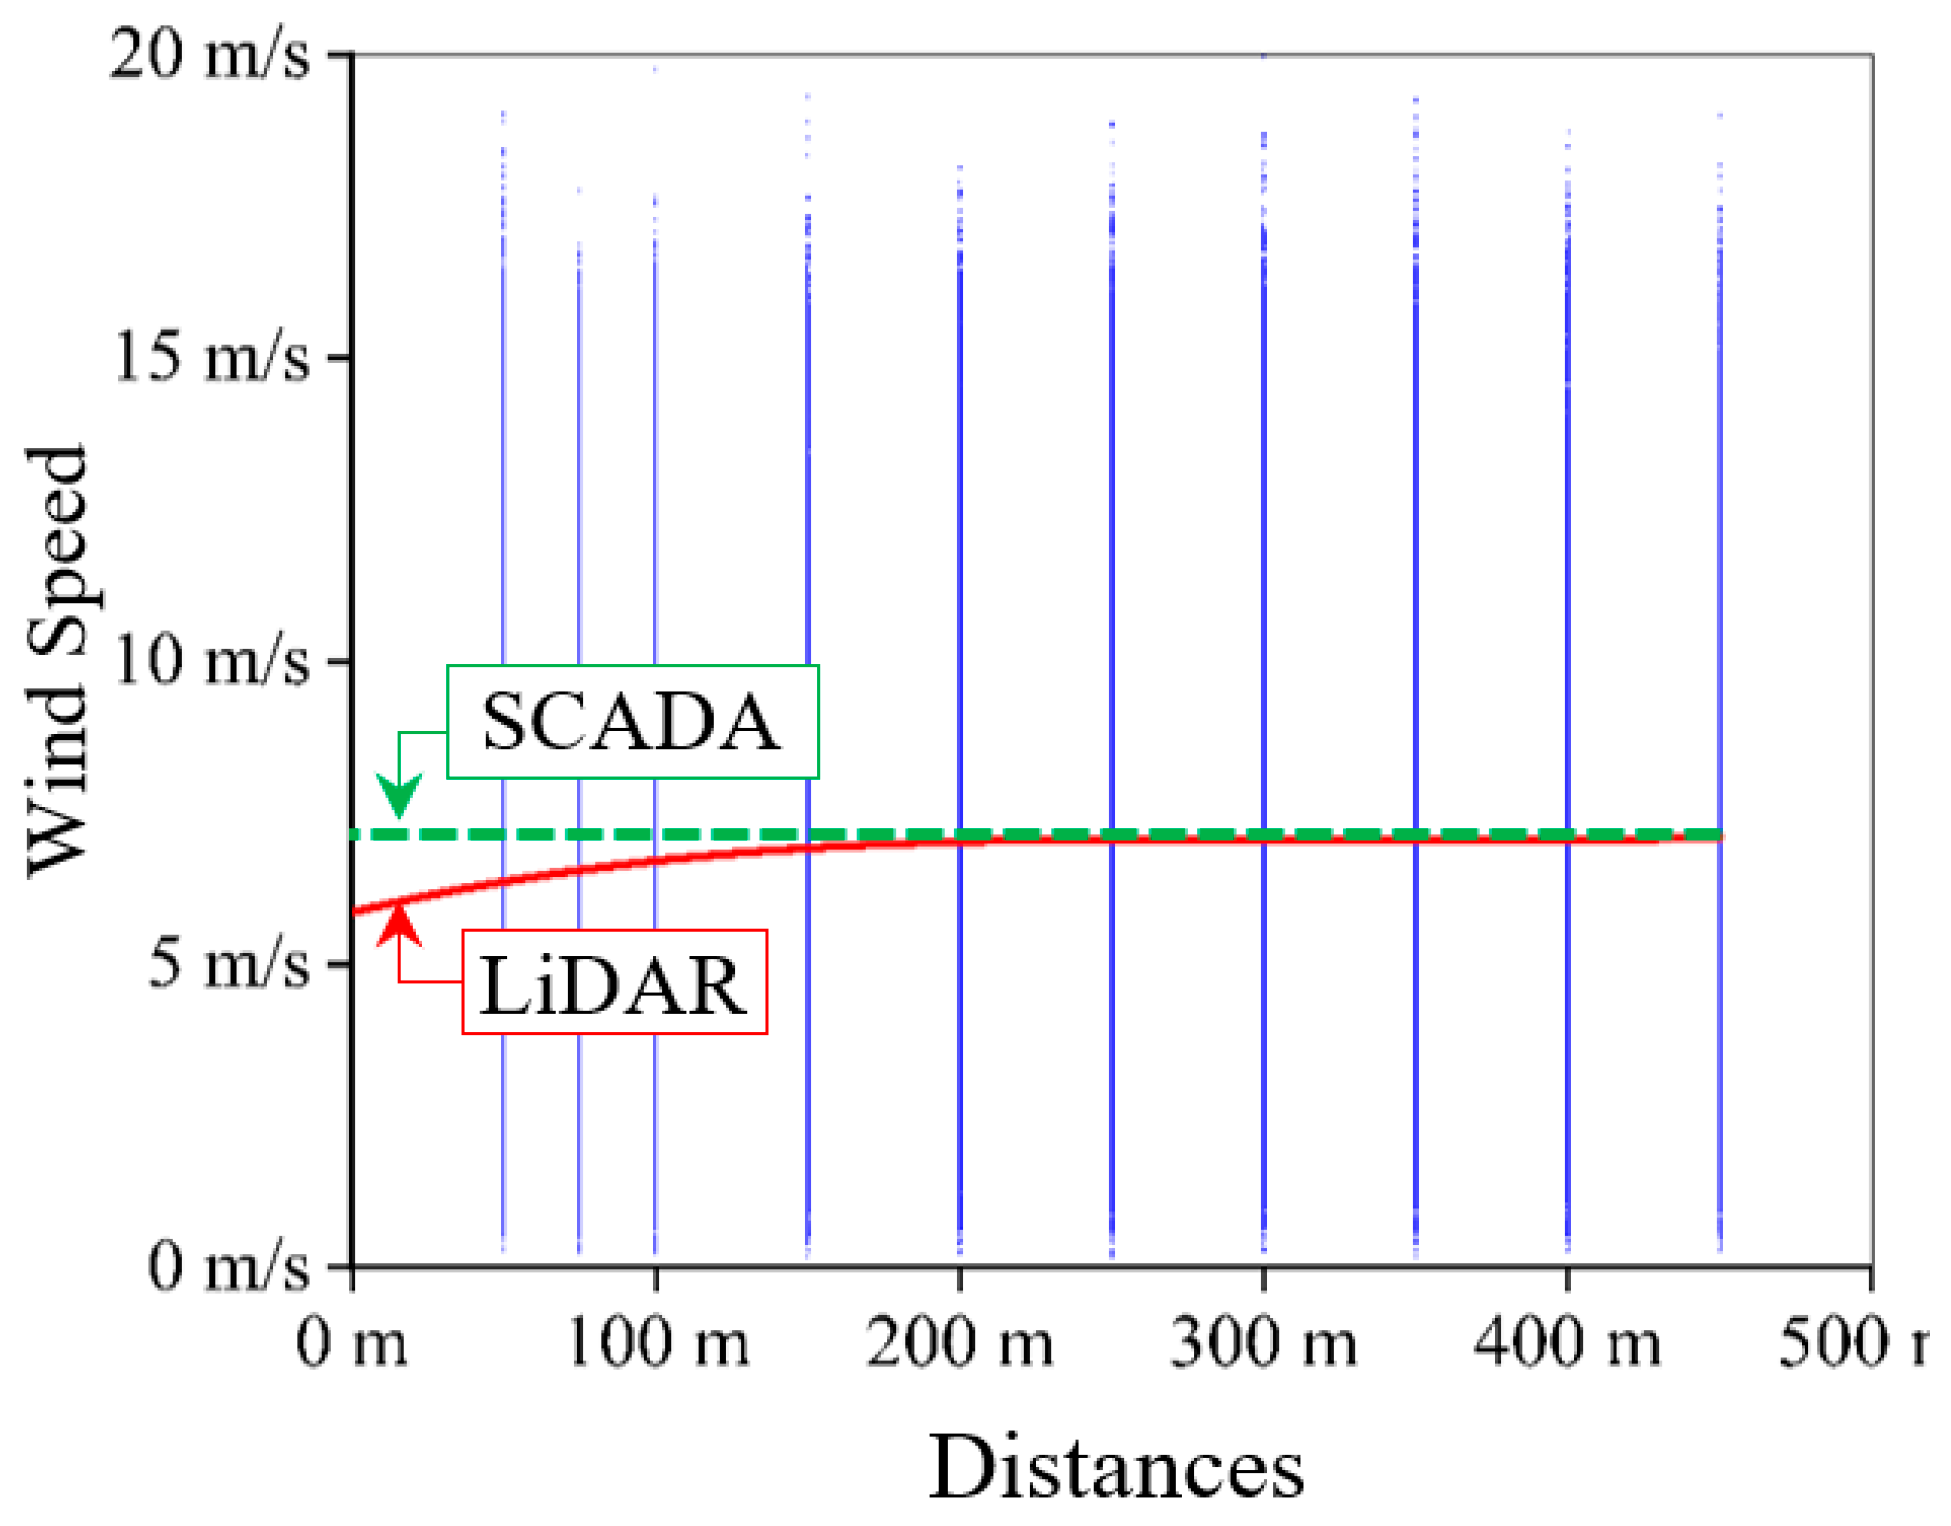
The year-long LiDAR data indicates a 5.84
bulk wind speed in the rotor plane (
Figure 4). Bulk
is 0.62, obtained from the axial induction using SCADA and LiDAR data. The average annual wind speed measured by the SCADA system is 7.23
on the rotor plane, as shown in
Figure 4. Compared with LiDAR, it is well-calibrated with the far-field upstream wind speed. It indicates that the SCADA data provides far-field wind speed at a distance of at least 250 meters upwind, not at the rotor plane.
Wind direction, wind farm layout and location can make a significant influence on yaw control strategy [
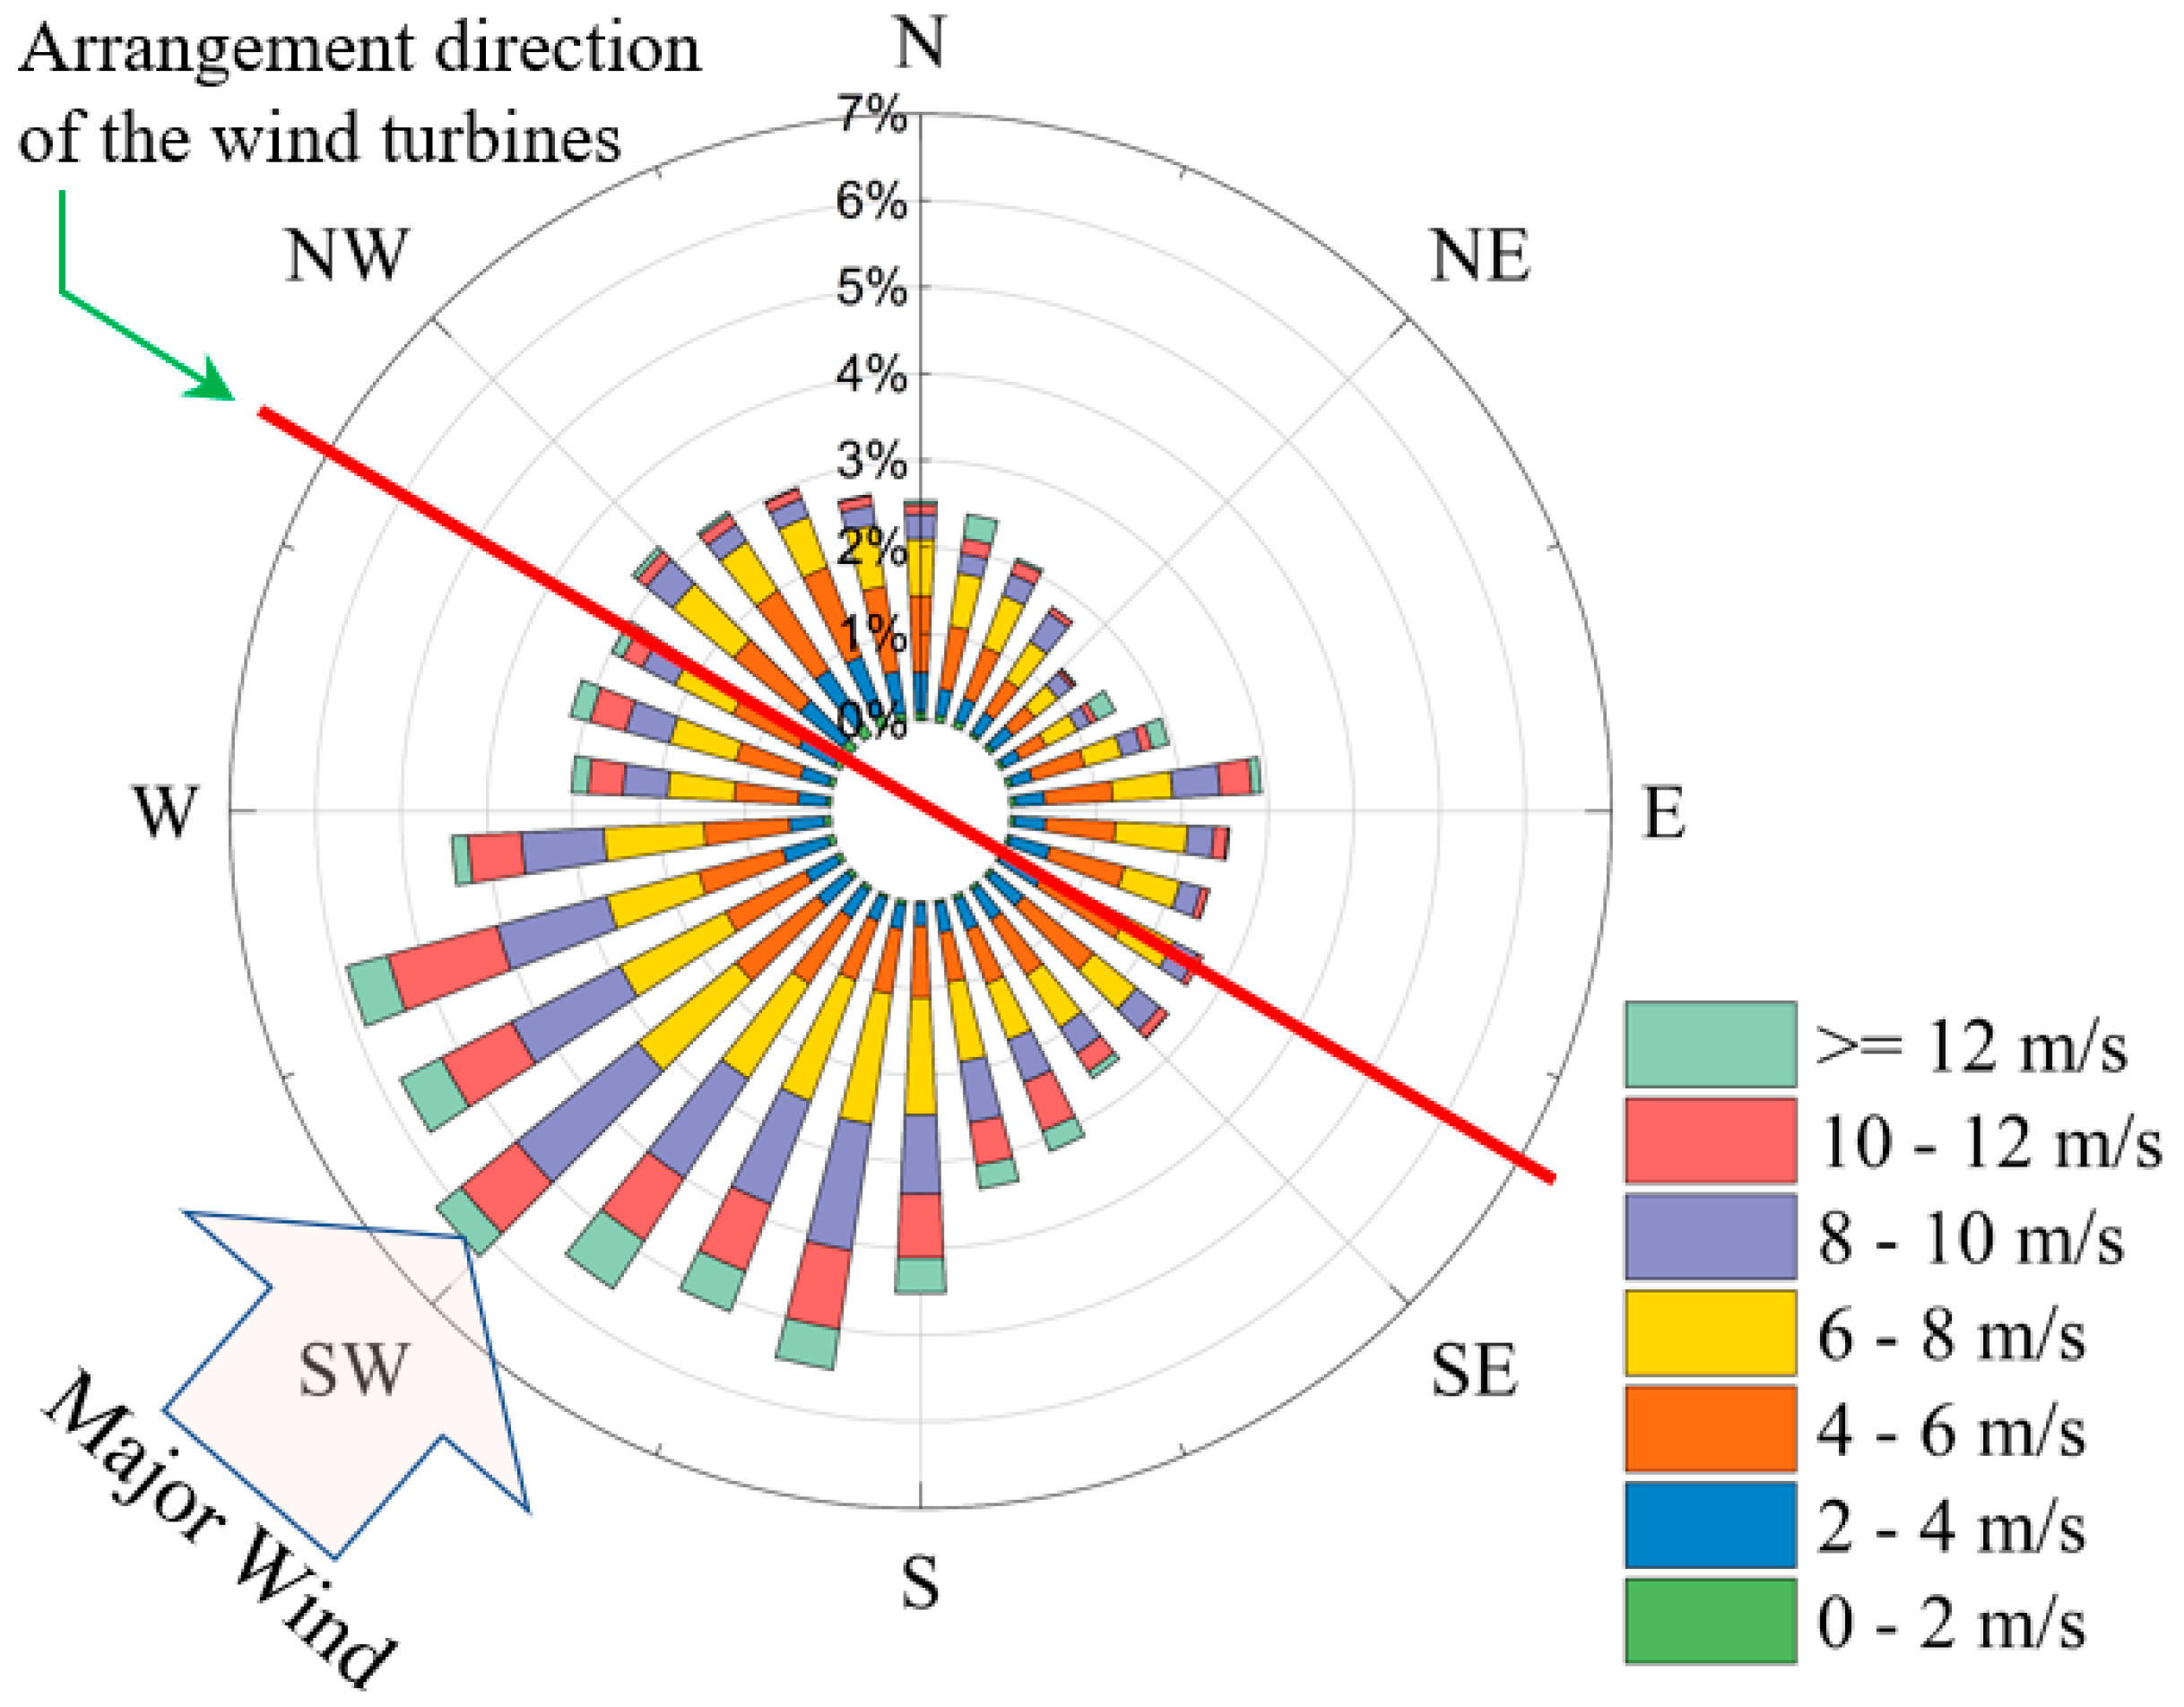
36]. The associated wind rose in the area of this study is illustrated in
Figure 5. The wind rose at the turbines location is obtained with the LiDAR and SCADA data. It is obtained for a yearlong and divided into 30 equal sections. It shows that the turbine pair receives winds from 180 to 270 degrees north at about 40% of the year. It is roughly 15% for the first quarter and 25% for the second and fourth quarters. So, the wind distribution indicates that the third quarter has the major wind. As seen, the wind farm layout appears appropriate; the major winds blow from the South-West, i.e., perpendicular to the arrangement of the turbines.
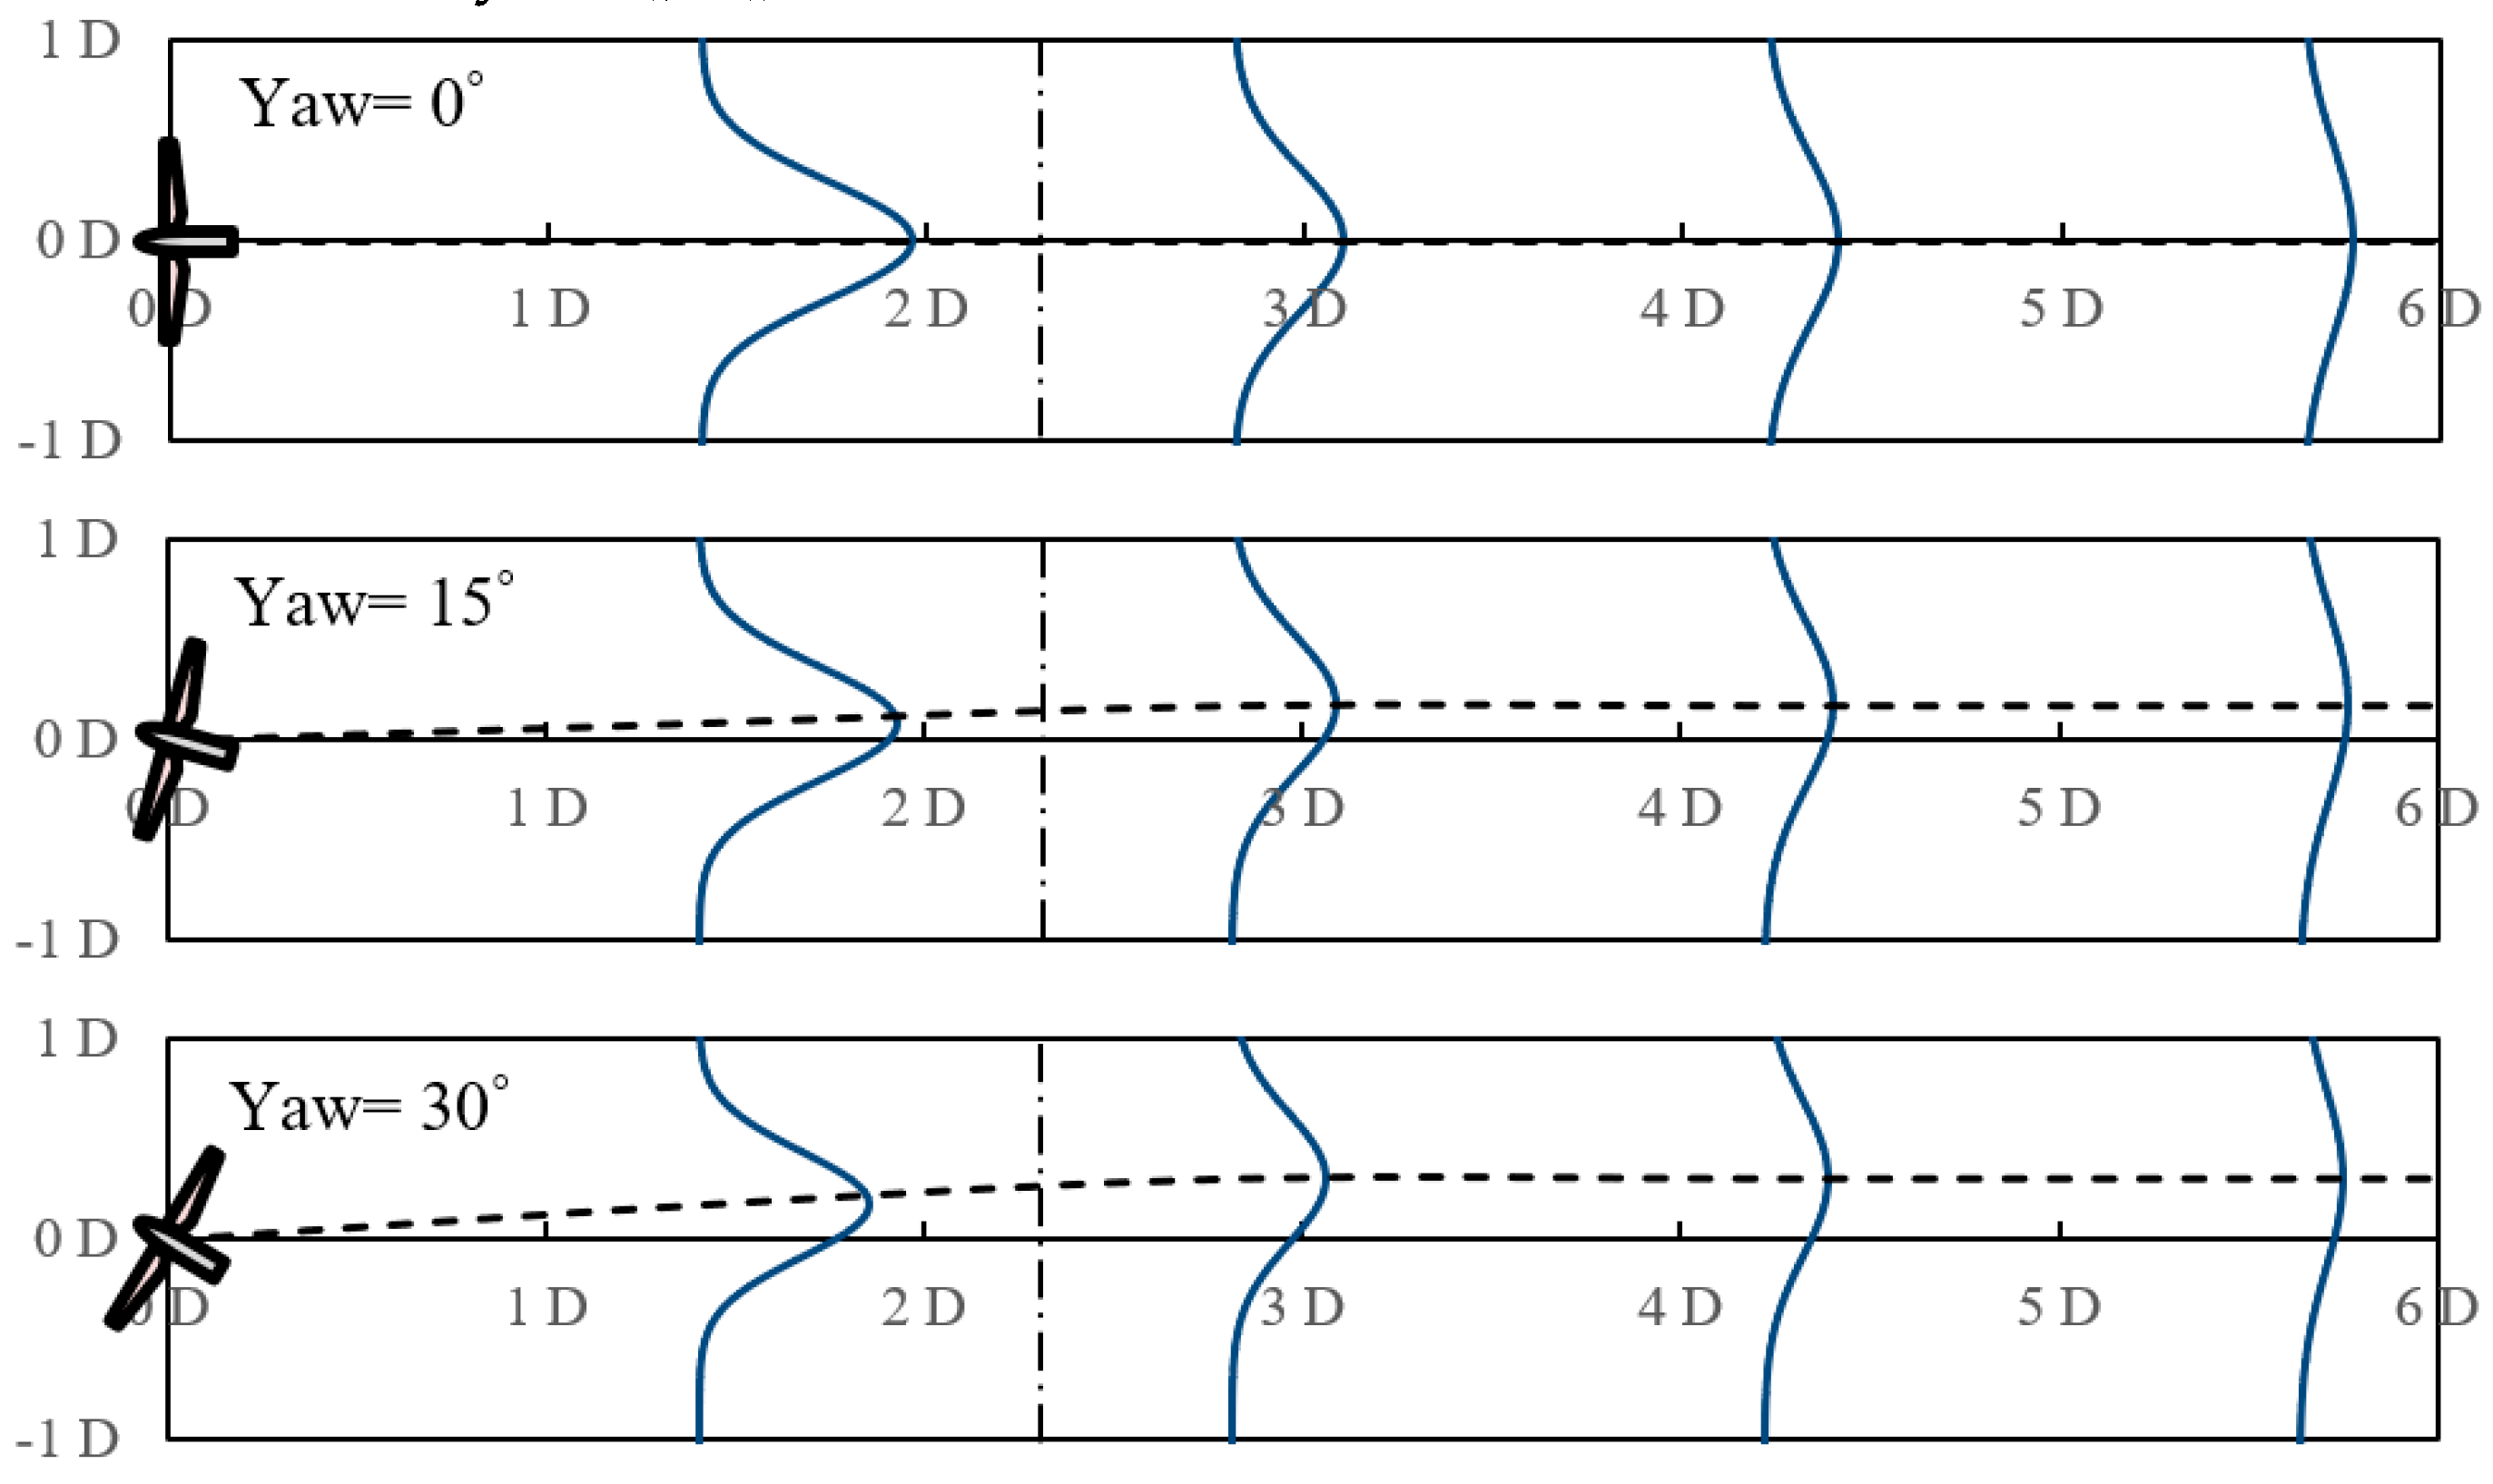
The wake for the referential average of the year modelled under different yaw angles is shown in
Figure 6. The position of the downwind wind turbine is represented by a black dash line.
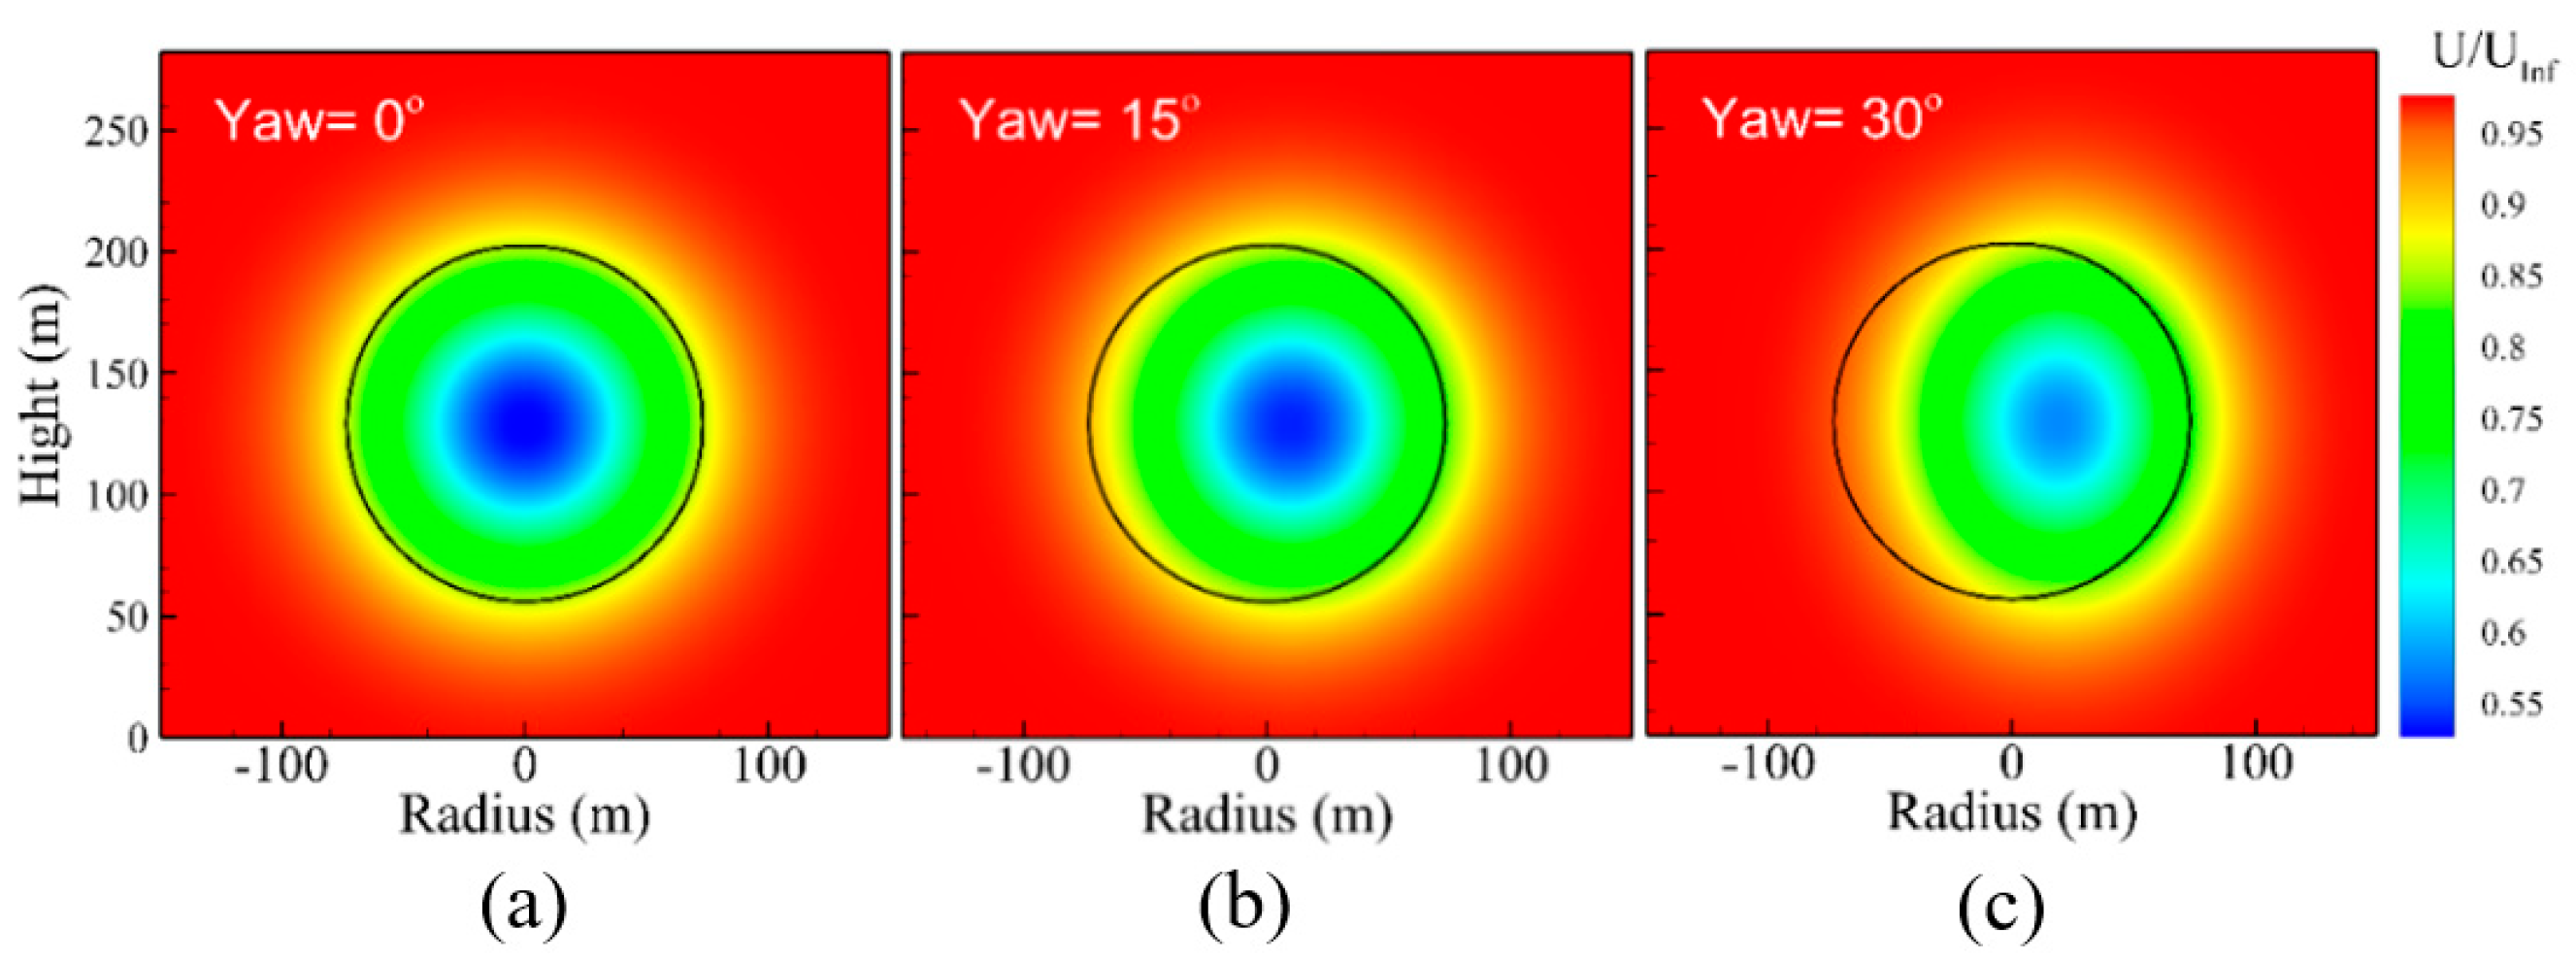
Figure 7 illustrates the wake of the upwind turbine in the rotor plane of the downwind turbine (black circles). In a yaw optimization approach, the wake deflection has a positive impact on the production of the downstream turbine that must overcome the negative effect of the upstream turbine yaw misalignment on its energy production.
As indicated by
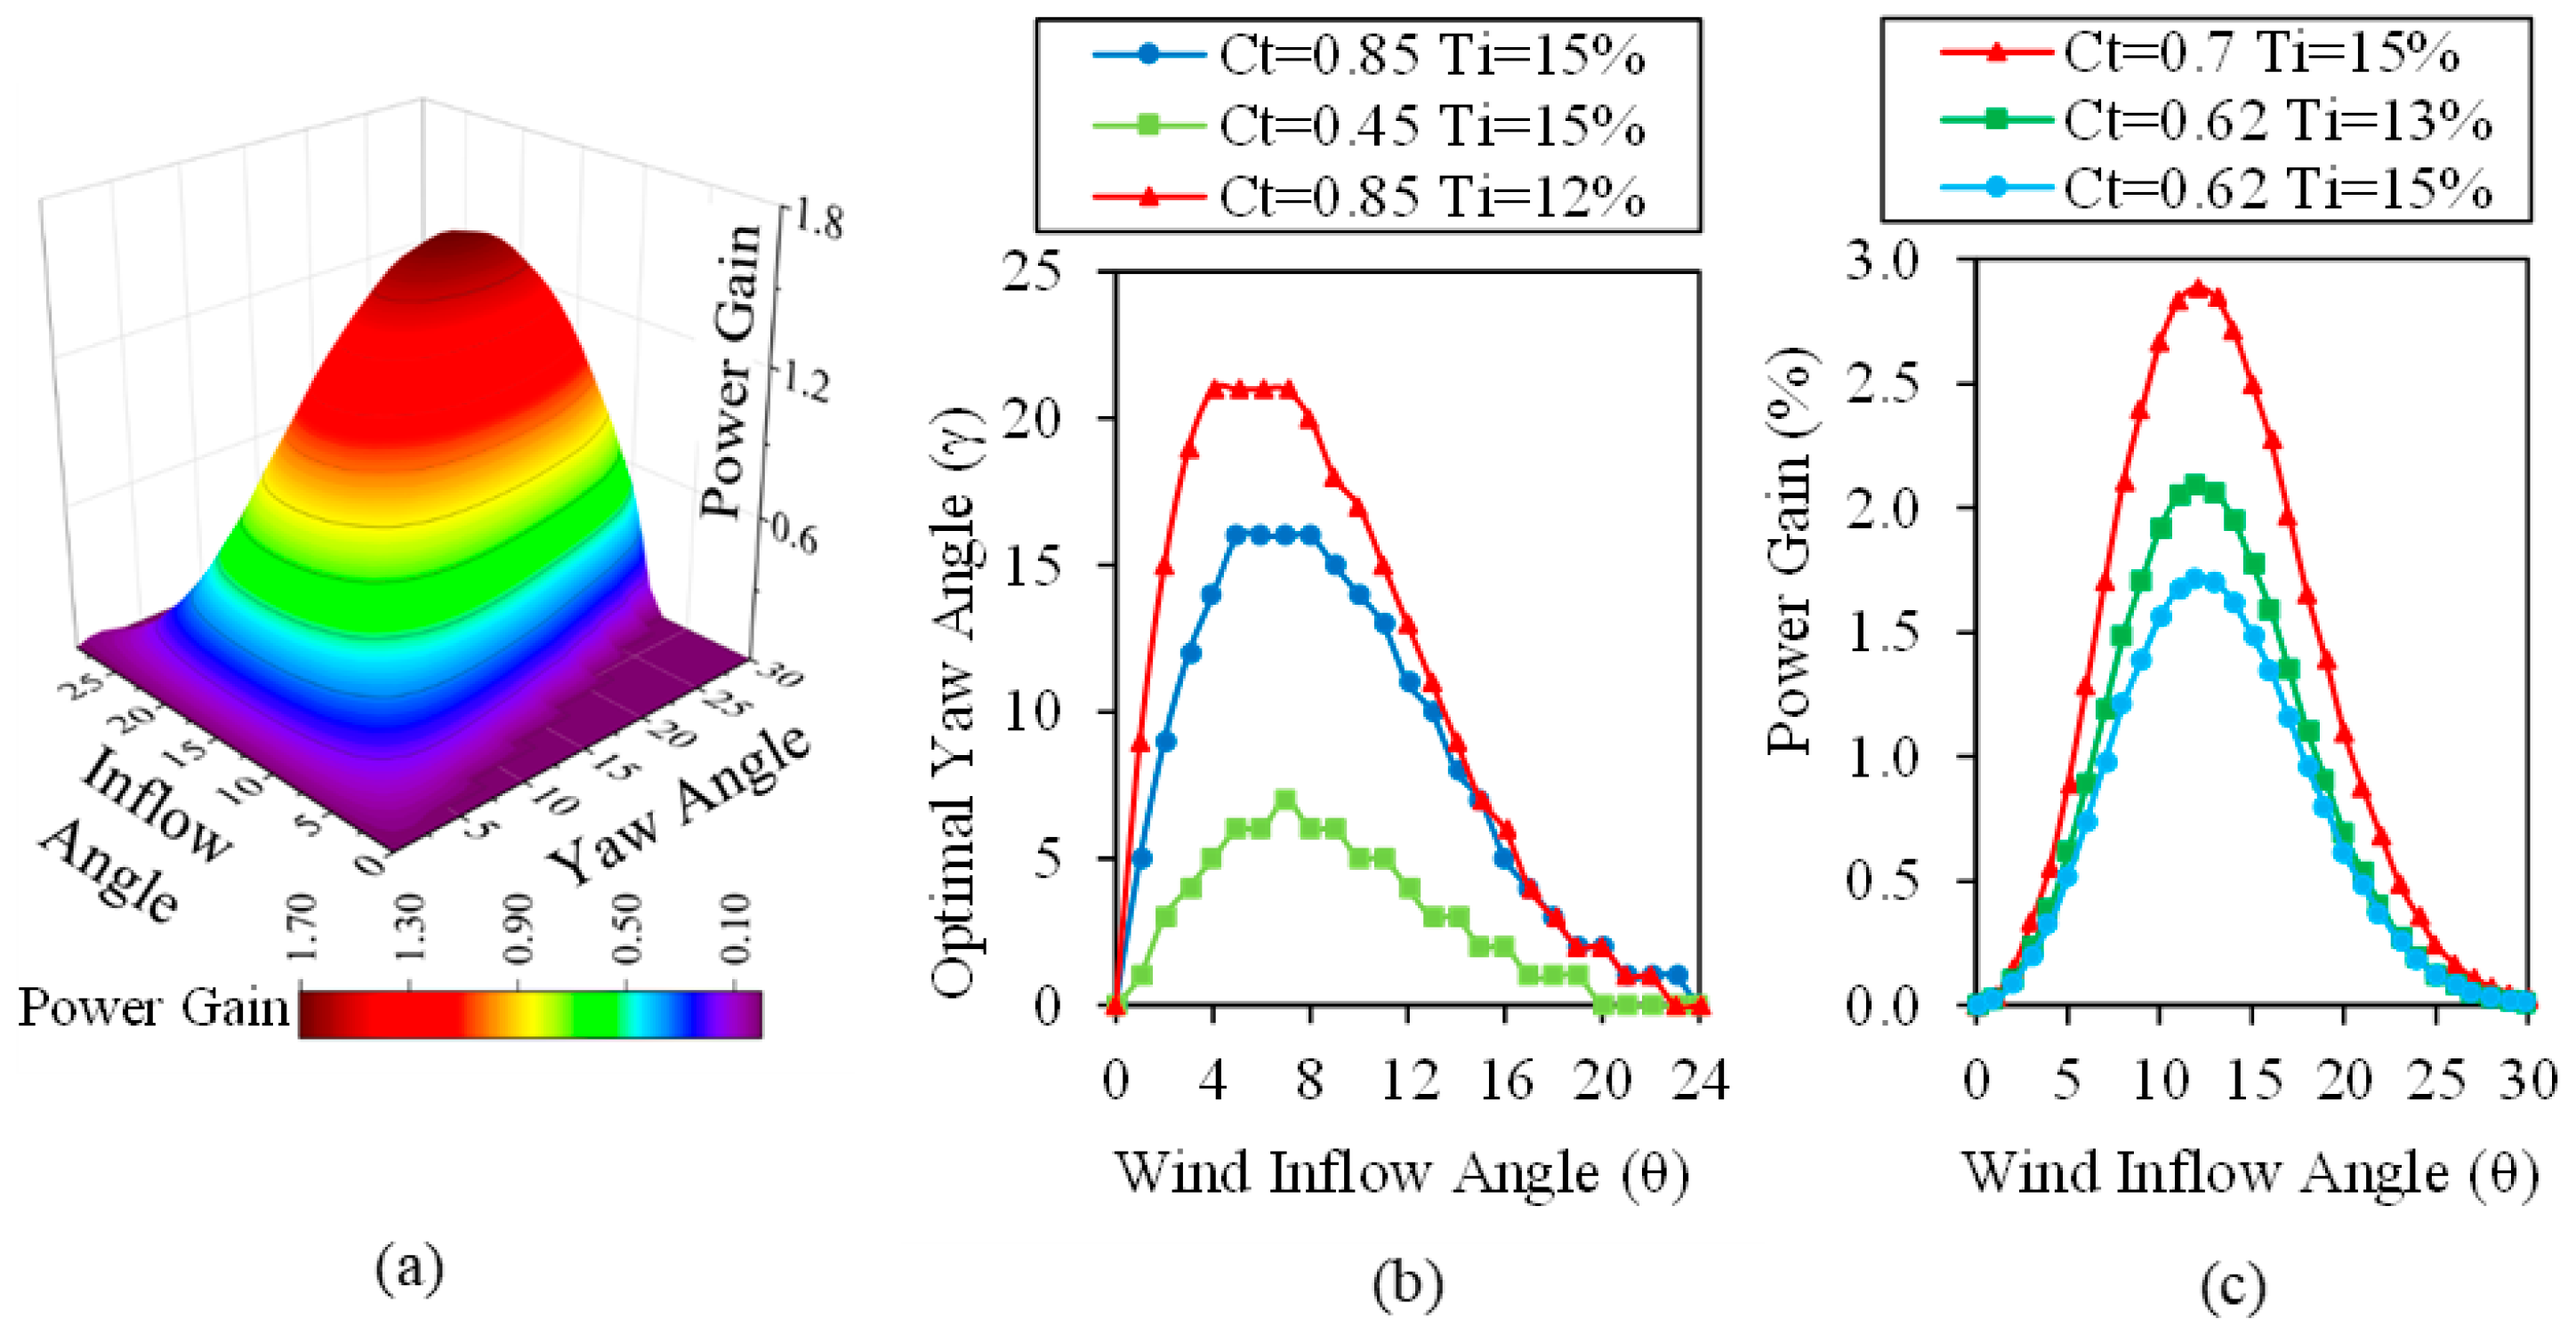
Figure 8, the yaw angle producing the maximum performance changes with the change of
and
values in
to
yaw angles. In studies employing Large Eddy Simulation (LES), this is occurred in
to
yaw angles, pointing that it depends on the location of the wind turbine in the wind farm layout [
37].
In
Figure 9, the wind speed ratio (
) in two cases: data without the yaw angle of the upstream turbine obtained from the SCADA and LiDAR systems (
Figure 9a,b), and the optimal yaw angle obtained from the analytical model (
Figure 9c,d) is shown. In
Figure 9c,d, we see a decrease in areas with a lower wind speed ratio than that in
Figure 9a,b. Because with more misalignment of the upstream turbine rotor, more intact and high momentum wind flow reaches the downstream turbine.
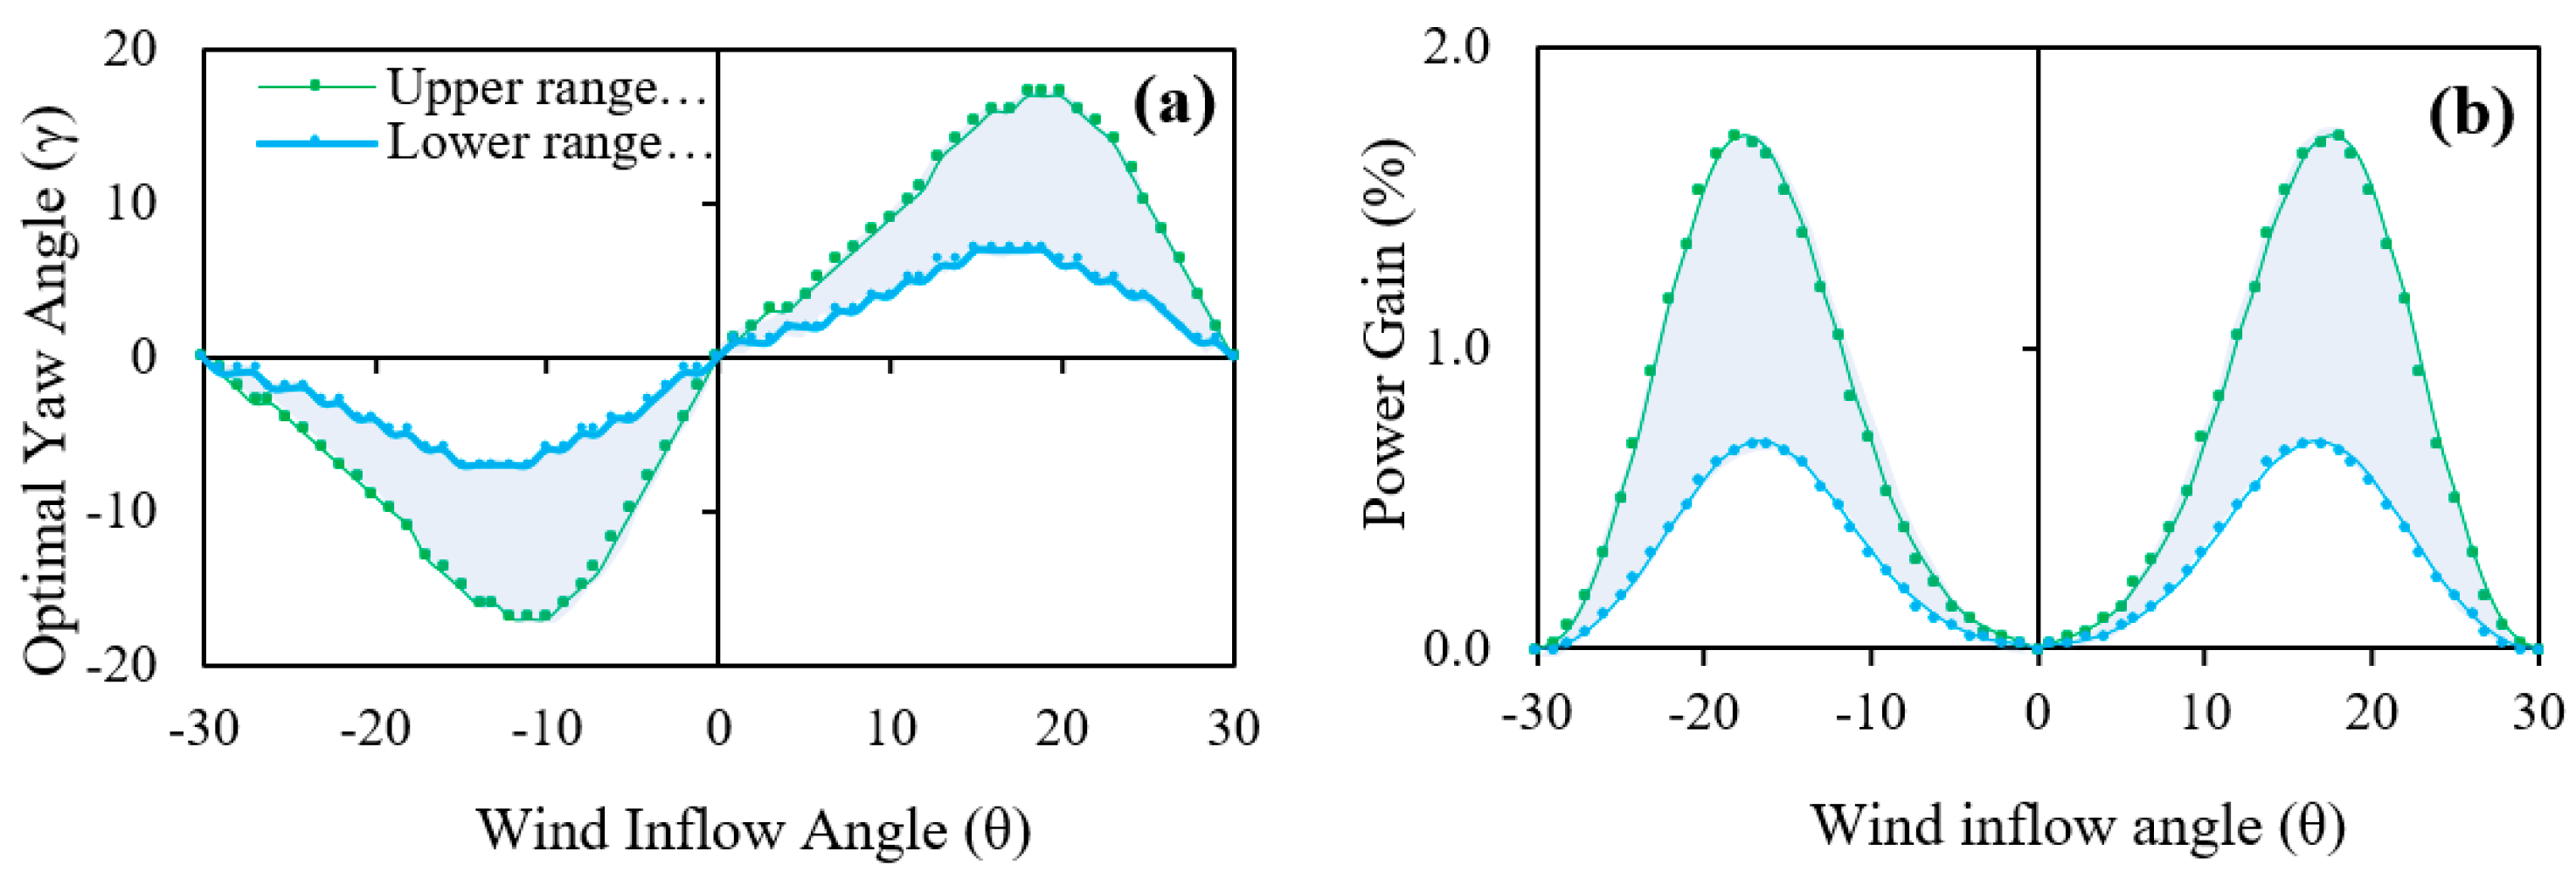
The maximum amount of power gain in the average annual occurs between wind inflow angles of 15 and 20 degrees (
Figure 10a), where the corresponding optimal yaw angles are between 3 to 9 degrees. As seen in
Figure 10b, the changes in power gain and the corresponding optimal yaw angle behave like a Bell curve along with the range of the wind inflow angle.
Changes in the power gain at different angles of the upcoming wind indicate that the amount of power gain is very low at small values of wind inflow angle (). But by increasing to values of 12 and 14 degrees, the amount of power gain reaches its maximum amount. Then with a further increase of , the amount of power gain decreases again until the downstream turbine leaves the wake area of the upstream turbine and then the power gain becomes zero. The appearance behaviours of power gain are similar in both values, but their maximum values are different.
Finally, according to the frequency of wind speed in different upstream angles, the amount of wind farm power gain increase, both in the overlap range and during one full-year, is calculated according to
Table 1.
At first glance, the power gain values obtained in this study, ranging from 0.23 to 0.58 in the overlap region and 0.08 to 0.21 in the full year, are relatively lower compared to some other research findings. One of the key factors contributing to this difference is the number of turbines in a row, as it has been observed that the power gain tends to increase with an increase in the number of turbines [
31]. As highlighted by Song et al. [
36], power plants with only two turbines, similar to the wind farm studied in this research, typically exhibit lower power gains. Their study on China Ming Yang 1.5 MW wind turbines reported a power gain of 0.32% to 0.8% through yaw control, which falls within the range of our results. This similarity suggests that the power gain achieved with two turbines may be more consistent across different studies. However, it is important to consider that other factors such as wind directions and wind farm layouts can also influence the power gain. Rak et al. [
38] estimated that yaw control in a wind farm consisting of eight rows of NREL 5-MW turbines could improve total power production by approximately 3.59% to 14.66%. This significant power gain can be attributed to the larger number of turbines and the resulting enhanced wake interactions. Similarly, Li et al. [
39] reported a power gain of 2.1% in the major wind direction for a realistic offshore wind farm. These findings highlight the significance of considering specific wind conditions and farm configurations when assessing the potential for power gain through yaw control. Furthermore, Puech et al. [
40] conducted a simulation-based investigation using real-world MM82 2-MW logs and reported a power gain of about 0.31% to 0.33%. These results align more closely with our findings, suggesting that variations in turbine design and operational conditions can contribute to differences in power gain values. Additionally, Howland et al. [
41] developed a collective control approach using a predictive physics-based, data-assisted wind farm flow control model. In their experiment with four utility-scale wind turbines, they achieved a power gain between 0.3% and 1.0%. This demonstrates the potential for further enhancing power gain through advanced control strategies, even with a limited number of turbines.
Overall, the comparison with other research emphasizes the complex nature of power gain through yaw control, influenced by factors such as the number of turbines, wind directions, wind farm layouts and locations, and control strategies employed. While the power gain values obtained in this study may be relatively lower, they still demonstrate the potential for improving power production through yaw control. Further studies focusing on optimizing control strategies and considering specific wind farm configurations are necessary to enhance power gain and maximize energy production.
4. Conclusions
In this study, using both measurement methods and mathematical models for the wake region, the amount of performance and power gain of a wind farm consisting of two 3.5 MW wind turbines equipped with a nacelle-mounted multi-plane LiDAR sensor was studied for a full year. First, the LiDAR data were analyzed along with SCADA data, and then a data-assisted mathematical model was customized to optimize the yaw angle and thus maximize the power gain, and then the results were deeply discussed.
In this case, it was found that in 38 percent of the year, the wind blows from the third quarter (southwest), which was called the major wind direction in the wind rose. It was 23 percent for the second quarter as well as the fourth quarter. This indicates that the major wind blows perpendicular to the line connecting the two turbines, according to the wind farm layout.
It was also found that the amount of optimal yaw of the upstream turbine and the amount of power gain of the wind farm depend on the values of
and
. These values depend on the wind conditions of the atmospheric boundary layer. With increasing
, the amount of power gain and the optimal yaw decreases [
42]. With increasing wind speed, the value of
decreases and therefore the power gain and the optimal yaw of the upstream turbine decrease.
Another factor that affects the calculations of both the optimal yaw and the power gain is the reduction factor of the upstream turbine production due to the yaw misalignment (). So that by reducing the value of here, the calculated optimal yaw and power gain increases and vice versa. These values create a range for the estimated parameters in this research. In order to reach the right values and achieve more accurate estimations, more experiments should be performed for more accurate corrections and evaluations.
It was also found that the amount of power gain at the corresponding optimal yaw changes as a Bell curve along the overlap range. So that in the wind inflow angle of zero, the amount of power gain and the corresponding optimal yaw angle are zero. But with increasing the inflow angle, the power gain and the optimum yaw increase, so that the power gain, corresponding optimal yaw of 17 degrees, reach its maximum values of 1.7 percent at an inflow angle of 12 degrees, as an optimistic (maximum) estimate (). At a minimum estimate () and an inflow angle of 14 degrees, power gain reaches its maximum value of 0.69 percent, corresponding optimal yaw of 7 degrees. Then, with a further increase of the wind inflow angle, the downstream turbine exits the wake region of the upstream turbine, and then the power gain and the corresponding optimal yaw angle become zero.
Author Contributions
Conceptualization, E.M., M.Kh. U.R., A.E. and M.K.; Methodology, E.M.; Validation, A.E. and U.R.; Formal analysis, M.Kh.; Investigation, E.M.; Resources, A.E. and U.R.; Data curation, M.Kh.; Writing – original draft, E.M.; Writing – review & editing, E.M., M.Kh., M.K. and; Visualization, M.Kh.; Supervision, E.M.; Funding acquisition, U.R. All authors have read and agreed to the published version of the manuscript.
Funding
The researcher of this project was financially supported by the University of Rostock, the Shahrood University of Technology, and the Ministry of Science, Research and Technology (CISSC center), independently.
Data Availability Statement
The data presented in this study are restricted but may be available by agreement between par-ties. Please contact the corresponding author.
Acknowledgments
We want to thank the Wind Energy Technology Institute, University of Rostock, the Wind-Projekt Company as the owner of the LiDAR system for providing the experimental data for this project, the Siemens Gamesa Company for their consultants, Center for International Scientific Studies and Collaborations (CISSC) of Iran for their support.
Conflicts of Interest
The authors declare no conflicts of interest.
References
- Irena, I. Future of Wind: Deployment, Investment, Technology, Grid Integration and Socio-Economic Aspects. Abu Dhabii 2019. [Google Scholar]
- Kragh, K.; Fleming, P. Rotor Speed Dependent Yaw Control of Wind Turbines Based on Empirical Data. In 50th AIAA Aerospace Sciences Meeting including the New Horizons Forum and Aerospace Exposition; Aerospace Sciences Meetings; American Institute of Aeronautics and Astronautics, 2012.
- Barthelmie, R.J.; Rathmann, O.; Frandsen, S.T.; Hansen, K.S.; Politis, E.; Prospathopoulos, J.; Rados, K.; Cabezón, D.; Schlez, W.; Phillips, J. Modelling and Measurements of Wakes in Large Wind Farms. In Proceedings of the Journal of Physics: Conference Series; IOP Publishing, 2007; Vol. 75, p. 12049.
- Zakir, M.N.; Abasin, A.R.; Irshad, A.S.; Elias, S.; Yona, A.; Senjyu, T. Practical Wind Turbine Selection: A Multicriterion Decision Analysis for Sustainable Energy Infrastructure. Pract. Period. Struct. Des. Constr. 2024, 29. [Google Scholar] [CrossRef]
- Lin, M.; Porté-Agel, F. Power Production and Blade Fatigue of a Wind Turbine Array Subjected to Active Yaw Control. Energies 2023, 16. [Google Scholar] [CrossRef]
- Fleming, P.A.; Ning, A.; Gebraad, P.M.O.; Dykes, K. Wind Plant System Engineering through Optimization of Layout and Yaw Control. Wind Energy 2016, 19, 329–344. [Google Scholar] [CrossRef]
- Scholbrock, A.; Fleming, P.; Wright, A.; Slinger, C.; Medley, J.; Harris, M. Field Test Results from Lidar Measured Yaw Control for Improved Yaw Alignment with the NREL Controls Advanced Research Turbine; National Renewable Energy Lab.(NREL), Golden, CO (United States), 2014.
- Mahmoodi, E.; Khezri, M.; Ebrahimi, A.; Ritschel, U.; Chamorro, L.P.; Khanjari, A. A Simple Model for Wake-Induced Aerodynamic Interaction of Wind Turbines. Energies 2023, 16. [Google Scholar] [CrossRef]
- Bao, J.; Yue, H. Design and Assessment of a LIDAR-Based Model Predictive Wind Turbine Control. Energies 2022, 15.
- Yang, J.; Fang, L.; Song, D.; Su, M.; Yang, X.; Huang, L.; Joo, Y.H. Review of Control Strategy of Large Horizontal-Axis Wind Turbines Yaw System. Wind Energy 2021, 24, 97–115. [Google Scholar] [CrossRef]
- Guo, F.; Schlipf, D.; Cheng, P.W. Evaluation of Lidar-Assisted Wind Turbine Control under Various Turbulence Characteristics. Wind Energ. Sci. 2023, 8, 149–171. [Google Scholar] [CrossRef]
- Simley, E.; Fürst, H.; Haizmann, F.; Schlipf, D. Optimizing Lidars for Wind Turbine Control Applications—Results from the IEA Wind Task 32 Workshop. Remote Sens. 2018, 10. [Google Scholar] [CrossRef]
- Held, D.P. Inflow Measurements by Nacelle Mounted Lidars for Wind Turbine and Farm Control. 2019.
- Boorsma, K.; Wagenaar, J.W.; Savenije, F.J.; Boquet, M.; Bierbooms, W.; Giyanani, A.; Rutteman, R. LiDAR Application for WInd Energy Efficiency. 2016.
- Bottasso, C.L.; Pizzinelli, P.; Riboldi, C.E.D.; Tasca, L. LiDAR-Enabled Model Predictive Control of Wind Turbines with Real-Time Capabilities. Renew. Energy 2014, 71, 442–452. [Google Scholar] [CrossRef]
- Kawabata, H.; Kogaki, T. Lidar-Assisted Yaw Control for Wind Turbines Using a 9-Beam Nacelle Lidar Demonstrator. In Proceedings of the Journal of Physics: Conference Series; IOP Publishing, 2020; Vol. 1452, p. 12056.
- He, R.; Yang, H.; Lu, L. Optimal Yaw Strategy and Fatigue Analysis of Wind Turbines under the Combined Effects of Wake and Yaw Control. Appl. Energy 2023, 337, 120878. [Google Scholar] [CrossRef]
- Sun, B.; Su, M.; He, J. Wind Power Prediction through Acoustic Data-Driven Online Modeling and Active Wake Control. Energy Convers. Manag. 2024, 319, 118920. [Google Scholar] [CrossRef]
- Howland, M.F.; Bossuyt, J.; Martínez-Tossas, L.A.; Meyers, J.; Meneveau, C. Wake Structure in Actuator Disk Models of Wind Turbines in Yaw under Uniform Inflow Conditions. J. Renew. Sustain. Energy 2016, 8, 43301. [Google Scholar] [CrossRef]
- Bastankhah, M.; Porté-Agel, F. Experimental and Theoretical Study of Wind Turbine Wakes in Yawed Conditions. J. Fluid Mech. 2016, 806, 506–541. [Google Scholar] [CrossRef]
- Miao, W.; Li, C.; Yang, J.; Xie, X. Numerical Investigation of the Yawed Wake and Its Effects on the Downstream Wind Turbine. J. Renew. Sustain. Energy 2016, 8, 33303. [Google Scholar] [CrossRef]
- Bartl, J.; Mühle, F.; Stran, L. Wind Tunnel Study on Power and Loads Optimization of Two Yaw-Controlled Model Wind Turbines. Wind Energy Sci. Discuss. 2018, 1–21. [Google Scholar]
- Fleming, P.; King, J.; Dykes, K.; Simley, E.; Roadman, J.; Scholbrock, A.; Murphy, P.; Lundquist, J.K.; Moriarty, P.; Fleming, K.; et al. Initial Results from a Field Campaign of Wake Steering Applied at a Commercial Wind Farm – Part 1. Wind Energ. Sci. 2019, 4, 273–285. [Google Scholar] [CrossRef]
- FLORIS, FLOw Redirection and Induction in Steady State. 2024.
- Jensen, N.O. A Note on Wind Generator Interaction; Risø National Laboratory, 1983; ISBN 8755009719.
- Jiménez, Á.; Crespo, A.; Migoya, E. Application of a LES Technique to Characterize the Wake Deflection of a Wind Turbine in Yaw. Wind Energy 2010, 13, 559–572. [Google Scholar] [CrossRef]
- Gebraad, P.M.O.; Teeuwisse, F.W.; van Wingerden, J.W.; Fleming, P.A.; Ruben, S.D.; Marden, J.R.; Pao, L.Y. Wind Plant Power Optimization through Yaw Control Using a Parametric Model for Wake Effects—a CFD Simulation Study. Wind Energy 2016, 19, 95–114. [Google Scholar] [CrossRef]
- Sinner, M.; Simley, E.; King, J.; Fleming, P.; Pao, L.Y. Power Increases Using Wind Direction Spatial Filtering for Wind Farm Control: Evaluation Using FLORIS, Modified for Dynamic Settings. J. Renew. Sustain. Energy 2021, 13, 23310. [Google Scholar] [CrossRef]
- Letizia, S.; Robey, R.; Bodini, N.; Sanchez Gomez, M.; Lundquist, J.K.; Krishnamurthy, R.; Moriarty, P.J. Tilted Lidar Profiling: Development and Testing of a Novel Scanning Strategy for Inhomogeneous Flows. J. Renew. Sustain. Energy 2024, 16. [Google Scholar] [CrossRef]
- Zhang, Z.; Huang, P.; Bitsuamlak, G.; Cao, S. Analytical Solutions for Yawed Wind-Turbine Wakes with Application to Wind-Farm Power Optimization by Active Yaw Control. Ocean Eng. 2024, 304, 117691. [Google Scholar] [CrossRef]
- Bastankhah, M.; Porté-Agel, F. Wind Farm Power Optimization via Yaw Angle Control: A Wind Tunnel Study. J. Renew. Sustain. Energy 2019, 11, 23301. [Google Scholar] [CrossRef]
- Howland, M.F.; González, C.M.; Martínez, J.J.P.; Quesada, J.B.; Larrañaga, F.P.; Yadav, N.K.; Chawla, J.S.; Dabiri, J.O. Influence of Atmospheric Conditions on the Power Production of Utility-Scale Wind Turbines in Yaw Misalignment. J. Renew. Sustain. Energy 2020, 12, 63307. [Google Scholar] [CrossRef]
- Brugger, P.; Fuertes, F.C.; Vahidzadeh, M.; Markfort, C.D.; Porté-Agel, F. Characterization of Wind Turbine Wakes with Nacelle-Mounted Doppler LiDARs and Model Validation in the Presence of Wind Veer. Remote Sens. 2019, 11. [Google Scholar] [CrossRef]
- Burton, T.; Jenkins, N.; Sharpe, D.; Bossanyi, E. Wind Energy Handbook; John Wiley & Sons, 2011; ISBN 111999392X.
- Liew, J.; Urbán, A.M.; Andersen, S.J. Analytical Model for the Power–Yaw Sensitivity of Wind Turbines Operating in Full Wake. Wind Energ. Sci. 2020, 5, 427–437. [Google Scholar] [CrossRef]
- Song, D.; Fan, X.; Yang, J.; Liu, A.; Chen, S.; Joo, Y.H. Power Extraction Efficiency Optimization of Horizontal-Axis Wind Turbines through Optimizing Control Parameters of Yaw Control Systems Using an Intelligent Method. Appl. Energy 2018, 224, 267–279. [Google Scholar] [CrossRef]
- Archer, C.L.; Vasel-Be-Hagh, A. Wake Steering via Yaw Control in Multi-Turbine Wind Farms: Recommendations Based on Large-Eddy Simulation. Sustain. Energy Technol. Assessments 2019, 33, 34–43. [Google Scholar] [CrossRef]
- Rak, B.P.; Santos Pereira, R.B. Impact of the Wake Deficit Model on Wind Farm Yield: A Study of Yaw-Based Control Optimization. J. Wind Eng. Ind. Aerodyn. 2022, 220, 104827. [Google Scholar] [CrossRef]
- Li, B.; He, J.; Ge, M.; Ma, H.; Du, B.; Yang, H.; Liu, Y. Study of Three Wake Control Strategies for Power Maximization of Offshore Wind Farms with Different Layouts. Energy Convers. Manag. 2022, 268, 116059. [Google Scholar] [CrossRef]
- Puech, A.; Read, J. An Improved Yaw Control Algorithm for Wind Turbines via Reinforcement Learning BT - Machine Learning and Knowledge Discovery in Databases.; Amini, M.-R., Canu, S., Fischer, A., Guns, T., Kralj Novak, P., Tsoumakas, G., Eds.; Springer Nature Switzerland: Cham, 2023; pp. 614–630.
- Howland, M.F.; Quesada, J.B.; Martínez, J.J.P.; Larrañaga, F.P.; Yadav, N.; Chawla, J.S.; Sivaram, V.; Dabiri, J.O. Collective Wind Farm Operation Based on a Predictive Model Increases Utility-Scale Energy Production. Nat. Energy 2022, 7, 818–827. [Google Scholar] [CrossRef]
- Zong, H.; Porté-Agel, F. Experimental Investigation and Analytical Modelling of Active Yaw Control for Wind Farm Power Optimization. Renew. Energy 2021, 170, 1228–1244. [Google Scholar] [CrossRef]
Figure 1.
a) Top view of the two-wind turbine array, b) photograph of the LiDAR at the nacelle of wind turbine 2.
Figure 1.
a) Top view of the two-wind turbine array, b) photograph of the LiDAR at the nacelle of wind turbine 2.
Figure 2.
a) LiDAR’s parameters, b) diagram illustrating the directions of laser beams of the nacelle-mounted LiDAR for this particular wind farm.
Figure 2.
a) LiDAR’s parameters, b) diagram illustrating the directions of laser beams of the nacelle-mounted LiDAR for this particular wind farm.
Figure 3.
The downstream turbine is fully under the overlap of the wake of the upstream turbine, where the overlap is full and is 100 percent at the wind inflow angle of zero () (a), Relation between wind inflow angle () and the overlap. As seen, at the moment of this figure, the overlap is just on the border (b).
Figure 4.
One-year measured LiDAR data averaged on the ten measuring planes (vertically arranged blue dots) reveals how the rotor’s induction (red line) penetrates the up-stream flow, compared to the SCADA measurement at the rotor plane (green dash line) which is well calibrated with the far-field.
Figure 4.
One-year measured LiDAR data averaged on the ten measuring planes (vertically arranged blue dots) reveals how the rotor’s induction (red line) penetrates the up-stream flow, compared to the SCADA measurement at the rotor plane (green dash line) which is well calibrated with the far-field.
Figure 5.
Wind rose plotted using one-year measured data by LiDAR and SCADA.
Figure 5.
Wind rose plotted using one-year measured data by LiDAR and SCADA.
Figure 6.
Wake deflection structure at different yaw angles (from 0 to 30 degrees). The position of the downstream wind turbine is specified with a white dashed line when the wind inflow angle is Zero.
Figure 6.
Wake deflection structure at different yaw angles (from 0 to 30 degrees). The position of the downstream wind turbine is specified with a white dashed line when the wind inflow angle is Zero.
Figure 7.
The ratio of upcoming wind speed to the downstream wind speed in the wake area: (a), (b), and (c) wind speed ratio at the downstream turbine position, (d), (e), and (f) cropped area of the downstream flow at the downstream rotor position for power production calculation, under 0, 15 and 30 degrees of yaw, respectively.
Figure 8.
Variation of power gain against inflow angle and yaw angle at the average parameters of the year (a), upstream optimal yaw angle (b), and power gain (c) affected by turbulence intensity () and thrust coefficient ().
Figure 8.
Variation of power gain against inflow angle and yaw angle at the average parameters of the year (a), upstream optimal yaw angle (b), and power gain (c) affected by turbulence intensity () and thrust coefficient ().
Figure 9.
Wind speed ratio reaches the downwind turbine at different angles of upcoming wind flow: Using SCADA and LiDAR without yaw, (a) T1 in downstream, (b) T2 in downstream. Using the optimal yaw model of this study, (c) T1 in downstream, (d) T2 in downstream.
Figure 9.
Wind speed ratio reaches the downwind turbine at different angles of upcoming wind flow: Using SCADA and LiDAR without yaw, (a) T1 in downstream, (b) T2 in downstream. Using the optimal yaw model of this study, (c) T1 in downstream, (d) T2 in downstream.
Figure 10.
Yaw control strategy: (a) Optimal yaw angle, (b) power gain due to applying the corresponding optimal yaw angle, at different inflow angles () in the studied wind farm.
Figure 10.
Yaw control strategy: (a) Optimal yaw angle, (b) power gain due to applying the corresponding optimal yaw angle, at different inflow angles () in the studied wind farm.
Table 1.
The amount of power gain for the times of overlap and during one full year.
Table 1.
The amount of power gain for the times of overlap and during one full year.
| |
Power Gain (Percent) |
| E: |
Overlap |
Full Year |
| E=1.3 (Upper range) |
0.58 |
0.21 |
| E=2.5 (Lower range) |
0.23 |
0.08 |
|
Disclaimer/Publisher’s Note: The statements, opinions and data contained in all publications are solely those of the individual author(s) and contributor(s) and not of MDPI and/or the editor(s). MDPI and/or the editor(s) disclaim responsibility for any injury to people or property resulting from any ideas, methods, instructions or products referred to in the content. |
© 2024 by the authors. Licensee MDPI, Basel, Switzerland. This article is an open access article distributed under the terms and conditions of the Creative Commons Attribution (CC BY) license (http://creativecommons.org/licenses/by/4.0/).
