1. Introduction
Metabolic disorders such as metabolic associated fatty liver disease (MAFLD), type 2 diabetes, and obesity are major health problems worldwide. One of the key factors in the development and progression of these metabolic disorders is endoplasmic reticulum (ER) stress. ER stress occurs when the function of the ER is disrupted by protein misfolding or calcium imbalance [
1] . This stress triggers a series of responses known as the unfolded protein response (UPR) to restore ER function [
2]. However, if ER stress persists and becomes severe, it can lead to cellular dysfunction.
Several proteins and small molecules have been investigated for their role in regulating ER stress, including agents that promote protein folding, maintain ER calcium homeostasis, activate UPR pathways, and alleviate oxidative stress [
3,
4,
5]. In particular, naturally derived compounds such as Urolithin A (UA), the metabolite of ellagitannin, the flavonoid Quercetin, and the polyphenol Resveratrol have been shown to alleviate ER stress [
6,
7,
8]. A previous study showed that UA inhibits ER stress and inflammatory responses induced by glucose toxicity in pancreatic β cells [
6]. UA is a well-known mitophagy inducer that removes damaged mitochondria, and also has significant antioxidant and anti-inflammatory effects [
9,
10,
11] . Because of these activities, UA holds great promise as a natural treatment for metabolic diseases. However, its target proteins and detailed mechanisms of action remains to be fully elucidated.
In this study, we investigated the potential of UA to alleviate ER stress associated with MAFLD. Recently, MAFLD has been highlighted as a metabolic disease that includes fatty liver disease and is closely related to insulin resistance and obesity [
12]. Using Cellular Thermal Shift Assay (CETSA) [
13,
14,
15,
16], we identified sarcoplasmic/endoplasmic reticulum Ca
2+-ATPase (SERCA) as a novel binding protein of UA.
SERCA uses energy from ATP hydrolysis to pump cytosolic calcium ions into the ER or SR [
17]. Dysfunction of SERCA is associated with diseases such as muscle disorders and heart failure [
18,
19]. The development of modulators of SERCA may be a promising strategy to maintain cellular homeostasis due to SERCA dysfunction. Our results show that UA, as an agonist of SERCA, alleviates palmitic acid-induced ER stress in liver cells and protects cells from ER stress. This study provides a new understanding of how UA regulates ER stress and highlights its potential role in the treatment of metabolic disorders.
2. Materials and Methods
2.1. Materials
Urolithin A (SML1791), Dimethyl sulfoxide (D2650), Palmitic acid (P5585), Duolink® In Situ Red Starter Kit (DUO92101), Triton X-100 were purchased from Sigma-Aldrich (St. Louis, MO). Rhod2-AM (R1244), Fluo4-AM (F14201), Mag-Fluo-4 AM (M14206), MitoSOX (M36008), Hoechst33342 (H3570), BODIPY 493/503 (D3922), lipofectamine RNAimax (13778075), lipofectamine 3000 (2757100), protease and phosphatase inhibitor solution (78441), DMEM (11995065), fetal bovine serum (FBS) (16000044), bovine serum albumin (A2153), antibiotics were purchased from Thermo-Fisher Scientific (Waltham, MA).
2.2. Cell Culture and Treatment
HepG2 were grown in DMEM, supplemented 10% FBS and 1% antibiotics. All cell cultures were maintained at pH 7.4 in a humidified incubator at 37°C under 5% CO2 in air. When cells were treated with PA, DMEM containing 2% BSA was used.
2.3. Western Blot
Soluble proteins were harvested from cells by using SDS lysis buffer (50 mM Tris-HCl, pH 6.8 containing 10% glycerol, 2% SDS, 10 mM dithiothreitol, 0.005% bromophenol blue). Equal amounts of proteins were analyzed by 8 %, 10 %, 12.5 % sodium dodecyl sulfate-polyacrylamide gel electrophoresis (SDS-PAGE) and then transferred to polyvinylidene difluoride (PVDF) membranes. The blots were then blocked and immunolabeled with primary antibodies against GRP78/Bip (Proteintech, 66574-1-Ig), PERK (CST, C33E10), p-PERK (Abclonal, AP1501), eiF2α (CST, L57A5), p-eiF2α (CST, D9G8), CHOP (Proteintech, 15204-1-AP), β-tubulin (Abcam, ab6040), β-actin (Abcam, ab6276), SERCA (Proteintech, 67248-1-Ig), Flag (Proteintech, 20543-1-AP) overnight at 4°C. Immunolabeling was visualized using an enhanced chemiluminescence kit (Bio-Rad Laboratories, 170-5061) according to the manufacturer’s instructions. Images were quantified using Image J software. All band intensities are proportional to the amount of the target protein on the membrane within the linear range of detection.
2.4. CETSA
Cell suspensions at a concentration of 300×104 cells/15 mL were aliquoted into each conical tube. DMSO (control) or UA was treated at 37 °C for 1 hour with gentle mixing. After centrifugation, the pellet was washed with PBS and resuspended in 1 mL of PBS (with protease inhibitor) and aliquoted into PCR tubes (100 μL per tube) and heated between 40-64 °C for 3 minutes and cooled at 25 °C for another 3 minutes in the thermal cycler. The tubes were centrifuged to pellet the cells and the supernatant was discarded and replaced with 0.4% NP-40 (in PBS) supplemented with protease inhibitors to facilitate solubilization of hydrophobic proteins. The cell suspension was subjected to two freeze-thaw cycles in liquid nitrogen and centrifuged at 20,000 g for 20 minutes at 4 °C. The supernatants (soluble proteins) were collected and used for Western blotting or LC-MS/MS analysis
2.5. Sample Preparation for LC-MS/MS Analysis
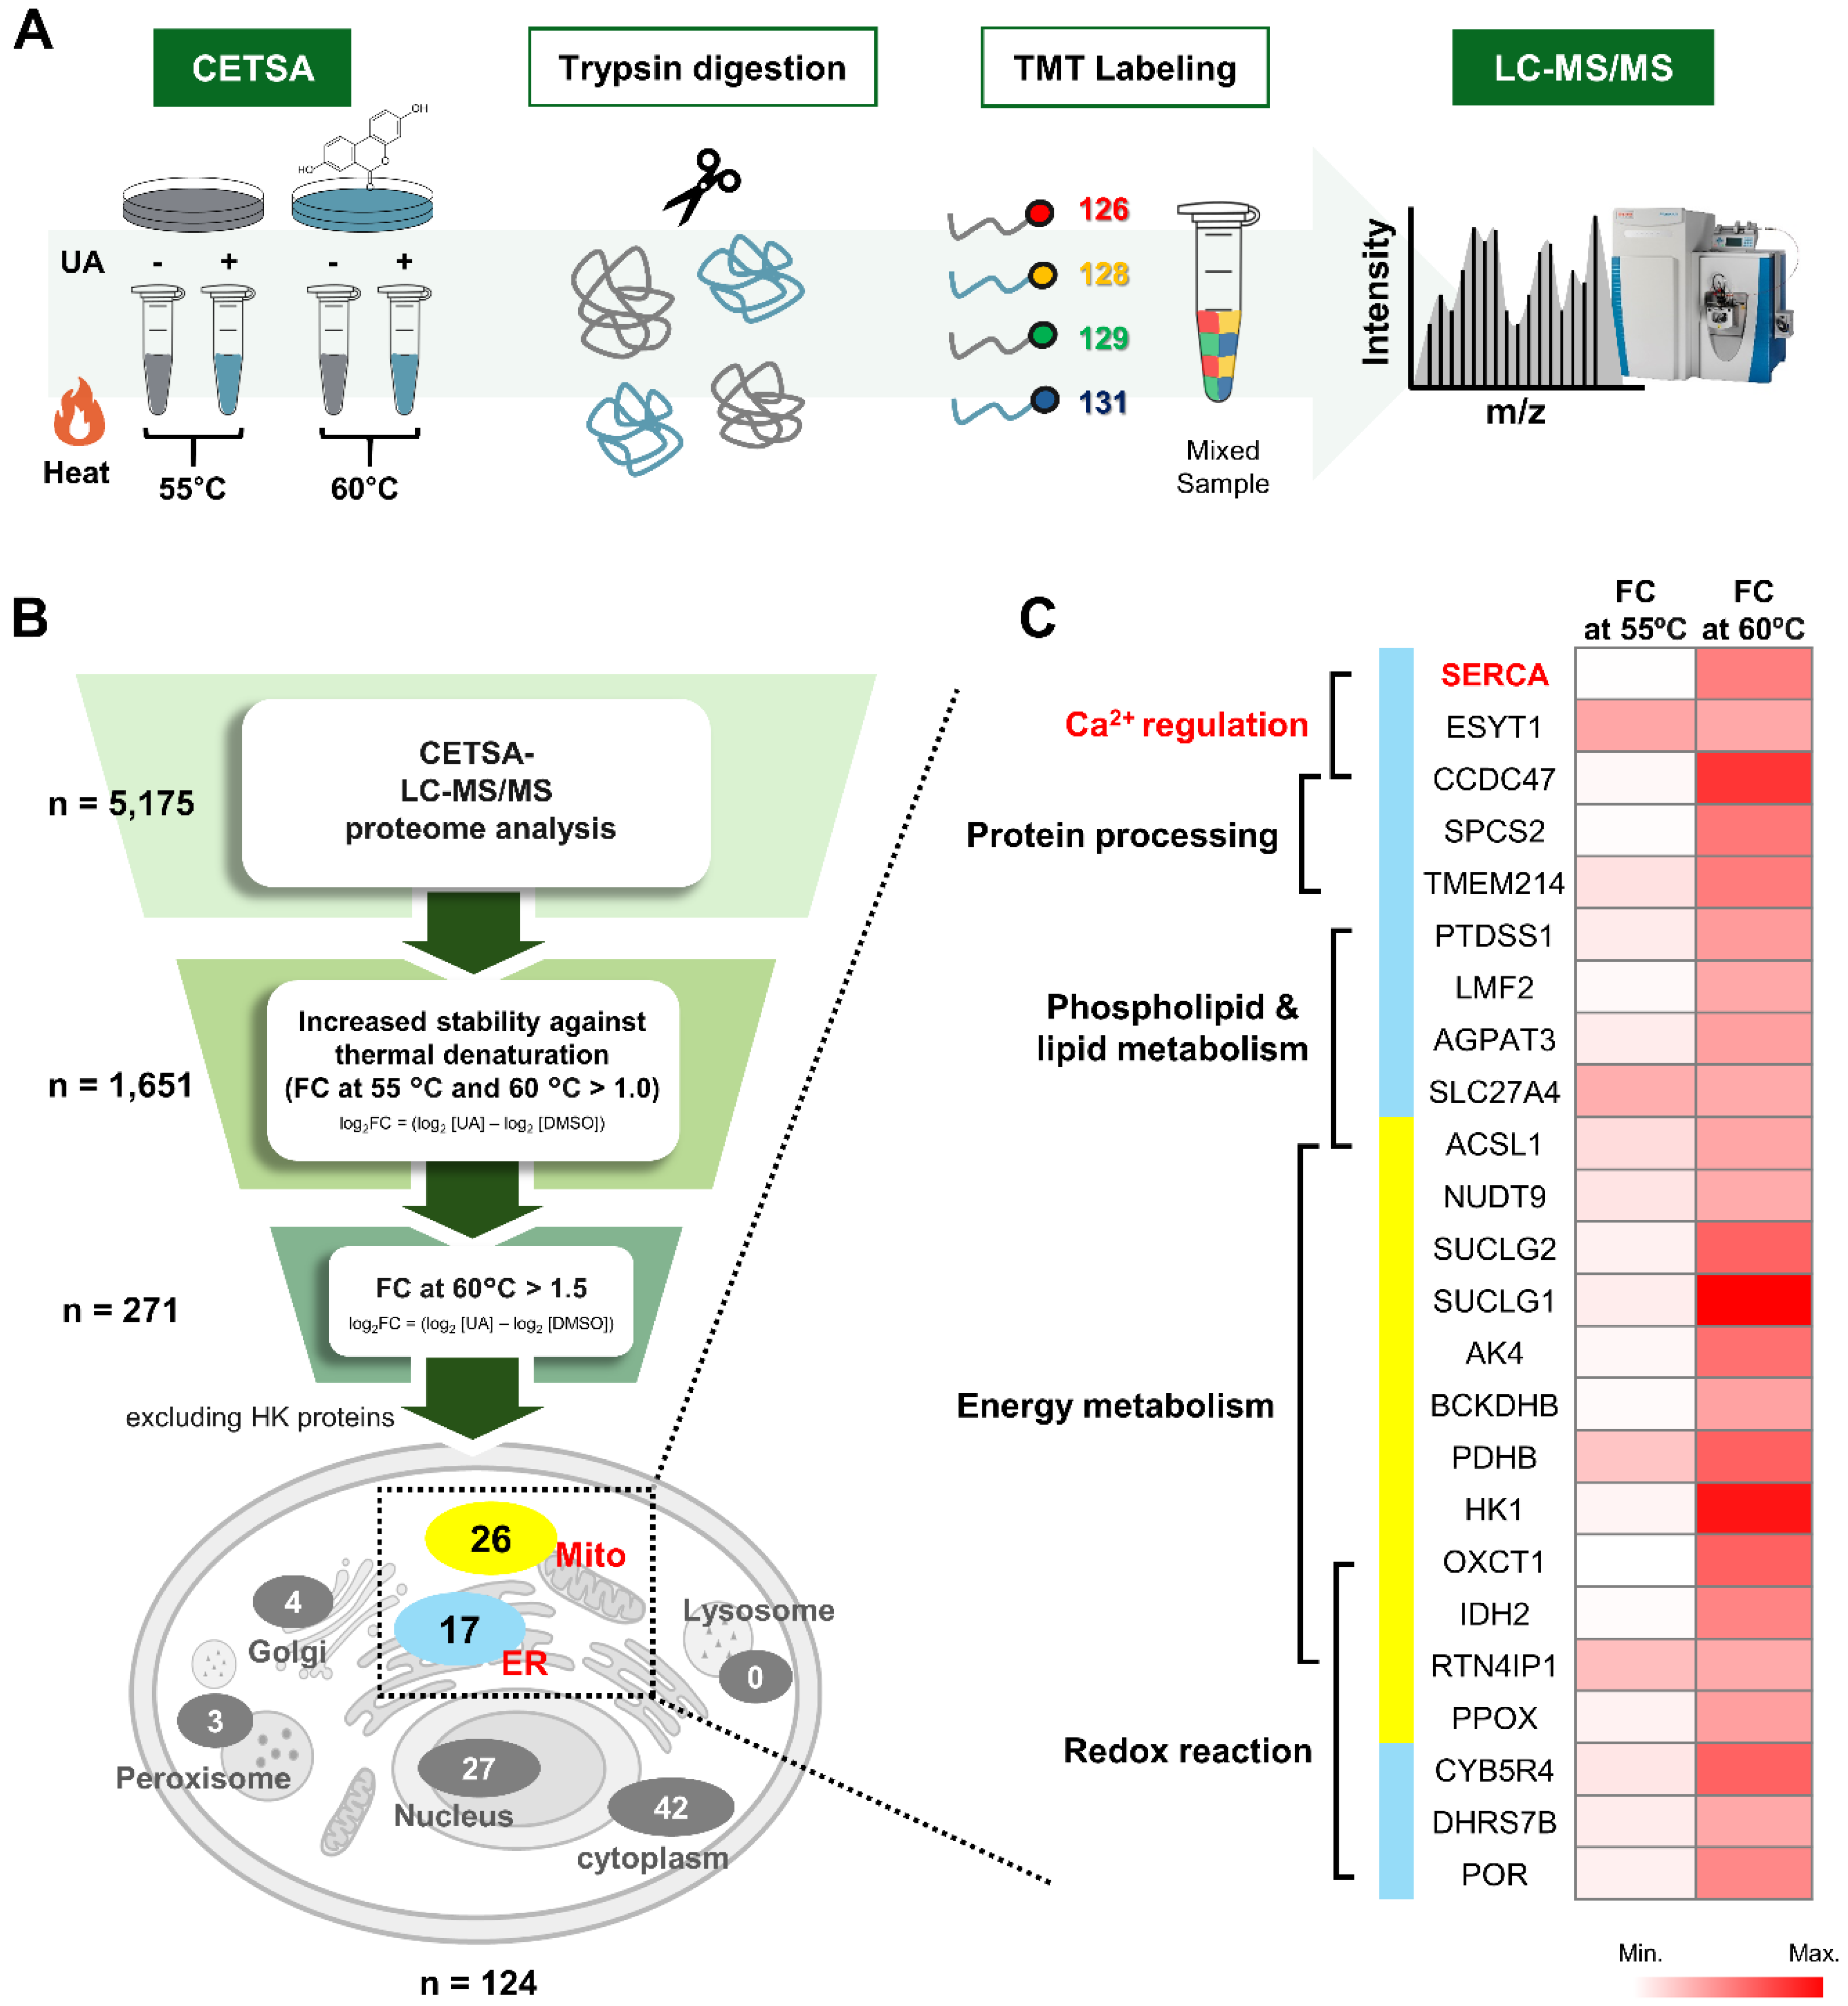
CETSA samples were denatured in 8 M urea and reduced with 500 mM TCEP for 1 hour at room temperature, followed by alkylation with 500 mM iodoacetamide for 1 hour. The buffer was then changed to 200 mM triethylammonium bicarbonate using a 10 K centrifugal filter. Proteins were digested with MS grade trypsin (1:40) at 37 °C for 16 hours. The resulting peptides were labeled with a 6-plex TMT reagent (Thermo-Fisher Scientific) according to manufacturer’ protocols, and the reaction was quenched with 5% hydroxylamine. TMT labeled samples (TMT-126; 55°C DMSO, TMT-128; 55°C UA, TMT-129; 55°C DMSO, TMT-131; 60°C UA) were pooled, vacuum dried, dissolved in 0.5% formic acid, and desalted using a C18 macro spin column. After desalting, the samples were vacuum dried and kept -80 °C freezer until HPLC fractionation.
2.6. High pH Reversed-Phase Liquid Chromatography for Peptide Fractionation
The dissolved TMT 6 plex labeled sample fractionated using a XBridge BEH Shield RP18 Column (130Å, 2.5㎛, 4.6x150mm, Waters) on NexeraXR HPLC (Shimadzu, Kyoto, Japan) with a 70 min gradient from 5% to 95% mobile phases B at a flow rate of 1.0 mL/min. Mobile phase A consisted of 5 mM ammonium formate in 100% water and mobile phase B consisted of 5 mM ammonium formate in 95% acetonitrile; both buffers were adjusted to a pH of 10 with ammonium hydroxide. A total of 40 fractions were collected using an FRC-10A fraction collector (Shimadzu), after the elution started with an interval of 1 min for each fraction. The 40 fractions were concentrated into 10 fractions. The concatenated fractions were dried and kept -80 °C freezer until LC-MS/MS analysis.
2.7. Liquid Chromatography Tandem Mass Spectrometry
Ten fractions were analyzed using a LC-MS/MS system consisting of an UltiMate U3000 RSLCnano (Thermo Fisher scientific) and an Exploris 480 mass spectrometer with a nano-electrospray source (EASY-Spray Sources). Peptides were first trapped in a precolumn (C18, 75 μm × 2 cm, nanoViper, Acclaim PepMap100, Thermo Fisher Scientific) and then applied to an analytical column (C18, 75 μm × 50 cm PepMap RSLC, Thermo Fisher Scientific) at a flow rate of 250 nL/min. The mobile phases were composed of 100% water (A) and 100% acetonitrile (B), each containing 0.1% formic acid. The LC gradient began with 5% B, maintained with 5% B over 8min, ramped to 25% B over 101 min, followed by 50% B over 10 min and increased to 95% B for 1min, and then was held constant for 8 min, and ended with 5% B over 1 min. After a gradient, the column was re-equilibrated with 5% B for 10 min before the next run. The voltage applied to produce an electrospray was 1800 V. The Exploris 480 mass spectrometer was operated in data-dependent mode, automatically switching between MS and MS/MS with a 2 sec cycle time. Full scan MS spectra (400-1600 m/z) were acquired with an auto maximal injection time mode at a resolution of 120,000 and an automatic gain control (AGC) target value of 1.0× 10⁶. MS/MS spectra were acquired from 110 m/z at a resolution of 30,000 with a high energy collision dissociation (HCD) of 38% normalized collision energy within 1.2 Da isolation window. AGC target value was 1.25× 10⁵ with an auto maximal injection time mode. The exclusion time for previously fragmented ions was 60 s within 10ppm.
2.8. Protein Identification and Quantitation
The Integrated Proteomics Pipeline using built-in search engines (IP2, version 6.5.5, Integrated Proteomics) was utilized for data analysis with UniProt human protein database (January, 2023, Reviewed 20,404 proteins). The reversed sequences of all proteins were appended into the database for calculation of false discovery rate (FDR). ProLucid [
20] was used to identify the peptides, a precursor mass error of 5 ppm, and a fragment ion mass error of 50 ppm. Trypsin was selected as the enzyme, with two potential missed cleavages. TMT modification (+ 229.1629) at the N-terminus and lysine residue by the labeling reagent and carbamidomethylation at cysteine were chosen as static modifications. Oxidation at methionine was chosen as variable modification. Reporter ions were extracted from small windows (±20 ppm) around their expected m/z in the HCD spectrum. The output data files were filtered and sorted to compose the protein list using the DTASelect (The Scripps Research Institute, La Jolla, CA) with two and more peptides assignments for a protein identification and a false positive rate less than 0.01 [
21].
Quantitative analysis was performed using Census in the IP2 pipeline (Integrated Proteomics, San Diego, CA) using only the unique peptides. The intensity at a reporter ion channel for a protein was calculated as the sum of the intensities of that reporter ion from all constituent peptides of the identified protein [
22]. Reverse and potential contaminant proteins were removed. The protein intensities summed by the reporter ion intensities of all identified TMT-labeled peptides were uploaded to the Perseus platform (version 1.6.14.0). The data were normalized by subtracting the median values based on columns after being transformed as log
2 values. Quantitative differences in protein levels (log
2 fold change, FC) were then calculated as log
2 [intensity of proteins in the UA sample] – log
2 [intensity of proteins in the DMSO sample] at both 55°C and 60°C, and significant proteins were then selected.
2.9. In Silico Docking Study
Molecular docking analysis was performed using Discovery Studio 2018 software. The structure of the SERCA was obtained from the Protein Data Bank (PDB: 7E7S). For ligands docking, DOCKER (a grid-based molecular docking method using CHARM forcefield) was used. Binding sites are defined by receptor cavities. The ligand was docked to the binding site of the protein and the top 10 hits were generated. The binding energy (CDOCKER energy) was calculated.
2.10. ATPase Activity Assay
The ER Enrichment Kit (Invent Biotechnologies, Minneapolis, MN) was used to isolate ER proteins from liver cells (LX-2), according to the manufacturer’s instructions. The ER fraction was solubilized in 0.5% Triton X-100 buffer (50 mM Tris-HCl (pH 7.4), 150 mM NaCl, 0.5% Triton X-100, 1 mM EDTA, 1 mM EGTA). ER protein at 1 μg/μL was pre-incubated with various concentrations of UA for 30 minutes, followed by measurement of ATPase activity. The ATPase activity was determined using an ATPase assay kit (Abcam, ab234055) according to the manufacturer’s instructions.
2.11. Lipid Droplet Staining
Cells were seeded in 12-well plates and co-treated with 0.5 mM PA and drugs for 24 hours, followed by treatment with BODIPY 493/503. Images were captured using an LSM980 confocal microscope at 400X magnification. Green fluorescence intensity was quantified using Image J software.
2.12. Calcium Analysis
For mitochondrial or cytosolic calcium analysis, HepG2 cells were grown in 8-well chamber slides. Cells were co-treated with 0.5 mM PA and drugs for 24 hours and then trated with either Rhod-2/AM (Invitrogen, R1244), Mag-Fluo-4/AM (Invitrogen, M14206) or Fluo-4/AM (Invitrogen, F14201) for 30 minutes. Cells were washed with Ca2+-free KRH buffer and live imaged using an LSM980 confocal microscope at 400X magnification. Fluorescence signal intensity was quantified using Image J software.
2.13. Mitochondrial ROS Measurement
Mitochondria ROS levels were assessed using red fluorescent mitochondrial superoxide indicator MitoSOX (Invitrogen, M36008). Cells were treated with drugs for 4 hours, followed by incubation with 5 μM MitoSOX and Hoechst33342 for 10 minutes. The cells were then washed with PBS and live imaged using an LSM980 confocal microscope at 400 x magnification. The intensity of the red fluorescence was quantified using Image J software.
2.14. Transfection
Cells were transfected with the 100 nM SERCA siRNA (Bioneer, Daejeon, South Korea) for 24 hours using Lipofectamine RNAiMAX reagent, according to the manufacturer’s instructions. A SERCA (FLAG-DYK-tagged) human ORF clone was used to generate the mutant SERCA vector. Cells were transfected with the SERCA plasmid using Lipofectamine 3000 reagent (Invitrogen) according to the manufacturer’s instructions. To measure ER calcium, cells were transfected with CMV-ER-LAR-GECO1 (Addgene, #61244) for 48 hours using Lipofectamine 3000 reagent and the images were captured using an LCM980 confocal microscope.
2.15. Statistical Analysis
Statistical analysis was performed using GraphPad Prism 9.0. All results are presented as the mean ± standard deviation (SD) values. Statistical significance was determined using Student’s t-tests (*p < 0.05, * *p < 0.01, * **p < 0.001, * ** *p < 0.0001).
4. Discussion
Urolithin A (UA) is a natural compound metabolized by gut microbiota from ellagi tannin and ellagic acid [
10]. UA prevents the accumulation of damaged mitochondria by inducing mitophagy, enhances fatty acid oxidation and glycogen synthesis by activating the AMPK signaling pathway, and inhibits inflammatory responses by suppressing the NF-κB pathway [
6,
9,
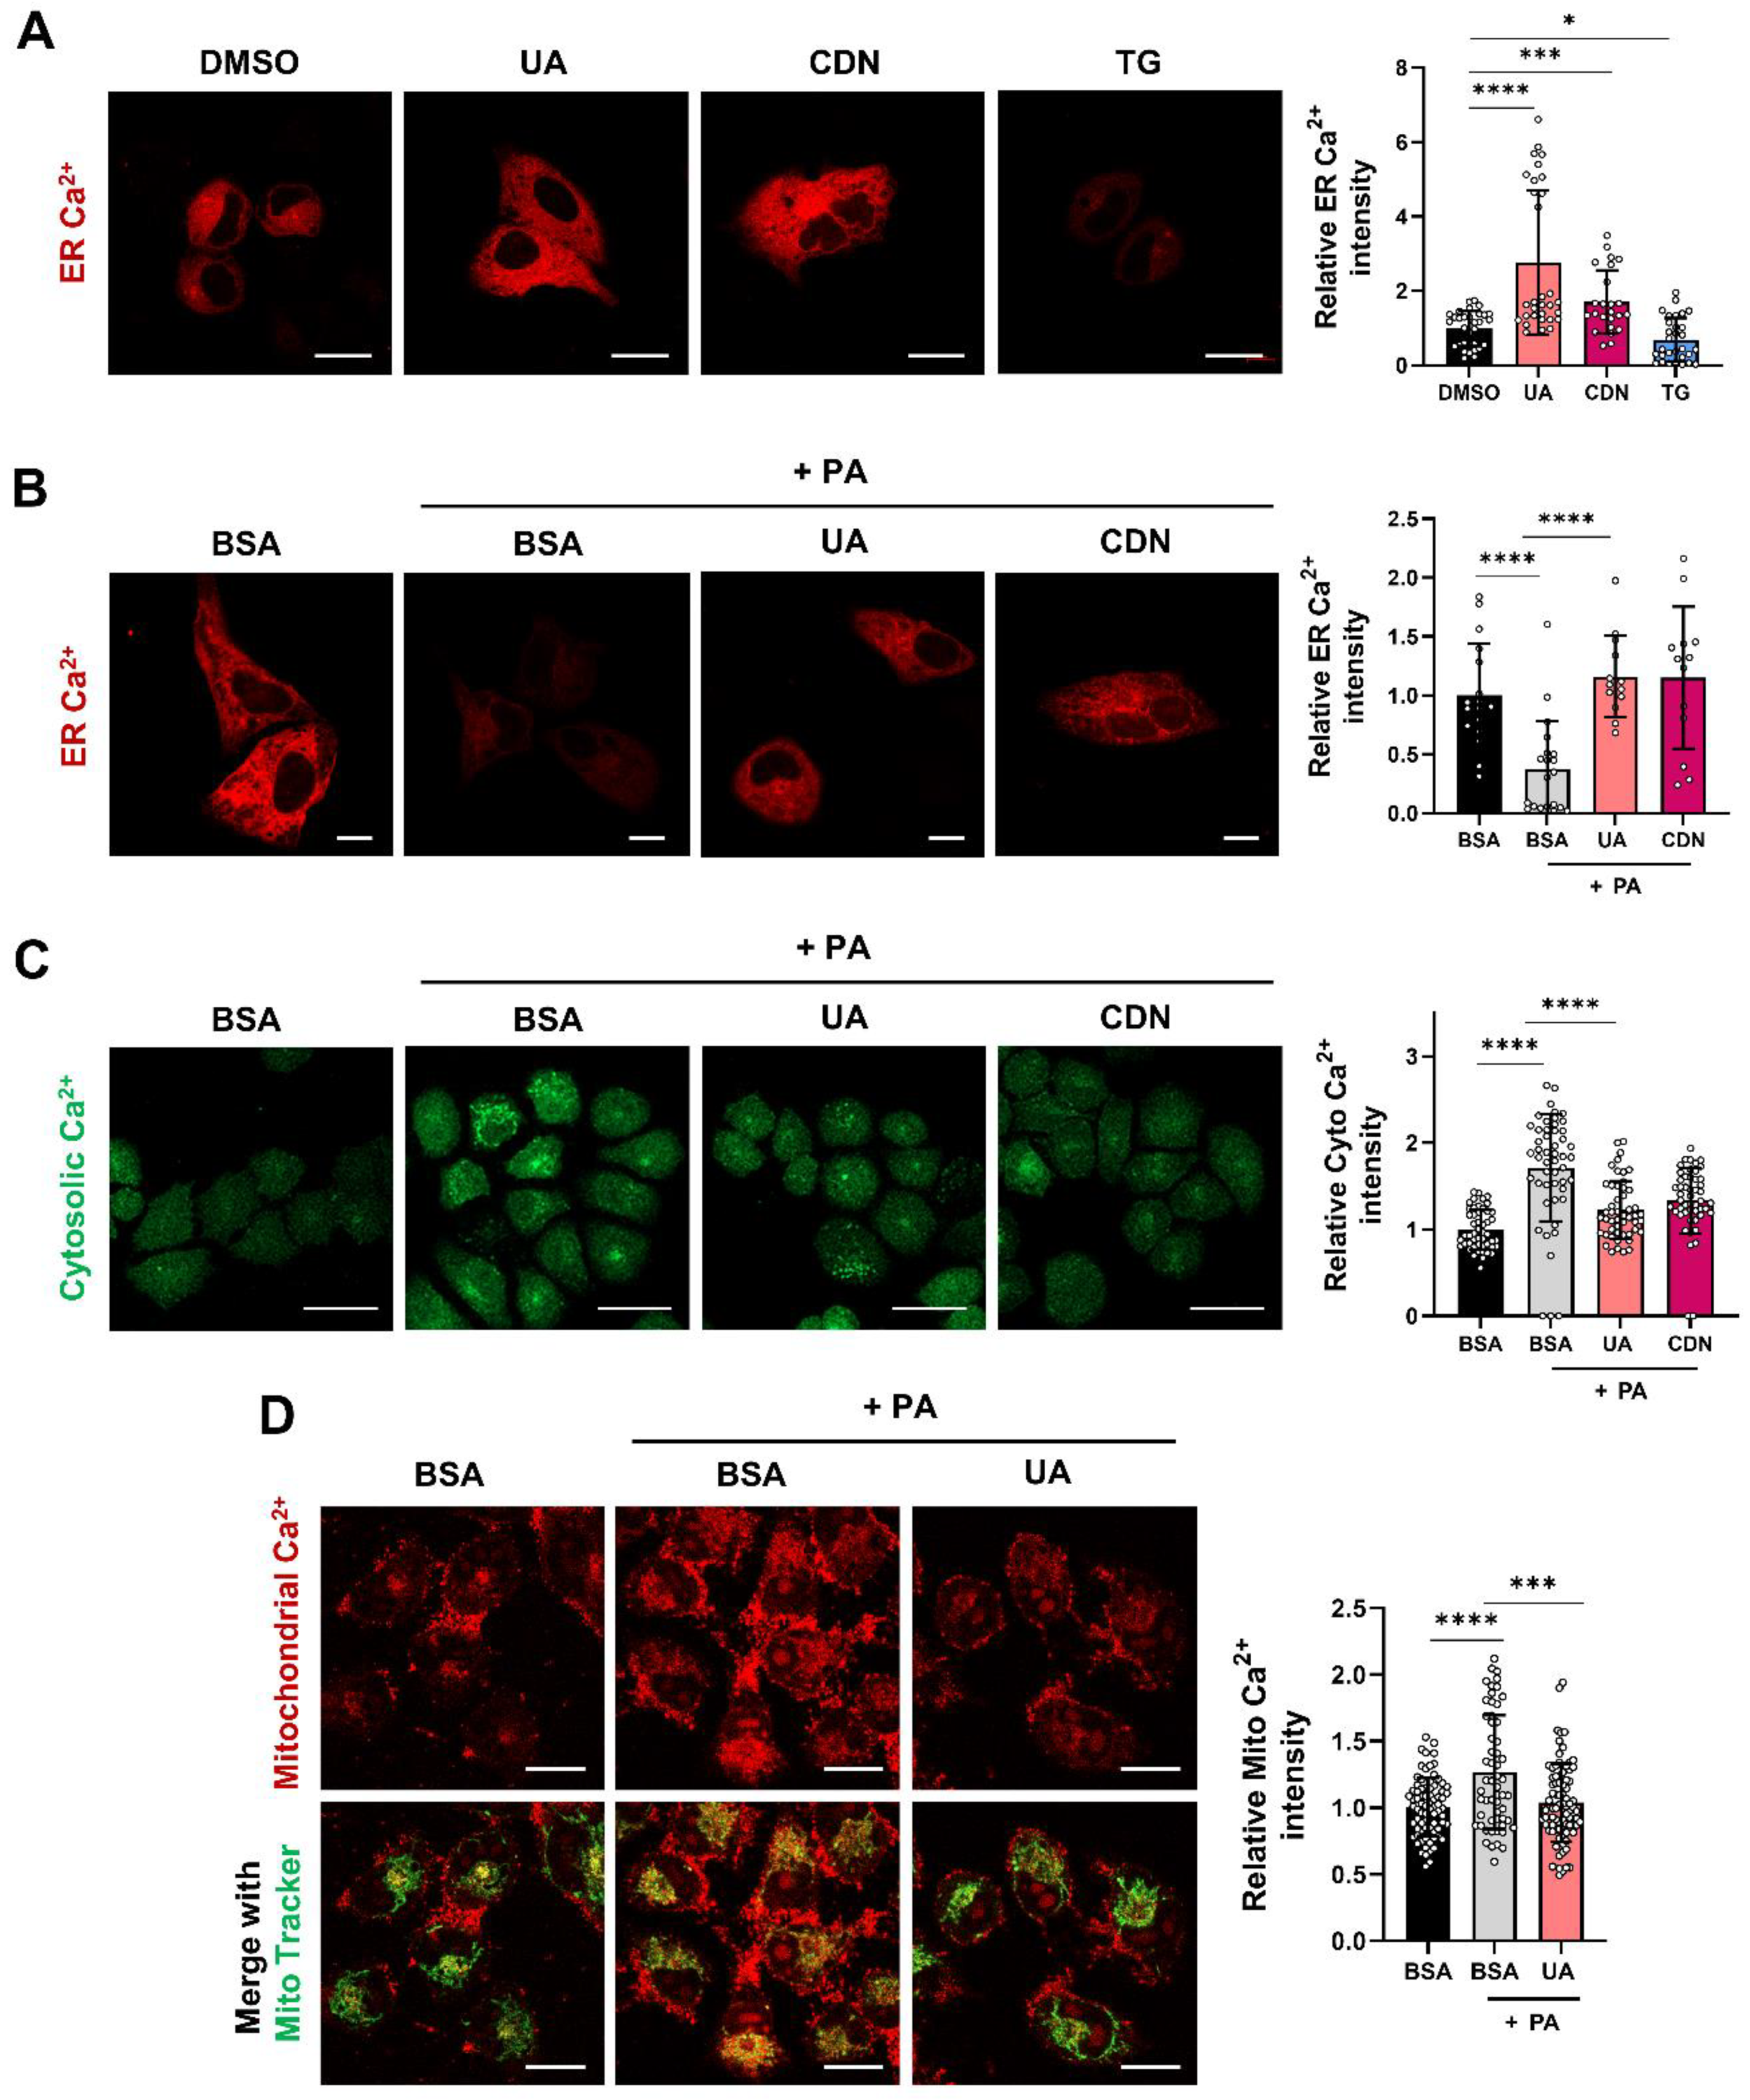
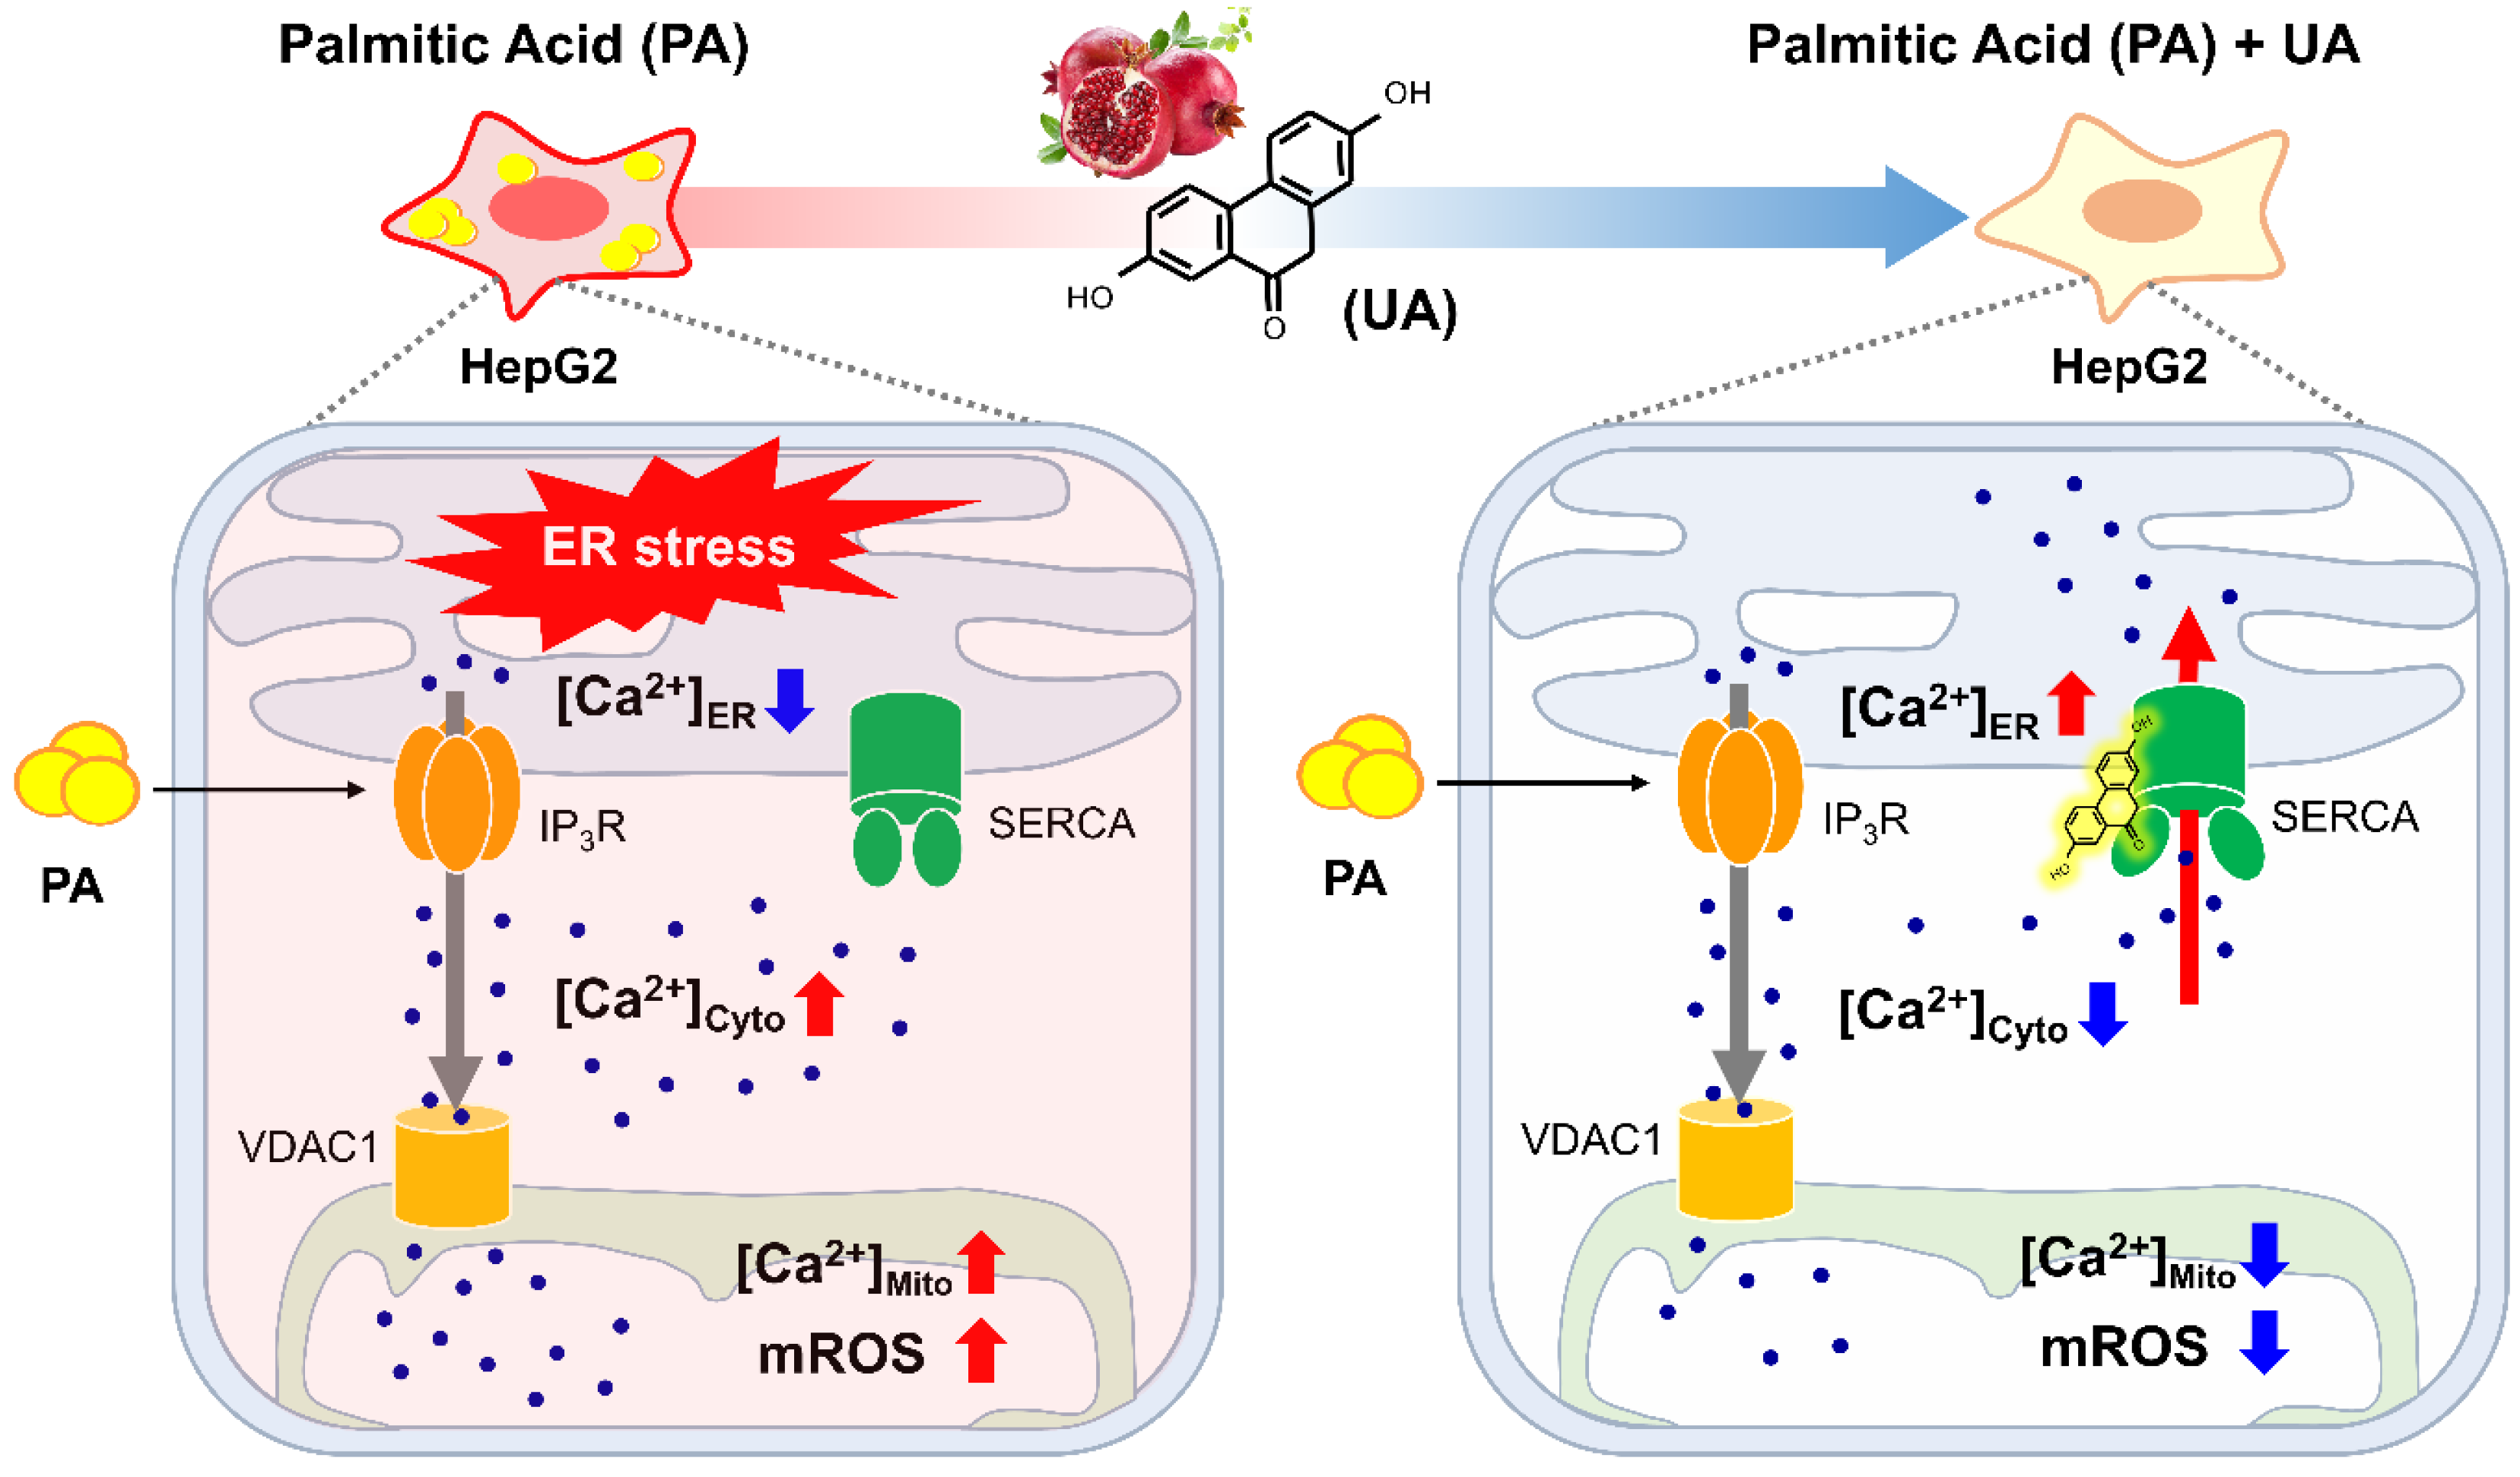
32]. Despite the diverse activities of UA, research on its target proteins are still poorly understood. Using CETSA-LC-MS/MS, a method for identifying target proteins using chemically unmodified compounds, SERCA was identified as a potential target of UA. Palmitic acid (PA) treatment causes lipid accumulation and inflammation in the liver, similar to non-alcoholic fatty liver disease. Intracellular calcium homeostasis was disrupted in PA-treated liver cells and regulation of SERCA by UA restored calcium levels in the ER, cytoplasm, and mitochondria to their original state. Recently, gene therapy aimed at increasing SERCA expression has been investigated for the treatment of heart failure [
33]. This supports the importance of SERCA as a target in diseases where ER calcium regulation is impaired.
SERCA undergoes structural transitions between four major states (E1, E1∙Ca²⁺, E2∙Ca²⁺, and E2), that facilitate ATP hydrolysis and calcium ion transport [
25]. Thapsigargin (TG), a non-competitive inhibitor of SERCA, binds to the E2 state, inhibiting ATPase activity and preventing calcium ion transport into the ER [
34]. Crystal structures have shown that TG binds to SERCA at a pocket formed by the TM helices, with F256 identified as a key residue involved in this binding [
35]. Our
in silico docking analysis suggests that UA binds to the A (actuator) domain of SERCA, providing a new small molecule tool with a binding site distinct from TG. However, our current studies have not yet confirmed whether UA induces structural changes in SERCA. Investigation of potential structural changes caused by UA binding remains for future research.
Recently, mitochondria-associated ER membranes (MAMs) have been shown to play an important role in maintaining cellular calcium homeostasis and regulating metabolic processes [
36]. Lee
et al. revealed a mechanism by which UA disrupts the contact between the ER and mitochondria by suppressing the expression of the TGM2 protein in the MAM, thereby inhibiting calcium influx into the mitochondria and subsequently reducing mROS levels [
37]. In line with this, we investigated the interactions between the ER and mitochondria in our HepG2 metabolic disorder model. The PLA assay between IP
3R and VDAC1 showed that these two organelles are closer together in PA-treated cells and that this interaction is reduced upon UA treatment (Supplementary
Figure 3). UA's ability to regulate organelle interactions helps reduce oxidative stress by preventing excessive calcium influx into mitochondria, making it a promising option for treating metabolic disorders. However, further research is needed to elucidate the detailed mechanisms by which UA regulates ER-mitochondria interaction and maintains cellular homeostasis.
Consistent with previous study that UA reduces lipid accumulation [
38], we observed that UA reduced lipid droplets increased by PA. Future research should investigate how the reduction of ER stress by UA is related to lipid levels, whether UA inhibits lipid uptake, and whether it can promote the degradation of lipid droplets via autophagy. This will help us better understand the mechanisms of UA regulation of cellular homeostasis and provide insight into the treatment of related diseases.
While further research is needed to fully understand the mechanism of UA, our study is significant because it provides the first evidence that UA acts as an activator of SERCA. This finding highlights the potential role of UA in protecting against ER stress-induced metabolic disfunction.
Figure 1.
UA protects hepatocytes from palmitic acid (PA)-induced cellular stress. (A) The MTT assay was performed on HepG2 cells treated with various concentrations of UA (1-100 μM) for 24, 48, and 72 hours to evaluate cell proliferation. (B) The MTT assay was used to measure the cell proliferation of HepG2 cells treated with PA (0.5 mM) and UA (20, 40 μM) for 24 hours. (C) The Trypan blue exclusion assay was performed to evaluate the cell viability of HepG2 cells treated with PA (0.5 mM) and UA (20, 40 μM) for 24 hours. (D) mCherry-CHOP stable HEK293 cells were treated with PA (0.5 mM) and UA (20, 40 μM) for 24 hours, and mCherry fluorescence signals were measured. The expression of CHOP was visualized as a fluorescence signal and observed using confocal microscopy (scale bar: 10 μM). (E) HepG2 cells were treated with PA (0.5 mM) and UA (20, 40 μM) for 24 hours, followed by staining of intracellular lipid droplets with BODIPY and observation via confocal microscopy (scale bar: 20 μM). (*p < 0.05, * *p < 0.01, * **p < 0.001, * ** *p < 0.0001).
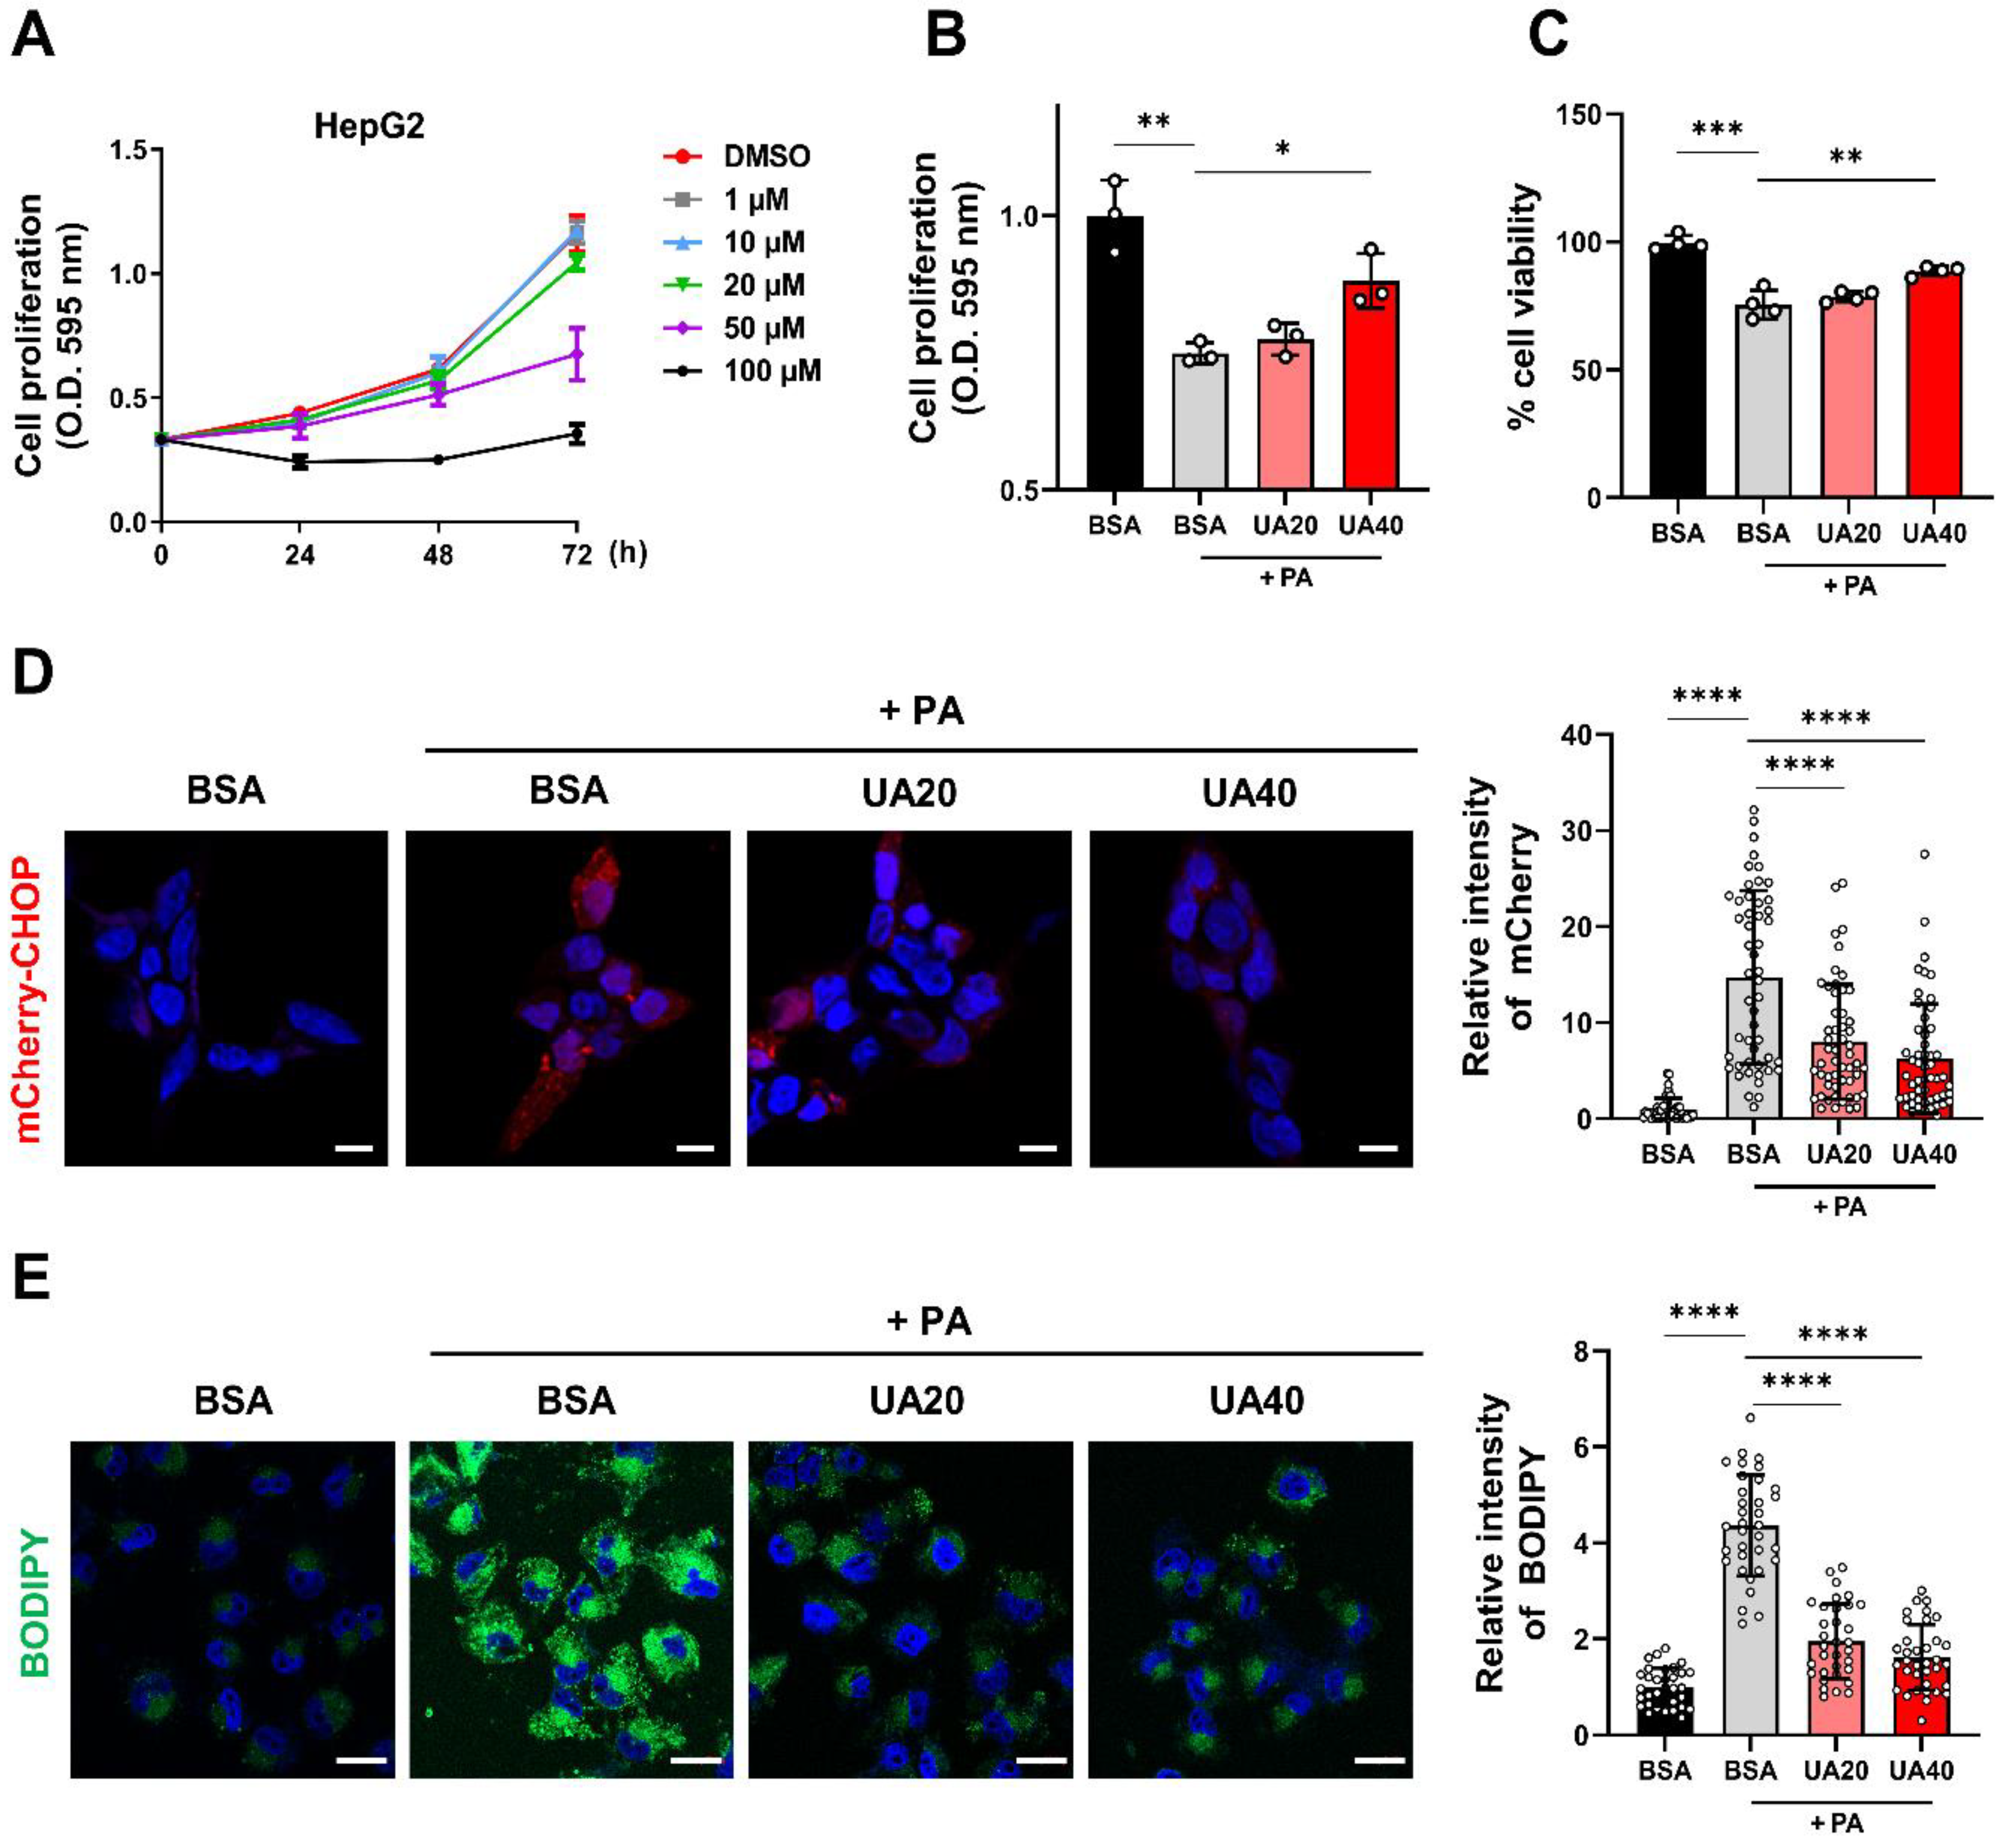
Figure 2.
CETSA-LC-MS/MS for the identification of target protein of UA. (A) Overview of the CETSA-LC-MS/MS method. HEK293 cells were treated with DMSO (control) or UA (20 μM) and subjected to thermal treatment (55°C or 60°C). Proteins were then extracted, digested with trypsin, and labeled with TMT reagents. The labeled peptides were analyzed by HPLC and LC-MS/MS. (B) Schematic diagram of the target selection identification criteria of the UA process. (C) Heatmap of target candidates of UA localized in the ER and mitochondria. Proteins are clustred by their functions, as indicated on the left side of the heatmap.
Figure 3.
Validation of UA binding to SERCA. (A) Western blot analysis to evaluate the thermal stability of SERCA in HepG2 cells treated with UA (40 μM) (B) Comparison of the binding affinity between UA and two calcium regulating target proteins; SERCA and CCDC47. HepG2 cells were treated with various concentrations of UA (1-100 μM), followed by isothermal CETSA at 52°C. (C) 2D diagram represents amino acids involved in UA binding to SERCA. (D) Predicted binding of UA to the actuator domain of SERCA, as visualized using Discovery Studio software (-CDOCKER Energy: -20.57 kcal/mol). (E) 3D structure of the full-length SERCA protein (PDB: 7E7S), highlighting its four domains. (F) HEK293 cells were transfected with FLAG-SERCA(WT), FLAG-SERCA(R198A), or FLAG-SERCA(K234A) for 48 hours and then treated with UA (40 μM). After heat treatment at 52°C for 3 minutes, proteins were extracted and analyzed by Western blot. (G) Measurement of ATPase activity of ER proteins extracted from LX2 cells. UA (20, 40 μM) and thapsigargin (0.1 μM) were each treated for 30 minutes before ATPase activity was assessed.
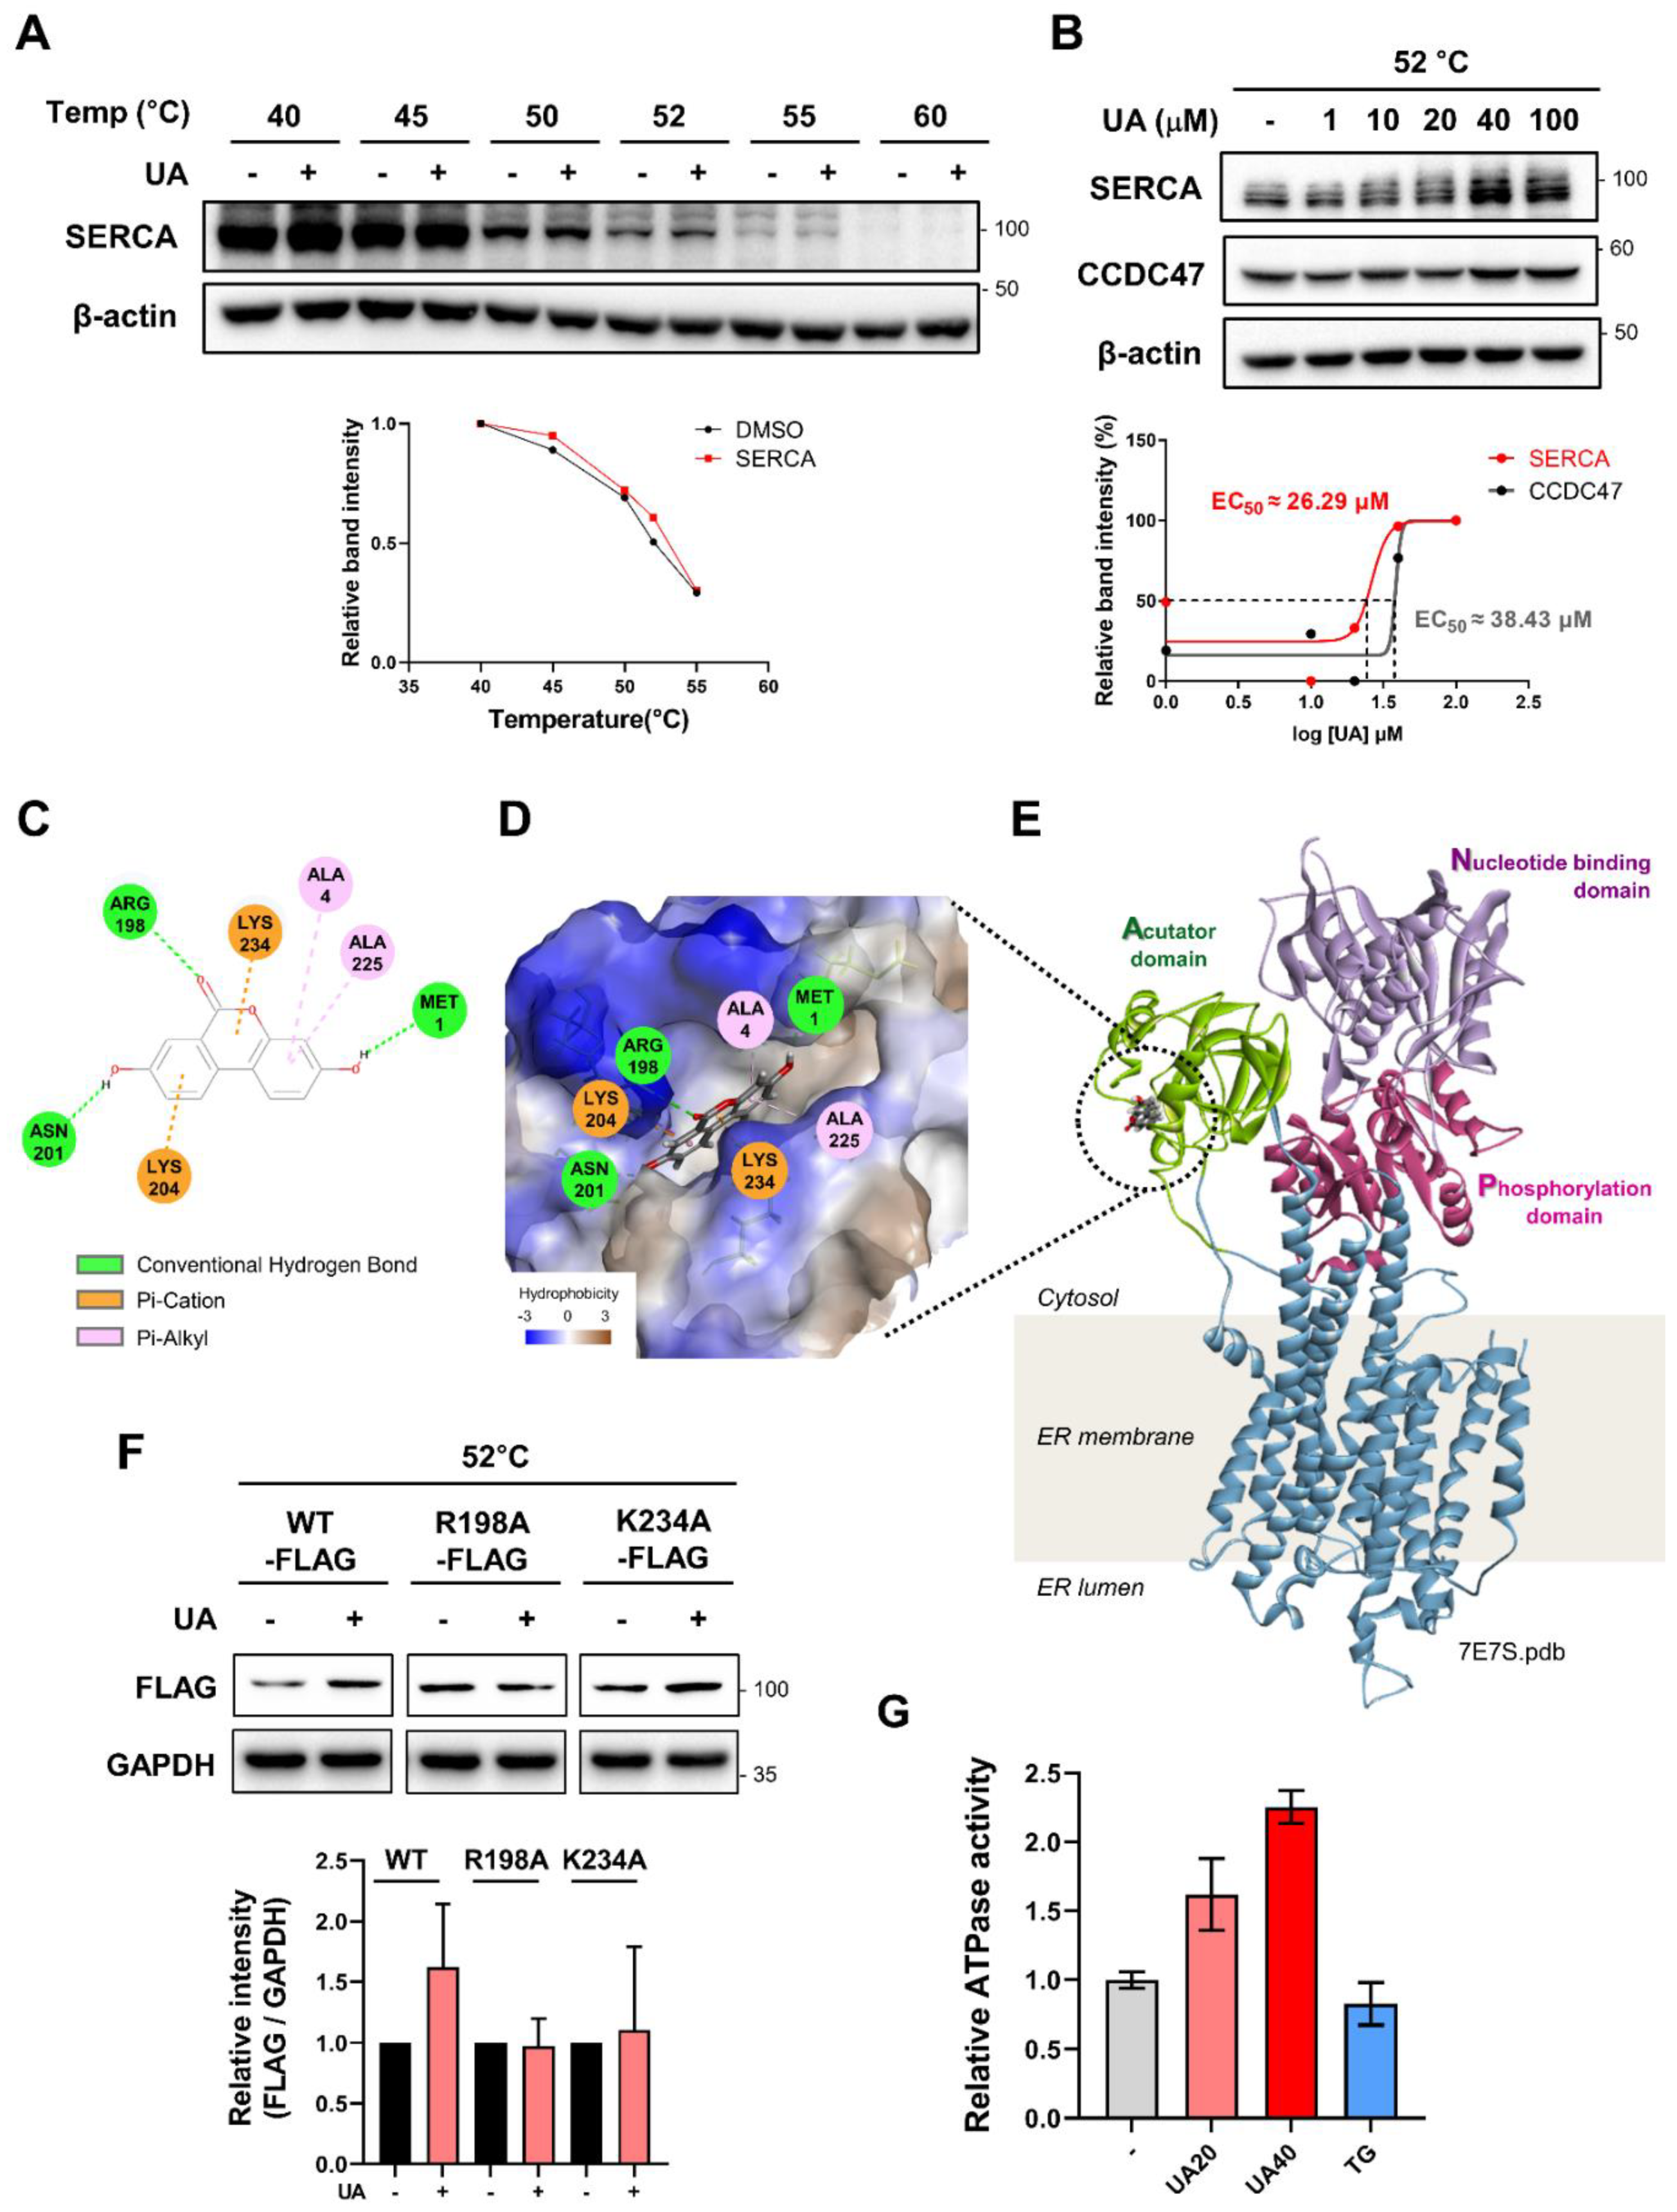
Figure 4.
UA prevents PA-induced disruption of intracellular calcium homeostasis. (A) HepG2 cells were transfected with the ER calcium indicator ER-LAR-GECO vector for 48h, followed by treatment with UA (40 μM), CDN1163 (10 μM), or TG (0.1 μM) for 6 h (scale bar: 20 μm). (B) ER calcium levels were measured in HepG2 cells treated with PA (500 μM) for 6 h, either alone or co-treated with UA (40 μM) and CDN1163 (10 μM) (scale bar: 10 μm). (C) Cytosolic calcium levels were assessed using the Fluo-4-AM after 6 hours of treatment with PA, either alone or co-treated with UA (40 μM), and CDN1163 (10 μM) (scale bar: 20 μm). (D) Mitochondrial calcium levels were determined using the Rhod-2-AM after 24 hours of treatment with PA, either alone or co-treated with UA (40 μM), and CDN1163 (10 μM) (scale bar: 20 μm). (*p < 0.05, * *p < 0.01, * **p < 0.001, * ** *p < 0.0001).
Figure 5.
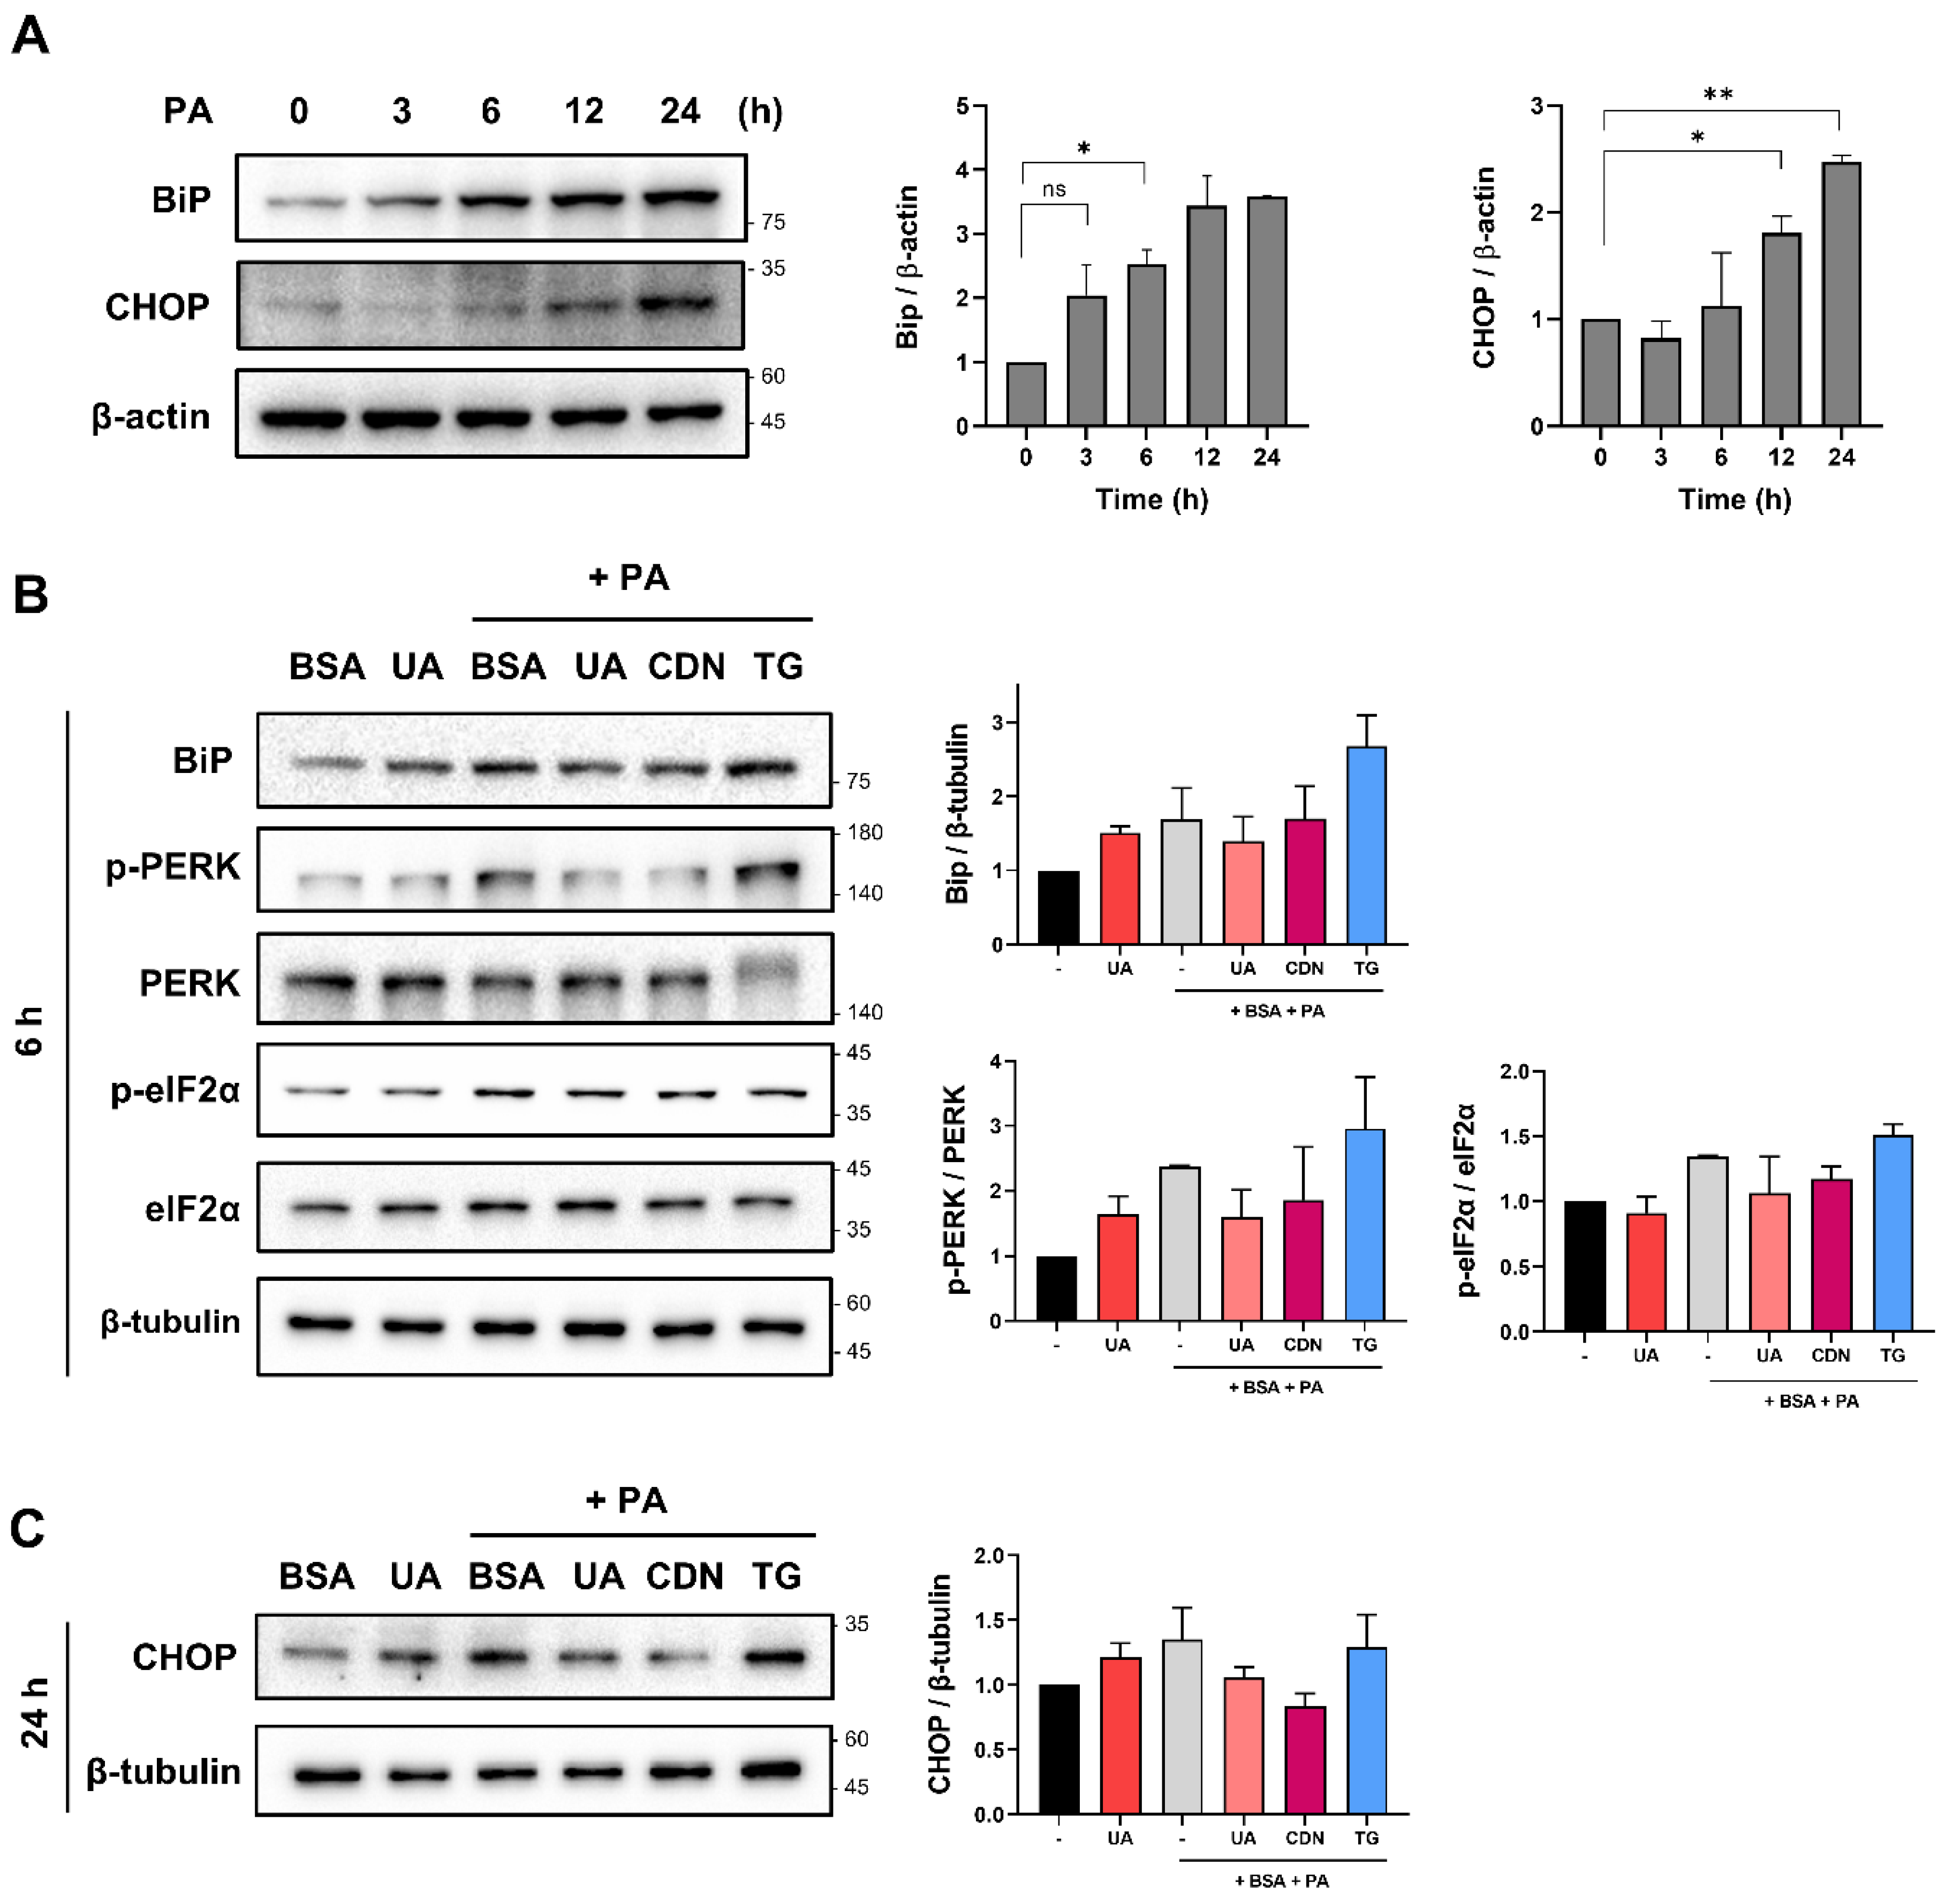
UA mitigates PA-induced ER Stress. (A) Western blot results showing changes in ER stress markers in HepG2 cells treated with PA. (B) HepG2 cells were treated with PA for 6 h in the absence or presence of UA (40μM), CDN1163 (10 μM) and Thapsigargin (0.1 μM). UA down-regulated the level of ER stress-related proteins. (C) HepG2 cells were treated with PA for 24 h in the absence or presence of UA (40μM), CDN1163 (10 μM) and Thapsigargin (0.1 μM). UA down-regulated the level of CHOP. (*p < 0.05, * *p < 0.01, * **p < 0.001, * ** *p < 0.0001).
Figure 6.
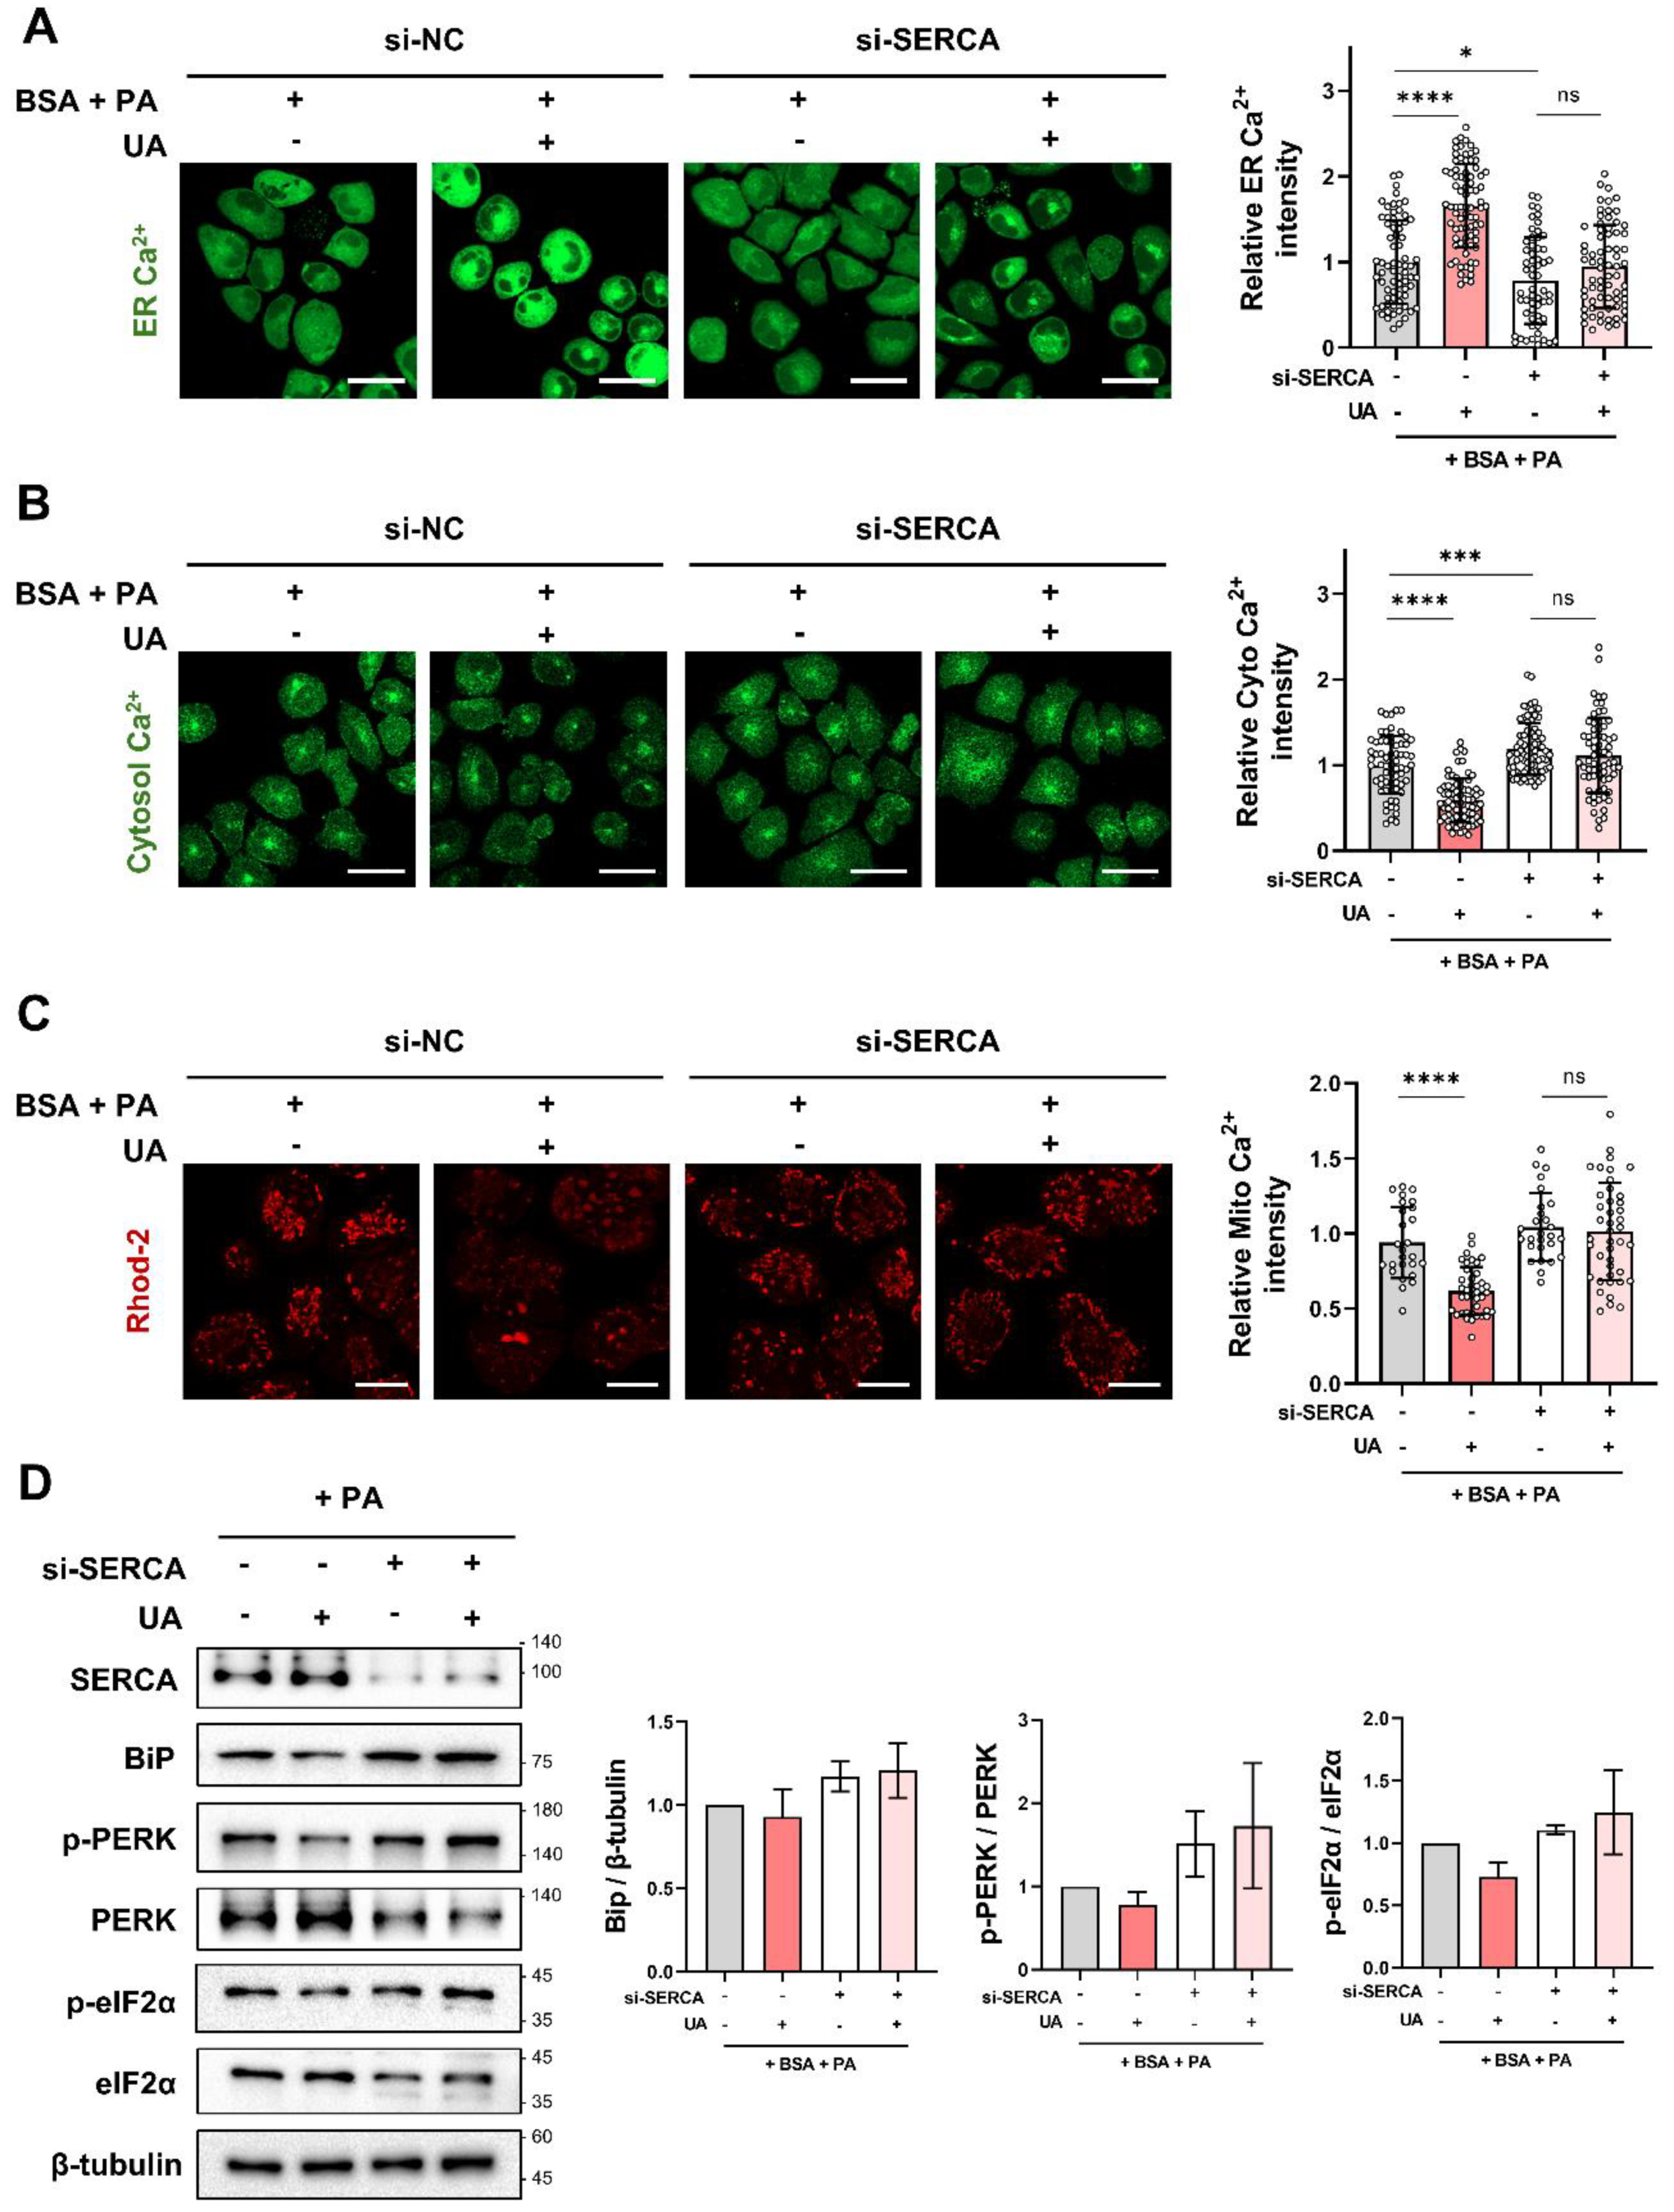
The activity of UA is suppressed in cells where SERCA is knocked down. (A-C) Following SERCA knockdown with si-SERCA for 24 hours, cells were co-treated with PA and UA (40 μM) for 6 hours. ER, cytosolic, and mitochondrial calcium levels were then measured using Mag-Fluo-4 AM, Fluo-4 AM, and Rhod-2 AM, respectively (scale bar: 40 μm). (D) SERCA knockdown using si-SERCA for 24 hours confirmed the effect of UA (40 μM) on PA-induced ER stress protein levels, as shown by Western blot. (*p < 0.05, * *p < 0.01, * **p < 0.001, * ** *p < 0.0001).
Figure 7.
Schematic summary of the target proteins and mechanisms of action of UA. HepG2 cells stimulated with PA release ER calcium through IP3R, leading to ER stress. UA binds to SERCA, the ER calcium pump, replenishing ER calcium levels and maintaining calcium homeostasis. This mechanism helps protect the cells from stress-induced damage.


