Preprint
Article

Effect of culture supernatant of Clostridium butyricum TO-A on human DNA repair factor-encoding gene promoters

Submitted:

05 October 2024

Posted:

07 October 2024

You are already at the latest version

A peer-reviewed article of this preprint also exists.

Abstract
In this study, Clostridium butyricum TO-A culture supernatant (CBCS) or butyric acid was added to a culture medium of human cervical carcinoma HeLa S3 cells, and changes in DNA repair-related gene promoter activi-ties were investigated. HeLa S3 cells were transfected with a luciferase (Luc) expression vector containing ap-proximately 500-bp of the 5′-upstream region of several human DNA repair-related genes and cultured with a medium containing CBCS (10%) or butyric acid (2.5 mM). Cells were harvested after 19 to 42 h of incubation. Luc assay revealed that the human ATM, PARG, PARP1, and RB1 gene promoter activities were significantly increased. Western blot analysis showed that amounts of the proteins encoded by those genes markedly in-creased. Furthermore, 8, 24, and 48 h after the addition of the CBCS (10%), total RNA was extracted and subjected to RNAseq analysis. The result showed that the expression of several DNA replication/repair-related genes, including NFKB, and the MCM gene groups, decreased markedly after 8 h. However, the expression of the histone genes increased after 24 h. Elucidation of the mechanism by which CBCS and butyrate affect DNA-repair associated protein-encoding gene expression may contribute to the prevention of carcinogenesis, of which the risk rises in accordance with aging.
Keywords: 
Subject: 
Medicine and Pharmacology  -   Pharmacology and Toxicology

1. Introduction

It has been suggested that defects in DNA repair control, which is thought to be associated with cellular senescence, affect the carcinogenic mechanism [1]. We established an experimental system to evaluate the promoter activities of the 5′-upstream regions containing transcription start sites (TSSs) of well-known human genes, of which encoding proteins are involved in cell growth suppression and DNA repair functions [2,3]. We have reported that the natural compound trans-resveratrol (Rsv) markedly increased TP53 [4], HELB [5], and MCM4 [6] gene promoter activities in HeLa S3 cells. Finding beneficial natural compounds that are contained in food will contribute to a development of novel therapies to treat cancer with fewer side effects.
The gut microbiota not only play an important role in food digestion and nutrient metabolism, but also have beneficial effects on human health, including the immune [7] and nervous systems [8]. In this study, we first examined whether the culture supernatant of probiotic bacteria (Bacillus subtilis TO-A (BS), Enterococcus faecium T-110 (EF), and Clostridium butyricum TO-A (CB)) increase the promoter activities of genes encoding proteins that are involved in cell growth suppression and DNA repair systems. It is considered important for maintaining health that the three types of bacteria used all grow in a well-balanced manner in the human intestine [9]. For example, B. subtilis TO-A can extend the life span of C. elegans [10]. Certain strains of E. faecium were identified to have favorable effects on immunomodulatory properties [11]. The beneficial health effect of the C. butyricum has also been investigated [12]. In this study, it was revealed that C. butyricum TO-A culture supernatant (CBCS) increases several well-known DNA repair-related gene promoter activities in HeLa S3 cells the most. C. butyricum is contained in fermented foods and produces n-butyric acid, which is found in various foods, such as fermented butter. It has been suggested that the bacteria have beneficial effects for maintaining good health conditions. In addition, n-butyric acid has been known to suppress the growth and inflammation of cancer cells, inducing cell morphology changes [13], cell death, and apoptosis of a colon cell line [14]. Butyrate induces acetylation not only of histones but also of the GC-box-recognizing transcription factor Sp1, affecting specific gene expression [14]. In this study, we examined whether the addition of n-butyric acid (5 mM) to an HeLa S3 medium instead of the CBCS activates some of the DNA repair-related gene promoters.
Techniques for analyzing intracellular transcripts have already been developed, and in this study HeLa S3 cells were cultured in a medium containing CBCS (10%), and the RNAseq analysis was carried out. The results showed that accumulation of the transcripts does not always correlate with promoter activation. Expression of some of the DNA replication factor-encoding genes significantly decreased at 8 hours after CBCS treatment. Expression of some specific DNA-repair factor-encoding genes whose promoters have “duplicated GGAA sequences” [15], could be activated in response to CBCS- or butyrate-induced signals. The activation of the promoters might be required to overcome the decrease of the transcripts. Our results suggested that post-transcriptional regulation occurred on each gene expression, even when the promoter activity was induced by butyrate. Elucidation of the post-transcriptional regulation mechanism by CBCS or butyrate will enable clinical application to prevent aging-associated carcinogenesis.

2. Results

2.1. Screening of Probiotic Bacterial Culture Supernatant That Affects Promoter Activities of Human DNA Repair Factor-Encoding Genes

Recent studies have revealed that intestinal bacteria or metabolites affect various health conditions [7,8]. We had been studying chemically synthesized or natural compounds, including trans-resveratrol, that up-regulate human genes encoding DNA-repair and replication factors [3,4,5,6], and based on these observations we hypothesized that some metabolites of microorganisms beneficial to health might affect transcription of DNA-repair associated factor encoding genes. Previously, we had developed and established the Luc reporter assay that can evaluate promoter activities of multiple human genes, including DNA-repair and mitochondrial function-associated genes [2,3]. DNA-transfected cells were harvested between 19 and 42 h after the addition of a culture medium containing 10% of the BS, EF, CB or B. amyloliquefaciens TOA5001 (BA) culture supernatant (CS), and the cellular extracts were prepared for Luc assay (Figure 1A and supplementary Table S1). The results indicated that the CBCS has the most apparent effect on inducing promoter activities of several human DNA-repair factor encoding genes, including the ATM, PARG, PARP1, and RB1 genes. The other bacterial cultivated supernatants have no such effect on inducing promoter activities. Thereafter, we focused on analyzing the effect of the CBCS on the DNA-repair factor encoding gene promoters. The induction of the promoter activities by the 10% CBCS-containing medium was greater at 42 h than 19 h treatment of the cells (Figure 1B).

2.2. Morphological Changes and Survival of HeLa S3 CELLS after addition of Probiotic Bacterial Cultivated Supernatants

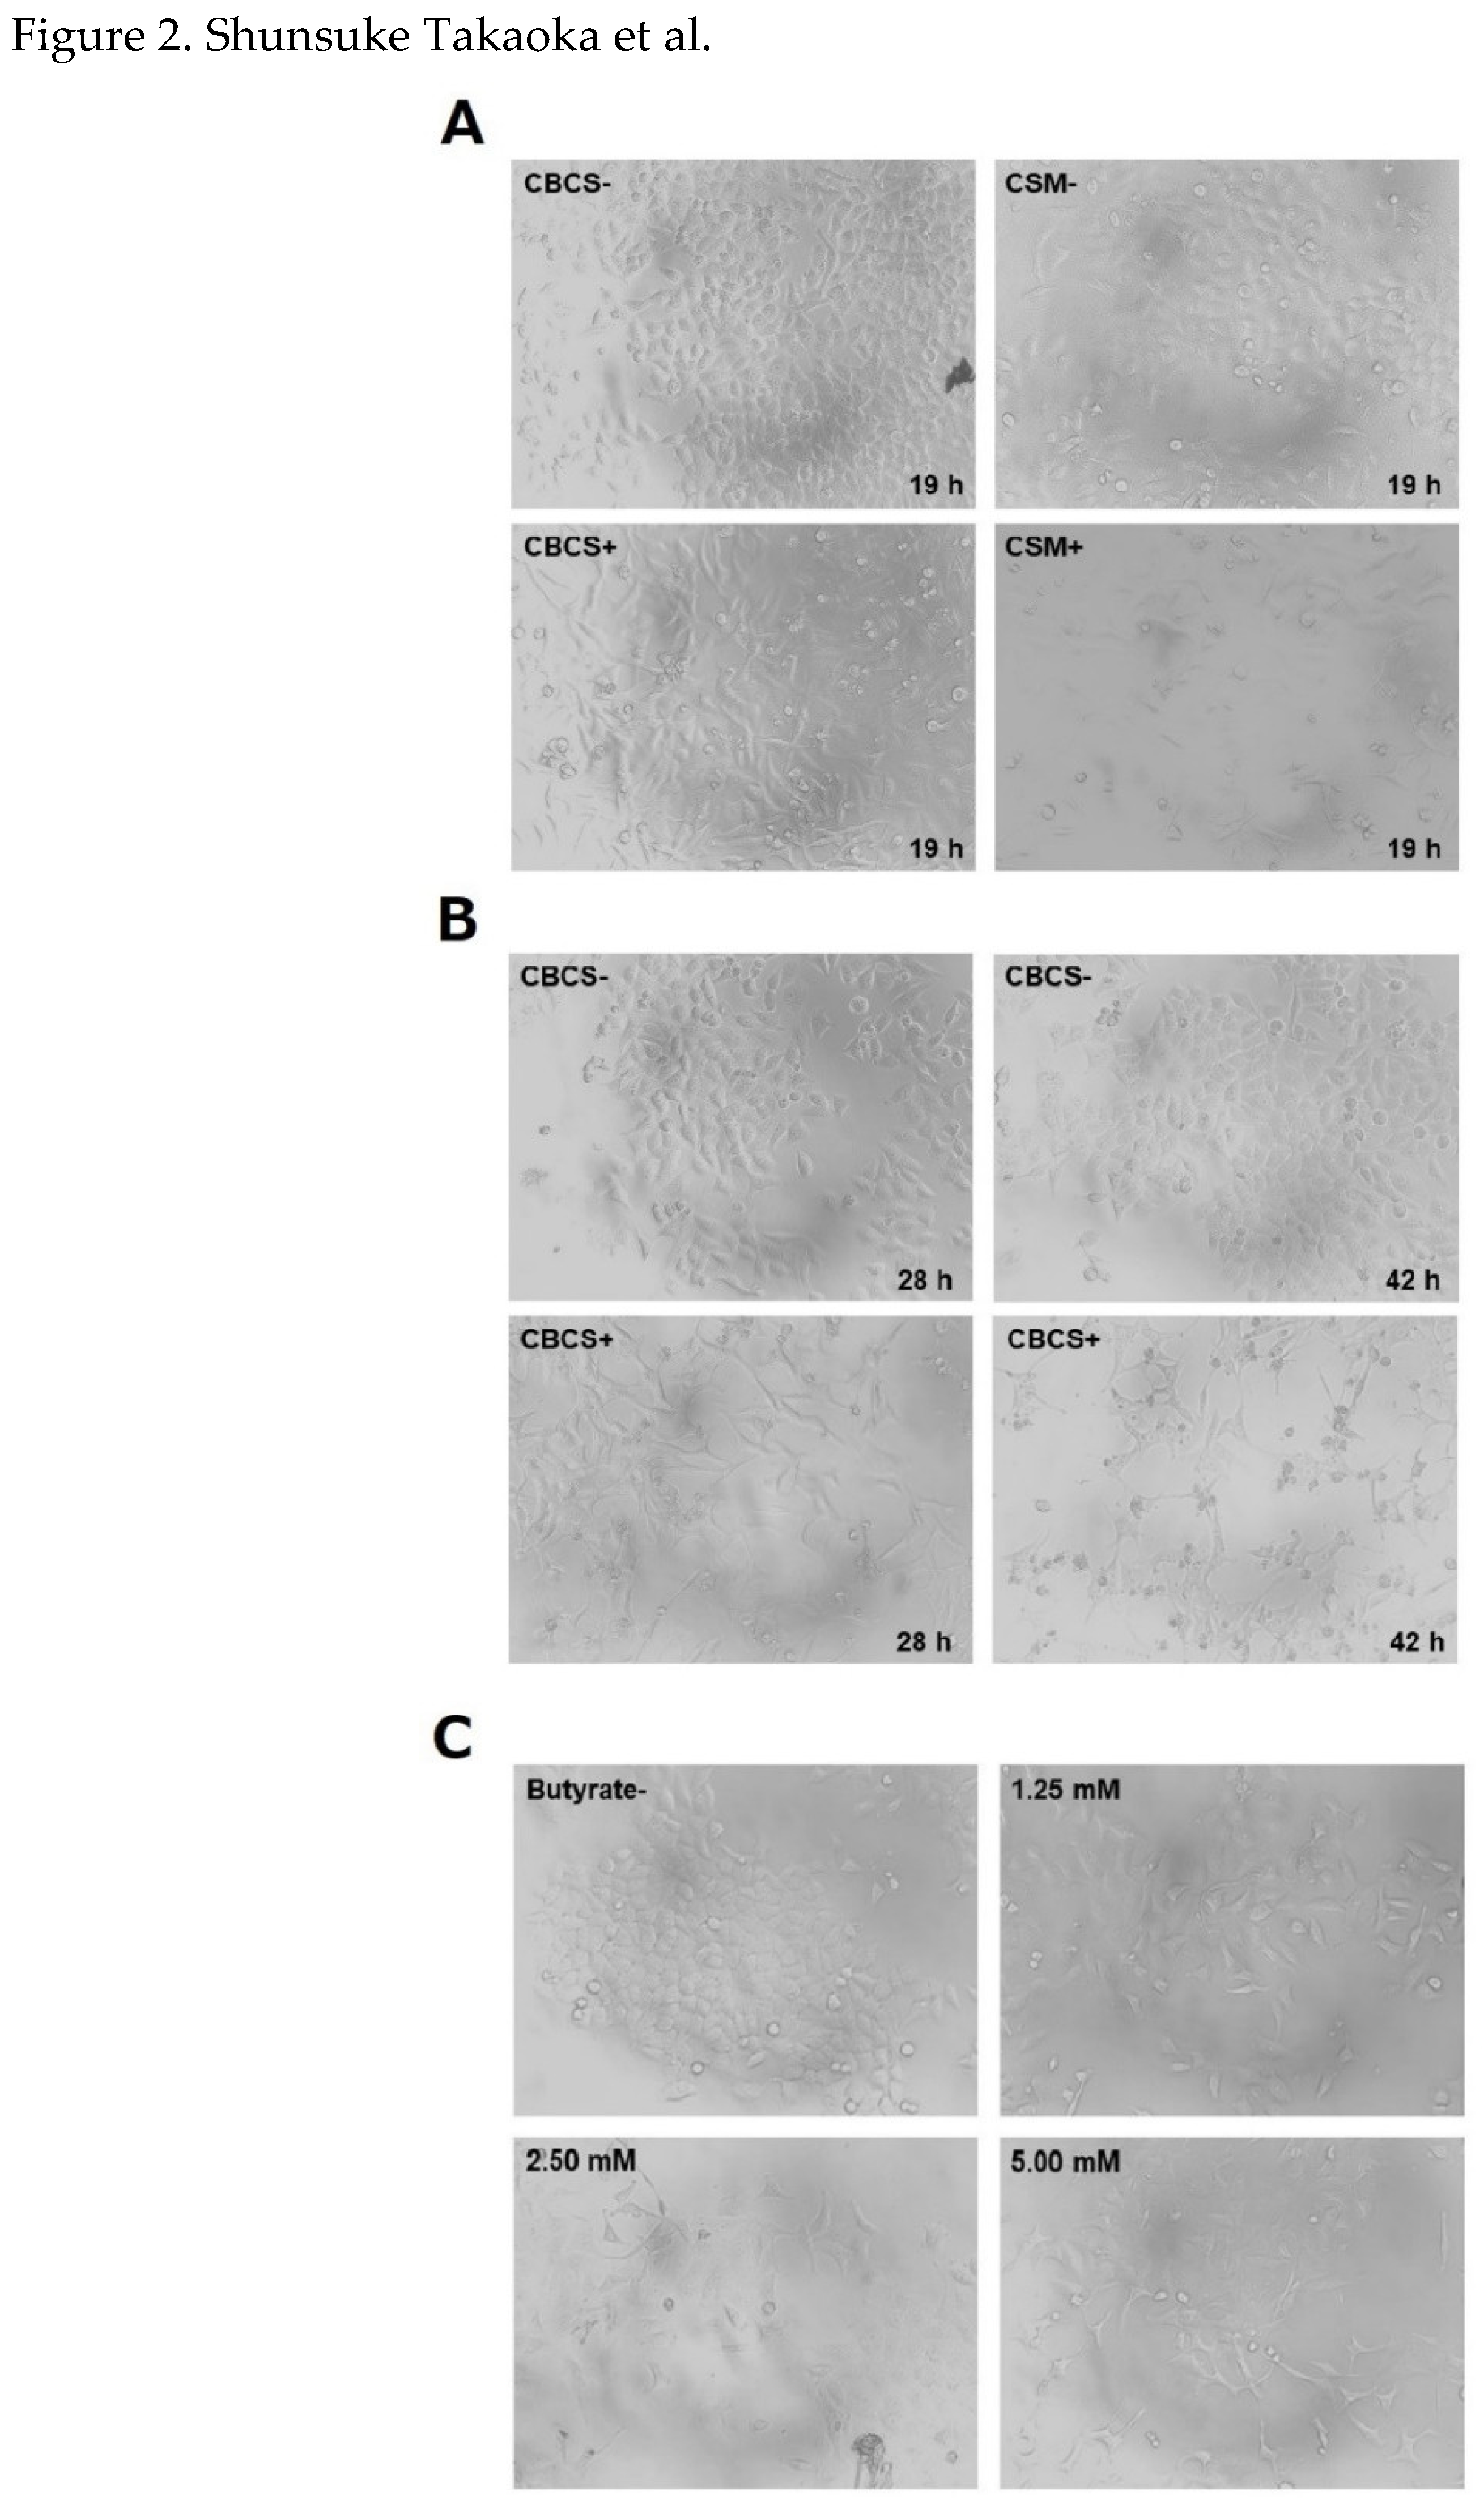
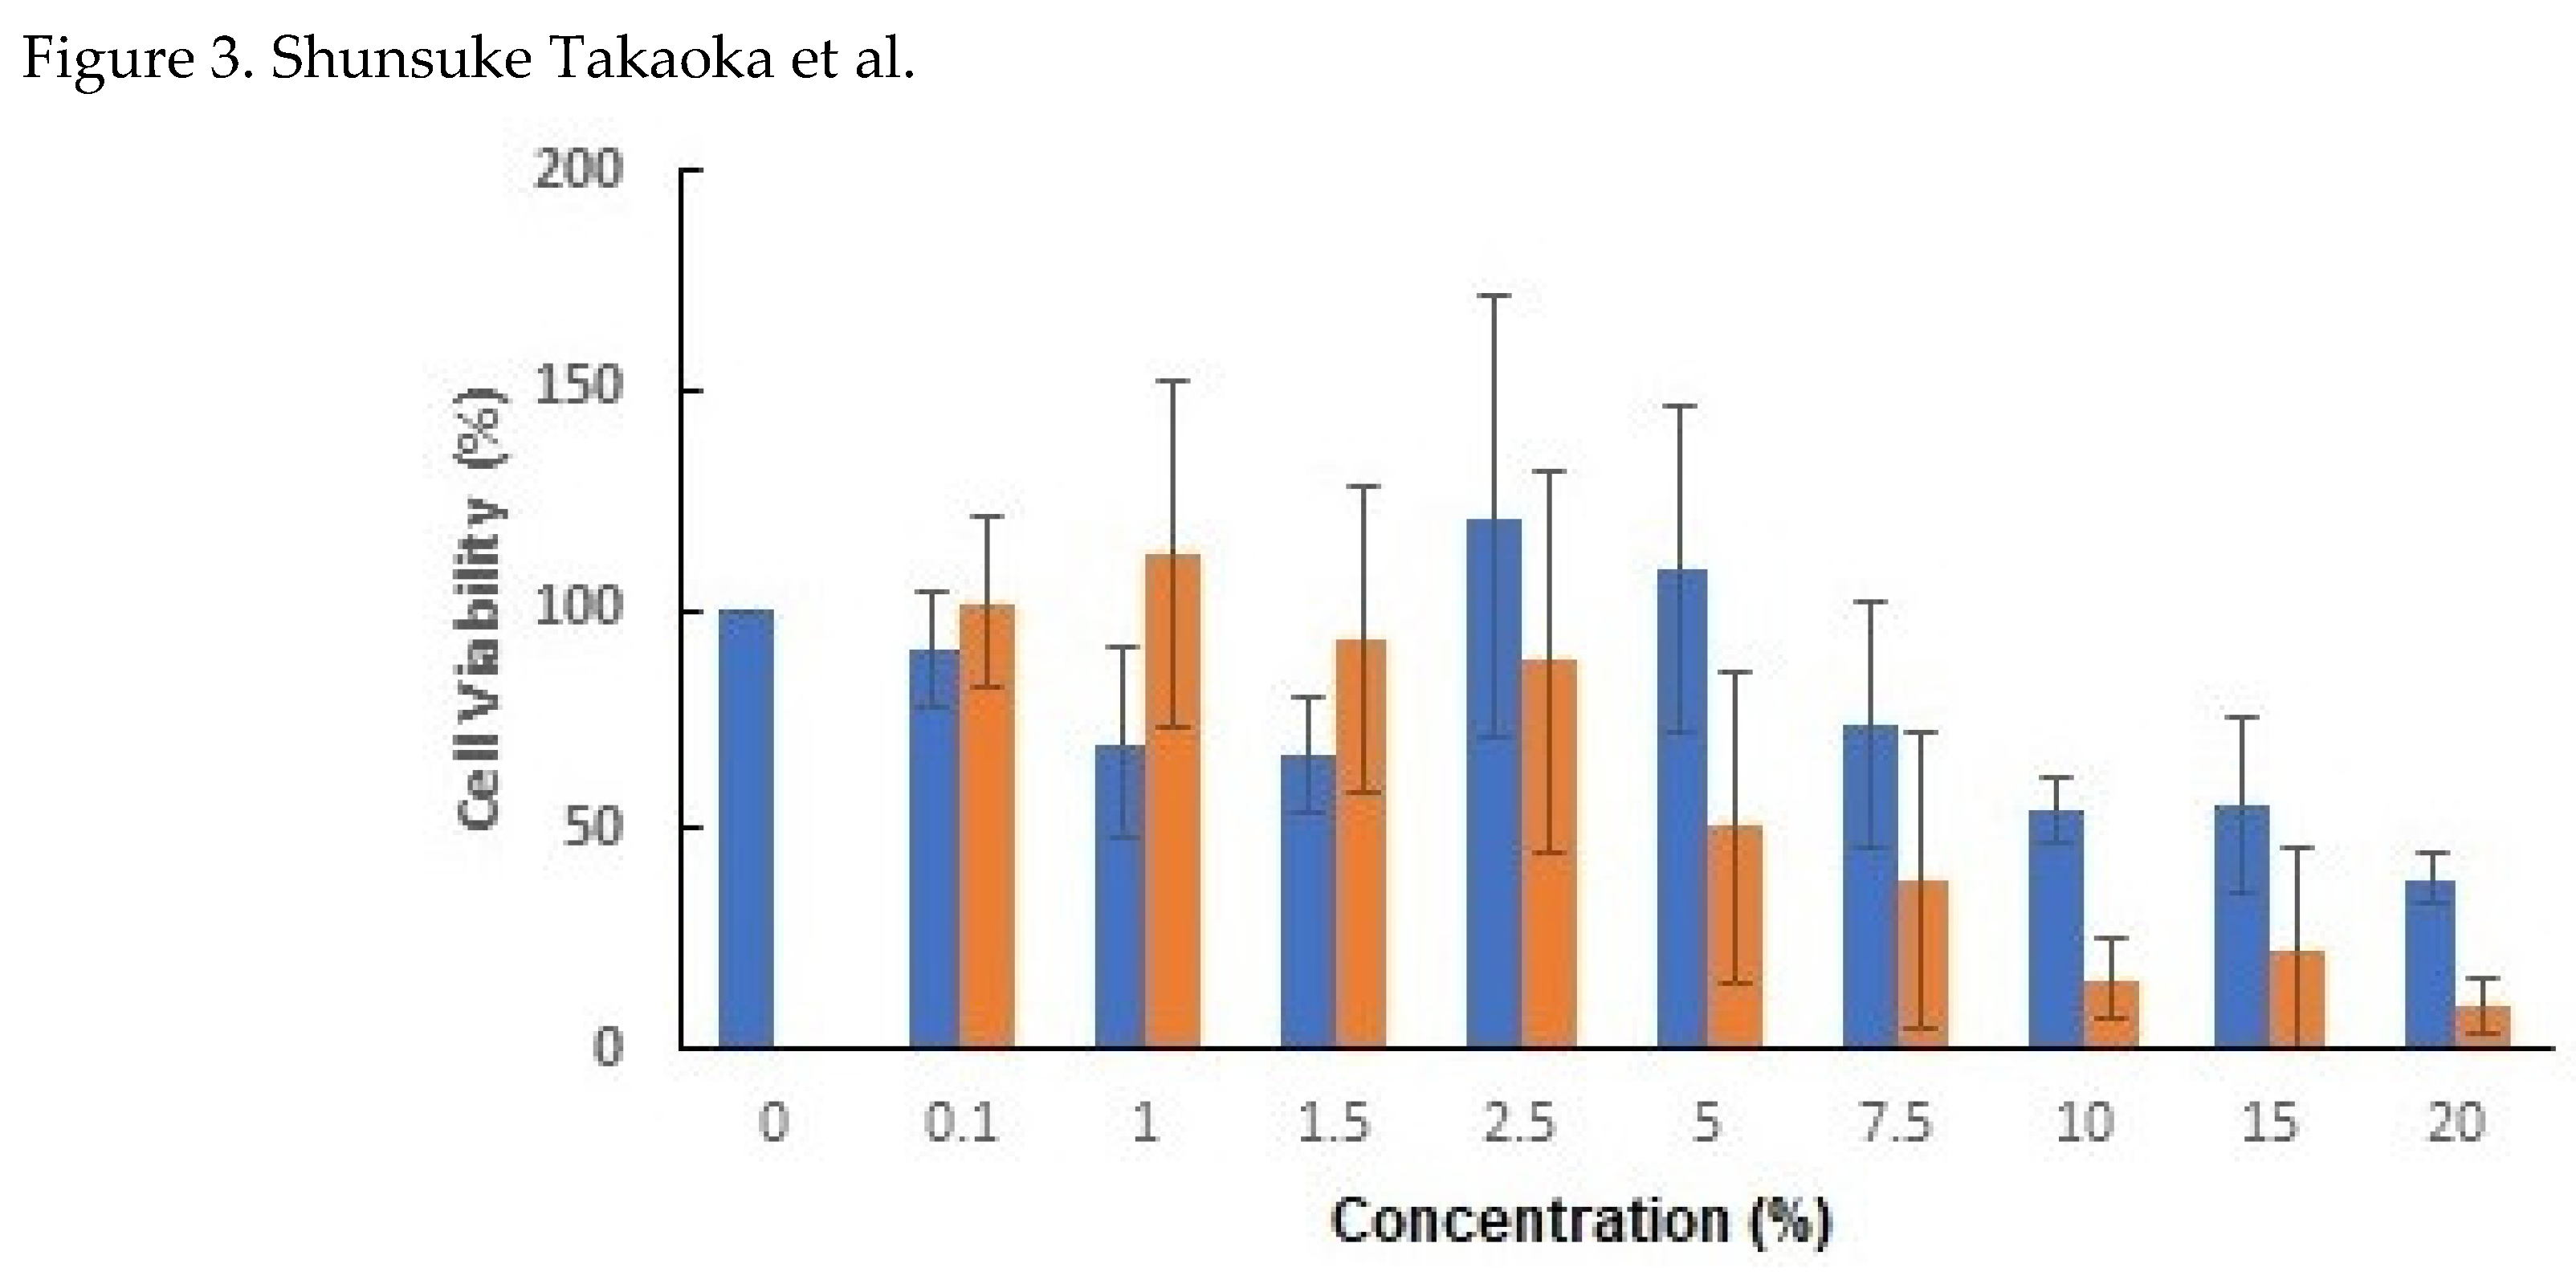
The morphological changes after addition of 10% CBCS or a CBCS/BSCS/EFCS mixture (CSM) was confirmed. After 19 h incubation, cell shapes had changed to be longer than control (Figure 2A). The changes in both shape and relative number of cells were apparent after further incubation with CBCS (Figure 2B). The relative cell number after 48 h cultivation with 10% CBCS was reduced to less than 20% of that with the control bacterial culture containing a medium (Figure 3). Growth of HeLa S3 cells was greatly reduced by cultivation with higher concentration of the bacterial culture medium. Thereafter, the concentration of the CBCS or the control bacterial culture medium was set as 10%. The morphological changes were also confirmed after n-butyric acid treatment (Figure 2C). The observations were consistent with the previous report showing that addition of the n-butyric acid to a culture medium caused morphological alteration of HeLa cells [13].

2.3. Responses of Human DNA-Repair Factor-Encoding Gene Promoters to n-Butyric Acid

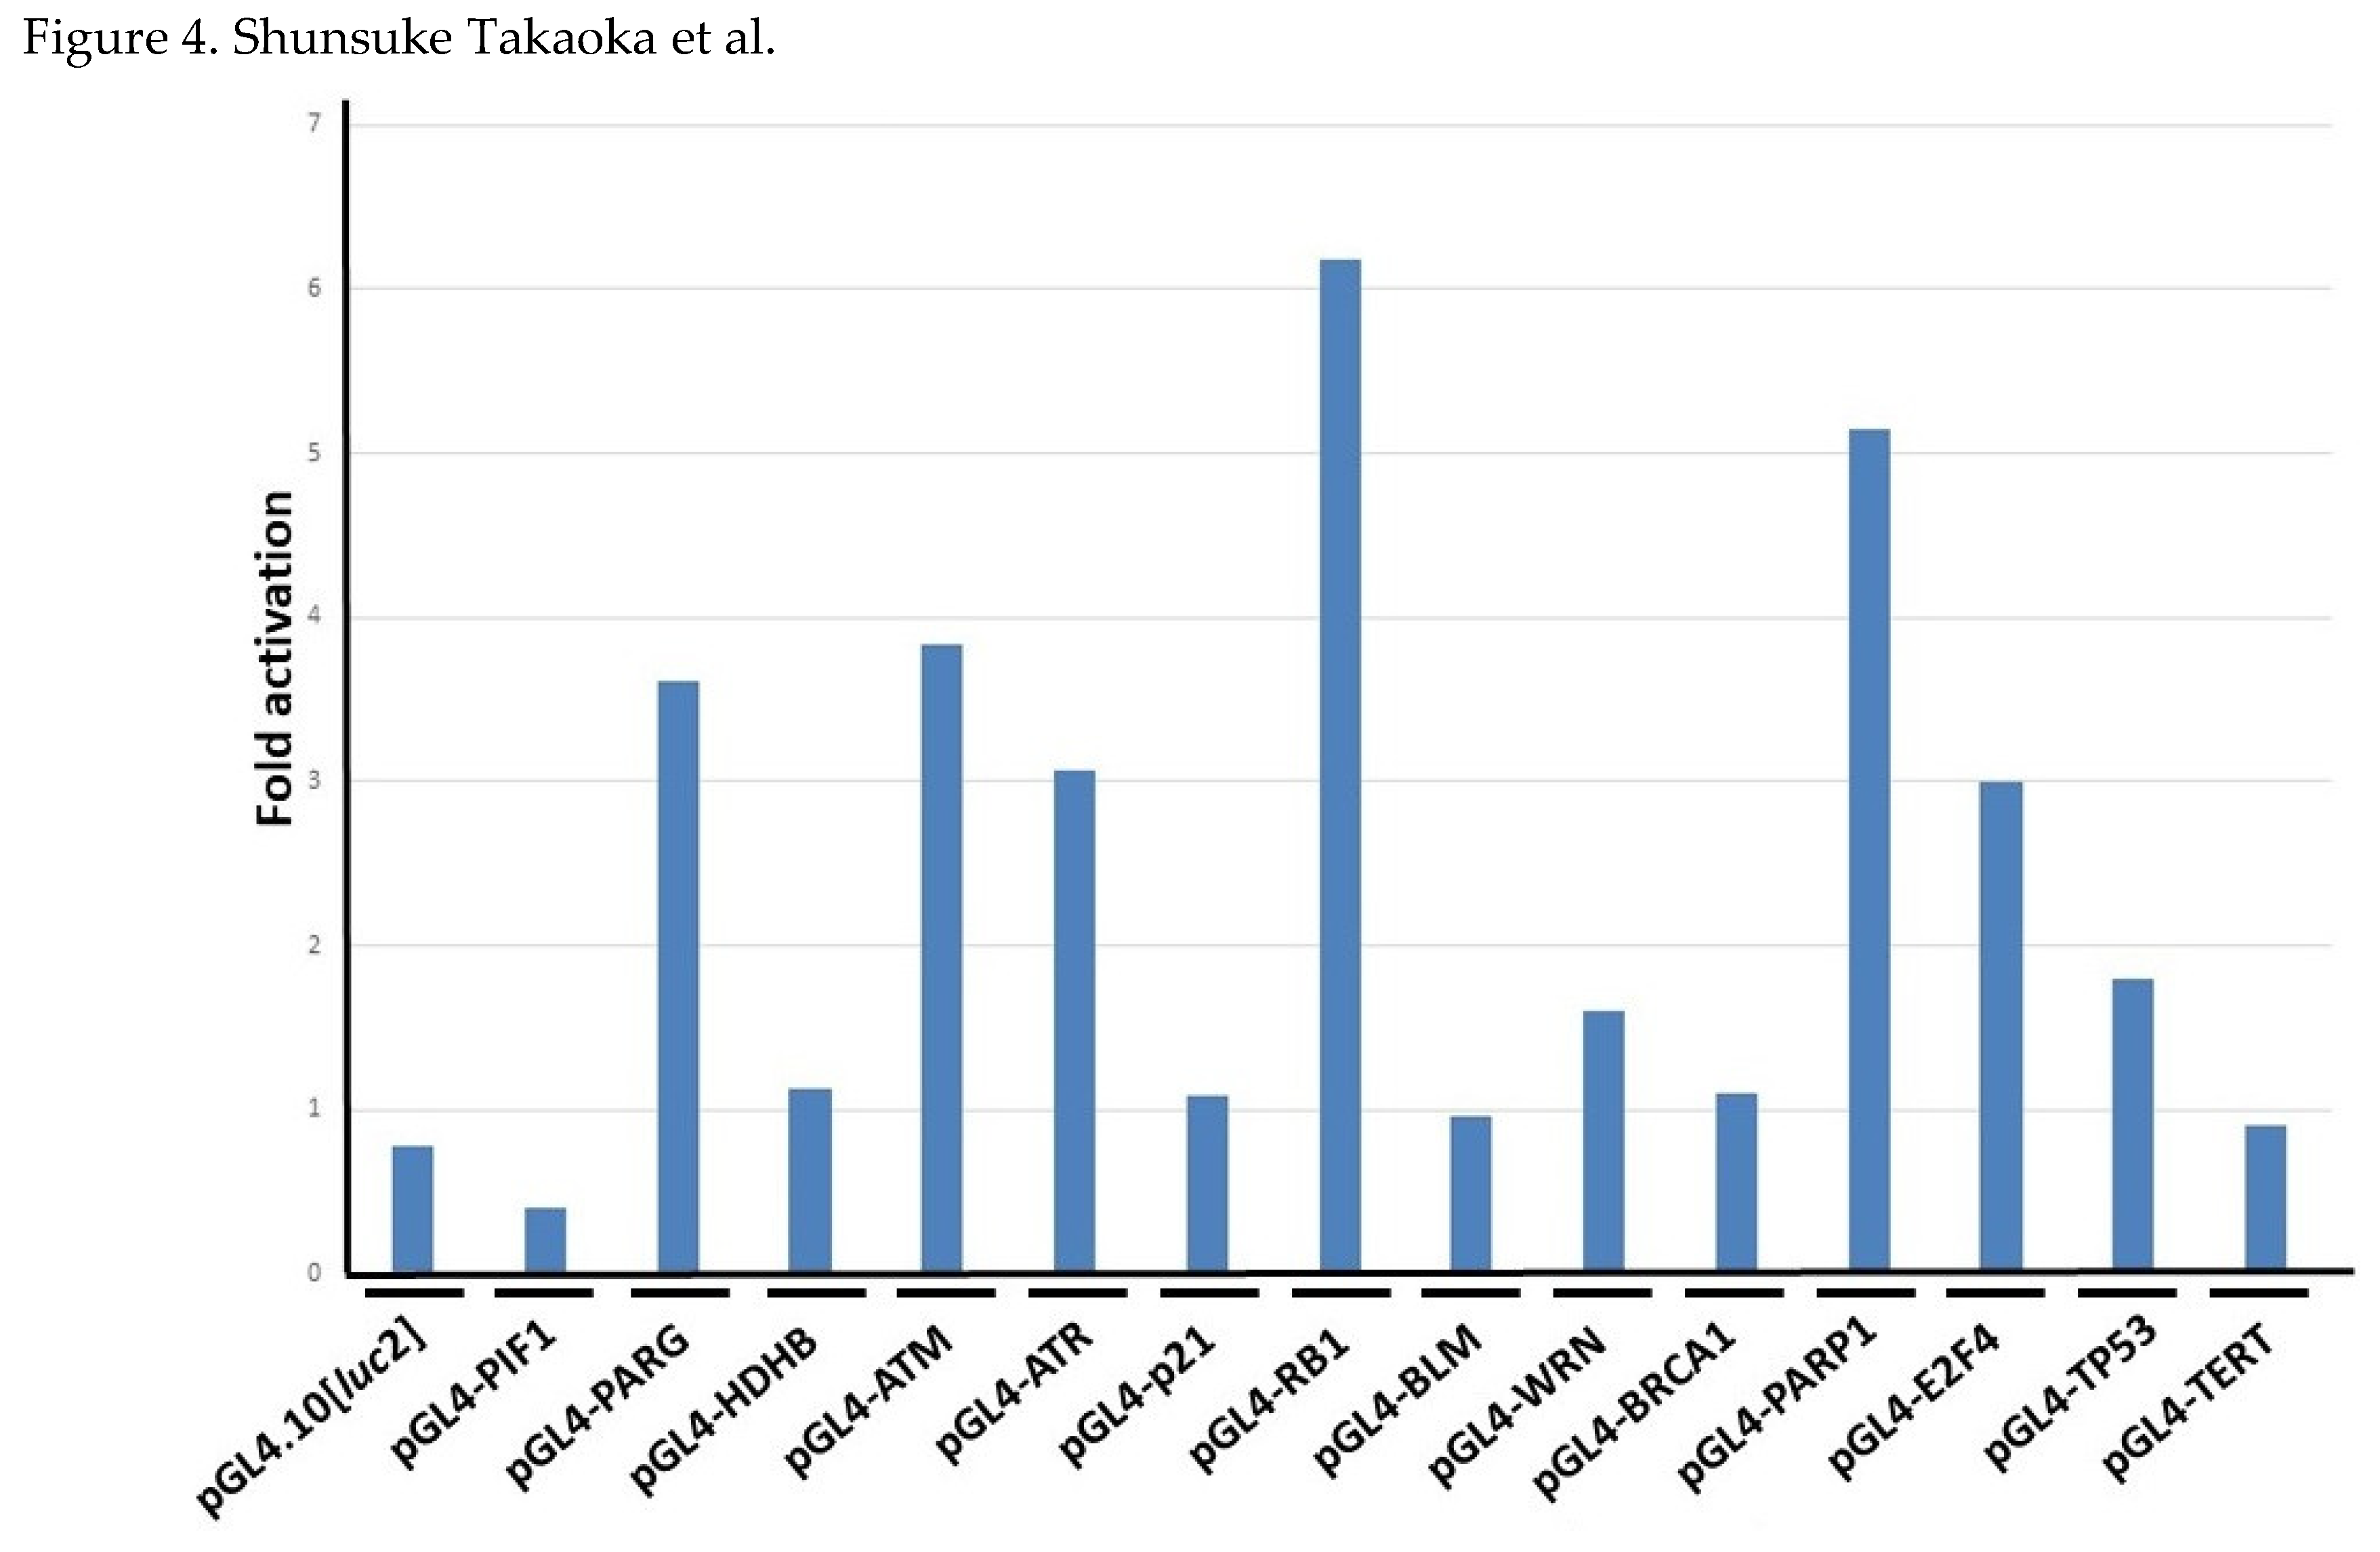
Both the suppressive effect on proliferation and the induction morphological changes of HeLa S3 cells can be similarly observed by the addition of the n-butyric acid to a culture medium. We therefore speculated whether the n-butyric acid, which is the unique metabolite of the CB cultivated broth, might affect promoter activities of the DNA-repair factor-encoding genes. The treatment of n-butyric acid (2.5 mM) for 19 h induced several gene promoter activities (Figure 4). The magnitude of induction of the ATM, RB1, and PARP1 promoter activities by the addition of n-butyric acid (5 mM) for 42 h was most prominent of all (supplementary Table S2). It should be noted that the TP53 promoter was not affected as much by n-butyric acid treatment. The fold activation of the TP53 promoter activity by 1.25, 2.5, and 5 mM for 19 h was 0.298, 0.819, and 1.59 respectively, suggesting that the n-butyric acid can induce a regulatory signal(s) that suppresses the TP53 promoter activity.

2.4. Amounts of ATM, PARP1, and RB1 in HeLa S3 Cells after CBCS Treatment

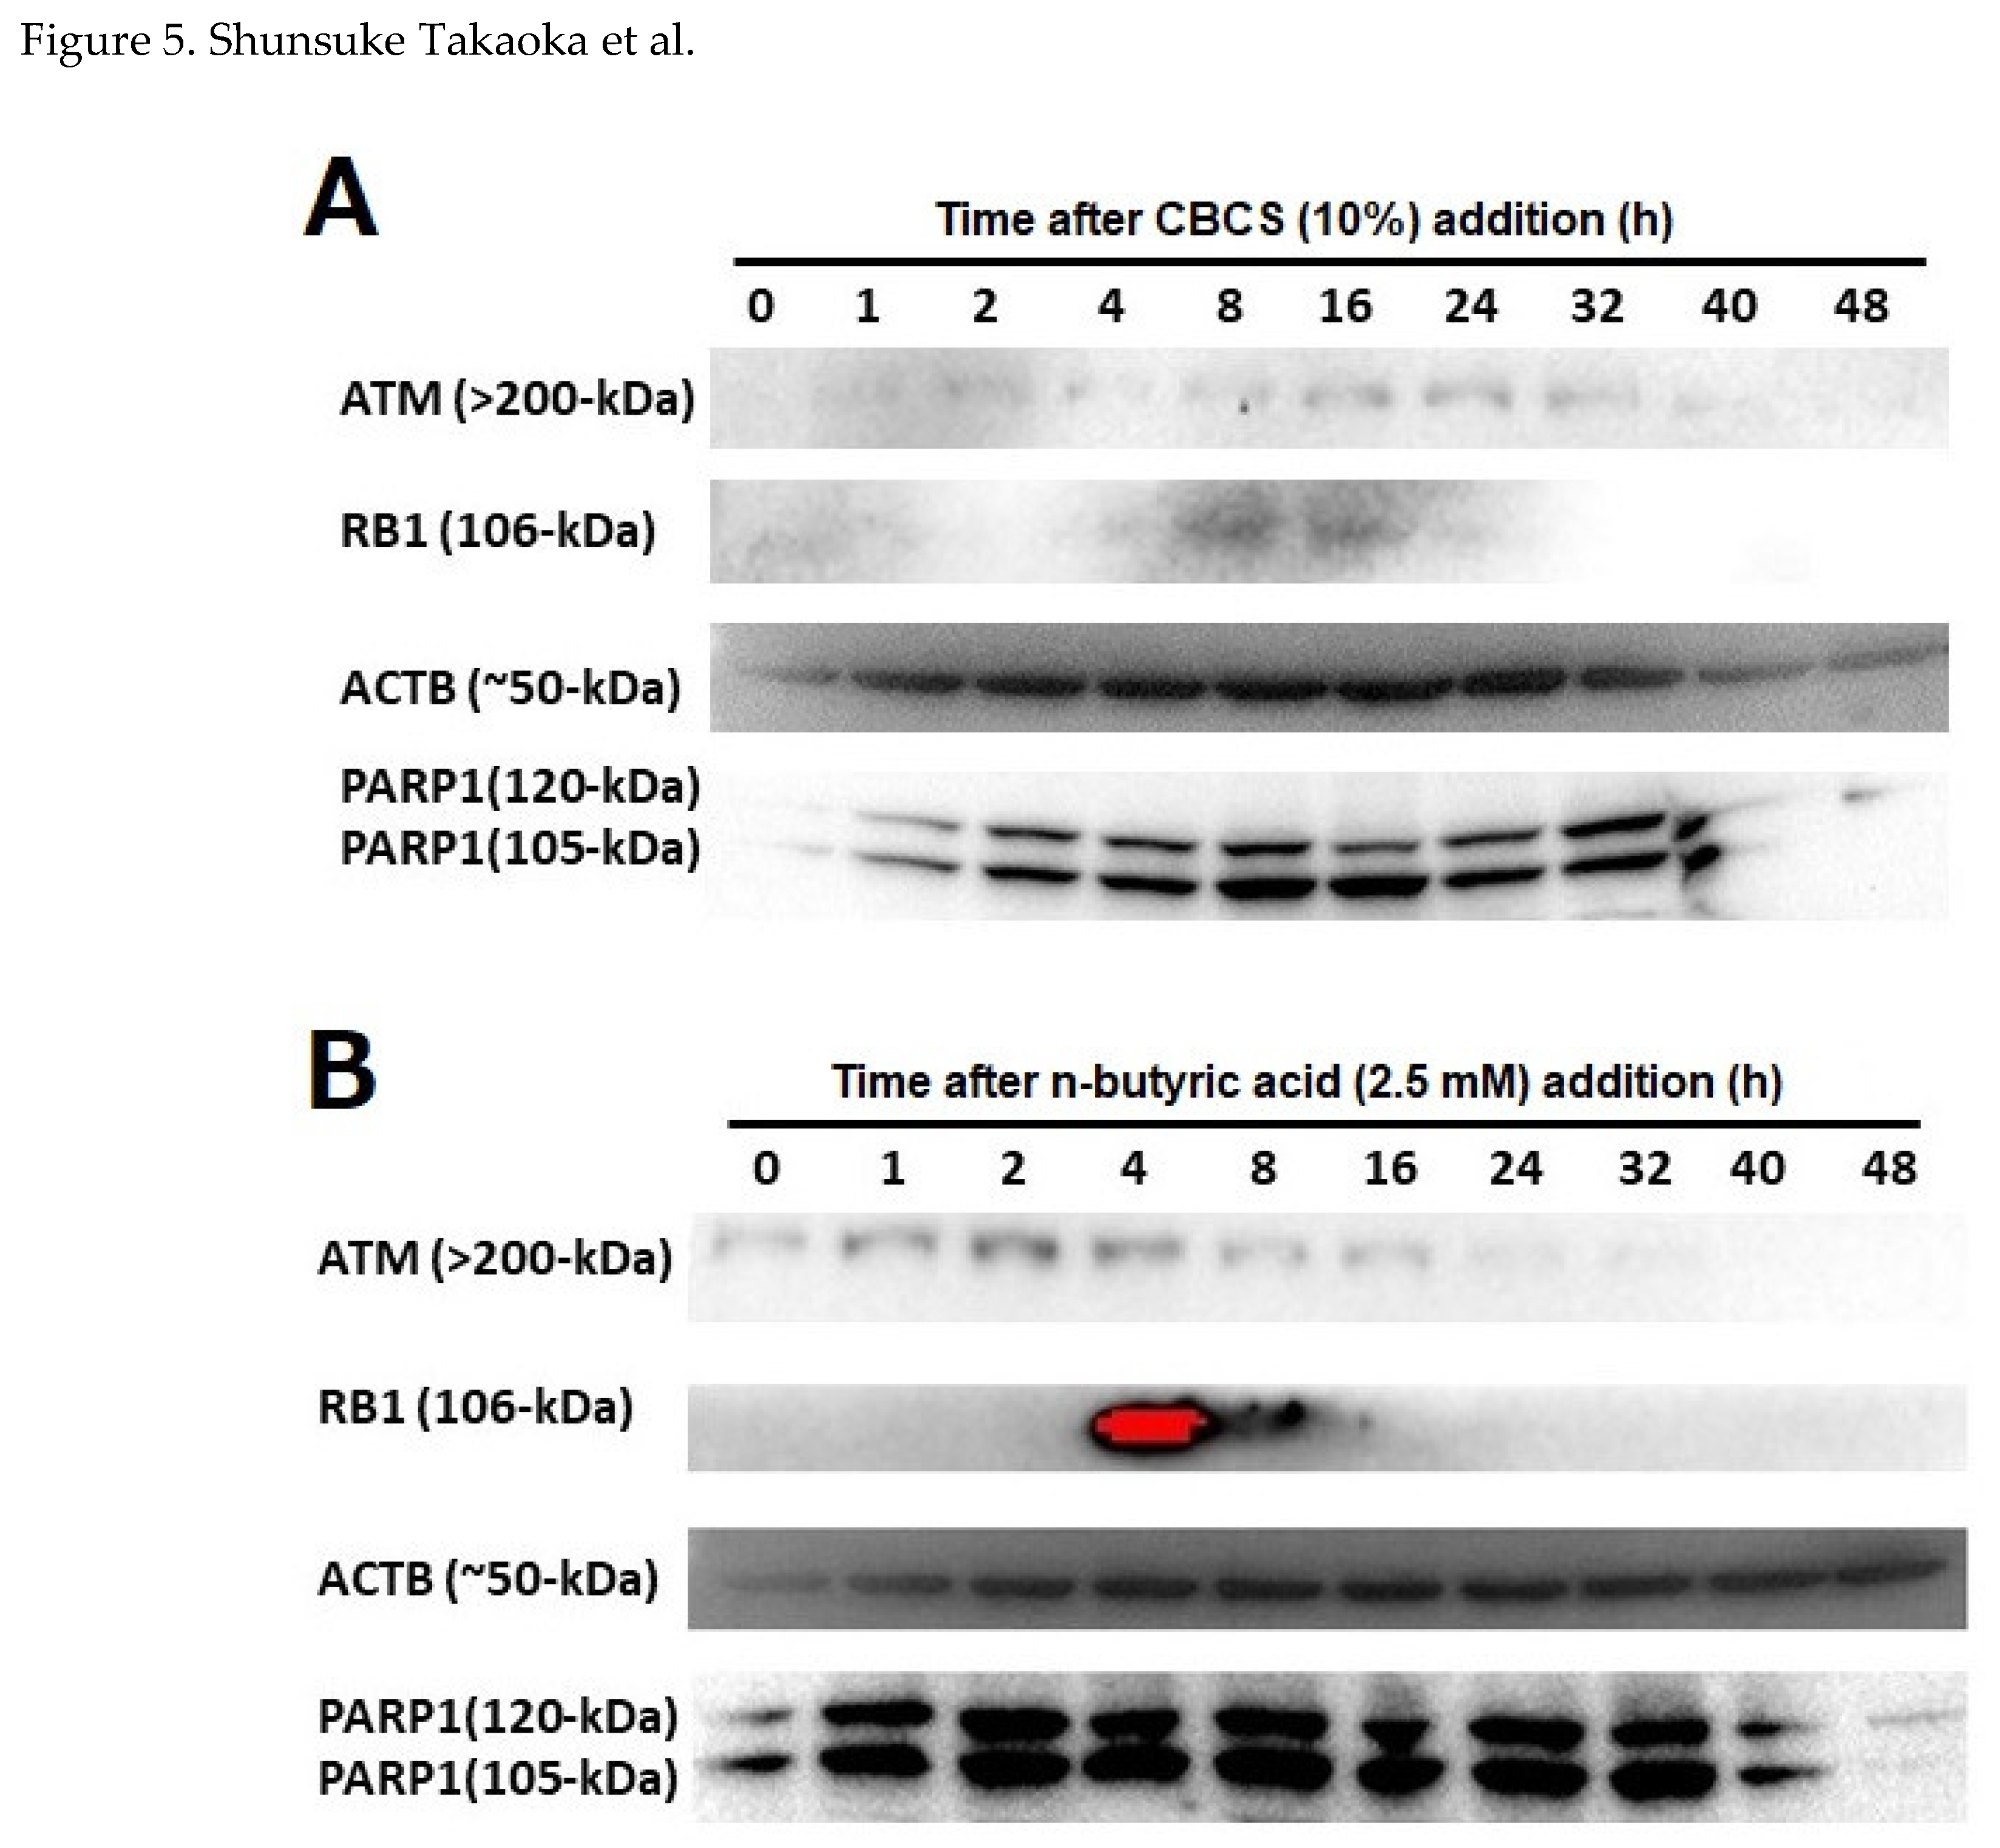
Amounts of ATM, PARP1, and RB1, for which encoding gene promoter activities were greatly induced by the addition of the CBCS (10%), were analyzed by Western blotting (Figure 5A). The ATM (>200-kDa) protein was detected only at a low level in the control cell extract, but it was induced at 2 h after addition of the CBCS (10%) and peaked at 24 h (Figure 5A, top). Similarly, the RB1 (106-kDa) protein was induced and peaked at 8 to 16 h (Figure 5A, second). Two bands that represent 120 and 105-kDa PARP1 protein were hardly detected in the control cell extract. Both bands were induced at 1 h and most accumulated at 8 h after the addition of the CBCS (10%) (Figure 5A, bottom). Although β-actin (ACTB, 50-kDa) was apparently detected in the 0 h control cell extract, it was gradually up- and down-regulated from 1 to 48 h after addition of the CBCS (10%) (Figure 5A, third). A similar experiment was carried out after addition of the n-butyric acid (2.5 mM) to the HeLa S3 cell culture medium (Figure 5B). Basically, the induction of the ATM, RB1, and PARP1 proteins were observed similarly to the addition of 10% CBCS. However, they accumulated earlier than CBCS (10%) treatment. The amounts of ATM, RB1, and PARP1 peaked at 2, 4, and 2 h after addition of n-butyric acid (Figure 5B).

2.5. n-Butyric Acid-Response Elements in the Human RB1 and PARP1 Gene Promoters

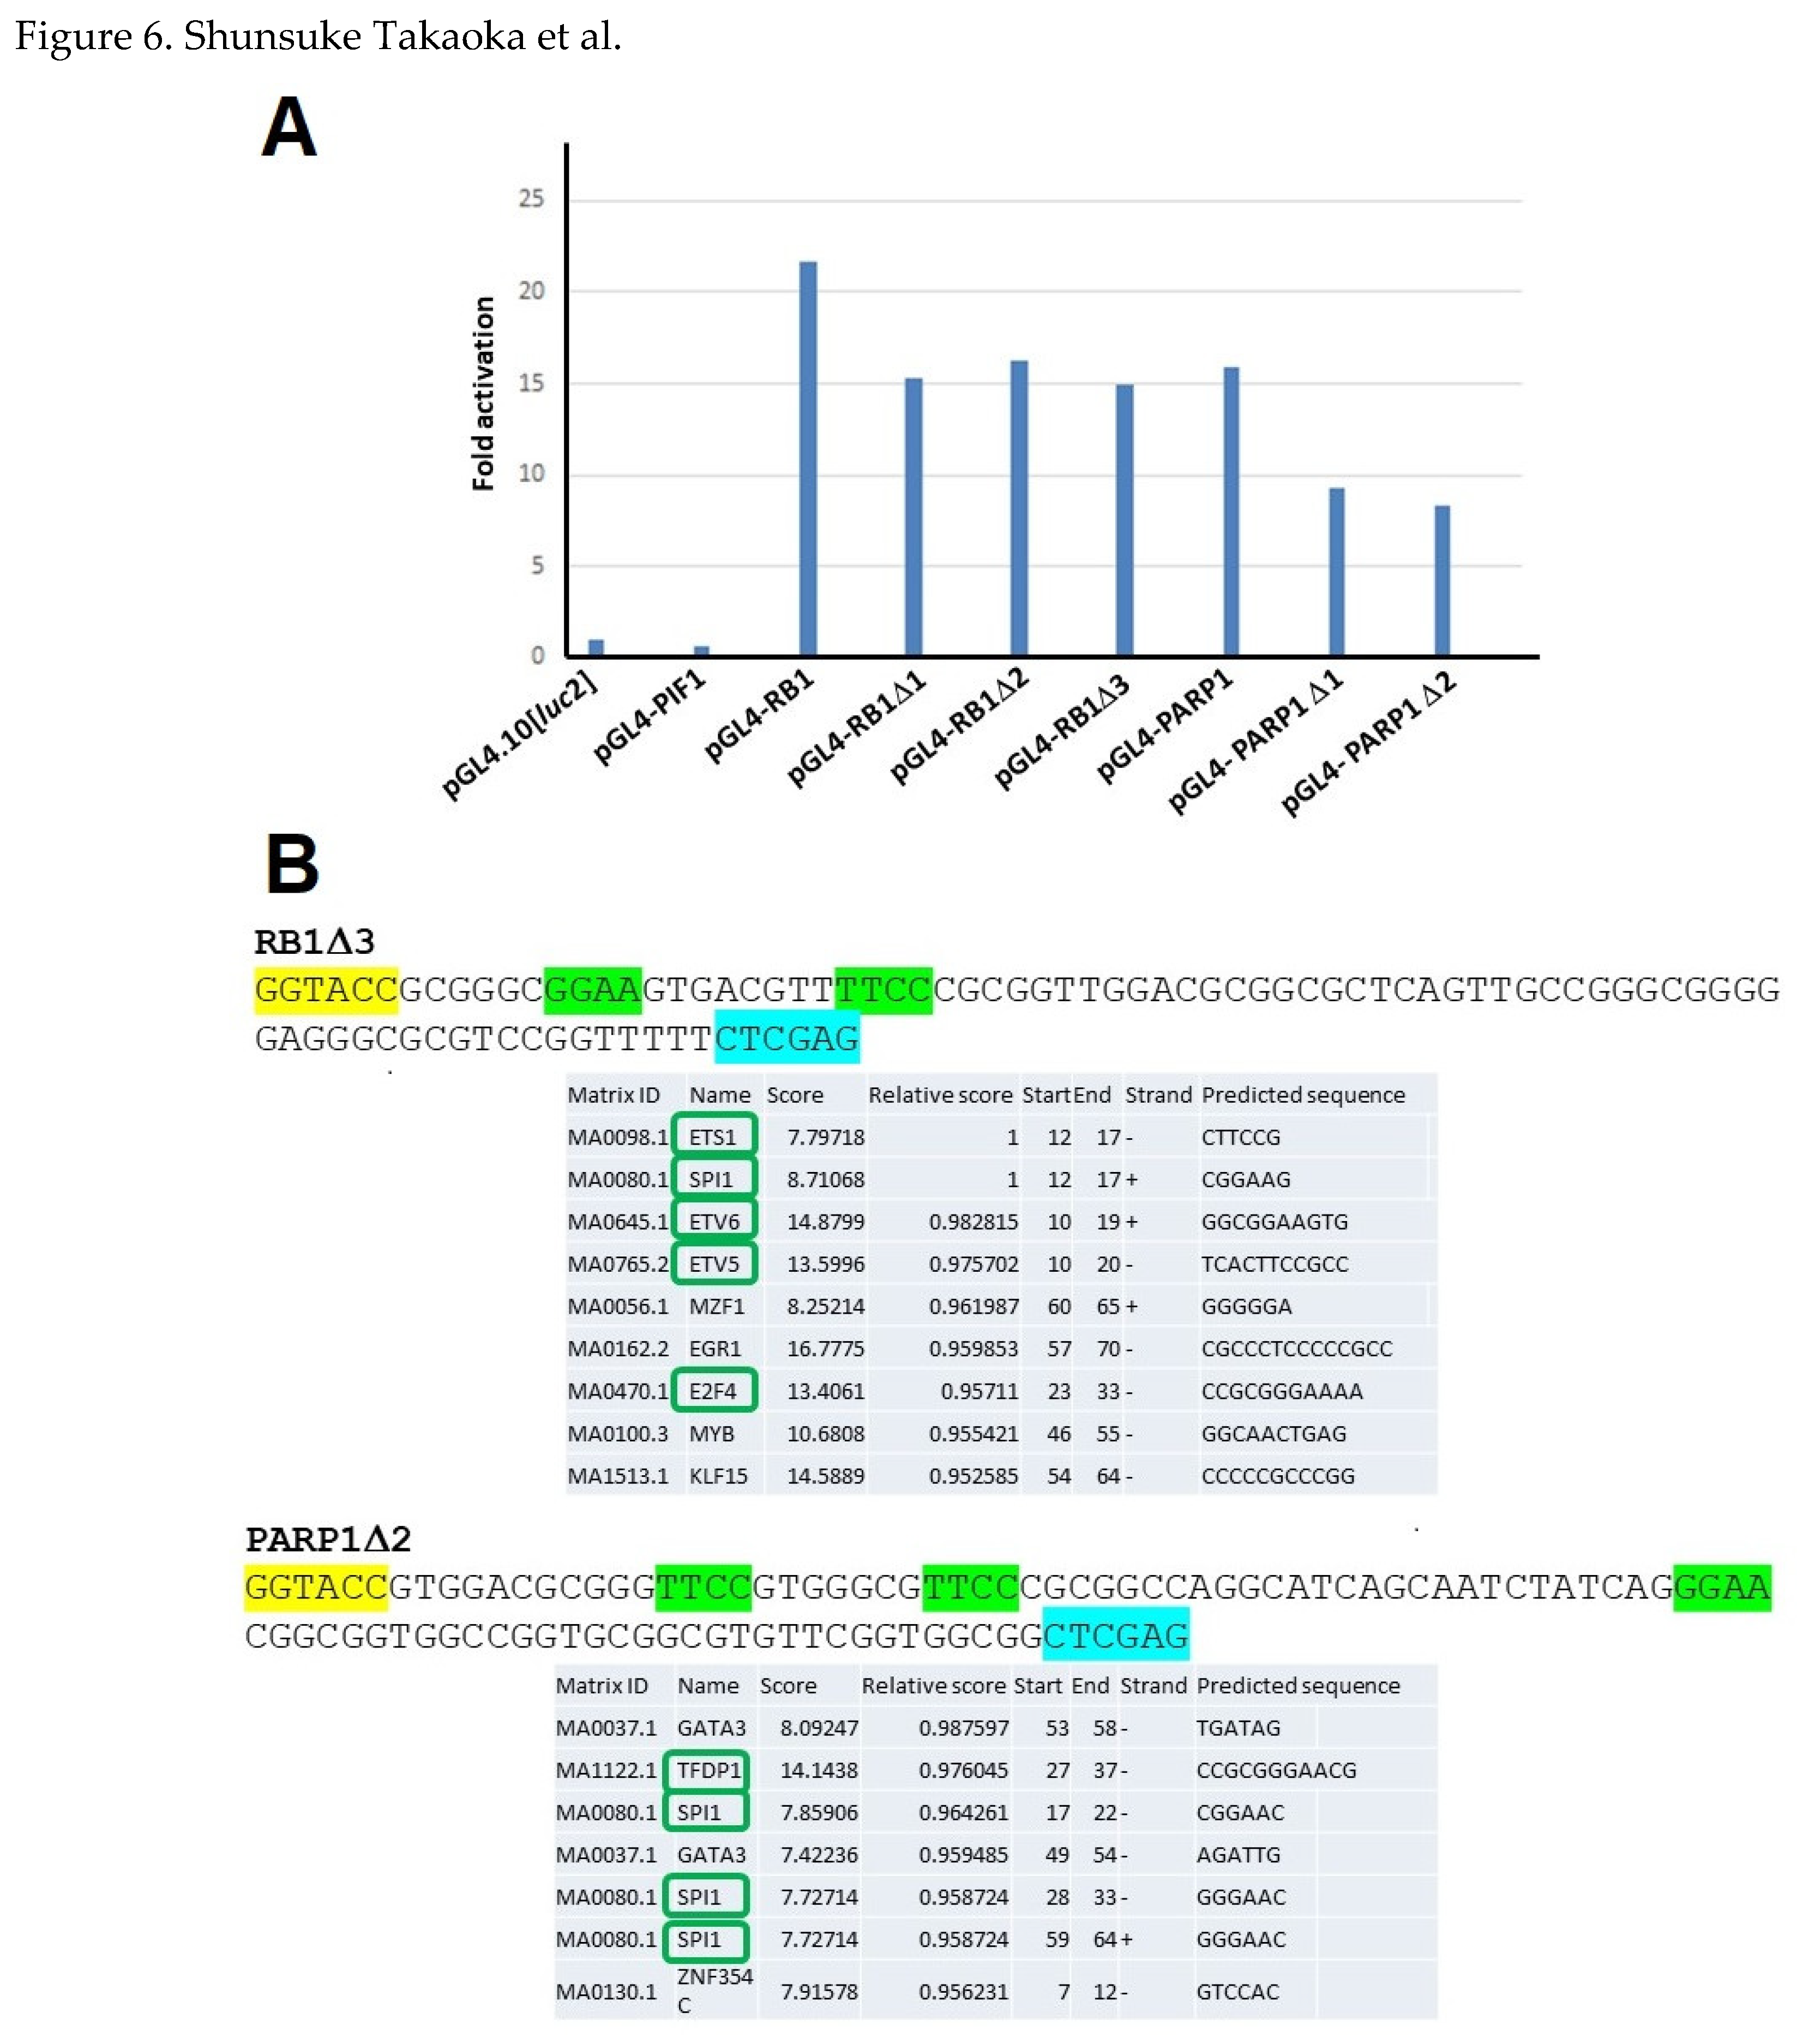
Because RB1 and PARP1 gene promoters most prominently responded to CBCS (10%) (Figure 1B, and supplementary Table S1) and n-butyric acid (supplementary Table S2) among the tested human gene promoters, deletion experiments were carried out (Figure 6). The most deletion introduced constructs, pGL4-RB1D3 and pGL4-PARP1D2, positively responded to n-butyric acid (5 mM) (Figure 6A). Both the 76- and the 90-bp, which are contained in the pGL4-RB1D3 and pGL4-PARP1D2 plasmids, respectively, have a duplicated GGAA (TTCC) motif. Notably, JASPAR-2020 analysis indicated that the SPI1 (PU.1) recognition sequence is contained in both 76- and 90-bp butyrate responding sequences (Figure 6B).

2.6. RNA Sequence (RNAseq) Analysis of HeLa S3 Cells after Cultivation with CBCS

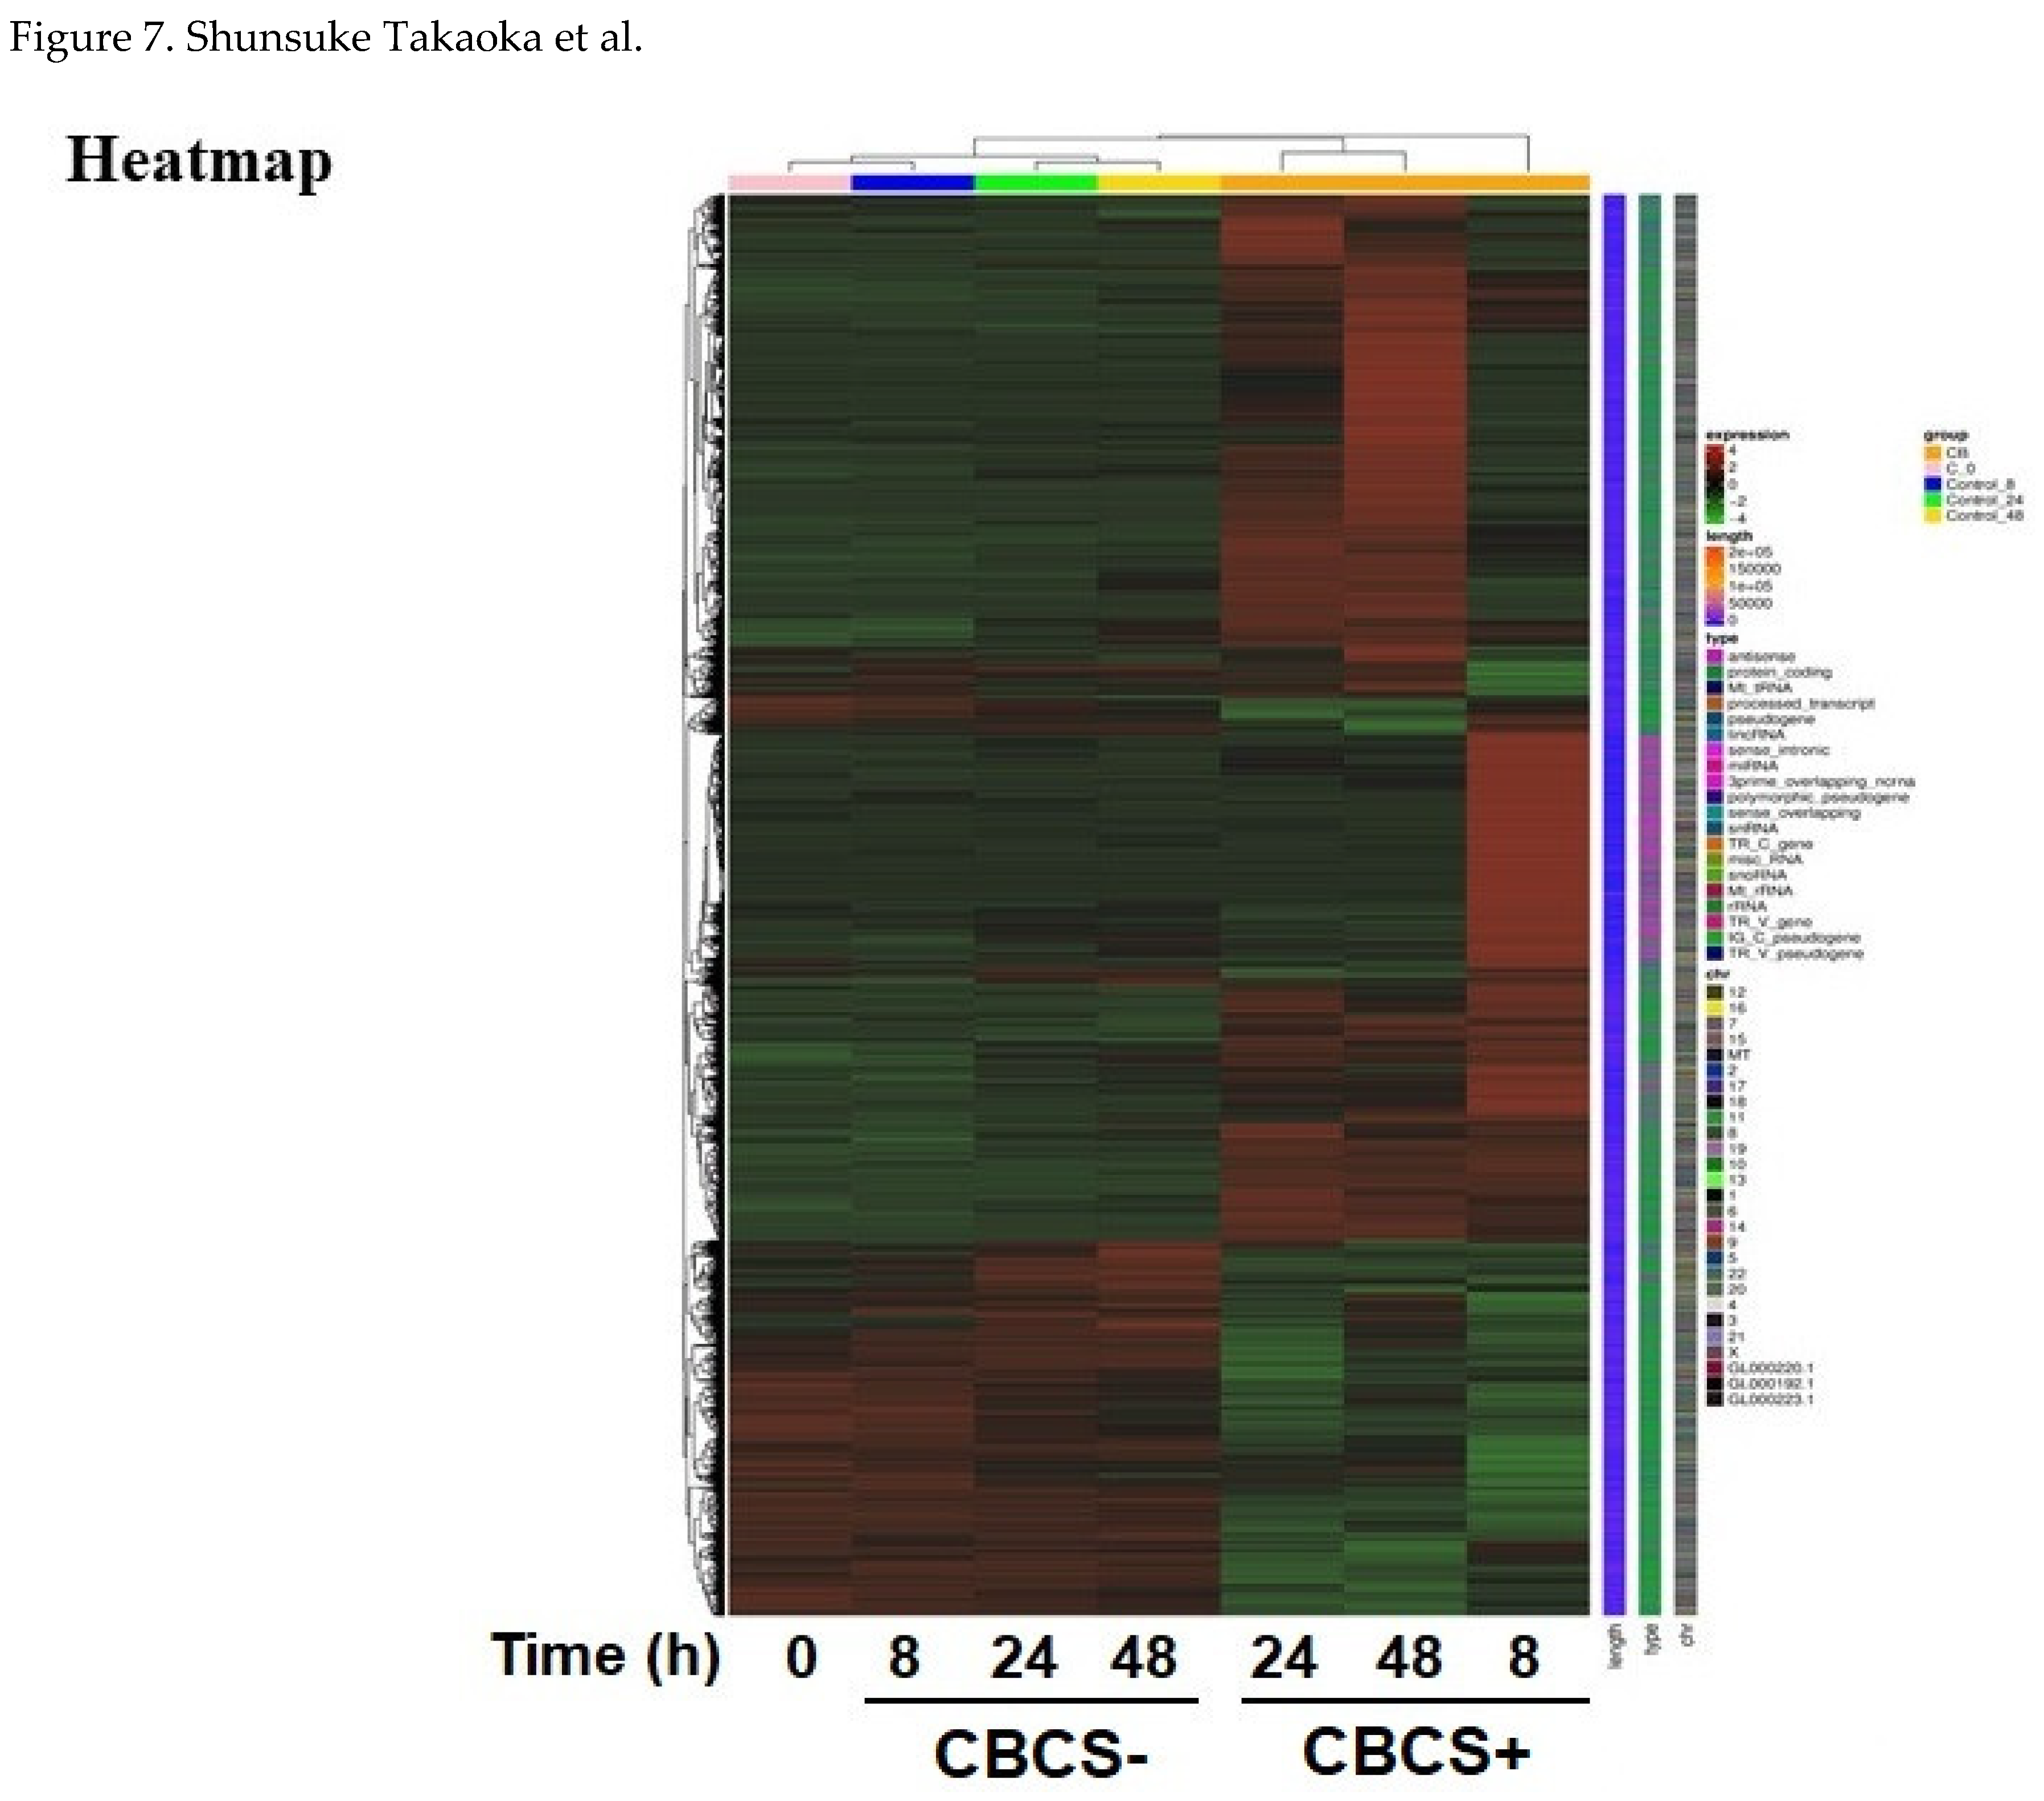
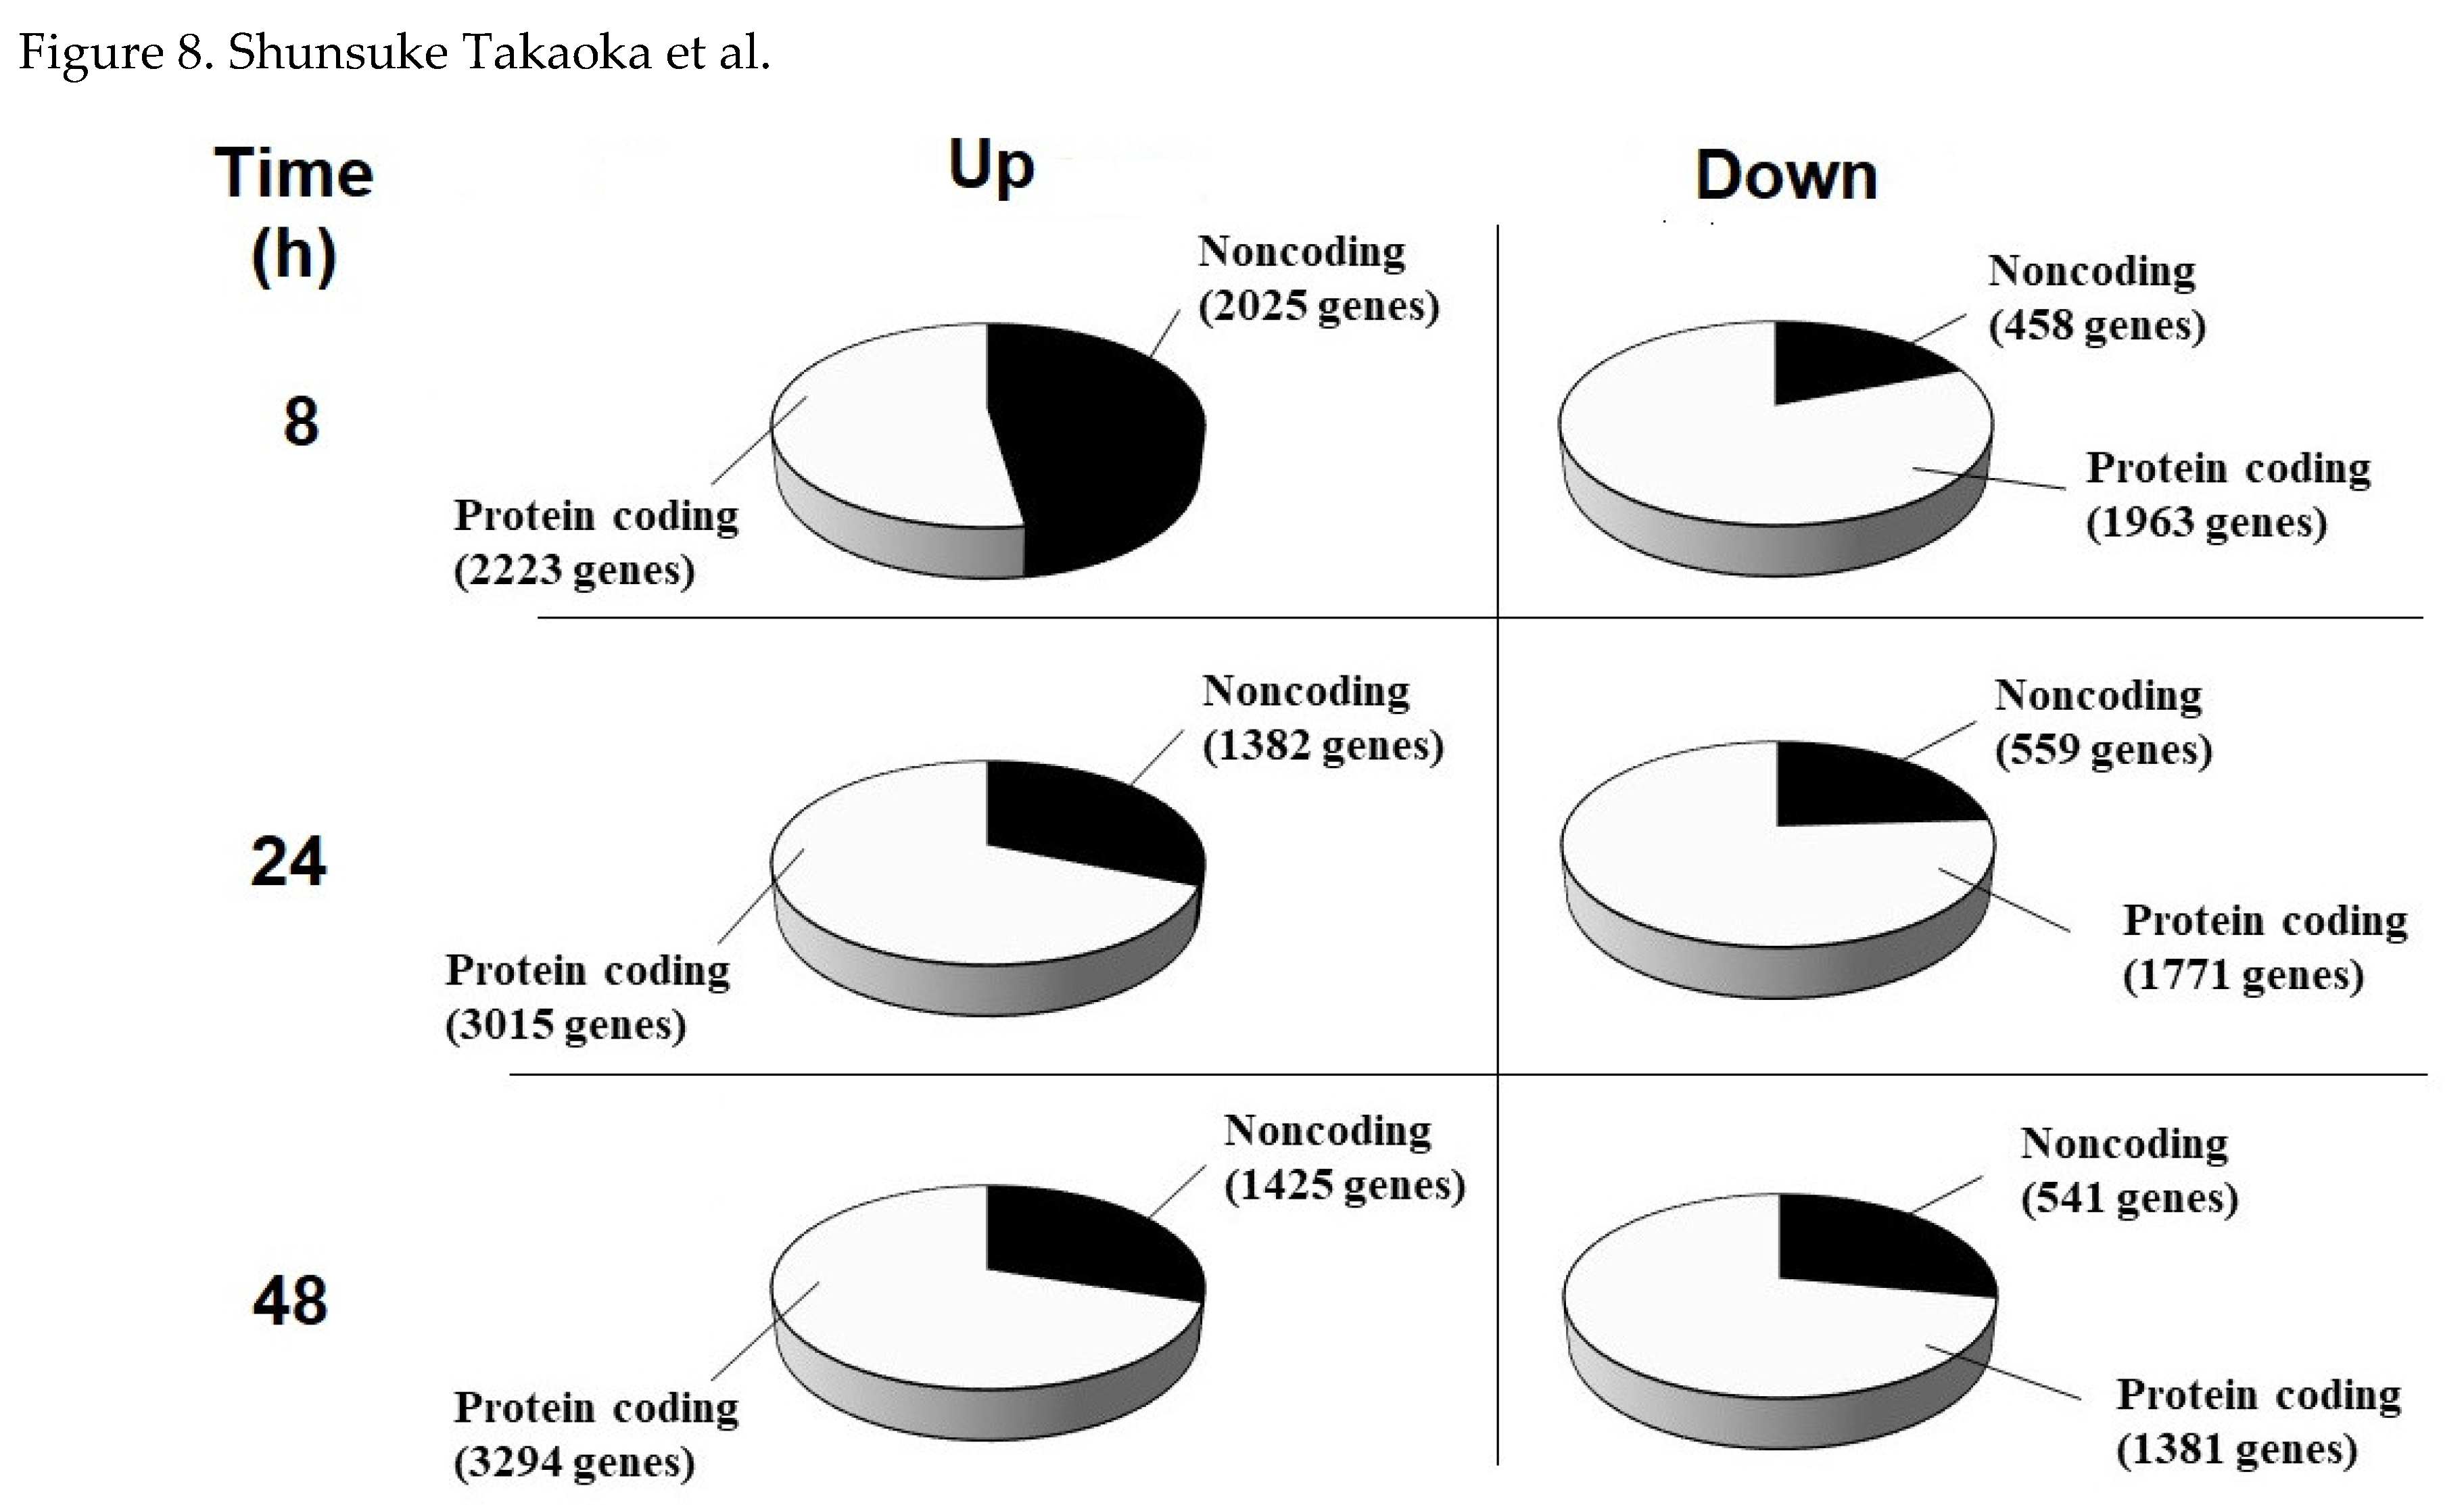
To evaluate transcriptionally activated and inactivated genes by the addition of CBCS (10%) to the HeLa S3 culture medium, RNAseq analysis was performed (Figure 7). In total, 6669, 6727, and 6641 genes were identified as differentially expressed between the CBCS group and the control group after 8, 24, and 48 h cultivation (Suppl. Table S3). Among these genes, 4248, 4397, and 4719 genes were significantly upregulated, and 2421, 2330, and 1922 genes were significantly downregulated after 8, 24, and 48 h CBCS (10%) addition, respectively. A number of these genes were further classified into protein-coding or non-coding genes (Figure 8). In summary, the results showed that significantly up-regulated genes are dominant after CBCS (10%) addition (Figure 7 and Suppl. Table S3). The ratio of non-coding/protein-coding was 50% at 8 h, then it declined to 30% after 24 h (Figure 8).
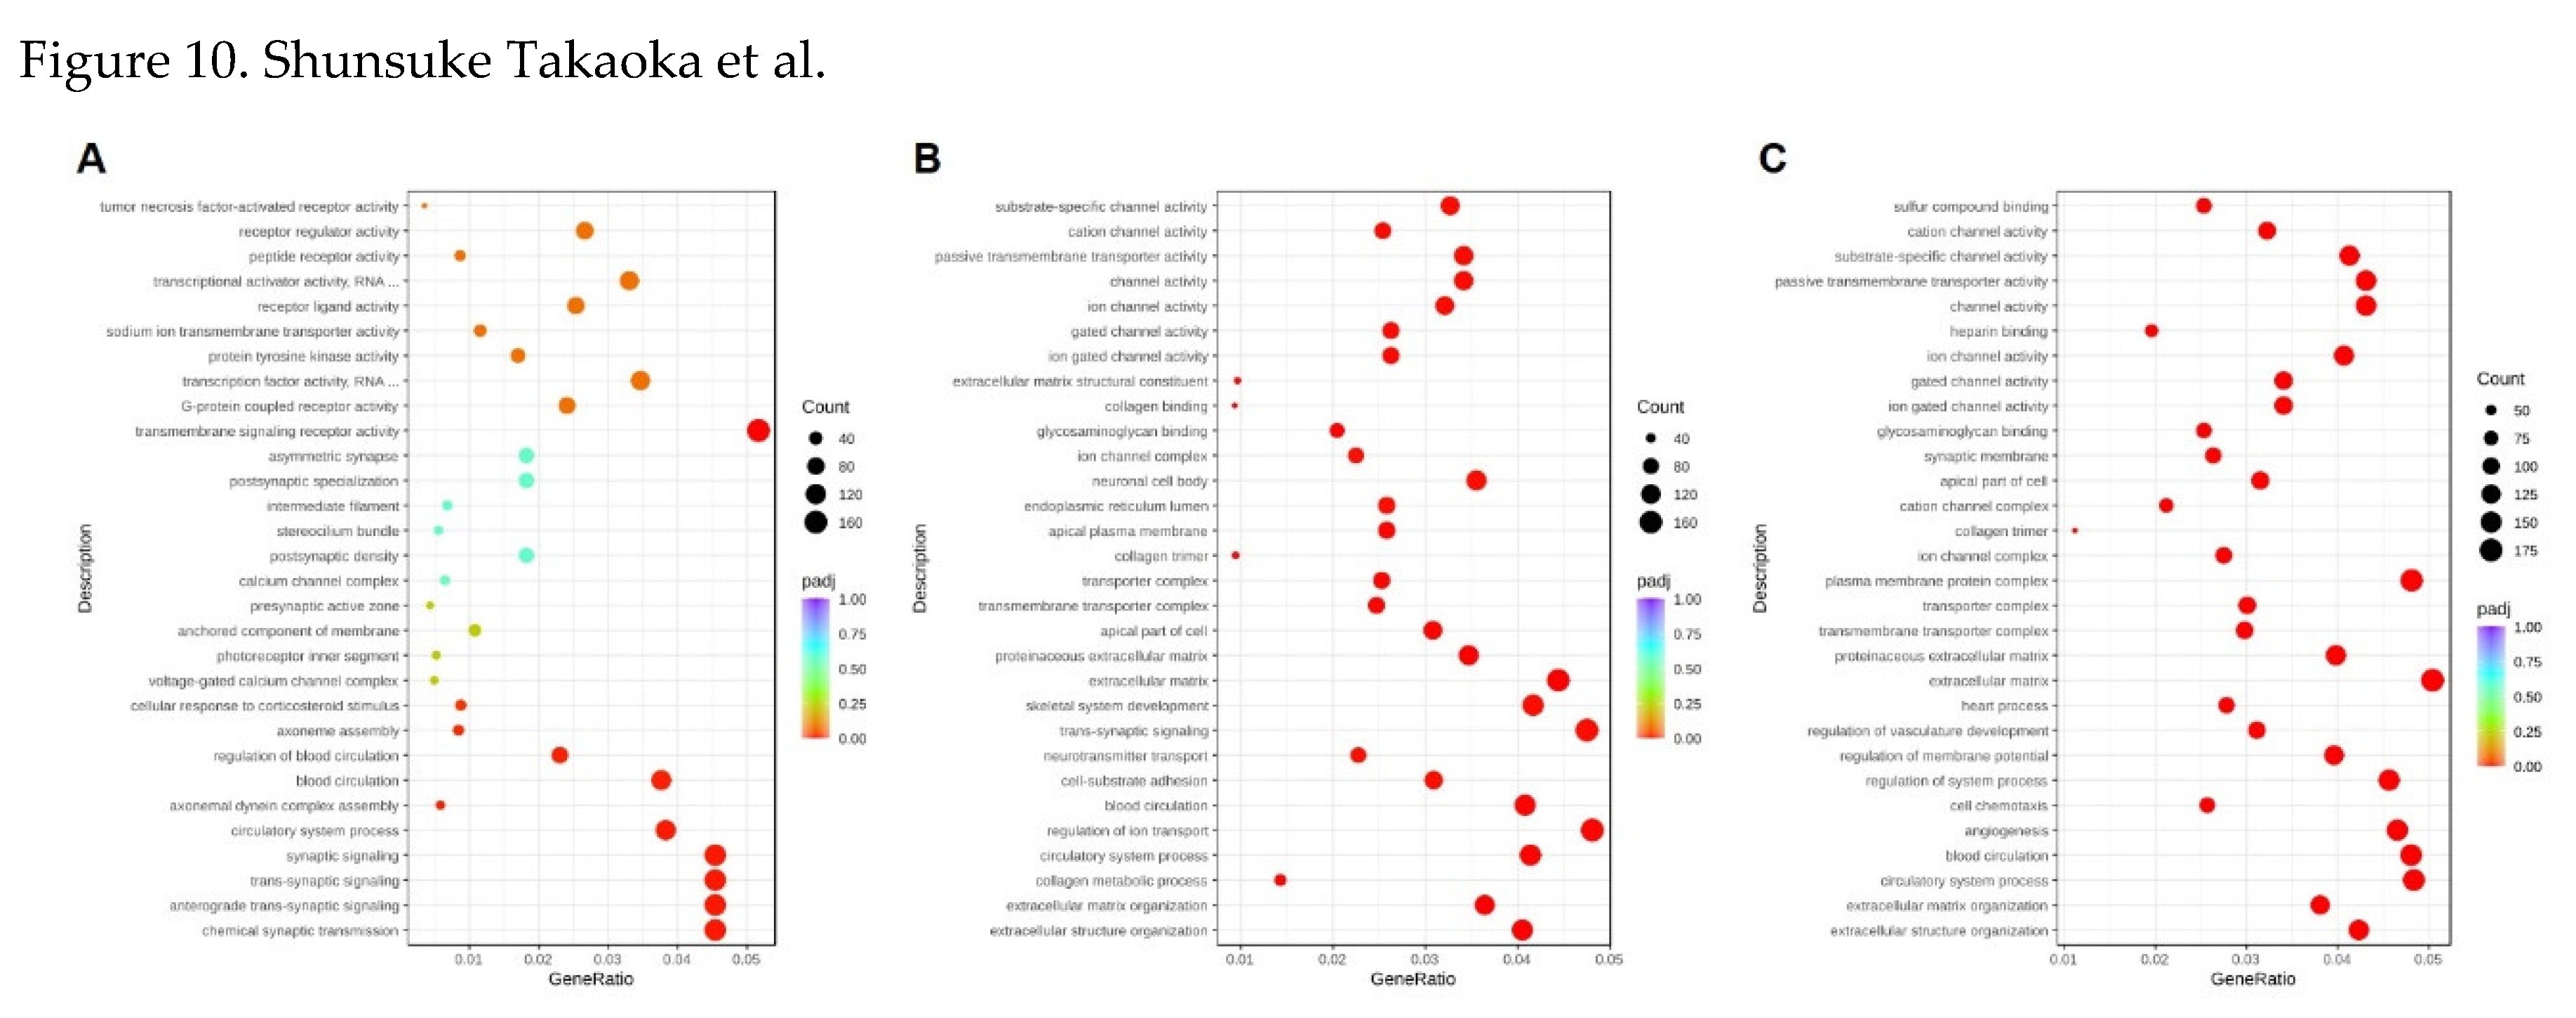
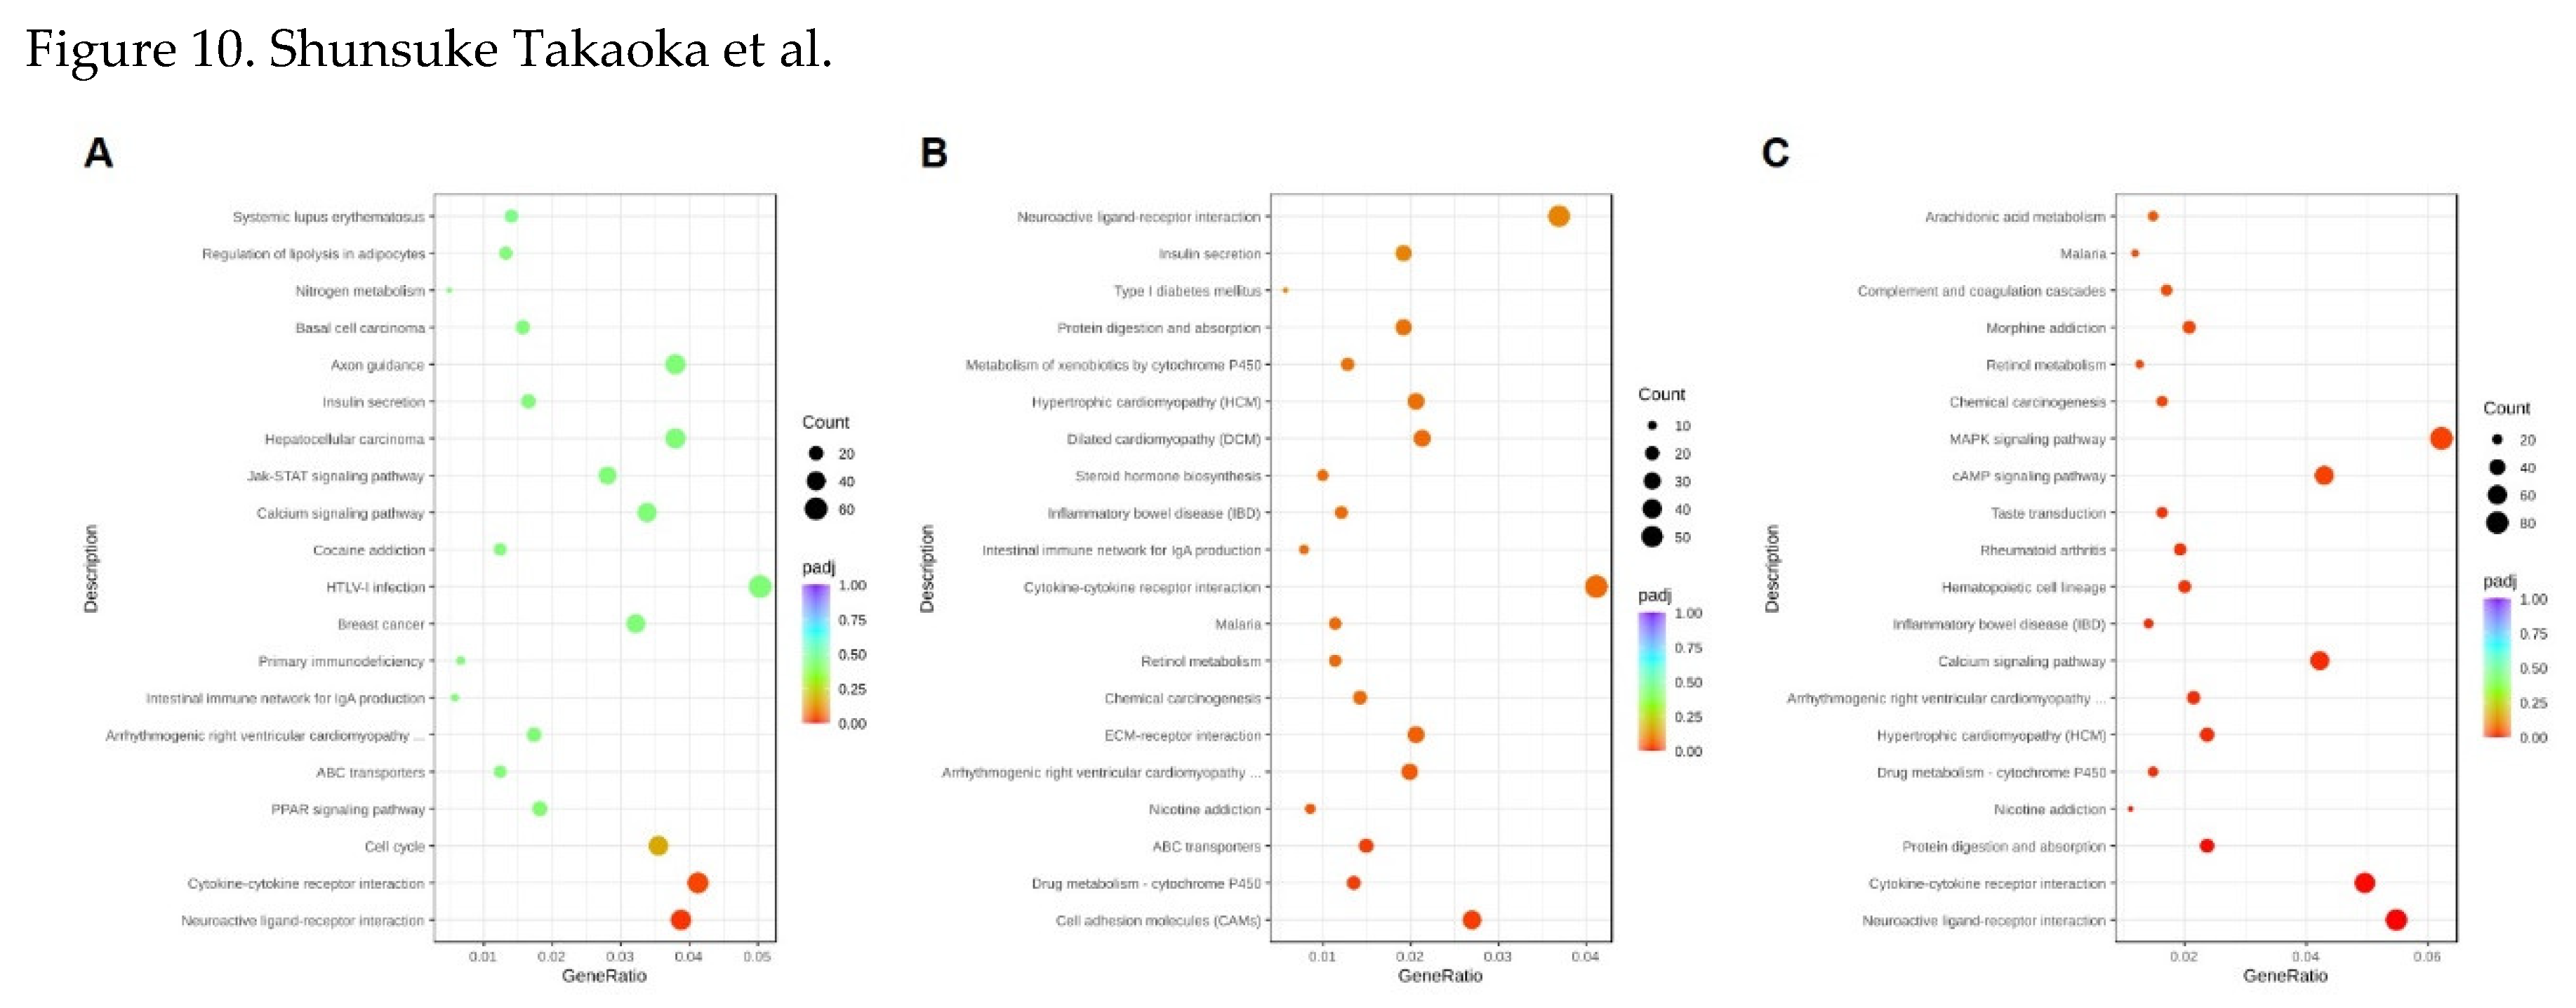
Gene ontology (GO) annotation classified the DEGs compared with the same time point control (Figure 9). At 8 h after the addition of the CBCS (10%), the most significant GO term was transmembrane/synaptic signaling and transcription factor activity (Figure 9A), most of which were up-regulated (Supple. Figure 1A). However, the downregulated genes were mainly correlated to transcription factor activity and transcriptional activator activity. Differentially expressed genes (DEGs) that were up-regulated after 24 and 48 h of CBCS (10%) treatment were different from those of the 8 h treated cells. The significant GO term at 24 and 48 h CBCS (10%) treatment was extracellular matrix/structure organization and various ion channel-related genes (Figure 9B and 9C). Most of the genes that were classified as having a significant GO term were up-regulated (Supple. Figure 1B and 1C). According to the KEGG analyses between 8, 24, and 48 h experiments, the DEGs that are commonly listed as significant are included in pathways related to neuroactive ligand-receptor interaction and cytokine-cytokine receptor interaction (Figure 10).

3. Discussion

In this study, it was shown that several human DNA-repair-associated gene promoters prominently respond to CBCS addition in human cervical carcinoma HeLa S3 cells. In contrast, the addition of other probiotic bacterial culture supernatants, including that of BSCS, EFCS, and BACS, to HeLa S3 cell culture did not upregulate at all (Figure 1A). Interestingly, promoter activities of the most genes were decreased in BACS (10%) treated cells (Figure 1A, purple bars). Therefore, expression of the DNA repair factor-encoding genes could be simultaneously suppressed by the BACS treatment. Although activities of the RB1 and TP53 promoters were detected, those of the PARP1 and TERT promoters were almost zero, implying that the compounds in the BACS may be applied for developing cell-death-inducing cancer therapeutics.
The enhancement of promoter activities increased in accordance with the morphological change of the cells (Figure 1B and Figure 2AB). In these experimental settings, the morphological change of HeLa S3 cells [13] was observed after the addition of n-butyric acid to the culture medium (Figure 2C), and some of the DNA repair factor-encoding gene promoters apparently responded (Figure 4). In addition, CBCS and n-butyric acid can accumulate ATM, RB1, and PARP1 proteins in HeLa S3 cells (Figure 5).
We have been studying promoters of the DNA repair factor-encoding genes, including HELB [5], MCM4 [6], and CDC45 [16]. Notably, they commonly contain GGAA (TTCC) motifs and GC-boxes, which are the ETS family [17] and Sp1 [18] recognition sequences, respectively. All of them respond to a natural compound, trans-resveratrol (Rsv) in HeLa S3 cells [5,6,16]. In this study, deletion experimentation showed that n-butyric acid-responding regions in the human RB1 and PARP1 promoters contain the duplicated GGAA (TTCC) motifs (Figure 6). Although the JASPAR-2020 analysis did not predict the GC-boxes in these n-butyric acid-responding regions, the GC-rich sequences 5′-CGGGCGGGGG-3′ and 5′-CGGCGGTGGCCGG-3′ were present in the RB1 and PARP1 promoters, respectively (Figure 6B). The implication that Sp1 could act as a transcription activator is consistent with the previous study that indicated Sp1-binding elements in the human ANT2 promoter are required to respond butyrate in HeLa cells [19]. Moreover, three Sp1 binding sequences that are contained in the HIV LTR are required for a positive response to butyrate in HeLa cells [20]. The possibility that the GC-box like sequences and GGAA duplication cooperatively confer the positive response to n-butyric acid is yet to be elucidated.
Butyrate is a histone-deacetylase (HDAC) inhibitor that impairs pancreatic β cell function [21,22]. Thus, the short-chain fatty acid can drastically increase the level of histone acetylation [23] in HeLa cells to inhibit chromosomal condensation [24] upregulating a specific gene expression [25,26]. The RNAseq data of this study indicated some novel findings. Firstly, expression-up-regulated genes are counted as two-fold of the down-regulated genes at all times tested (Suppl. Table S3), Secondly, the number of non-coding RNAs (ncRNAs) is most abundant at 8 h after CBCS addition (Figure 8), suggesting a specific transcription system worked to evoke non-coding RNA expression at an early stage of the response to CBCS or n-butyric acid. They must have lowered the relative expressions of the protein-encoding-genes. Although, some specific ncRNAs might affect translation efficiencies, they are not directly used as templates to produce polypeptides. Therefore, each protein level would simply be dependent on its coding gene expression. It is consistent that the ATM, RB1, and PARP protein levels were induced after the n-butyric acid treatment. However, the RNAseq raw data showed that most of the genes, for which promoter activities were up-regulated by CBCS or n-butyric acid (Figure 1 and Figure 4), were not increased as expected (Table 1). If all the data of the non-coding RNAs were eliminated, some of them might have been evaluated as significantly induced. We used the PIF1 promoter as a control because its activity was relatively high but it showed very low responses to CBCS or n-butyric acid among tested promoters. Surprisingly, its expression level (FPKM value) of CBCS-treated cells was significantly decreased compared with that of control cells (Table 1). If it were used as a reference control, most of the relative expressions of the genes in Table 1, except for that of the TP53, would be evaluated as increased. Both the TP53 and NFKB1 transcripts were evaluated as significantly decreased at 8 to 48 h (Table 2). The p53 is generally known as a tumor suppressor that stops cell proliferation to induce apoptosis or cell death. Although HeLa S3 cells have wild type TP53 on the chromosome [27], quite a lot of cancers have mutations on the protein-encoding sequences of the gene [28]. In this regard, down-regulation of the gene expression by CBCS can be applied to TP53 mutated cancer, suppressing accumulation of mutated p53. Our results also support previous studies showing that butyrate inhibits NF-κB activation in human epithelial cells [29] and in degenerated intervertebral disc tissues [30]. Also, in mice, the butyrate can inhibit NF-κB activation [31,32], suggesting that it could limit immune signals, including inflammatory response. Finally, although it was not indicated by either GO term or KEGG analyses, expression of well-known protein-encoding genes were identified. Although the molecular mechanisms that would explain how histone-encoding genes are transcribed have not been fully understood, many of them are head-head linked with oppositely transcribed histone-encoding genes [33]. Several histone-encoding gene transcripts were up-regulated after 8 h of CBCS treatment (Table 2). This result is consistent with the previous report, indicating that butyrate induces poly(A)-H1 histone mRNA in HeLa cells [34]. Additionally, histones H2B, H3, and H4 [35] are hyperacetylated at a transcriptionally active mono nucleosome-rich fraction of the HeLa S3 nuclei [36]. Moreover, hypermethylation was caused on the active nucleosomal DNA [37]. Therefore, the reason why specific genes, including histone-encoding genes, are activated at an early stage after butyrate treatment could be partly explained by alterations in local structures of the chromosomes. In contrast, DNA replication factor-encoding gene transcripts, including NFKB1, PCNA, POLA1, POLE, POLF, and MCM2/3/5/7, were significantly down-regulated (Table 2). This observation is consistent with a previous report showing that butyrate suppresses DNA replication to enhance etoposide-induced human tumor cell death [38]. In addition, up-regulated RNAs after 24 and 48 h are the transcripts from genes that encode immune response-associated factors. The mechanisms that induced these gene expressions should be elucidated.

4. Materials and Methods

4.1. Materials

n-Butyric acid (butyrate) (Cat. No. 023-05396) was purchased from Fuji Film (Tokyo, Japan).

4.2. Preparation of Probiotic Bacterial Culture Supernatants

For the probiotic bacterial culture, appropriate nutrient media containing peptone, sugar, etc. were used as manufacturing media for culturing each strain listed below. The nutrient medium was used as a negative control in each experimental setting in this study, and probiotic bacterial culture supernatants were prepared from each strain cultured suspension. In short, B. subtilis TO-A (BS), E. faecium T-110 (EF), C. butyricum TO-A (CB), and Bacillus amyloliquefaciens TOA5001 (BA) from Toa Biopharma Co., Ltd. (Tokyo, Japan) were cultured with each nutrient medium at 37 °C for appropriate culture times, respectively. Only CB was cultured under anaerobic conditions. Then the cultured suspension was filtrated through hydrophilic PVDF membrane filters with the dimeter of 47 mm and a pore size of 0.22 µm (Durapore®, Merck Millipore Ltd., Ireland).

4.3. Cells and Cell Culture

Human cervical carcinoma (HeLa S3) cells [2] were grown in Dulbecco’s modified Eagle’s medium (DMEM Low Glucose) (Nakarai Tesuque, Kyoto, Japan), supplemented with 10% fetal bovine serum (FBS) (Biosera, East Sussex, UK) and penicillin-streptomycin at 37 °C in a humidified atmosphere with 5% CO2.

4.4. Construction of Luciferase (Luc) Reporter Plasmids

The Luc reporter plasmids, carrying approximately 500-bp, which contain transcription start sites (TSSs) of the human DNA-repair and cell cycle controlling factor-encoding genes were constructed previously. The promoter regions that are contained in the plasmids, pGL4- PARG D6 [39], pGL4-HDHB [5] and pGL4-BLM [40], have been characterized. pGL4-ATM, pGL4-ATR, pGL4-p21, pGL4-RB1, pGL4-WRN, pGL4-BRCA1, pGL4-PARP1, pGL4-E2F4, pGL4-TP53 and pGL4-TERT plasmids have been shown to contain functional promoters [3,41,42]. They were used for multiple DNA transfection by the DEAE-[5,15,39–42dextran method [2]. The RB1 and PARP1 promoter deletions were carried out by PCR with sense and anti-sense primers (Table 3) and pGL4-RB1 [41] and pGL4-PARP1 [42] respectively, as a template. The amplified DNA fragments were digested with KpnI and XhoI and they were ligated into the MCS of pGL4.10[luc2] to generate pGL4- RB1-D1, pGL4-RB1-D2, pGL4-RB1-D3, pGL4-PARP1-D1 and pGL4-PARP1-D2. Nucleotide sequences were confirmed by DNA sequencing service (FASMAC, Greiner Japan Inc., Atsugi, Japan) with primers Rv (TAGCAAAATAGGCTGTCCCC) and GL (CTTTATGTTTTTGGCGTCTTCC). The Luc reporter plasmid, pGL4-PIF1 has been constructed as described [42].

4.5. Transient Transfection and Luciferase (Luc) Assay

Luc reporter plasmids were transfected into HeLa S3 cells by DEAE-dextran method in 96-well plates [2], and after 24 h of transfection, the culture medium was changed to 10% probiotic bacterial culture supernatant or control culture containing DMEM with 10% FBS. After a further 24 h of incubation, cells were collected and lysed with 100 μL of 1 x cell culture lysis reagent, containing 25 mM Tris-phosphate (pH 7.8), 2 mM DTT, 2 mM 1,2-diaminocyclohexane-N,N,N’,N’,-tetraacetic acid, 10% glycerol and 1% Triton X-100, then mixed and centrifuged at 12,000 x g for 5 sec. The supernatant was stored at -80 °C. The Luc assay was performed with a Luciferase assay system (Promega) and relative Luc activities were calculated as described previously [5,15,39,40,41,42].

4.6. Western Blot Analysis

Western blot analysis was carried out after SDS-PAGE (15% acrylamide) as previously described [4,5,6], with antibodies against PARP1 (Cat. No. sc-7150), RB1 (Cat. No. sc-50, Santa Cruz Biotechnology, Santa Cruz, CA) and β-actin (Cat. No. A5441, Sigma-Aldrich, St Louis, MO) followed by the addition of horseradish peroxidase (HRP)-conjugated anti rabbit (Cat. No. A0545) or anti mouse IgG (Cat. No. A9917) secondary antibodies (Sigma-Aldrich). Signal intensities were quantified with a ChemiDoc and ImageLab System (BioRad, Berkeley, CA).

4.7. Cell Viability Assay (CCK-8 Assay)

Cell viability assay was carried out with a CCK-8 assay kit (TOYOBO, Tokyo, Japan), according to the manufacturers protocol. Briefly, after 48 h cultivation of HeLa S3 cells with CBCS or a bacterial culture medium containing DMEM/10% FBS, CCK-8 (10 μL) was added to each well. After a further 1 h incubation, A450 was measured with SYNERGY HTX (Agilent Technologies, Santa Clare, CA).

4.8. Statistical Analysis

Standard deviations (S.D.) for each data were calculated and results are shown as means ± S.D. from three independent experiments. Statistical analysis for data in Figure 2, Figure 3, and Figure 7 were performed with the Student’s t-test, and asterisks indicate values of *p <0.05 and **p<0.01.

4.9. Preparation of Total RNAs from HeLa S3 cells and RNAseq Analysis

After 0, 8, 24, 48 h of cultivation with DMEM/10% FBS containing 10% of CBCS or control bacterial culture medium, HeLa S3 cells were harvested, and RNAs were isolated with GenEluteTM Mammalian Total RNA Miniprep kit (SIGMA Aldrich Japan Co Ltd., Tokyo Japan), and the quality was analyzed using an Agilent 2100 bioanalyzer (Agilent technologies, California, CA, USA). RNA sequencing and the data analyses were carried out by Novogene Co. Ltd. (Singapore). The gene expression profiles of CBCS and Control groups were analyzed by the Illumina HiSeq2000 RNA Sequencing system (Illumina, San Diego, CA, USA).

4.10. Identification of Differentially Expressed Genes (DEGs)

Differential gene expression analysis was carried out by Novogene. Briefly, after the quantification of gene expression, statistical analysis of the expression data was done to indicate the differentially expressed genes (DEGs) or significantly expressed genes between two groups if |log2(FoldChange)| > 1, and padj < 0.05.

4.11. Functional Enrichment Analysis

The clusterProfiler [43] software was applied to perform enrichment analysis, including GO Enrichment, DO Enrichment, KEGG and Reactome database Enrichment.

5. Conclusion

The probiotic C. butyricum has been revealed to have health-beneficial effects, including anti-cancer activity [44,45,46]. Moreover, the butyrate, which is the short-chain fatty acid with HDAC inhibitory effect [47], is produced by bacteria in the gut [48]. It not only suppresses tumor genesis but also viral DNA replication [49,50,51]. Additionally, CBCS prominently reduced NFKB gene expression, which may suppress inflammation (Table 2). Although, in this study we used HeLa S3 cells, butyrate has effects that serve to prevent tumor genesis, viral replication, and inflammation in the gut [48]. However, we should not ignore the fact that microbiota, including CB, produce not only butyrate but also other health-beneficial compounds [52].
The ncRNAs are thought to have evolved from what would have originally been junk RNAs [53]. However, recent studies have revealed that the ncRNAs, including micro RNAs (miRNAs), have relevant biological functions and are contained quite abundantly in cells, even affecting cell behavior [54]. Moreover, long ncRNAs (lncRNAs), including MALAT1, NEAT1, and NORAD, have been well studied and revealed to have biologically important functions [55]. Recently, the possibility that some specific miRNAs might be associated with butyrate-induced tumor suppression were examined [56,57]. In this study, it was shown that expressions of many ncRNAs, including various miRNAs, are up-/down-regulated by the CBCS treatment. Some of them or their combinations might play key roles in evoking morphology-changing signals that may accompany cell growth arrest. Finding the most essential ncRNAs that stop cell proliferation but maintain integrity in the DNA-repair system will contribute to developing novel drugs for cancer therapy with much lowered side-effects.

Supplementary Materials

The following supporting information can be downloaded at the website of this paper posted on Preprints.org.

Author Contributions

S.T., Y.U., R.O., S.A., T.O., F.U. constructed Luc reporter plasmids and experiments (transfection assay, preparation of RNAs for RNAseq analysis and western blotting). Y.O. and D.S.W. prepared probiotic bacterial culture supernatants. T.I. and Y.O. collected and analyzed/interpreted the data. Y.O. and D.S.W. interpreted the data and edited the manuscript. F.U. supervised the research work and analyzed/interpreted the data and wrote the manuscript. All authors have read and approved the final manuscript and agree to be accountable for all aspects of the research and for ensuring that the accuracy or integrity of any part of the work are appropriately investigated and resolved.

Funding

The present study was supported in part by a Research Fellowship from TOA BIOPHARMA Co. Ltd.

Data Availability Statement

The RNAseq raw data for interpretation of the data sets is available only when permission was provided by corresponding author F.U. The RNAseq results comparing experimental (CBCS-treatment) with control at 8, 24, and 48 h are shown at the link sites as follows, https://tus.box.com/s/l0om5sh1t34tj6vfn22p2mxw25dmmff5, https://tus.box.com/s/u0xgi6xv6sk7mouc0oi5wjviffy649sd, and https://tus.box.com/s/c1hxekion5lb2r62q5b553hjswj04tpo, respectively.

Acknowledgments

The authors are grateful to Marie Nose for excellent technical assistance. This study was performed with the permission of the recombinant DNA experimental committee admission No.1917 of Tokyo University of Science.
Conflicts of interest: The authors declare that they have no competing interests.

References

  1. Clarke, T.L.; Mostoslavsky, R. DNA repair as a shared hallmark in cancer and aging. Mol. Oncol. 2022, 16, 3352–3379. [Google Scholar] [CrossRef] [PubMed]
  2. Uchiumi, F.; Larsen, S.; Tanuma, S. Application of DEAE-dextran to an efficient gene transfer system. In Dextran: Chemical Structure, Application and Potential Side Effects. Figgs, G.P. (ed.) Nova Science Publishers, Inc., Hauppauge, NY, 2014, pp.143-156.
  3. Takihara, Y.; Sudo, D.; Arakawa, J.; Takahashi, M.; Sato, A.; Tanuma, S.; Uchiumi, F. Nicotinamide adenine dinucleotide (NAD+) and cell aging. In: New Research on Cell Aging and Death. Strakoš, R. and Lorens, B. (eds.) Nova Science Publishers, Inc., Hauppauge, NY, 2018, pp.131-158.
  4. Uchiumi, F.; Shoji, K.; Sasaki, Y.; Sasaki, M.; Sasaki, Y.; Oyama, K.; Sugisawa, S.; Tanuma, S. Characterization of the 5′-flanking region of the human TP53 gene and its response to the natural compound, Resveratrol. J. Biochem. 2016, 159, 437–447. [Google Scholar] [CrossRef] [PubMed]
  5. Uchiumi, F.; Arakawa, J.; Iwakoshi, S.; Ishibashi, S.; Tanuma, S. Characterization of the 5′-flanking region of the human DNA helicase B (HELB) gene and its response to trans-resveratrol. Sci. Rep. 2016, 6, 24510. [Google Scholar] [CrossRef] [PubMed]
  6. Uchiumi, F.; Katsuda, C.; Akui, M.; Kusaka, M.; Tanaka, M.; Asai, M.; Tanuma, S. Effect of the natural compound trans-resveratrol on human MCM4 gene transcription. Oncol. Rep. 2020, 44, 283–292. [Google Scholar] [CrossRef]
  7. Rooks, M.G.; Garrett, W.S. Gut microbiota, metabolites and host immunity. Nat. Rev. Immunol. 2016, 16, 341–352. [Google Scholar] [CrossRef]
  8. Strandwitz, P. Neurotransmitter modulation by the gut microbiota. Brain Res. 2018, 1693, 128–133. [Google Scholar] [CrossRef]
  9. Arai, E.N.; Yoneda, S.; Yoneda, N.; Ito, M.; Tsuda, S.; Shiozaki, A.; Nohira, T.; Hyodo, H.; Kumazawa, K.; Suzuki, T.; et al. Probiotics including Clostridium butyricum, Enterococcus faecium, and Bacillus subtilis may prevent recurrent spontaneous preterm delivery. J. Obstet. Gynaecol. Res. 2022, 48, 688–693. [Google Scholar] [CrossRef]
  10. Saito, R.; Sato, N.; Okino, Y.; Wang, D.S.; Seo, G. Bacillus subtilis TO-A extends the lifespan of Caenorhabditis elegans. Biosci. Microbiota Food Health 2023, 42, 124–130. [Google Scholar] [CrossRef]
  11. Mansour, N.M.; Heine, H.; Abdou, S.M.; Shenana, M.E.; Zakaria, M.K.; El-Diwany, A. Isolation of Enterococcus faecium NM113, Enterococcus faecium NM213 and Lactobacillus casei NM512 as novel probiotics with immunomodulatory properties. Microbiol. Immunol. 2014, 58, 559–569. [Google Scholar] [CrossRef]
  12. Stoeva, M.K.; Garcia-So, J.; Justice, N.; Myers, J.; Tyagi, S.; Nemchek, M.; McMurdie, P.J.; Kolterman, O.; Eid, J. Butyrate-producing human gut symbiont, Clostridium butyricum, and its role in health and disease. Gut Microbes 2021, 13, 1–28. [Google Scholar] [CrossRef]
  13. Ginsburg, E.; Salomon, D.; Sreevalsan, T.; Freese, E. Growth inhibition and morphological changes caused by lipophilic acids in mammalian cells. Proc. Nat. Acad. Sci. USA 1973, 70, 2457–2461. [Google Scholar] [CrossRef] [PubMed]
  14. Waby, J.S.; Chirakkal, H.; Yu, C.; Griffiths, G.J.; Benson, R.S.P.; Bingle, C.D.; Corfe, B.M. Sp1 acetylation is associated with loss of DNA binding at promoters associated with cell cycle arrest and cell death in a colon cell line. Mol. Cancer 2010, 9, 275. [Google Scholar] [CrossRef] [PubMed]
  15. Uchiumi, F.; Miyazaki, S.; Tanuma, S. The possible functions of duplicated ets (GGAA) motifs located near transcription start sites of various human genes. Cell. Mol. Life Sci. 2011, 68, 2039–2051. [Google Scholar] [CrossRef] [PubMed]
  16. Arakawa, J.; Kondoh, H.; Matsushita, T.; Ogino, Y.; Asai, M.; Tanuma, S.; Uchiumi, F. Induction of the human CDC45 gene promoter activity by natural compound trans-resveratrol. Mol. Med. Rep. 2024, 29, 1–9. [Google Scholar] [CrossRef] [PubMed]
  17. Wei, G.H.; Badis, G.; Berger, M.F.; Kivioja, T.; Palin, K.; Enge, M.; Bonke, M.; Jolma, A.; Varjosalo, M.; Gehrke, A.R.; Yan, J.; Talukder, S.; Turunen, M.; Taipale, M.; Stunnenberg, H.G.; Ukkonen, E.; Hughes, T.R.; Bulyk, M.L.; Taipale, J. Genome-wide analysis of ETS-family DNA-binding in vitro and in vivo. EMBO J. 2010, 29, 2147–2160. [Google Scholar] [CrossRef]
  18. Wieratra, I. Sp1: Emerging roles-Beyond constitutive activation of TATA-less housekeeping genes. Biochem. Biophys. Res. Commun. 2008, 372, 1–13. [Google Scholar] [CrossRef]
  19. Hodny, Z.; Li, R.; Barath, P.; Nelson, B.D. Sp1 and chromatin environment are important contributors to the formation of repressive chromatin structures on the transfected human adenine nucleotide translocase-2 promoter. Biochem. J. 2000, 346, 93–97. [Google Scholar] [CrossRef]
  20. Bohan, C.A.; Robinson, R.A.; Luciw, P.A.; Srinivasan, A. Mutational analysis of sodium butyrate inducible elements in the human immunodeficiency virus type I long terminal repeat. Virology 1989, 172, 573–583. [Google Scholar] [CrossRef]
  21. McNabney, S.M.; Henagan, T.M. Short chain fatty acids in the colon and peripheral tissues: A focus on butyrate, colon cancer, obesity and insulin resistance. Nutrients 2017, 9, 1348. [Google Scholar] [CrossRef]
  22. Bridgeman, S.; Ellison, G.; Newsholme, P.; Mamotte, C. The HDAC inhibitor butyrate impairs b cell function and activates the disallowed gene Hexokinase I. Int. J. Mol. Sci. 2021, 22, 13330. [Google Scholar] [CrossRef]
  23. Mathis, D.J.; Oudet, P.; Wasylyk, B.; Chambon, P. Effect of histone acetylation on structure and in vitro transcription of chromatin. Nucleic Acids. Res. 1978, 5, 3523–3547. [Google Scholar] [CrossRef] [PubMed]
  24. Annunziato, A.T.; Frado, L.L.Y.; Seale, R.L.; Woodcock, C.L.F. Treatment with sodium butyrate inhibits the complete condensation of interphase chromatin. Chromosoma 1988, 96, 132–138. [Google Scholar] [CrossRef] [PubMed]
  25. Darnell, R.B. Independent regulation by sodium butyrate of gonadotropin alpha gene expression and cell cycle progression in HeLa cells. Mol. Cell Biol. 1984, 4, 829–839. [Google Scholar] [PubMed]
  26. Chou, J.Y.; Takahashi, S. Control of placental alkaline phosphatase gene expression in HeLa cells: Induction of synthesis by prednisolone and sodium butyrate. Biochemistry 1987, 26, 3596–3602. [Google Scholar] [CrossRef]
  27. Yaginuma, Y.; Westphal, H. Analysis of the p53 gene in human uterine carcinoma cell lines. Cancer Res. 1991, 51, 6506–6509. [Google Scholar]
  28. Negrini, S.; Gorgoulis, V.G.; Halazonetis, T.D. Genomic instability—An evolving hallmark of cancer. Nat. Rev. Mol. Cell Biol. 2010, 11, 220–228. [Google Scholar] [CrossRef]
  29. Lührs, H.; Gerke, T.; Boxberger, F.; Backhaus, K.; Melcher, R.; Scheppach, W.; Menzel, T. Butyrate inhibits interleukin-1-mediated nuclear factor-kappa B activation in human epithelial cells. Dig. Dis. Sci. 2001, 46, 1968–1973. [Google Scholar] [CrossRef]
  30. Jia, J.; Nie, L.; Liu, Yi. Butyrate alleviates inflammatory response and NF-kB activation in human degenerated intervertebral disk tissues. Int. Immunopharmacol., 2020, 78, 2106004. [Google Scholar] [CrossRef]
  31. Ying, X.D.; Wei, G.; An, H. Sodium butyrate relieves lung ischemia-reperfusion injury by inhibiting NF-kB and JAK2/STAT3 signaling pathways. Eur. Rev. Med. Pharmacol. Sci. 2021, 25, 413–422. [Google Scholar]
  32. Pedersen, S.S.; Prause, M.; Williams, K.; Barrès, R.; Billestrup, N. Butyrate inhibits IL-1b-induced inflammatory gene expression by suppression of NF-kB activity in pancreatic beta cells. J. Biol. Chem. 2022, 298, 102312. [Google Scholar] [CrossRef]
  33. Uchiumi, F. Chapter 6 Dysregulation of transcription and human diseases. In Bidirectional Gene Promoters-Transcription System and Chromosomal Structure, 1st ed.; Uchiumi, F., Ed.; Elsevier: USA, 2022; Volume 101, p. 122. ISBN 978-0-12-818787-6. [Google Scholar] [CrossRef]
  34. Kress, H.; Tönjes, R.; Doenecke, D. Butyrate induced accumulation of a 2.3 kb polyadenylated H1(0) histone mRNA in HeLa cells. Nucleic Acids. Res. 1986, 14, 7189–7197. [Google Scholar] [CrossRef] [PubMed]
  35. Vettese-Dadey, M.; Grant, P.A.; Hebbes, T.R.; Crane-Robinson, C.; Allis, C.D.; Workman, J.L. Acetylation of histone H4 plays a primary role in enhancing transcription factor binding to nucleosomal DNA in vitro. EMBO J. 1996, 15, 2508–2518. [Google Scholar] [CrossRef] [PubMed]
  36. Egan, P.A.; Levy-Wilson, B. Structure of transcriptionally active and inactive nucleosomes from butyrate-treated and control HeLa cells. Biochemistry 1981, 20, 3695–3702. [Google Scholar] [CrossRef] [PubMed]
  37. Boffa, L.C.; Mariani, M.R.; Parker, M.I. Selective hypermethylation transcribed nucleosomal DNA by sodium butyrate. Exp. Cell Res. 1994, 211, 420–423. [Google Scholar] [CrossRef] [PubMed]
  38. Li, L.; Sun, Y.; Liu, J.; Wu, X.; Chen, L.; Ma, L.; Wu, P. Histone deacetylase inhibitor sodium butyrate suppresses DNA double strand break repair induced by etoposide more effectively in MCF-7 cells than in HEK293 cells. BMC Biochem. 2015, 16, 2. [Google Scholar] [CrossRef]
  39. Uchiumi, F.; Sakakibara, G.; Sato, J.; Tanuma, S. Characterization of the promoter region of the human PARG gene and its response to PU.1 during differentiation of HL-60 cells. Genes Cells 2008, 13, 1229–1248. [Google Scholar] [CrossRef]
  40. Uchiumi, F.; Watanabe, T.; Hasegawa, S.; Hoshi, T.; Higami, Y.; Tanuma, S. The effect of Resveratrol on the Werner Syndrome RecQ helicase gene and telomerase activity. Curr. Aging Sci. 2011, 4, 1–7. [Google Scholar] [CrossRef]
  41. Uchiumi, F.; Watanabe, T.; Tanuma, S. Characterization of various promoter regions of the human DNA helicase-encoding genes and identification of duplicated ets (GGAA) motifs as an essential transcription regulatory element. Exp. Cell Res. 2010, 316, 1523–1534. [Google Scholar] [CrossRef]
  42. Uchiumi, F.; Watanabe, T.; Ohta, R.; Abe, H.; Tanuma, S. PARP1 gene expression is downregulated by knockdown of PARG gene. Oncol. Rep. 2013, 29, 1683–1688. [Google Scholar] [CrossRef]
  43. Yu, G.; Wang, L.G.; Han, Y.; He, Q.Y. clusterProfiler: An R package for comparing biological themes among gene clusters. OMICS 2012, 16, 284–287. [Google Scholar] [CrossRef]
  44. Stoeva, M.K.; Garcia-So, J.; Justice, N.; Myers, J.; Tyagi, S.; Nemchek, M.; McMurdie, P.J.; Kolterman, O.; Eid, J. Butyrate-producing human gut symbiont, Clostridium butyricum, and its role in health and disease. Gut Microbes 2021, 13, 1–28. [Google Scholar] [CrossRef] [PubMed]
  45. Xu, H.; Luo, H.; Zhang, J.; Li, K.; Lee, M.H. Therapeutic potential of Clostridium butyricum anticancer effects in colorectal cancer. Gut Microbes 2023, 15, 2186114. [Google Scholar] [CrossRef] [PubMed]
  46. Chen, D.; Jin, D.; Huang, S.; Wu, J.; Xu, M.; Liu, T.; Dong, W.; Liu, X.; Wang, S.; Zhong, W.; Liu, Y.; Jiang, R.; Piao, M.; Wang, B.; Cao, H. Clostridium butyricum, a butyrate-producing probiotic, inhibits intestinal tumor development through modulating Wnt signaling and gut microbiota. Cancer Lett. 2020, 469, 456–467. [Google Scholar] [CrossRef] [PubMed]
  47. Steliou, K.; Boosalis, M.S.; Perrine, S.P.; Sangerman, J.; Faller, D.V. Butyrate histone deacetylase inhibitors. Biores. Open Access 2012, 1, 192–198. [Google Scholar] [CrossRef]
  48. Recharla, N.; Geesala, R.; Shi, X.Z. Gut microbial metabolite butyrate and its therapeutic role in inflammatory bowel disease: A literature review. Nutrients 2023, 15, 2275. [Google Scholar] [CrossRef]
  49. Shadan, F.F.; Villarreal, L.P. n-Butyrate mediated inhibition of papovavirus DNA replication in vivo and in cell culture: A mechanistic approach. Virus Genes 2000, 20, 209–216. [Google Scholar] [CrossRef]
  50. Pant, K.; Mishra, A.K.; Pradhan, S.M.; Nayak, B.; Das, P.; Shalimar, D.; Saraya, A.; Venugopal, S.K. Butyrate inhibits HBV replication and HBV-induced hepatoma cell proliferation via modulating SIRT-1/Ac-p53 regulatory axis. Mol. Carcinog. 2019, 58, 524–532. [Google Scholar] [CrossRef]
  51. Shadan, F.F.; Cowsert, L.M.; Villarreal, L.P. n-Butyrate, a cell cycle blocker, inhibits the replication of polyomaviruses and papillomaviruses but not that of adenoviruses and herpesviruses. J. Virol. 1994, 68, 4785–4796. [Google Scholar] [CrossRef]
  52. Qu, R.; Zhang, Y.; Ma, Y.; Zhou, X.; Sun, L.; Jiang, C.; Zhang, Z.; Fu, W. Role of the gut microbiota and its metabolites in tumorigenesis or development of colorectal cancer. Adv. Sci. (Weinh) 2023, 10, e2205563. [Google Scholar] [CrossRef]
  53. Palazzo, A.F.; Koonin, E.V. Functional long non-coding RNAs evolve from junk transcripts. Cell 2020, 183, 1151–1161. [Google Scholar] [CrossRef]
  54. Yan, H.; Bu, P. Non-coding RNA in cancer. Essays Biochem. 2021, 65, 625–639. [Google Scholar] [PubMed]
  55. Kopp, F.; Mendell, J.T. Functional classification and experimental dissection of long noncoding RNAs. Cell 2018, 172, 393–407. [Google Scholar] [CrossRef] [PubMed]
  56. Xiao, Y.; Dai, X.; Li, K.; Gui, G.; Liu, J.; Yang, H. Clostridium butyricum partially regulates the development of colitis-associated cancer through miR-200c. Cell Mol. Biol. (Noisy-le-grand) 2017, 63, 59–66. [Google Scholar] [CrossRef] [PubMed]
  57. Ma, L.; Lyu, W.; Song, Y.; Chen, K.; Lv, L.; Yang, H.; Wang, W.; Xiao, Y. Anti-inflammatory effect of Clostridium butyricum-derived extracellular vesicles in ulcerative colitis: Impact on host microRNAs expressions and gut microbiome profiles. Mol. Nutr. Food Res. 2023, 67, e2200884. [Google Scholar] [CrossRef]
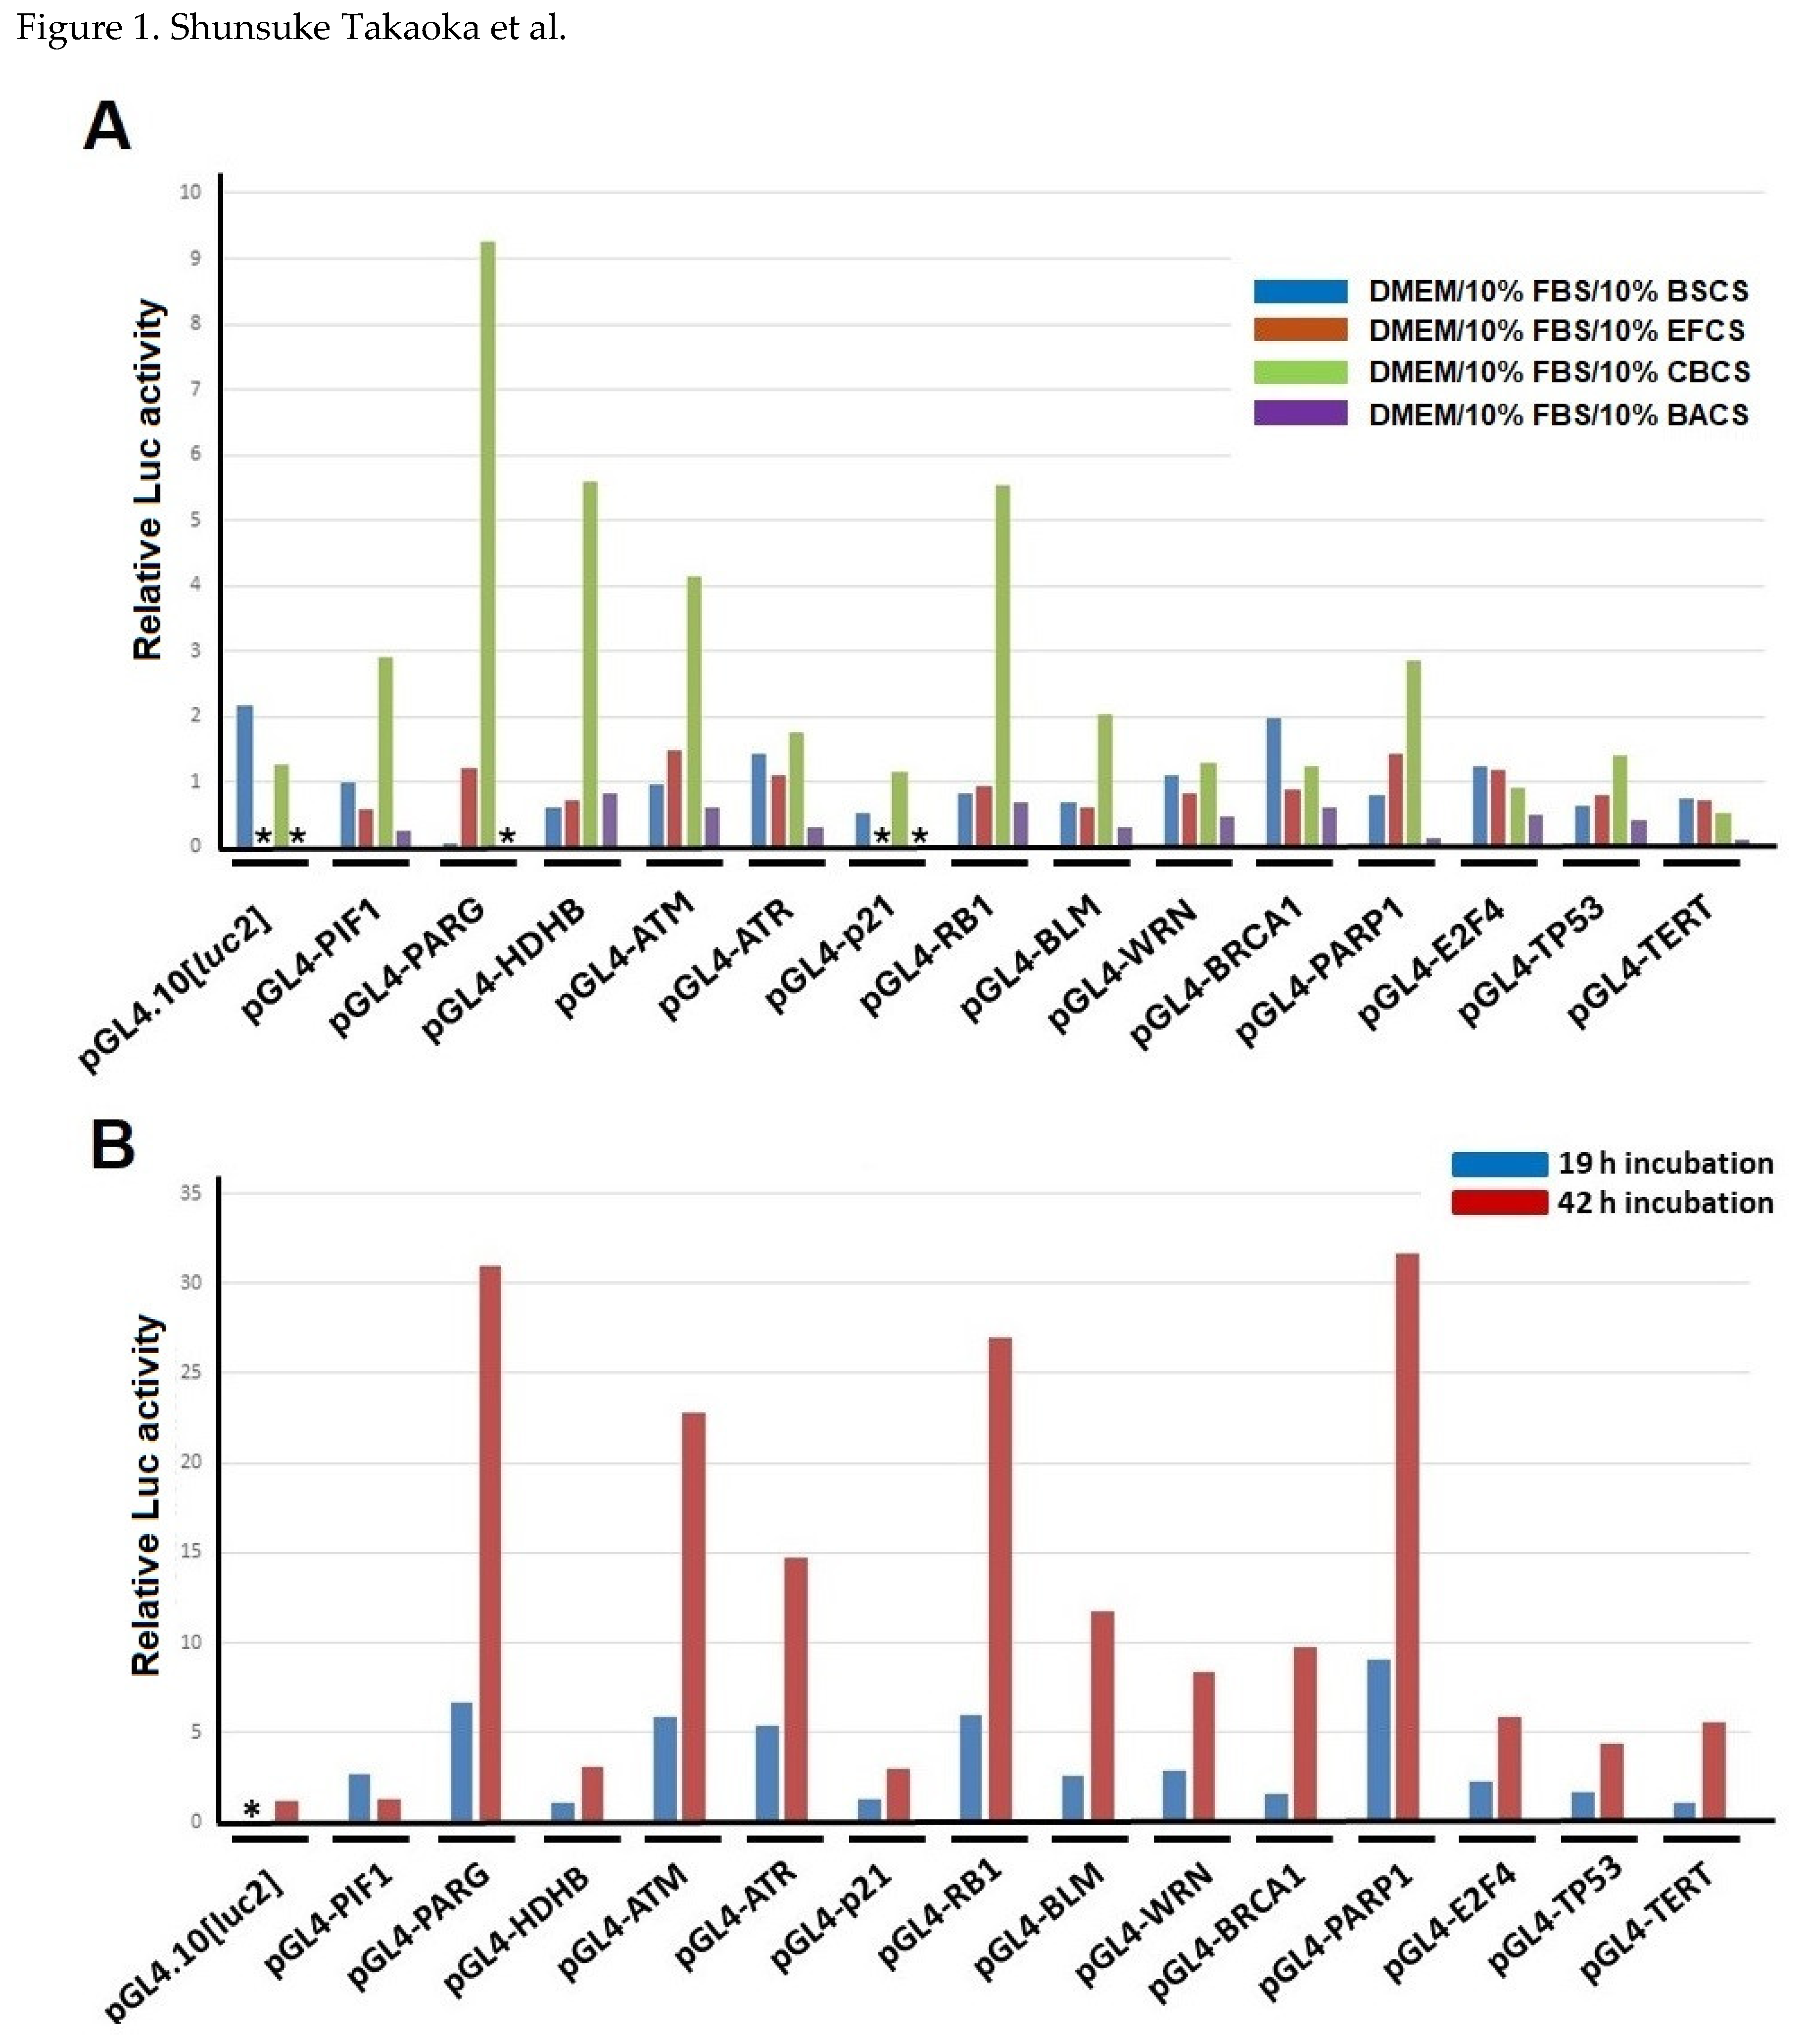
Figure 1. Responses of human gene promoters to bacteria-cultivated supernatants in HeLa S3 cells. (A) Screening of bacteria-cultivated supernatants (BCSs) that can activate human DNA-repair factor-encoding gene promoters. BSCS: Bacillus subtilis TO-A culture supernatant; EFCS: Enterococcus faecium T-110 culture supernatant; CBCS: Clostridium butyricum TO-A culture supernatant; BACS: Bacillus amyloliquefaciens TOA5001 culture supernatant. (B) Effect of CBCS on human DNA-repair factor-encoding gene promoters. Three independent experiments were done. Results show relative Luc activities compared with that of the BCS-nontreated pGL4-PIF1 transfected cells. Asterisks indicate values that were not determined.
Preprints 120339 g001
Figure 2. Morphological changes of HeLa S3 cells after treatment of BCSs. (A) HeLa S3 cells were cultured in a medium containing 10% CBCS or CBCS/BSCS/EFCS mixture (CSM) for 19 h (lower panels). Upper panels indicate HeLa S3 cells that were cultured in a medium with 10% control supernatant for 19 h. (B) HeLa S3 cells were cultured in a medium containing 10% CBCS for 28 and 42 h (lower panels). Upper panels indicate HeLa S3 cells that were cultured in a medium with 10% control supernatant for 28 and 42 h. (C) HeLa S3 cells were cultured in a medium containing 0 (upper left), 1.25 (upper right), 2.5 (lower left), and 5 mM (lower right) of n-butyric acid for 25 h.
Preprints 120339 g002
Figure 3. Inhibitory effect of CBCS on HeLa S3 cell proliferation. HeLa S3 cells (2,500 cells/well) were cultivated in a 96-well plate for 24 h. Then, the culture medium was changed to that containing 0 to 20% of CBCS (red columns) or a control bacterial culture medium (blue columns), and CCK-8 assay was carried out after 48 h incubation at 37 oC with 5% of CO2.
Preprints 120339 g003
Figure 4. Responses of the human gene promoters to n-butyric acid in HeLa S3 cells. HeLa S3 cells were transfected Luc reporter plasmids, including pGL4.10[luc2] and pGL4-PIF1 as negative and positive control vectors, respectively. After 4 h of the transfection, the culture medium was changed to that containing 2.5 mM of n-butyric acid. After further incubation, cells were corrected, and Luc assay was carried out. Averages from three independent experiments with or without n-butyric acid were calculated. Fold activation indicates the ratio of the average Luc activity of butyrate-containing and -non-containing medium cultured results.
Preprints 120339 g004
Figure 5. Levels of ATM, RB1, and PARP1 proteins in HeLa S3 cells. HeLa S3 cells (1 x 10⁶) were cultivated with a DMEM containing 10% FCS for 24 h. Then, culture medium was changed to that containing (A) 10% CBCS or (B) n-butyric acid (2.5 mM). After 0 to 48 h of the medium exchange, cells were corrected, and RIPA buffer extracts were subjected to SDS-PAGE and Western blotting.
Preprints 120339 g005
Figure 6. n-Butyric acid response elements in the human RB1 and PARP1 gene promoters. (A) Deletion experiment of the human RB1 and PARP1 promoters. HeLa S3 cells were transfected Luc reporter plasmids. After 4 h of the transfection, the culture medium was changed to that containing 5 mM of n-butyric acid, and similar experiments were carried out. Averages from three independent experiments with or without n-butyric acid were calculated. Fold activation indicates the ratio of the average Luc activity of butyrate-containing and -non-containing medium cultured results. (B) n-Butyric acid responding core sequences in the 5′-upstream regions of the human RB1 and PARP1. The n-butyric acid responding sequences in the pGL4-RB1D3 and pGL4-PARP1D2 was applied to the JASPAR-2020 program (threshold>95%). Restriction enzyme KpnI and XhoI sites are yellow- and pale blue-highlighted, respectively. The green-highlighted GGAA and TTCC are the core motif that are recognized by transcription factors, including ETS family proteins.
Preprints 120339 g006
Figure 7. Heat map for the RNAseq cluster analysis of differentially expressed genes (DEGs) between samples. HeLa S3 cells that were cultivated with or without CBCS (10%) for 0, 8, 24, and 48 h. Red and green represent up- and down-regulated genes, respectively.
Preprints 120339 g007
Figure 8. Classification of genes by protein coding. The up- (left) and down-regulated (right) genes of 8 (upper), 24 (middle), and 48 h (lower) cultivated HeLa S3 cells were classified further into protein-coding (white pies) or noncoding RNAs (black pies).
Preprints 120339 g008
Figure 9. GO enrichment analysis comparing differential genes of CBCS treated and non-treated HeLa S3 cells. RNA samples were obtained from (A) 8, (B) 24, and (C) 48 h cultivation with or without CBCS (10%).
Preprints 120339 g009
Figure 10. KEGG enrichment analysis comparing differential genes of CBCS treated and non-treated HeLa S3 cells. RNA samples were obtained from (A) 8, (B) 24, and (C) 48 h cultivation with or without CBCS (10%).
Preprints 120339 g010
Table 1. Comparisons of FPKM value between CBCS-treated and non-treated HeLa S3 cells.
Time (h)   8 24 48
Gene CBCS FPKM fold p-value FPKM fold p-value FPKM fold p-value
PIF1 - 4.243928 0.896654 0.604697 5.52694 0.123736 4.59E-11 4.295748 0.137542 5.07E-10
+ 3.805336 0.683883 0.590845
PARG - 8.055117 0.494794 0.013937 6.682184 1.014106 0.902802 7.401787 0.886953 0.547691
+ 3.985623 6.776441 6.565034
HELB - 1.034974 0.921202 0.748394 0.934543 0.471383 0.017126 0.861079 0.743293 0.290985
+ 0.95342 0.440527 0.640034
ATM - 3.14527 0.736635 0.218432 3.311033 1.050696 0.998052 3.869949 0.891405 0.553431
+ 2.316915 3.47889 3.449691
ATR - 6.495218 0.579147 0.040087 5.301323 0.712684 0.176728 5.465636 0.687106 0.13576
+ 3.761683 3.77817 3.75547
CDKN2A - 40.86149 0.66904 0.113326 44.3764 0.30763 2.88E-05 35.56736 0.781209 0.291049
+ 27.33799 13.65149 27.78555
RB1 - 18.129 0.875097 0.515848 16.76921 0.967857 0.771565 20.02231 1.222334 0.611419
+ 15.86463 16.23019 24.47395
BLM - 9.167653 1.289576 0.494121 6.728003 1.382269 0.344308 6.201939 1.918412 0.039864
+ 11.82238 9.299909 11.89788
WRN - 7.16739 0.877522 0.533055 5.909568 0.799329 0.344161 5.718025 0.748446 0.237544
+ 6.289544 4.723689 4.279635
BRCA1 - 17.60425 0.705496 0.162193 15.94288 1.06099 0.977051 15.8065 0.998662 0.843619
+ 12.41973 16.91523 15.78536
PARP1 - 61.14282 0.895026 0.563022 47.50302 1.018003 0.908481 45.8812 0.970177 0.764114
+ 54.72441 48.35821 44.51287
E2F4 - 11.49784 1.340332 0.414959 13.36074 0.680938 0.133485 10.49973 0.691647 0.14477
+ 15.41092 9.097842 7.262107
TP53 - 16.52675 0.492513 0.009924 21.79782 0.203597 6.00E-08 20.15492 0.292592 1.56E-05
+ 8.139646 4.437968 5.897179
TERT - 0.647083 1.291257 0.635664 0.362969 1.783149 0.142159 0.187431 1.122226 1
+ 0.835551 0.647228 0.21034
Table 2. Specific genes that were up-/down-regulated by CBCS treatment.
8 h Up Down
ATP1A3 ATP1B2 ATP2A1 ATF1 DNMT1 DNMT3A
ATP6V1C2 FOSB HIST1H2AC EP300 ELK4 ETS2
HIST1H2AG HIST1H2AG HIST1H2AI LIG3 MCM2 MCM3
HIST1H2BD HIST1H2BJ HIST1H3J MCM5 MCM7 NFKB1
HIST1H4H HIST2H2A4 HIST2H3C PARP2 PARP3 PCNA
HIST2H2BF HIST2H3A HIST2H3D POLA1 POLE POLE2
      POLF RFC3 TP53
      XBP1    
24 h Up Down
ATP1A3 ATP1B2 CDKN1A CDKN2A ETS2 ERBB2
FOS GATA3 IL1A LDHA HK2 NEIL1
IL1B IL6 IL8 NFKB1 PARP3 POLE3
IL21R JUN NFATC1 STAT5A STAT5B STAT6
POLD4 STAT3 STAT4 TP53 XBP1  
48 h Up Down
BDNF EGF FGF18 APP3 LIG1 LIG3
IL1A IL1B IL6 NEIL1 NFKB1 TP53
IL8 IL12A IL12B      
IL18 IL21R IL24      
JUN NFATC1 RELB      
The transcripts that were evaluated as being significant at two time points or more are bold typed.
Table 3. Primer pairs for amplifying 5′-upstreams of the RB1 and PARP1 genes.
Luc plasmid Primer Sequence (5′ to 3′)
pGL4-RB1-D1 hRB1-3590 TTCGGTACCCACGCCAGGTTTCCCAG
AhRB1-3787 AATCTCGAGAAAAACCGGACGCGCCCTC
pGL4-RB1-D2 hRB1-3649 TTCGGTACCAGCGCCCCAGTTCCCCAC
AhRB1-3787 AATCTCGAGAAAAACCGGACGCGCCCTC
pGL4-RB1-D3 hRB1-3707 TTCGGTACCGCGGGCGGAAGTGACG
AhRB1-3787 AATCTCGAGAAAAACCGGACGCGCCCTC
pGL4-PARP1-D1 hPARP1-8202 TTCGGTACCCGGCAGGCGCCCGGGAAACTC
AhPARP1-8041 AATCTCGAGCCGCCACCGAACACGCCGC
pGL4-PARP1-D2 hPARP1-8135 TTCGGTACCGTGGACGCGGGTTCCGTGGGC
AhPARP1-8041 AATCTCGAGCCGCCACCGAACACGCCGC
KpnI and XhoI recognition sequences are bold typed.
Disclaimer/Publisher’s Note: The statements, opinions and data contained in all publications are solely those of the individual author(s) and contributor(s) and not of MDPI and/or the editor(s). MDPI and/or the editor(s) disclaim responsibility for any injury to people or property resulting from any ideas, methods, instructions or products referred to in the content.
Copyright: This open access article is published under a Creative Commons CC BY 4.0 license, which permit the free download, distribution, and reuse, provided that the author and preprint are cited in any reuse.
Alerts
Prerpints.org logo

Preprints.org is a free preprint server supported by MDPI in Basel, Switzerland.

Subscribe

© 2025 MDPI (Basel, Switzerland) unless otherwise stated