Preprint
Essay

Modeling Thunderstorms Using Machine Learning for WA

Altmetrics

Downloads

82

Views

47

Comments

0

This version is not peer-reviewed

Submitted:

06 October 2024

Posted:

07 October 2024

You are already at the latest version

Alerts
Abstract
This research developed and evaluated a machine learning model for predicting thunderstorm frequency, in the Wa region of Ghana, with a focus on its impact for agricultural planning and management. Using a range of meteorological variables including Total Column Water(TCW), Total Column Rain Water(TCRW), and Convective Available Potential Energy (CAPE), the research aim to identify important predictors of thunderstorm occurrence and quantify their relative importance. A Random Forest algorithm was employed to create the predictive model, which was trained and tested on historical weather data. The model demonstrated good predictive capabilities, explaining approximate 72.6% of the variance in thunderstorm occurrences, with a mean absolute error of 2.34 storms and an index of agreement of 0.926. Key findings showed the importance of atmospheric moisture content, particularly TCW and TCRW , in predicting thunderstorm frequency. Atmospheric instability measures, such as CAPE, played a secondary but important role. The model showed strength in capturing overall trends in thunderstorm frequencies but exhibited some limitations in predicting extreme events. The research contributes to the field of meteorology by demonstrating the effectiveness of machine learning techniques in capturing complex atmospheric interactions leading to thunderstorm formation. It also provides a framework for linking thunderstorm predictions to potential agricultural impacts, enhancing the practical applicability of weather forecasting in the agricultural sector. The study lays the groundwork for more sophisticated, localized weather predictions systems that can greatly benefit agricultural planning and broader weather dependent activities in the region. Future research dimensions include exploring advanced feature engineering, integrating temporal and spatial analysis, and developing agricultural impacts models to further enhance the practical utility of thunderstorm predictions.
Keywords: 
Subject: Environmental and Earth Sciences  -   Environmental Science

CHAPTER ONE

1.1. Background

The agricultural landscape, particularly crop productivity, is significantly shaped by climate, which is defined by a long-term series of meteorological conditions. Understanding the nature of climate, its parameters, their relationship with crops, and the changing pattern in climate is important for understanding the importance of modeling thunderstorms using machine learning in Wa. Thunderstorms are powerful and widespread meteorological phenomenon, occurring in various regions across the globe. These intense weather events, characterized by lightning, thunder, heavy rainfall and sometimes hail or strong winds, play a significant role in the earth’s climate system and water cycle, (World Meteorological Organization, 2021). The impact of thunderstorm on agriculture is a matter of growing concern worldwide, particularly in the context of climate change and food security (Lesk et al., 2016). Globally, thunderstorms affect agricultural productivity in many ways. While they can provide essential precipitation for crops especially in rain-fed agricultural systems, their intensity and frequency can also pose a great risk to crop yield (Rosenzweig et al., 2001). Excessive rainfall associated with thunderstorms can lead to soil erosion, nutrient leaching and water logging, all of which can negatively impact plant growth and development. Conversely, the strong winds that often accompany these storms can cause lodging in cereal crops, reducing both yield and quality (Berry et at., 20004). Lightning strikes during thunderstorms can damage crops directly and pose a risk to agricultural systems (Holle, 2008). The need to understand and predict thunderstorms has become important due to their impact on agriculture, which is an important economic sector in many developing countries (FAO, 2021). In recent years, advanced modeling techniques, including machine learning approaches, have shown promise in improving the accuracy of thunderstorm predictions on global scale ( Gijben et al, 2017). These models can integrate various meteorological parameters such as temperature, humidity, wind speed and atmospheric pressure to forecast the likelihood, intensity and duration of thunderstorms (Litta et al., 2012). In sub - Saharan Africa, where agriculture is predominantly rain-fed, the relationship between thunderstorms and crop productivity is particularly important. This region, which includes countries like Ghana, is highly vulnerable to climate variability and extreme weather events (Kotir, 2011). Upper West region of Ghana, where the city of Wa is located, provides a good illustrative case study for examining the impact of thunderstorm on agriculture in the developing country context.
Wa, in the Upper West region of Ghana, experiences a single rainy season from May to October, during which thunderstorms are common(Owusu and Waylen, 2013). Agriculture is the primary economic activity in this region with over 80% of the population engaged in farming (Ghana Statistical Service, 2020). The agricultural sector in Wa, as in much of Ghana, is heavily dependent on rainfall , making it particularly prone to the effects of thunderstorms (Ministry of Food and Agriculture, Ghana, 2022). By accurately predicting thunderstorms occurrences, farmers and agricultural stakeholders in regions like Wa, can make informed decisions about planting dates, crop selection and implementation of protective measures. This can potentially lead to improved crop yields and more sustainable agricultural practices in the face of changing climate patterns (Crane et al., 2011). This research aims to develop a good model for thunderstorms prediction in Wa, Upper West region of Ghana, with specific focus on its application to agricultural productivity. By leveraging machine learning techniques and incorporating local meteorological data, seeking to create a tool that can enhance the resilience of local farming communities to extreme weather events. This research contributes to the broader global effort of understanding and mitigating the impacts of thunderstorms on agriculture, particularly in vulnerable or regions.

1.2. Problem Statement

The Upper West region of Ghana, particularly the area around Wa, faces significant challenges in agricultural productivity due to the predictable nature of thunderstorms. These weather events can be both beneficial and detrimental effects on crop yields, providing necessary rainfall but also potentially causing damage through excessive precipitation, strong winds and lightning. The lack of accurate, localized thunderstorm prediction models hinders farmers ability to make informed decisions about planting, harvesting and implementing positive measures. This problem is further backed by climate change, which is altering traditional weather patterns and increasing the frequency and intensity of extreme weather events. As a result, there is the need for improved thunderstorm modeling specific to the Wa region to enhance agricultural resilience and food security in the face of changing climatic conditions.

1.3. Research Questions

General Research
1.
How can region-specific thunderstorm prediction model be created?
Specific research Questions
  • What are the historical patterns and frequency of thunderstorms in Wa?
  • What is the trend of meteorological conditions in Wa?
  • What main meteorological factors influence thunderstorms formation in Wa?
  • How can a thunderstorm prediction model be created based on historical meteorological data in Wa?
Research objectives
  • To create a thunderstorm prediction model tailored to Wa.
Specific objectives
  • To evaluate historical trends in thunderstorms frequency in Wa.
  • To evaluate the meteorological trends in Wa.
  • To determine the meteorological parameters affecting thunderstorms formation
  • To create a thunderstorm prediction model based on historical meteorological data in WA.

1.4. Significance of the Study

1.4.1. Introduction

In this section we explain why it is important for modeling thunderstorms for the yield of crop production using machine learning in the context of climatic trends:

1.4.2. Farmers’ Climate Adaptation

This investigation provides farmers within the Wa district with useful resources and insights to help them deal with the climate shifts. Farmers may choose the best crops and manage the growing dates, use of resources, and yields by predicting yields of crops responses to climatic factors.

1.4.3. Food Security

Increasing agricultural yield is a crucial first step towards raising food security. By creating precise models, we aid in the sustainable cultivation of staple crops, preventing food shortages, and assuring a steady supply of food for everybody.

1.4.4. Effective Resource Use

Precision methods of agriculture based on machine learning can assist with ensuring the best use of resources, such as type of crop suitable under certain climatic conditions in relation to farmers utilizing water on crops because of climatic conditions.

1.4.5. Climate Adaptation

Encouraging agriculture that is climate resilient is important in dealing with of change in the climate. This research supports the development of agricultural resilience by discovering crop varieties and their yield that can endure climatic issues.

1.4.6. Policy Formulation

The results of this research can help agricultural organizations and policy makers develop successful policies for climate-resilient agriculture. It can direct financial investments in agricultural support structures, infrastructure, and research.

1.4.7. Improvement of scientific understanding

This research adds to the increasing body of knowledge on climate-smart agriculture by utilizing machine learning to explore the complex link between climatic parameters and crop yield. It provides insightful information about modeling methods and their uses in agricultural research.

1.4.8. Local and International Relevance

Although Wa district is the focus of this study, its techniques and conclusions may be more broadly applicable to other agricultural areas experiencing comparable climatic issues.

1.5. Scope of Study

In the context of changing climatic factors, this research prioritizes using of machine learning approaches to model thunderstorm output. It intends to offer insightful analysis and useful information the thunderstorms within the district of Wa.
Wa district serves as the study’s main geographic focus. The district, which located in Ghana’s Upper West Region, is notable by several agricultural activities. The models created and the study results will be adapted to the unique climatic and agricultural characteristics of this area. The objective of this study is to identify long-term climatic patterns and their effects on agricultural yield by analyzing historical data on thunderstorms covering some selected years.

1.6. Organization of The Study

The study is organized into five (5) chapters. Chapter one (1), which is the introductory chapter covers the background of the study, Problem Statement, Research Questions, Research Objectives, Research Methodology, Data Analysis and Presentation, Significance of the study and Scope of the study. Chapter two (2) focuses on the Profile of the Wa district. Major items in the chapter include the Geo-Physical characteristics, Social and Demographic characteristics, the Economic characteristics of the district and spatial organization of the area. The third chapter reviews relevant existing literature related to the subject matter of the study. Data analysis and presentation will be done in Chapter Four (4) while chapter five (5) consists of a discussion of the major findings, conclusion, and recommendations.

CHAPTER TWO

2.1. Literature Review2.2. Introduction
This section is aimed to provide an overview of existing research and scholarly work related to thunderstorms frequency, agriculture, climate change and Machine learning. thunderstorm productivity is an important component of food security and agricultural sustainability. Accurate modelling is important for crop yield for making good for informed decision in agriculture, resource allocation, and understanding the impact of climate change on food production. In recent times, machine learning has gained popularity as valuable tool for predicting a lot of environmental issues and concerns, such as predicting the weather, Tsunami, and other environmental pollution.
Machine Learning Algorithms
Machine learning offers a robust framework for handling the mixed nature of agriculture data and complex interactions between various factors affecting crop yields. These factors include soil quality, weather conditions, seed variety and farming practices. ML algorithms can process large datasets to identify patterns and relationships that are not immediately apparent to human analysts. Despite the potential of ML in agriculture, several challenges persist. Data quality availability are often limiting factors. High quality and refined data are required to trained models effectively.
Additionally, the selection of relevant features and the interpretation of ML model’s outputs are important for providing actionable insights and there are challenges to them for instance, feature selection can be a challenge in modeling, especially when dealing with high-dimensional data or datasets with a large number of variables. The process of feature selection aims to identify the most relevant and informative features (variables) that contribute to the predictive power of the model while removing irrelevant or redundant features. As the number of features increases, the complexity of the model also increases, leading to higher computational costs and potential overfitting issues (Bellman, 1961). Irrelevant or redundant features can introduce noise and misleading patterns, making it harder for the model to learn the underlying relationships effectively (Guyon & Elisseeff, 2003). Models with a large number of features can become difficult to interpret and understand, especially in domains where interpretability is essential, such as healthcare or finance (Ribeiro et al., 2016). In some cases, features may be highly correlated with each other, leading to multicollinearity issues (Dormann et al., 2013). This can cause instability in the model’s parameter estimates and make it challenging to determine the individual contribution of each feature. In certain domains, such as text mining or genomics, the number of features can be extremely large compared to the number of observations. Feature selection becomes crucial in these scenarios to identify the most informative features and avoid overfitting (Saeys et al., 2007).
Many advanced machine learning models, such as neural networks or ensemble methods, are often criticized for being “black boxes,” (Khaki, S., & Wang, L. 2019) meaning that it’s difficult to understand the internal workings and the specific contributions of each feature to the final output. This lack of interpretability can be problematic in the agricultural domain, where stakeholders (farmers, policymakers, researchers) may want to understand the underlying relationships and mechanisms driving crop productivity. According to Shahhosseini et al.(2020) interpreting the models becomes even more challenging when dealing with complex interactions and non-linear relationships between the features and the target variable (yield). In research conducted by Cao et al. (2021) they highlighted that the interpretability of machine learning models remains a challenge, which limits their ability to provide meaningful insights into the underlying mechanisms and interactions between environmental factors and crop growth processes.
Recent studies by Priyatikanto et al. (2023) have focused on improving the accuracy and reliability of ML models for crop yield prediction. For instance, a systemic review by Assous et al. (2023) highlighted the importance of selecting appropriate ML methods and features that can analyze large amounts of data and provide accurate results in this they developed sustainable ML mode; to crop yields in the Gulf countries, emphasizing the impact of variables like rain, temperature changes and nitrogen fertilizer.
Thunderstorms are meteorological event that have been studied widely due to their impact on agriculture and human activities. Doswell (2001) describes the three key factors necessary for thunderstorm formation: moisture, instability and a lifting mechanism. The intensity and frequency of thunderstorms are influenced by various factors including temperature, humidity and atmospheric dynamics (Markowski and Richardson, 2010). In West Africa, including Ghana, thunderstorms are often associated with the movement of inter tropical convergence zone( ITCZ) Nicholas (2018) explains that the seasonal migration of the ITCZ plays a key role in determining the timing and intensity of thunderstorms in a region.
The relationship between thunderstorms and agricultural productivity is diverse. While thunderstorms can provide necessary rainfall for crop growth, they can also lead to significant damage. Rosenzweig et al (2001) highlights how extreme precipitation events, often associated with thunderstorms, can lead to soil erosion, water logging and nutrients leaching, all of which negatively impacts crop yields. In Ghana specifically Antwi-Agyei et al. (2014) found that extreme weather events including intense thunderstorm, contribute to crop failures and food insecurity, particularly in the Northern region where Wa is located. Their study emphasizes the need for improved weather forecasting and agricultural adaptation strategies.
Advances in technology and data analysis have led to great improvements in thunderstorms modeling. Traditional approaches often relied on numerical weather predictions (NWP) models. However, as pointed out by Gijben et al., (2017), machine learning techniques have shown promising results in improving the accuracy of thunderstorm predictions. Litta et al., (2012) demonstrated the effectiveness of artificial neural networks in predicting thunderstorm occurrence, using parameters such as temperature, humidity and wind speed. Their model showed improved accuracy compared to traditional statistical methods. In the African concept, Thiaw et al., (2017) used a combination of satellite data and machine learning algorithms to predict extreme precipitation events, including those associated with thunderstorms.
The use of thunderstorms predictions lies in their ability to inform agricultural decision making. Crane et al., (2011) emphasizes the importance of understanding local farming practices and decision making processes when developing weather based agricultural advisory service. In Ghana, Naab et al., (2019) found that farmers in Upper West, where Wa is located, increasing rely on weather forecasts for making planting decisions . However, they also noted challenges in forecast interpretation and the need for more localized, user friendly prediction tools.
Climate change is expected to change thunderstorm patterns globally. Taylor et al., (2017) shows that warming temperatures may lead to more intense thunderstorms in parts of Africa including Ghana. This shows and relay the need for adaptable modeling approaches that can account for changing climate dynamics. Sylla et al., (2016) used regional climatic models to project future rainfall patterns in West Africa, including a potential increase in extreme precipitation events, including those associated with thunderstorms, particularly in the latter half of the 21st century.
The impact of thunderstorms on crop yield have been studied extensively. Lesk et al., (2016) conducted a global analysis of extreme weather disasters and their efforts on crop production, finding that droughts and extreme heat greatly reduced national cereal production, while the impact of flood and extreme cold were generally less severe. However they noted that the effects varied regionally, emphasizing the need for localized studies . In West Africa, Roudier et al., (2011) reviewed the potential impact of climate change on crop yields, highlighting the vulnerability of rain fed agriculture to changes in precipitation patterns, including those associated with thunderstorms.
The use of remote sensing and satellite data has greatly increased our ability to monitor and predict thunderstorm activity. Sorooshian et al., (2000) demonstrated the potential of satellite based precipitation estimates for hydrological modeling and water resource management, which is particularly relevant for understanding the impact of thunderstorm on agriculture. Building on this, Huffman et al., (2007) developed the tropical rainfall measuring mission (TRMM) multi satellite precipitation analysis, which has been widely used for studying precipitation patterns in tropical regions, including west Africa.
In terms of agricultural adaptations to extreme weather events, Howden et al., ( 2007) emphasized the importance of developing crop varieties that are more resilient to climate variability. This approach could be particularly relevant in regions like Wa, where thunderstorms pose a risk to crop production. Additionally, Di Falco and Veronesi (2013) studied the role of crop diversification as an adaption strategy in Ethiopia, finding that it significantly increased farm productivity in the face of climate variability.
The Integration of indigenous knowledge with modern forecasting techniques presents an opportunity for more comprehensive and locally relevant thunderstorms prediction models. Cudjoe et al., (2014) explored the precipitation and indigenous knowledge of climate change in Ghana, highlighting the potential for combining traditional and scientific approaches to weather forecasting. Similarly, Nyong et al., (2007) discussed the value of indigenous knowledge in climate change mitigation and adaptation strategies in the African Sahel.
While progress has been made in thunderstorm modeling and understanding it’s agricultural impacts, several gaps remain. There is a need for more localized studies, particularly in regions like Wa, where the link between thunderstorm and agriculture is an issue but understudied. The development of user friendly, localized predictions tools that integrates multiple data sources and account for climate change projections remain a challenge.
Crop productivity. A study by Antwi-Agyei et al. (2012) examined the effects of climate variability and change on food security in some regions of ghana which Northern region happens to be part of that study. They highlighted the region’s variability to drought, downpour of unexpected rains and high temperature which has affected the regions crop productivity and low yield in certain crops. Cedric et al. (2022) in their work “crops yield prediction based on machine learning models: Case of West African countries”, examined the high impact climate and other factors has on crop productivity yield which is dwindling the agricultural zones in most regions in Ghana and other African Countries.
Climate change impact on Agriculture
The impact of climate change on agriculture has been a topic of considerable research since it has become a global priority to ensure food security. The United Nations framework convention on climate change (UNFCC, 2014) and the International Panel on Climate Change (IPCC, 2014) have highlighted the risks associated with changing climate patterns, including shifts in rainfall patterns and the increasing temperatures in Africa. These changes can significantly affect crop yield and agricultural practices. Lobell et al. (2012) conducted a study on the influence of climate change on global crop productivity which Africa was highlighted. Their findings mark the importance of modeling and predicting climate change impacts on crop productivity, aligning with the objectives this study carries.
Sustainable Agriculture and Food Security
Achieving sustainable agriculture and food security is shared goal among data scientist, researchers, policymakers, and international organizations. The Ministry of food and agriculture and the Food and Agriculture Organization (2020) has consistently stressed the importance of sustainable practices to ensure food security in the face of growing economy and environmental shift. Sustainable agricultural practices such soil management, water management, proper information to farmers and available data for researchers, play important role in the achieving better crop yield. Oikonomidis et al.,2023) in their research: Deep learning for crop yield prediction, gave insights into the resilience for sustainable African agriculture. They emphasis on the need to integrate modern technology and sustainable practices to ensure better crop yield and eliminate hunger.
Machine Learning in Agriculture
Machine learning (ML) has changed various fields, including agriculture. ML techniques, such as decision trees, support vector Machine (SVM), and neural networks (NN) have shown promise in predicting crop yield (Cedric et al., 2022). Naveen et al. (2022) in their work emphasized that the ability to analyse big datasets and capture complex relationships between the climate and crop performances makes ML a powerful tool in the agricultural and other field.
Crop yield and climate parameters, Buenor et al. (2023) in their work emphasized that, in crop growth and yield climate parameters play a big role. Rainfall, temperature, sunlight, and humidity are among key factors that that influences crop productivity. Understanding how these parameters act or interact with specific crops is good for effective modelling. ML algorithms excel in capturing in capturing non-linear between climate parameters and crop yield, giving advantages over traditional statistical methods (Lontsi et al.,2022)
In a work conducted by Subhadra et al. (2016) they developed a model for corn and soybean yield forecasting with climatic aspect by applying artificial neu ral network. They have considered the rainfall, Maryland corn and soybean yield data and predict the corn and soy bean yield at state, regional and local levels by applying both the artificial neural network technique and the mul tiple linear regression model. Lastly, they compared both the techniques and conclude that the ANN model gives more accurate yield prediction than the multiple linear regressions. Crop-climate interaction modeling., determining the climatic parameters affecting yields requires an understanding of the complex interactions between crop growth stages, environmental conditions, and management practices(Veenadhari et al.,2014)
Machine learning is a realistic method that can provide better yield prediction based on many attributes. It is a subdivision of Artificial Intelligence (AI) that focuses on learning. Machine learning (ML) can discover information from datasets by identifying patterns and correlations. The models must be trained using datasets that represent prior experience-based outcomes(Wigh et al.,2022). Crop simulation models, such as DSSAT (Decision Support System for Agrotechnology Transfer) and APSIM (Agricultural Production Systems Simulator), can be useful tool for exploring these interactions and quantifying the impacts of climate variables on crop yields (Jones et al., 2003; Keating et al., 2003)
In a work conducted by Veenadhari et al. (2014) they came up with a website designed as an interactive software tool for predicting the influence of climatic parameters on the crop yields. C4.5 (The C4.5 is a popular decision tree algorithm used for classification tasks in machine learning and data mining.) algorithm is used to find out the most influencing climatic parameter on the crop yields of selected crops in selected districts of Madhya Pradesh. This software provides an indication of relative influence of different climate parameters on the crop yield, other agro-input parameters responsible for crop yield are not considered in this tool, since, and application of these input parameters varies with individual fields in space and time. Based on the C4.5 algorithm, decision tree and decision rules have been developed, which are displayed when icon decision tree is selected. This website went under massive data training and finally went under ML training to be to give the results. Using the developed software, the influence of climatic parameters on crop productivity in selected districts of Madhya Pradesh was carried out for predominant crops. For Soybean crop in all the selected districts, the most influencing parameter was found to be cloud cover, for paddy crop it was found as rainfall, for maize crop it was maximum temperature and for wheat crop the minimum temperature. Their work aligns with my where crop which are being modeled are against climate parameters
Several agricultural, soil, and environmental elements such as temperature, humidity, rainfall, moisture, and pH have an impact on agricultural production. Farmers continue to use the traditional methods they learned from their forefathers. However, the issue is that back then, when the climate was quite wholesome, everything went on schedule. Many things, however, have changed because of global warming and numerous other variables (Morales and Francisco, 2023). The various existing methods have solved these issues but also have several drawbacks such as low spatial resolution, more challenges in real-time implementation, minimal accuracy rate, etc. Because of this concern, a novel technique called interfused machine learning with an advanced stacking ensemble model is introduced for accurate prediction of various crops. The impact of changing climatic conditions on crop productivity and yield is an important of research. Studies have shown that rising temperatures can lead to heat stress, negatively affecting crop growth and reducing yields (Lobell and Gourdji, 2012). Additionally, shifts in precipitation patterns, including increased frequency of droughts and intense rainstorms, can limit the availability water for crops, causing yield reductions or crop damage from flooding (Lobell et al, 2011). A well detailed review of these climatic impacts on various crops and region is necessary to understand the extent and mechanisms of these effects.
Ensemble modeling techniques, to improve the accuracy and robustness of crop production models, ensemble modeling techniques can be employed. These techniques combine multiple machine learning algorithms or models, leveraging their strength and mitigating their weakness. (Paudel et al, 2021). Ensemble methods, such as, boosting, bugging, and stacking, can enhance predictive performance of crop yield productivity models.
An ML model can be descriptive or predictive, depending on the research topic and questions. Predictive models use past knowledge to predict what will happen in the future. Descriptive templates, on the other hand, help to describe how things are now or what happened in the past. (Bali et al, 2022) Machine learning could help predict agricultural yields and decide which crops to sow and what to do during the growing season. Several machine learning algorithms were deployed to enhance the agricultural yield forecast investigation. Crop yields have lately been predicted using machine learning approaches such as multivariate regression, decision trees, association rule mining, and artificial neural networks (Kavita, and Mathur, 2021). There is the need to do spatial modeling and interpolation, crop yield and climate data often exhibit spatial variability, requiring spatial modeling and interpolation techniques to capture this variability. (Raju et al., 2023). Methods like kriging, inversing distance weighting, and regression-based techniques can be used to interpolate point-based data into continuous surfaces, enabling the inclusion of spatial dependencies in crop yield models. (Li & Heap., 2011).
The application of machine learning and AI in precision agriculture has gained a good attention, considering the new built libraries and frameworks. Abhinav et al. (2022) provides a well detailed review on machine learning applications, including early disease diagnosis through image analysis, weather forecasting using time-series models, crop tracking using remote sensing data, and resource optimization through predictive models. These techniques can improve crop management, increase yield, and reduce resource waste. Machine learning is a realistic method that can provide better yield prediction based on many attributes. It is a subdivision of Artificial Intelligence (AI) that focuses on learning. Machine learning (ML) can discover information from datasets by identifying patterns and correlations. The models must be trained using datasets that represent prior experience-based outcomes (Wigh et al,, 2022). The predictive model is built using a range of characteristics, and the parameters are calculated using previous data throughout the training phase. Machine learning models assume the output (crop yield) to be a non-linear function of the input variables (area and environmental factors)(Kavita, and Mathur, 2021).
Another work was conducted by Paudel et al.(2021) who combined agronomic principles of crop modeling with machine learning to de- sign a machine learning baseline for large-scale crop yield prediction. Their baseline was a workflow emphasizing correctness, modularity, and reusability. Their features were created by using crop simulation outputs and weather, remote sensing, and soil data from the MARS Crop Yield Forecasting System (MCYFS) database. In their proposed workflow, three machine learning algorithms namely Gradient boosting, Support Vector Regression(SVR), and k-Nearest Neighbors was used to predict the yield of soft wheat, spring barley, sunflower, sugar beet, and potato crops at the regional level in the Netherlands, Germany, and France. Sun et al proposed a novel multilevel deep learning model coupling Recurrent Neural Network (RNN) and Convolutional Neural Network (CNN) to extract both spatial and temporal features to predict crop yield. The main aims of their work were to evaluate the performance of the proposed method for corn belt yield prediction in the US Corn Belt and to evaluate the influence of different data sets on the pre- diction task. They used both time-series remote sensing data, soil property data, as the inputs. Their experimentation was done in the US Corn Belt states to predict corn yield from 2013 to 2016 at the county level.
Khaki et al. (2018) developed a Deep Neural Network-based solution to predict yield, check yield, and yield difference of corn hybrids based on genotype and environmental (weather and soil) data. Their work was carried out as part of the 2018 Syngenta Crop Challenge. Their model was found to predict with very good accuracy, with a RMSE of 12% of the average yield and 50% of the standard deviation for the validation dataset using predicted weather data. In their other paper work, the authors in Khaki et al. (2020) implemented a hybrid model which combines convolutional neural networks (CNNs), fully connected layer and recurrent neural networks (RNNs) to estimate the yield of corn and soybean. This model outperformed random forest (RF), deep fully connected neural networks (DFNN), and LASSO with a root mean square error of 9% and 8% of the respective average yield of corn and soybean. In this work, the CNNs were used to extract features from weather and soil datasets. The fully connected layer then combines the high-level features from the CNNs into the RNN including the yield data for the prediction analysis. Predictive learning models have been proposed to classify sugarcane yield grade with input features such as plot characteristics, sugarcane characteristics, plot cultivation scheme and rain volume. The machine learning models used in this work are random forest and gradient boosting trees. The accuracies of both models were compared to two non-machine learning models and they outperformed these models with 71 . 83% and 71 . 64% of random forest and gradient boosting tree respectively. Additionally, the authors noticed that both machine and non-machine learning models analyze yield grade 3 incorrectly from the confusion matrices, which they suggested to explore in future and find the cause Charoen-Ung et al. (2018).
Kaneko et al. recently proposed a crop yield study focusing on African countries. They used a deep learning architecture on satellite im- age data to predict maize at the district level in six countries in Africa: Ethiopia, Kenya, Malawi, Nigeria, Tanzania, and Zambia. Their model predicted with an R 2 of 0,56. We take another direction by using cli- mate, chemical, and agricultural parameters. The impacts of climate change are most evident in crop productivity because this parameter represents the component of greatest concern to producers, as well as consumers (Hatfield et al., 2015)
The use of ML in agriculture is promising as it assists farmers, policy-makers and other stakeholders in agriculture in making intelligent decisions. Machine learning applications in agriculture will enhance the optimized use of resources for the cultivation and harvesting of crops and the production of livestock. Proper management of pests and dis- eases on-farm can lead to an increase in quality farm produce. Image processing was used to detect diseases and spread of disease on leaf and fruits, and weight of mango Jhuria et al. (2013). Additionally, use of ML has been employed to detect and classify laurel wilt disease from healthy leaves for an effective disease management Abdulridha et al. (2018). Another use of ML in agriculture is in crop yield prediction. Forecasting crop yields enhances crop management, irrigation scheduling, and labor requirements for harvesting and storage Alibabaei et al. (2021).
Preprints 120380 i001
Explanation of the Conceptual Framework diagram
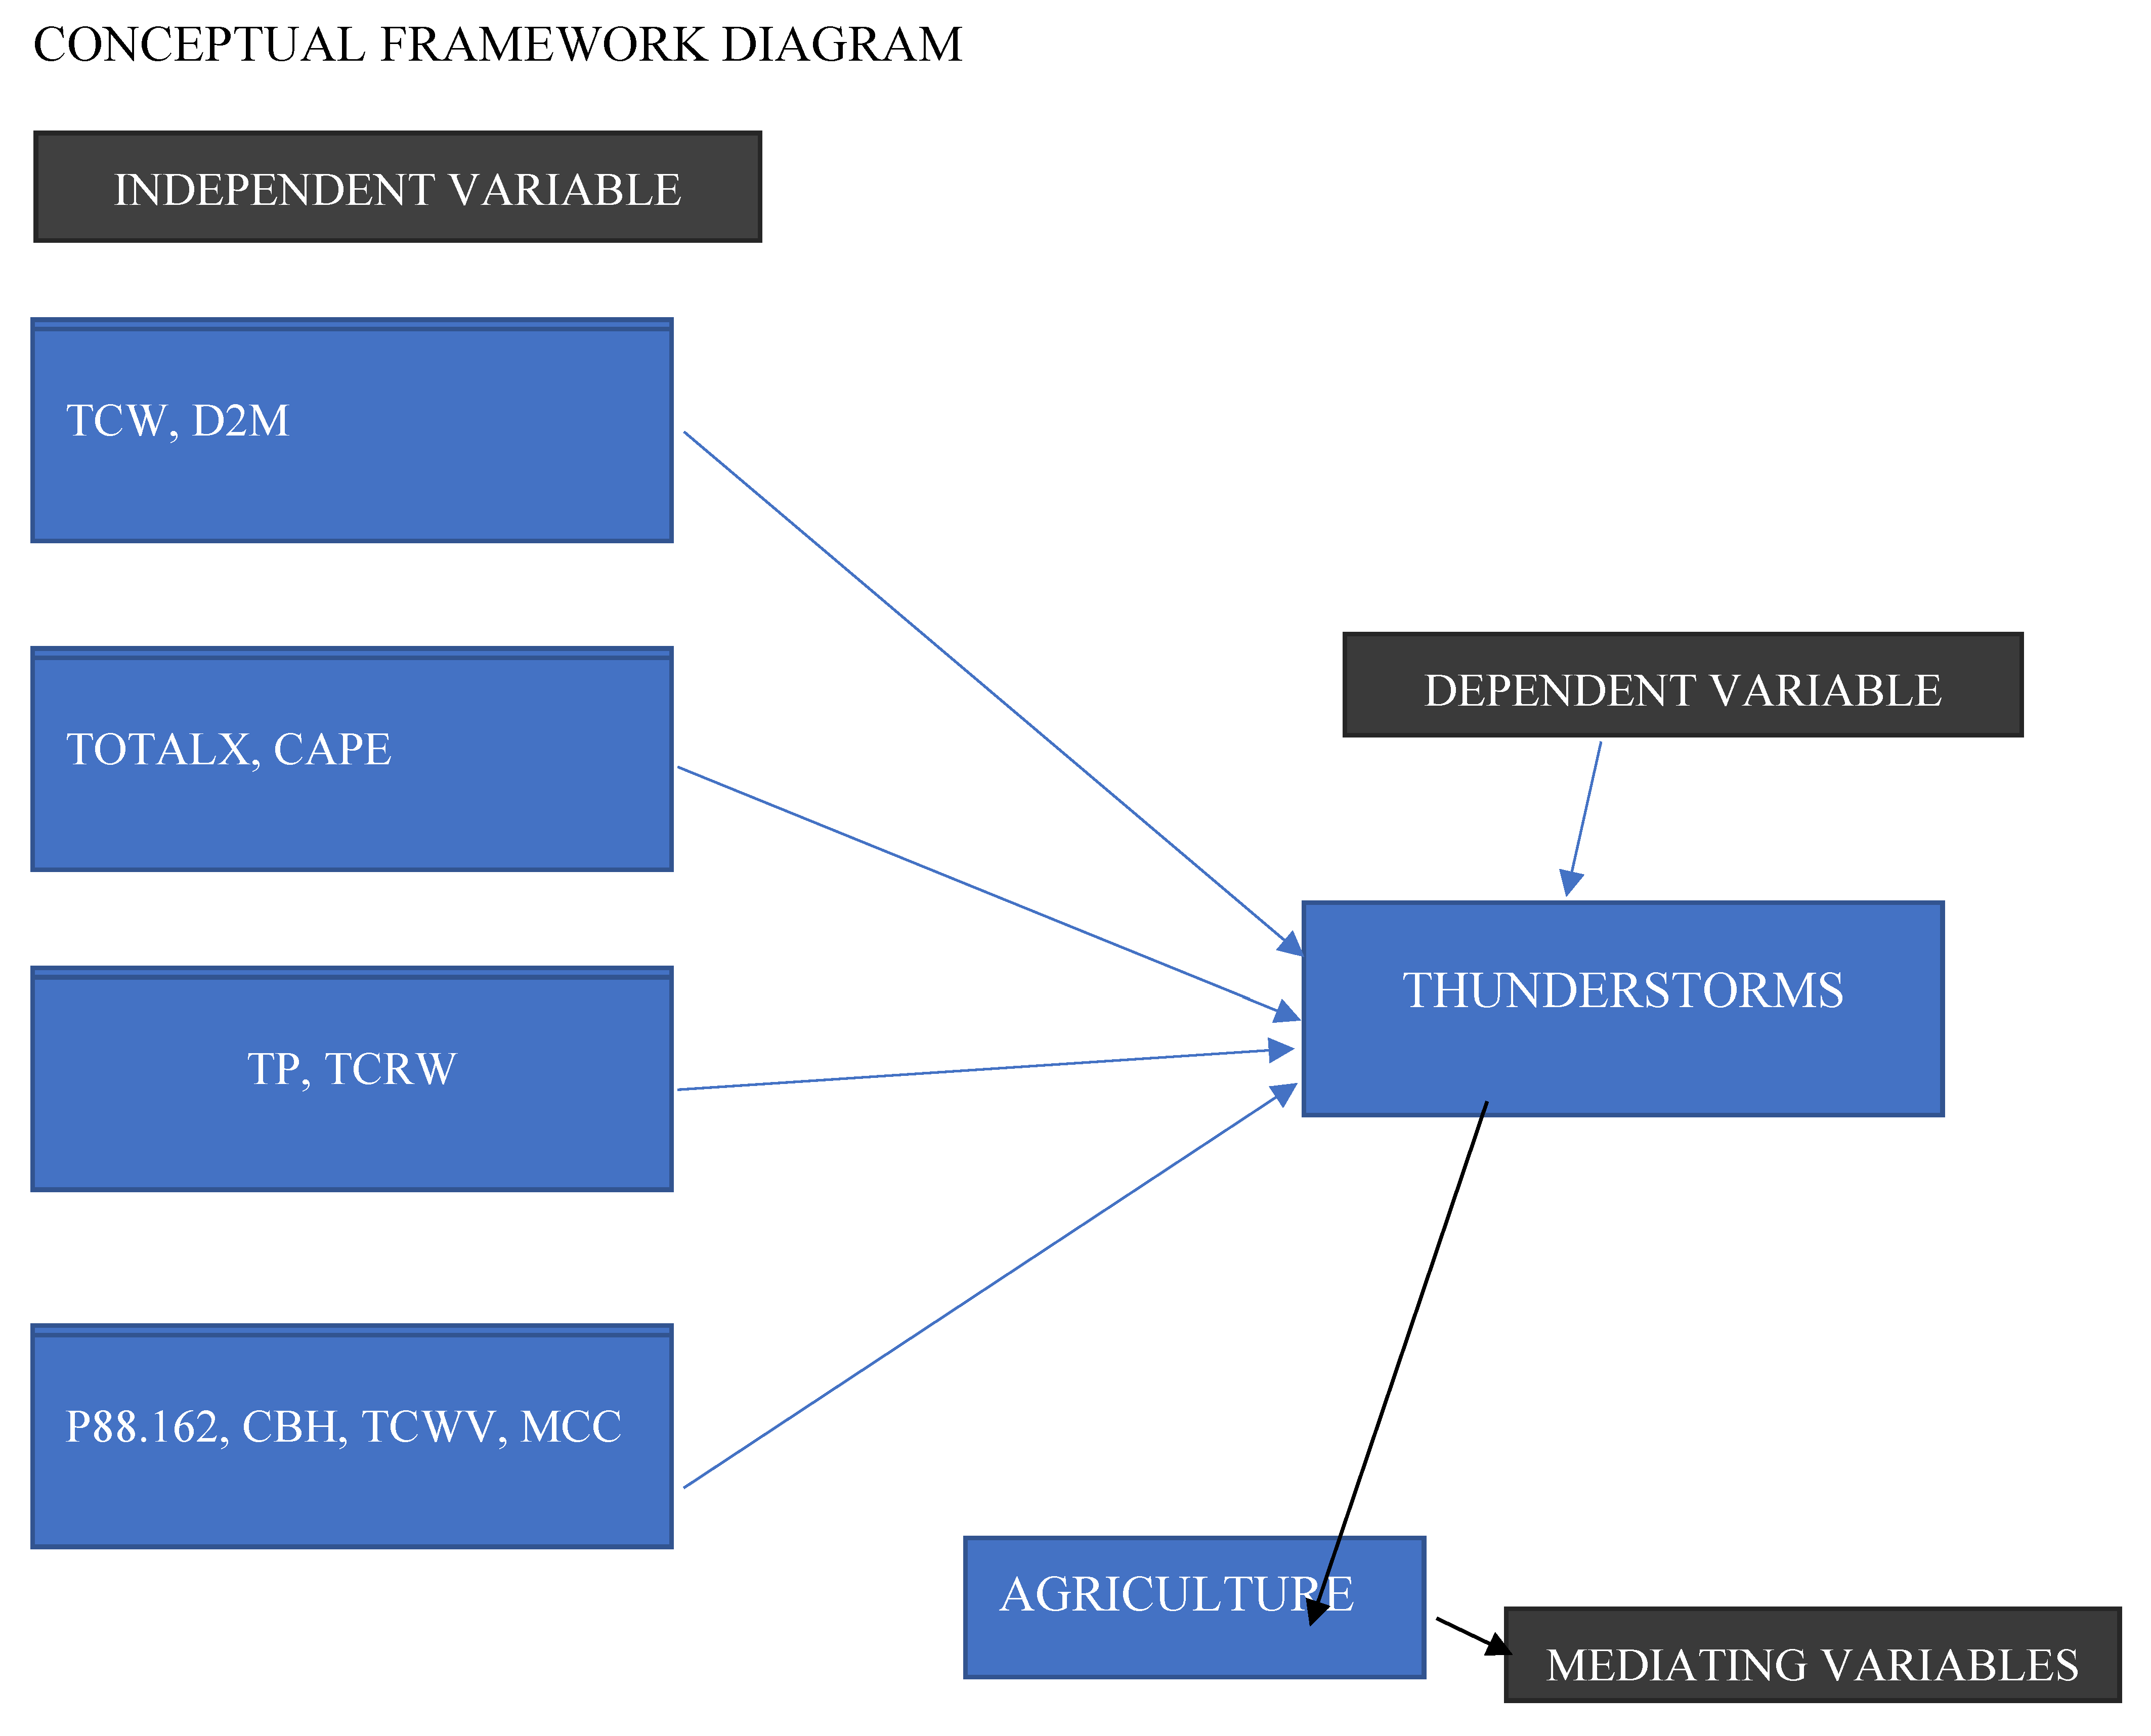
This conceptual framework shows the diverse link of atmospheric variables that contribute to thunderstorm formation and their impact on agriculture. The framework is structured into three main components: independent variables, the dependent variable, and a mediating variable.
Independent Variables:
The framework identifies four groups of independent variables that are hypothesized to influence thunderstorm occurrence:
  • TCW, D2M: Total Column Water and Dew Point at 2 meters. These variables represent atmospheric moisture content, which is important for thunderstorm development.
  • TOTALX, CAPE: TOTALX , a stability index and Convective Available Potential Energy. These parameters show atmospheric instability, an important factor for thunderstorm formation.
  • TP, TCRW: Total Precipitation and Total Column Rain Water. These variables show the presence of water in the atmosphere, both as potential rain and as existing precipitation.
  • P88.162, CBH, TCWV, MCC: This group includes Vertical integral of eastward cloud liquid water flux (P88.162), Cloud Base Height (CBH), Total Column Water Vapor (TCWV), and Mesoscale Convective Complexes (MCC). These variables represent a mix of atmospheric conditions that can influence thunderstorm development or formation.
Dependent Variable:
THUNDERSTORMS: This is the primary outcome of interest in the model. The framework is showing that the occurrence and characteristics of thunderstorms are directly influenced by the independent variables listed above in the independent variables.
Mediating Variable:
AGRICULTURE: The framework shows that thunderstorms have an impact on agriculture, positioning agriculture as a mediating variable. This shows that the research takes into consideration not just the formation of thunderstorms, but also their effects on agricultural systems.
This conceptual framework provides a good view of the thunderstorm prediction model, including both the meteorological factors contributing to thunderstorm formation and the broader impact of these storms on agricultural systems. It shows the difference of thunderstorm prediction by including a wide range of atmospheric variables and appreciates the practical importance of accurate forecasting for the agricultural sector. The framework aligns well with the feature importance results discussed, particularly the importance of moisture-related variables (TCW, TCRW) in predicting thunderstorms. It also provides place for why some variables are important in the model, even if they showed lower feature importance in the statistical analysis. This conceptual model serves as a good guide for understanding the structure of the predictive model and interpreting its results in a broader environmental context, and economic context.

CHAPTER THREE

3.1. Study Area

The Upper West Region is in the north-western part of Ghana and shares borders with the La Cote D’Ivoire to the north-west, Burkina Faso to the north, Upper East to the East and the Northern Region to the south. The Wa Municipal Assembly was created out of the then Wa District in 2004 with legislative instrument (L1) 1800 in pursuant of the policy of decentralization started in 1988. The Assembly is empowered as the highest political and administrative body in the Municipality charged with the responsibility of facilitating the implementation of national policies. Under section 10 of the Local Government Act 1993 (Act 426), the Assembly exercises deliberative, legislative, and executive functions in the district. By this act, the Assembly is responsible for the overall development of the Municipality. The Wa Municipality is therefore tone of the eleven administrative areas (District Assemblies) that make up the Upper West Region (UWR) of Ghana. The Municipality shares administrative boundaries with Nadowli District to the north, the Wa East District to the east and the Wa west district to the west. The Municipality lies between latitudes 9º50!N to 10º20!N and between longitudes 9º40! W and 10º15!W. It has an area of approximately 234.74 km2, about 6.4% of the area of Upper West Region. The implication of the location of the municipality for development is, enhancing bilateral trade and commerce with Franco phone countries. The Wa town has the potential to grow and be upgraded into both an industrial and commercial hub for the north-western corridor of Ghana. The Figure 1 (map) below shows the location of the Wa Municipality with some of the peri-urban communities that fall victim of the rapidly urbanizing process in the municipality.

3.2. Relief, Drainage and Topography

The Municipality lies in the Savannah high plains, which generally, is gently undulating with an average height between 160m and 300m above sea level. The gentle rolling nature of the landscape implies that the topography is no barrier to agriculture and other physical development. The low-lying areas are found in the following localities: Charia, Zingu, Kperisi to the North and Piisi, Dapouha, Boli, Sing, Biihe and Busa to the South. These manifest in the form of valleys that collect and retain water during the rainy season and are therefore suitable for rice cultivation and livestock rearing. These low-lying areas have further given rise to two main drainage systems, the Sing-Bakpong and its tributaries to the South and Billi and its tributaries to the North. The streams are seasonal and thus dry up during the long dry season thereby reducing available of water for agriculture, domestic, industrial, and constructional uses. This implies the provision of dams, dugouts and rainwater harvesting to provide adequate water to meet the domestic and agricultural needs of the increasing population in the area.

3.3. Weather

The climate of the Wa Municipality is characterized by long, windy, and hot dry season followed by the short and stormy wet season. The dry season occurs between November and April. The north eastern trade winds from the Sahara desert precipitates the cold harmattan winds between November and February which brings with it coughs, cold and other respiratory diseases and skin diseases. The hot season records high temperatures with a peak of between 40 C and 45 C in March and April causing dehydration and incidence of cerebral meningitis. The effect of climate change is becoming more manifest of late due to human activities in terms of bush burning, felling of trees, poor farming practices and infrastructural activities. The wet season lasts between April and October. The annual mean rainfall volume of between 840 mm and 1400 mm is sparsely and poorly distributed over the months. The rainfall pattern is erratic and punctuated by spells of long droughts and heavy downpours and floods. This affects humidity levels, soil moisture levels, crop growth and general agricultural productivity.

3.4. Land Use

Notwithstanding the fact that the municipality is the commercial hub of the upper west region, agriculture remains main the economic activity. It remains the largest single contributor to the local economy and employs about 70% of the active population. The main staple crops grown are millet, sorghum, maize, rice, cowpea, and groundnuts cultivated on subsistence basis. However, soybeans, groundnuts, Bambara beans are produced as cash crops. Economic trees within the municipality are sheanuts, dawadawa, mango, baobab, and teak. The vegetation cover of the area is guinea savanna woodland, which is made up of grasses and tree species such as Butylosternum Paradoxum (Shea tree), Parkia biglolosa (Dawadawa), Adansonia Digitata (baobab), Anarcadium occidentale (cashew), Acacia, Ebony, Neem and Mango among others. There is a marked change in the plant life of this vegetation zone during different seasons of the year. The vegetation in this area is thus open and dominated by short grasses. In the wet season, the area looks green and in the dry season, the grass dries and most of the trees shed their leaves and prone to bush fires. Human activities such as firewood harvesting, charcoal burning, farming, quarrying, construction etc. are all combined to modify the natural environment. The Municipality lies in the Savanna high plains, which generally, is undulating with an average height between 160 and 300 m above sea level and has two main drainage systems, Sing-Bakpong and its tributaries to the South and Billi and its tributaries to the North. The streams dry up during the long dry season thereby reducing available water for agriculture, domestic, industrial and construction users. Apart from the Wa central-the capital of the municipality, there are eight peri-urban towns within the municipality. However, the study would focus on the four fast urbanizing communities (Busa, Kpongo, Charia/Loho and Kperisi) located almost equidistance from the municipality.

3.5. Agriculture

The agriculture sector provides more than 60% of the municipal population sources of jobs, livelihood, and business. It is a sector crucial to the local economy because it is currently the major provider of jobs. Despite its strategic role in fighting poverty, it is under modernized. Traditional technologies still dominate agriculture production, processing, storage, and marketing. Programs are therefore required to enhance development of sustainable agriculture production systems e.g., irrigation systems, enhanced farmer education and training, enhanced technology transfer in agriculture production, storage and enhance corporate development for marketing. Agro-Industry is an immense potential waiting development. The investment potentials are many and varied. Cereals flour: processing from Staple food crops like maize, millet, and sorghum. About 5,581, 7,113and 5,180 MT of maize, millet and sorghum respectively are produced annually. About 70- 80% of the production is processed at grinding mills where the possibility of food contamination is very high.

3.5.1. Pito Brewing

A local beverage (Pito) produced from sorghum (Guinea Corn) which enjoys a lot of patronage in the municipality and the region faces the challenges of maintaining the quality/standards beyond a day, meeting preferred taste and alcohol level of consumers, packaging, and traditional brewing process. Yet it is one of the major sources of livelihoods and income for women. Modernizing pito brewing has a potential of not only augmenting sorghum production but improving women income level. Processing/Packaging: of dairy and meat products (cheese, yoghurt, sausages) for households, catering and hospitality industries: Cattle herds are about 6,696 while small ruminants’ population is about 8,457. Livestock production is still basically open range, while a growing hospitality and catering industry lack the necessary meat product.

3.6. Research Methodology

3.6.1. Research Approach

To model thunderstorm frequency, this study uses a quantitative research methodology that makes use of data data along with machine learning techniques. We can examine big databases using quantitative approaches, and we can spot trends that affect agricultural yields.

3.6.2. Sources of Data

The sources of data on the study are primary a secondary data source.
1. Thunderstorm Data: Data on thunderstorms was collected from ERA5, which is the latest climate reanalysis produced by ECMWF, providing hourly data on atmospheric, land-surface and sea-state parameters together with estimates of uncertainty. This dataset is valuable for studying climate trends and validating models
2. Climatic data: Data on climate parameters was collected from ERA5, which is the latest climate reanalysis produced by ECMWF, providing hourly data on atmospheric, land-surface and sea-state parameters together with estimates of uncertainty. This dataset is valuable for studying climate trends and validating models.

3.6.4. Method

The data analysis for this research, aimed at modeling thunderstorms using machine learning and climate data, it follows a systematic approach. Here are the methods of data analysis:
3.6.5 Data Preprocessing
Feature Selection: Relevant features (climate variables or parameters) were selected for model development, improving model performance and interpretability. Filter method was used as they are computationally efficient and good starting point for small datasets. Feature importance provided a base ranking on contributing to model’s selection.

3.6.7. Model Development

  • Machine Learning Models: Time series analysis and a machine learning method, Random Forest was employed.
  • Training and testing sets: The dataset was divided into training and testing sets to enable the machine learning models to be trained. 20% was used for the testing 80% for the training.
  • Model Training: Machine learning models are trained using historical thunderstorm data as the target variable and climate variables as predictors.

3.6.8. Machine Learning Algorithms to be Used

Machine Learning Algorithms: In this research, following machine learning algorithms are employed:
  • Random Forest: Random Forest is an ensemble learning technique that mixes several different decision trees to identify deep correlations in the data. It was aid in dealing with non-linearities.

3.6.9. Model Evaluation

To evaluate the model strength and universality, K-Fold Cross Validation were used. K-fold cross-validation is a technique for evaluating predictive models. The dataset was divided into k subsets or folds. The model was trained and evaluated k times, using a different fold as the validation set each time. Performance metrics from each fold are averaged to estimate the model’s generalization performance.

3.6.10. Performance Metrics

Model performance was evaluated using the following metrics:
  • Mean Absolute Error: Mean absolute error measures the average absolute differences between the predicted and actual crop yield
  • Root Mean Squared Error: It quantifies the square root of the average differences between predicted and actual crop yield.
These metrics can mathematically be represented as follows:
EQUATIONS
  • MAE= 1 / n Y i e l d p r e d i c t e d a c t u a l y i e l d
  • RMSE = 1 / n Y i e l d p r e d i c t e d a c t u a l y i e l d ^ 2

3.6.11. Results Presentation

  • Data Visualization: Results are presented using visualizations, including charts and graphs, to help interpret the relationship between climate variables or parameters and thunderstorm frequency.
  • Interpretation of data: The findings are analyzed in the context of climate trends and their implications for crop productivity yield in Wa.

CHAPTER 4

4.1. Introduction

Random Forest models have gained popularity in meteorology for their ability to handle complex, no-linear relationships between variables. Breiman (2001) introduced Random Forest as an ensemble learning method that provides strong predictions by aggregating the outputs of multiple decision trees. Their application in weather prediction, including thunderstorm forecasting, has shown promising results due to their flexibility and ability to use different meteorological data (Schultz et al., 2019)

4.2. Model Performance Evaluation

The Random Forest Regressor was evaluated using multiple metrics to assess its accuracy in predicting thunderstorm frequency. The primary metrics included Mean Absolute Error (MAE), Mean Squared Error (MSE), Root Mean Squared Error (RMSE), and the R-squared score (R2) as shown below:
Table 1. showing model performance by metric evaluation.
METRIC VALUE
MAE 2.34
MSE 9.64
RMSE 3.11
R2 0.73
1. Mean Absolute Error (MAE): 2.34: The MAE showed that, on average, the model’s predictions deviated from the actual thunderstorm frequency by about 2.34 occurrences. This suggests a moderate level of accuracy, considering the range of thunderstorm frequencies observed in previous images.
2. Root Mean Square Error (RMSE): 3.11: The RMSE is higher than the MAE, which is expected as it subjects large errors more heavily. The value shows that while the model generally performed well, there were some instances of larger prediction errors.
3. R Squared Score: 0.73: This R² value shows that approximately 72.63% of the variance in thunderstorm frequency was explained by the model. This clearly shows a good fit, though there’s still some unexplained variability in the data.

4.2.1. Interpretation and Discussion

The model demonstrated good predictive capabilities, as evidenced by the high Index of Agreement and a reasonably high R² score. It captured a great portion of the variability in thunderstorm frequency, which is commendable given the complex nature of atmospheric processes. The MAE of 2.34 and RMSE of 3.11 show that while the model’s predictions were generally close to observed values, there were some notable deviations.
Table 2. Features and their full meaning.
Features In Abbreviation Full Meaning
TCW Total Column Water
TCRW Total Column Water Vapor
TCWV Total Column Water Vapor
CAPE Convective Available Potential Energy
MCC Mesoscale Convective Complex
P88.162 Vertical integral of eastward cloud liquid water flux
TP Total Precipitation
TOTALX Total Totals Index
CBH Cloud Base Height
D2M 2-meter Dewpoint Temperature

4.3. Trend Analysis of Thunderstorms

Figure 2. trend analysis of thunderstorms.
Preprints 120380 g002
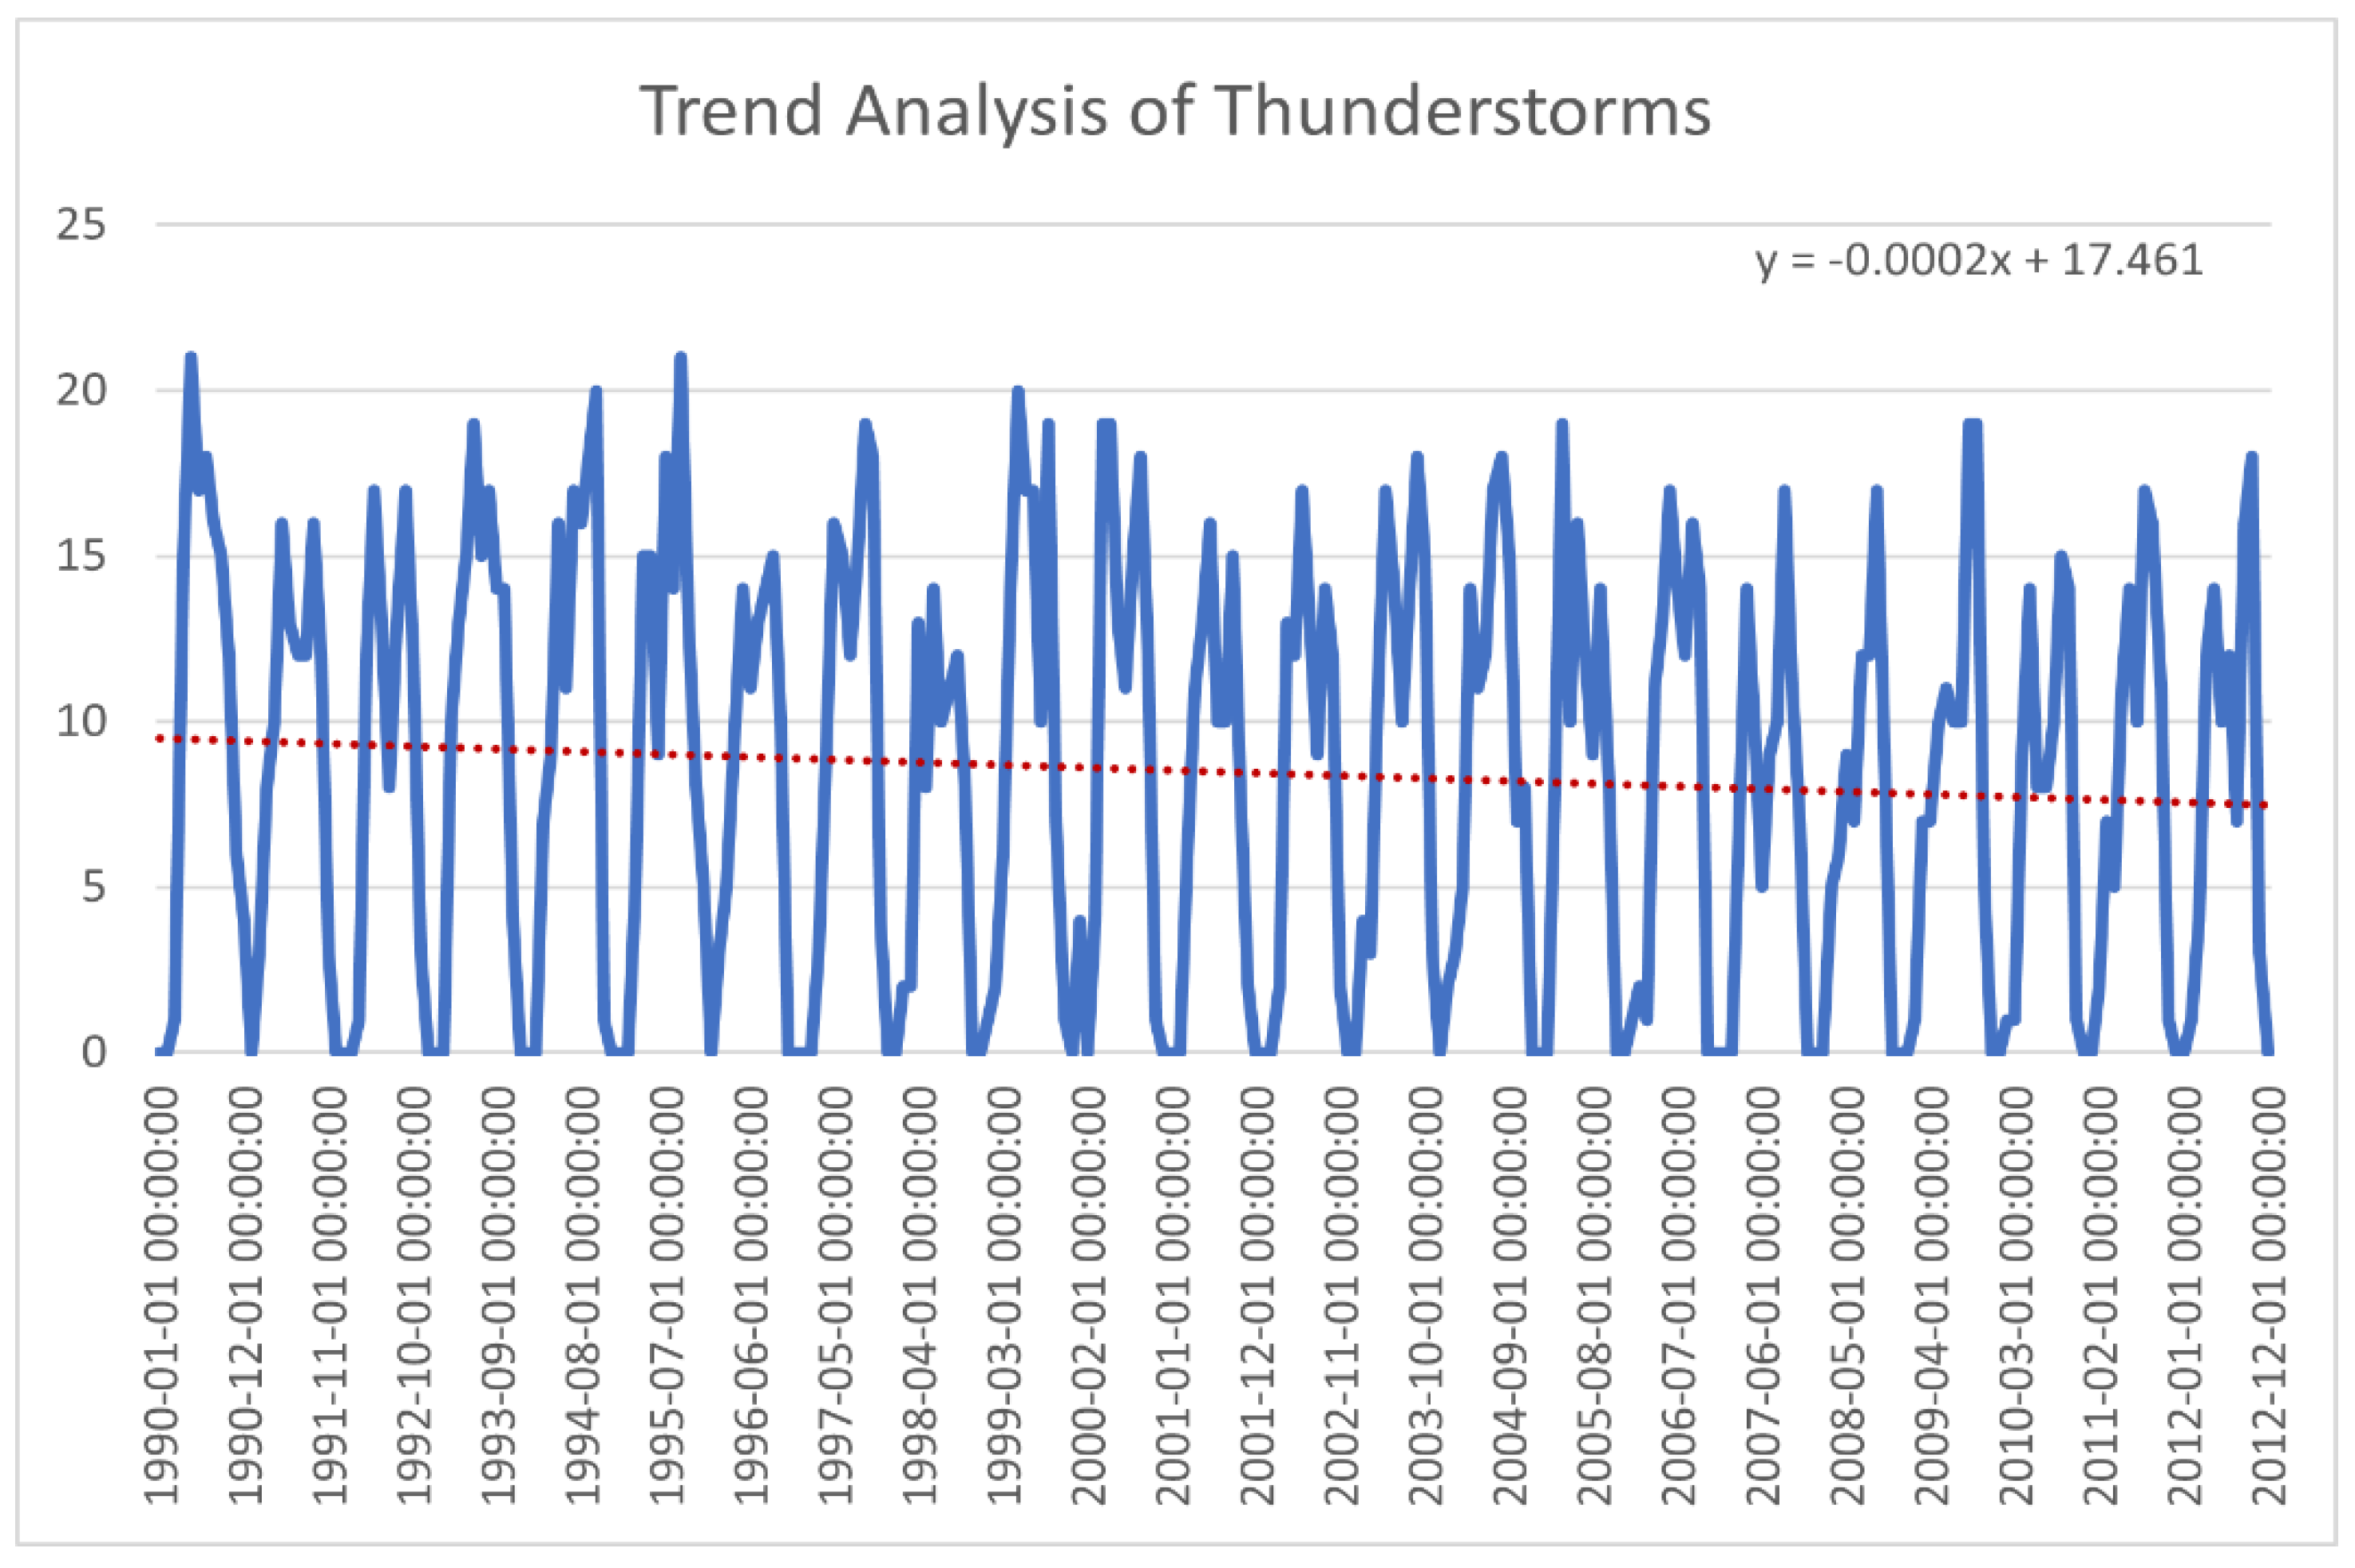
The trend analysis of thunderstorms in the graph shows a clear oscillating pattern over time, with the number of thunderstorms varying between 0 and 20. The linear trend line has a slightly negative slope, as indicated by the equation y = -0.0002x + 17.461 . This suggests that, overall, -00002 represents the total number of thunderstorms decreased per month. The red dotted line, which represent the trendline shows the general trend or direction that the number of thunderstorms is following over time.

4.4. Feature Correlation with Thunderstorm Frequency
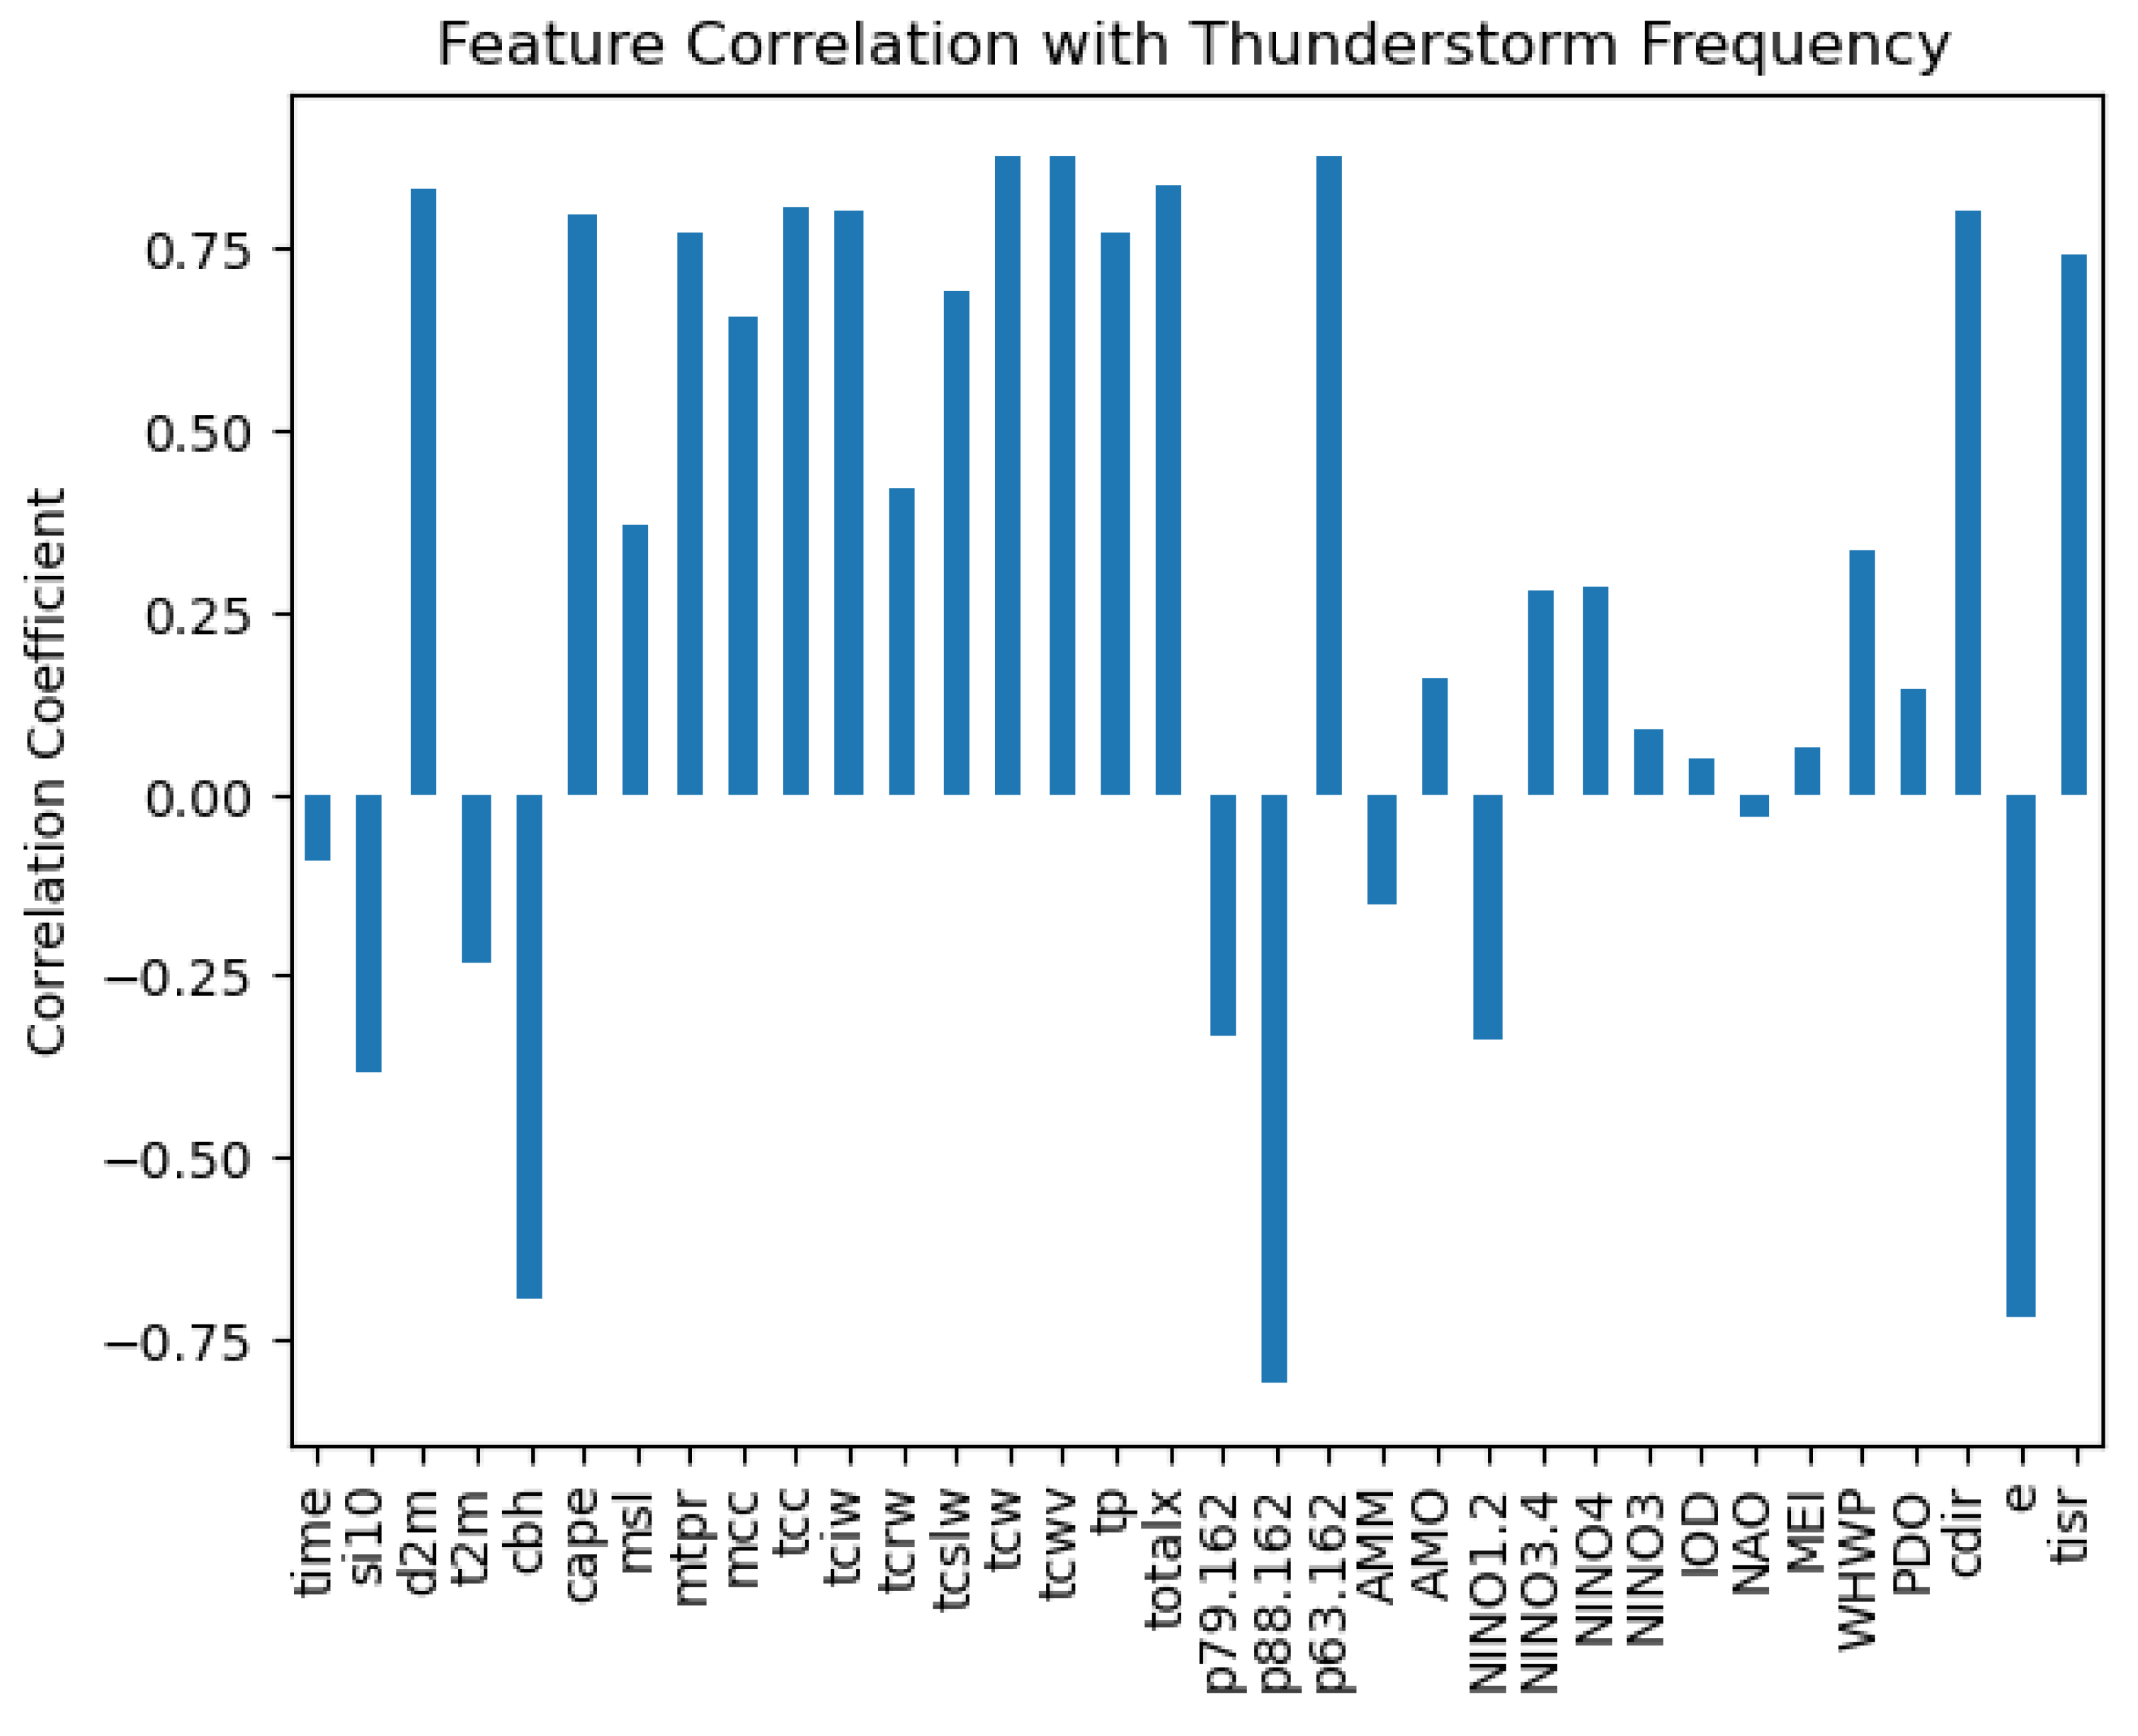
Figure 3. feature correlation with thunderstorm frequency.
Preprints 120380 g003
The figure above shows a bar graph representing the correlation coefficients of various features with thunderstorm frequency. The graph displayed both positive and negative correlations for different features. Among the features we will focus on: TCW, D2M, TOTALX, CAPE, TP, TCRW, P88.162, CBH, TCWV AND MCC.
TCW (Total Column Water) had a strong positive correlation with thunderstorm frequency, with a coefficient around 0.75. This indicated that as the amount of water vapor in the atmosphere increased, thunderstorm frequency tended to increase as well. D2M (2m Dewpoint Temperature) also showed a strong positive correlation, with a coefficient similar to TCW. This suggested that higher dewpoint temperatures at 2 meters above the ground were associated with more frequent thunderstorms. Totalx (Total Totals Index) had a positive correlation, though not as strong as TCW or D2M. This meteorological index, which combines temperature and moisture information, showed a moderate relationship with thunderstorm occurrence. CAPE (Convective Available Potential Energy) displayed a positive correlation, indicating that higher values of CAPE were associated with increased thunderstorm frequency. This aligned with meteorological understanding, as CAPE is a measure of atmospheric instability. TP (Total Precipitation) showed a positive correlation, suggesting that periods with more overall precipitation also tended to have more thunderstorms. TCRW (Total Column Rain Water) had a strong positive correlation, similar to TCW. This indicated that higher amounts of rain water in the atmospheric column were linked to more frequent thunderstorms. P88.162(Vertical integral of eastward cloud liquid water flux showed a positive correlation. CBH (Cloud Base Height) had a negative correlation, suggesting that lower cloud bases were associated with more frequent thunderstorms. TCWV (Total Column Water Vapor) showed a strong positive correlation, very similar to TCW, supporting the relationship between atmospheric moisture and thunderstorm frequency. MCC (Mesoscale Convective Complexes) had a weak positive correlation, indicating a slight tendency for more thunderstorms when these weather systems were present. These correlations provide understandings into the atmospheric conditions associated with thunderstorm frequency, stressing on the importance of moisture, instability, and other meteorological factors in thunderstorm development.

4.5. Thunderstorms Cycles

Figure 4a. Intra-Annual cycle.
Preprints 120380 g004a
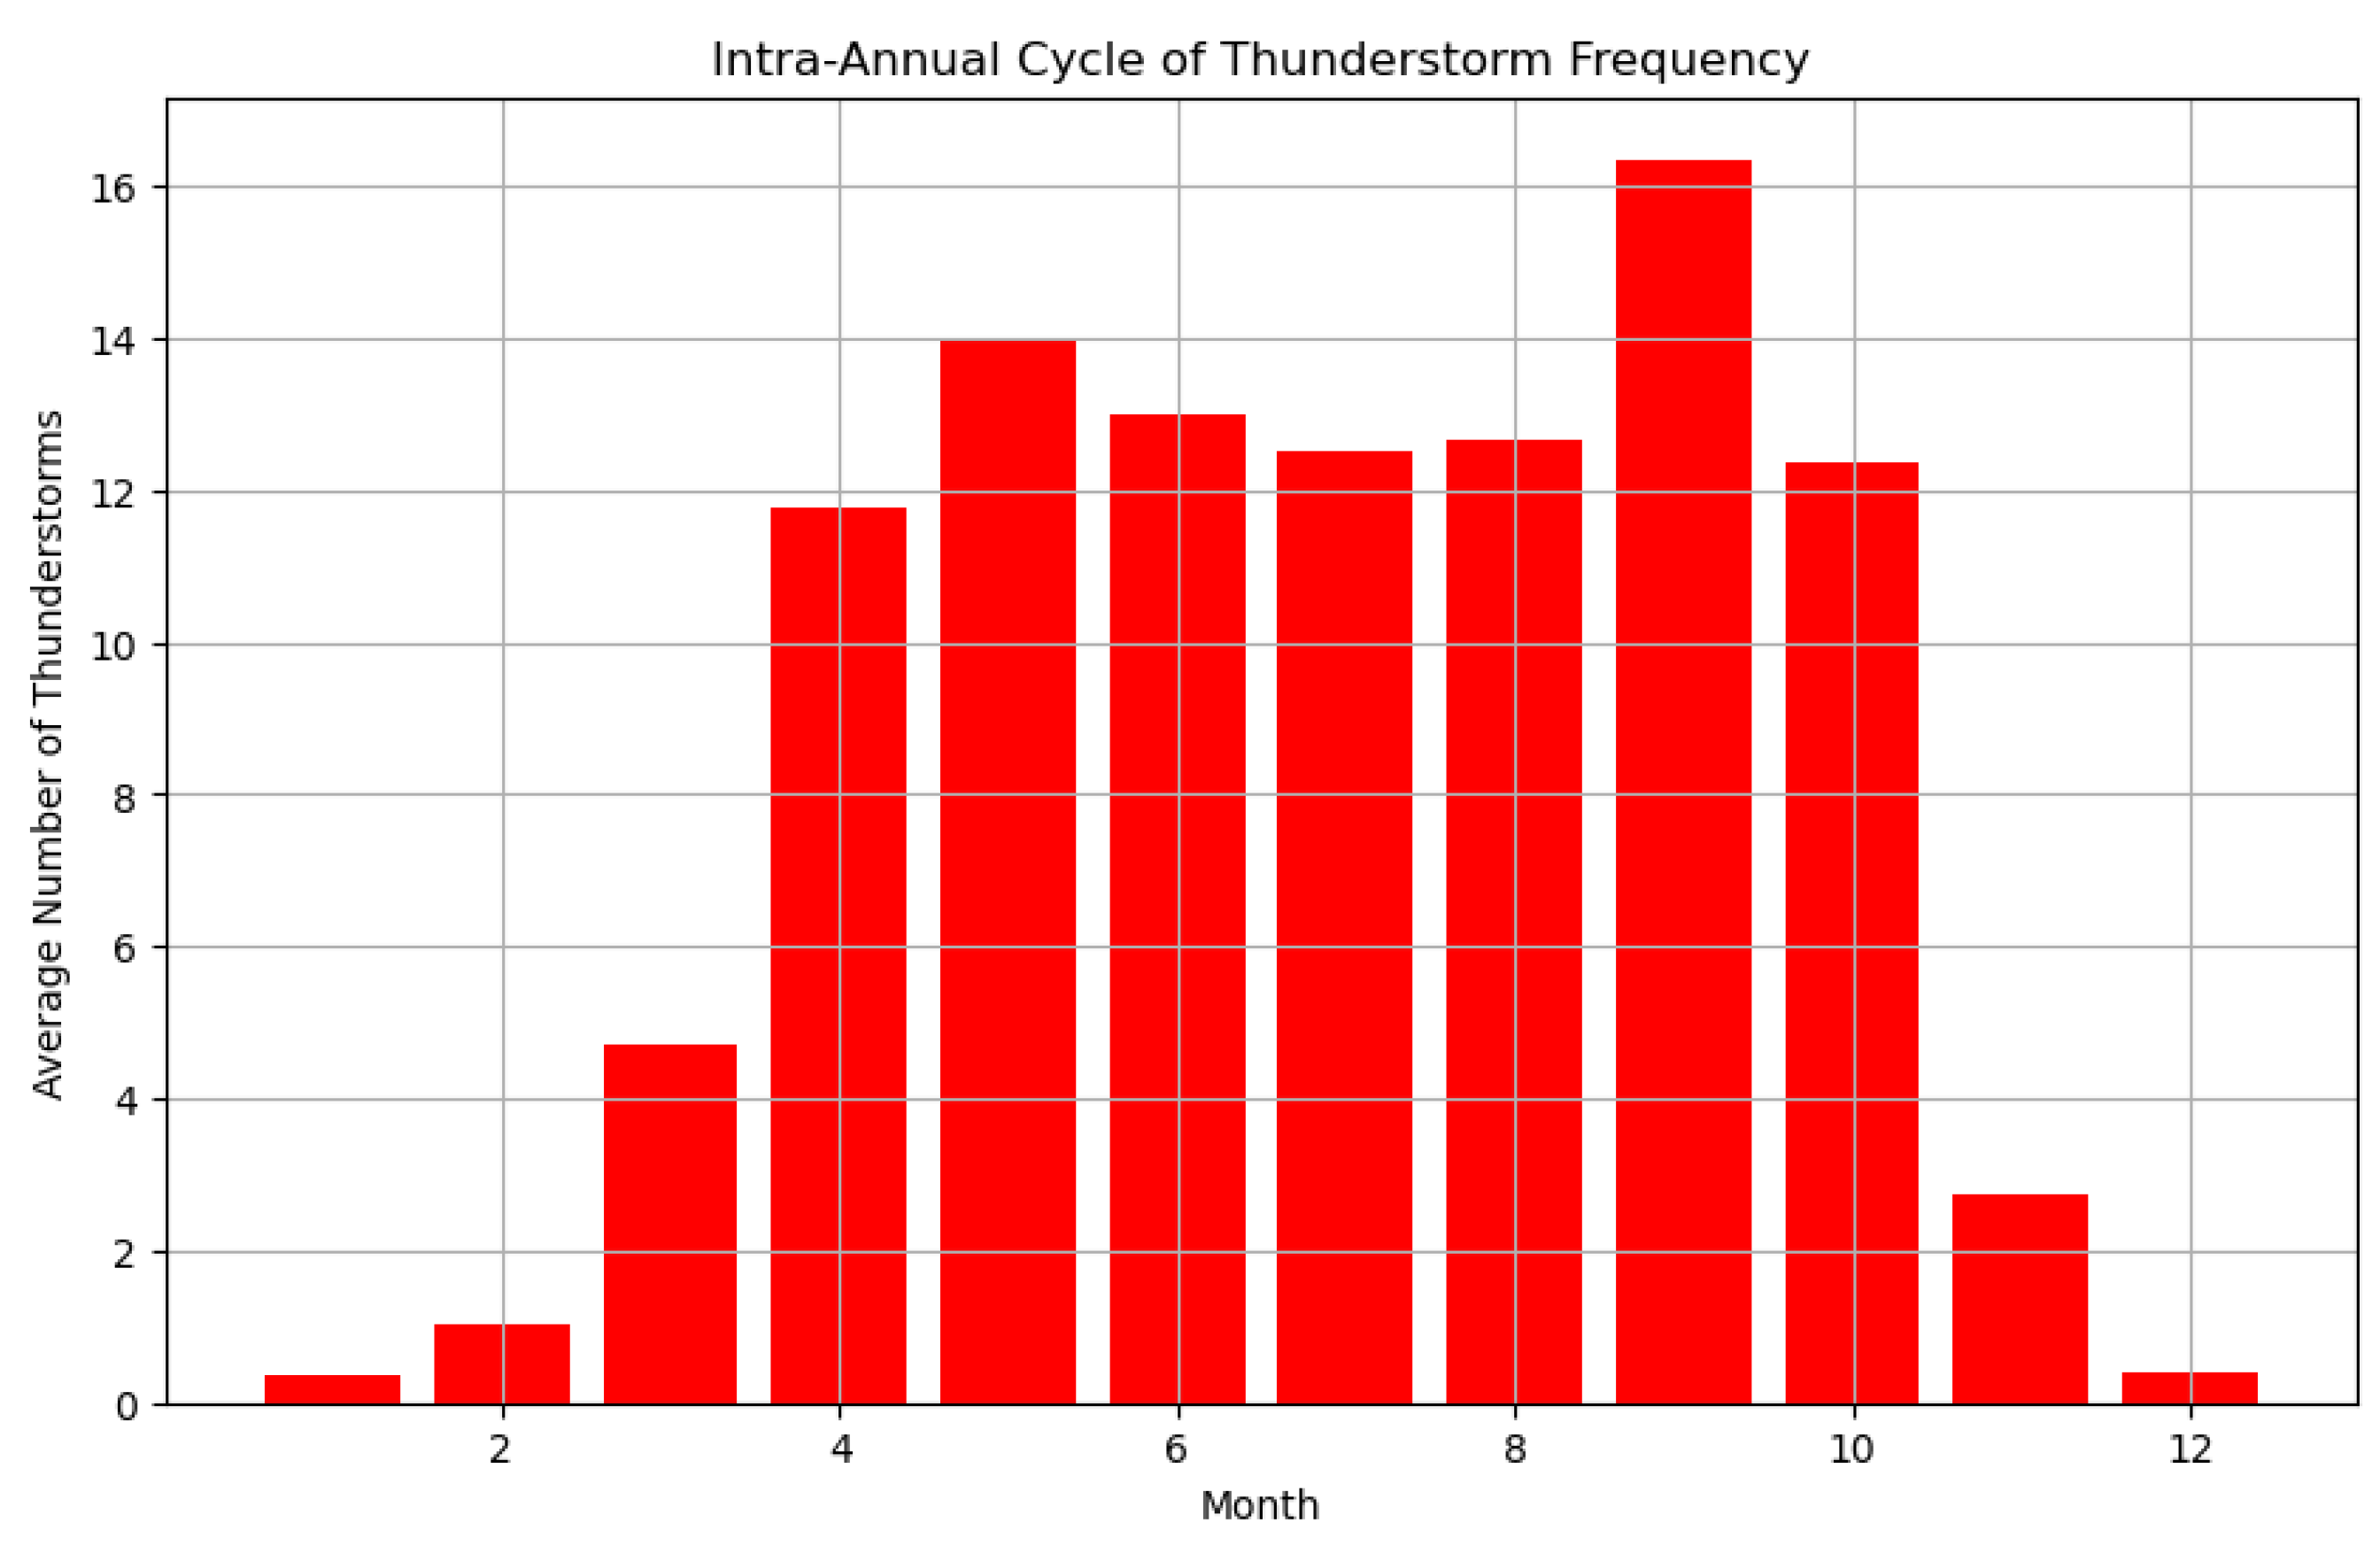
Figure 4a shows the intra-annual cycle of thunderstorm frequency, displaying the average number of thunderstorms for each month of the year. A clear seasonal pattern developed from the data. Thunderstorm frequency was lowest in the dry months, with December and January showing very few thunderstorms on average, less than 1 per month. As wet season progressed, there was a steady increase in thunderstorm frequency. March and April saw a notable rise, with April averaging around 5 thunderstorms. The raining months exhibited the highest thunderstorm activity. June, July, and August all had high frequencies, averaging between 12 to 14 thunderstorms per month. The peak in thunderstorm frequency occurred in September, with an average of about 16 thunderstorms. After September, there was a sharp decline in thunderstorm frequency. October still had a relatively high number, around 12, but November saw a significant drop to about 3 thunderstorms on average. The intra-annual pattern aligned with typical seasonal weather patterns in many temperate regions, where warm, humid conditions in late dry seasons often provide ideal conditions for thunderstorm development.
Figure 4b. Inter-Annual Cycle.
Preprints 120380 g004b
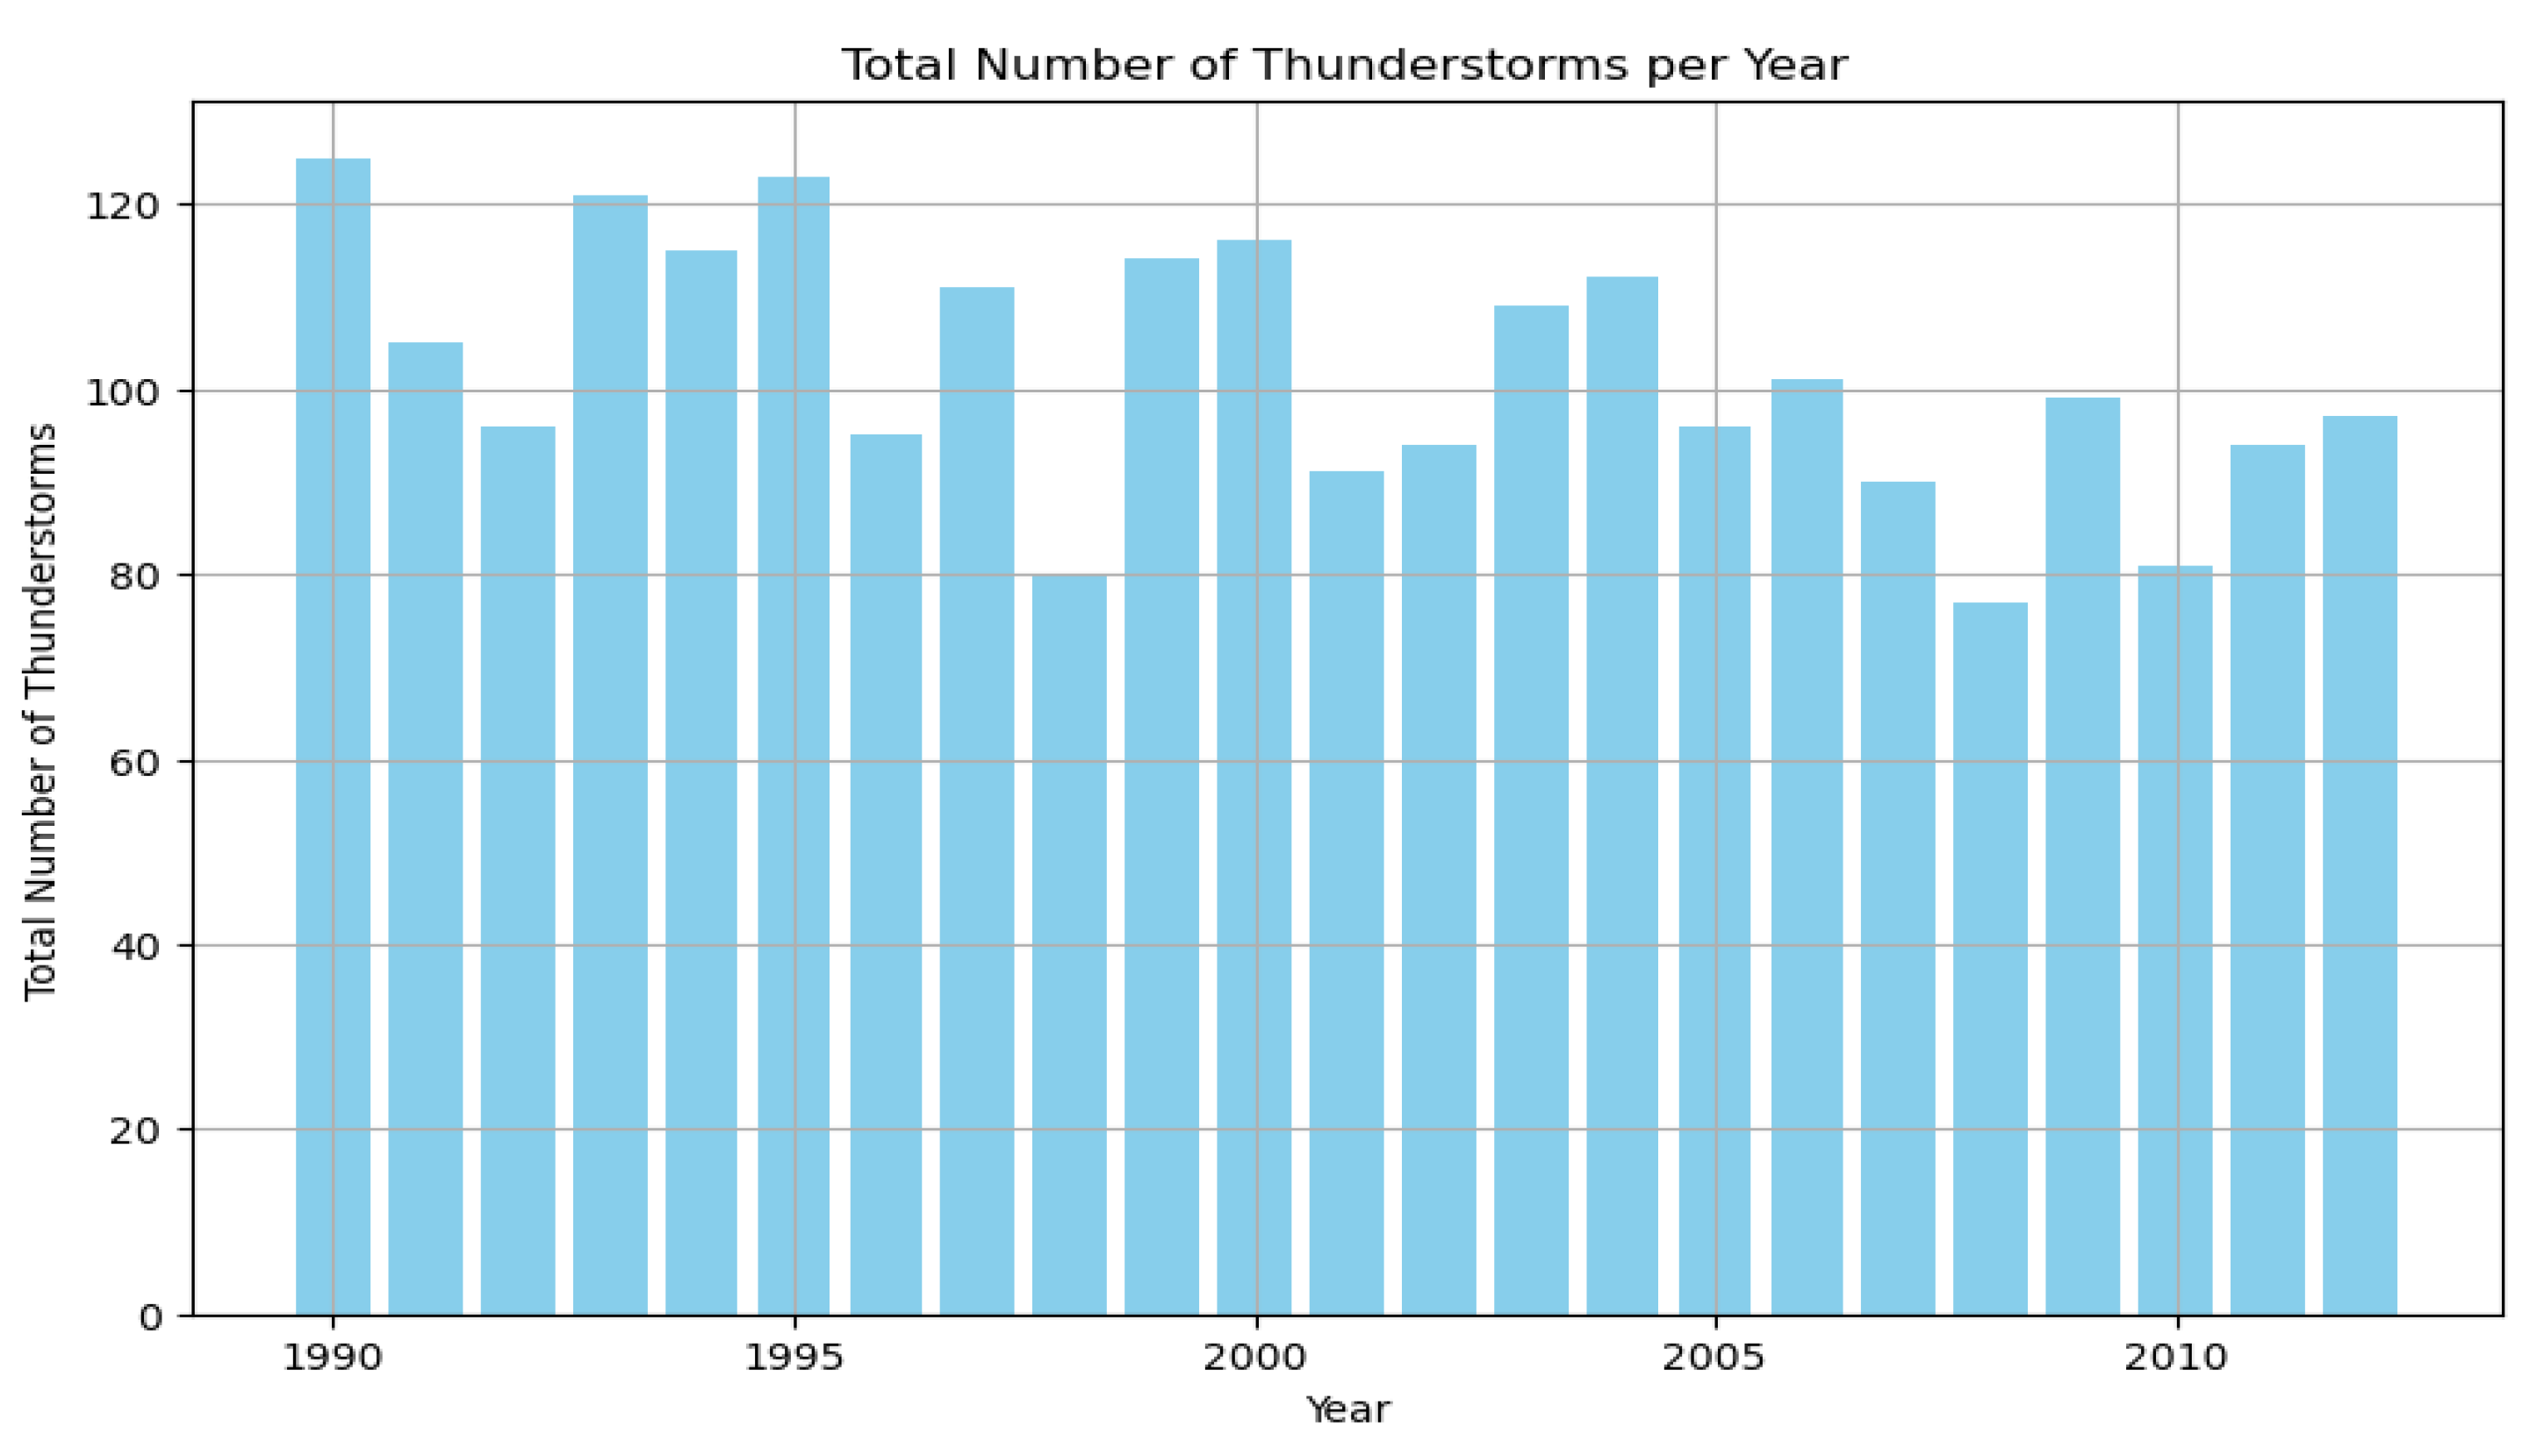
Figure 4b shows The Total Number of Thunderstorms per Year from around 1990 to 2012. Each bar represents the total number of thunderstorms observed in a particular year. The vertical axis shows the total number of thunderstorms, while the horizontal axis shows the year. In the early 1990s, the total number of thunderstorms remained relatively high, with values around 120 per year. Over time, there was a noticeable decline in the total number of thunderstorms, although the pattern was not smooth. Some years experienced a great drop, while others showed increases, but the overall trend pointed to fewer thunderstorms as time progressed. The early years (1990-1993) showed consistently high thunderstorm activity, with totals consistently above 110 thunderstorms per year. A fall occurred around the mid-1990s, where the number dropped to below 110, changing between about 100 and 110 thunderstorms from 1993 to 1997. Another decrease appeared around 2005-2007, where the total number of thunderstorms fell below 90 for the first time in the recorded period. Toward the later years, from 2005 going, the total number of thunderstorms drifted mostly between 90 and 100 per year, showing a downward trend from the earlier years of the data. But a slight increase is observed toward the end of the study period (2010-2012), where the number of thunderstorms started increasing again, but it still remained lower than the values recorded in the early 1990s.

4.5. Decomposition of Thunderstorms Data
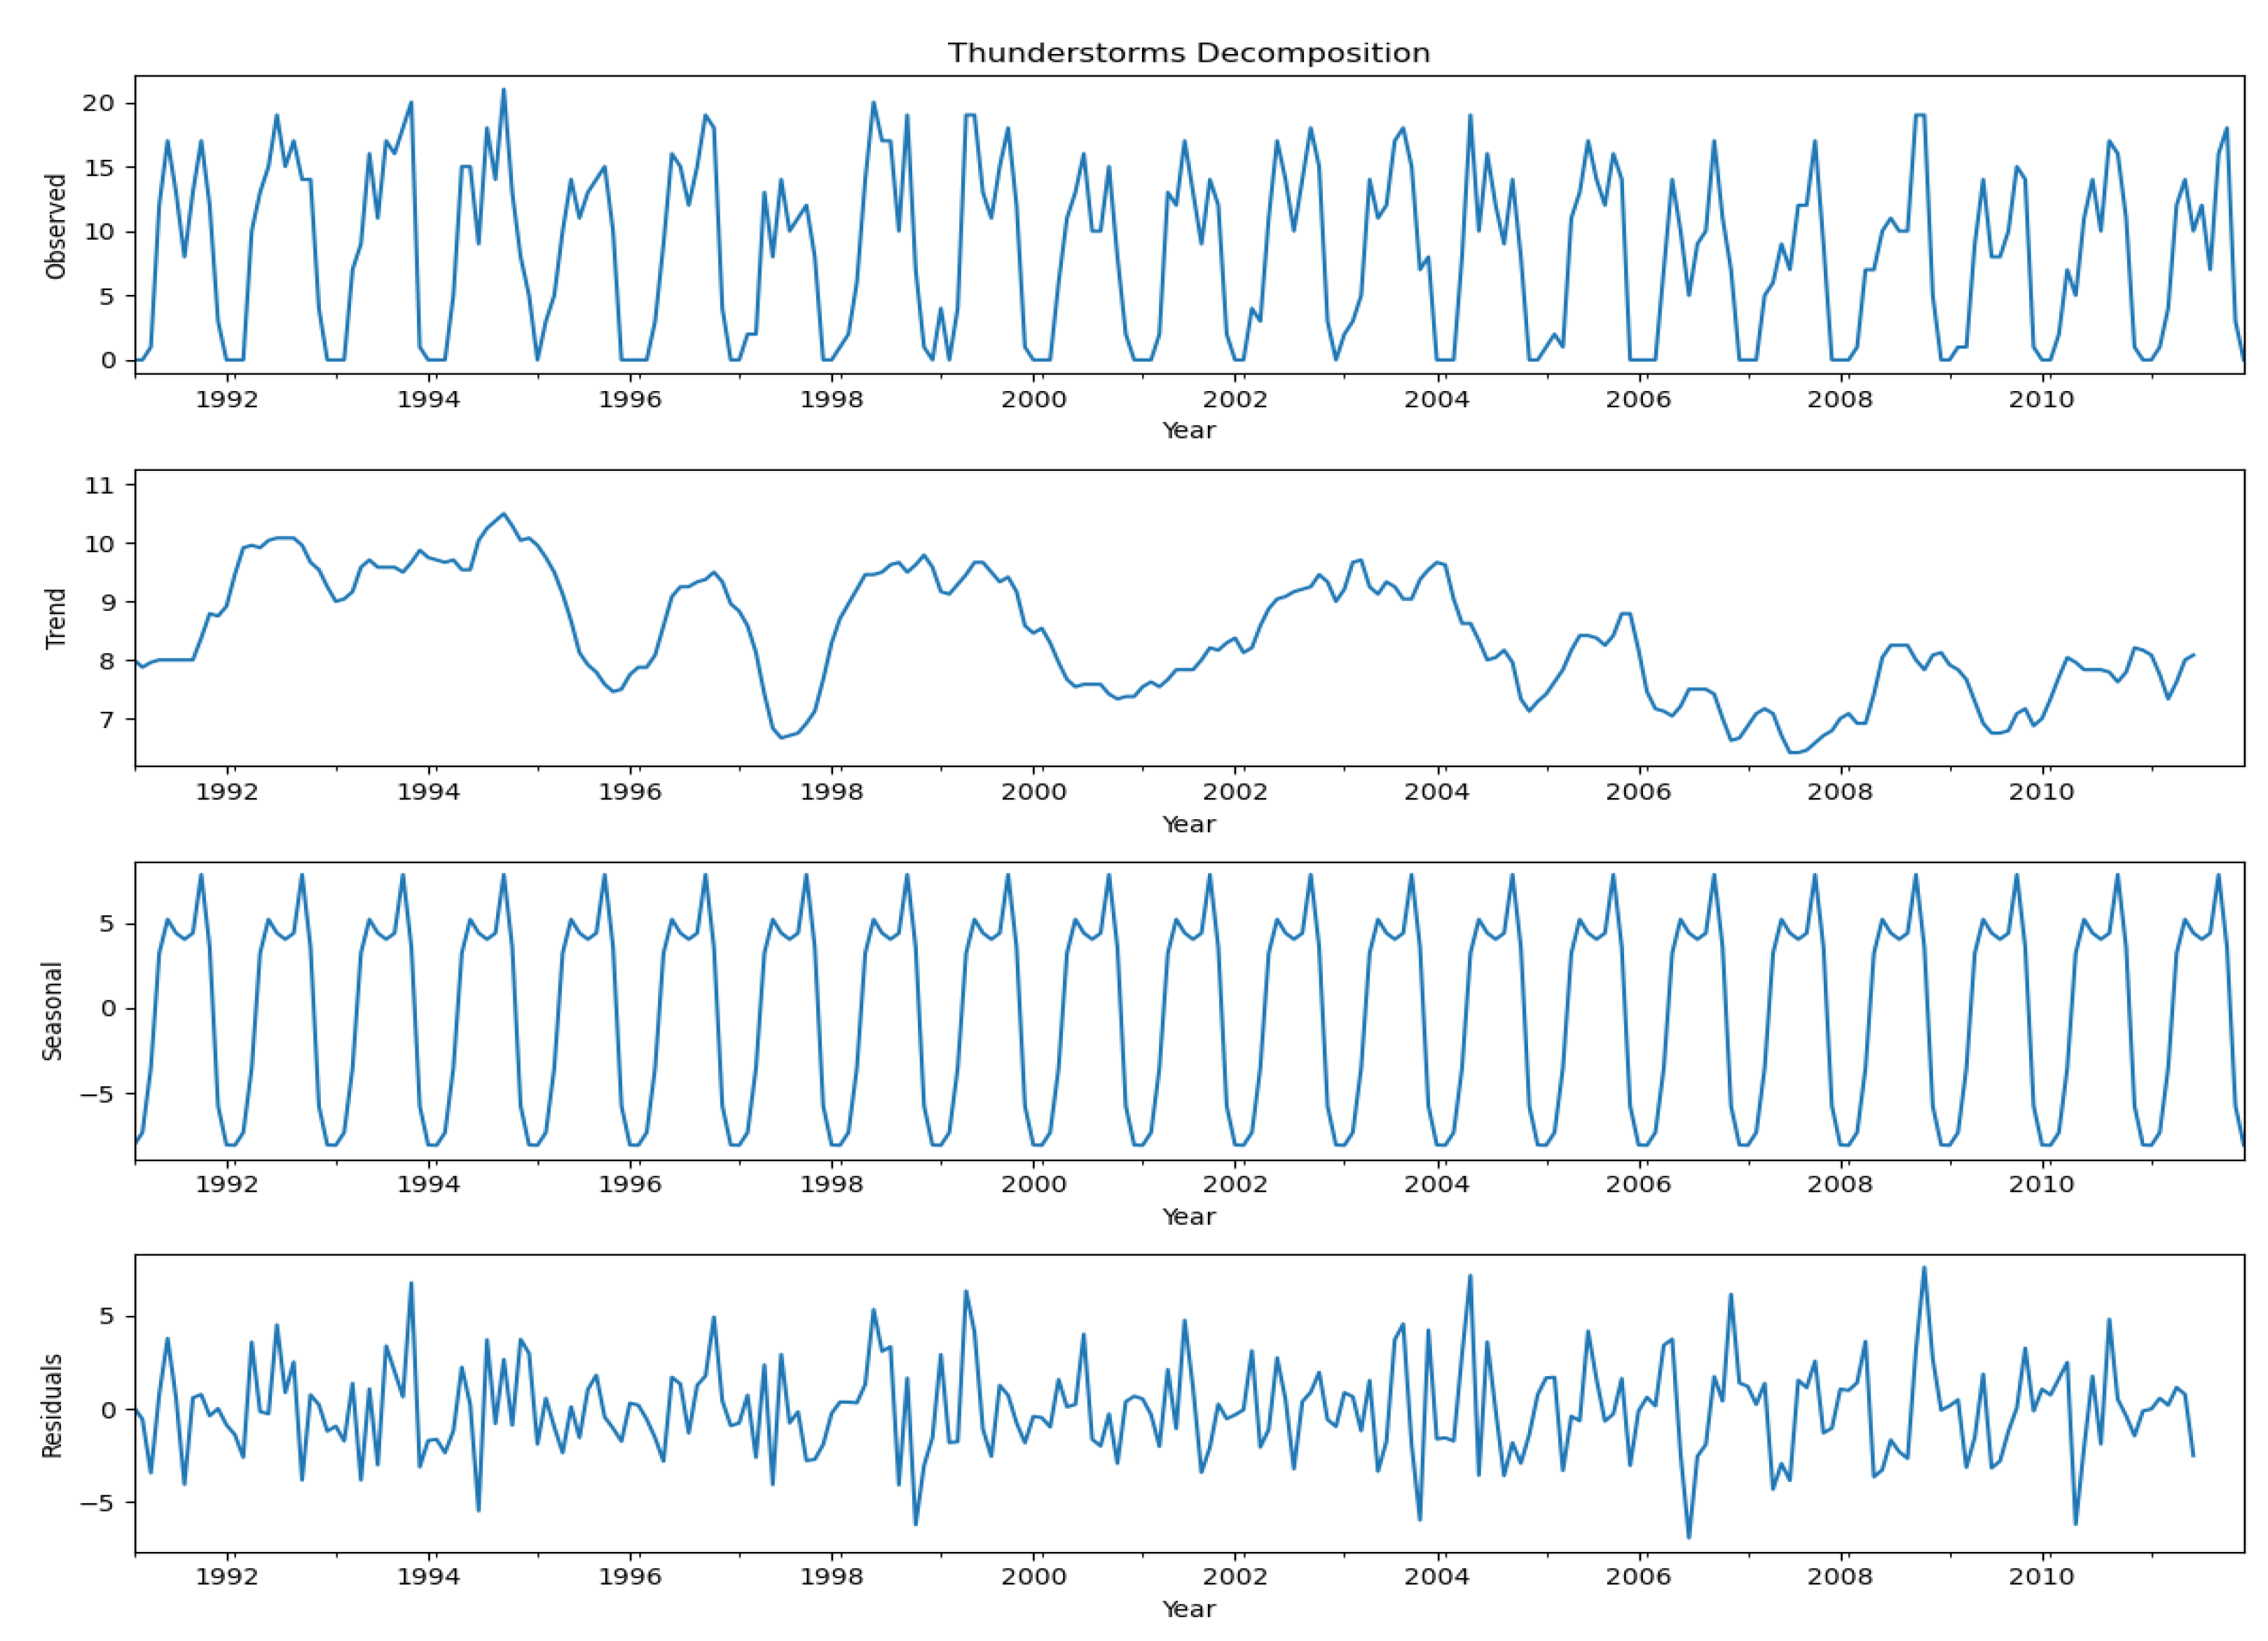
Figure 5. Decompositions of thunderstorms data.
Preprints 120380 g005
A time series decomposition of thunderstorm data, broken down into four components: the original data, trend, seasonal pattern, and residuals. The top panel showed the original thunderstorm data. It displayed a clear cyclical pattern with peaks and troughs occurring regularly. The frequency of thunderstorms varied between 0 and about 20 per time unit, with most peaks reaching around 15-20. The second panel shows the overall trend in thunderstorm frequency. This trend line showed some variations over time, starting at around 10 thunderstorms, slowly to about 8 at its lowest point, and then slightly increasing towards the end. This suggested that while there were short-term variations, the long-term trend in thunderstorm frequency was relatively stable with a slight decrease followed by a minor increase. The third panel showed the seasonal component of the data. It showed a very consistent pattern that repeated regularly, with values ranging from about -10 to +10. This regular pattern corresponded to annual seasonal variations in thunderstorm frequency, matching the intra-annual cycle seen in the previous graph.
The bottom panel displayed the residuals, which showed the variation in the data not explained by the trend or seasonal components. These residuals appeared to be fairly randomly distributed around zero, with most points falling between -5 and +5. This suggested that the trend and seasonal components captured most of the structured variation in the data. The decomposition showed that thunderstorm frequency had a strong seasonal pattern, a relatively stable long-term trend with some variations, and some random variation that wasn’t explained by these components. This analysis provides a more detailed understanding of the factors influencing thunderstorm frequency over time.

4.6. K-Means Clustering of Thunderstorm Events
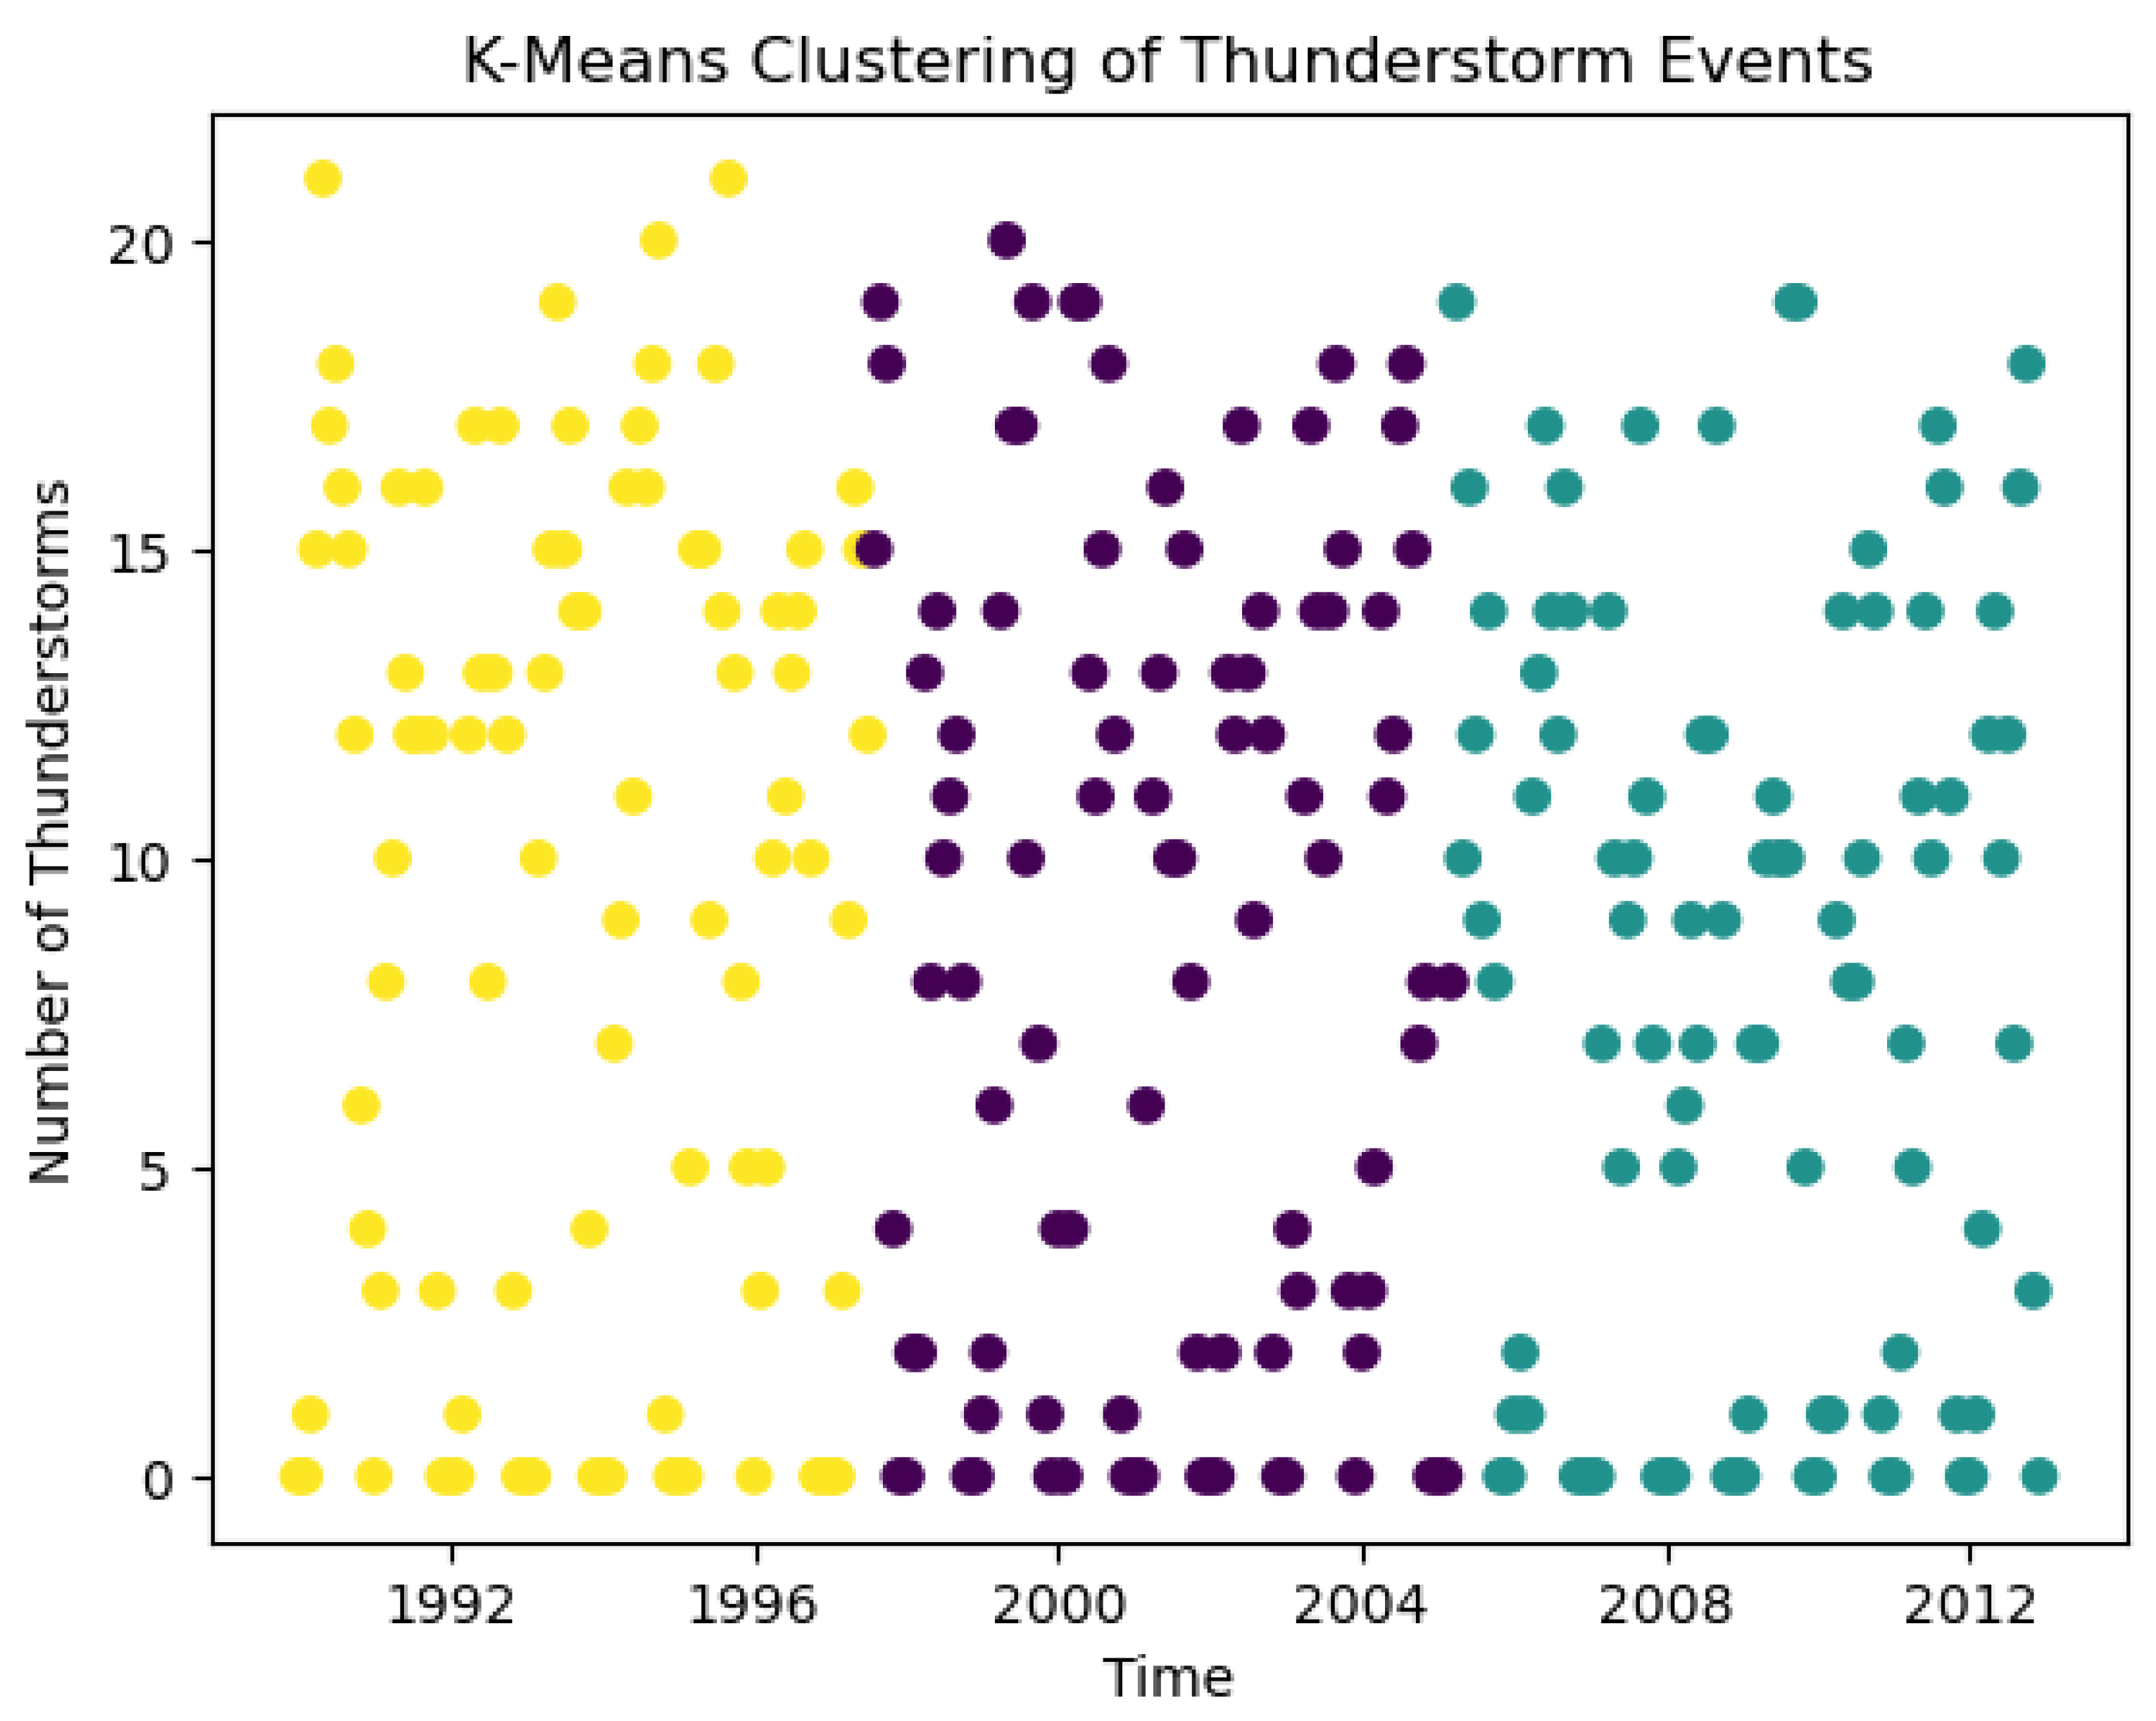
Figure 6. K-Means Clustering of Thunderstorm events.
Preprints 120380 g006
The above figure shows results of K-Means clustering applied to thunderstorm events over time. Thunderstorm frequency on the y-axis and time on the x-axis, from 1992 to 2012. The clustering algorithm divided the data into three distinct groups, represented by different colors: yellow, purple, and teal. The yellow cluster covered the earliest time period, roughly from 1992 to 1998. It show a wide range of thunderstorm frequencies, from 0 to over 20 events. There appeared to be a slightly higher concentration of points in the upper range of frequencies for this period. The purple cluster represented the middle time period, from 1998 to 2006. It also shows a wide range of thunderstorm frequencies, similar to the yellow cluster. However, there seemed to be a more even distribution of points across the frequency range. The teal cluster covered the most recent time period, from about 2006 to 2012. The cluster show a similar spread of thunderstorm frequencies as the other two clusters, but with a slightly lower maximum frequency, not quite reaching the highest levels seen in the earlier periods. All three clusters showed thunderstorm frequencies ranging from 0 to about 20 events, with an even distribution of points throughout this range. This suggested that while the clustering algorithm identified different time periods, the overall pattern of thunderstorm frequency remained quite steady across these periods. The clustering results indicated that there are indirect changes in thunderstorm patterns over the two decades, but these changes were not severe enough to create clearly separated clusters based on frequency alone. The main unique factor between the clusters appeared to be the time period rather than important differences in thunderstorm frequency patterns.

4.7. Comparisons with Observation

Figure 7. observed vs. Predicted thunderstorm frequency(Time Series Plot of Model Predictions).
Preprints 120380 g007
I.
Model Performance:
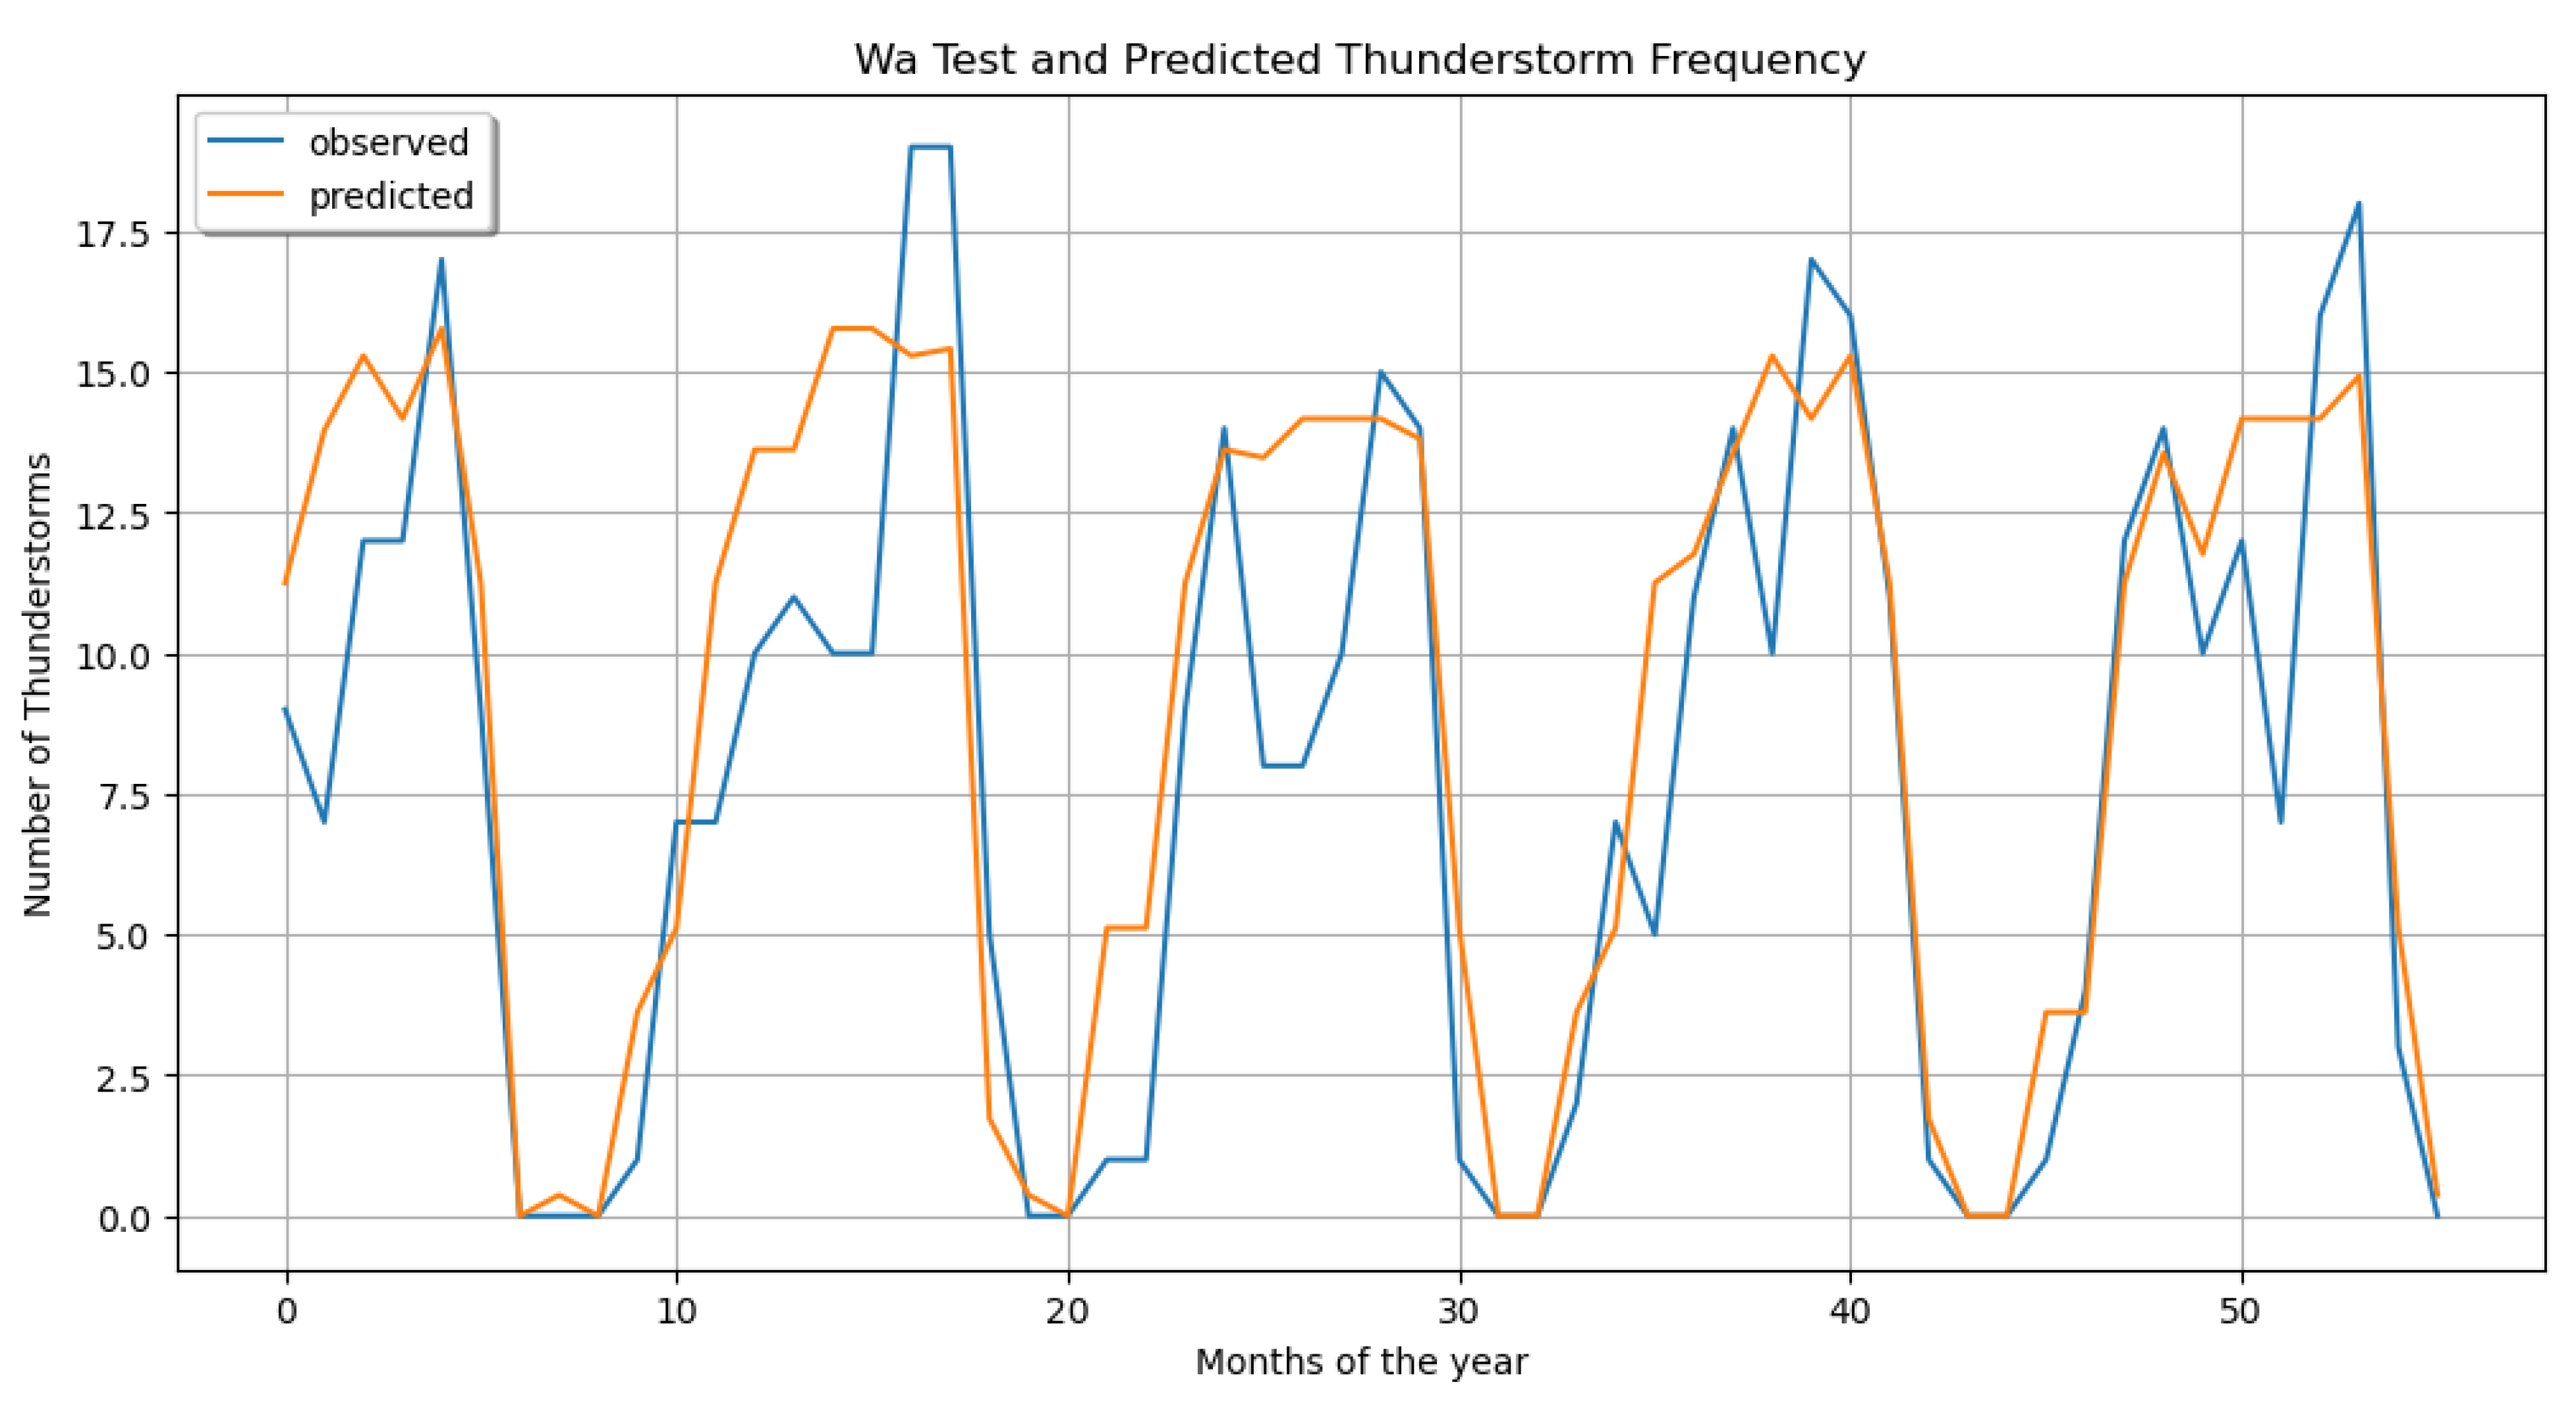
The figure above shows that the machine learning model was able to capture the general trend and seasonality of thunderstorm occurrences in Wa. The predicted values (orange line) closely followed the pattern of the observed values (blue line) throughout the time series, showing that the model had learned the underlying seasonal patterns of thunderstorm frequency in the region. Research shows the importance of various meteorological predictors, such as humidity and cloud water content, can vary with the season. For example, during the monsoon season in tropical regions, moisture-related features tend to increase due to the high availability of water vapor (Romatschke & Houze, 2010). Conversely, in drier periods, other factors such as wind shear or temperature gradients may become more influential.
II.
Comparison with Observations:
When comparing the model’s predictions with thunderstorm observations, these are what were seen:
  • Seasonal Patterns: The model successfully captured the cyclical nature of thunderstorm occurrences, with peaks and troughs aligning well between predicted and observed values. This suggested that the model effectively learned the seasonal variations in thunderstorm frequency.
  • Magnitude Alignment: In many instances, the predicted thunderstorm frequency closely matched the observed frequency, particularly during periods of low activity (near zero occurrences) and moderate activity (around 10-15 thunderstorms).
  • Peak intensity: The model showed some limitations in predicting extreme peaks. For example, around March, there was a sharp observed peak of about 19 thunderstorms, which the model underestimated, predicting around 15 thunderstorms.
  • Lag in the Predictions: At certain points, there appeared to be a small lag between the predicted and observed values. This was particularly noticeable around July and September, where the predicted peaks and troughs seemed to occur slightly after the observed ones.
  • Overestimation during Low Activity: In some low-activity periods, such as around month 5, the model had tended to overestimate the number of thunderstorms, predicting activity when there were actually very few or no observed thunderstorms.
  • Variability Capture: While the model captured the overall trend well, it sometimes smoothed out the short-term variability present in the observed data. This was evident in the more jagged appearance of the observed line compared to the smoother predicted line.
These observations shows that while the model performed well in capturing the general patterns and seasonality of thunderstorm occurrences in Wa, there were some anomalies or inconsistencies in predicting extreme events and short-term variability. The model’s ability to closely follow the overall trend showed its usefulness for general forecasting, but its limitations in capturing extreme events and fine-grained variations should be seen.

4.8. Scatter Plot Showing The Model Performance
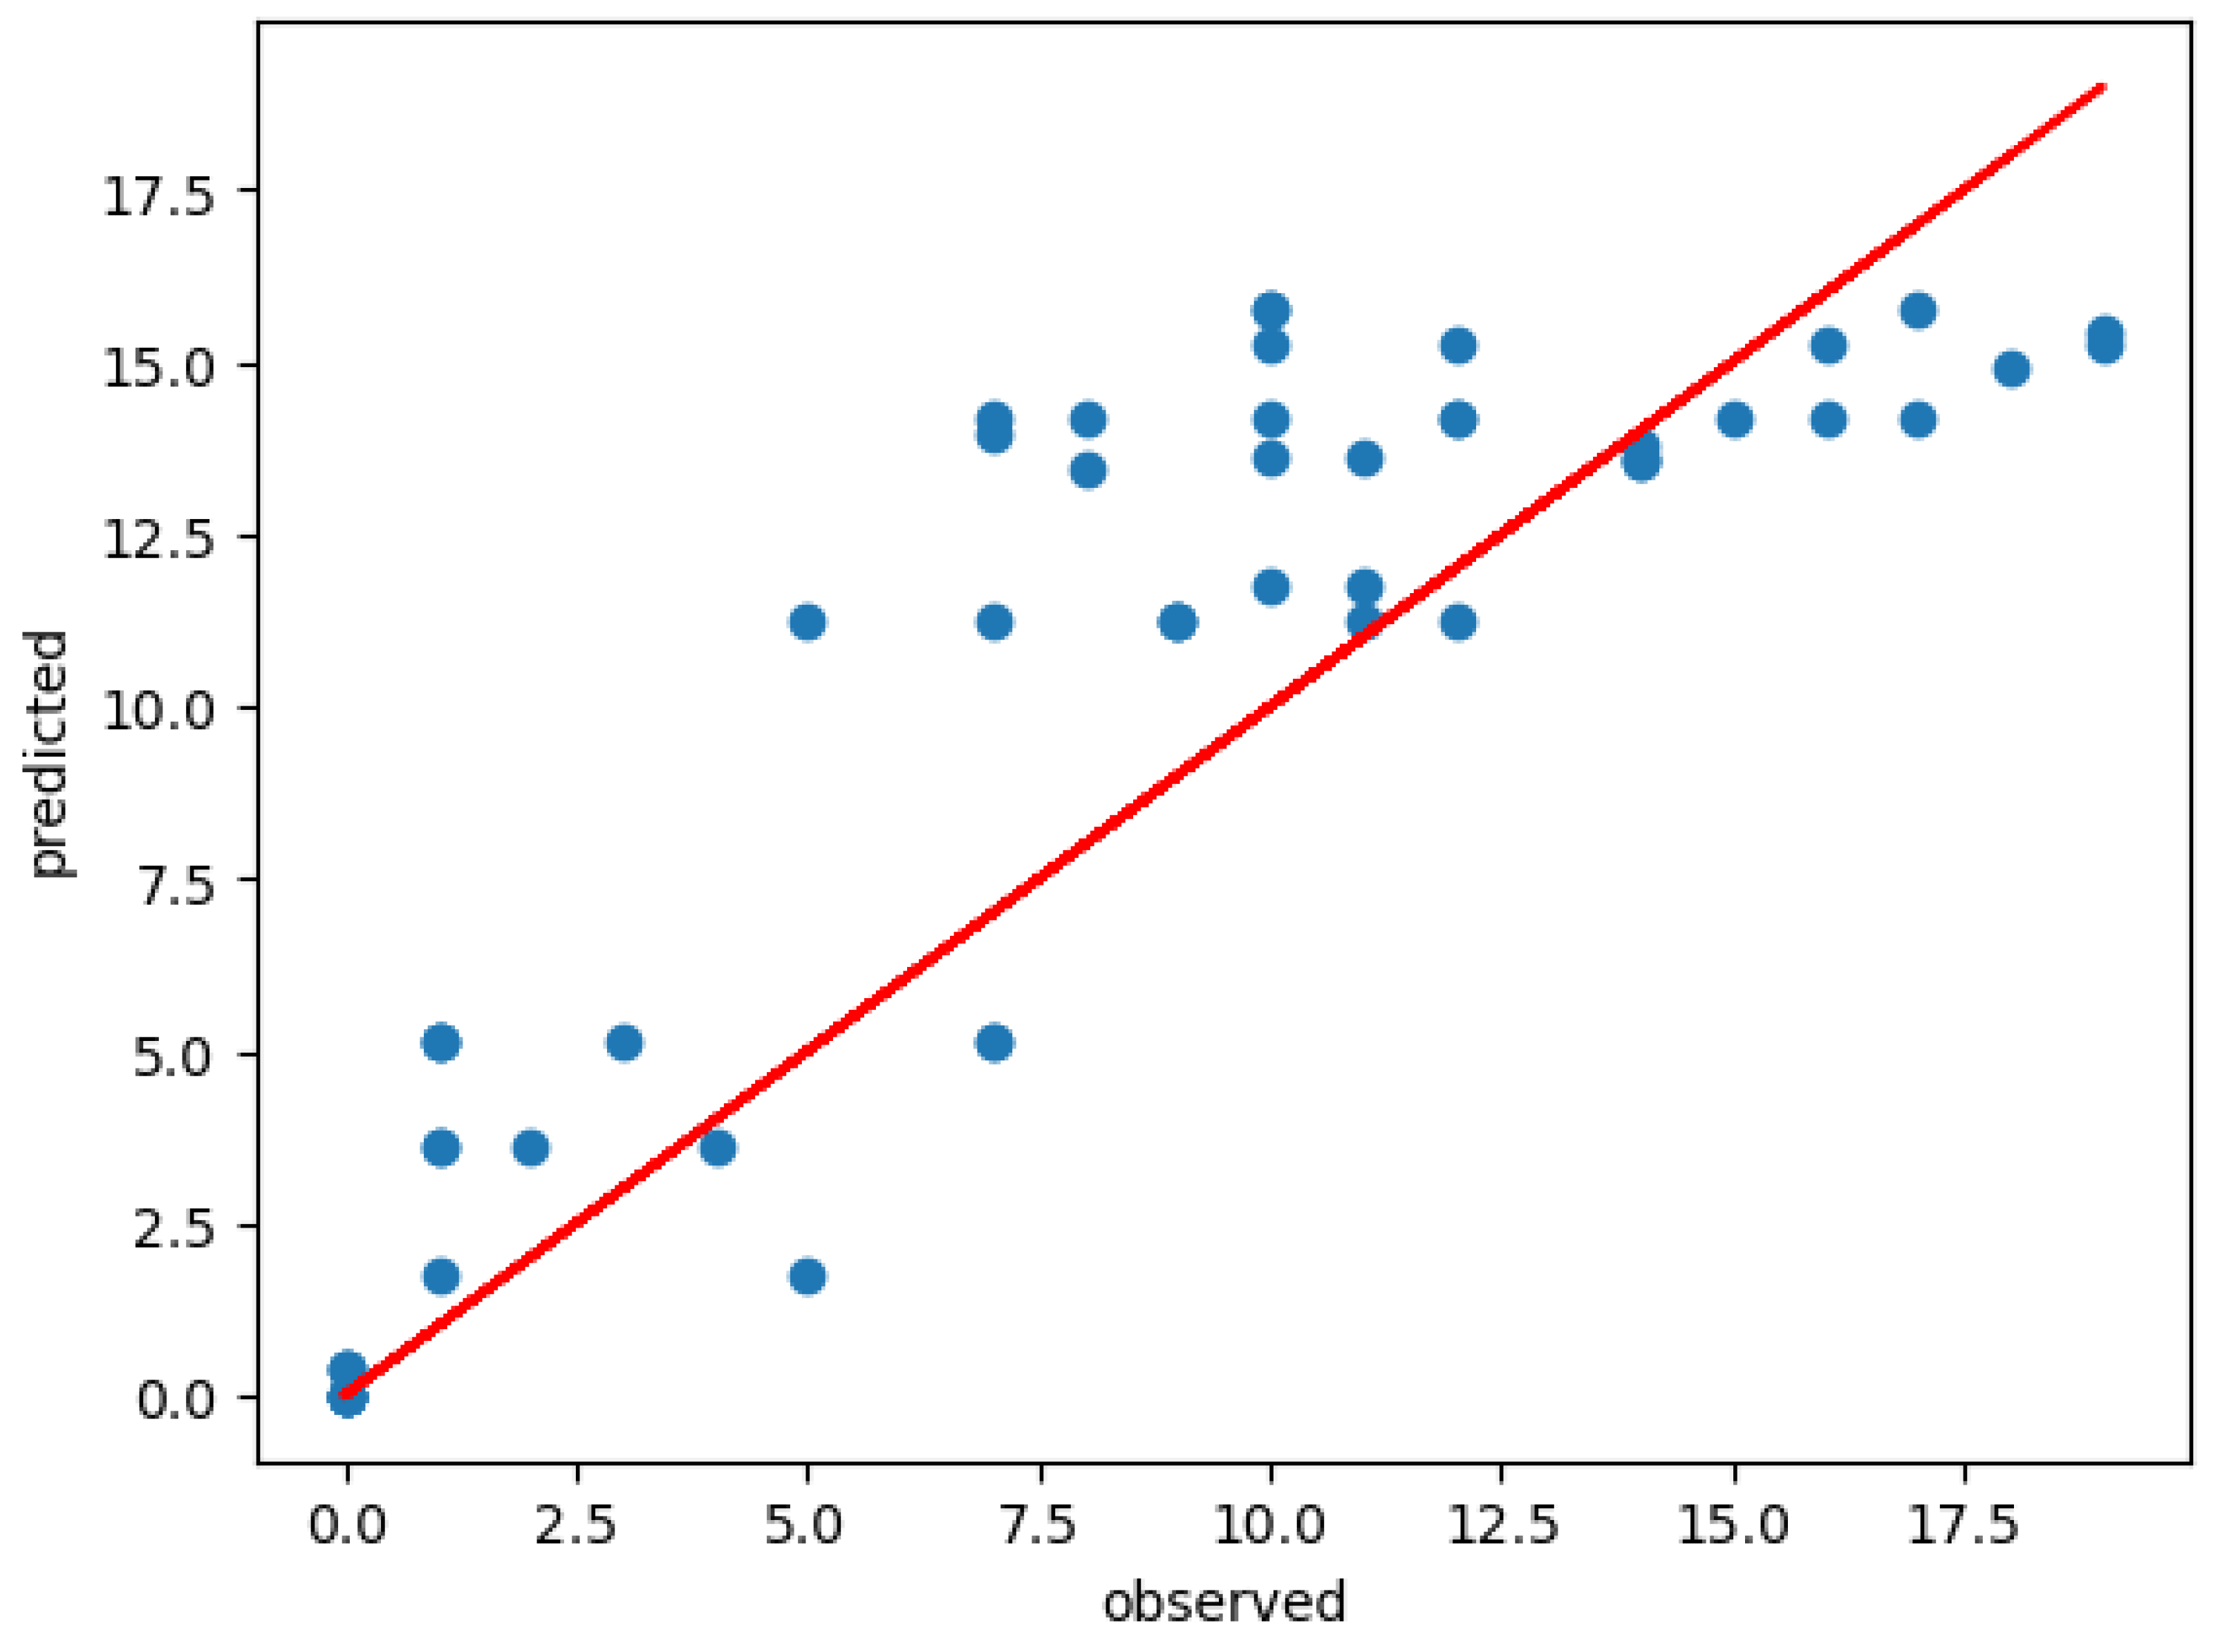
Figure 9. Scatter plot showing model perform observed and predicted.
Preprints 120380 g008
  • Model Performance:
The scatter plot also showed many important aspects of the model’s performance. There was a clear positive correlation between the observed and predicted values. Many points also closed-in around the red diagonal line, which represented good prediction. This showed that the model was often able to make accurate predictions, especially in the mid-range of thunderstorm frequencies. The spread of points around the diagonal line provided insight into the model’s precision. The moderate scatter showed that while the model was generally accurate. Analyzing the scatter plot also revealed many patterns in how the model’s predictions compared to actual observations. The model predicts thunderstorm frequencies ranging from 0 to about 17, which closely matched the range of observed frequencies. This showed that the model was capable of capturing the full range of thunderstorm activity in the region (Wa).
2. Bias at different ranges:
Low Frequencies: For observed frequencies below 5, the model showed a small tendency to overestimate, as many points in this range fell above the diagonal line.
Mid-Range Frequencies: The most notable feature is that the model tends to overpredict in the mid-range of observed thunderstorm frequencies (7-12 observed storms). In this range, many of the predicted values lie above the red diagonal line, indicated that the model predicts higher frequencies than what was observed.
High Frequencies: For observed frequencies above 12, there was a noticeable trend of underestimation, with most points falling below the diagonal line.
These observations indicated that while the model showed good overall performance, it had some systematic biases. It tended to overestimate low frequencies, underestimate high frequencies, and showed more variability in its predictions for moderate thunderstorm activity.

4.9. Feature Importance

Figure 7. Feature importance.
Preprints 120380 g009
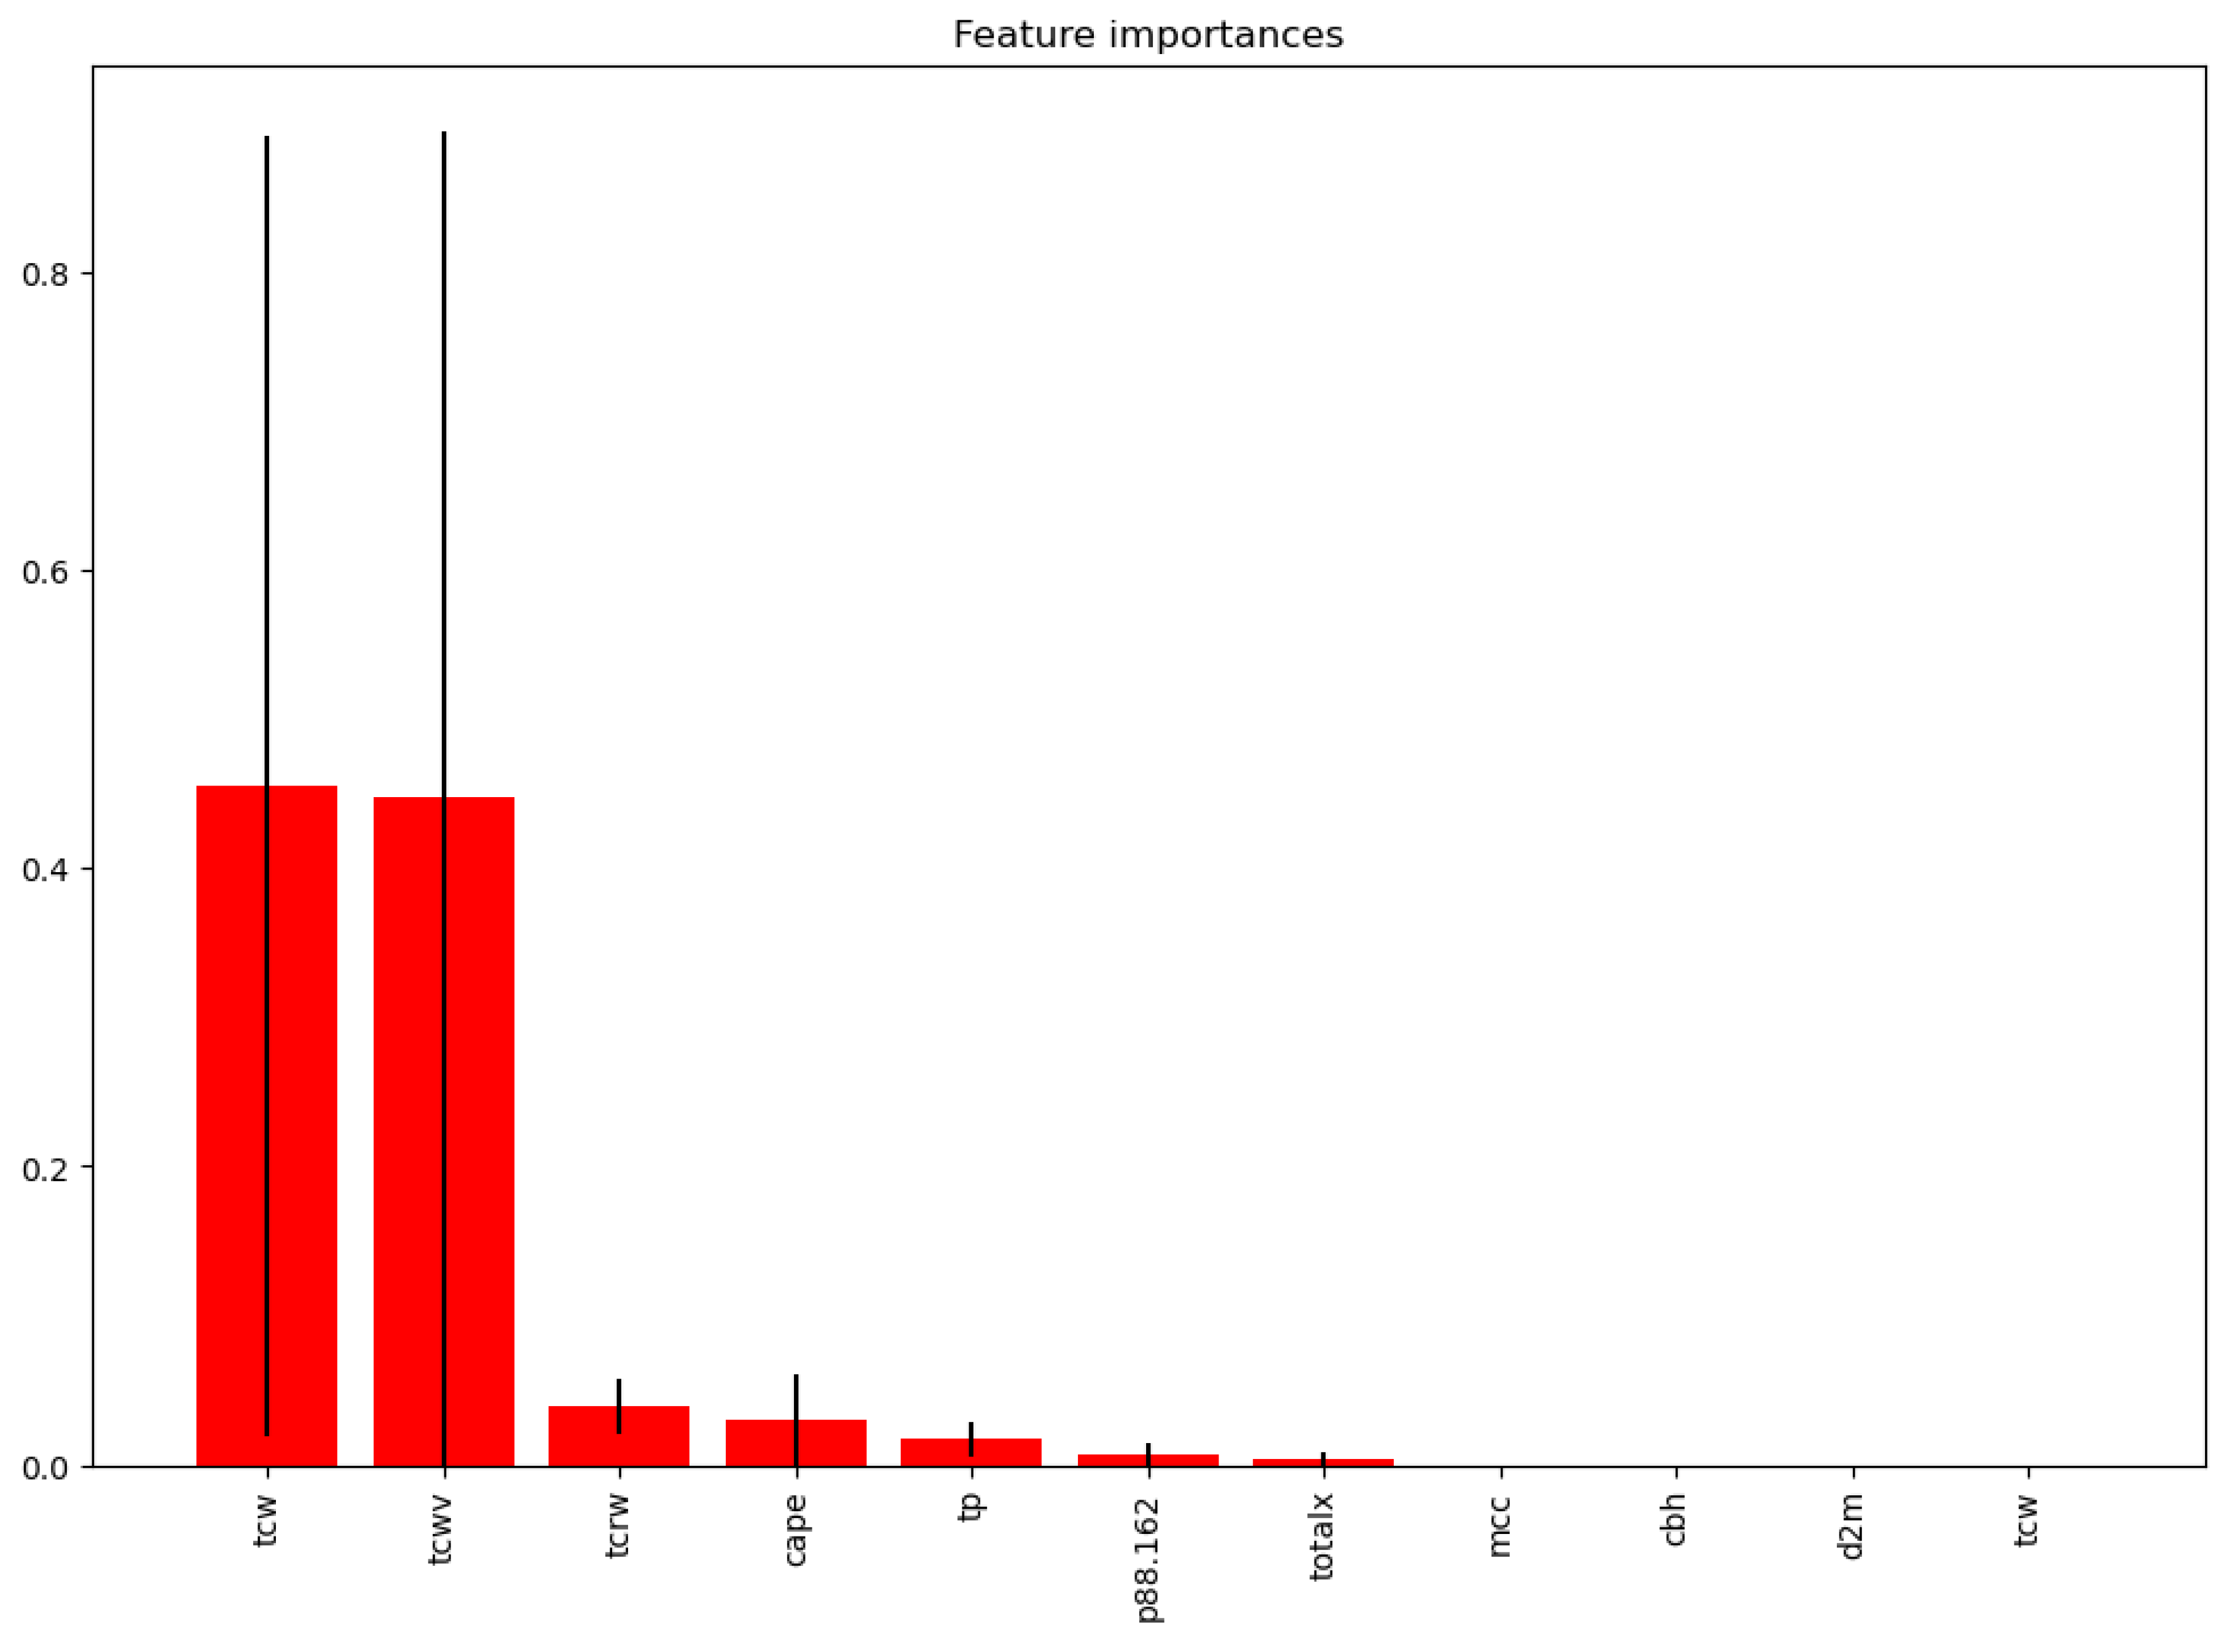
The image above clearly showed that features Total Column Water and Total Column Water Vapor were by far the most important predictors in the model, with importance scores of approximately 0.47 and 0.46. These two features alone accounted for the big majority of the model’s predictive power. Total Column Rain Water and Convective Available Potential Energy emerged as the next most important, although with much lower importance scores of around 0.05 and 0.03. While these features contributed to the model’s predictions, their impact was less than the top two. Vertical integral of eastward cloud liquid water flux, Total Totals Index, Mesoscale Convective Complex, Cloud Based Height, and 2-meter Dewpoint Temperature showed very low importance scores, each contributing less than 0.02 to the model’s predictions. This showed that these features had minimal impact on the model’s output. The importance scores showed a clear hierarchy among the features, with a sharp drop-off after the top two. This shows that the model relied heavily on a small subset of the available features for making predictions.
Studies have shown the important role of moisture in the thunderstorm formation. Moisture in the atmosphere, particularly Total Column Water Vapor(tcwv), serves as the primary fuel for convective process that leads to thunderstorm (Doswell, 2001). Higher moisture levels are directly associated with increased instability in the atmosphere, promoting development of convective clouds and storms Convective Available Potential Energy (CAPE) is widely regarded as key predictor of thunderstorm potential. It measures the amount of light energy available to parcels of air, with higher CAPE values showing greater potential for severe storms (Emmanuel, 1994). However, its predictive power can vary depending on geographical region and prevailing weather patterns.

CHAPTER 5

5.1. Recommendations

Based on the findings of this study the following recommendations are proposed for various stakeholders:
For farmers and agricultural practitioners:
  • Seasonal Planning: utilizes the thunderstorm frequency predictions to optimize planting schedules, especially for crops sensitive to heavy rainfall or strong winds.
  • Water Management: Implement improved water management strategies based on predicted thunderstorms patterns, including enhanced drainage systems for period of high thunderstorm activity and water conservation methods for drier period.
  • Crop Selection: Consider diversifying crop selection to include varieties more resilient to predicted thunderstorm patterns in the region.
  • Risk Mitigation: Develop contingency plan for period of high thunderstorm activity, including measures to protect livestock and secure farm equipment.
For Policymakers and Government Agencies:
  • Early Warning Systems: Invest in and implement early warning systems that integrate this thunderstorm prediction model to alert farmers and rural communities about impending severe weather events.
  • Infrastructure Development: Prioritize the development of climate resilient agricultural infrastructure, such as improved drainage systems and sheltered storage facilities, in areas prone to frequent thunderstorm.
  • Agricultural Insurance: Develop and promote weather-indexed insurance products for farmers, using the thunderstorm prediction model as a basis for risk assessment and policy design.
  • Research Funding: Allocate resources for continued research into climate change impacts on local weather patterns and their effects on agriculture in the Wa region.
For Meteorological Services and Researchers:
  • Model Refinement: Continue to refine the prediction model by integrating higher resolution data and exploring advanced machine learning techniques such as deep learning or ensemble methods.
  • Spatial Analysis: Expand the study to include spatial analysis, mapping thunderstorm frequency and intensity across different parts of the region to identify high-risk areas.
  • Climate Change Integration: Investigate the potential impacts of climate change on thunderstorm patterns in the region and integrate these projections into long term prediction model.
  • Cross-disciplinary Collaboration: Foster partnership between meteorologist, agronomist, and economist to develop integrated model that link weather predictions directly to agricultural yield forecasts and economic impacts.
  • Data Collection Enhancement: Improve the quality and density of weather monitoring stations in the region to provide more accurate and localized data for future model iterations.
For Agricultural Extension Services:
  • Training Programs: Develop and implement training programs for farmers on interpreting and utilizing thunderstorm predictions in their agricultural decision-making processes.
  • Information Dissemination: Establish effective channels for disseminating timely thunderstorm predictions and related agricultural advisories to rural communities, possibly leveraging mobile technologies.
  • Adaptive Practices: Promote and teach adaptive agricultural practices that are resilient to variable weather conditions, including soil conservation techniques and crop diversification.
For the Broader Scientific Community:
  • Methodology Sharing: Share the methodologies and findings of this study to encourage similar research in other regions and other fields of study, facilitating a global understanding of thunderstorm patterns and their agricultural impacts.
  • Interdisciplinary Research: Encourage interdisciplinary research projects that combine meteorology, agriculture, economic and social sciences to provide all-inclusive understanding of weather impacts on rural livelihood.

5.2. Conclusion

The research developed a machine learning model for predicting thunderstorm frequency in the Wa region, with implications for agricultural planning and management. The model demonstrated good predictive capability, explaining roughly 72.6% of the variance in thunderstorm occurrences, with a mean absolute error of 2.34 storms.

5.2.1. Key Findings Include:

1. The critical importance of atmospheric moisture content, particularly Total Column Water (TCW) and Total Column Rain Water (TCRW), in predicting thunderstorm frequency.
2. The secondary but important role of atmospheric instability measures like Convective Available Potential Energy (CAPE) in the prediction model.
3. The model’s ability to capture overall trends in thunderstorm frequency, as evidenced by the high Index of Agreement (0.926).

5.2.2. Contribution of The Research

The research contributes to the field of thunderstorm prediction by:
1. Demonstrating the effectiveness of machine learning techniques in capturing complex atmospheric interactions leading to thunderstorm formation.
2. Highlighting the relative importance of different meteorological variables in thunderstorm prediction for this specific geographical area.
3. Providing a framework for linking thunderstorm predictions to agricultural impacts, enhancing the practical applicability of the model.

Acknowledgments

I would like to express my sincere gratitude to my supervisor, Dr. Robert A. Akum, for his invaluable guidance, support and expertise throughout this research project. His insights and encouragement were instrumental in shaping this study and bringing it to fruition. I also extend my thanks to the Department of Environment and Resource Studies at S.D.D. University of Business and Integrated Development Studies for providing the resource and environment conducive to conducting this research.

References

  1. Sharma, A.; Jain, A.; Gupta, P.; Chowdary, V. Machine learning applications for precision agriculture: A comprehensive review. IEEE Access 2020, 9, 4843–4873. [Google Scholar] [CrossRef]
  2. Anjana, Aishwarya Kedlaya K, Aysha Sana, B Apoorva Bhat, Sharath Kumar, Nagaraj Bhat, An efficient algorithm for predicting crop using historical data and pattern matching technique, Global Transitions Proceedings, Volume 2, Issue 2, 2021. [CrossRef]
  3. Antwi-Agyei, P.; Fraser, E.D.; Dougill, A.J.; Stringer, L.C.; Simelton, E. Mapping the vulnerability of crop production to drought in Ghana using rainfall, yield, and socioeconomic data. Applied Geography 2012, 32, 324–334. [Google Scholar] [CrossRef]
  4. Antwi-Agyei, P.; Stringer, L.C.; Dougill, A.J. Livelihood adaptations to climate variability: insights from farming households in Ghana. Regional Environmental Change 2014, 14, 1615–1626. [Google Scholar] [CrossRef]
  5. Arul, M.; Kareem, A.; Burlando, M.; Solari, G. Machine learning based automated identification of thunderstorms from anemometric records using shapelet transform. Journal of Wind Engineering and Industrial Aerodynamics 2022, 220, 104856. [Google Scholar] [CrossRef]
  6. Associate For Change (2012). Ghana food security with a focus on upper west region. Mennonite Economic Department Associates.
  7. Assous, H.F.; AL-Najjar, H.; Al-Rousan, N.; AL-Najjar, D. Developing a Sustainable Machine Learning Model to Predict Crop Yield in the Gulf Countries. Sustainability 2023, 15, 9392. [Google Scholar] [CrossRef]
  8. Azad MA, K.; Islam AR, M.T.; Rahman, M.S.; Ayen, K. Development of novel hybrid machine learning models for monthly thunderstorm frequency prediction over Bangladesh. Natural Hazards 2021, 108, 1109–1135. [Google Scholar] [CrossRef]
  9. Bellman, R.E. (1961). Adaptive control processes: a guided tour. Princeton University Press.
  10. Berry, P.M.; Sterling, M.; Spink, J.H.; Baker, C.J.; Sylvester-Bradley, R.; Mooney, S.J.; Tams, A.R.; Ennos, A.R. Understanding and reducing lodging in cereals. Advances in Agronomy 2004, 84, 217–271. [Google Scholar]
  11. Buernor, A.B.; Kabiru, M.R.; Chaouni, B.; Akley, E.K.; Raklami, A.; Silatsa, F.B. , … & Jemo, M. (2023). On-farm managed trials and machine learning approaches for understanding variability in soybean yield in Northern Ghana.
  12. Cao, Q.; Miao, Y.; Feng, G.; Gao, X.; Li, F.; Liu, B. , … & Khosla, R. Coupling machine learning models and crop models to forecast wheat productivity in Kansas. Scientific Reports 2021, 11, 1–13. [Google Scholar] [CrossRef]
  13. Cedric, L.S.; Adoni WY, H.; Aworka, R.; Zoueu, J.T.; Mutombo, F.K.; Krichen, M.; Kimpolo CL, M. Crops yield prediction based on machine learning models: Case of West African countries. Smart Agricultural Technology 2022, 2, 100049. [Google Scholar] [CrossRef]
  14. Chandrashekar, G.; Sahin, F. A survey on feature selection methods. Computers & Electrical Engineering 2014, 40, 16–28. [Google Scholar]
  15. Codjoe, S.N.A.; Owusu, G.; Burkett, V. Perception, experience, and indigenous knowledge of climate change and variability: the case of Accra, a sub-Saharan African city. Regional Environmental Change 2014, 14, 369–383. [Google Scholar] [CrossRef]
  16. Crane, T.A.; Roncoli, C.; Hoogenboom, G. Adaptation to climate change and climate variability: The importance of understanding agriculture as performance. NJAS-Wageningen Journal of Life Sciences 2011, 57, 179–185. [Google Scholar] [CrossRef]
  17. Crane, T.A.; Roncoli, C.; Hoogenboom, G. Adaptation to climate change and climate variability: The importance of understanding agriculture as performance. NJAS – Wageningen Journal of Life Sciences 2011, 57, 179–185. [Google Scholar] [CrossRef]
  18. Di Falco, S.; Veronesi, M. How can African agriculture adapt to climate change? A counterfactual analysis from Ethiopia. Land Economics 2013, 89, 743–766. [Google Scholar] [CrossRef]
  19. Dormann, C.F.; Elith, J.; Bacher, S.; Buchmann, C.; Carl, G.; Carré; G. , … & Lautenbach, S. Collinearity: a review of methods to deal with it and a simulation study evaluating their performance. Ecography 2013, 36, 27–46. [Google Scholar]
  20. Doswell III, C.A. (2001). Severe convective storms—An overview. In Severe convective storms (pp. 1-26). American Meteorological Society.
  21. Emmanuel, K.A. (1994). Atmospheric Convection. Oxford University Press.
  22. FAO, 2021. The State of Food and Agriculture 2021. Rome, FAO.
  23. Ghana Statistical Service, 2020. Population and Housing Census: Regional Report – Upper West Region.
  24. Gijben, M.; Dyson, L.L.; Loots, M.T. A statistical scheme to forecast the daily lightning threat over southern Africa using the Unified Model. Atmospheric Research 2017, 194, 78–88. [Google Scholar] [CrossRef]
  25. Gijben, M.; Dyson, L.L.; Loots, M.T. A statistical scheme to forecast the daily lightning threat over southern Africa using the Unified Model. Atmospheric Research 2017, 194, 78–88. [Google Scholar] [CrossRef]
  26. Guyon, I.; Elisseeff, A. An introduction to variable and feature selection. Journal of Machine Learning Research 2003, 3, 1157–1182. [Google Scholar]
  27. Holle, R.L. , 2008. Annual rates of lightning fatalities by country. 20th International Lightning Detection Conference.
  28. Howden, S.M.; Soussana, J.F.; Tubiello, F.N.; Chhetri, N.; Dunlop, M.; Meinke, H. Adapting agriculture to climate change. Proceedings of the National Academy of Sciences 2007, 104, 19691–19696. [Google Scholar] [CrossRef]
  29. Huffman, G.J.; Bolvin, D.T.; Nelkin, E.J.; Wolff, D.B.; Adler, R.F.; Gu, G. , … & Stocker, E.F. The TRMM multisatellite precipitation analysis (TMPA): Quasi-global, multiyear, combined-sensor precipitation estimates at fine scales. Journal of Hydrometeorology 2007, 8, 38–55. [Google Scholar]
  30. Kamangir, H.; Collins, W.; Tissot, P.; King, S.A. A deep-learning model to predict thunderstorms within 400 km2 South Texas domains. Meteorological Applications 2020, 27, e1905. [Google Scholar] [CrossRef]
  31. Khaki, S.; Wang, L. Crop yield prediction using deep neural networks. Frontiers in plant science 2019, 10, 621. [Google Scholar] [CrossRef] [PubMed]
  32. Kotir, J.H. Climate change and variability in Sub-Saharan Africa: a review of current and future trends and impacts on agriculture and food security. Environment, Development and Sustainability 2011, 13, 587–605. [Google Scholar] [CrossRef]
  33. Lesk, C.; Rowhani, P.; Ramankutty, N. Influence of extreme weather disasters on global crop production. Nature 2016, 529, 84–87. [Google Scholar] [CrossRef]
  34. Lesk, C.; Rowhani, P.; Ramankutty, N. Influence of extreme weather disasters on global crop production. Nature 2016, 529, 84–87. [Google Scholar] [CrossRef]
  35. Litta, A.J.; Mohanty, U.C. Simulation of a severe thunderstorm event during the field experiment of STORM programme 2006, using WRF–NMM model. Current Science 2008, 204–215. [Google Scholar]
  36. Litta, A.J.; Idicula, S.M.; Mohanty, U.C. Artificial neural network model in prediction of meteorological parameters during premonsoon thunderstorms. International Journal of Atmospheric Sciences 2012, 2013. [Google Scholar] [CrossRef]
  37. Litta, A.J.; Idicula, S.M.; Mohanty, U.C. Artificial neural network model in prediction of meteorological parameters during premonsoon thunderstorms. International Journal of Atmospheric Sciences 2012, 2013. [Google Scholar] [CrossRef]
  38. Lobell, D.B.; Gourdji, S.M. The influence of climate change on global crop productivity. Plant physiology 2012, 160, 1686–1697. [Google Scholar] [CrossRef]
  39. Lobell, D.B.; Schlenker, W.; Costa-Roberts, J. Climate trends and global crop production since 1980. Science 2011, 333, 616–620. [Google Scholar] [CrossRef] [PubMed]
  40. Lontsi Saadio Cedric, Wilfried Yves Hamilton Adoni, Rubby Aworkaa, Jérémie Thouakesseh Zoueuc, Franck Kalala Mutomboa, Moez Krichenf, Charles Lebon Mberi Kimpolo (2022). Crops yield prediction based on machine learning models: Case of West African countries. Elsevier.
  41. Markowski, P.; Richardson, Y. (2010). Mesoscale meteorology in midlatitudes (Vol. 2). John Wiley & Sons.
  42. Ministry of food and agriculture (2020). Profile of Upper West Region: Investment Opportunities. https://mofa.gov.gh.
  43. Ministry of Food and Agriculture, Ghana, 2022. Agriculture in Ghana: Facts and Figures.
  44. Naab, F.Z.; Abubakari, Z.; Ahmed, A. The role of climate services in agricultural productivity in Ghana: The perspectives of farmers and institutions. Climate Services 2019, 13, 24–32. [Google Scholar] [CrossRef]
  45. Naveen Kumar Mahanti, Konga Upendar, Subir Kumar Chakraborty (2022). Comparison of artificial neural network and linear regression model for the leaf morphology of fenugreek (Trigonella foenum graecum) grown under different nitrogen fertilizer doses. Elsevier. [CrossRef]
  46. Nicholson, S.E. The ITCZ and the seasonal cycle over equatorial Africa. Bulletin of the American Meteorological Society 2018, 99, 337–348. [Google Scholar] [CrossRef]
  47. Nyong, A.; Adesina, F.; Osman Elasha, B. The value of indigenous knowledge in climate change mitigation and adaptation strategies in the African Sahel. Mitigation and Adaptation Strategies for Global Change 2007, 12, 787–797. [Google Scholar] [CrossRef]
  48. Oikonomidis, A.; Catal, C.; Kassahun, A. Deep learning for crop yield prediction: a systematic literature review. New Zealand Journal of Crop and Horticultural Science 2023, 51, 1–26. [Google Scholar] [CrossRef]
  49. Owusu, K.; Waylen, P.R. The changing rainy season climatology of mid-Ghana. Theoretical and Applied Climatology 2013, 112, 419–430. [Google Scholar] [CrossRef]
  50. Paudel, D.; Boogaard, H.; de Wit, A.; Janssen, S.; Osinga, S.; Pylianidis, C.; Athanasiadis, I.N. Machine learning for large-scale crop yield forecasting. Agricultural Systems 2021, 187, 103016. [Google Scholar] [CrossRef]
  51. Priyatikanto Rhorom, Mayangsari Lidia, Prihandoko Rudi, Admiranto Gunawan 2020 Classification of Continuous Sky Brightness Data Using Random Forest. Advances in Astronomy.
  52. Ramesh Medar, Vijay S Rajpurohit, Shweta (2019) IEEE 5th international conference for convergence in technology (I2CT), 1-5, 2019.
  53. Ribeiro, M.T.; Singh, S.; Guestrin, C. (2016). “Why should I trust you?”: Explaining the predictions of any classifier. In Proceedings of the 22nd ACM SIGKDD International Conference on Knowledge Discovery and Data Mining (pp. 1135-1144.
  54. Rorig, M.L.; McKay, S.J.; Ferguson, S.A.; Werth, P. Model-generated predictions of dry thunderstorm potential. Journal of Applied Meteorology and Climatology 2007, 46, 605–614. [Google Scholar] [CrossRef]
  55. Rosenzweig, C.; Iglesias, A.; Yang, X.B.; Epstein, P.R.; Chivian, E. Climate change and extreme weather events; implications for food production, plant diseases, and pests. Global Change and Human Health 2001, 2, 90–104. [Google Scholar] [CrossRef]
  56. Rosenzweig, C.; Iglesias, A.; Yang, X.B.; Epstein, P.R.; Chivian, E. Climate change and extreme weather events; implications for food production, plant diseases, and pests. Global Change and Human Health 2001, 2, 90–104. [Google Scholar] [CrossRef]
  57. Roudier, P.; Sultan, B.; Quirion, P.; Berg, A. The impact of future climate change on West African crop yields: What does the recent literature say? Global Environmental Change 2011, 21, 1073–1083. [Google Scholar] [CrossRef]
  58. Saeys, Y.; Inza, I.; Larrañaga, P. A review of feature selection techniques in bioinformatics. Bioinformatics 2007, 23, 2507–2517. [Google Scholar] [CrossRef] [PubMed]
  59. Shahhosseini, M.; Hu, G.; Archontoulis, S.V. Forecasting corn yield with machine learning ensembles combining crop models and climate data. arXiv, 2020; arXiv:2002.04647. [Google Scholar]
  60. Shi, W.; Tao, F.; Zhang, Z. A review on statistical models for identifying climate contributions to crop yields. Journal of geographical sciences 2013, 23, 567–576. [Google Scholar] [CrossRef]
  61. Sivakumar, M.V. Climate extremes and impacts on agriculture. Agroclimatology: Linking Agriculture to Climate 2020, 60, 621–647. [Google Scholar]
  62. Sorooshian, S.; Hsu, K.L.; Gao, X.; Gupta, H.V.; Imam, B.; Braithwaite, D. Evaluation of PERSIANN system satellite-based estimates of tropical rainfall. Bulletin of the American Meteorological Society 2000, 81, 2035–2046. [Google Scholar] [CrossRef]
  63. Sylla, M.B.; Nikiema, P.M.; Gibba, P.; Kebe, I.; Klutse, N.A.B. (2016). Climate change over West Africa: Recent trends and future projections. In Adaptation to climate change and variability in rural West Africa (pp. 25-40). Springer, Cham.
  64. Taylor, C.M.; Birch, C.E.; Parker, D.J.; Dixon, N.; Guichard, F.; Nikulin, G.; Lister, G.M.S. Modeling soil moisture-precipitation feedback in the Sahel: Importance of spatial scale versus convective parameterization. Geophysical Research Letters 2017, 44, 6495–6503. [Google Scholar] [CrossRef]
  65. Thiaw, W.M.; Gudgel, R.; Jha, B.; Kumar, A.; Murtugudde, R. Seasonal to interannual variability of rainfall over West Africa: A combined GCM and high-resolution satellite study. Journal of Geophysical Research: Atmospheres 2017, 122, 1758–1774. [Google Scholar]
  66. UNFCCC, Â. (1992). United Nations framework convention on climate change. Oct-2013. [On line]. Available in: http://unfccc. Int/2860. Php. [Access: 01-nov-2014].2.
  67. Vahid Yousefnia, K.; Bölle, T.; Zöbisch, I.; Gerz, T. A machine-learning approach to thunderstorm forecasting through post-processing of simulation data. Quarterly Journal of the Royal Meteorological Society 2023. [Google Scholar] [CrossRef]
  68. Veenadhari, S.; Misra, B.; Singh, C.D. (2014, January). Machine learning approach for forecasting crop yield based on climatic parameters. In 2014 International Conference on Computer Communication and Informatics (pp. 1-5). IEEE.
  69. World Meteorological Organization, 2021. Guidelines on the Definition and Monitoring of Extreme Weather and Climate Events.
  70. Zhang, X. ; Toudeshki; Ehsani, R.; Li, H.; Zhang, W.; Mac, R. (2022). Yield estimation of citrus fruit using rapid image processing in natural background. Elsevier.
  71. Yousefnia, K.V.; Bölle, T.; Zöbisch, I.; Gerz, T. A machine-learning approach to thunderstorm forecasting through post-processing of simulation data. arXiv 2023, arXiv:2303.08736. [Google Scholar] [CrossRef]
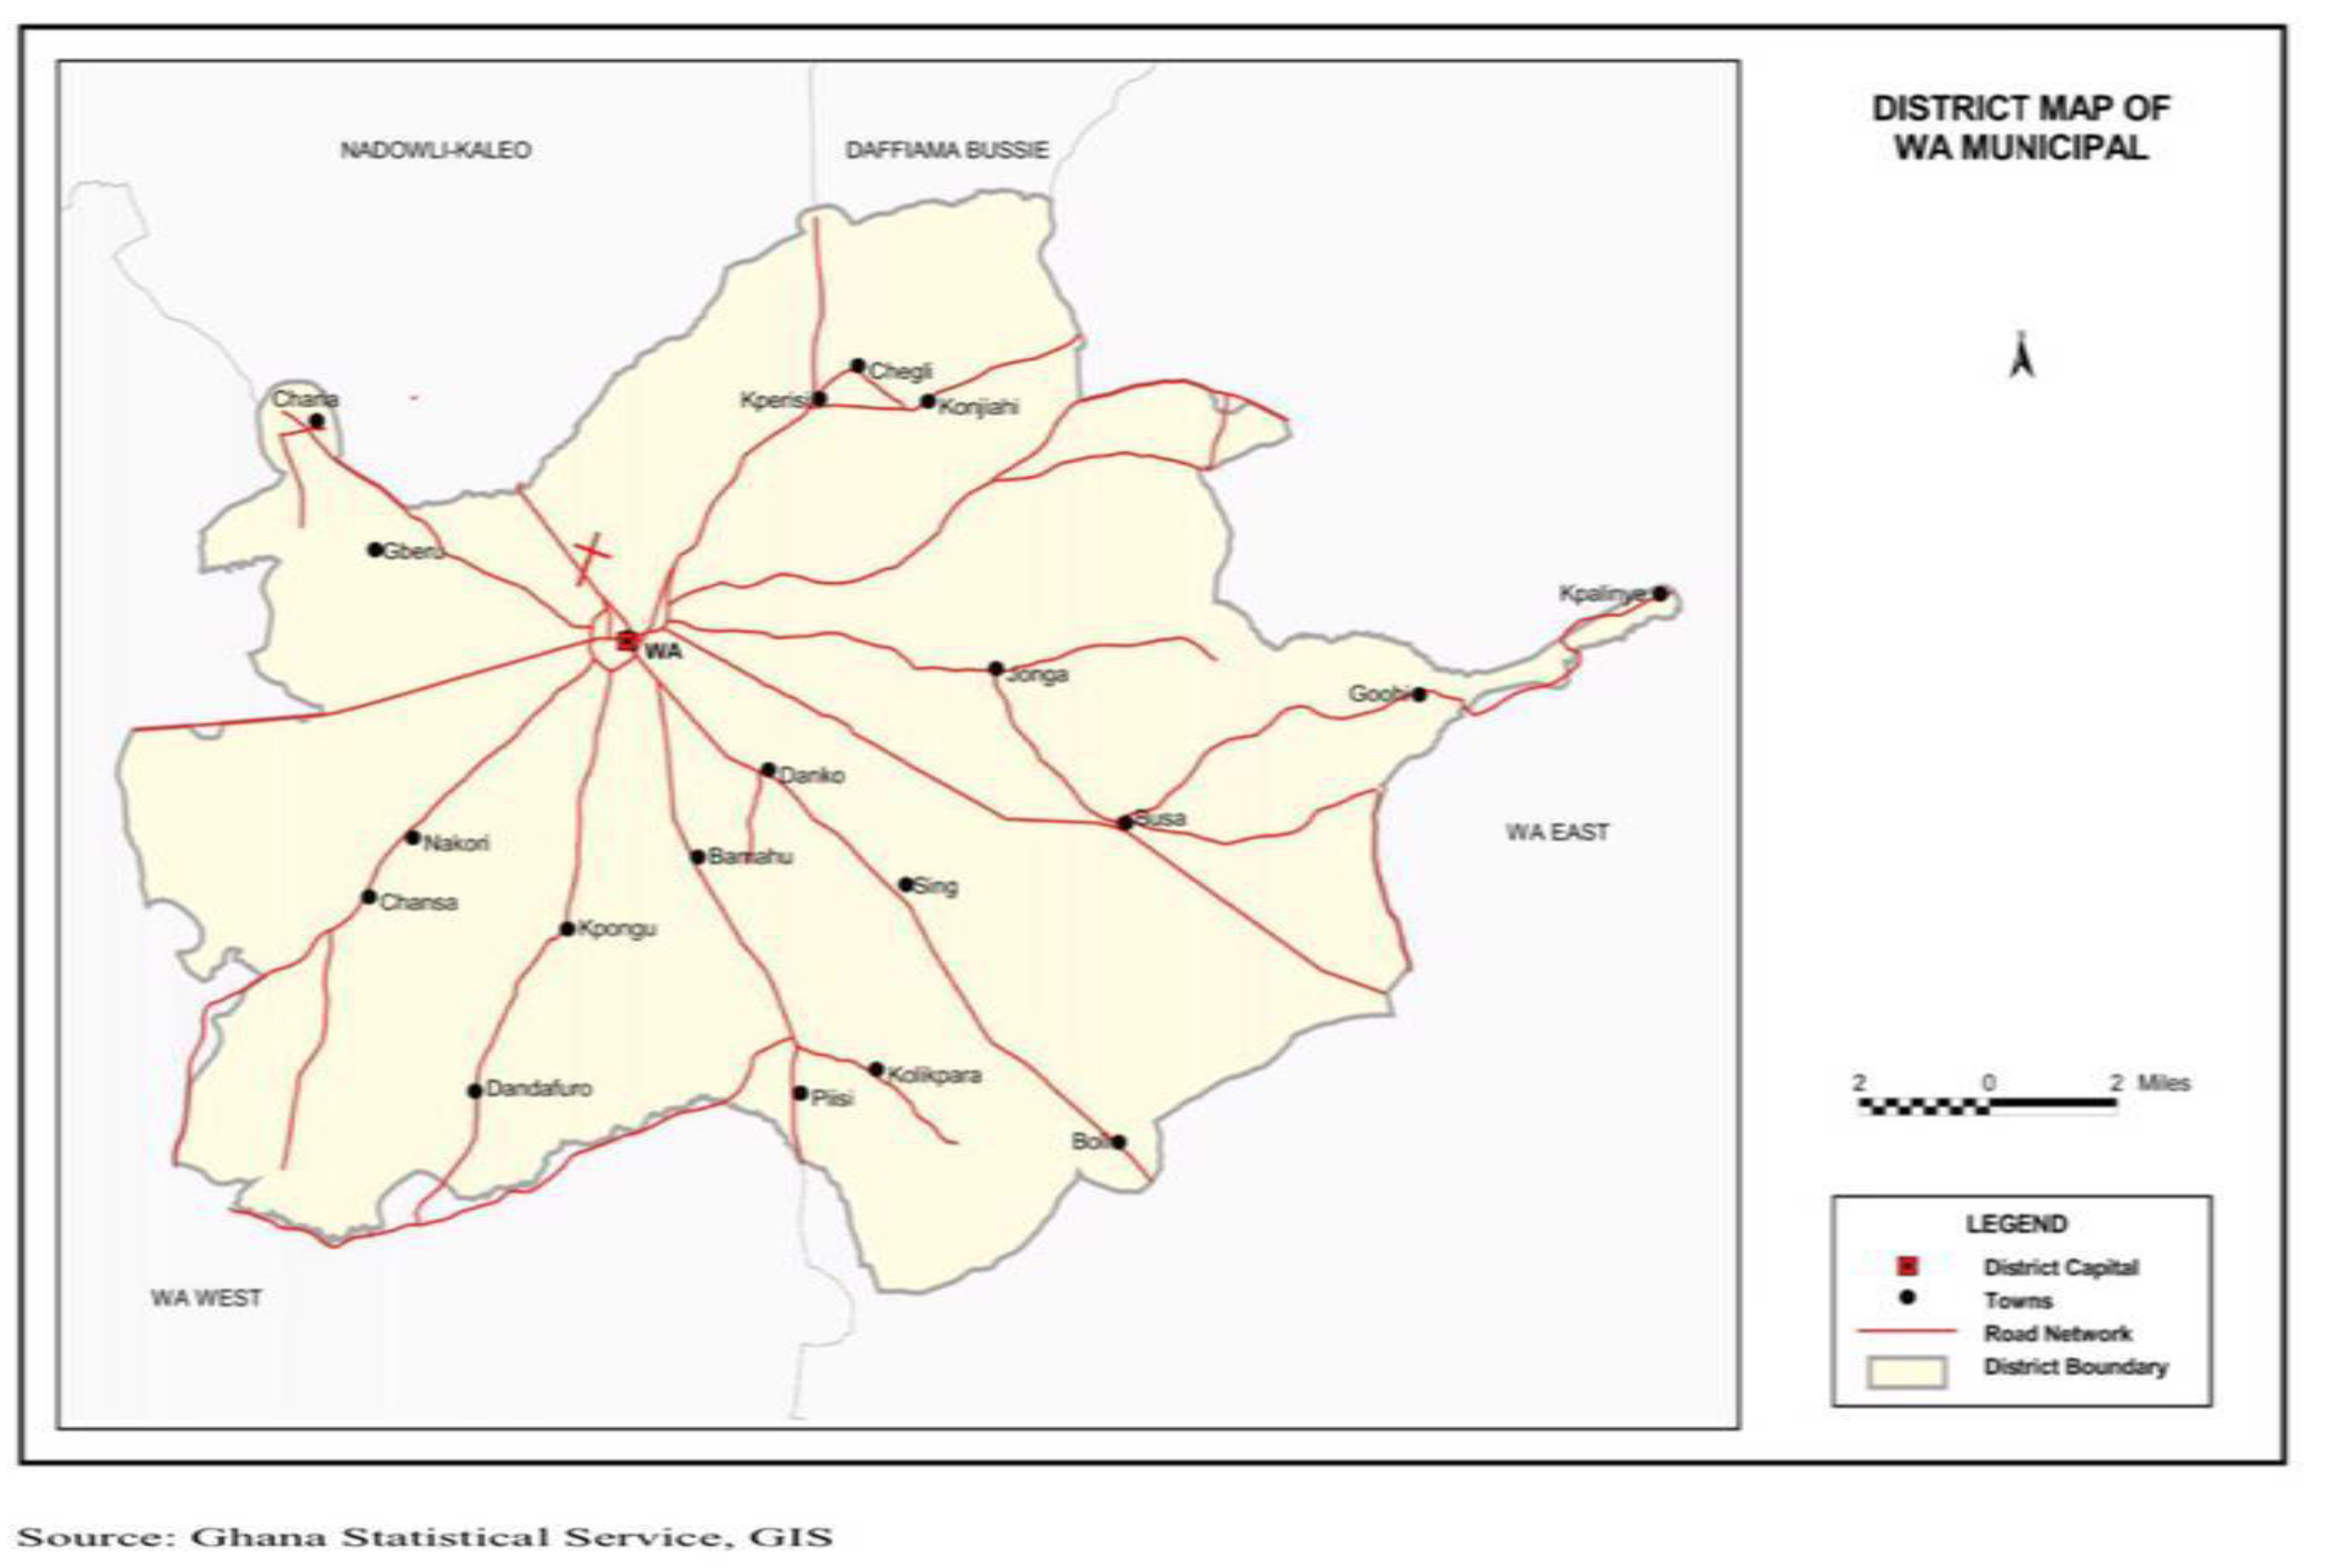
Figure 1. Map of Wa Municipal District.
Preprints 120380 g001
Disclaimer/Publisher’s Note: The statements, opinions and data contained in all publications are solely those of the individual author(s) and contributor(s) and not of MDPI and/or the editor(s). MDPI and/or the editor(s) disclaim responsibility for any injury to people or property resulting from any ideas, methods, instructions or products referred to in the content.
Copyright: This open access article is published under a Creative Commons CC BY 4.0 license, which permit the free download, distribution, and reuse, provided that the author and preprint are cited in any reuse.
Prerpints.org logo

Preprints.org is a free preprint server supported by MDPI in Basel, Switzerland.

Subscribe

© 2024 MDPI (Basel, Switzerland) unless otherwise stated