1. Introduction
Metal oxide semiconductors have long been recognized as exceptional materials for gas sensing applications due to their high sensitivity to trace gas concentrations, stability, low cost, and potential for miniaturization and low power consumption [
1,
2,
3]. However, while single metal oxide sensors offer broad gas detection capabilities, they often lack selectivity, presenting a significant challenge in distinguishing between different gases. To address this, recent research has focused on enhancing sensor selectivity through various methods, including doping with catalytic metals [
4], surface modifications [
5], and the development of multicompositional sensing films [
6,
7].
One particularly promising approach involves the use of heterostructures composed of dissimilar metal oxides, such as ZnO and SnO₂ [
8,
9]. These heterostructures leverage the formation of depletion layers at the junctions between different oxides, which can be modulated by the presence of target gases, thereby altering the sensor's conductivity [
10]. Additionally, combining two different metal oxides can increase gas adsorption sites, further improving sensor performance [
11,
12]. Among various combinations, ZnO/SnO₂ heterostructures have shown remarkable improvements in sensitivity and selectivity, particularly for detecting hazardous gases like hydrogen sulfide (H₂S) [
13,
14,
15].
In previous studies, the authors have shown Ultrasonic Spray Pyrolysis (USP) can be used to deposit densely packed thin films of ZnO/SnO₂ heterostructures for H₂S detection [
16]. These densely packed thin films achieved approximately 95 times better response than the pure SnO₂ sensor toward 5 ppm H₂S at an operating temperature of 450 °C, with the lowest detection concentration of 0.5 ppm. Also in [
17], Zhu et al. developed hierarchical and highly-ordered nanobowl ZnO/SnO₂ gas sensors, which demonstrated high sensitivity and selectivity for detecting H₂S gas at concentrations as low as 1 ppm, with long-term stability and repeatability. The hierarchical sensing materials were synthesized through a sequential process that involved hard template processing, atomic layer deposition, and hydrothermal processing. Additionally in [
18], Guo et al. conducted a study on the hydrothermal synthesis of ZnO/SnO₂ for H₂S detection. Their findings showed that this type of heterostructure exhibits better H₂S gas response and selectivity compared to other interfering gases such as NO, SO₂, CO, CH₄, and C₂H₅OH. The most important works concerning gas sensing of ZnO/SnO
2 heterostructure have been summarized in [
16].
H₂S is a highly toxic and flammable gas, characterized by its infamous rotten egg odor [
19]. Even at low concentrations, H₂S poses significant health risks, including respiratory irritation, dizziness, and, at higher concentrations, can be fatal [
20]. Additionally, H₂S is corrosive and can cause severe damage to equipment and infrastructure, particularly in industries such as petrochemicals, wastewater treatment, and natural gas processing [
21]. The ability to accurately detect and monitor H₂S levels is therefore crucial for ensuring safety in both industrial and environmental settings. This drives the motivation to develop highly sensitive and selective sensors capable of detecting H₂S at very low concentrations.
In this study, ZnO/SnO₂ porous heterostructures were successfully fabricated using a screen-printing method with mayer-bar, producing five distinct sensor compositions ranging from pure SnO₂ to pure ZnO. The structural, morphological, and gas sensing properties of these sensors were thoroughly investigated. The heaters, essential for achieving the optimal operational temperature, were fabricated using USP, which enabled precise and uniform deposition on the sensor substrate. The study shows that the SnO₂/ZnO ratio 3:4 sensor composition demonstrated highest gas sensing performance among investigated samples towards low concentrations of H₂S (5 ppb). To quantitatively evaluate sensor performance, the concept of analytical sensitivity was employed. Analytical sensitivity provides a robust measure of the sensor's ability to detect small changes in gas concentration. This approach allows for the optimization of sensor signal selection and the direct calculation of potential errors in gas concentration measurements. The results of this study highlight the potential of screen printed porous ZnO/SnO₂ heterostructure thick films in developing highly efficient gas sensors with low detection limits and high sensitivity for various applications.
2. Experimental Details
The substrates used for fabricating SnO₂-ZnO porous heterostructure sensors were high-purity (99%) alumina plates, laser cut into small dimensions of 3 mm × 3 mm × 0.5 mm. Prior to any deposition, these substrates underwent a cleaning process involving ultrasonic baths in acetone and distilled water, followed by air drying.
For microheater formation, the cleaned alumina substrates were directly placed on the hot stage of an USP system, previously reported for various applications [
22,
23,
24]. The precursor solution, consisting of 0.5 M stannous chloride dihydrate dissolved in 99.9% (v/v) ethanol, was prepared for USP deposition. The deposition process was carried out with a spray rate of 4 mL/min at a substrate temperature of 325°C for 30 minutes [
25,
26]. Post-deposition, the samples were annealed at 900°C for one hour in air to stabilize the microheater characteristics, particularly for high-temperature operations.
The screen-printing method was employed to deposit the ZnO/SnO₂ sensing layers onto the substrates [
27]. A homogeneous paste was prepared by grinding a mixture of SnO₂ and/or ZnO powder (Sigma-Aldrich, <100 nm particle size) with 1,2-propanediol (Sigma-Aldrich, 99.5+% ACS reagent) using a mortar. The resulting paste, with an oily/honey-like consistency, was coated onto the substrates using a mayer-bar coater equipped with a 16 µm grooved metallic bar. The bar was rolled over the alumina substrates at a speed of 20 mm/s, producing a uniform layer of the sensing material. The coated sensors were then left to settle at room temperature for 1 hour and subsequently dried on a hotplate at 80°C overnight. Finally, the sensors were annealed at 500°C for 10 minutes. The fabricated sensor details are listed in
Table 1.
The gas sensing properties of the fabricated sensors were evaluated in a controlled environment. The sensors were placed on a ceramic foundation equipped with electrical feedthroughs, housed within a stainless-steel chamber of 5 cm³ volume. The chamber, maintained in a cleanroom environment, was fitted with connectors for gas inlet and outlet.
The gas flow was controlled using mass flow controllers (MFCs), with a continuous flow of 500±5 ml/min, monitored by an independent flowmeter. Precleaned and dried compressed air was used as the carrier gas. Target gas mixtures, including 100 ppm and 1 ppm H₂S diluted in N₂, were introduced from standard analytical quality gas cylinders. The relative humidity of the gas mixtures was continuously monitored using a commercial humidity sensor and adjusted with a bubble humidifier.
The sensors' operating temperature was held steady at 325 °C during measurements, with temperature monitored using small s-type thermocouple. A constant voltage of 5 V was applied, and electrical parameters were measured using Keithley 2410 electrometers. The entire experiment was controlled via LabVIEW software, with data acquisition at 0.5-second intervals.
3. Results and Discussion
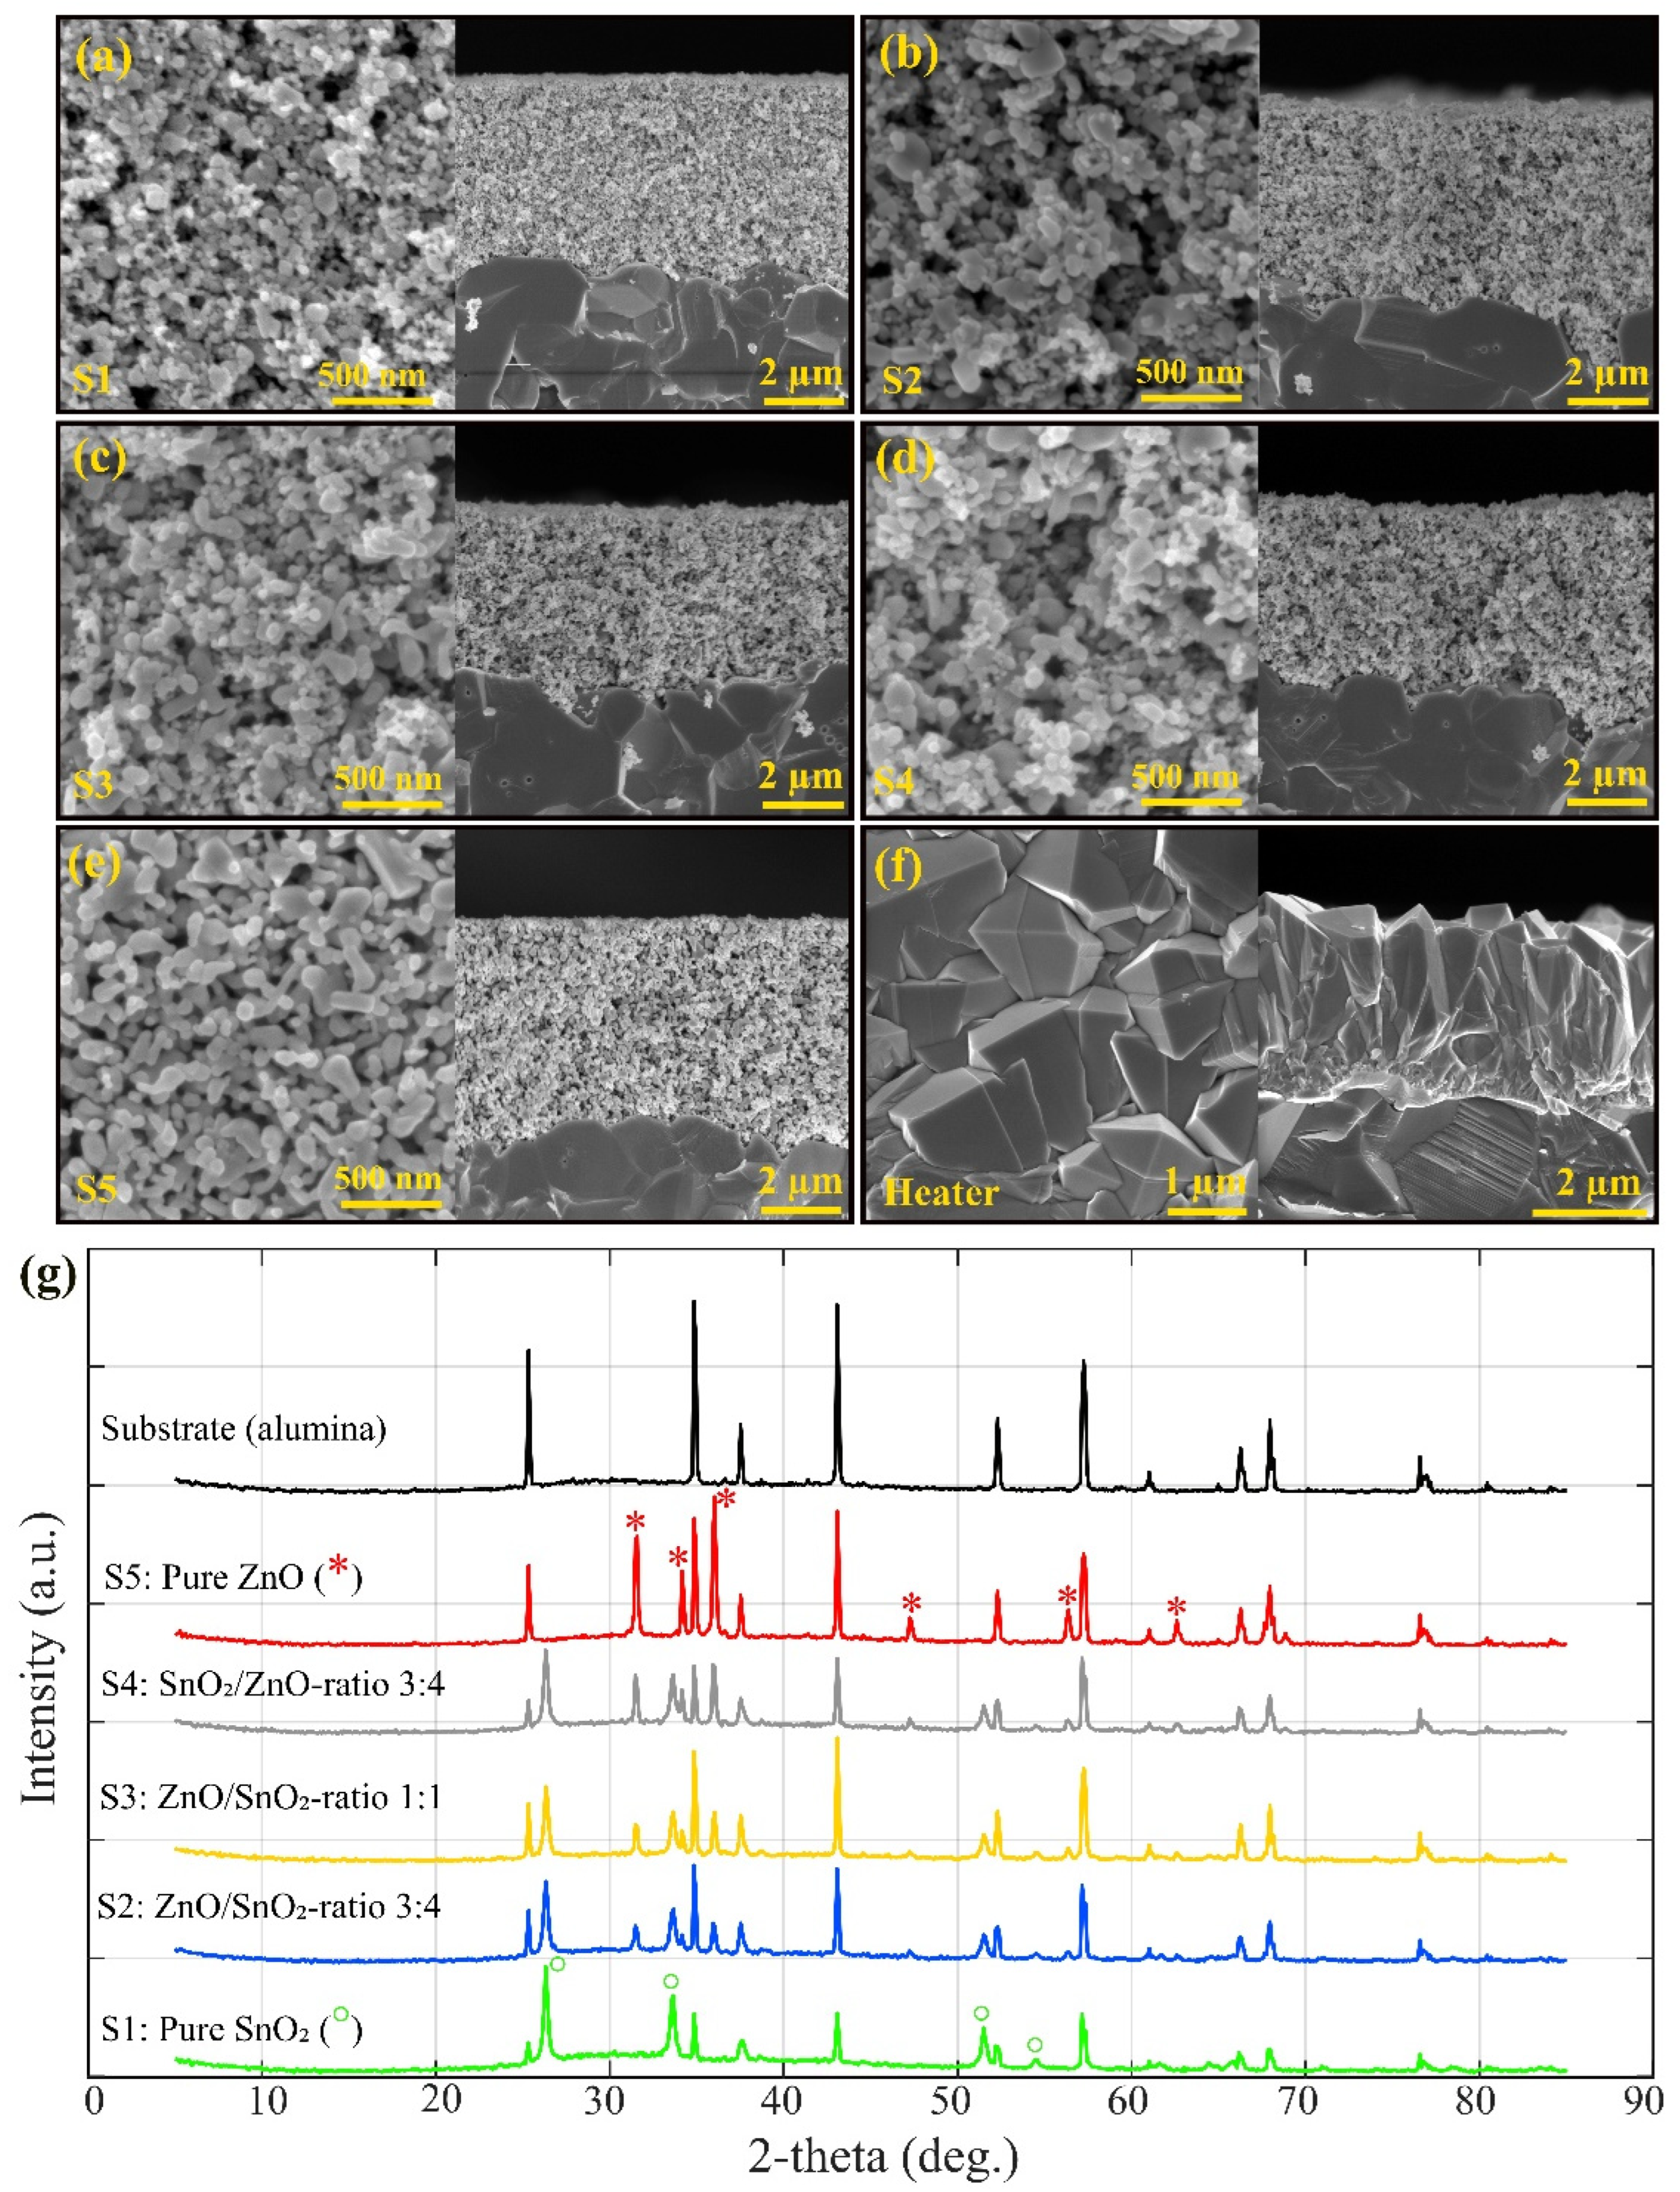
The SEM images of the sensors (
Figure 1a-
Figure 1e) indicate porosity in all compositions, with a consistent film thickness of approximately 4-5 µm across the samples. The porous networks observed in the SEM micrographs are well-suited for gas diffusion. Additionally, the SEM image of the heaters (see
Figure 1f) shows a uniform dense structure designed specifically by USP to provide efficient heating across the sensor surfaces.
The crystallographic phases of the fabricated ZnO
/SnO₂ heterostructure sensors were analyzed by XRD, with distinct patterns observed for the pure ZnO and SnO₂ samples as well as their composites. According to
Figure 1g, for the pure ZnO sample, the XRD pattern showed prominent diffraction peaks at 2θ values of 31.5
7°, 34.
15°, 36.
03°, 47.
23°, and 56.
35°, corresponding to the (100), (002), (101), (102), and (110) planes of the hexagonal wurtzite structure of ZnO (JCPDS No. 36-1451) [
9,
28]. These peaks confirm the successful formation of highly crystalline ZnO with no other impurity phases present (the peaks are represented by red * in the XRD pattern of ZnO). The sharp and well-defined peaks indicate a high degree of crystallinity in the ZnO layer. In contrast, the pure SnO₂ sample exhibited diffraction peaks at 2θ values of 26.
31°, 33.
65°, 51.
5°, and 54.
57° corresponding to the (110), (101), (211), and (220) planes, respectively. These reflections are characteristic of the tetragonal rutile phase of SnO₂ (JCPDS No. 41-1445), confirming the high crystallinity of the SnO₂ component (the peaks are represented by green ͦ in the XRD pattern of SnO
2) [
29,
30].
In the composite sensors, the XRD patterns reflected a combination of the distinct ZnO and SnO₂ peaks, depending on the ZnO and SnO2 ratio. For instance, in the S4 (SnO₂/ZnO, ratio 3:4) sample, peaks from both the hexagonal ZnO and the tetragonal SnO₂ phases were detected, indicating the coexistence of both materials without significant phase interaction or formation of secondary compounds. The preservation of these individual crystalline phases suggests that the heterostructures were formed via a simple physical mixing of the ZnO and SnO₂ phases without solid-state reaction at the temperatures used in this study. The heterostructure sample S4, which exhibited both the ZnO and SnO₂ diffraction peaks, showed the highest H₂S gas response, suggesting that the presence of both phases is essential for enhancing gas sensing performance through the creation of additional active sites and improved charge transfer at the interface in the presence of target gas.
In order to determine the optimal operating temperature, sensor S3 was exposed to 5 ppm of H₂S for 5 minutes at varying temperatures, ranging from 200 °C to 450 °C (at 5% RH). The highest sensor response was observed at 325 °C, which this temperature is lower than our previous findings on ZnO/SnO₂ heterostructures prepared by USP [
16]. As illustrated in
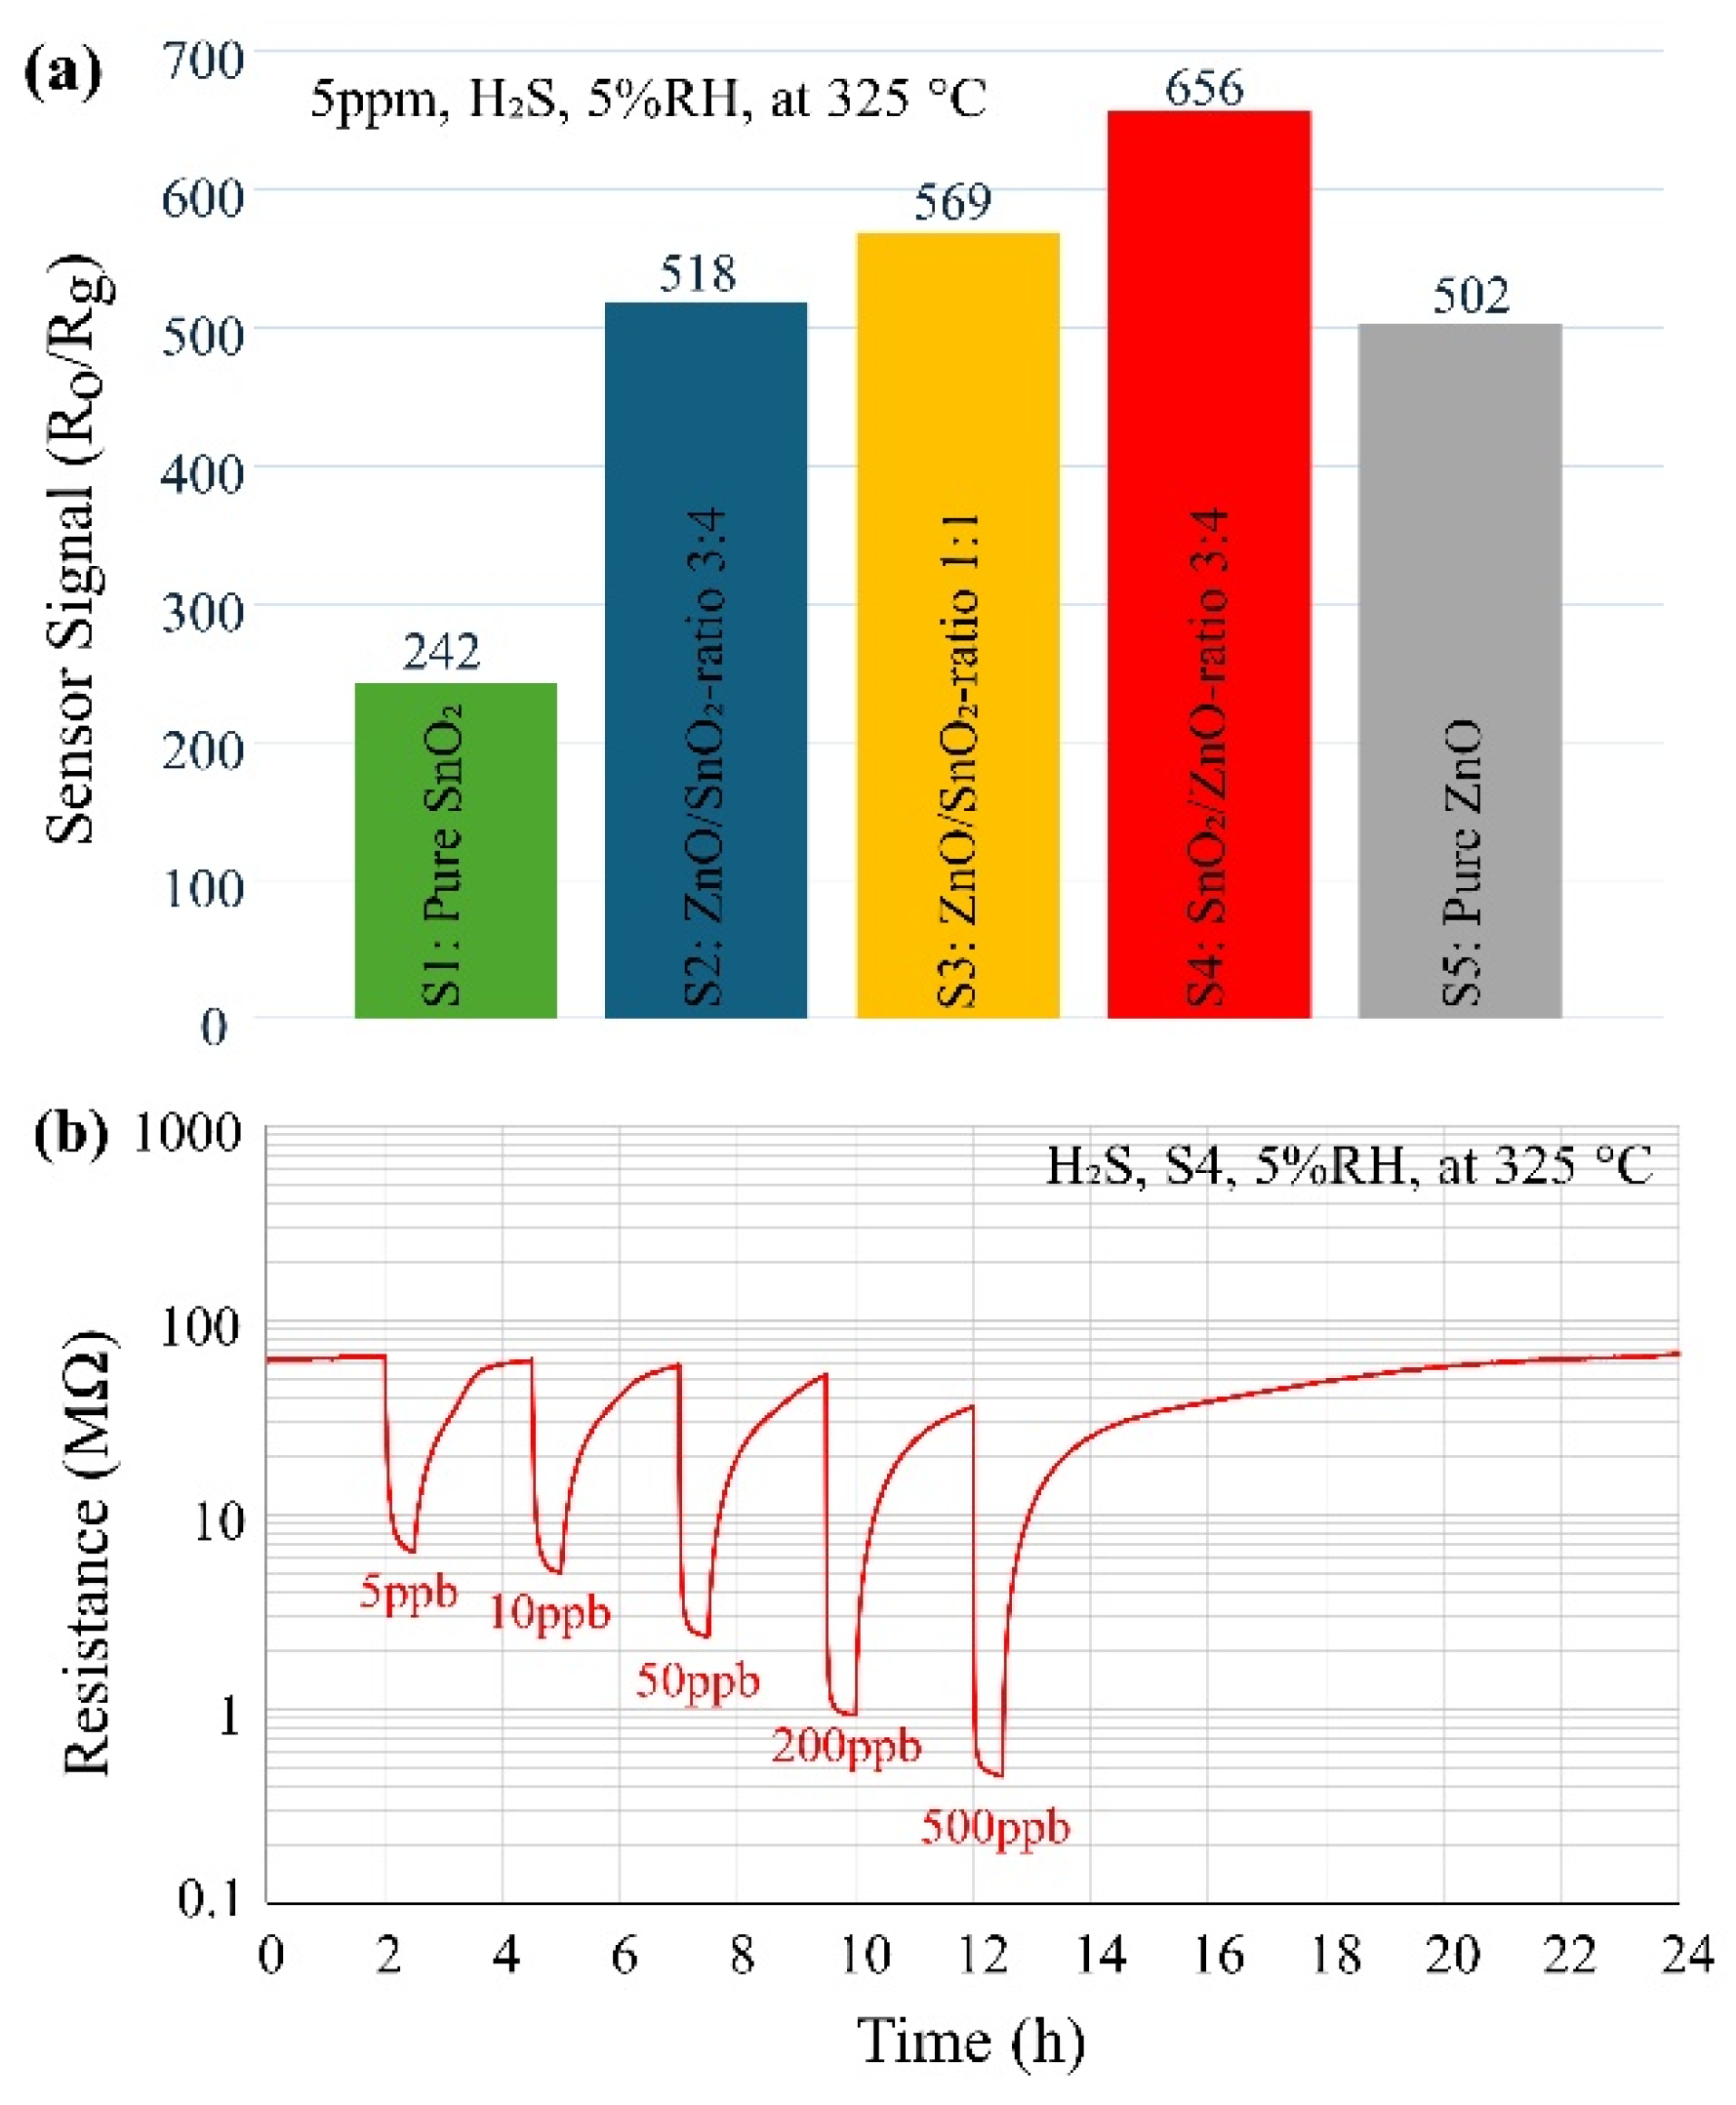
Figure 2a, all sensors were subsequently tested at this optimal operating temperature towards 5 ppm of H₂S for 5 minutes under dry conditions (5% RH). The results indicate that sensor S4 exhibited the highest response among the investigated samples and was therefore selected for further investigation. Interestingly, in all compositions containing both ZnO and SnO₂ (S2, S3, S4), the response was higher than that of the pure SnO₂ (S1) and pure ZnO (S5) samples, highlighting the critical role of heterostructures in enhancing the sensor's response to the target gas.
The dynamic response (R
g) of the sensor (S4) to H₂S gas is illustrated in
Figure 2b. The sensor is exposed to varying concentrations of H₂S (5 ppb, 10 ppb, 50 ppb, 200 ppb, and 500 ppb) at 325 °C for 30 minutes in 5% RH, followed by a 2-hour recovery period. The sensor (S4) exhibited approximately 10, 12, 28, 60, and 82 times changes in resistance (R
o/R
g) upon exposure to 5 ppb, 10 ppb, 50 ppb, 200 ppb, and 500 ppb of H₂S, respectively. These values (detection levels, concentrations) are significantly lower than those reported in previous studies [
13,
16].
In gas sensing, the sensor response can be defined either by the relative change in resistance (Ro/Rg) or directly by the resistance in the presence of the target gas (Rg). The choice of signal significantly affects the accuracy and reliability of the sensor readings.
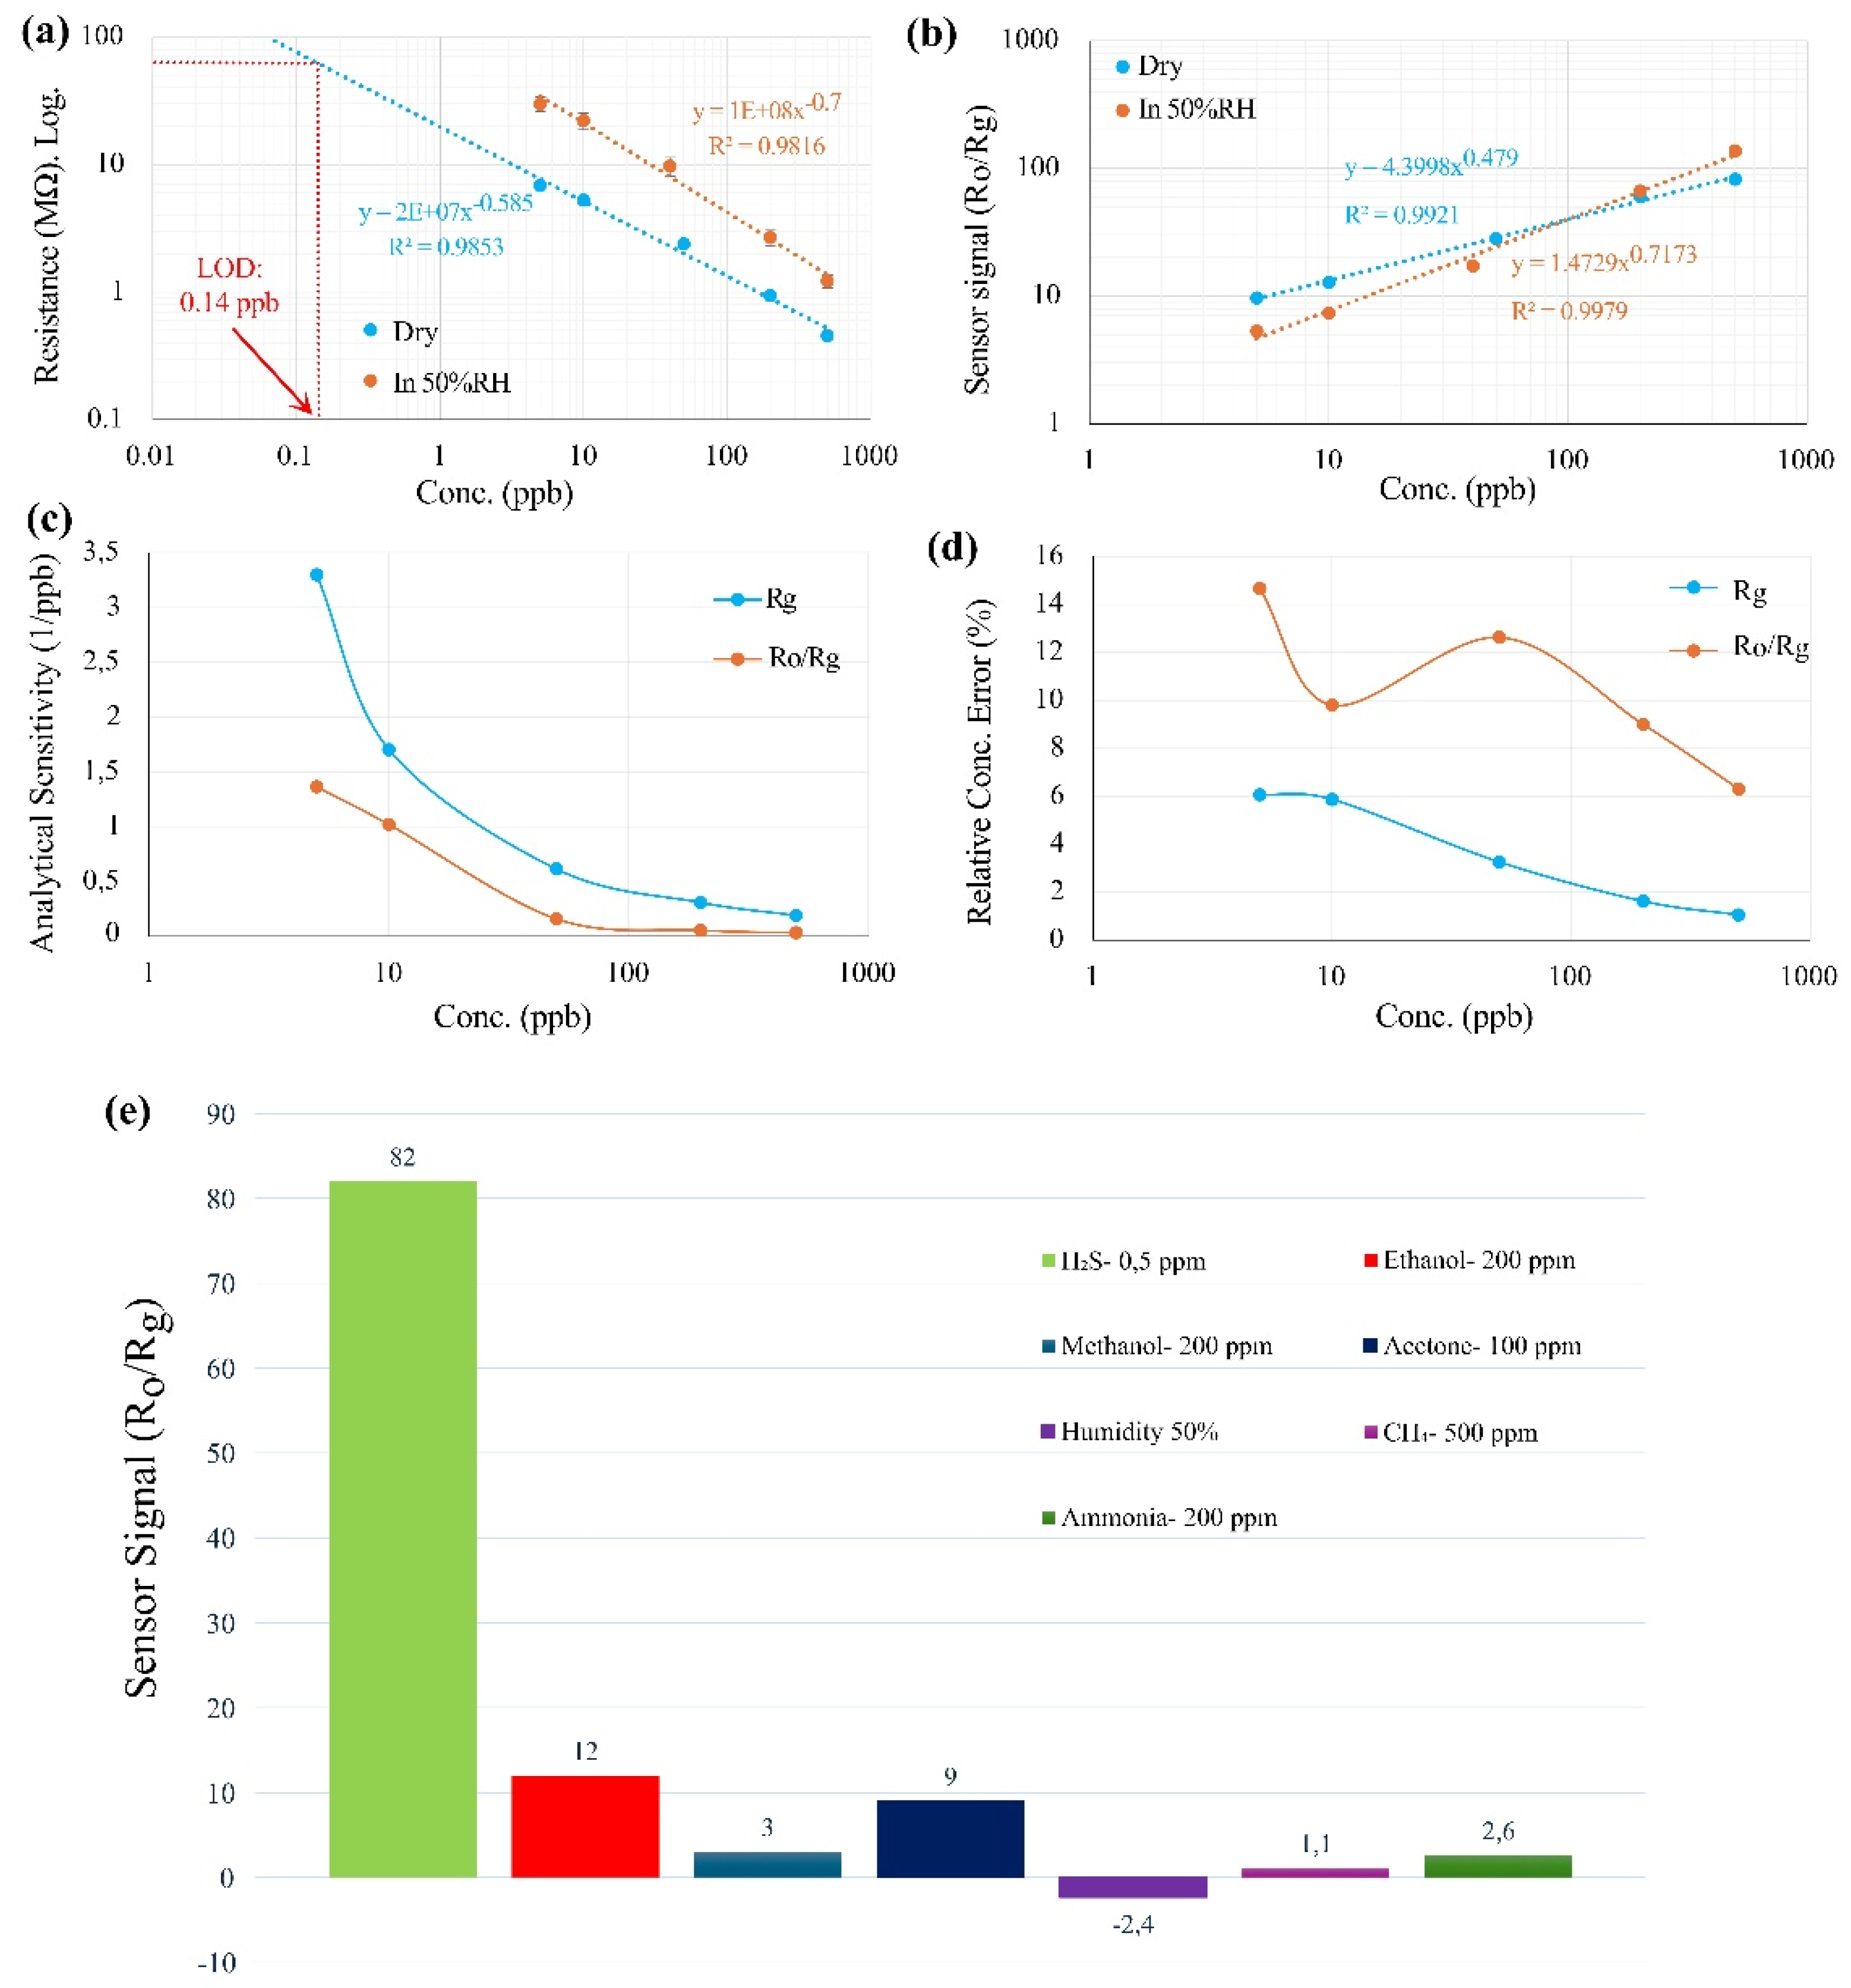
The 6 measured points and corresponding fitting curves (sensor signal vs concentration) for R
g and R
o/R
g are presented in
Figure 3a and 3b. To further investigate the sensor signal, analytical sensitivity (sensitivity over standard division of sensor signal) is calculated and presented in
Figure 3c, indicating higher values for R
g compared to R
o/R
g in all concentration. In this Figure both curves related to analytical sensitivity decreasing gradually by increasing concentration.
Analysis of the sensor’s performance reveals that using R
o/R
g leads to higher error bars compared to R
g. This is primarily due to variations in the baseline resistance (R
o), which can introduce significant inaccuracies, particularly at low concentrations. To be more precise, the relative concentration error can be calculated using analytical sensitivity. As demonstrated in
Figure 3d, the relative concentration error with R
o/R
g reached up to 14% at 5 ppb, highlighting substantial measurement uncertainties. Conversely, when R
g is used as the sensor signal, the influence of baseline fluctuations is minimized, resulting in a more stable and accurate detection of the target gas. This approach yields lower relative concentration errors, generally less than 6% across all tested concentrations (5 ppb to 500 ppb), and reaching around 1% relative concentration error at 500ppb, as illustrated in
Figure 3d. The improved precision with R
g underscores its advantage over R
o/R
g in reducing measurement errors and enhancing sensor performance. Thus, selecting R
g as the sensor signal is crucial for achieving a more accurate and reliable response. By mitigating baseline-related inaccuracies, R
g provides a more effective measurement of target gases, ensuring higher sensitivity and precision in gas detection applications.
To examine the effect of humidity, the same measurements were performed at 50% RH, and the results, along with the fitted curves, are shown in
Figure 3a and 3b. The data indicates that higher humidity levels cause changes in the sensor's resistance. However, when using the sensor's resistance (R
g) as the sensor signal, the slope of the calibration curve, or sensitivity, in humid conditions remains almost the same as in dry conditions. On the other hand, when using R
o/R
g as the sensor signal, the sensitivity changes significantly under humid conditions compared to the dry state (5% RH). In humid environments, H₂S molecules must compete with water molecules for adsorption sites on the pre-adsorbed oxygen species. This suggests that in humid conditions, fewer sites are available for H₂S molecules to adsorb and contribute to the sensor's conductivity.
Following the approach detailed in [
31], the LOD for S4 (5%RH, at 325 °C) was calculated by extrapolating the fitted calibration curve to its intersection with a signal level equivalent to three times the standard deviation of the noise level. Specifically, the LOD for H₂S was determined to be 0.14 ppb. These calculations demonstrate the sensitivity of the sensor and its capability to detect low concentrations of these gases with a high degree of confidence.
Sensing Mechanism
Oxygen plays an essential role in redox reactions on the surface of metal oxides [
32]. When the sensor is exposed to air, oxygen molecules are absorbed on its surface, leading to the formation of reactive oxygen species such as O₂⁻, O⁻, and O²⁻ [
33,
34]. These species are formed as electrons move from the metal oxide surface to the adsorbed oxygen, causing the surface to oxidize and resulting in upward band bending in the energy diagram. At 325 °C, O⁻ is the main species on the surface. When the sensor comes into contact with a reducing gas like H₂S, these oxygen species react with the gas, releasing electrons into the sensing material. The reaction can be written as:
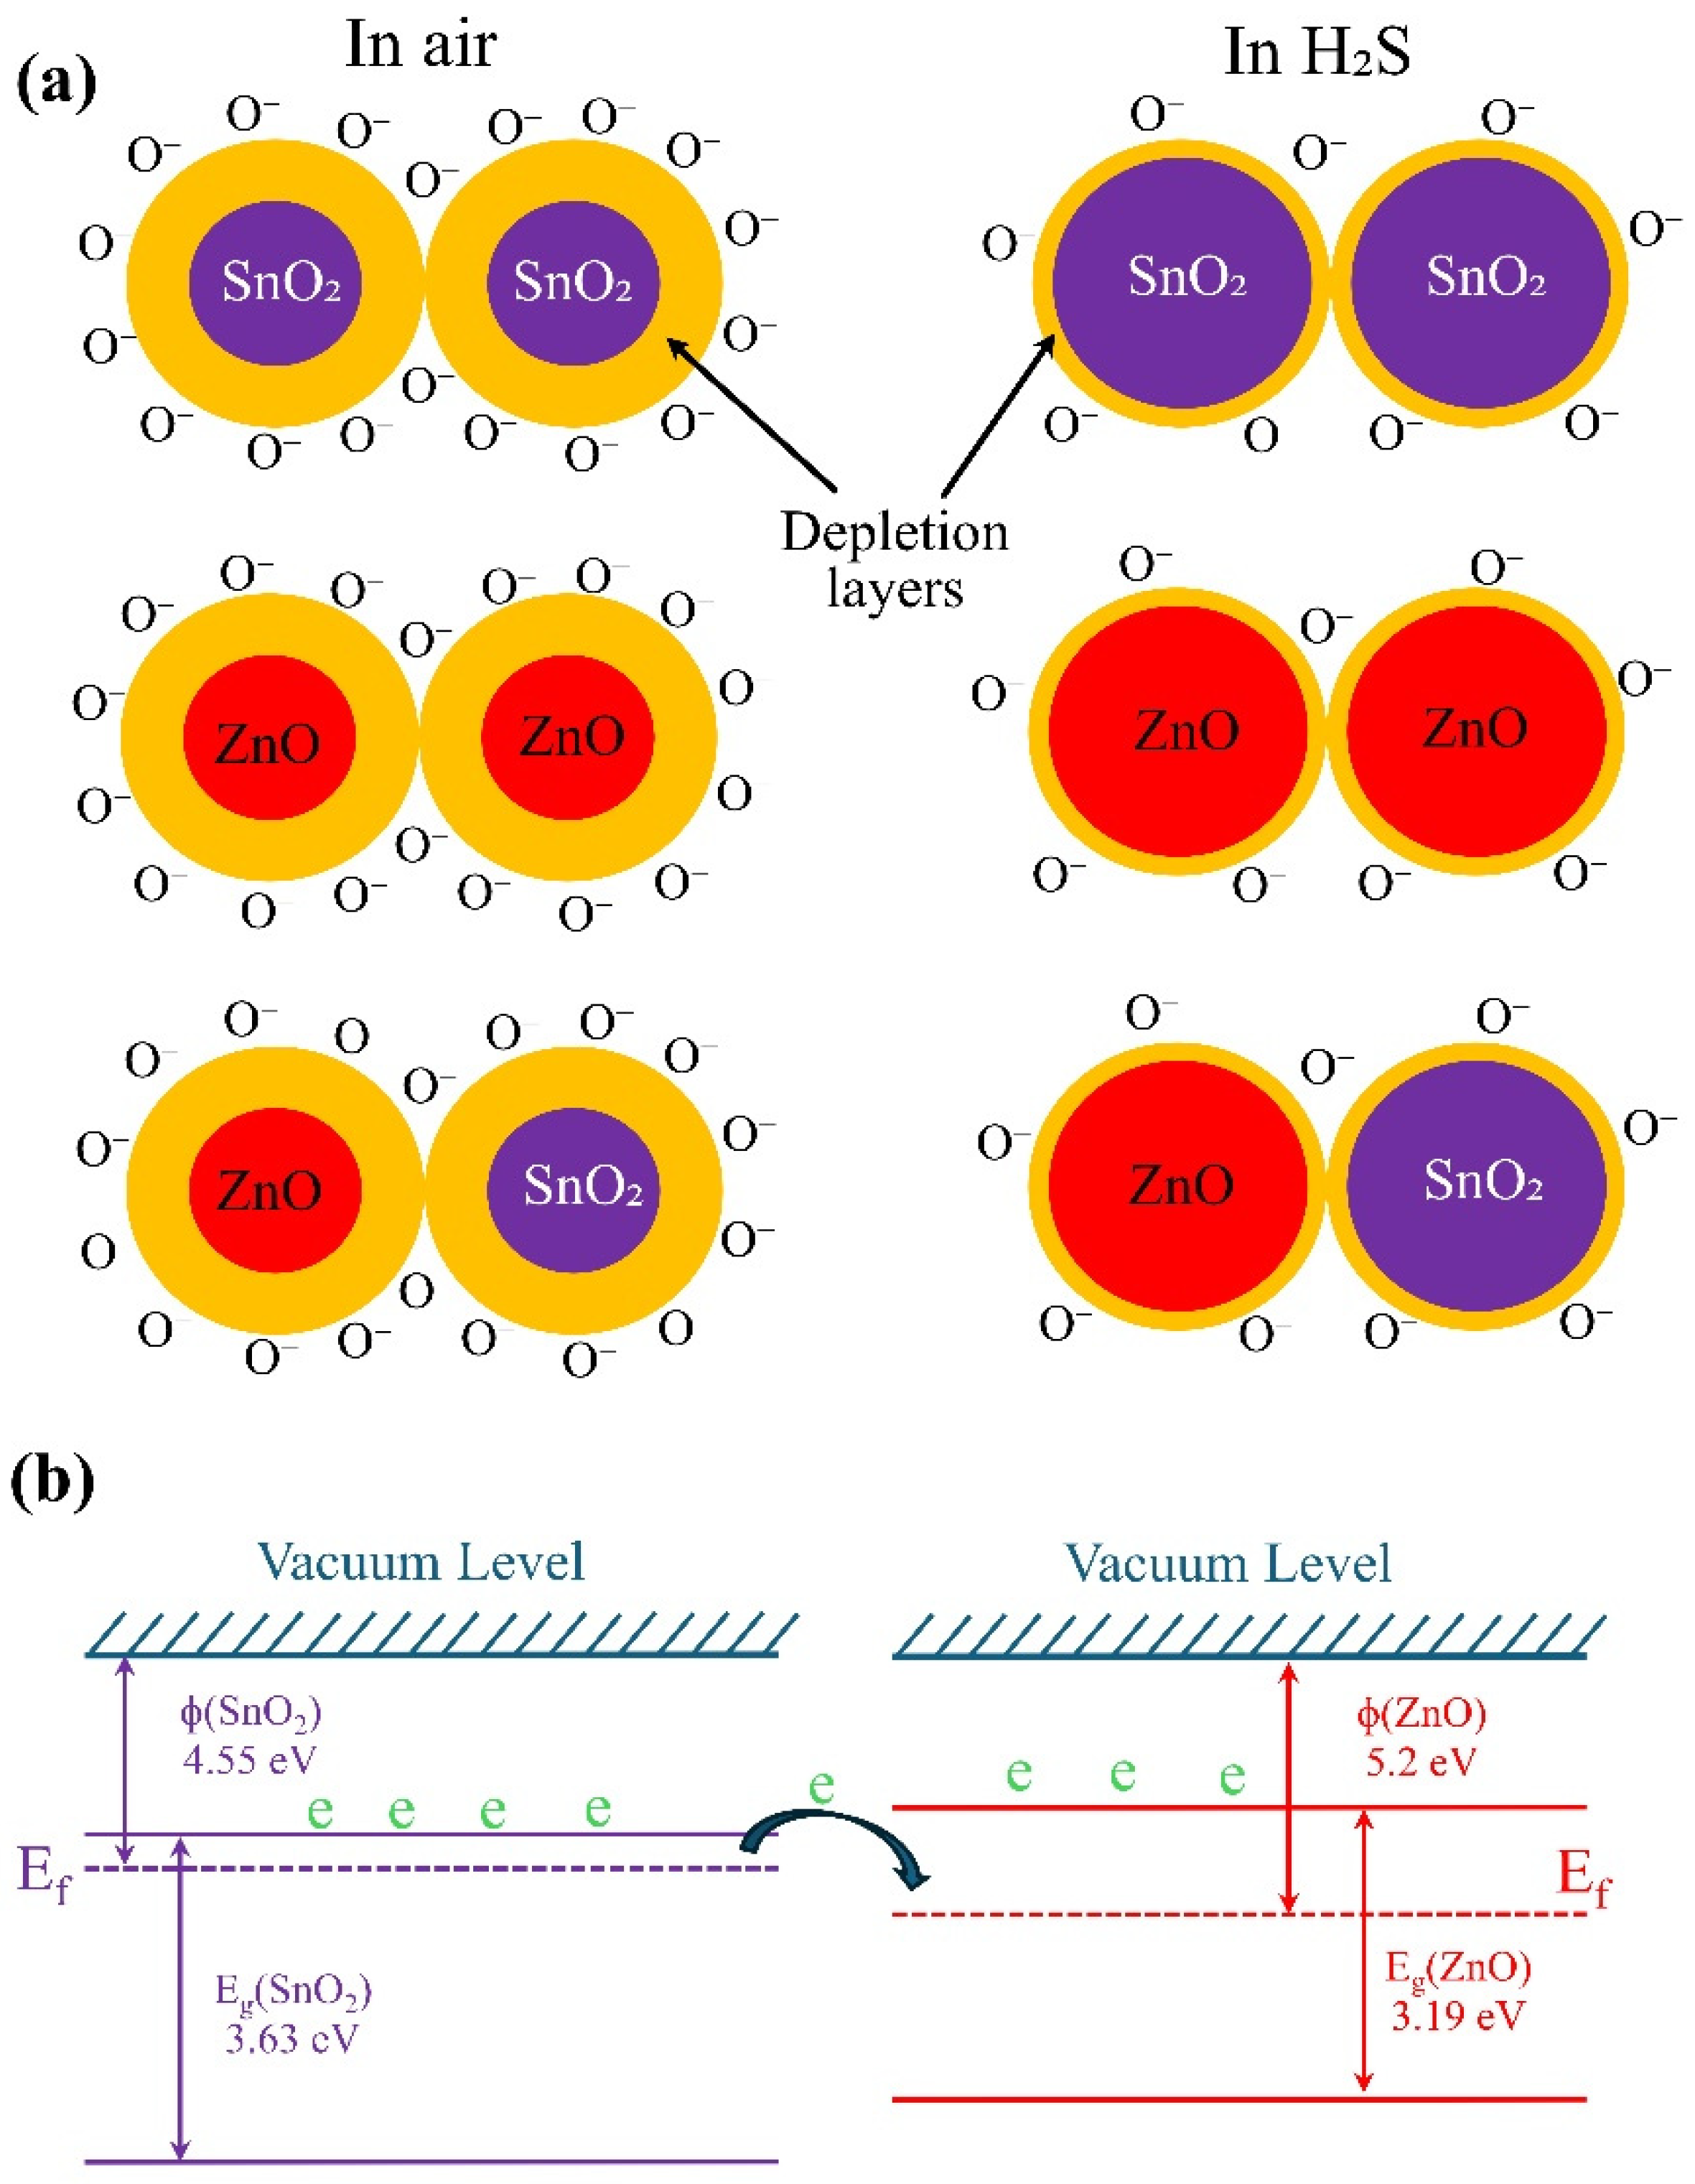
This reaction increases the number of free electrons on the surface, thereby reducing the sensor's resistance. In the presence of air, a depletion layer forms on the ZnO/SnO₂ grains, primarily controlled by negatively charged oxygen species. Electrons must overcome the barrier between the heterostructure and homostructure grains (ZnO grains, SnO₂ grains, and ZnO/SnO₂ grains, see
Figure 4a and also related energy band diagram are presented in
Figure 4b) to contribute to electrical conduction. The baseline resistance of the heterostructure (ZnO/SnO₂) is significantly higher than that of the pure ZnO or SnO₂, indicating the existence of an energy barrier between the dissimilar metal oxide grains. This barrier results from the difference in work functions and electron affinity between ZnO and SnO₂, which creates a built-in potential, leading to a depletion region at the interface [
11].
When the sensor is exposed to H₂S, the adsorbed oxygen species on the surface of ZnO/SnO₂ grains react with the gas molecules, releasing free electrons. In addition, thanks to the porous structures prepared by screen printing H
2S can penetrate into the sensing layer and interact with hole sensing layer. This interaction reduces the thickness of the depletion layer (see
Figure 4a) and lowers the barrier at the heterostructure interface, allowing electrons to flow more easily across the grain boundaries. As the barrier decreases, the resistance of the sensor drops, leading to an increase in current flow. This is especially evident in ZnO/SnO₂ heterostructures, where the combination of both materials enhances the sensitivity and response to H₂S by providing additional active sites for gas interaction.
For ZnO/SnO₂ porous structures made using screen printing, in the presence of N₂, the number of free charge carriers involved in conduction is equal to the number of free charge carriers in the bulk material. As a result, by this consideration there is no initial band bending, and the sensor's resistance in N₂ sets the threshold between conduction mechanisms controlled by the depletion layer and the accumulation layer [
35], [
36]. For the S4 sensor, this boundary is measured at 766 kΩ (the sensor’s resistance in N₂, see
Figure S1 in supplementary information).
In dry air, as the concentration of the target gas increases, the sensor's resistance decreases. For H₂S concentrations higher than 260 ppb (according to the calibration curve), the conduction mechanism shifts from being controlled by the depletion layer to the accumulation layer. However, in humid conditions (50% RH), across all investigated H₂S concentrations (5 ppb to 500 ppb), the conduction remains controlled by the depletion layer, with no transition to the accumulation layer observed. However, according to the calibration curve (in 50% RH) for concentrations higher than 1 ppm the conduction mechanism will shift to the region controlled by accumulation layer.
The sensor's selectivity towards some common interfering gases like ethanol, CH
4, methanol, acetone, ammonia, and humidity were investigated, and the results are presented in
Figure 3e.


