1. Introduction
Ariel (Atmospheric Remote-sensing Infrared Exoplanets Large-survey) is the M4 ESA mission of the Cosmic Vision 2015 – 2025 Program, selected in March 2018 and officially adopted in November 2020. Its launch is scheduled by 2029 from the Guyana Space Center in Kourou, around local noon, on board an Ariane 6.2 launcher in a dual launch configuration with Comet Interceptor. The aim of the mission is to characterize the atmospheres of hundreds of exoplanets orbiting near different types of stars by low-resolution transit spectroscopy and to identify the key factors affecting the formation and evolution of planetary systems [
1]. The nominal duration of the mission is foreseen to be four years with a possible extension of at least two more years [
1,
2].
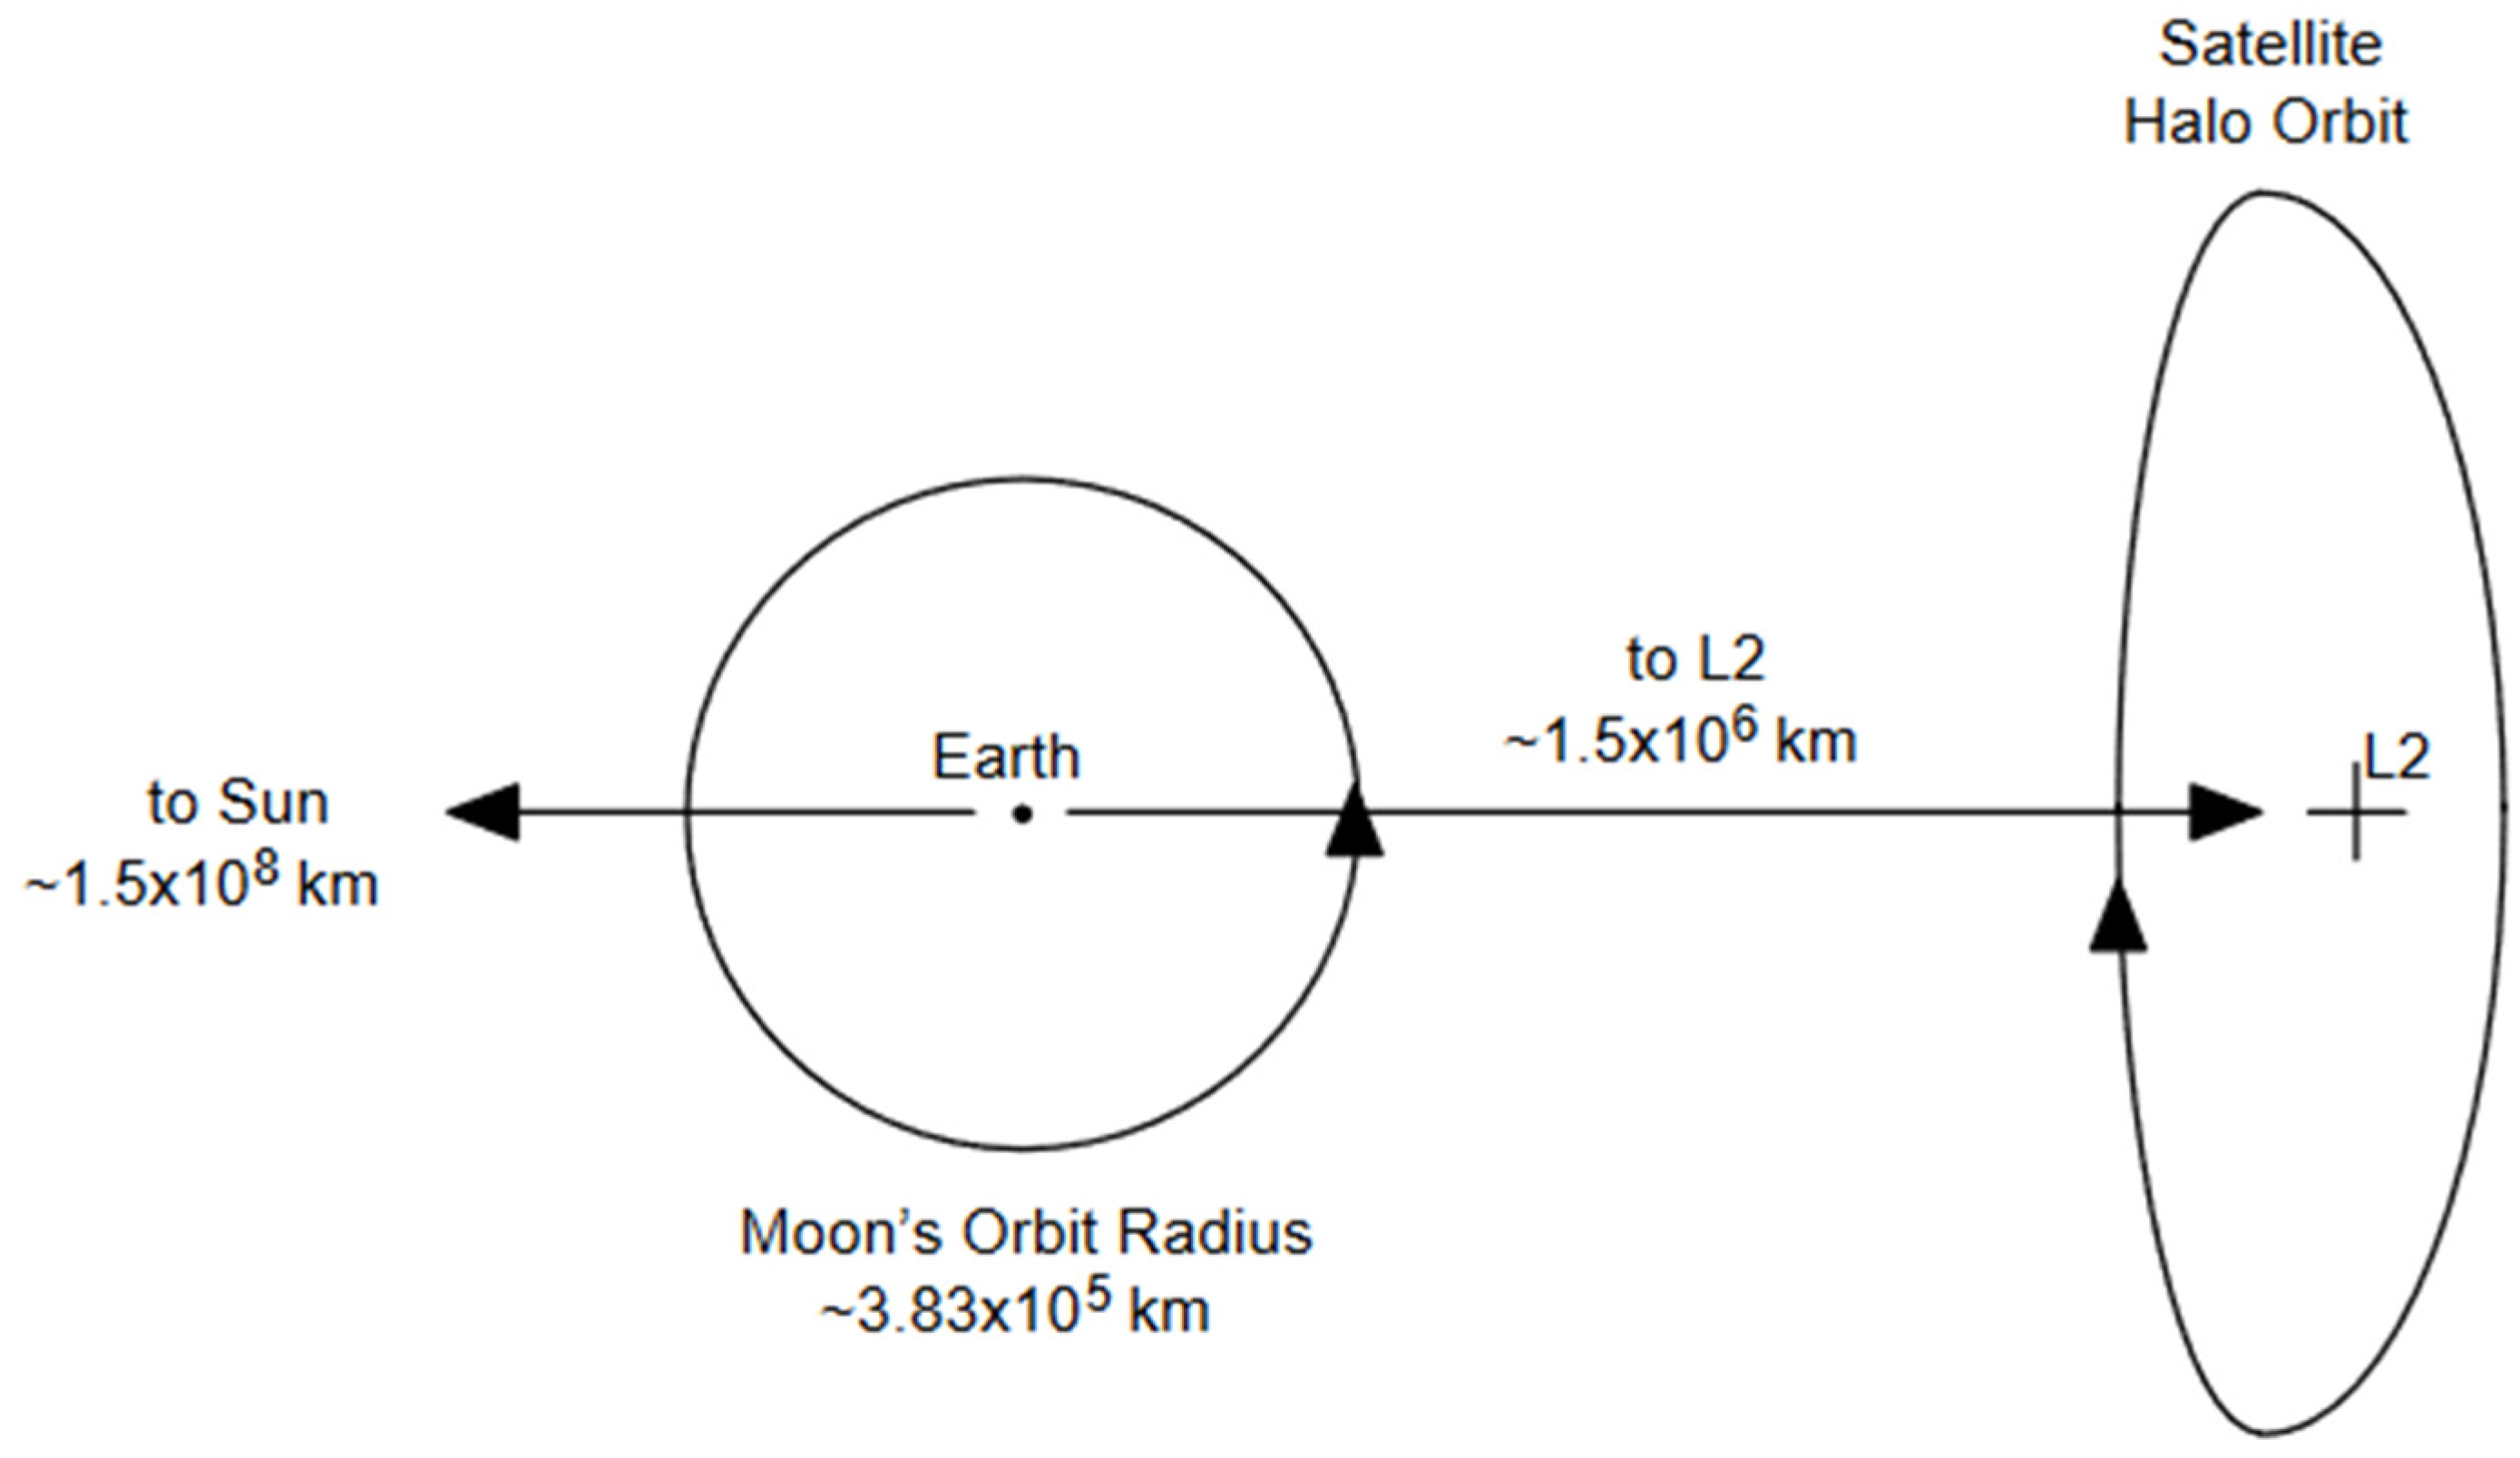
The baseline operational orbit of the Ariel spacecraft (S/C) will be a large amplitude, eclipse-free, halo orbit around the second Lagrangian point (L2) located at about 1.5 million km from the Earth (1.01 A.U. from the Sun) in the anti-Sun direction. To reach this orbit, the spacecraft will pass through both LEO (Low Earth Orbit) and GEO (Geostationary Orbit), crossing the Van Allen radiation belts [
2].
As the spacecraft will constantly be immersed in and interact with electromagnetic radiation, space plasma, and cosmic rays, the spacecraft charging phenomenon can occur, i.e., the accumulation of a net amount of positive or negative charge, both on its surfaces, phenomenon known as surface charging, or within the materials, phenomenon known as deep dielectric charging or bulk charging [
3]. This mechanism has many consequences, ranging from interfering with the instrument’s nominal functionality to electrostatic discharges (ESDs) that might lead, as worst cases, to the loss of the entire mission [
4].
In this work, a preliminary surface charging analysis regarding the Ariel spacecraft’s external surfaces has been carried out with the European SPIS [
5] (Spacecraft Plasma Interaction Software) simulator developed by the SPINE (Spacecraft Plasma Interaction Network in Europe) community. The simulations will cover the L2-relevant environment and the passage through the GEO.
2. The Ariel Mission
2.1. Payload Design
The Ariel S/C is structured in a modular way, with a warm service module (SVM) and a cold payload module (PLM) intended to be procured and tested in parallel (refer to
Figure 1) by the AMC consortium and the S/C Prime contractor, Airbus Defence and Space (ADS).
The SVM is composed of a main body enclosed by a top and a bottom sandwich panel made of CFRP (Carbon Fiber Reinforced Polymer) face sheets and aluminum honeycomb. The main body hosts all the S/C avionic equipment and the warm payload (PL) units, while the bottom panel externally hosts all the equipment that needs to face the Sun, such as the solar panels, the communication antennae, and the propulsion thrusters activated by the on-board Attitude and Orbit Control System (AOCS) in a closed loop with the payload’s Fine Guidance System (FGS). The top panel is the mechanical and thermal interface to the PLM and is referred to as the Payload Interface Panel (PIP) [
1].
The PLM is supported by three bipods which are hollow cylinders made of CFRP and filled with low thermally conductive rigid foam. To maintain the cryogenic operative temperature of the PL, both an active and a passive cooling system are used. The Active Cooler System (ACS) consists of a Joule-Thomson effect compressor using Neon gas while the passive cooling system consists of a series of V-Groove (VG) radiators made of a honeycomb structure of aluminum alloy. The V-Grooves are a high-efficiency thermal shielding system that isolates the PLM from the SVM allowing the PL to operate at a temperature of approximately 55 K during its operational orbit while the SVM temperature will be kept in the range 253 – 323 K. The V-Grooves are mechanically supported and thermally decoupled from the PIP by GFRP (Glass Fiber Reinforced Polymer) struts.
The integrated payload baseline features an off-axis Cassegrain telescope made entirely of aluminum, equipped with an elliptic primary mirror (M1) that measures 1100 mm x 730 mm. A refocusing mechanism located behind the secondary mirror (M2) allows for adjustments to correct any misalignments that may occur during assembly, launch, and/or cooldown. The telescope directs a collimated beam, which is separated into different wavelengths by dichroics, into two distinct instruments with overlapping fields of view:
The FGS [
6,
7] whose job is to ensure the centering, focusing, and guiding of the satellite and provides high-precision photometry of the target in the visible band and a low-resolution near-IR spectrometer. Data from the FGS detectors are collected by the FPE (Focal Plane Electronics) working at 137 K as operational temperature and hosting two SIDECAR ASICs for the IR (HgCdTe-based) detectors. The FPE is supported by insulating GFRP-based struts mounted on the Telescope Optical Bench (TOB). To perform its functions, the FGS instrument will utilize two detectors operating across four spectral bands: FGS-1 [0.6-0.8 μm], FGS-2 [0.81-1 μm], VISPhot [0.50-0.60 μm], and NIRSpec [1.10-1.95 μm]. The data generated by the FGS-1 and FGS-2 channels will be redundant, serving both photometric analysis and providing redundant guidance information to the spacecraft by determining the centroid position of the target star at a frequency of 10 Hz.
The Ariel IR Spectrometer [
8,
9] (AIRS) provides low-resolution spectroscopy across two IR channels: AIRS-Ch0 [1.95-3.90 μm] with R ≥ 100 and AIRS-Ch1 [3.90-7.80 μm] with R ≥ 30. AIRS is positioned at the intermediate focal plane of the telescope and optical system common to the two instruments. It features two Teledyne IR detectors made from ternary compounds of Mercury, Cadmium, and Tellurium (HgCdTe), which are sensitive to the wavelengths of interest, and two analog interface electronics, known as Cold Front-End Electronics (CFEE), cooled to 55 K, for managing and reading-out the detectors. The detector and electronics are controlled by the AIRS Detector Control Unit (A-DCU), which is it turn managed by the Instrument Control Unit (ICU) of the PL.
The Ariel S/C is designed to ensure that the Sun never illuminates the cryogenic PLM under any operational conditions. This is achieved through an optimized design and geometry, with the Service Module (SVM) and solar panels providing continuous shielding to the PLM throughout all mission phases.
2.2. Ariel Orbit
The baseline operational orbit of the Ariel spacecraft is a large amplitude, eclipse-free, halo orbit around the second Lagrangian point (L2), an unstable point of equilibrium in the Sun-Earth-Moon gravitational system situated along the line joining the Sun and the Earth at about 1.5 million km from the Earth (1.01 A.U. from the Sun) in the anti-Sun direction (refer to
Figure 2) [
1,
2]. This orbit is becoming the orbit of choice of many current (e.g., JWST) and future (e.g., PLATO) astronomical missions as it offers the possibility of long uninterrupted observations in a fairly stable radiative and thermo-mechanical environment.
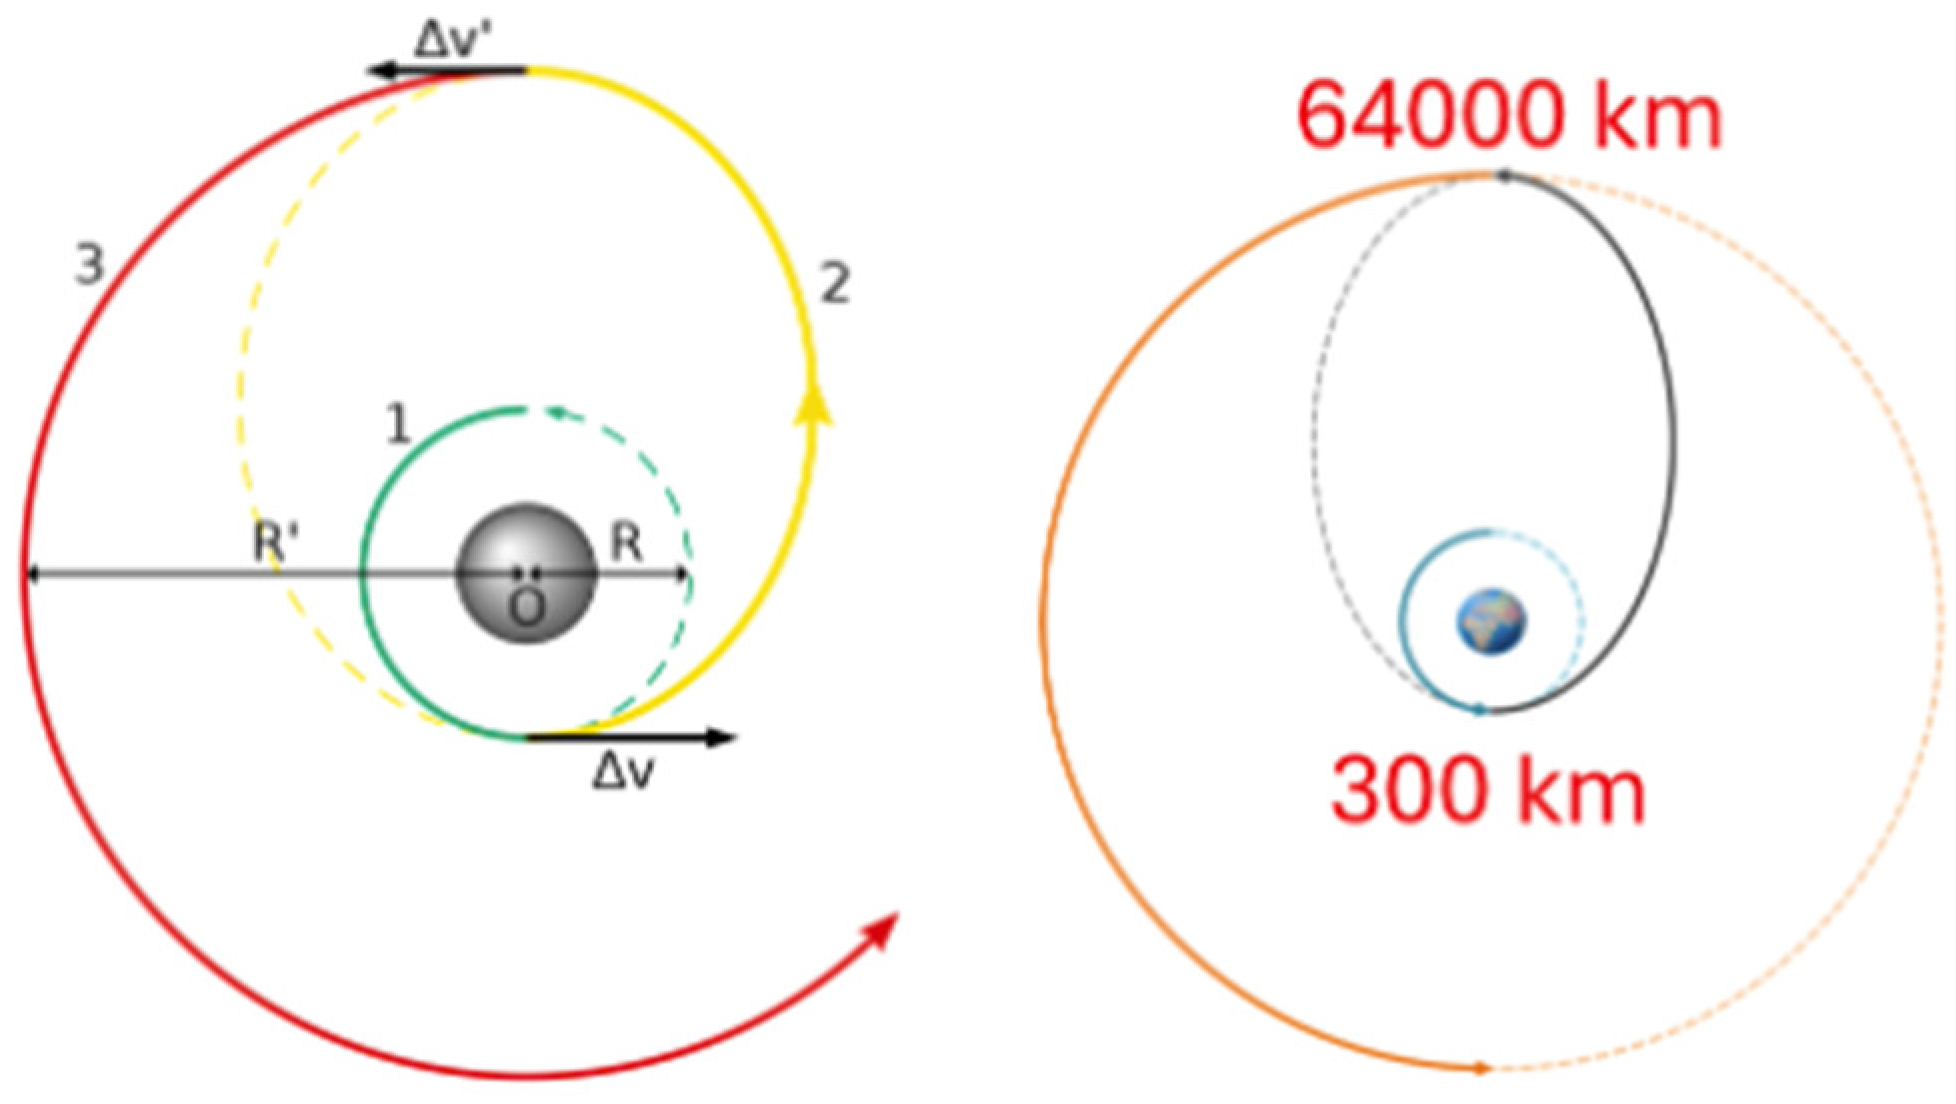
To reach the operational orbit around L2, an injection trajectory with a single passage through the Van Allen radiation belts and different Earth orbit altitudes is foreseen [
1,
2]. This trajectory is approximated by a worst-case scenario of a half orbit lasting 10.5 hours, with perigee at 300 km (LEO), apogee at 64,000 km (GEO), and near-zero-degree inclination (refer to
Figure 3). Because of the inclination close to zero degrees, for the scope of charging simulations carried out in this work, a geostationary orbit has been considered rather than a geosynchronous one.
During its operational orbit around L2, Ariel will encounter three different plasma environments characterized by: the direct solar wind, the Earth’s magnetosheath, and the Earth’s magnetotail. Because of the amplitude of the orbit, the satellite will spend most of the time in the direct solar wind and in the Earth’s magnetosheath and a small fraction of time in the Earth’s magnetotail [
2].
In this paper, the results of the simulations of the satellite passage through the GEO and the L2 environments are reported.
3. Overview of the Spacecraft Charging Phenomenon
During both the operational orbit and the injection trajectory, the Ariel S/C will be immersed and constantly interact with electromagnetic radiation (e.g., light, interplanetary EM waves, not intentional and intentional RF-waves for communication to ground, etc.), charged particles (principally electrons and protons but heavy ions are present too in much smaller amount) from plasma environment, and Galactic Cosmic Rays (GCRs). These interactions can lead to the spacecraft charging phenomenon i.e., the accumulation of a net amount of positive or negative charge both on the external surfaces of the S/C, a phenomenon known as surface charging, or inside the satellite materials, a phenomenon known as deep dielectric charging or bulk charging. The accumulated charge generates a not null surface potential, with respect to the space plasma potential which is taken as zero-reference, and, in turn, an electric field according to Gauss Law [
3,
11,
12].
This phenomenon can lead to multiple consequences, such as electromagnetic coupling issues inside the harnesses, interferences with the nominal operation of instruments or with ground communications and, in case of the occurrence of an electrostatic discharge (ESD) the satellite materials and instruments can be damaged. In the worst-case scenario, this phenomenon can even lead to the loss of the mission [
4]. The ESA ECSS (European Cooperation for Space Standardization) standard does not foresee any discharge risk if the voltage difference between two different S/C surfaces or between a S/C surface and the space plasma is less than about 100 V [
13].
In this work, an analysis of the surface charging phenomenon regarding the external surfaces of the Ariel S/C has been carried out, relating to the risk of electrostatic discharge. For the analysis, only the plasma charged particles, and the sunlight contributions have been considered as the other terms give negligible contribution to the phenomenon.
The spacecraft charging phenomenon can arise from multiple mechanisms. The main method of charge accumulation is through the direct collection of charged plasma particles as they collide with the spacecraft’s surfaces during their random motion. However, not all particles get collected; some may be reflected depending on factors such as the angle of impact, surface material properties, and the existing surface charge. The collected particles can be treated as a current from the plasma environment to the S/C. According to the equipartition theorem, electrons have a higher mean velocity than ions, resulting in a tendency for the spacecraft surfaces to accumulate a net negative charge [
3].
However, second-order effects contribute to limiting negative charging. For instance, when incoming particles have energies within a specific range, they may trigger the emission of one or more electrons from the impacted surface, a process known as Secondary Electron Emission (SEE). Additionally, surfaces exposed to direct Sunlight can emit electrons due to the photoelectric effect if the incoming photons fall in the UV band. Typically, the photoemission current dominates over the other involved currents. These second-order effects not only mitigate the accumulation of negative charge on the satellite’s surfaces but can also result in positively charged surfaces. The charging process continues until the equilibrium is reached, i.e., the current flow entering a surface is equal to the current flow exiting it. In this work, a secondary electron energy of 2.0 eV and a photoelectron energy of 3.25 eV are assumed [
3,
19].
All the processes involved in the spacecraft charging phenomenon are summarized in
Figure 4.
4. Plasma Environments
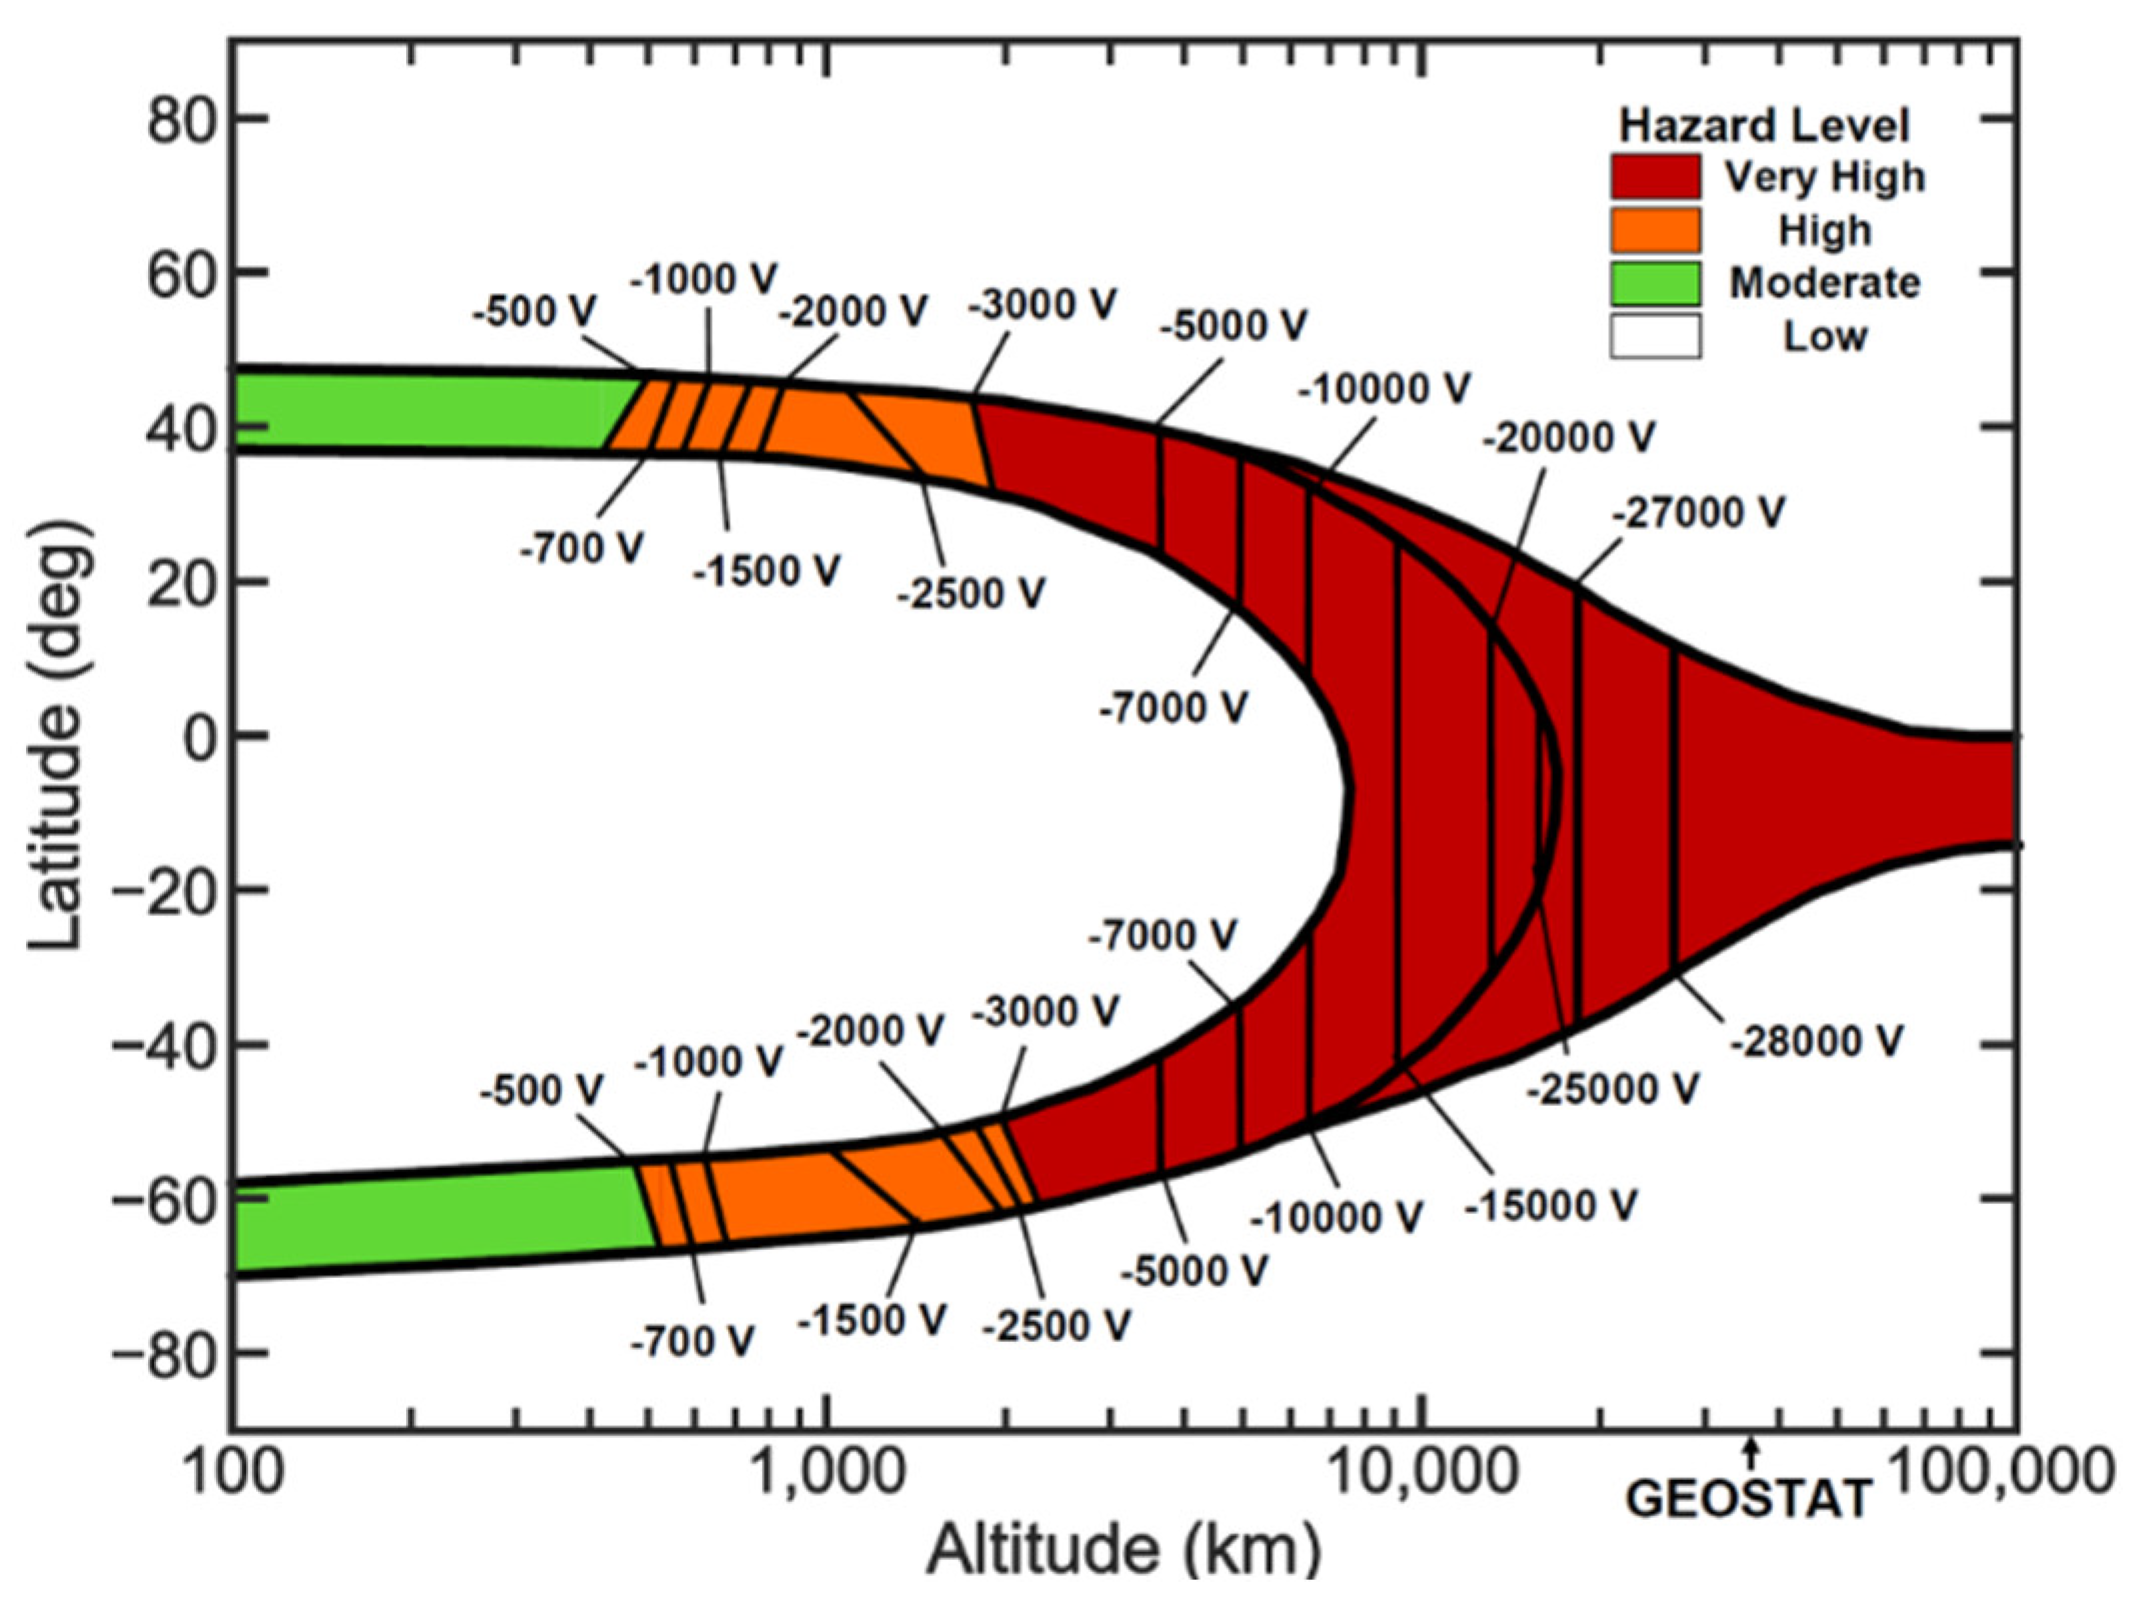
Geostationary orbit (GEO) is characterized by high-energy electrons and ions, making this environment particularly prone to heavy charging compared to other environments. Since high-energy electrons are the main cause of the spacecraft charging phenomenon, S/C surfaces in GEO can accumulate negative charges reaching hundreds of volts or even several kilovolts, even when exposed to sunlight. As illustrated in
Figure 5, for a GEO orbit with zero-degree inclination, the risk related to the surface charging phenomenon is notably high.
The solar wind is a continuous but variable flow of coronal plasma, carrying the solar magnetic field along it, that starts at the Sun as a hot dense, slowly moving plasma and gets accelerated outwards becoming cool, rare and supersonic near Mercury and beyond. The solar wind velocity at 1 A.U. typically lies in the range of 300 – 1200 km/s and is generally around 400 km/s [
2].
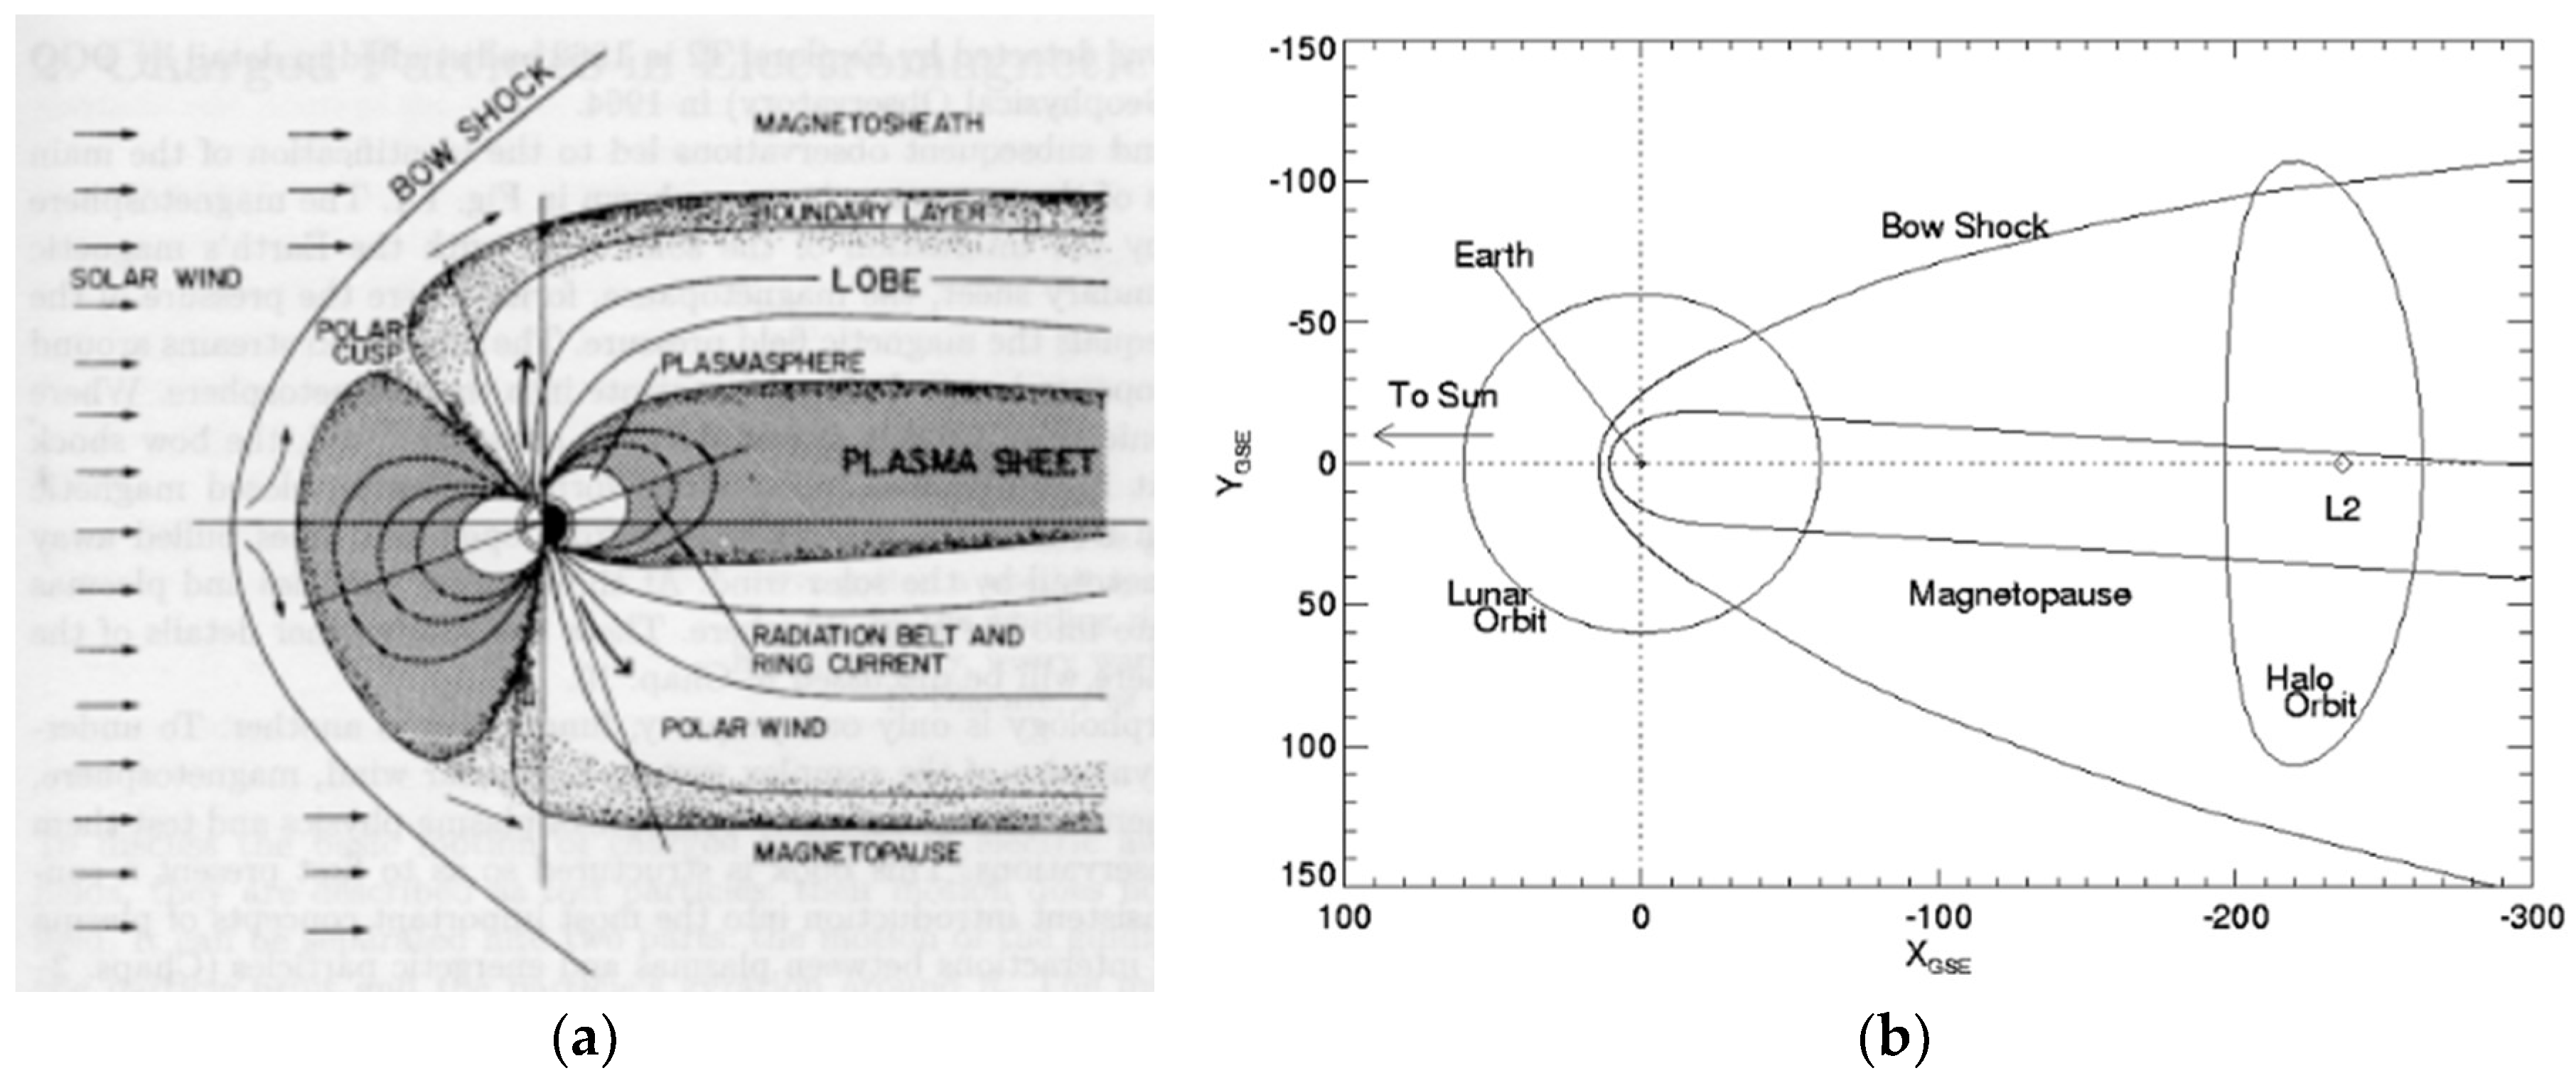
At the Earth, the presence of the magnetosphere causes the solar wind to decelerate abruptly forming thus a shock wave in which the plasma is slowed, compressed, heated and defected. The region enclosed by this “bow shock”, known as the magnetosheath, consists primarily of solar wind plasma that has been shocked and diverted around Earth’s magnetic field. The innermost boundary of this region is the magnetopause. The radius of the Earth’s magnetosheath around L2 is approximately 100
(Earth radii) and it is an area of relatively high density and low energy plasma [
2].
The Earth’s magnetic field does not exhibit a perfect dipolar configuration but is compressed on the day side and elongated on the night side due to its constant interaction with the supersonic solar wind. The elongated structure on the night side, known as the magnetotail, extends well beyond L2, affecting thus the Ariel orbit, although its precise extent remains uncertain. The external boundary of the magnetotail is the magnetopause. Around L2, the magnetotail can be approximated by a cylinder with a radius of about 20 to 30
and is an area of relatively low density and high temperature plasma compared to the solar wind and the magnetosheath regimes. The orientation of the magnetotail, as well as the magnetosheath one, is determined by the solar wind direction and is thus highly variable. The average aberration angle of the magnetotail from the Sun-Earth line is about 4 degrees and can be up to about 10 degrees, meaning that L2 can be located inside the magnetosheath or even in the magnetotail [
2].
All the described structures are shown in
Figure 6 [
10].
As most of the solar wind’s acceleration takes place near the Sun, the Ariel S/C will not observe significant differences in velocity as its distance from the Sun varies. Therefore, adding the 0.01 A.U. to the Sun-Earth distance, to reach L2, would modify the solar wind plasma parameters negligibly, allowing to consider the 1 A.U. parameters for the simulations carried out in this work. The same assumption holds for the plasma parameters in the Earth’s magnetosheath and magnetotail. However, while the spatial variation of plasma parameters in the L2 environment is negligible, their temporal variation is not. As a result, the Ariel spacecraft is likely to encounter several distinct plasma regimes within a single orbit [
2].
5. Ariel Charging Model vs Spacecraft Configuration
Due to multiple interactions with different surfaces and materials composing the satellite and due to the variability of the space plasma parameters, accurate charging predictions and assessments would be nearly impossible without the use of advanced simulation tools. In this work, the SPIS (Spacecraft Charging Plasma Interaction Software) simulator [
5], is adopted, as one of the main European reference software for space avionics charging assessment studies and ESD risk mitigation. SPIS is a complex free tool developed by the SPINE (Spacecraft Plasma Interaction Network in Europe) community.
SPIS is a simulation suite based on a numerical kernel, called SPIS-NUM, an electrostatic 3D unstructured Particle-In-Cell (PIC) plasma model consisting of a Java-based highly modular Object-Oriented library. The SPIS simulator provides a friendly user interface, called SPIS-UI, that allows the user to easily define all the needed input parameters and browse the simulation modules.
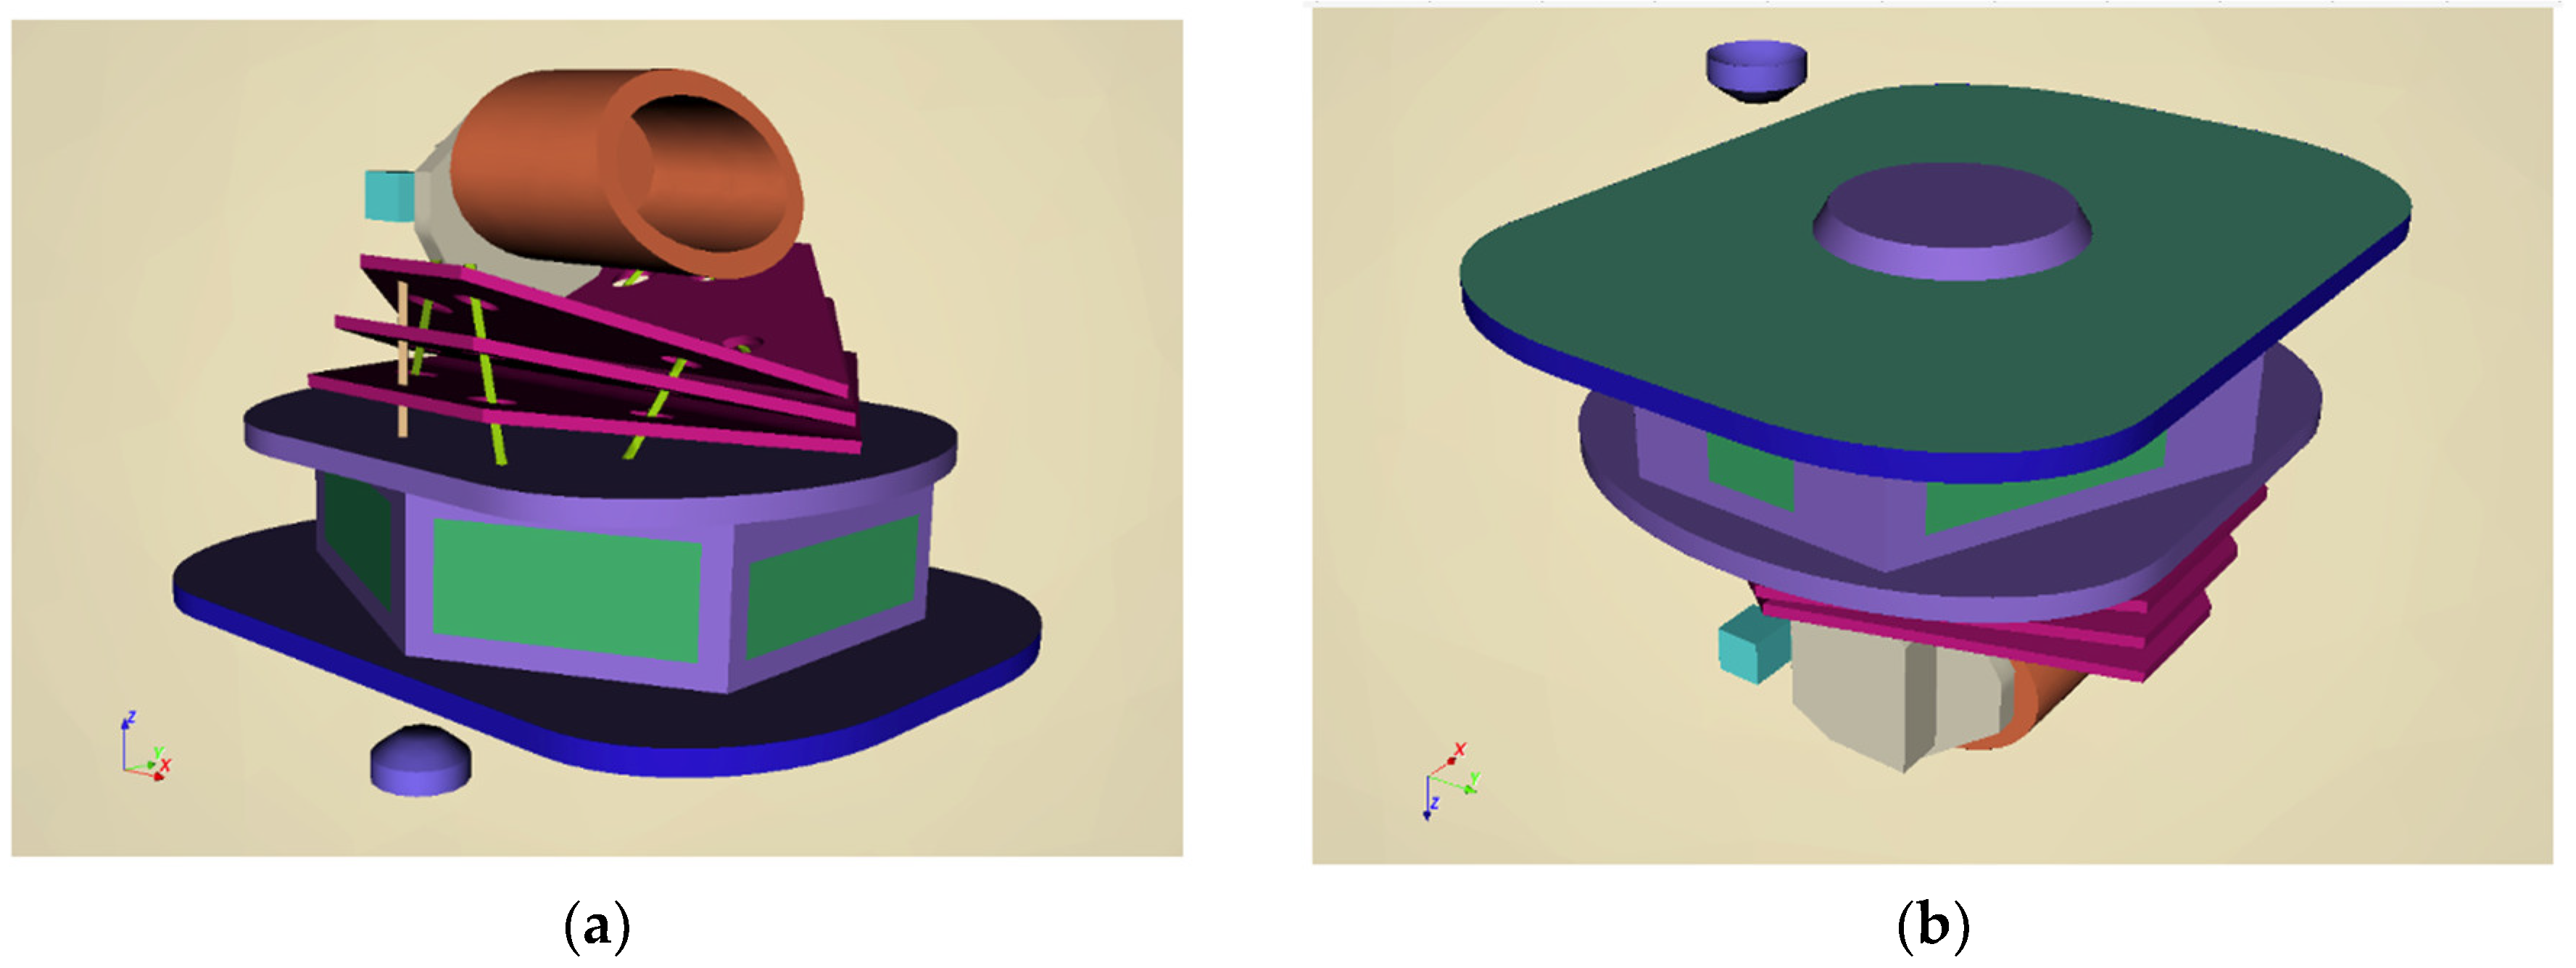
A simplified CAD model of the spacecraft, developed in collaboration with AIRBUS Defence and Space [
14,
15,
16], was used to reduce memory requirements and computational time for simulations and analyses of complex models. The model is meshed by dividing it into discrete geometric and topological cells, with triangular elements for surfaces and tetrahedral elements for volumes. The CAD creation and meshing processes have to be done using a third-party 3D finite element mesh generator called GMSH [
17] which is a free tool embedded in the SPIS simulator. The creation of the geometrical model must also include an external boundary and a computational volume. The external boundary corresponds to the unperturbed plasma and will contain the computational volume in which the plasma particles will be injected during the simulation.
In order to keep the number of mesh tetrahedral at a reasonable value, the following simplifications have been made with reference to the annexed List of Abbreviation:
S/C Radiators: smaller surfaces of similar material on the same flat panel are merged into one single large area, and radiator edges were brought in from the panel edges to allow some space.
MGA (Medium Gain Antenna): modelled as a simplified thicker metal structure (Al) detached from the main spacecraft body.
Solar Array and PIP: both use a thicker panel size.
V-Grooves: modelled with a thicker size and an increased gap between V-Grooves to allow for meshing between them and the PIP.
Telescope: simplified model detached from the V-Grooves and given sufficient thickness to allow for a reasonable mesh size. Telescope and S/C main body are made equipotential by means of the ESN/SPICE circuit.
Bipods: shaped so that they do not touch at the top in order to reduce the weight of the mesh. This simplification has minimal impact as all bipods are then grouped into a single ESN. Low resistances are assumed as their interfaces with the telescope and the PIP by means of the ESN/SPICE circuit.
VGs supporting struts: only six struts are modelled in the geometry and are then grouped into a single ESN. As for the telescope, VGs are considered part of the S/C chassis.
FPE – IC harness connectors: only one of connector (dielectric part) is modelled due to its reduced dimensions and the need to adopt a suitable meshing.
FPE struts: only one FPE strut is modelled (same consideration for FPE-IC).
The geometrical model of the S/C used in this work is shown in
Figure 7 and
Figure 8. Colors are aligned with those adopted for the retrieved voltage level 2D curves.
Material properties are assigned using a geometric editor, as the SPIS software includes a built-in database that enables the simulation of various configurations and materials, such as conductors, semiconductors, dielectrics, paints, and coatings, which helps developing physical groups and intricate spacecraft structures.
SPIS allows to define an internal SPICE-like circuit (netlist) connecting different structural components by defining a series of Electrical Super Nodes (ESNs) assigned to physical groups. These ESNs can be linked through user-specified impedances or voltage differences (biasing conditions). All potentials (biases) are referenced to the spacecraft’s ground node (chassis), and the plotted resulting voltage levels can be referred to the plasma (baseline) or the spacecraft potential.
ESNs and selected materials, the SPICE-like netlist (with reference to a simplified S/C to PL electrical configuration) and the adopted temperatures for the subsystems are listed respectively in
Table 1,
Table 2 and
Table 3.
6. Plasma Environment Definition and Input Parameters
As already mentioned, during its operational orbit around L2, Ariel will encounter three different plasma environments: the direct solar wind, the Earth’s magnetosheath and the Earth’s magnetotail. To reach the final orbit, a direct escape injection is foreseen which is approximated by a worst-case scenario of a half orbit lasting 10.5 hours, with a perigee at 300 km (LEO), an apogee at 64,000 km (GEO) and a near-zero-degree inclination. In this work, simulations regarding the L2-relevant plasma environment and the GEO have been carried out. The input data used for the SPIS simulations are reported in
Table 4 and have been retrieved from [
2,
18]. The GEO plasma parameters do not include the 5% and 90%/95% range due to their absence in the reviewed literature.
7. Simulation Results
At L2, the ambient plasma exhibits relatively low density and energy, making significant spacecraft charging unlikely. Additionally, because the solar arrays remain continuously exposed to direct sunlight, the photoelectron current is expected to dominate other currents, resulting in a positive charge on the solar arrays.
In GEO, however, higher potential levels are expected due to the high energy plasma particles (electrons and protons/ions kinetic velocities) and relatively larger Debye length.
The S/C capacitance is set to 10 μF, which is relatively large since lower values are typically more realistic. However, this only influences the transient behavior and settling time of the ground potential, without affecting the calculated potential levels in steady-state conditions, which is the primary focus of the simulation. This higher capacitance value also enhances model stability and reduces computational time. The simulation duration is chosen in such a way as to find a reasonable compromise between computational cost (including settling time to steady state) and achieving an equilibrium state, as the real simulation target.
7.1. GEO Early Injection Trajectory to L2
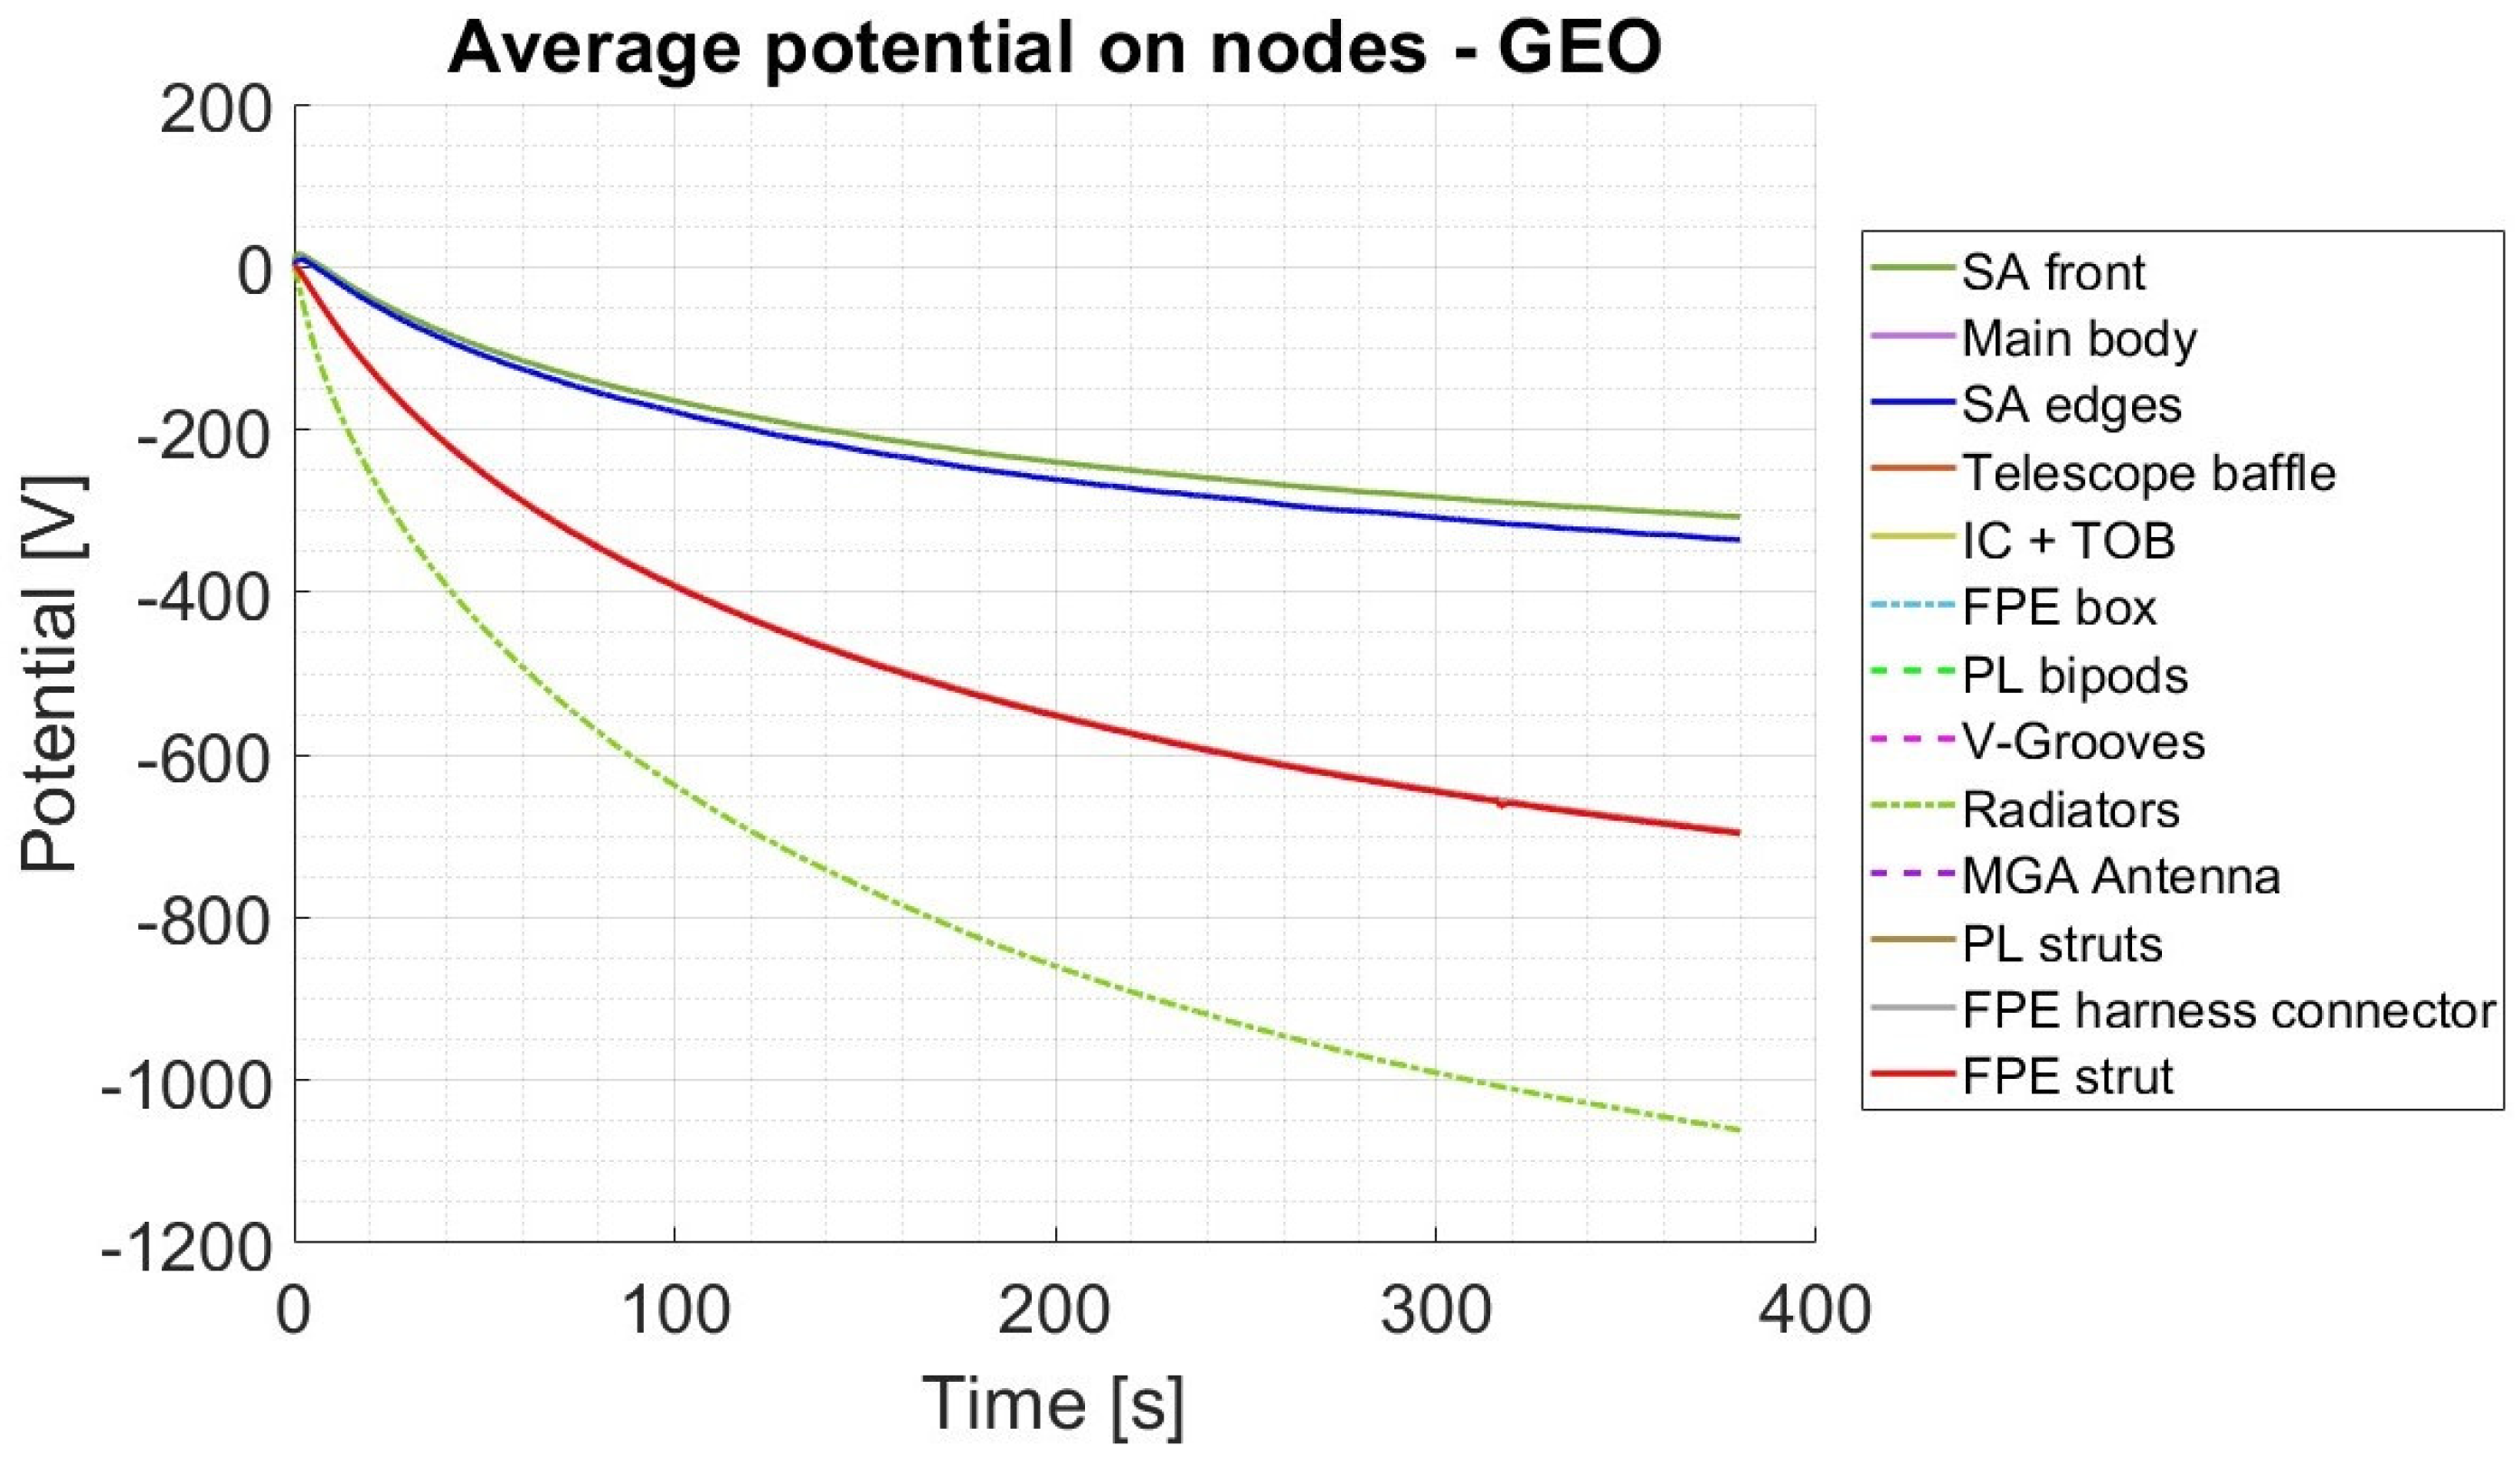
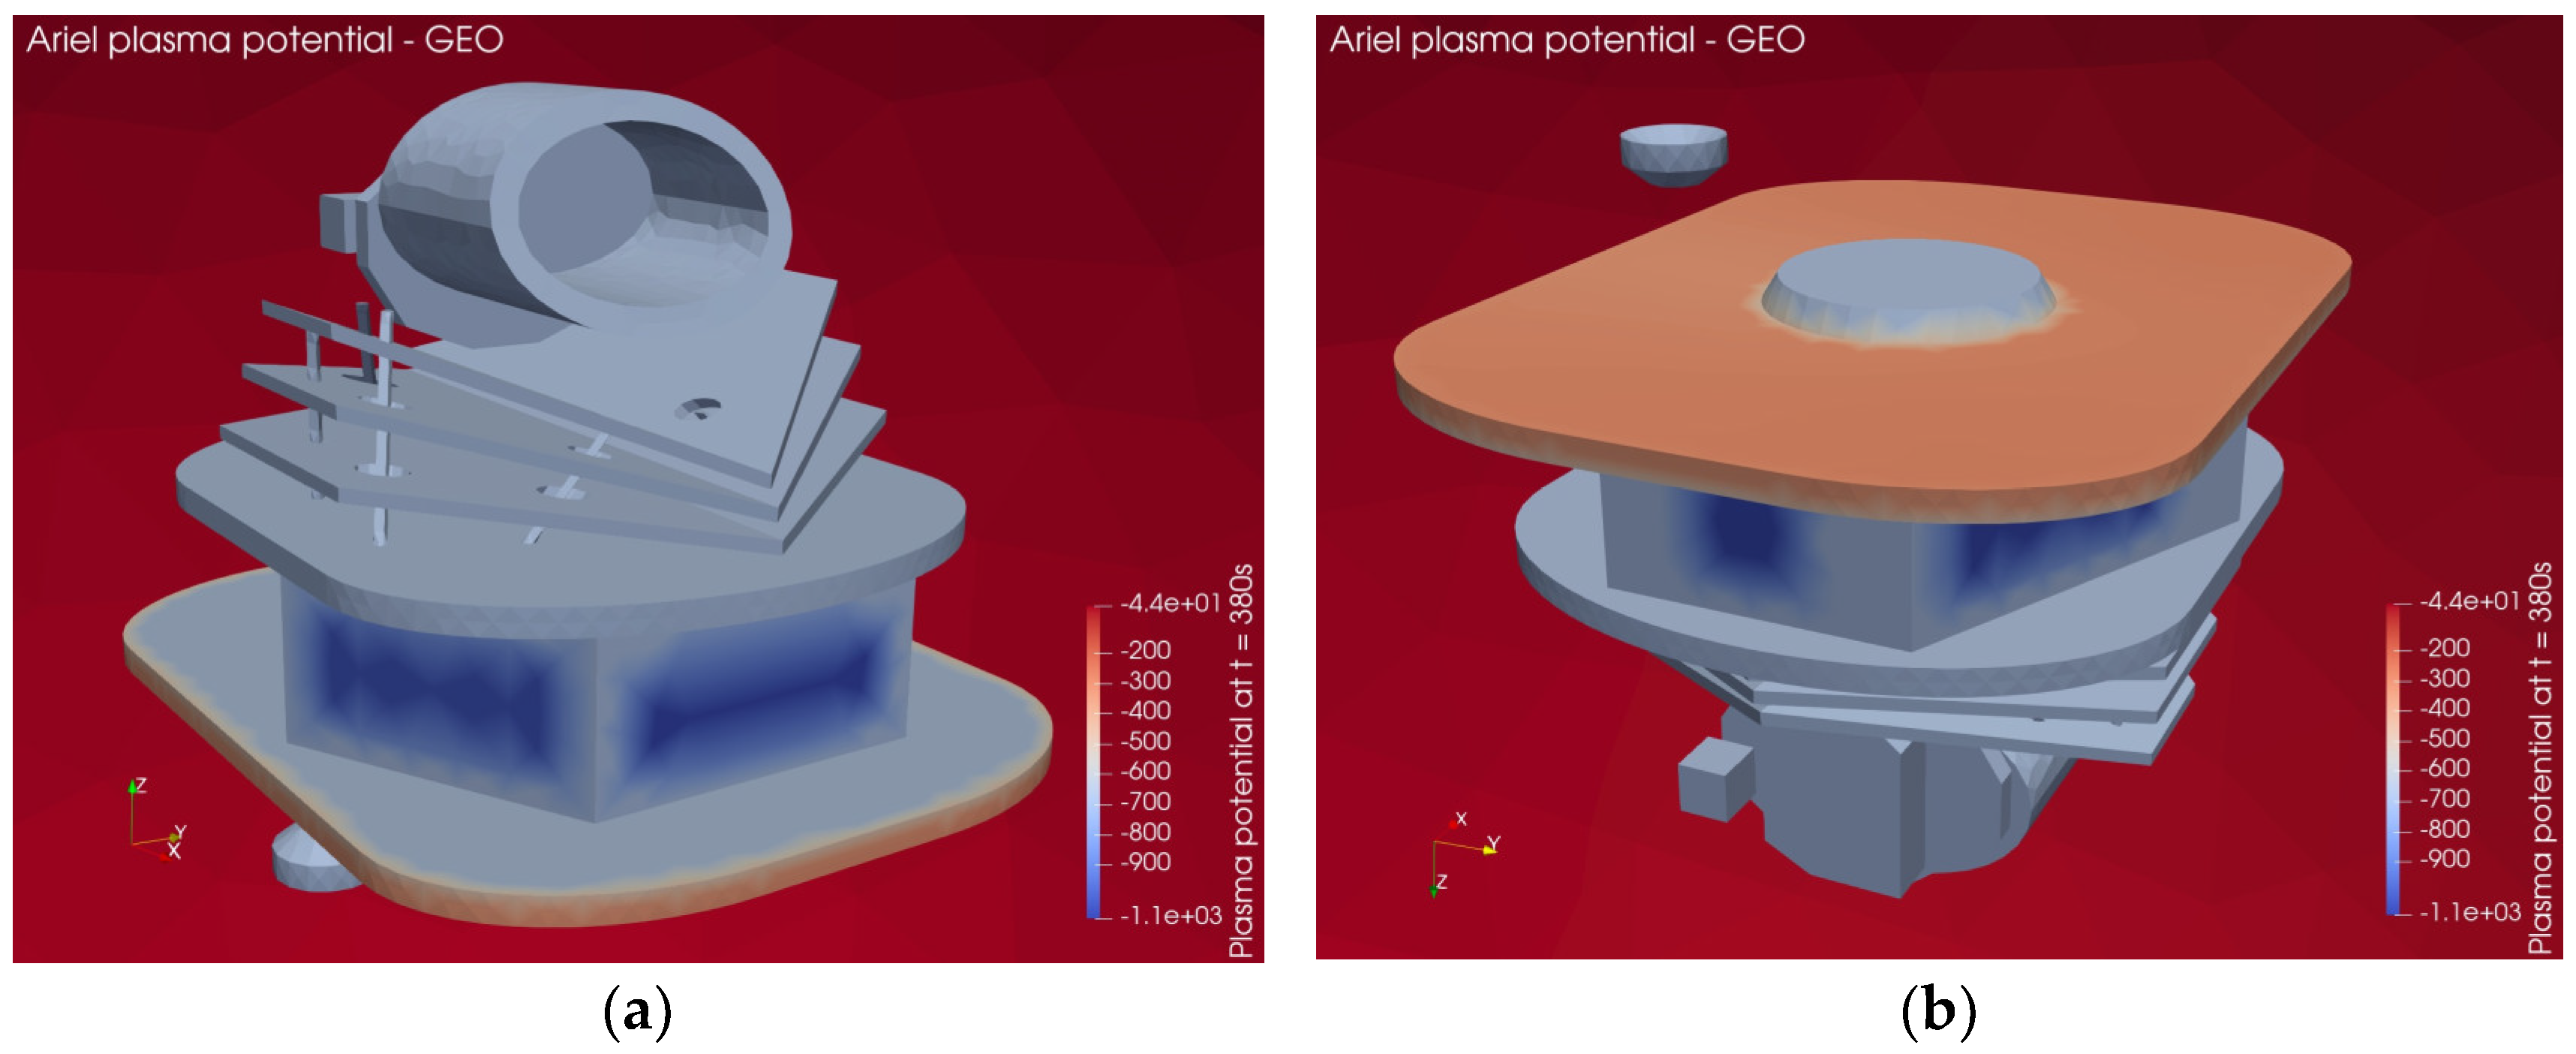
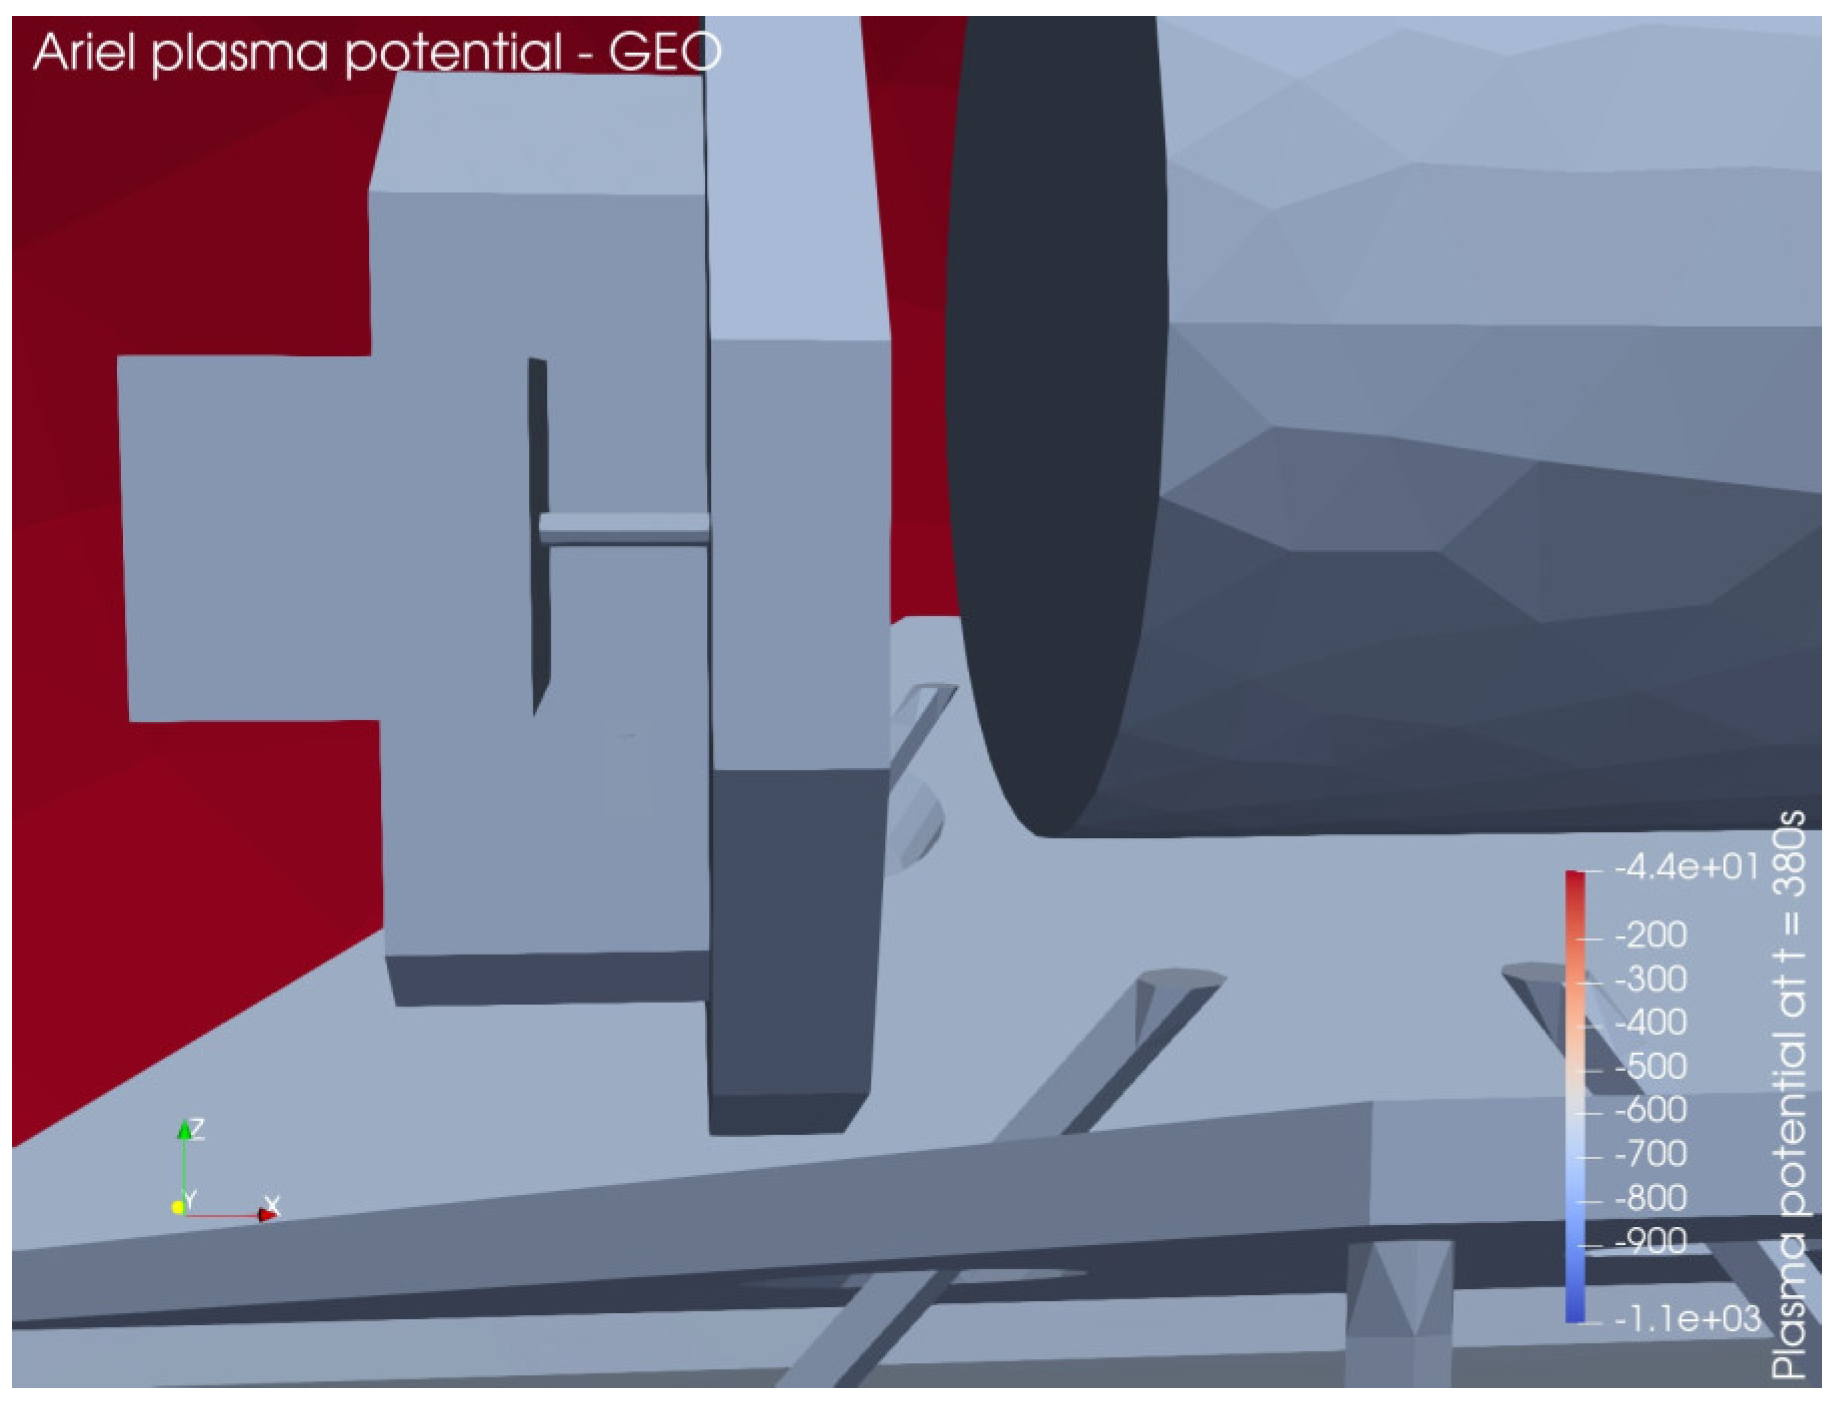
As expected, the GEO orbit is the most concerning. As can be seen from
Figure 9,
Figure 10, and
Figure 11, in this environment high potential differences are reached both between different surfaces of the satellite and between the surfaces themselves and the ambient plasma (which, as previously mentioned, is taken as zero potential level). In this environment, therefore, as also mentioned in
Figure 5, a high risk of ESD is expected both between different surfaces of the S/C and from the surfaces of the S/C to the surrounding plasma.
7.2. Solar Wind (1 A.U.)
7.2.1. Solar Wind – Average Conditions
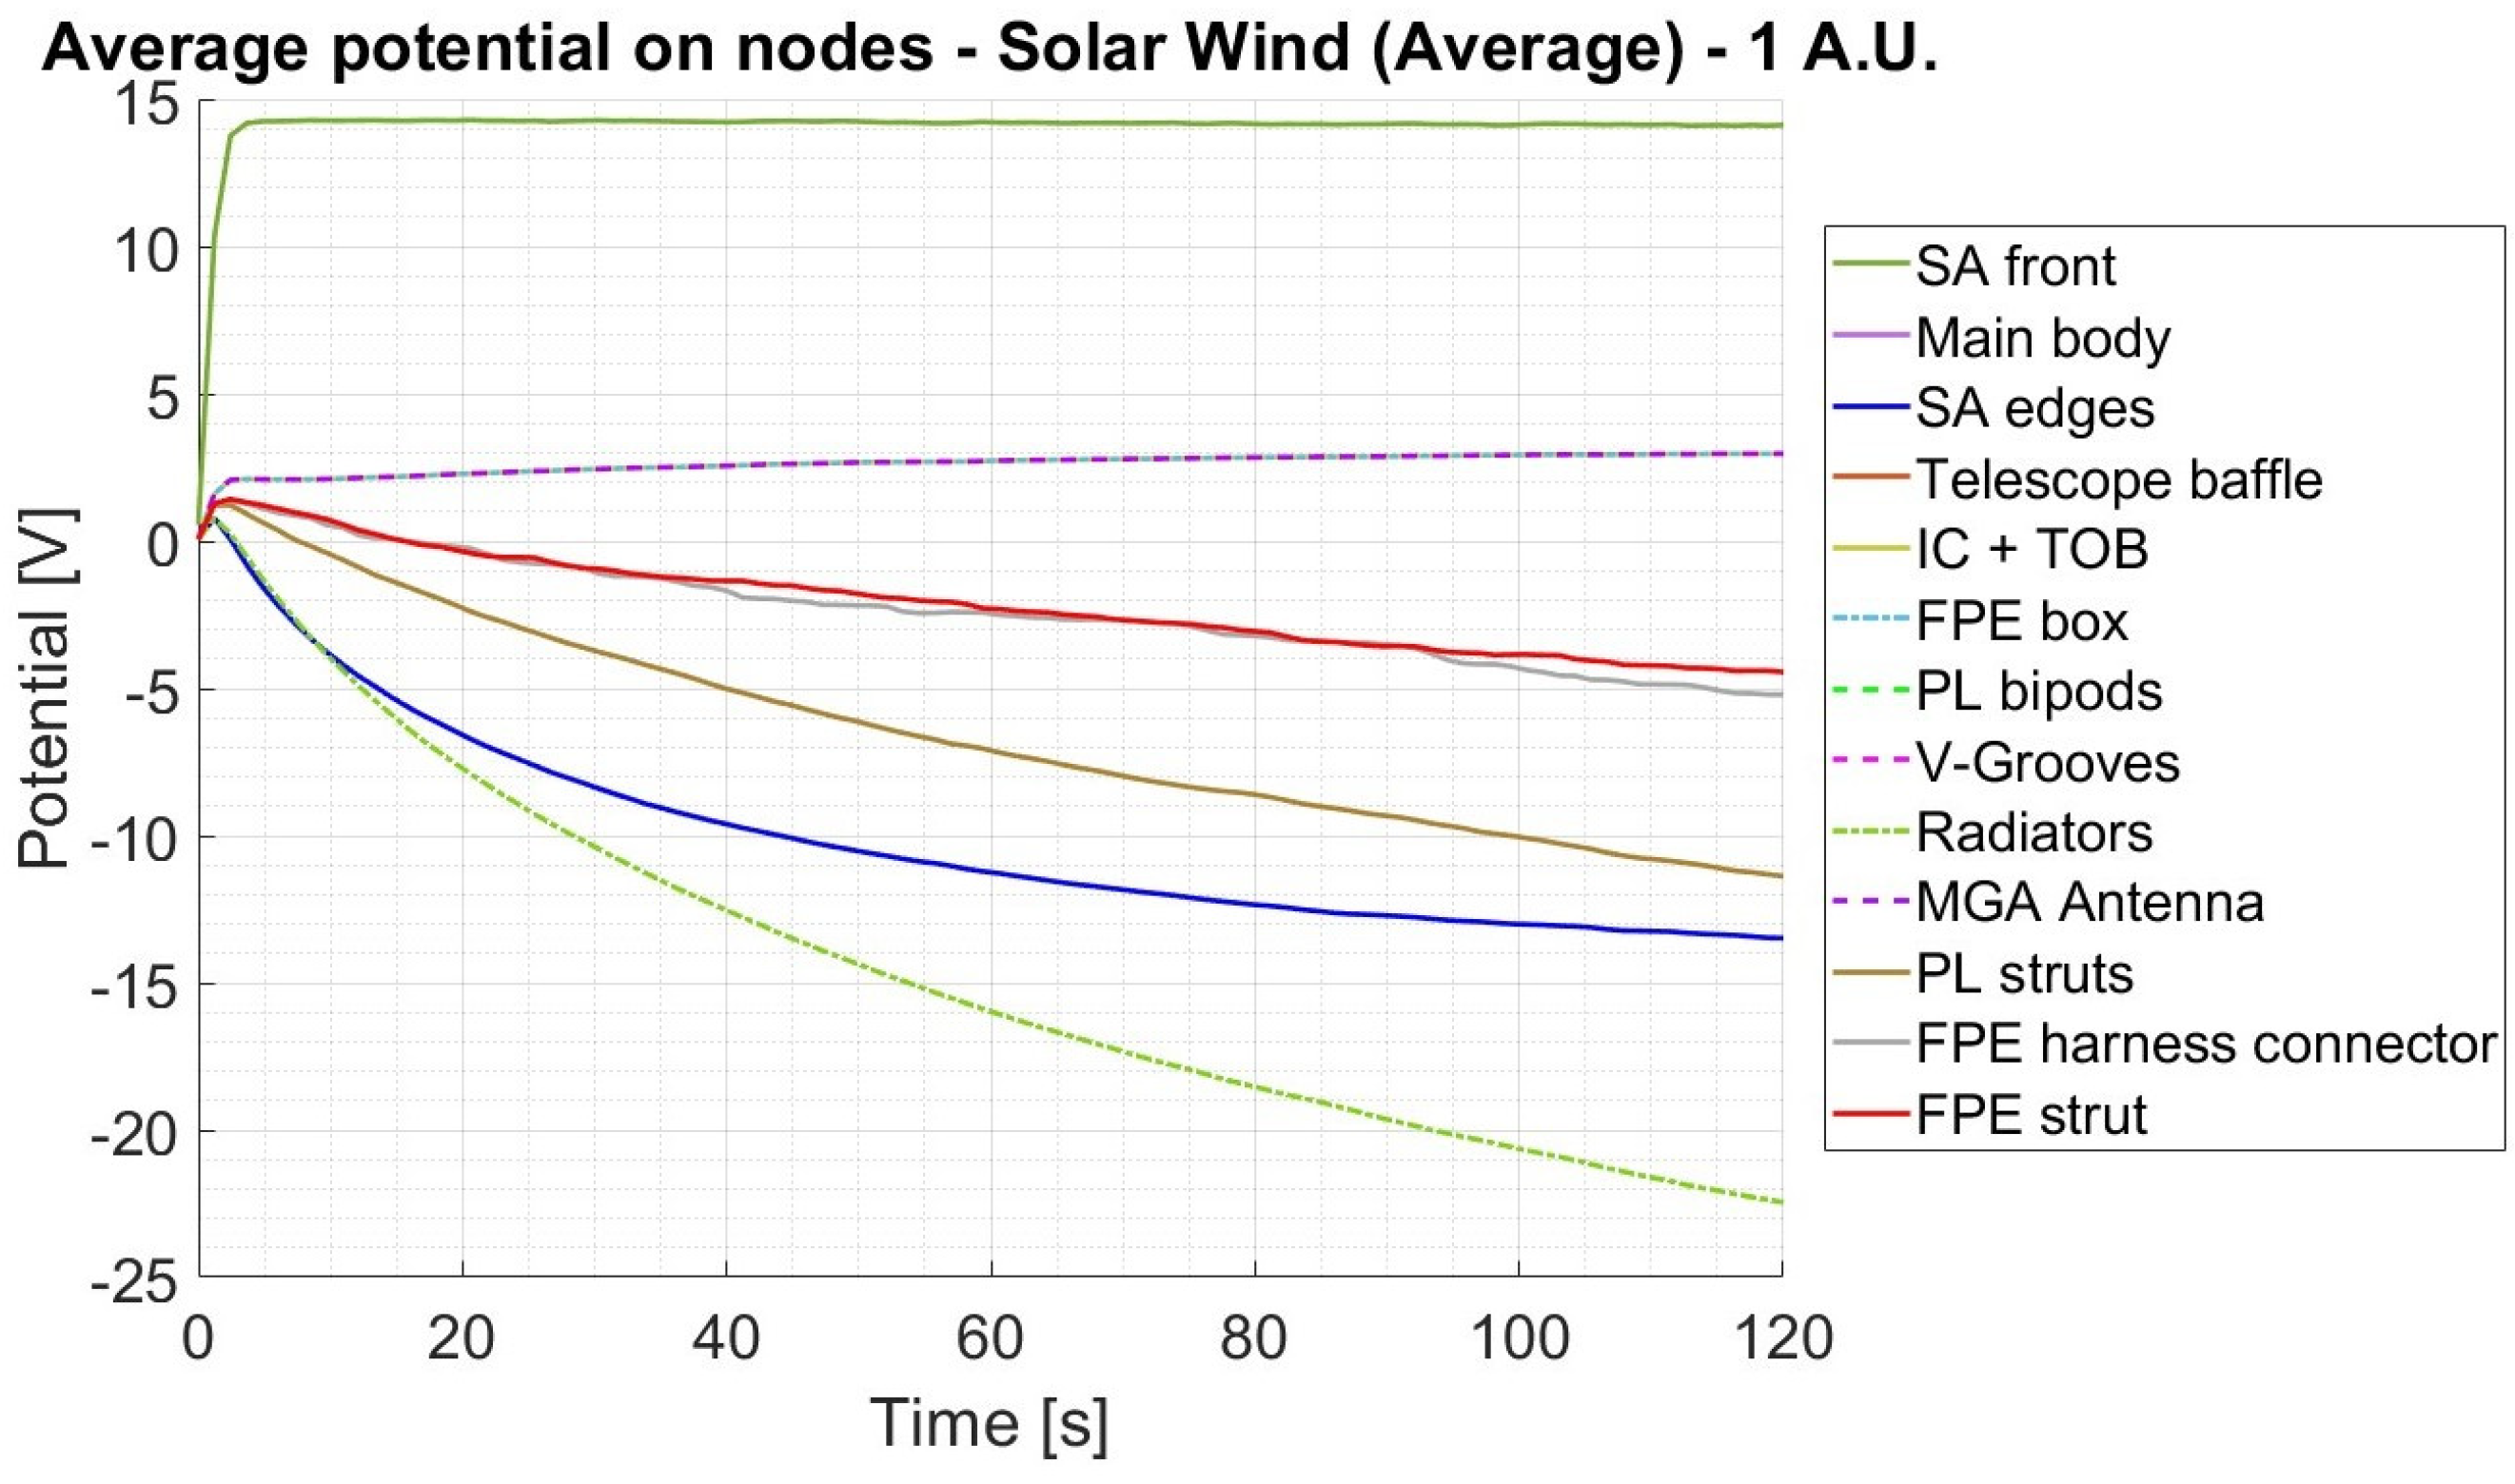
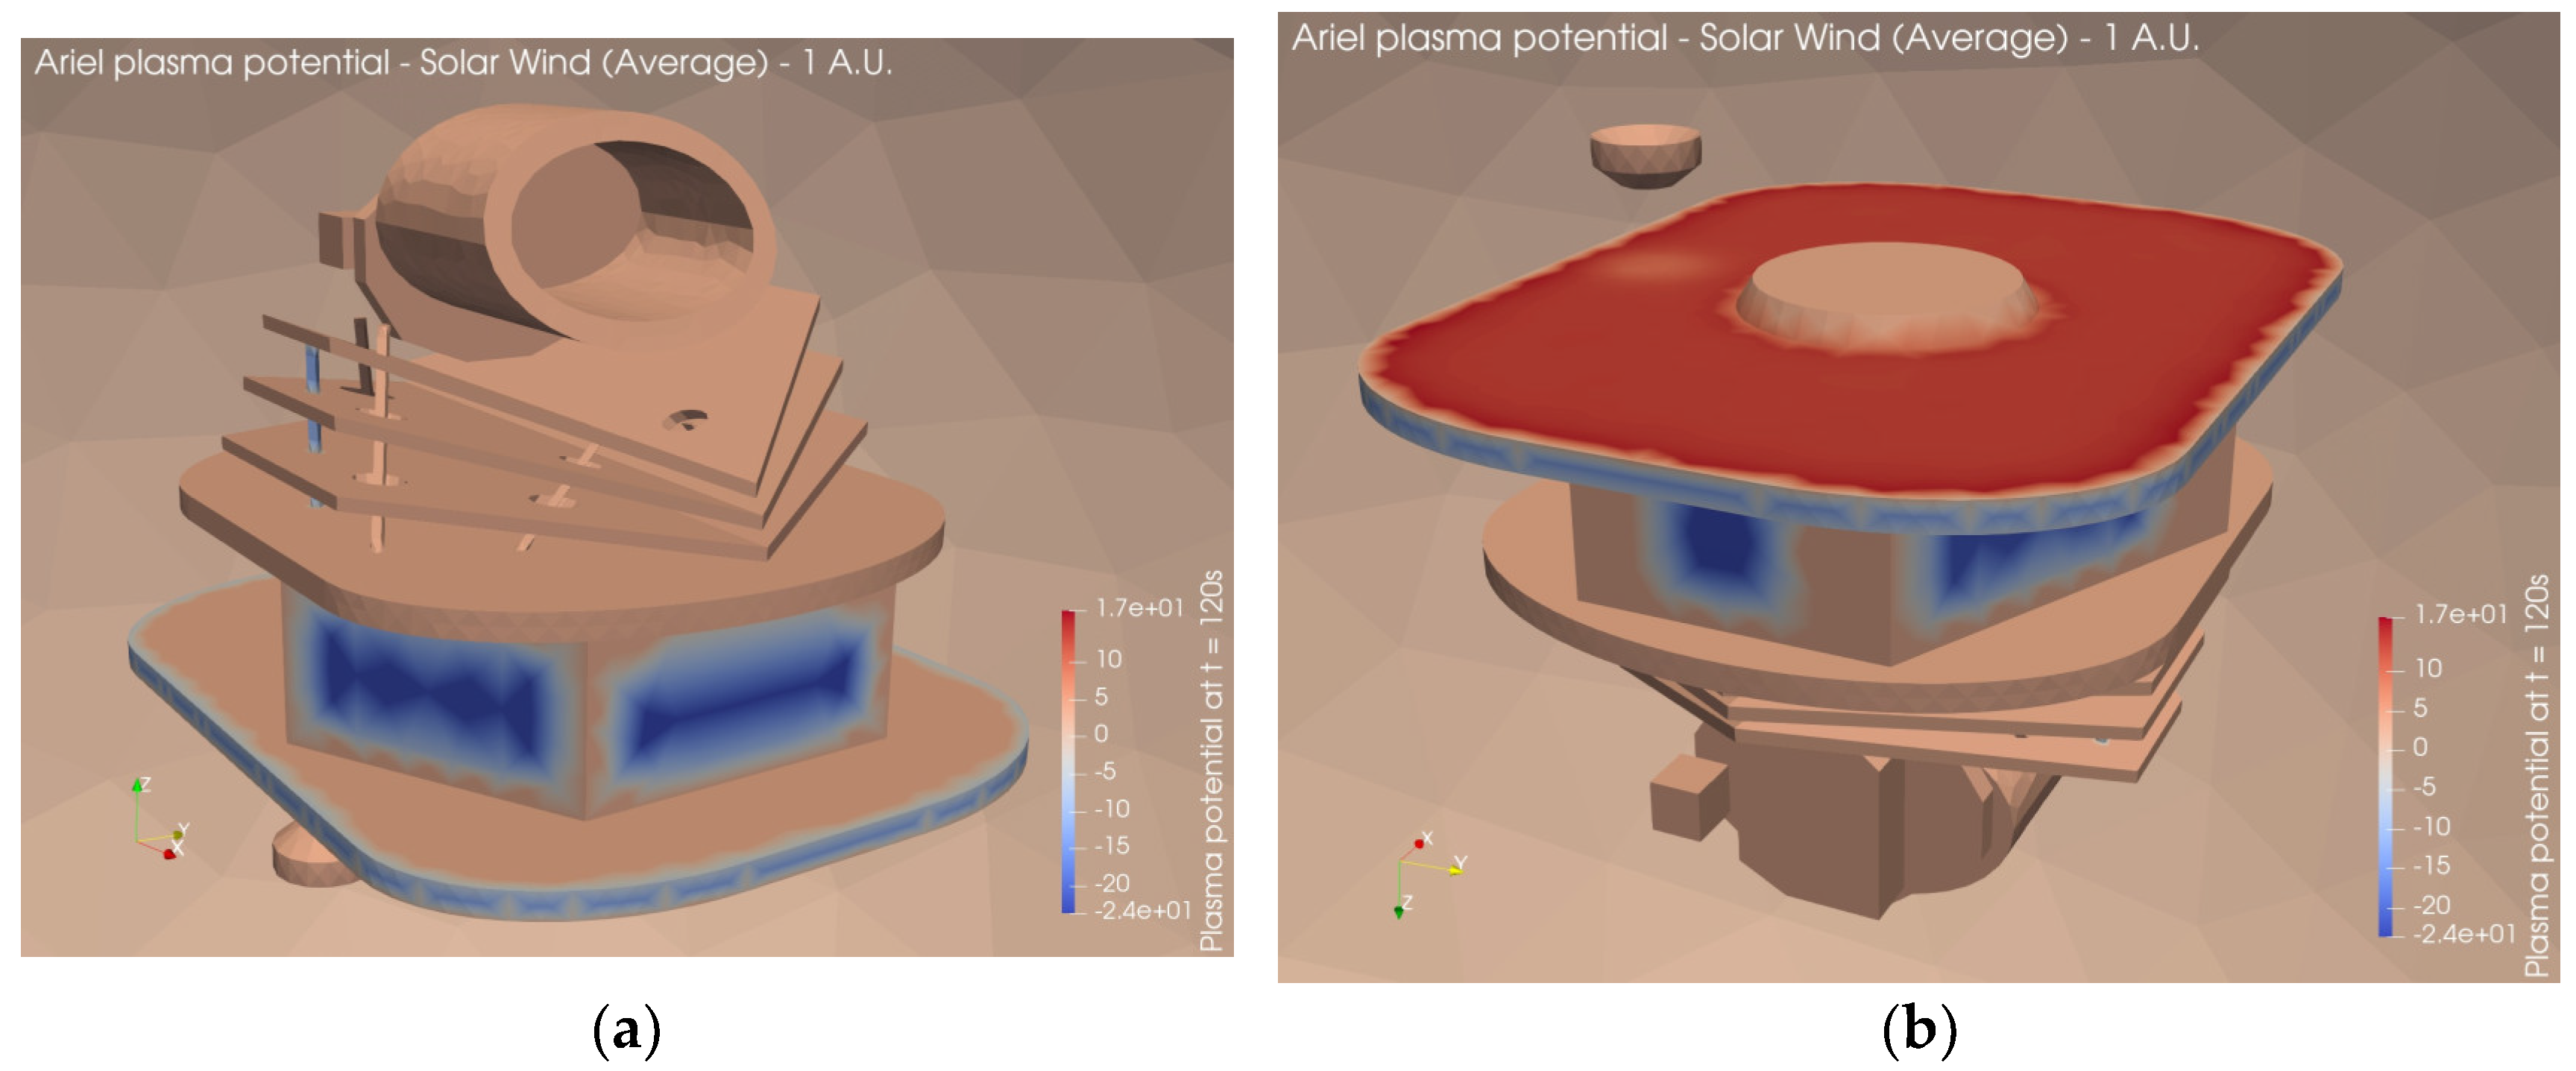
In this environment, the Ariel solar arrays charge positively up to about 14 V due to the aforementioned photoelectric effect for surfaces directly exposed to the sunlight. The surfaces of the radiators, however, covered with non-conductive paint, are charged to a potential of about -23V at the end of the simulation time (120s), with a weak tendency to an asymptotic behavior, for which longer simulation times would be needed for confirmation. The resulting potential differences do not pose a significant risk of ESDs according to the ECSS standards [
13], either between different surfaces of the S/C or from the S/C surfaces to the surrounding plasma.
Figure 12.
Surface potential evolution – Solar Wind (1 A.U.) – Average conditions.
Figure 12.
Surface potential evolution – Solar Wind (1 A.U.) – Average conditions.
Figure 13.
3D map of plasma potential – Solar Wind (1 A.U.) – Average conditions (a) Ariel front; (b) Ariel bottom.
Figure 13.
3D map of plasma potential – Solar Wind (1 A.U.) – Average conditions (a) Ariel front; (b) Ariel bottom.
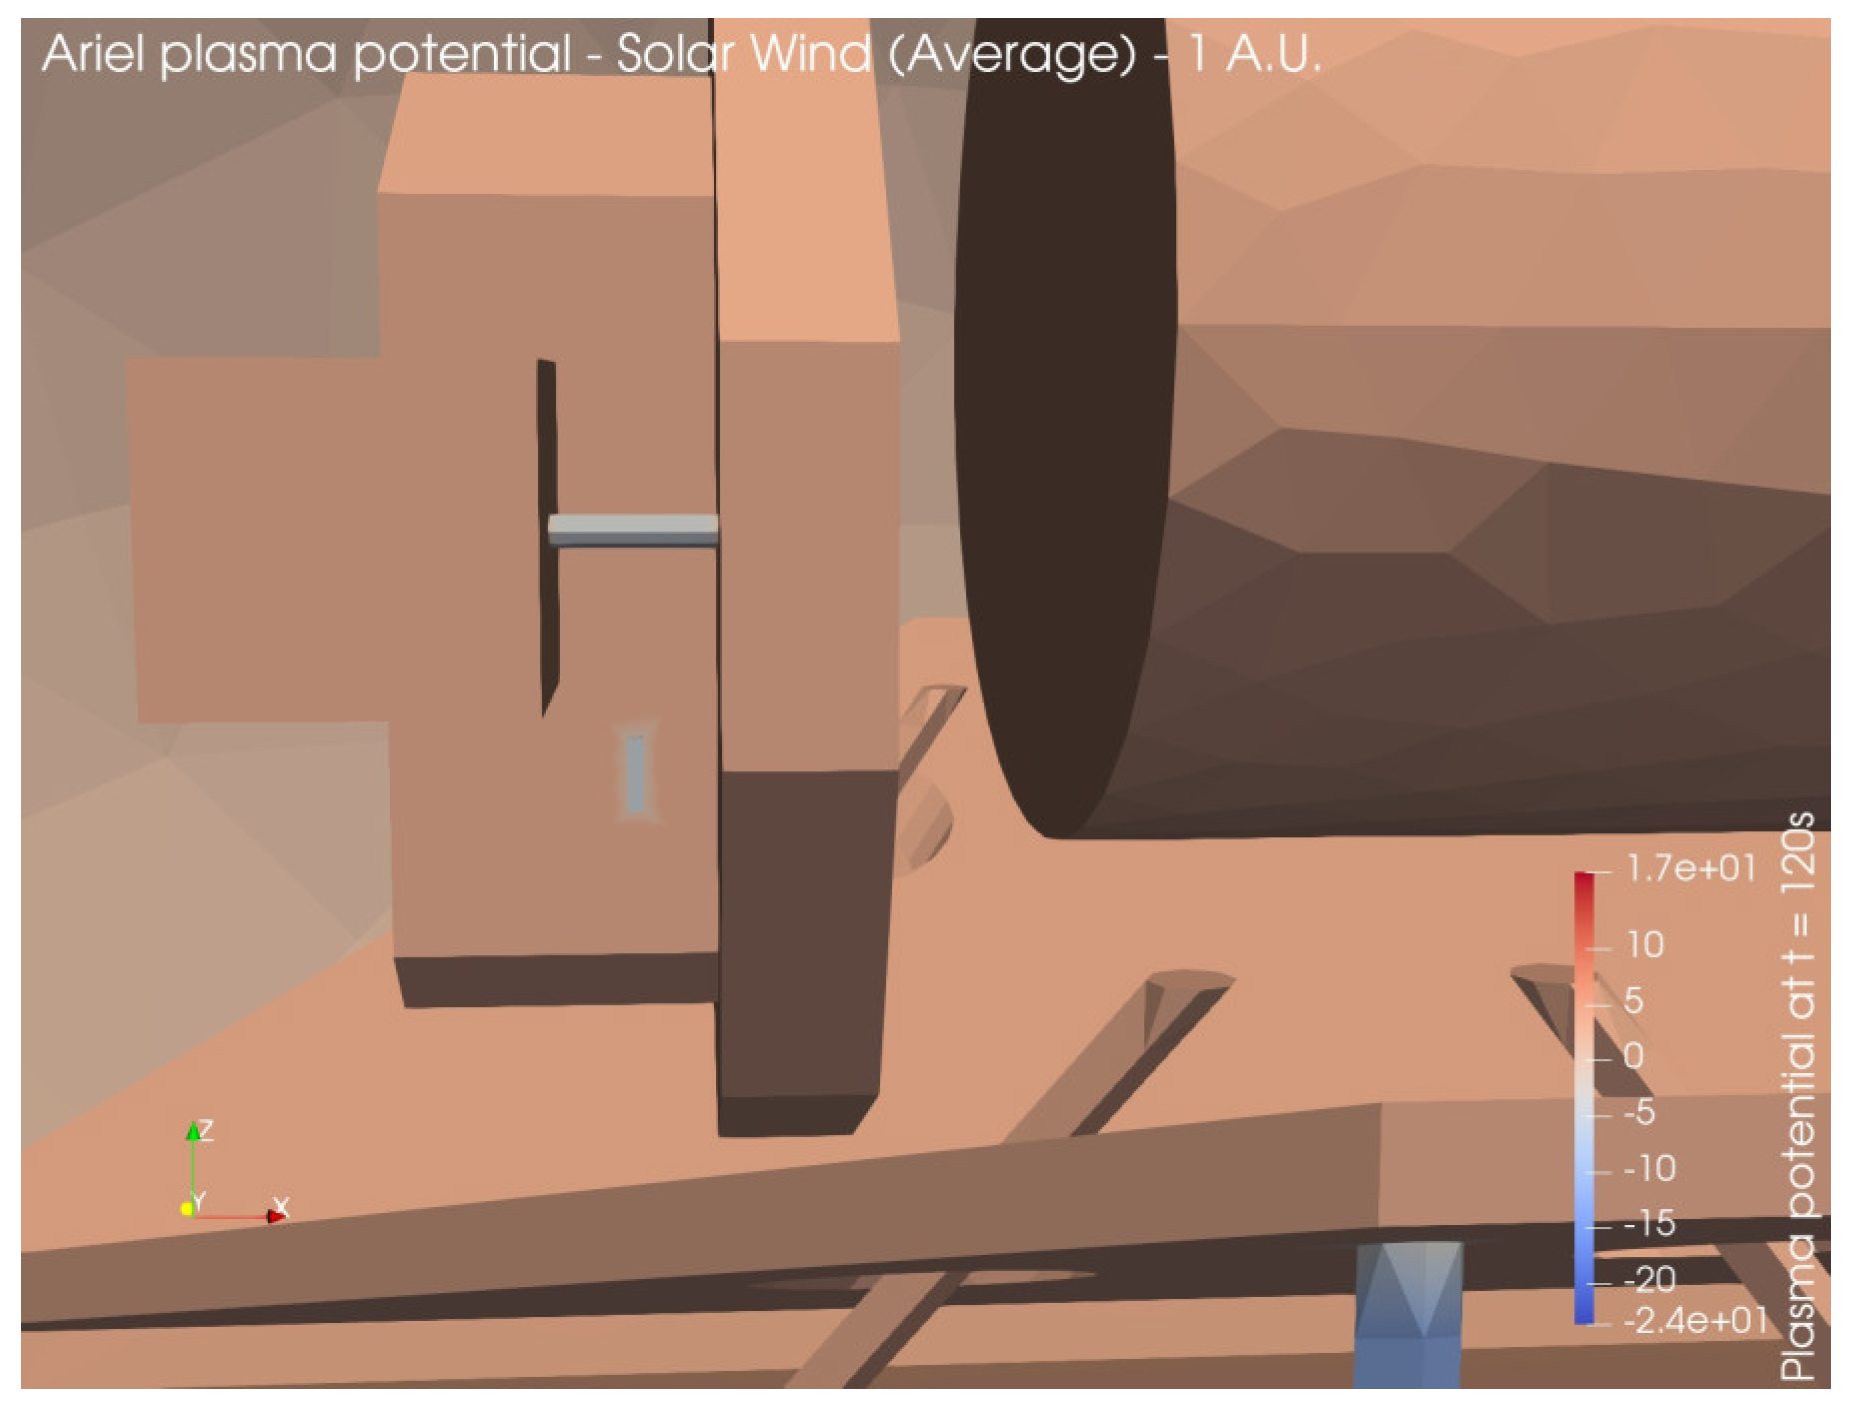
Figure 14.
3D map of plasma potential – Solar Wind (1 A.U.) – Average conditions: closeup on FPE-IC connector and FPE strut.
Figure 14.
3D map of plasma potential – Solar Wind (1 A.U.) – Average conditions: closeup on FPE-IC connector and FPE strut.
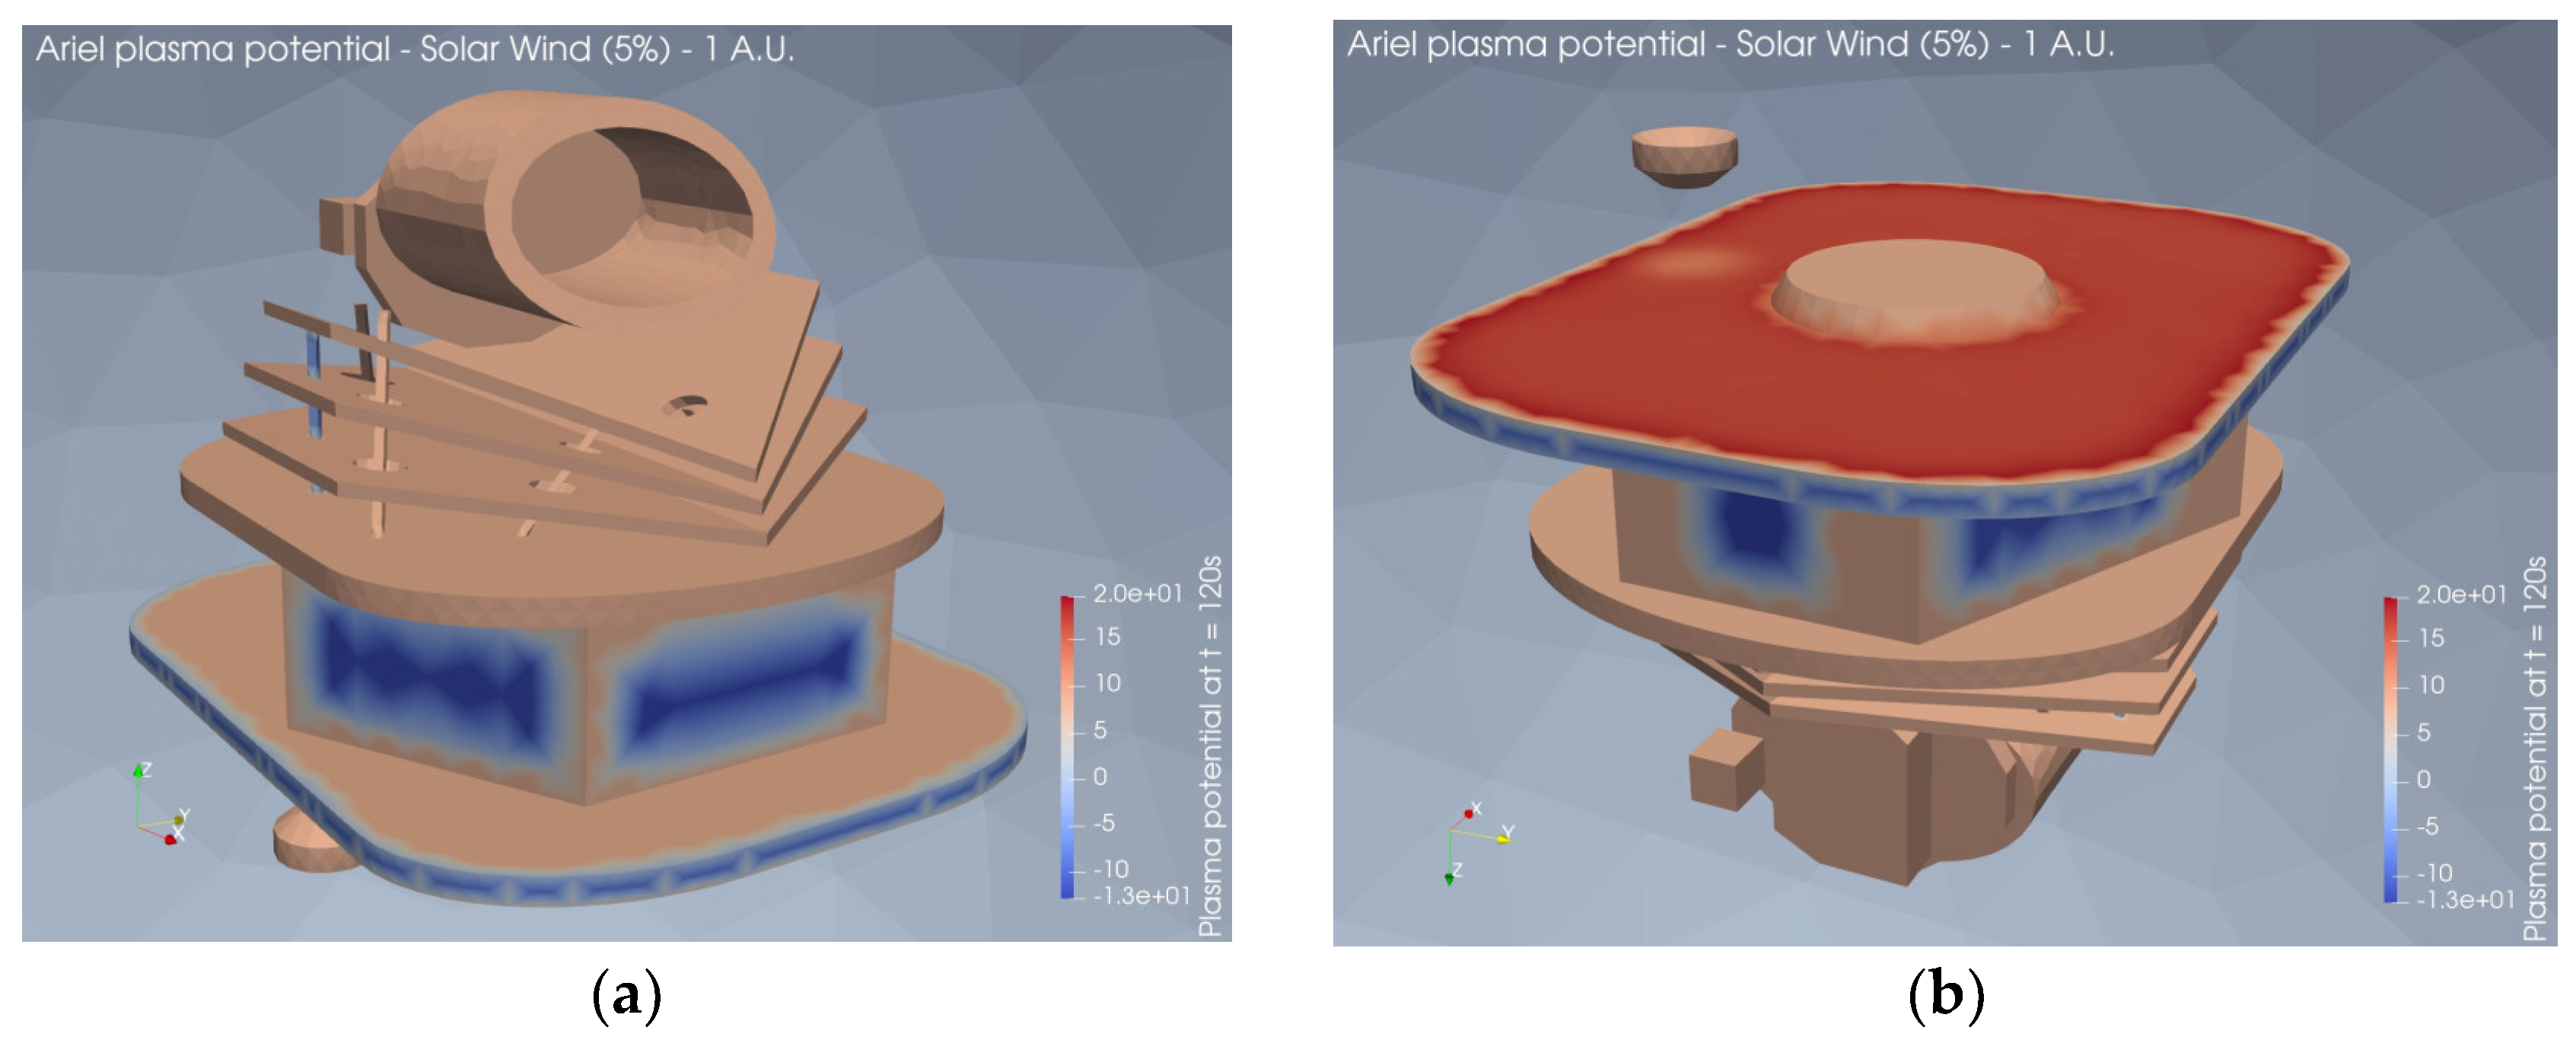
7.2.2. Solar Wind –5% Conditions
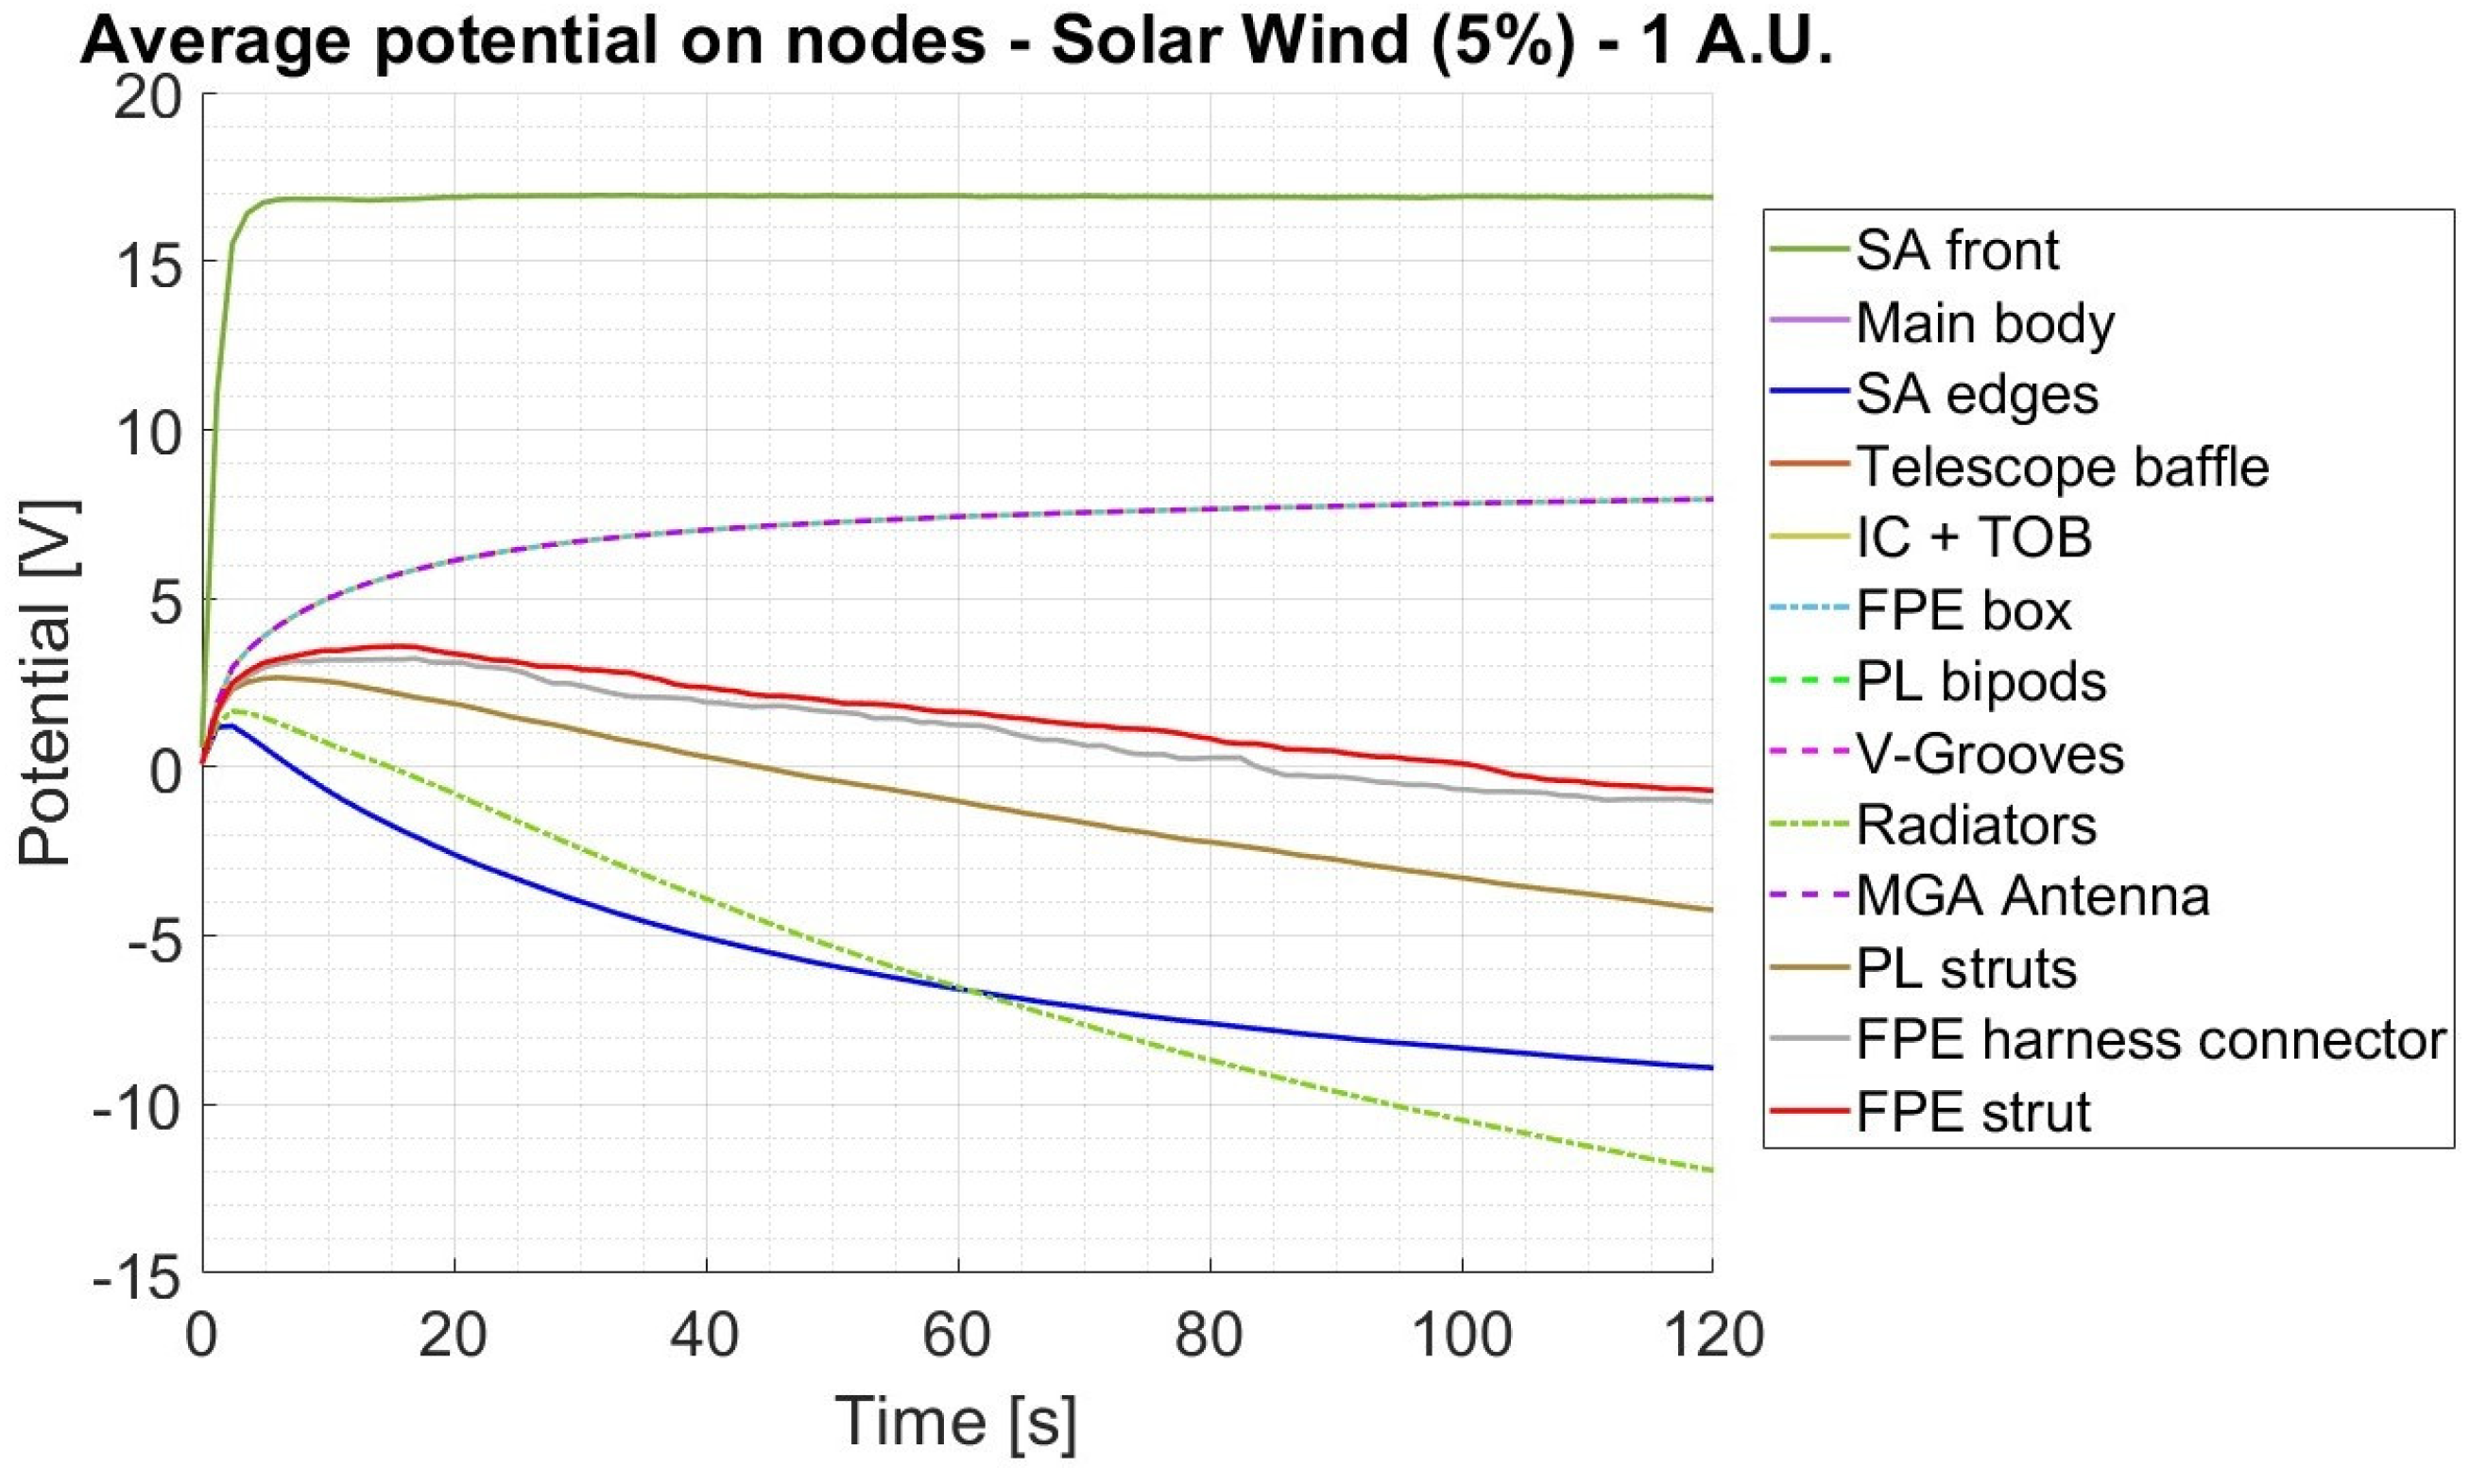
In this environment, the Ariel solar arrays charge positively up to about 17 V due to the photoelectric effect on surfaces directly exposed to the sunlight. The radiators surfaces, however, covered with non-conductive paint, are slowly charged to a potential of about -12V. The resulting potential differences do not pose a significant risk of ESDs according to the ECSS standards [
13], either between different surfaces of the S/C or from the S/C surfaces to the surrounding plasma.
Figure 12.
Surface potential evolution – Solar Wind (1 A.U.) – 5% conditions.
Figure 12.
Surface potential evolution – Solar Wind (1 A.U.) – 5% conditions.
Figure 13.
3D map of plasma potential – Solar Wind (1 A.U.) – 5% conditions (a) Ariel front; (b) Ariel bottom.
Figure 13.
3D map of plasma potential – Solar Wind (1 A.U.) – 5% conditions (a) Ariel front; (b) Ariel bottom.
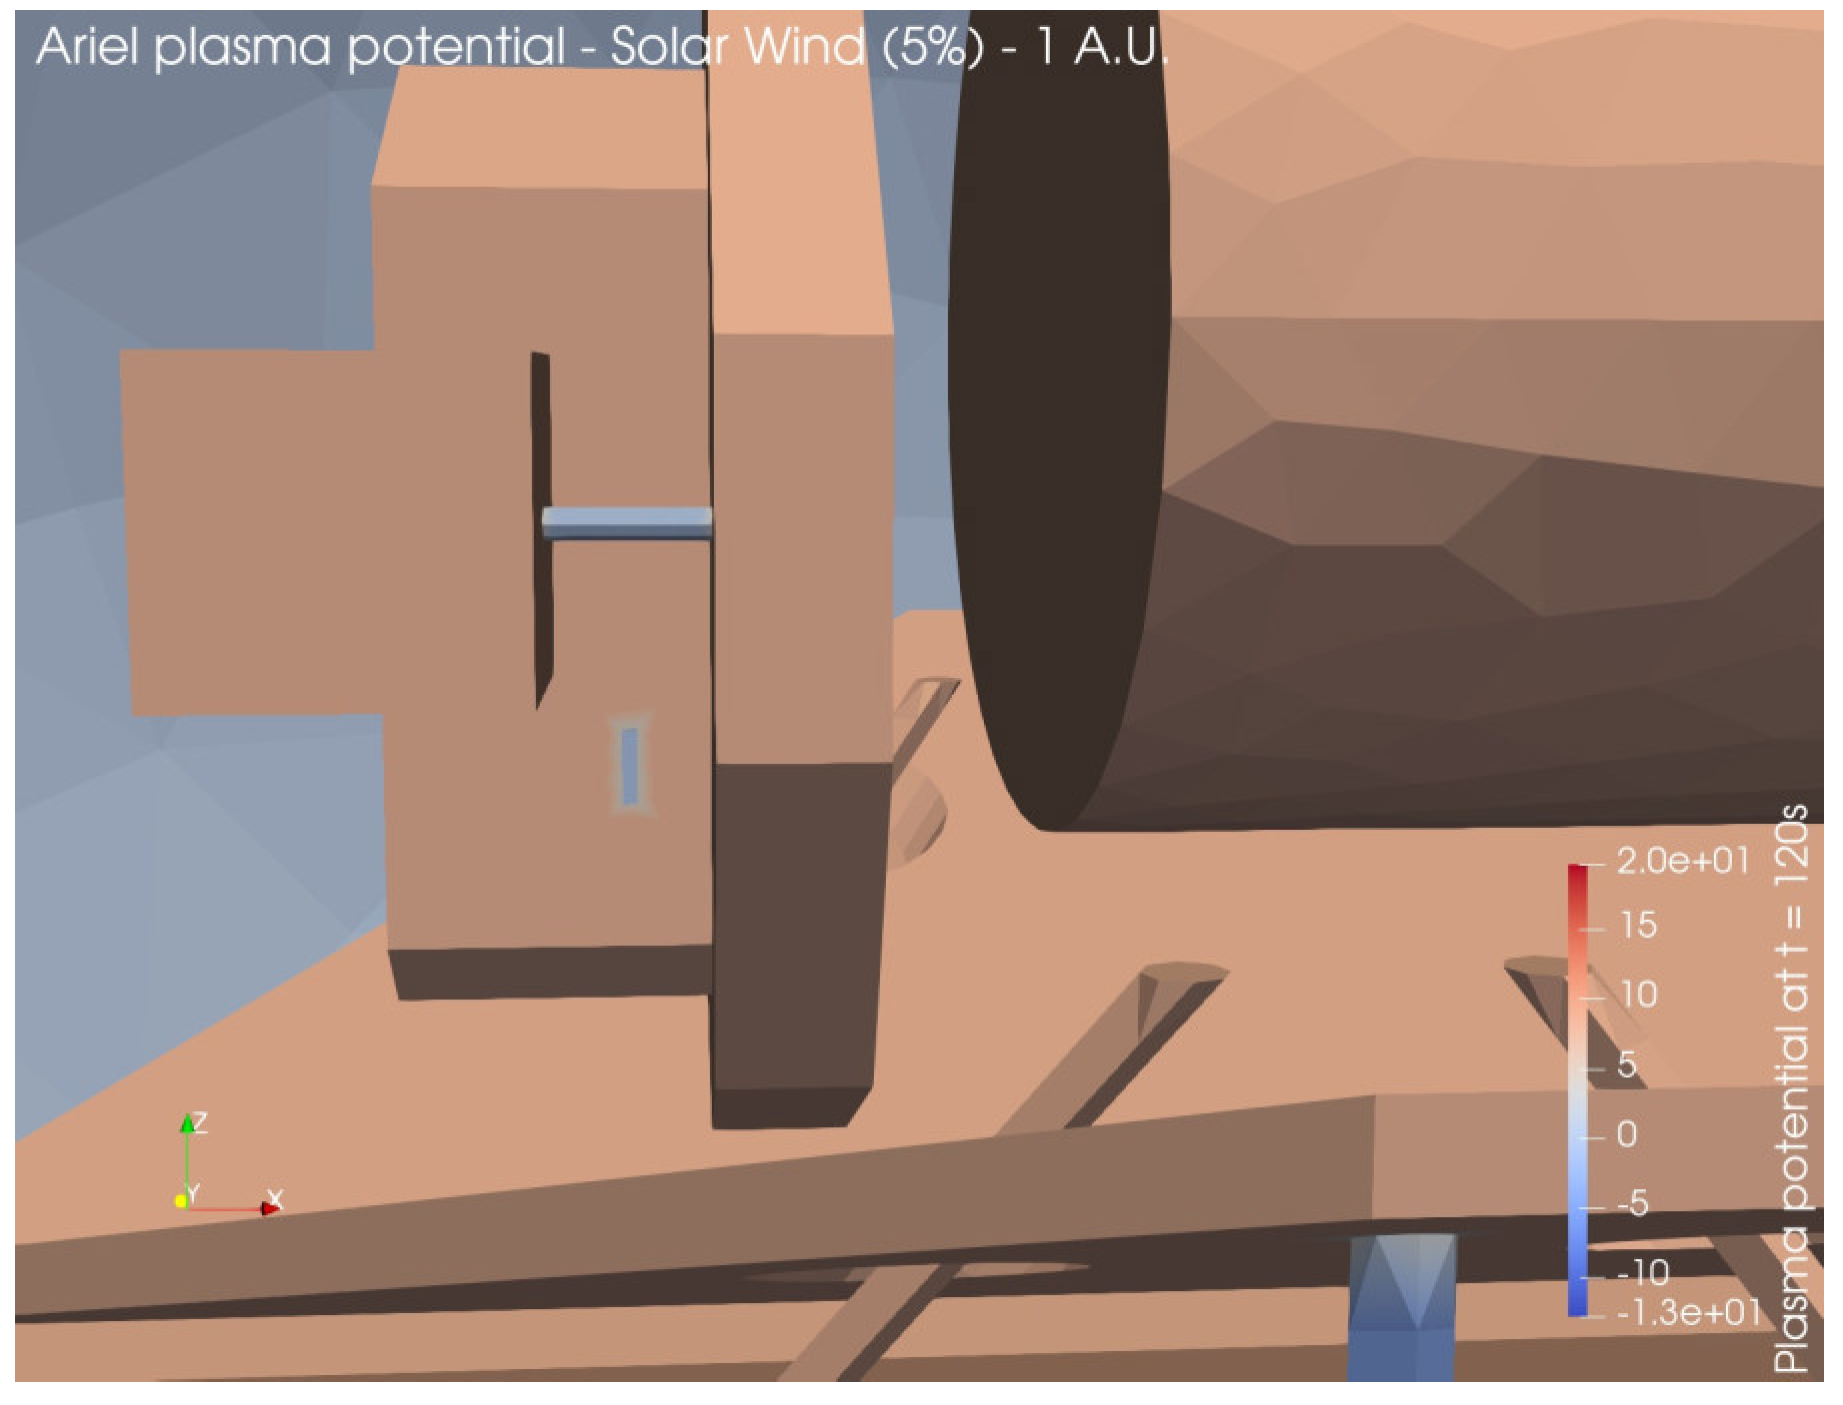
Figure 14.
3D map of plasma potential – Solar Wind (1 A.U.) – 5% conditions: closeup on FPE-IC connector and FPE strut.
Figure 14.
3D map of plasma potential – Solar Wind (1 A.U.) – 5% conditions: closeup on FPE-IC connector and FPE strut.
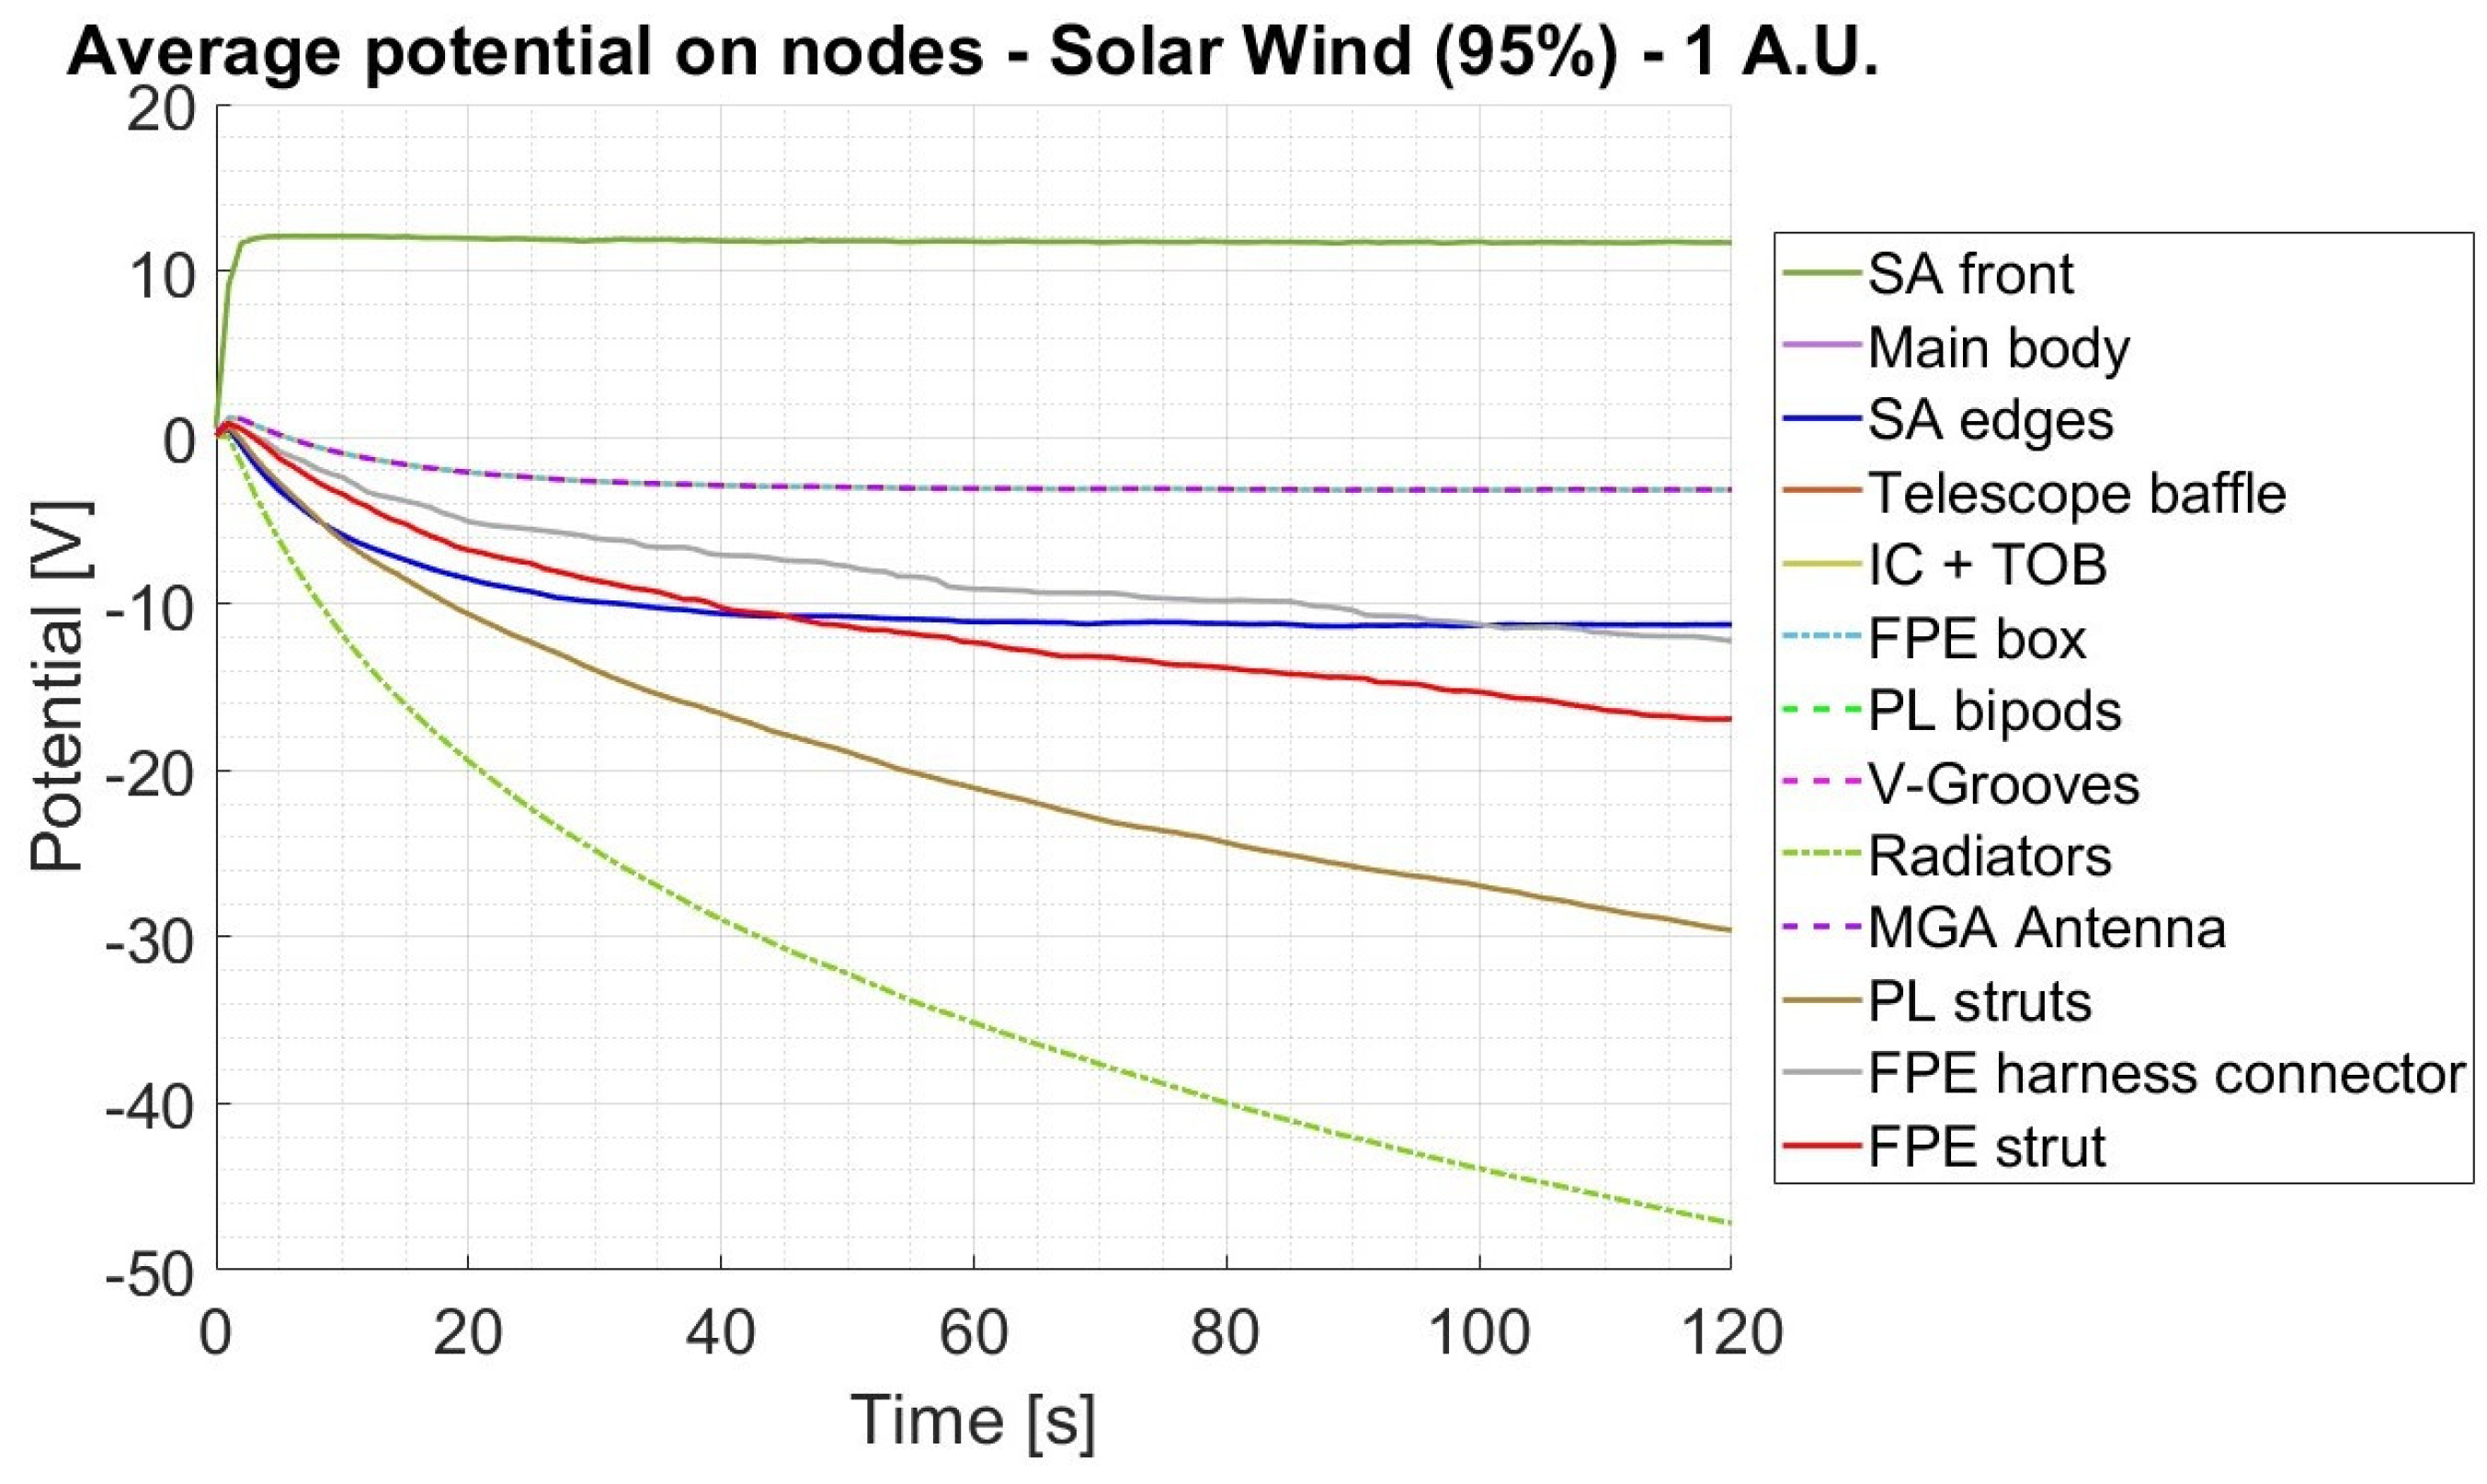
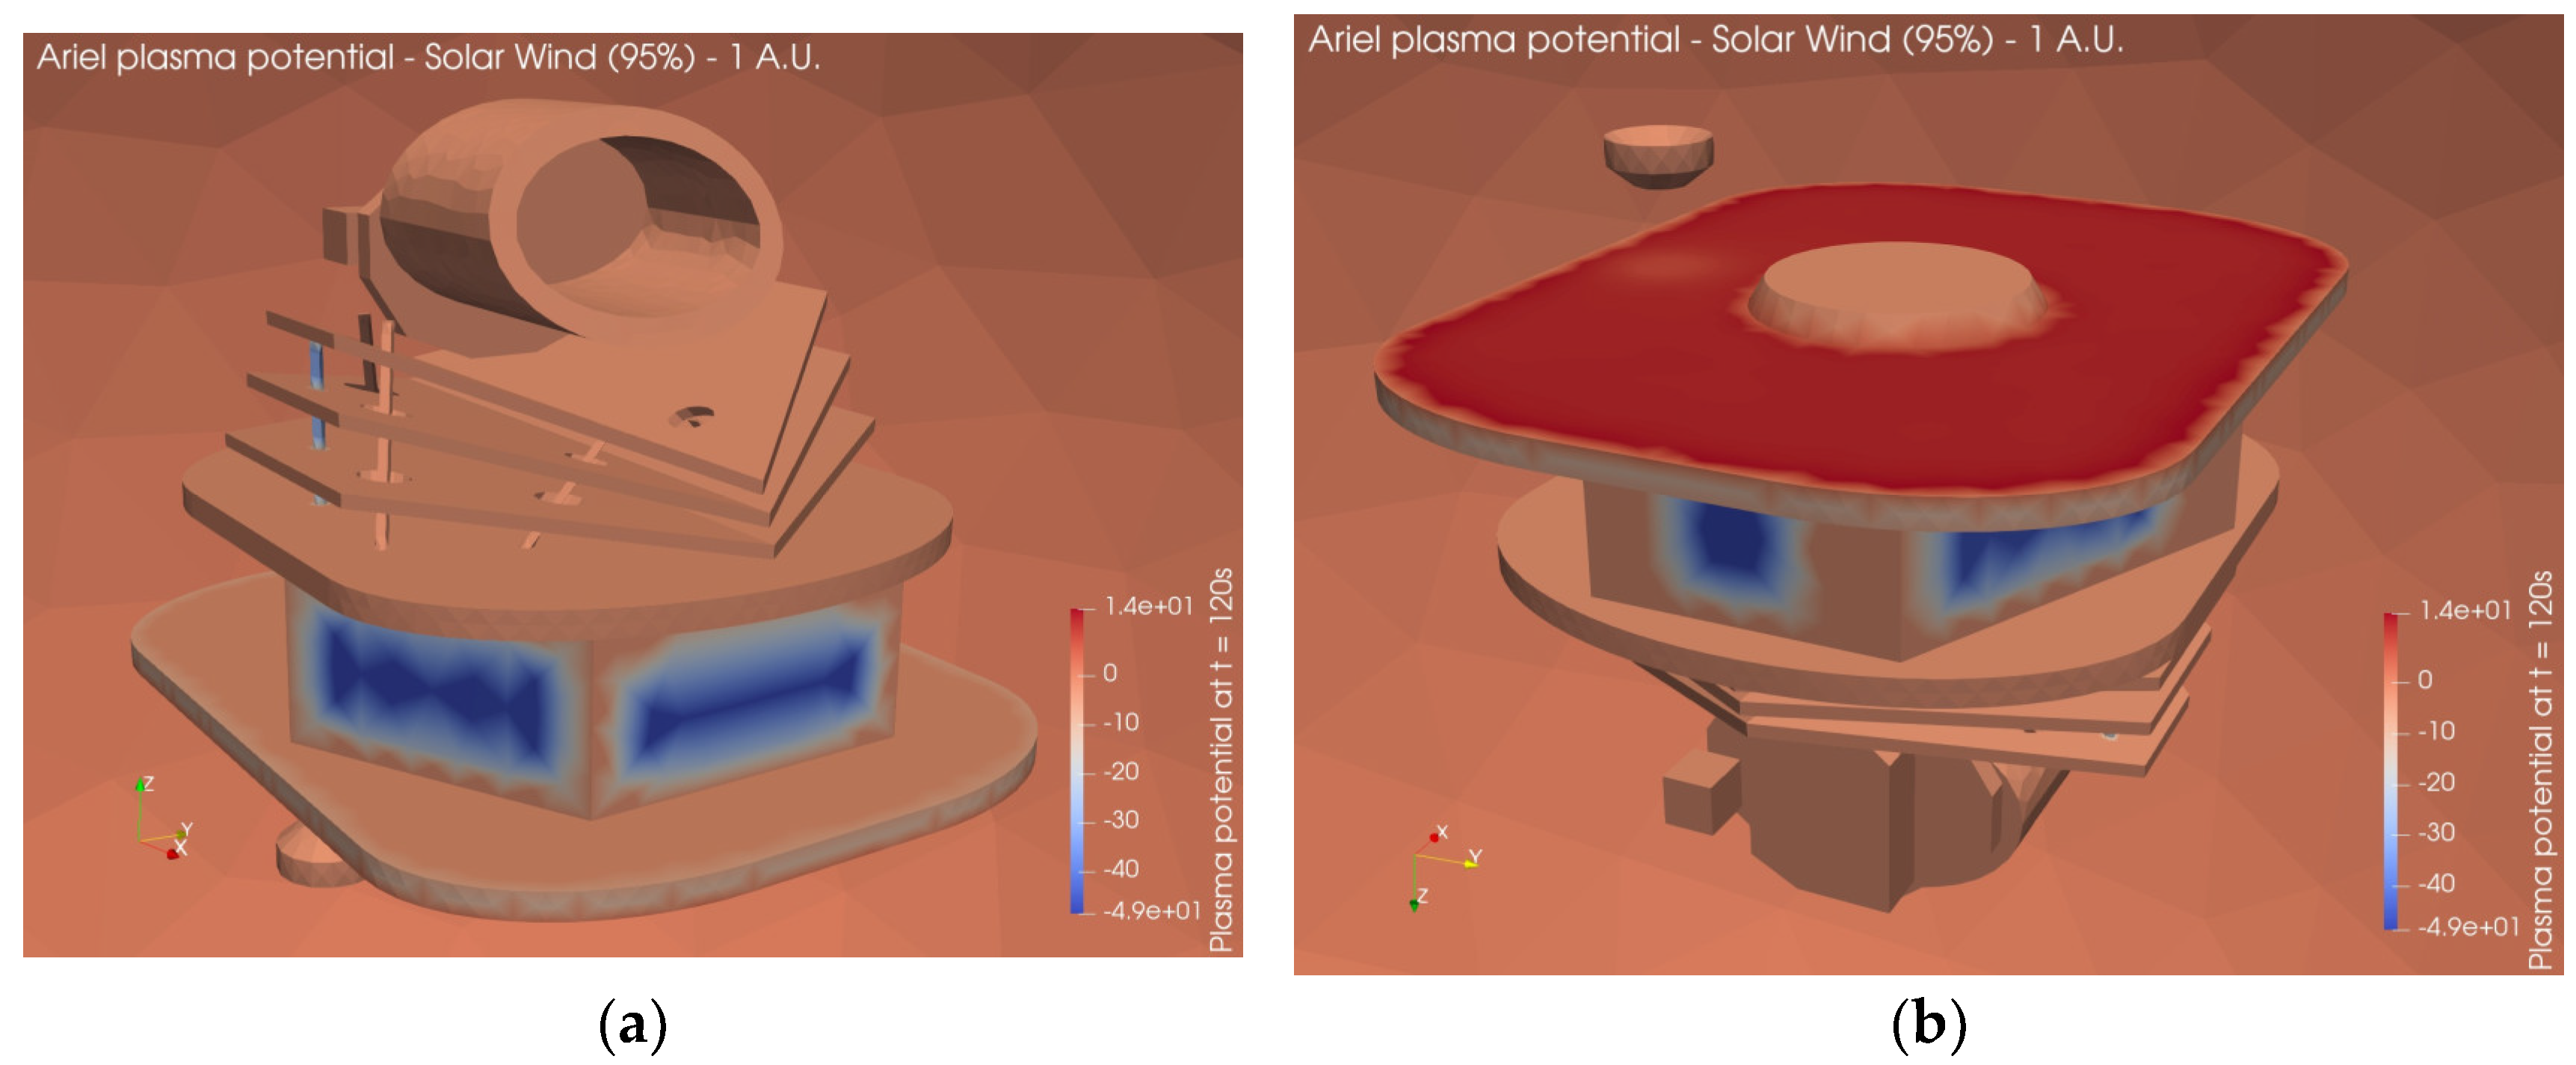
7.2.3. Solar Wind –95% Conditions
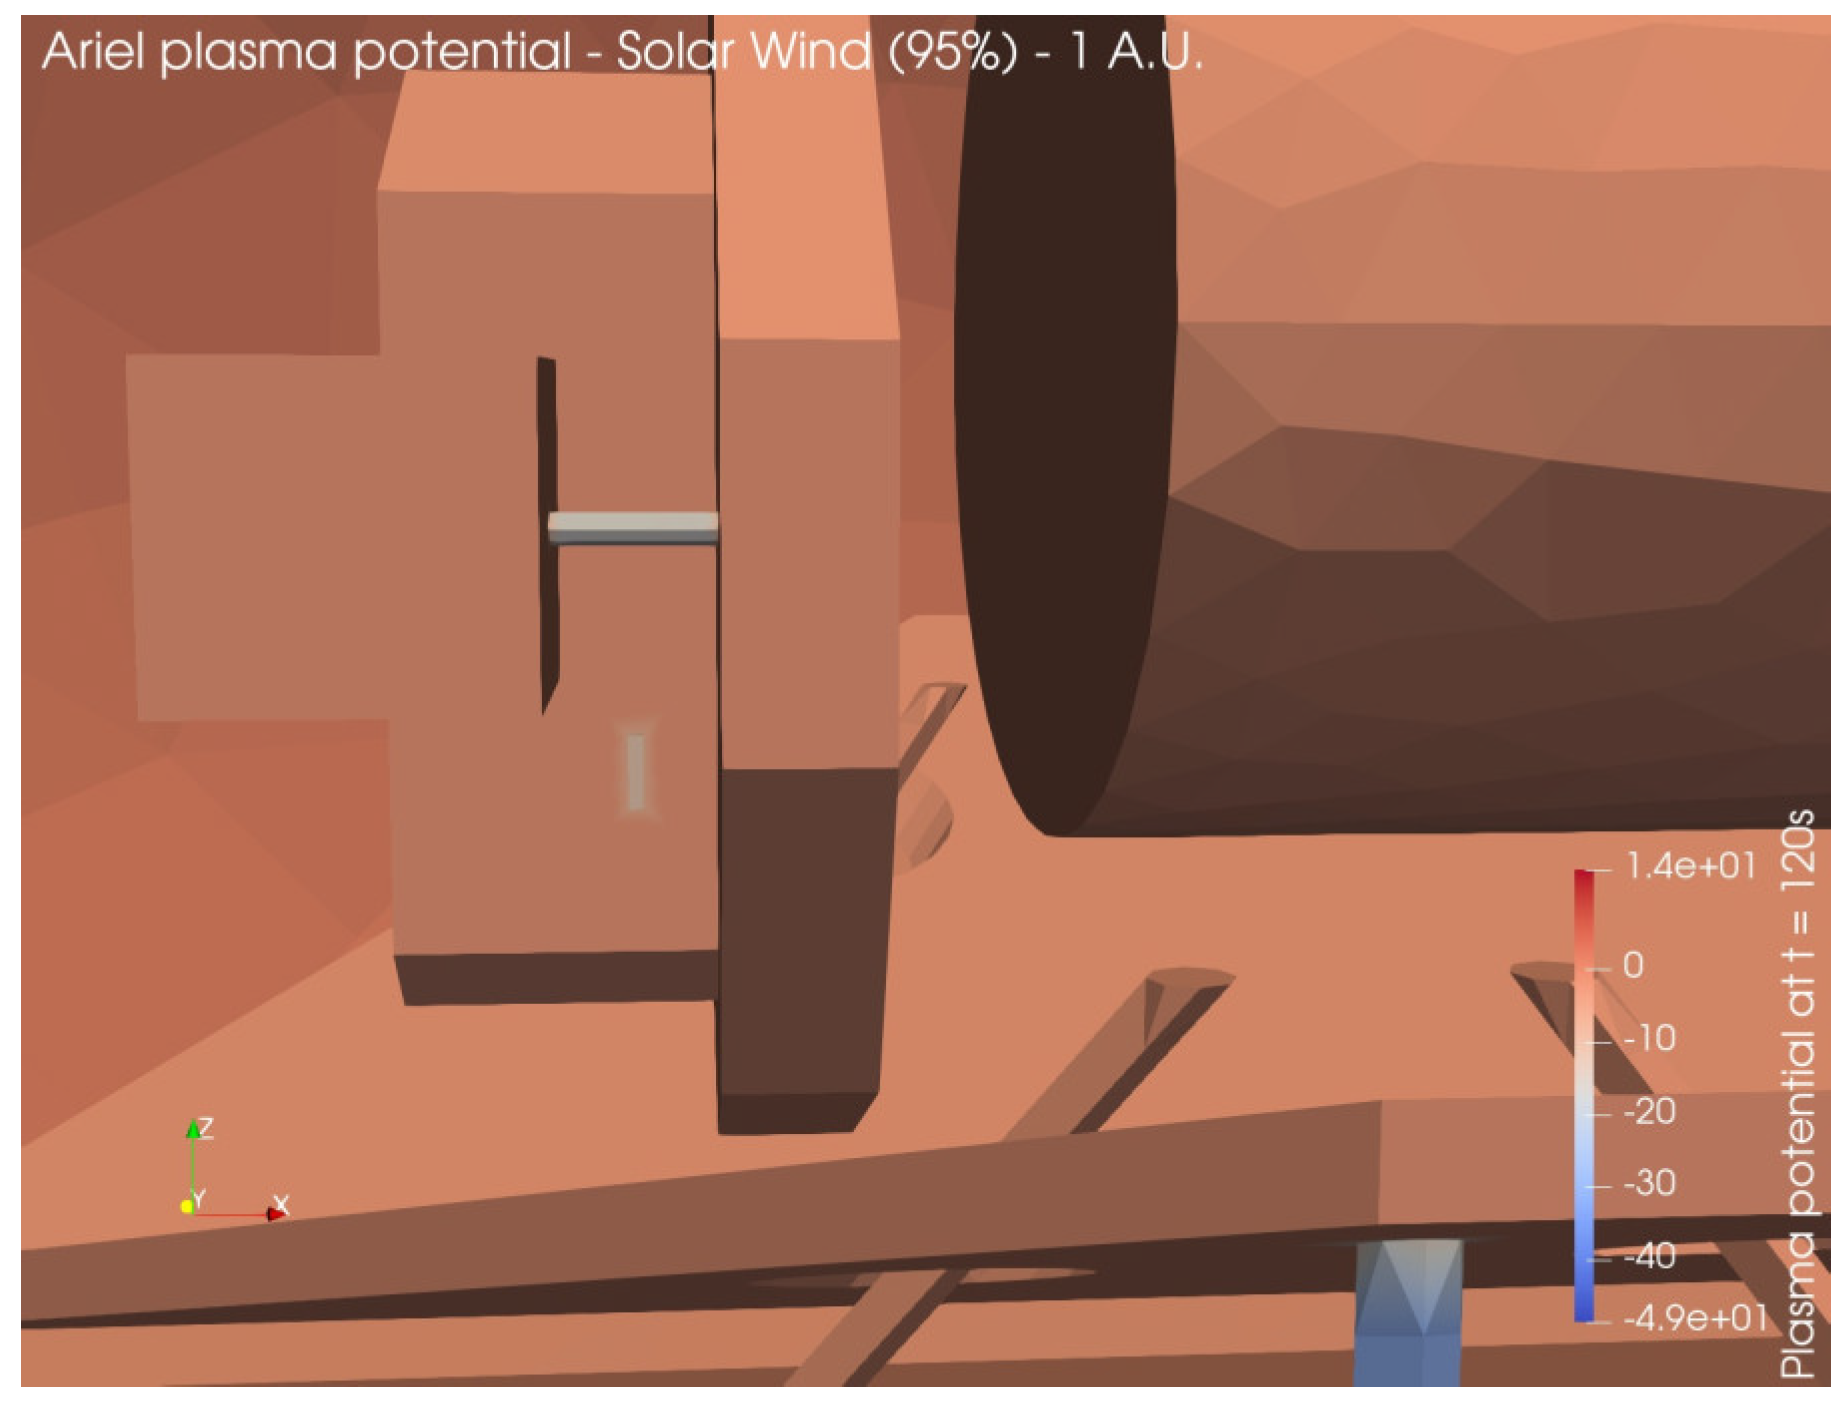
In this environment the most positively charged subsystem, at about 11V, are the solar arrays due to the photoelectric effect while the most negatively charged subsystem, at about -49V, are the SVM radiators. The resulting potential differences do not pose a significant risk of ESDs according to the ECSS standard [
13], either between different surfaces of the S/C or from the S/C surfaces to the surrounding plasma. As for the average conditions simulation, longer times would be needed for an asymptotic behavior confirmation.
Figure 18.
Surface potential evolution – Solar Wind (1 A.U.) – 95% conditions.
Figure 18.
Surface potential evolution – Solar Wind (1 A.U.) – 95% conditions.
Figure 19.
3D map of plasma potential – Solar Wind (1 A.U.) – 95% conditions (a) Ariel front; (b) Ariel bottom.
Figure 19.
3D map of plasma potential – Solar Wind (1 A.U.) – 95% conditions (a) Ariel front; (b) Ariel bottom.
Figure 20.
3D map of plasma potential – Solar Wind (1 A.U.) – 95% conditions: closeup on FPE-IC connector and FPE strut.
Figure 20.
3D map of plasma potential – Solar Wind (1 A.U.) – 95% conditions: closeup on FPE-IC connector and FPE strut.
7.3. Earth’s Magnetosheath
7.3.1. Magnetosheath – Average Conditions
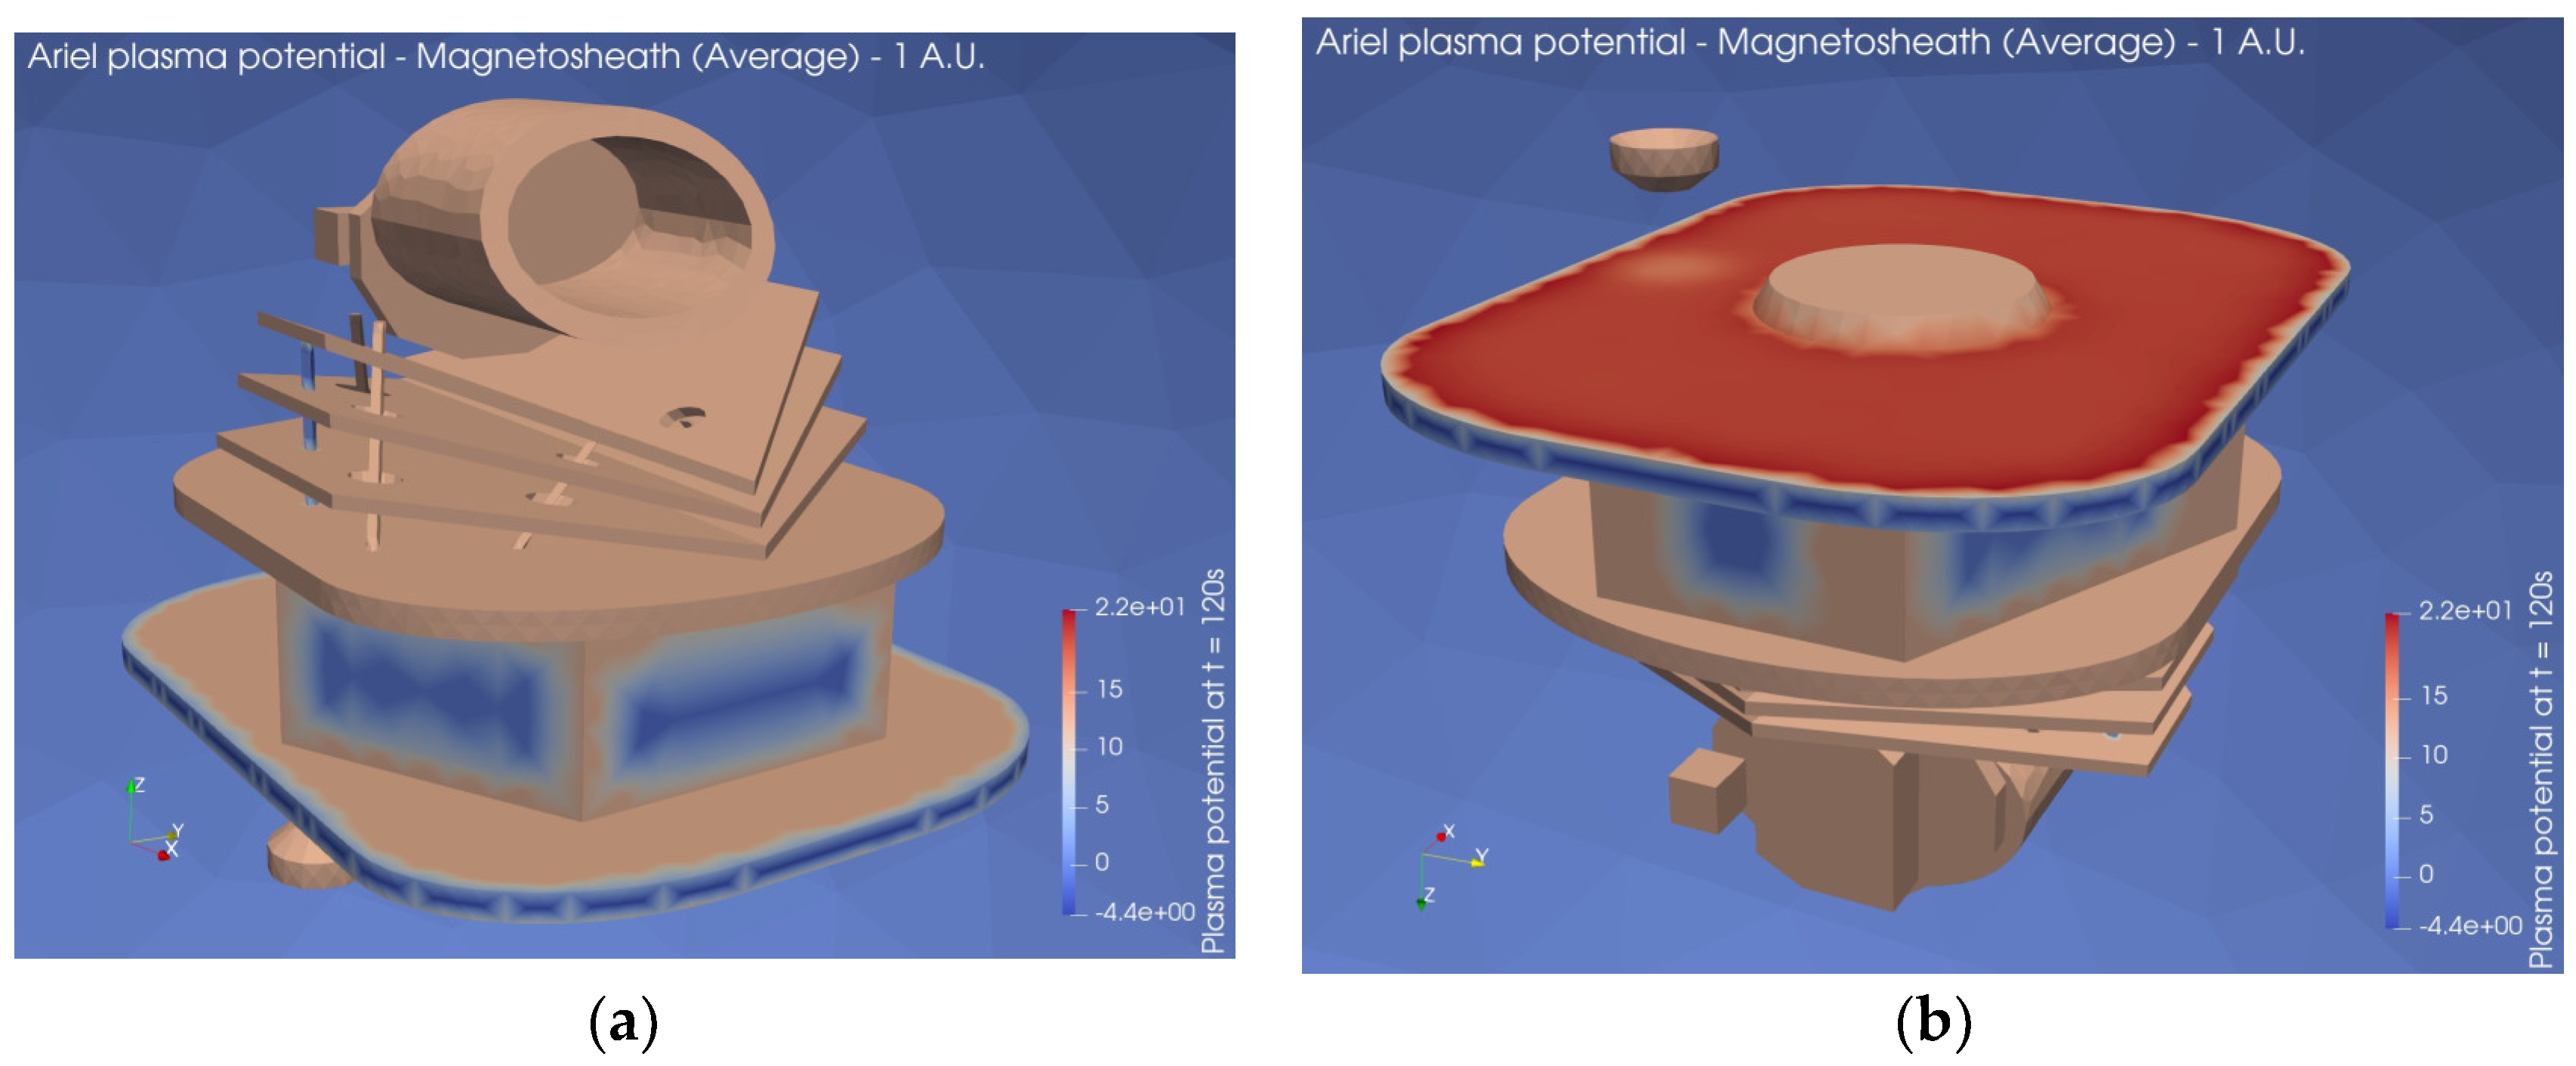
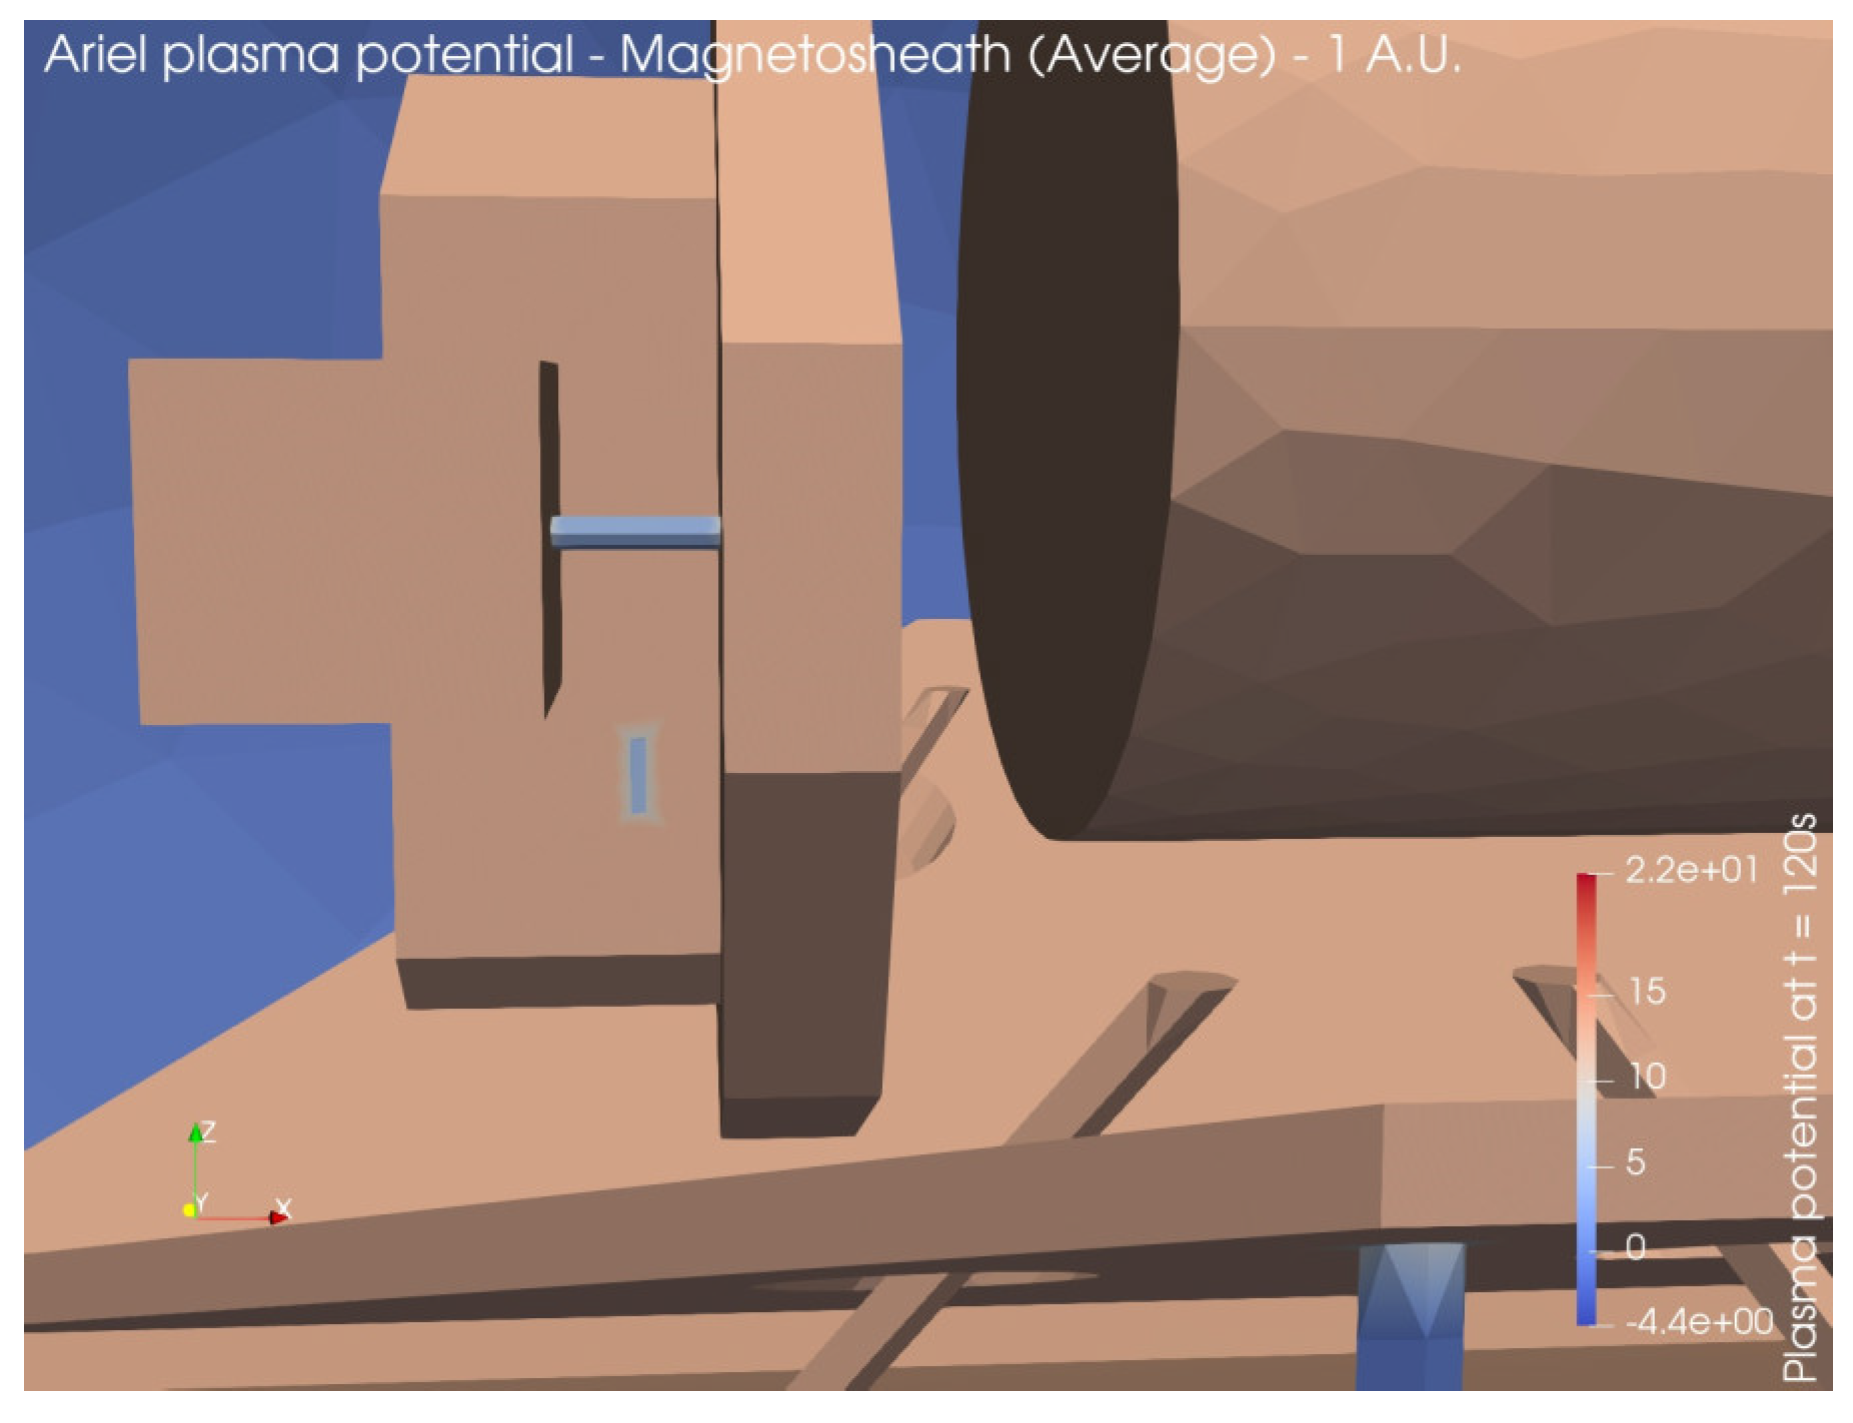
In this environment, the Ariel solar panels charge positively up to about 20 V while the solar array edges are charged to a potential of about -4V with a clear asymptotic behavior. The resulting potential differences do not pose a significant risk for ESDs, either between different surfaces of the S/C or from the S/C surfaces to the surrounding plasma.
Figure 21.
Surface potential evolution – Magnetosheath (1 A.U.) – Average conditions.
Figure 21.
Surface potential evolution – Magnetosheath (1 A.U.) – Average conditions.
Figure 22.
3D map of plasma potential – Magnetosheath (1 A.U.) – Average conditions (a) Ariel front; (b) Ariel bottom.
Figure 22.
3D map of plasma potential – Magnetosheath (1 A.U.) – Average conditions (a) Ariel front; (b) Ariel bottom.
Figure 23.
3D map of plasma potential – Magnetosheath (1 A.U.) – Average conditions: closeup on FPE-IC connector and FPE strut.
Figure 23.
3D map of plasma potential – Magnetosheath (1 A.U.) – Average conditions: closeup on FPE-IC connector and FPE strut.
7.3.2. Magnetosheath – 5% Conditions
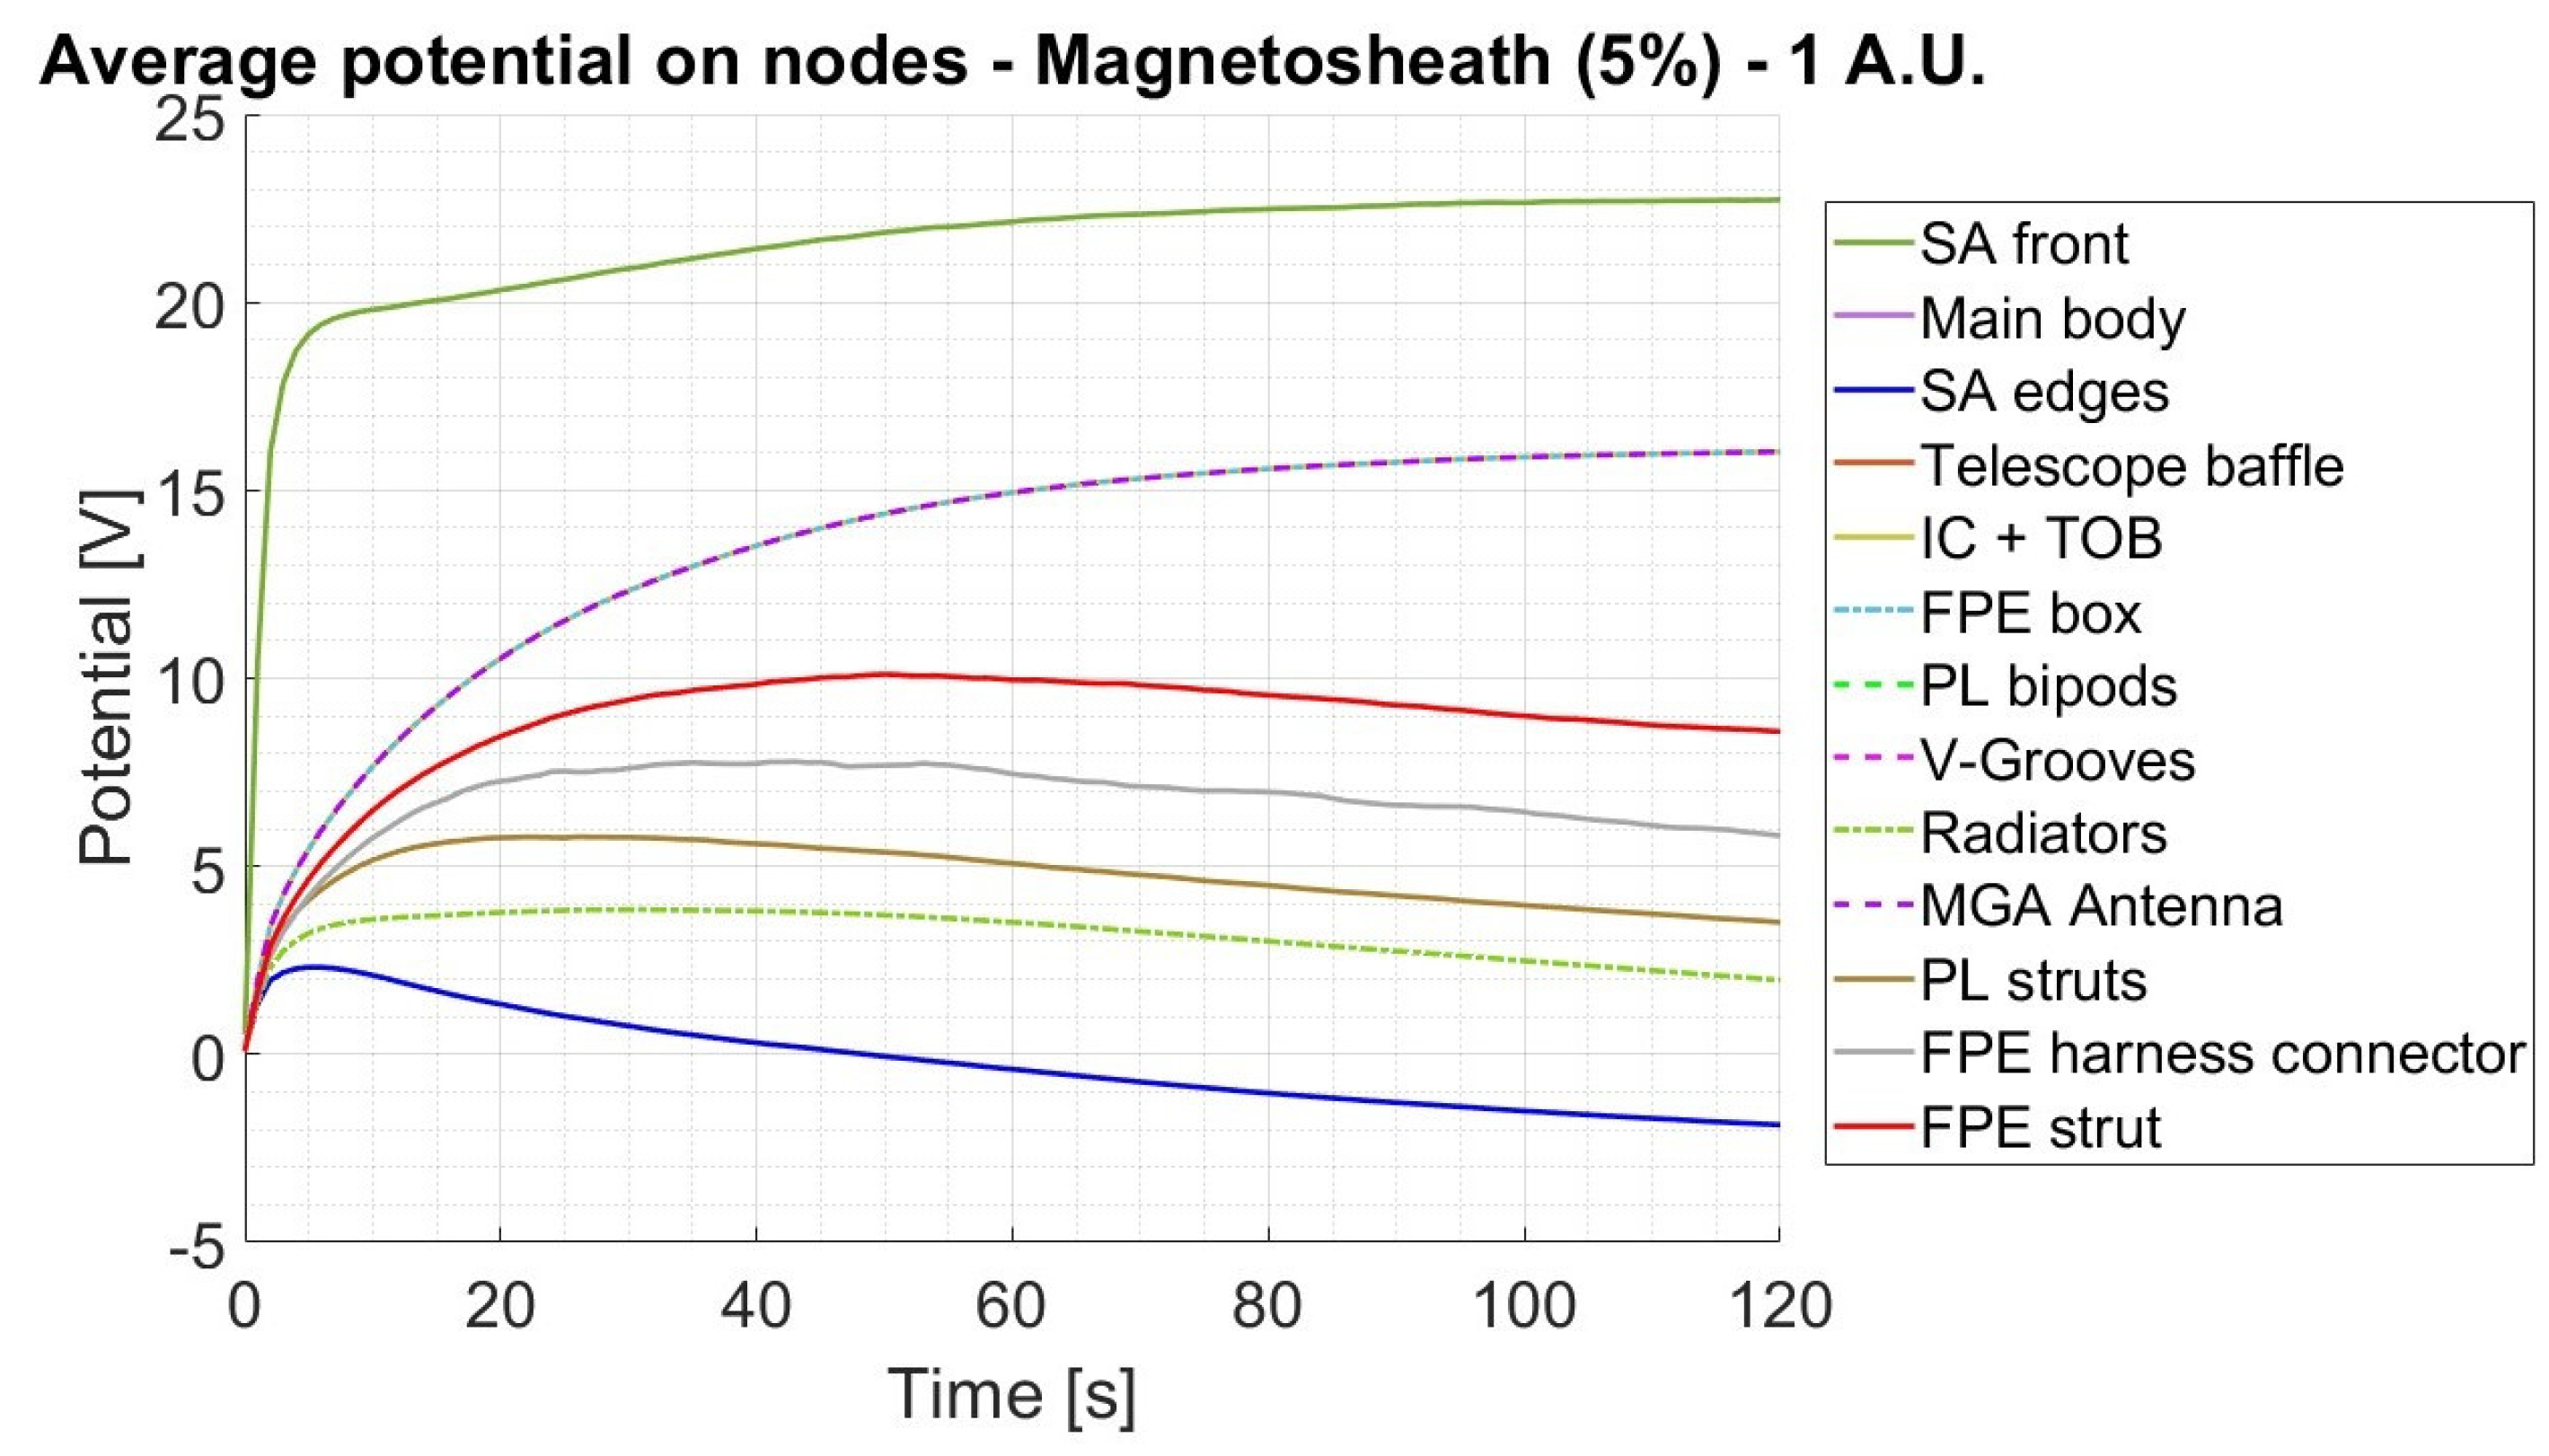
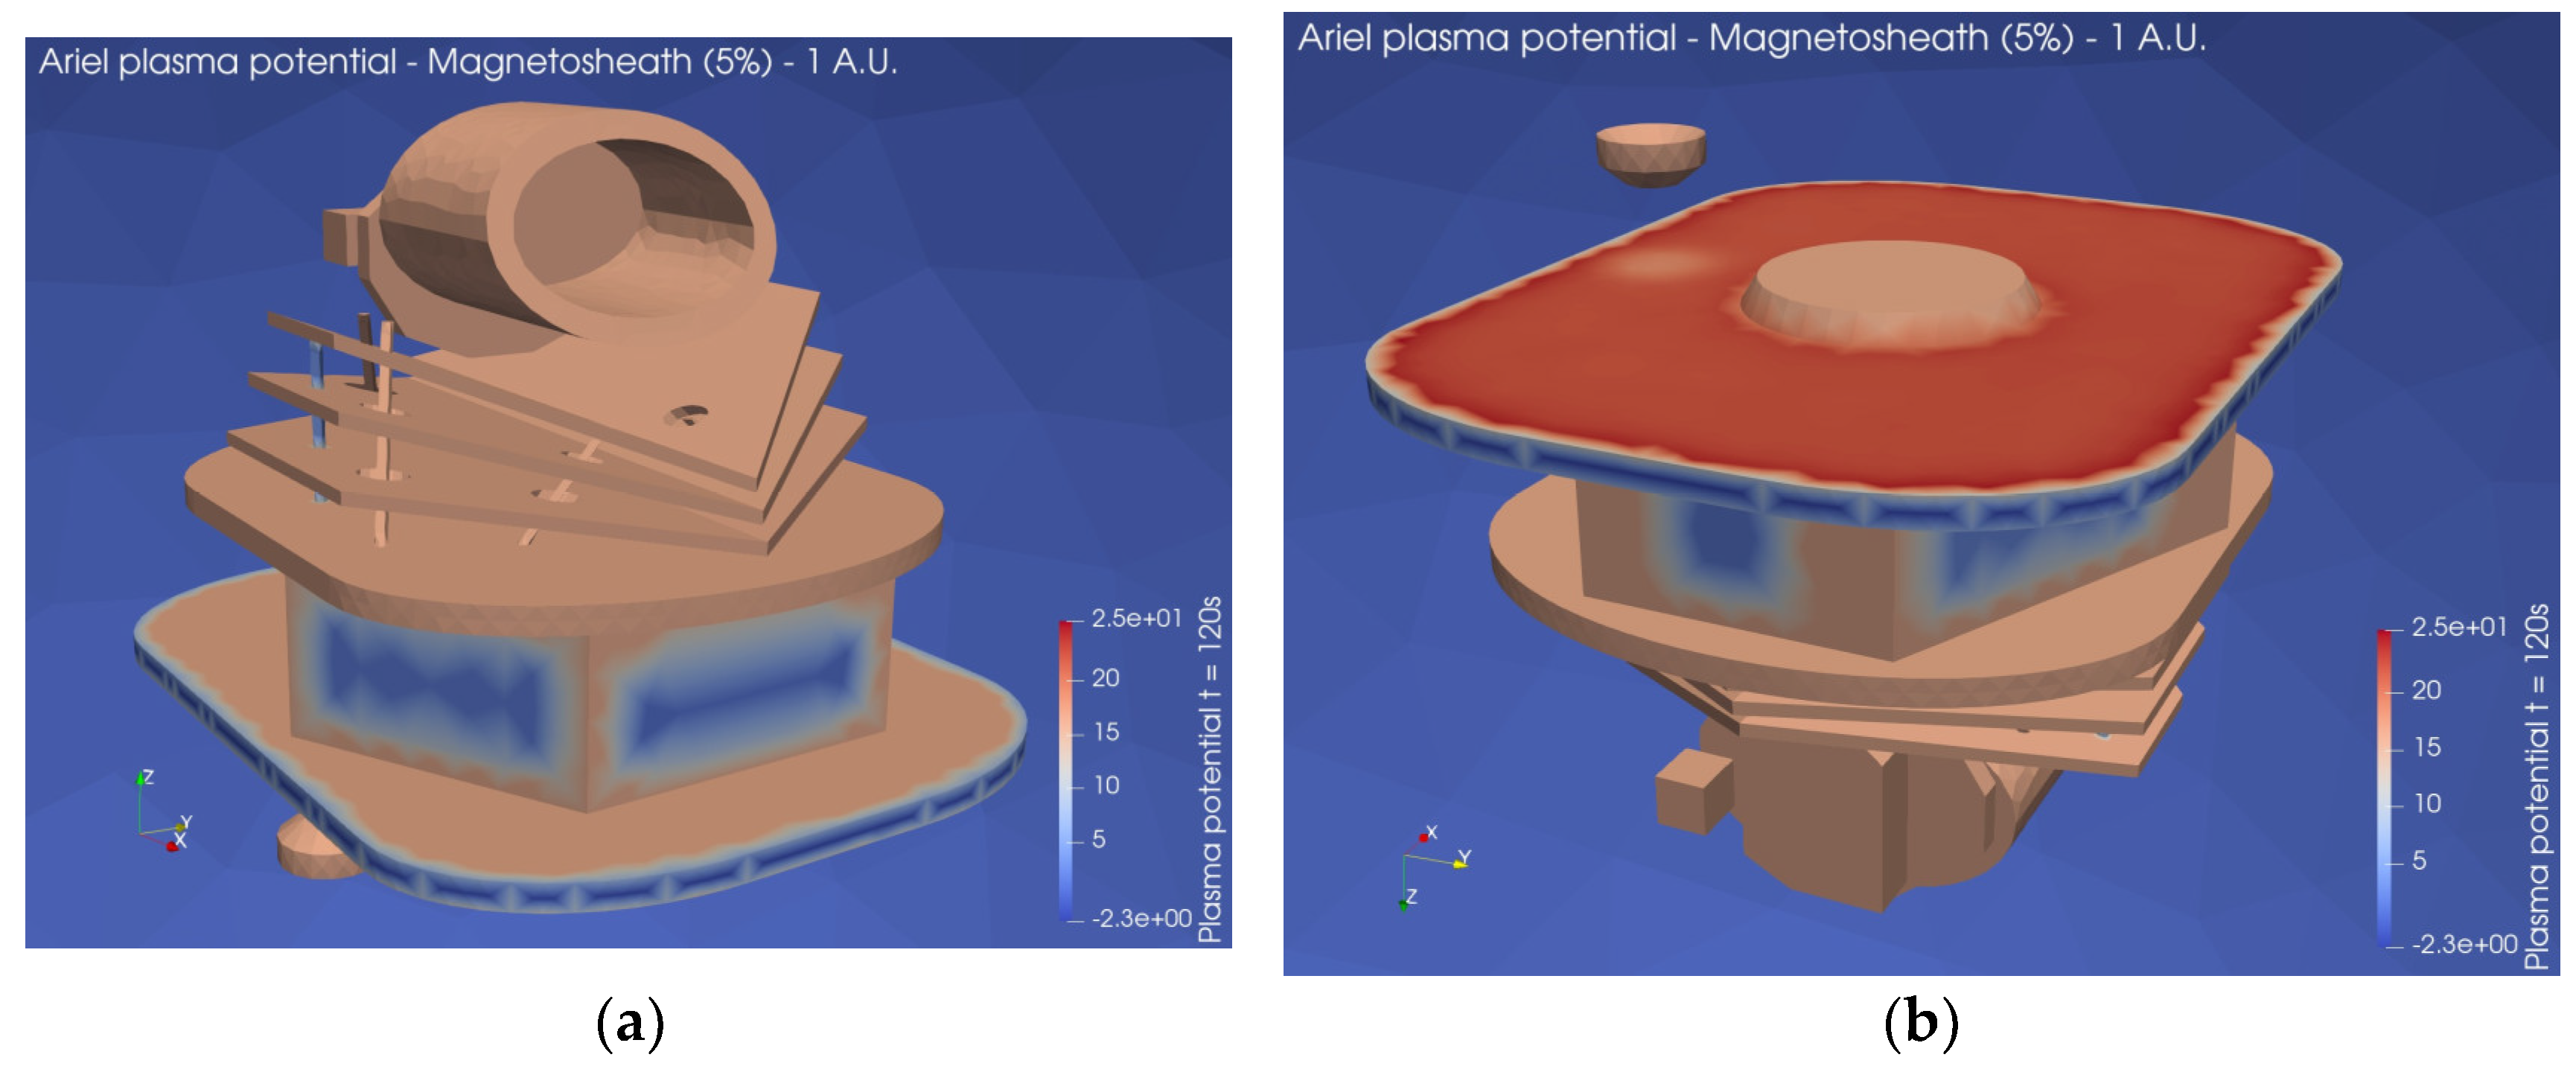
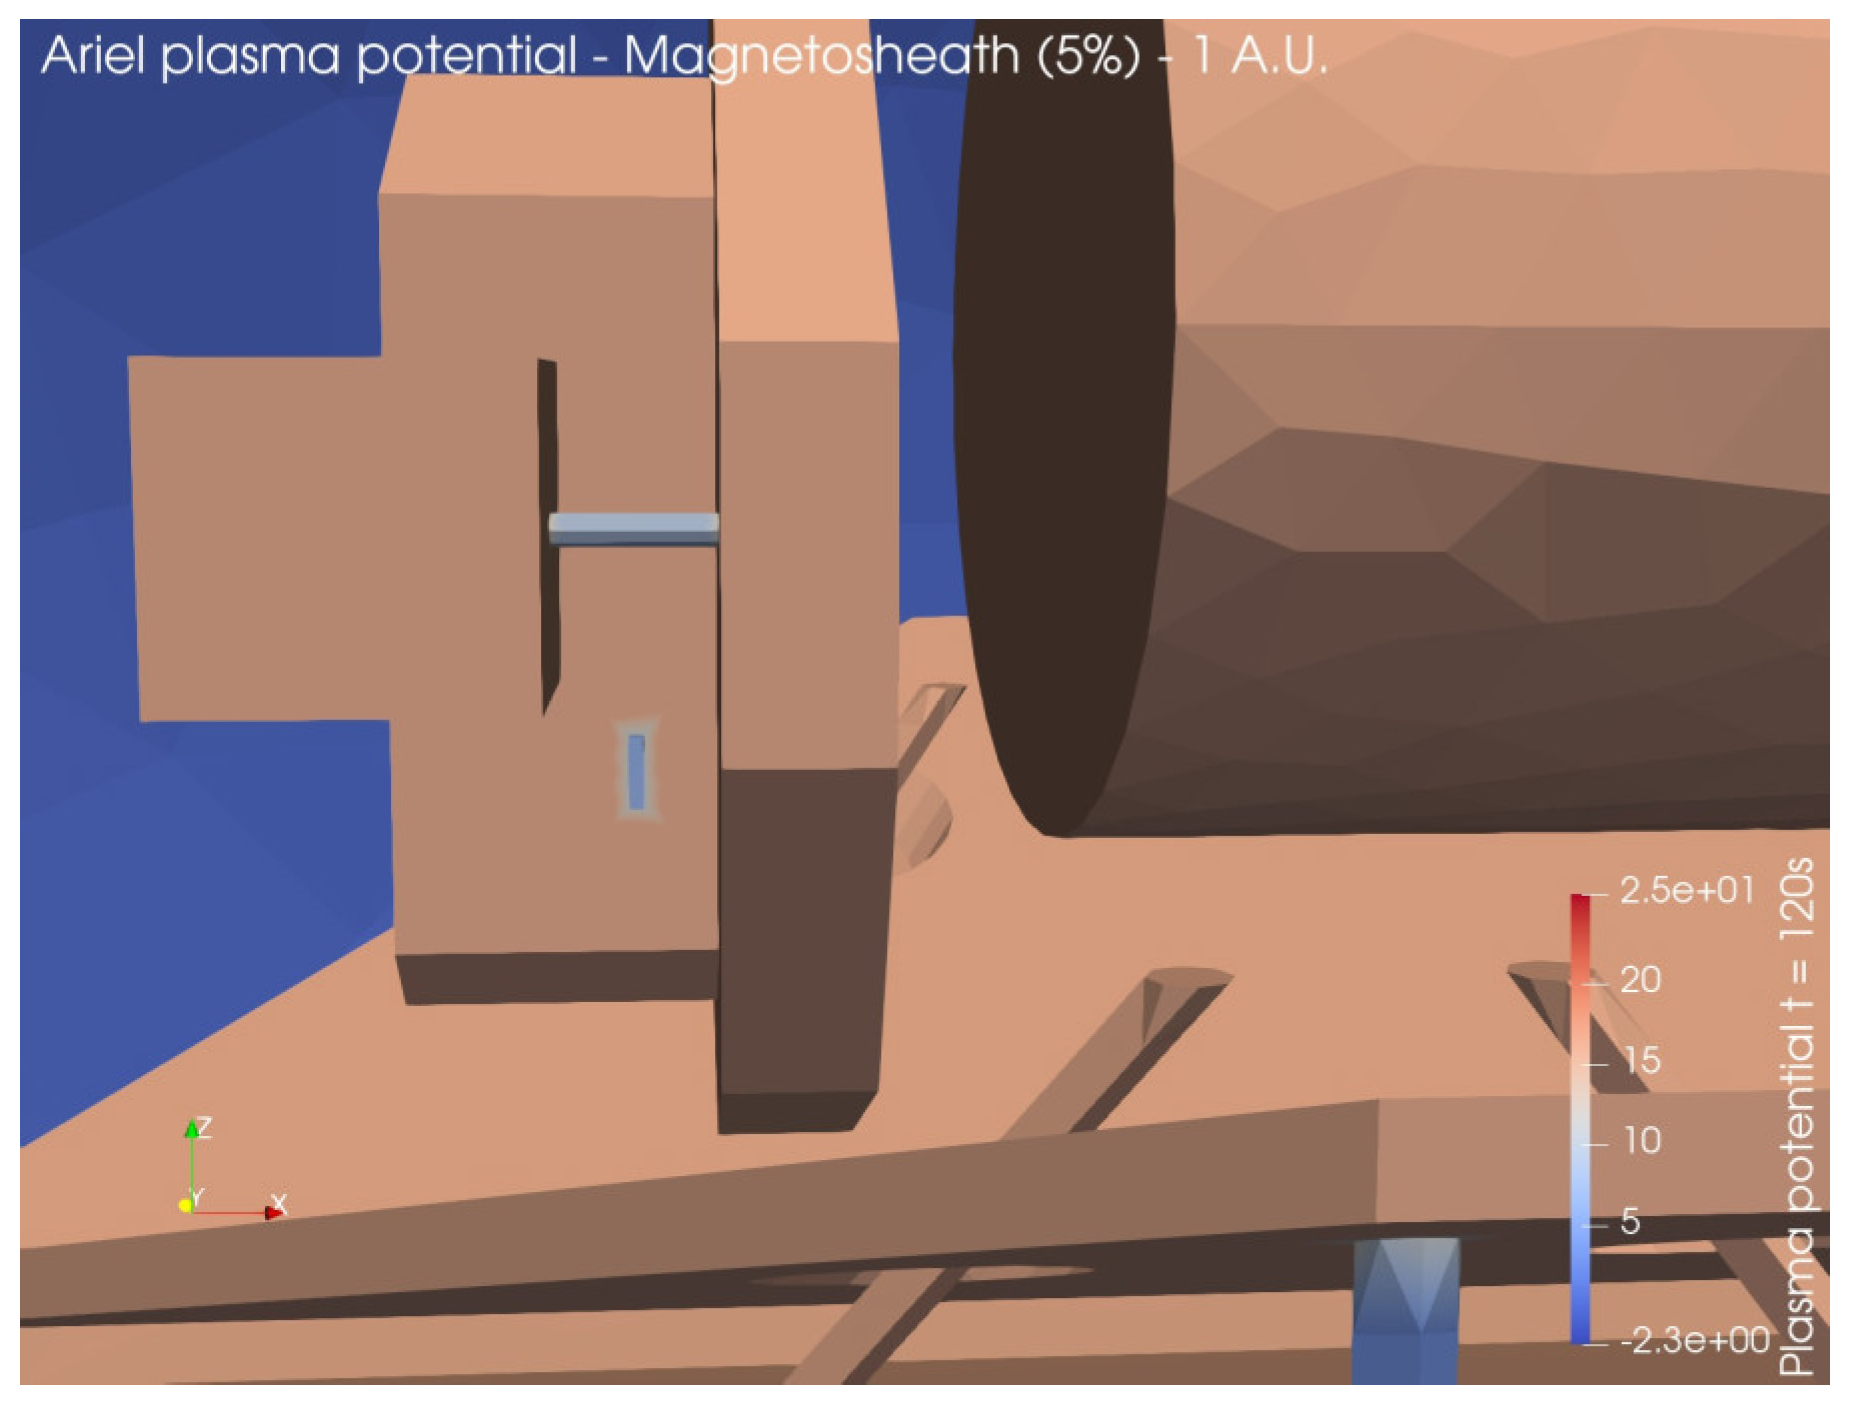
In this environment, the most positively charged subsystem, up to about 23 V, are the solar panels due to the photoelectric effect while the most negatively charged one are the solar array edges, charged to a potential of about -2V. The resulting potential differences do not pose a significant risk of ESDs according to the ECSS standards [
13], either between different surfaces of the S/C or from the S/C surfaces to the surrounding plasma.
Figure 24.
Surface potential evolution – Magnetosheath (1 A.U.) – 5% conditions.
Figure 24.
Surface potential evolution – Magnetosheath (1 A.U.) – 5% conditions.
Figure 25.
3D map of plasma potential – Magnetosheath (1 A.U.) – 5% conditions (a) Ariel front; (b) Ariel bottom.
Figure 25.
3D map of plasma potential – Magnetosheath (1 A.U.) – 5% conditions (a) Ariel front; (b) Ariel bottom.
Figure 26.
3D map of plasma potential – Magnetosheath (1 A.U.) – 5% conditions: closeup on FPE-IC connector and FPE strut.
Figure 26.
3D map of plasma potential – Magnetosheath (1 A.U.) – 5% conditions: closeup on FPE-IC connector and FPE strut.
7.3.3. Magnetosheath – 90% Conditions
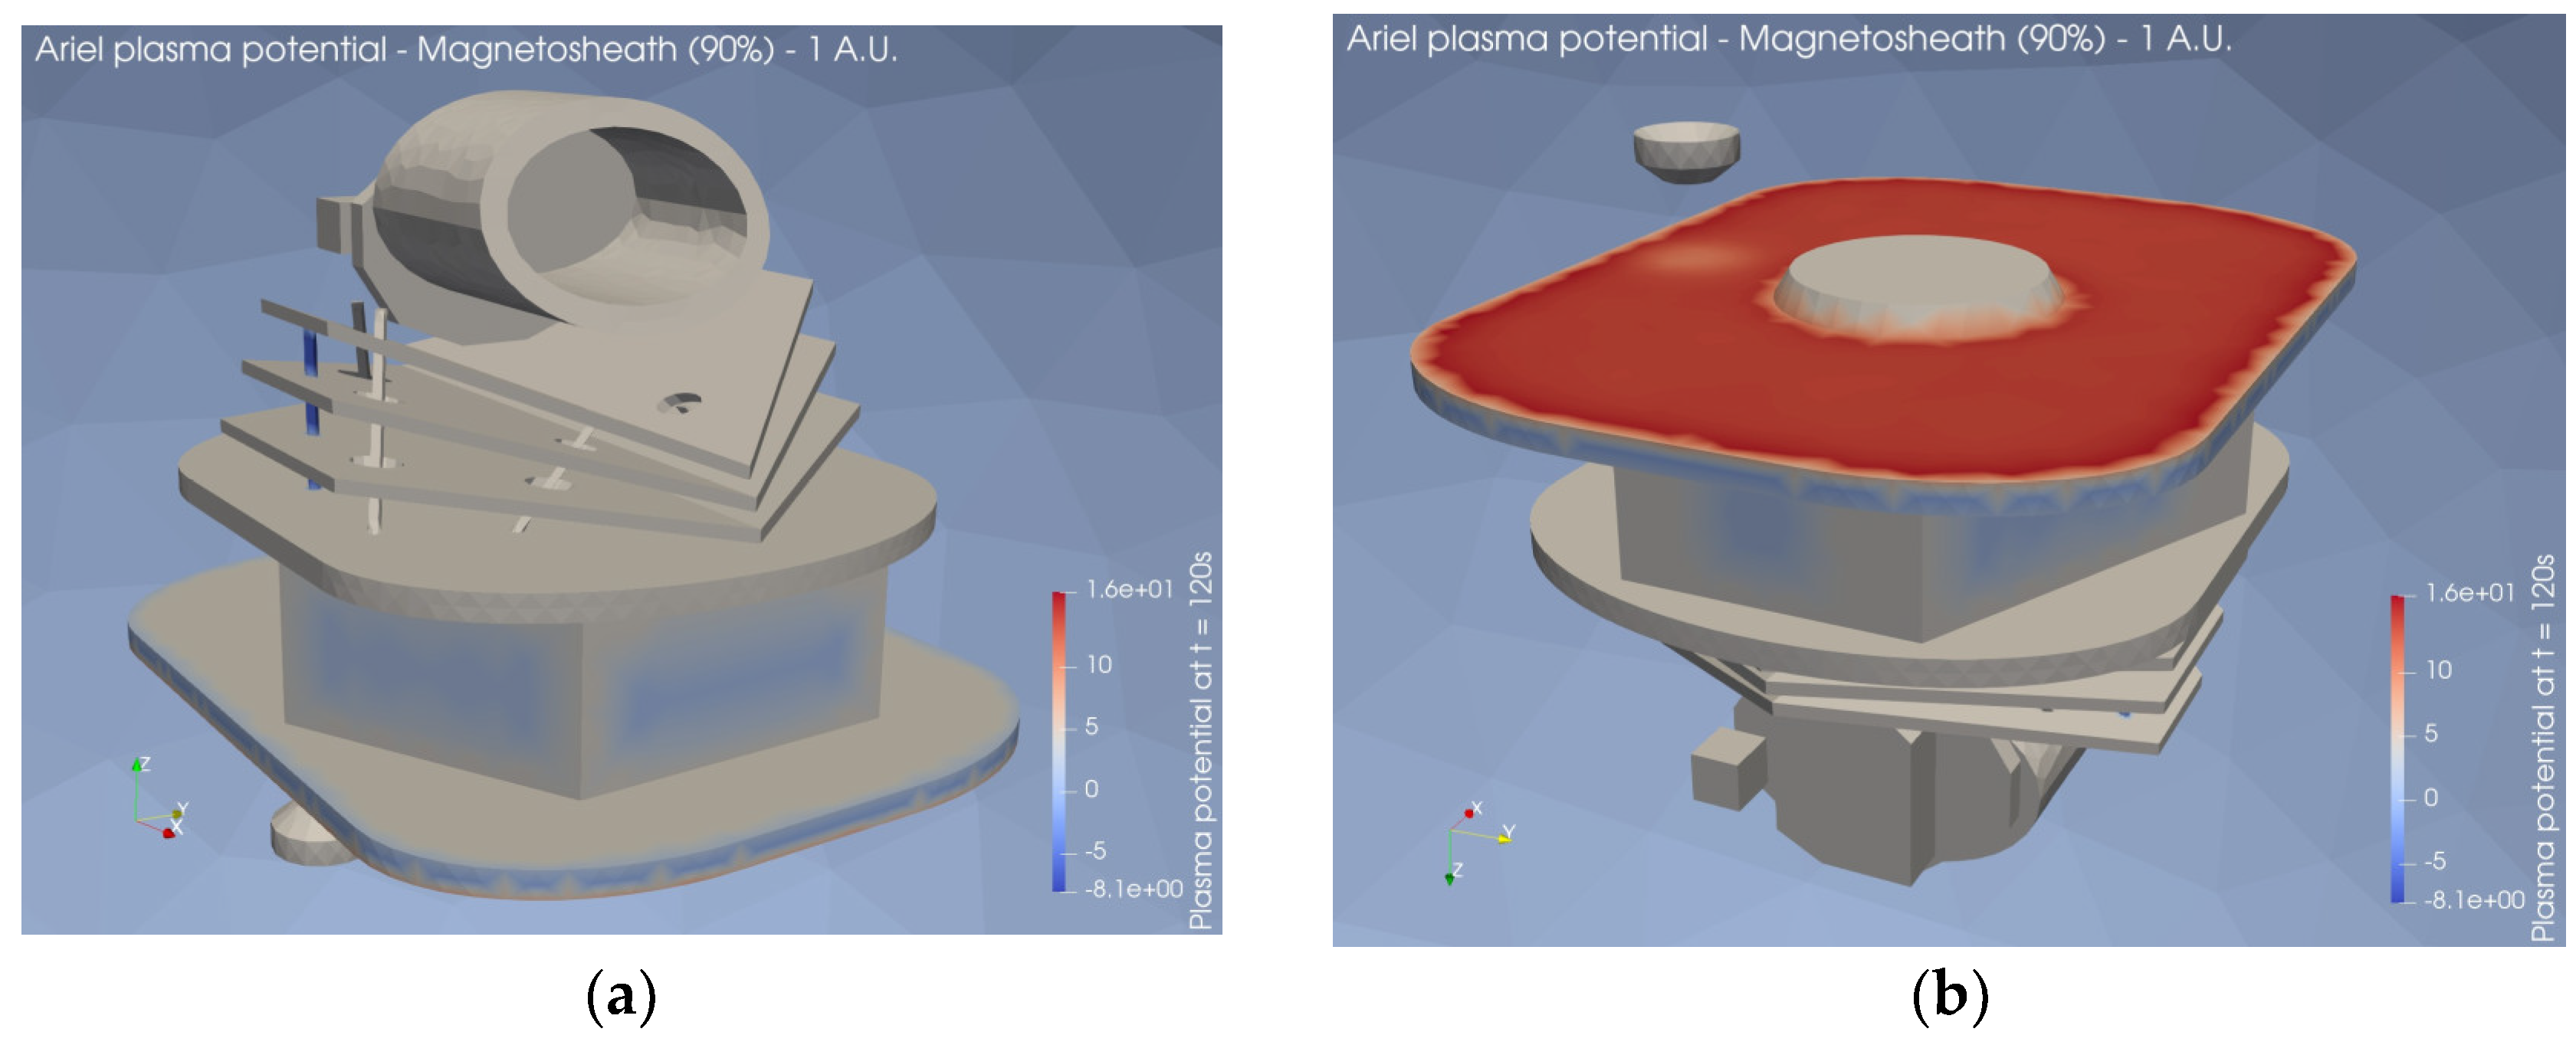
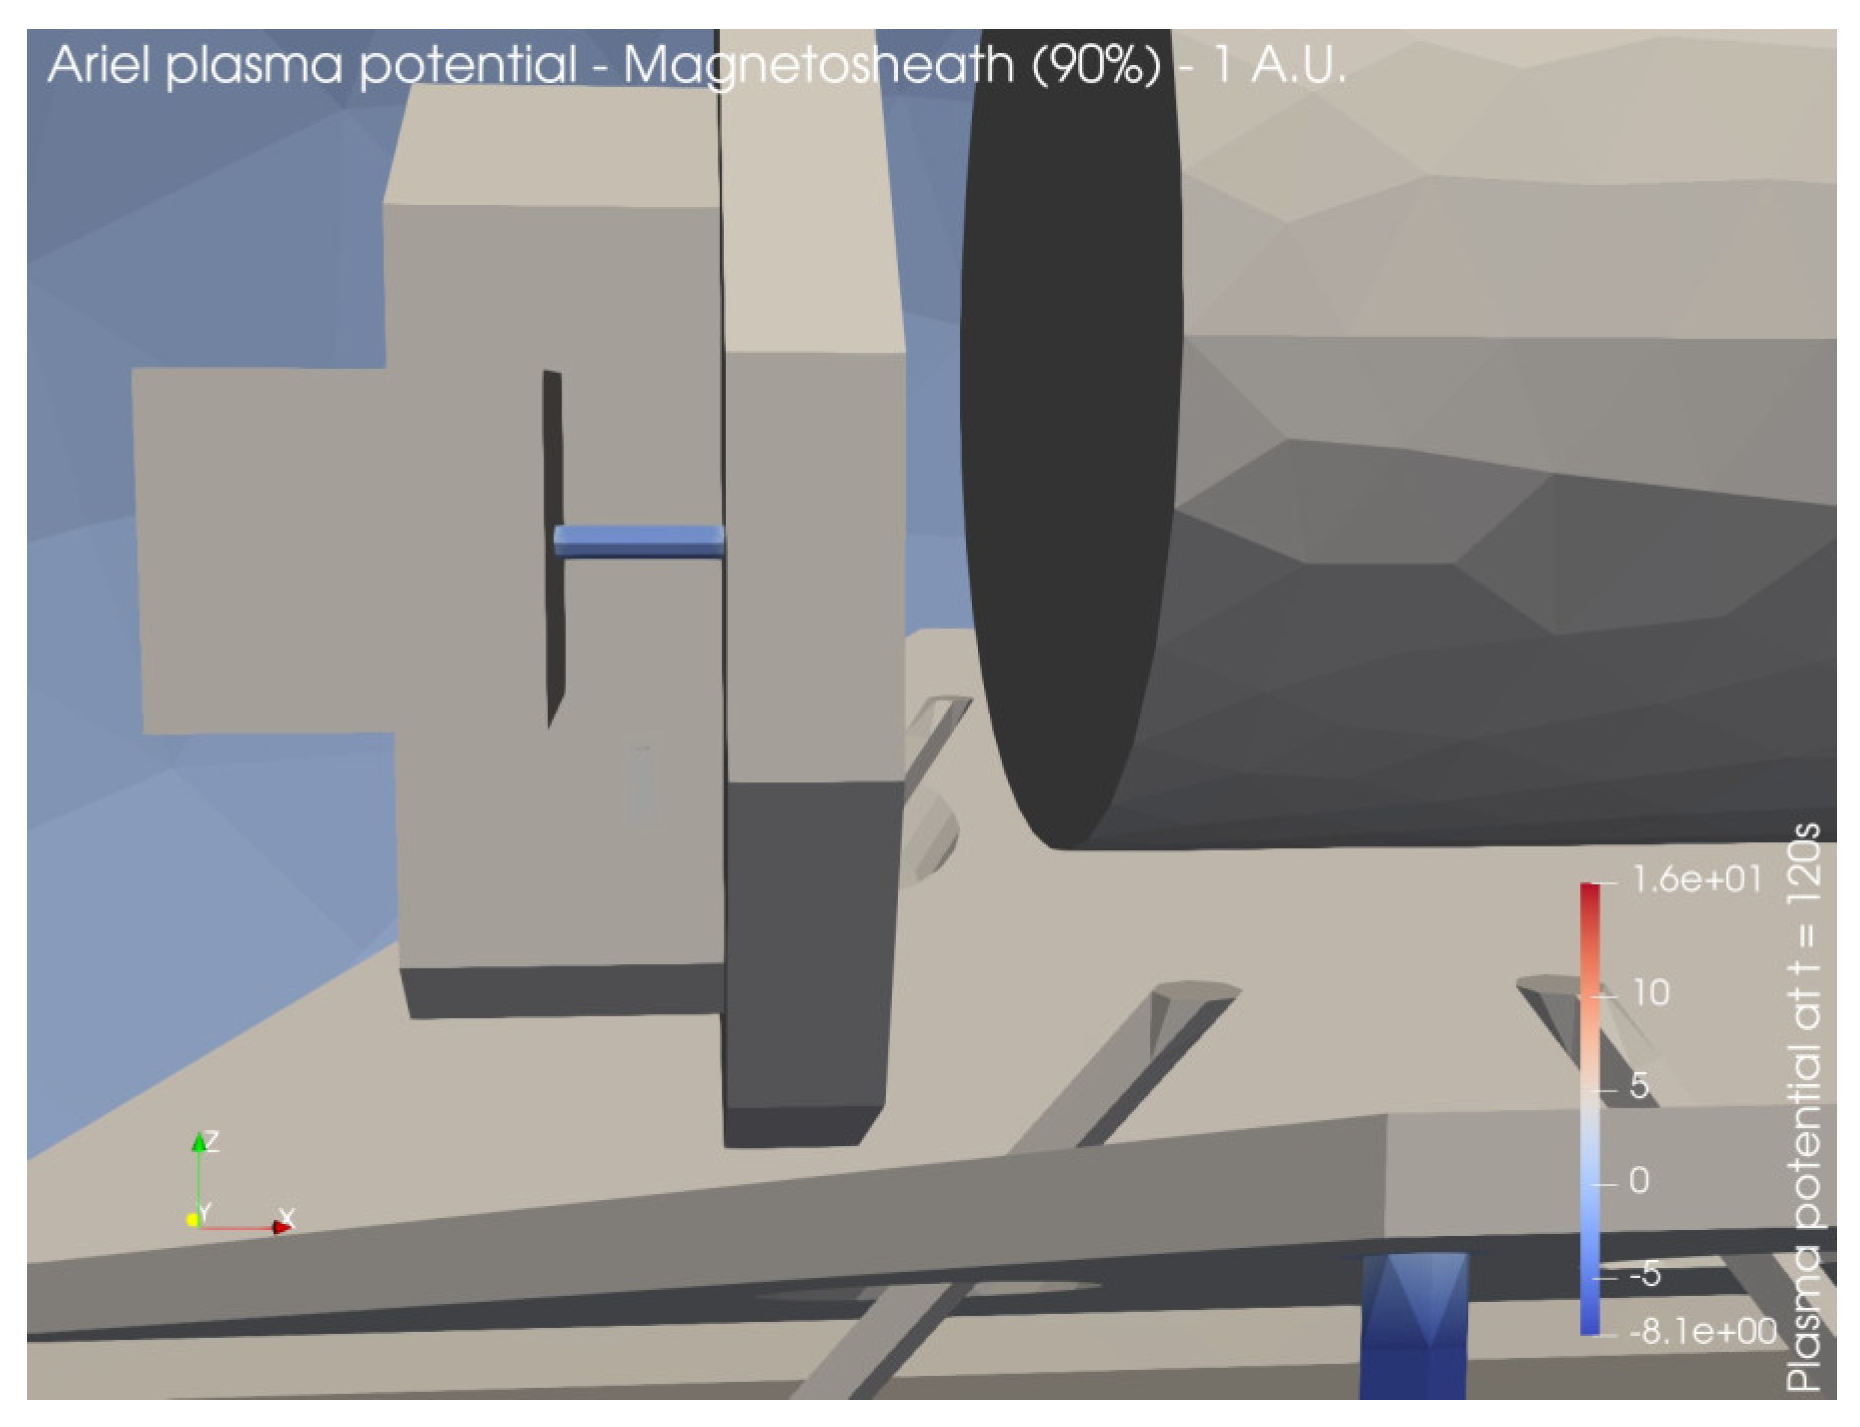
In this environment, the Ariel solar panels charge positively up to about 14 V while the PL struts are charged to a potential of about -7V at the end of the simulation time (120s), without showing an asymptotic behavior and for which longer simulations times would be needed. The resulting potential differences do not pose a significant risk of ESDs according to the ECSS standards [
13], either between different surfaces of the S/C or from the S/C surfaces to the surrounding plasma.
Figure 27.
Surface potential evolution – Magnetosheath (1 A.U.) – 90% conditions.
Figure 27.
Surface potential evolution – Magnetosheath (1 A.U.) – 90% conditions.
Figure 28.
3D map of plasma potential – Magnetosheath (1 A.U.) – 90% conditions (a) Ariel front; (b) Ariel bottom.
Figure 28.
3D map of plasma potential – Magnetosheath (1 A.U.) – 90% conditions (a) Ariel front; (b) Ariel bottom.
Figure 29.
3D map of plasma potential – Magnetosheath (1 A.U.) – 90% conditions: closeup on FPE-IC connector and FPE strut.
Figure 29.
3D map of plasma potential – Magnetosheath (1 A.U.) – 90% conditions: closeup on FPE-IC connector and FPE strut.
7.4. Earth’s Magnetotail
7.4.1. Magnetotail – Average Conditions
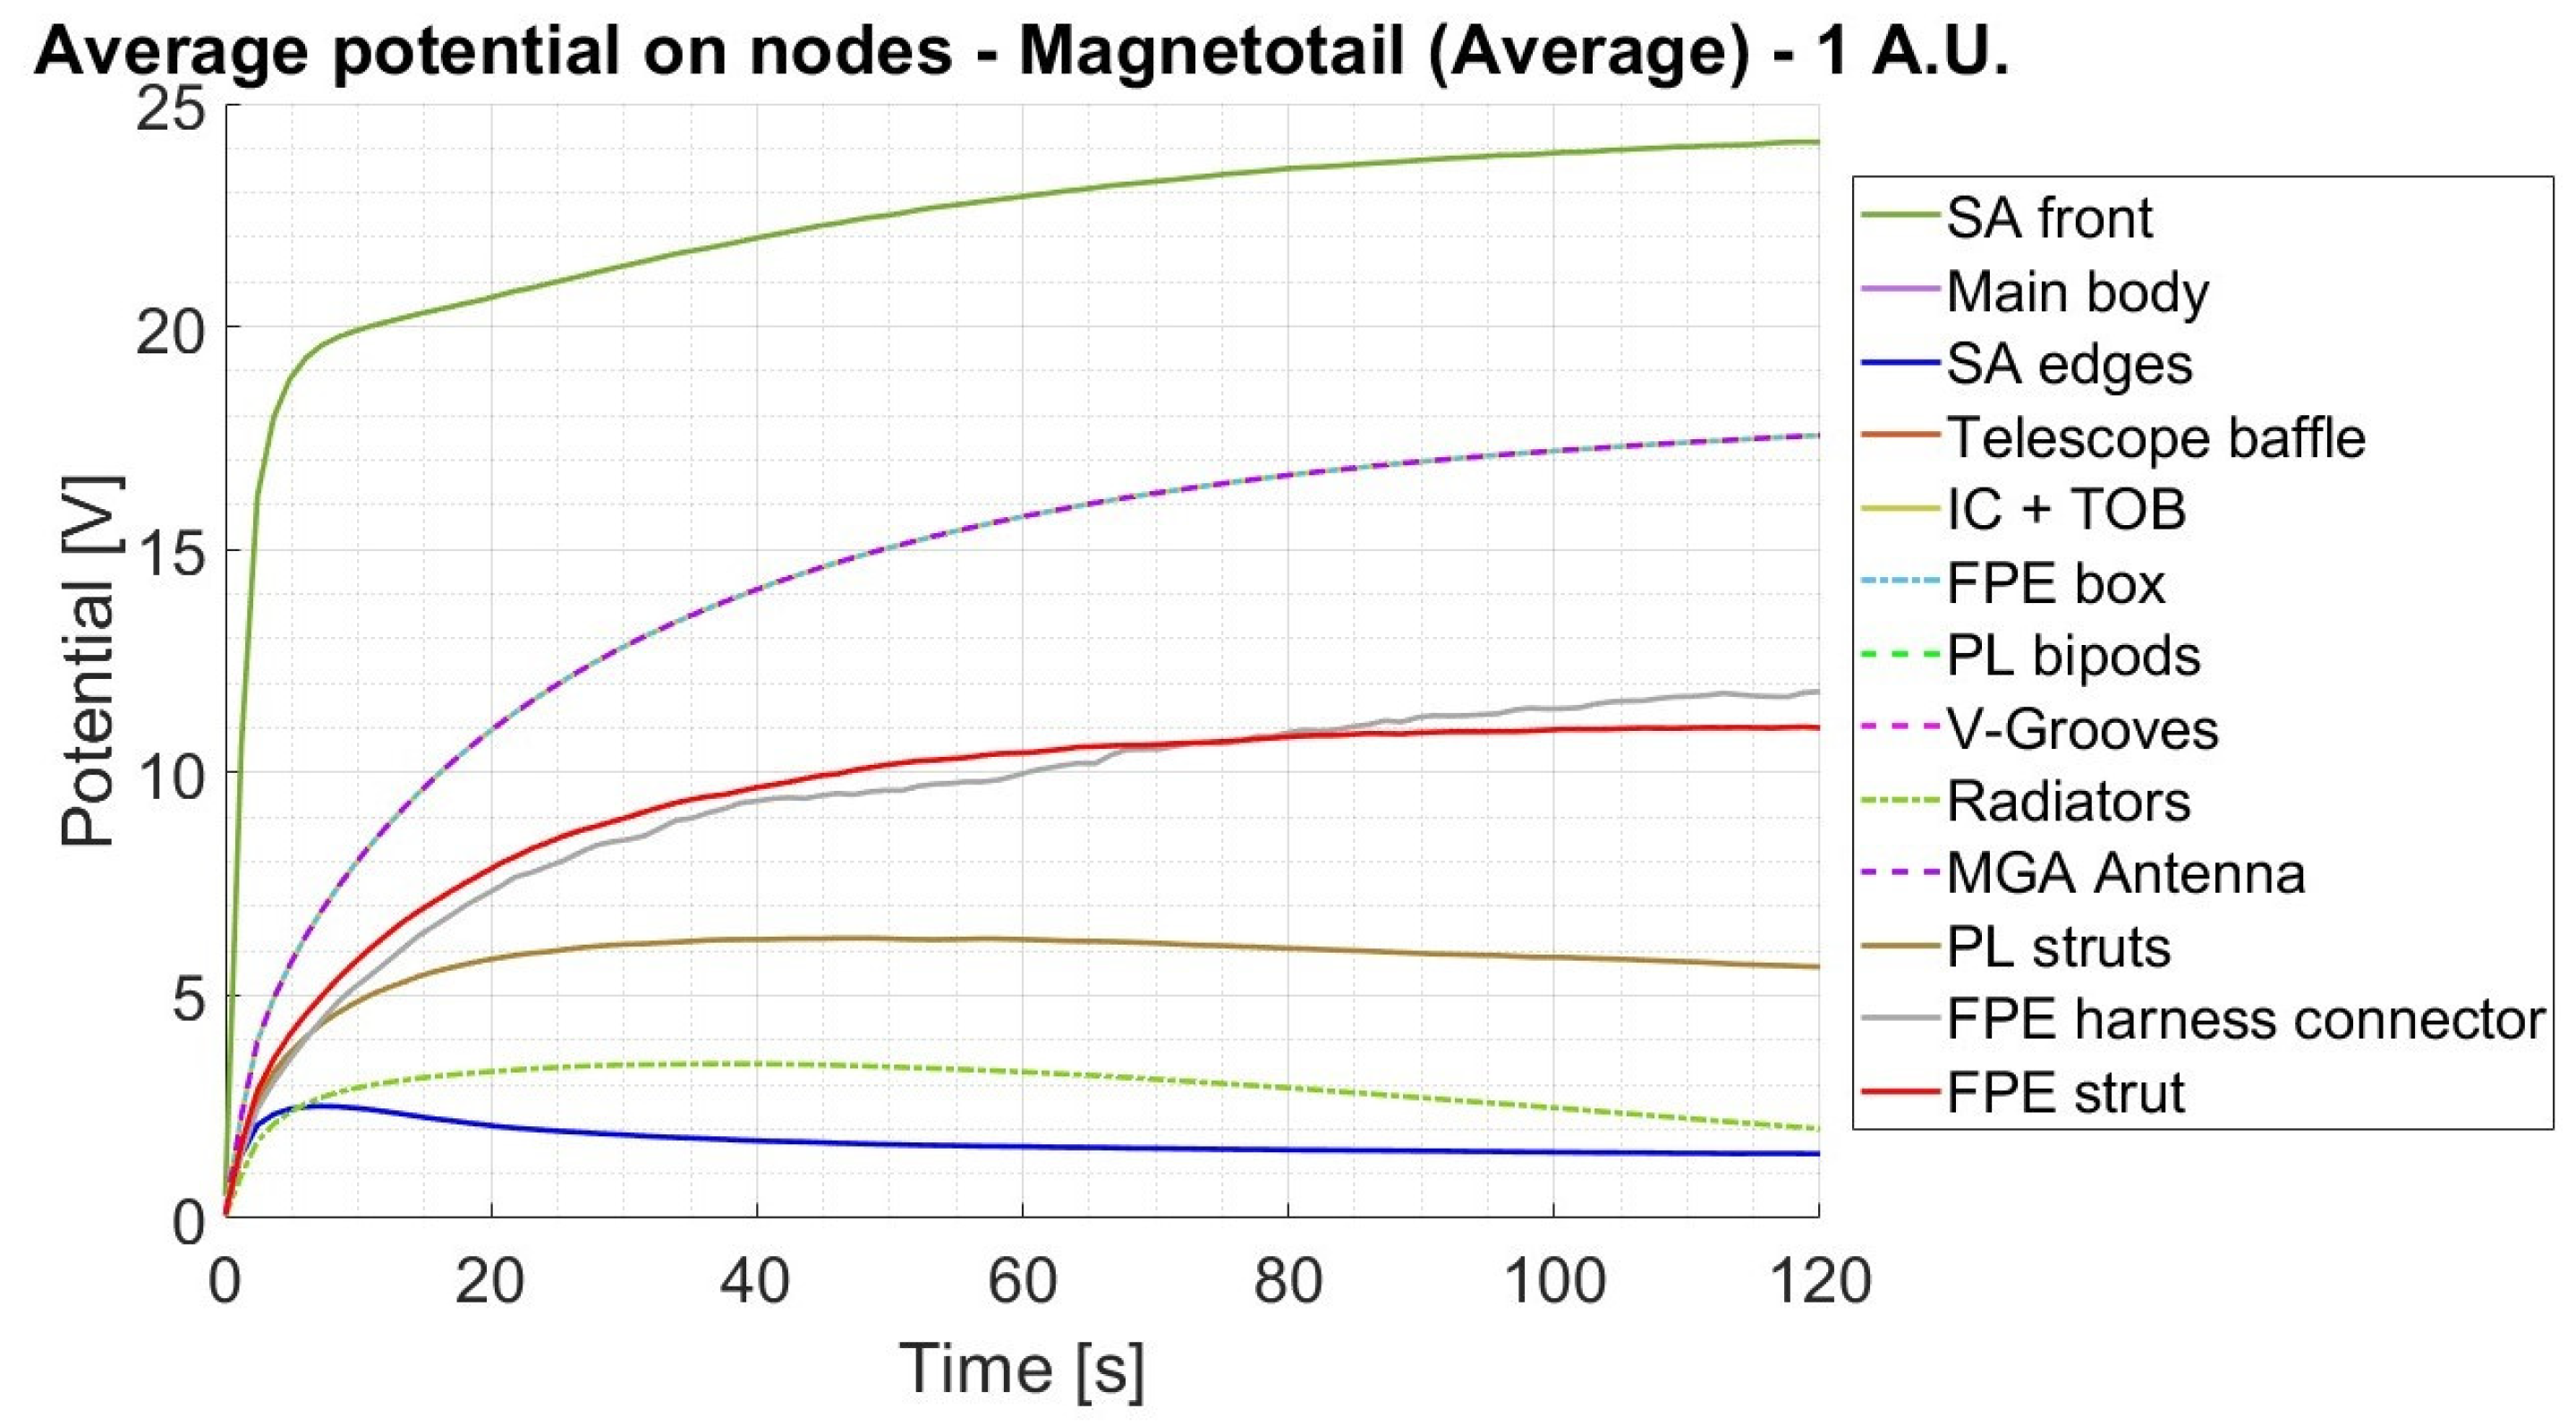
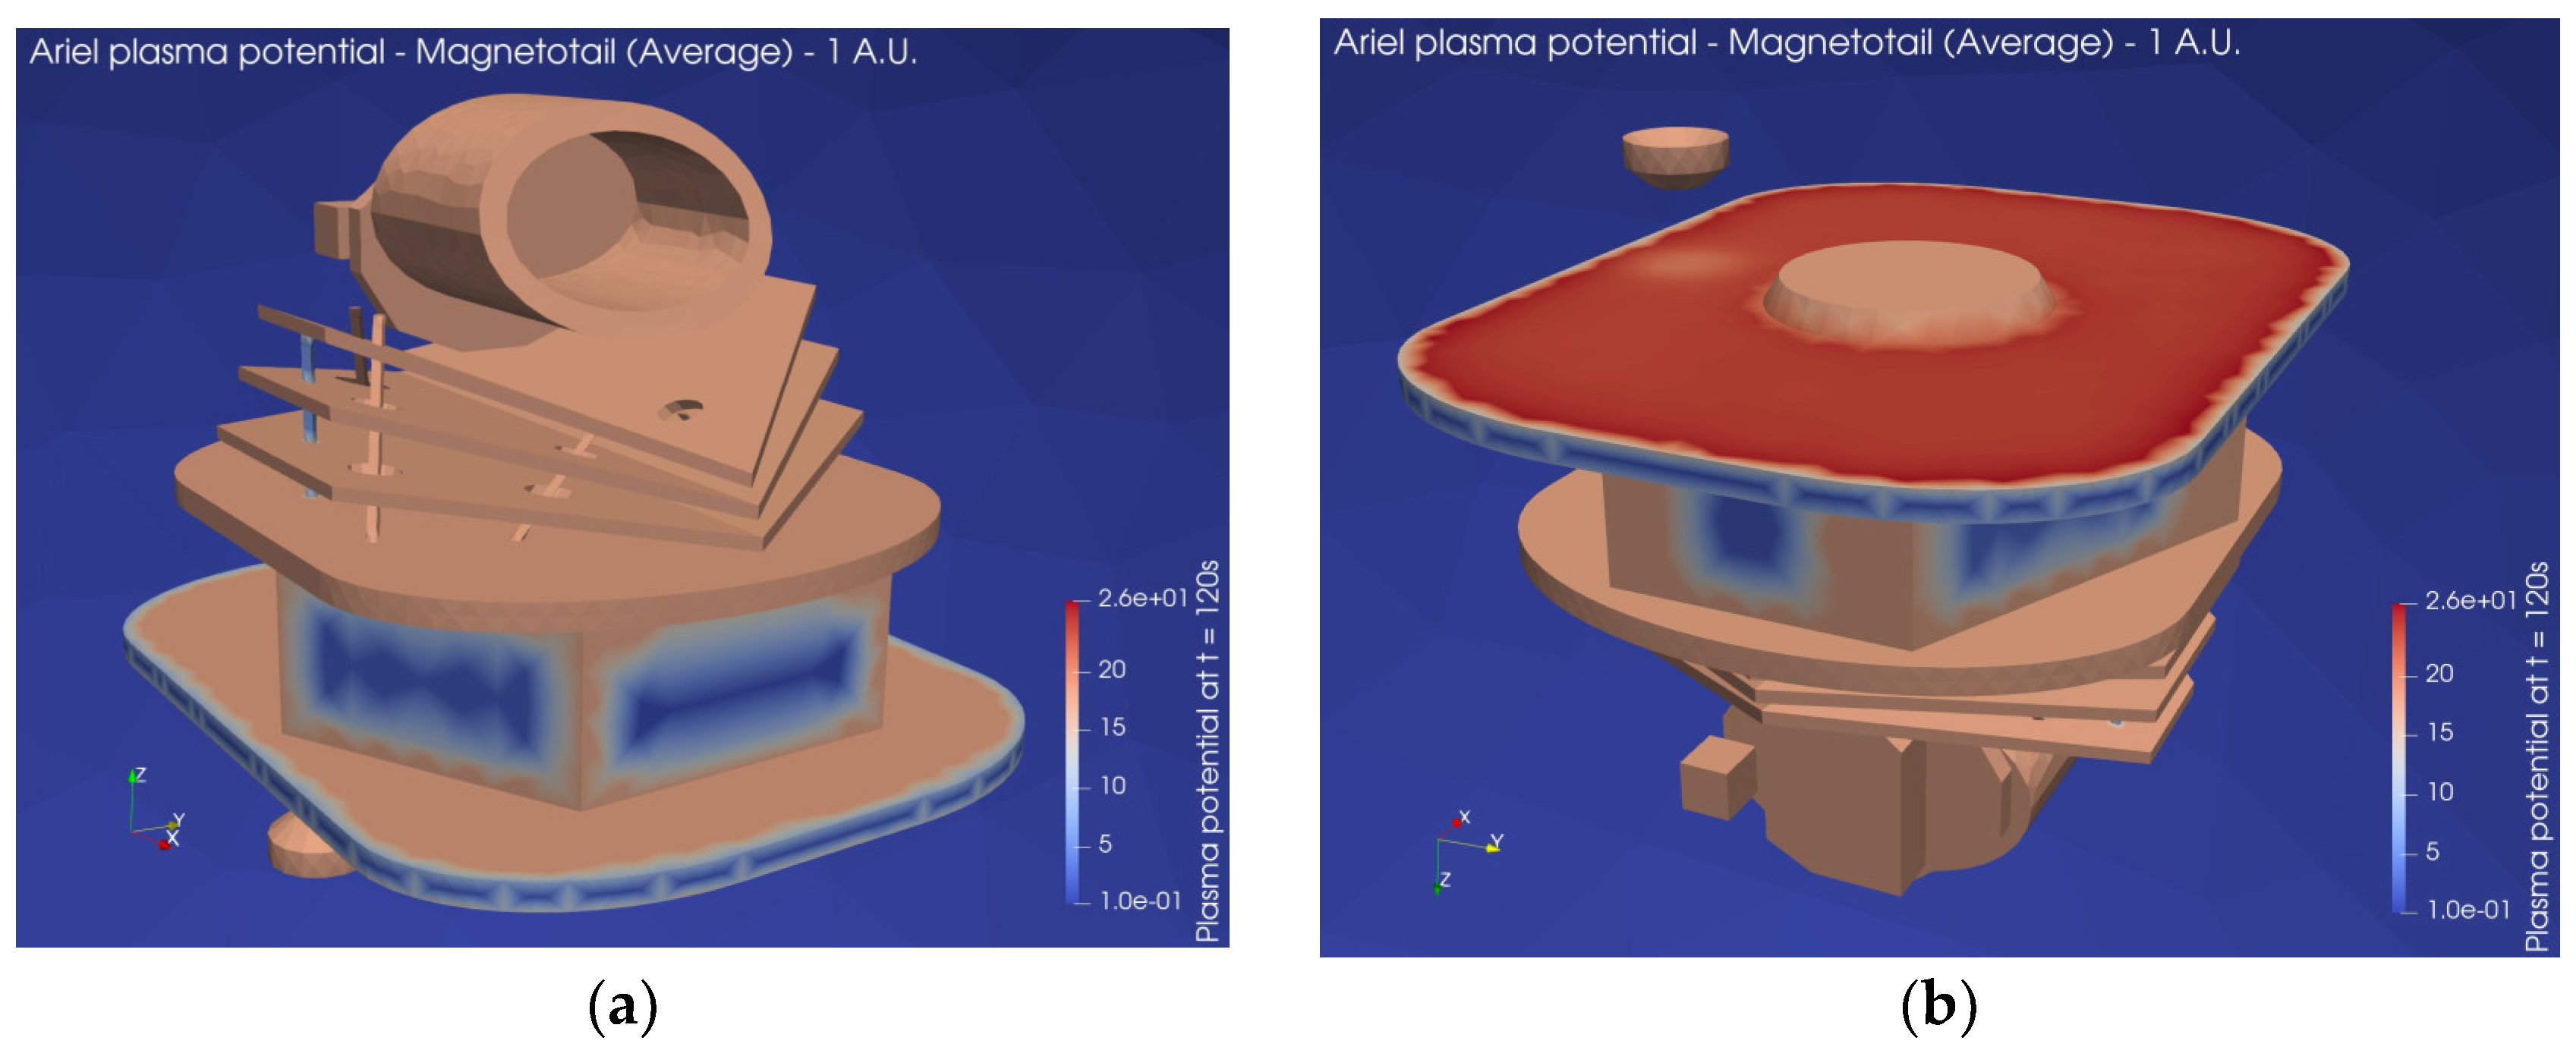
In this environment, the Ariel solar panels charge positively up to about 24 V due to the photoelectric effect. The solar arrays edges are instead charged to a potential of about 1V. The resulting potential differences do not pose a significant risk of ESDs according to the ECSS standards [
13], either between different surfaces of the S/C or from the S/C surfaces to the surrounding plasma and for longer times, as a clear asymptotic behavior is shown.
Figure 30.
Surface potential evolution – Magnetotail (1 A.U.) – Average conditions.
Figure 30.
Surface potential evolution – Magnetotail (1 A.U.) – Average conditions.
Figure 31.
3D map of plasma potential – Magnetotail (1 A.U.) – Average conditions (a) Ariel front; (b) Ariel bottom.
Figure 31.
3D map of plasma potential – Magnetotail (1 A.U.) – Average conditions (a) Ariel front; (b) Ariel bottom.
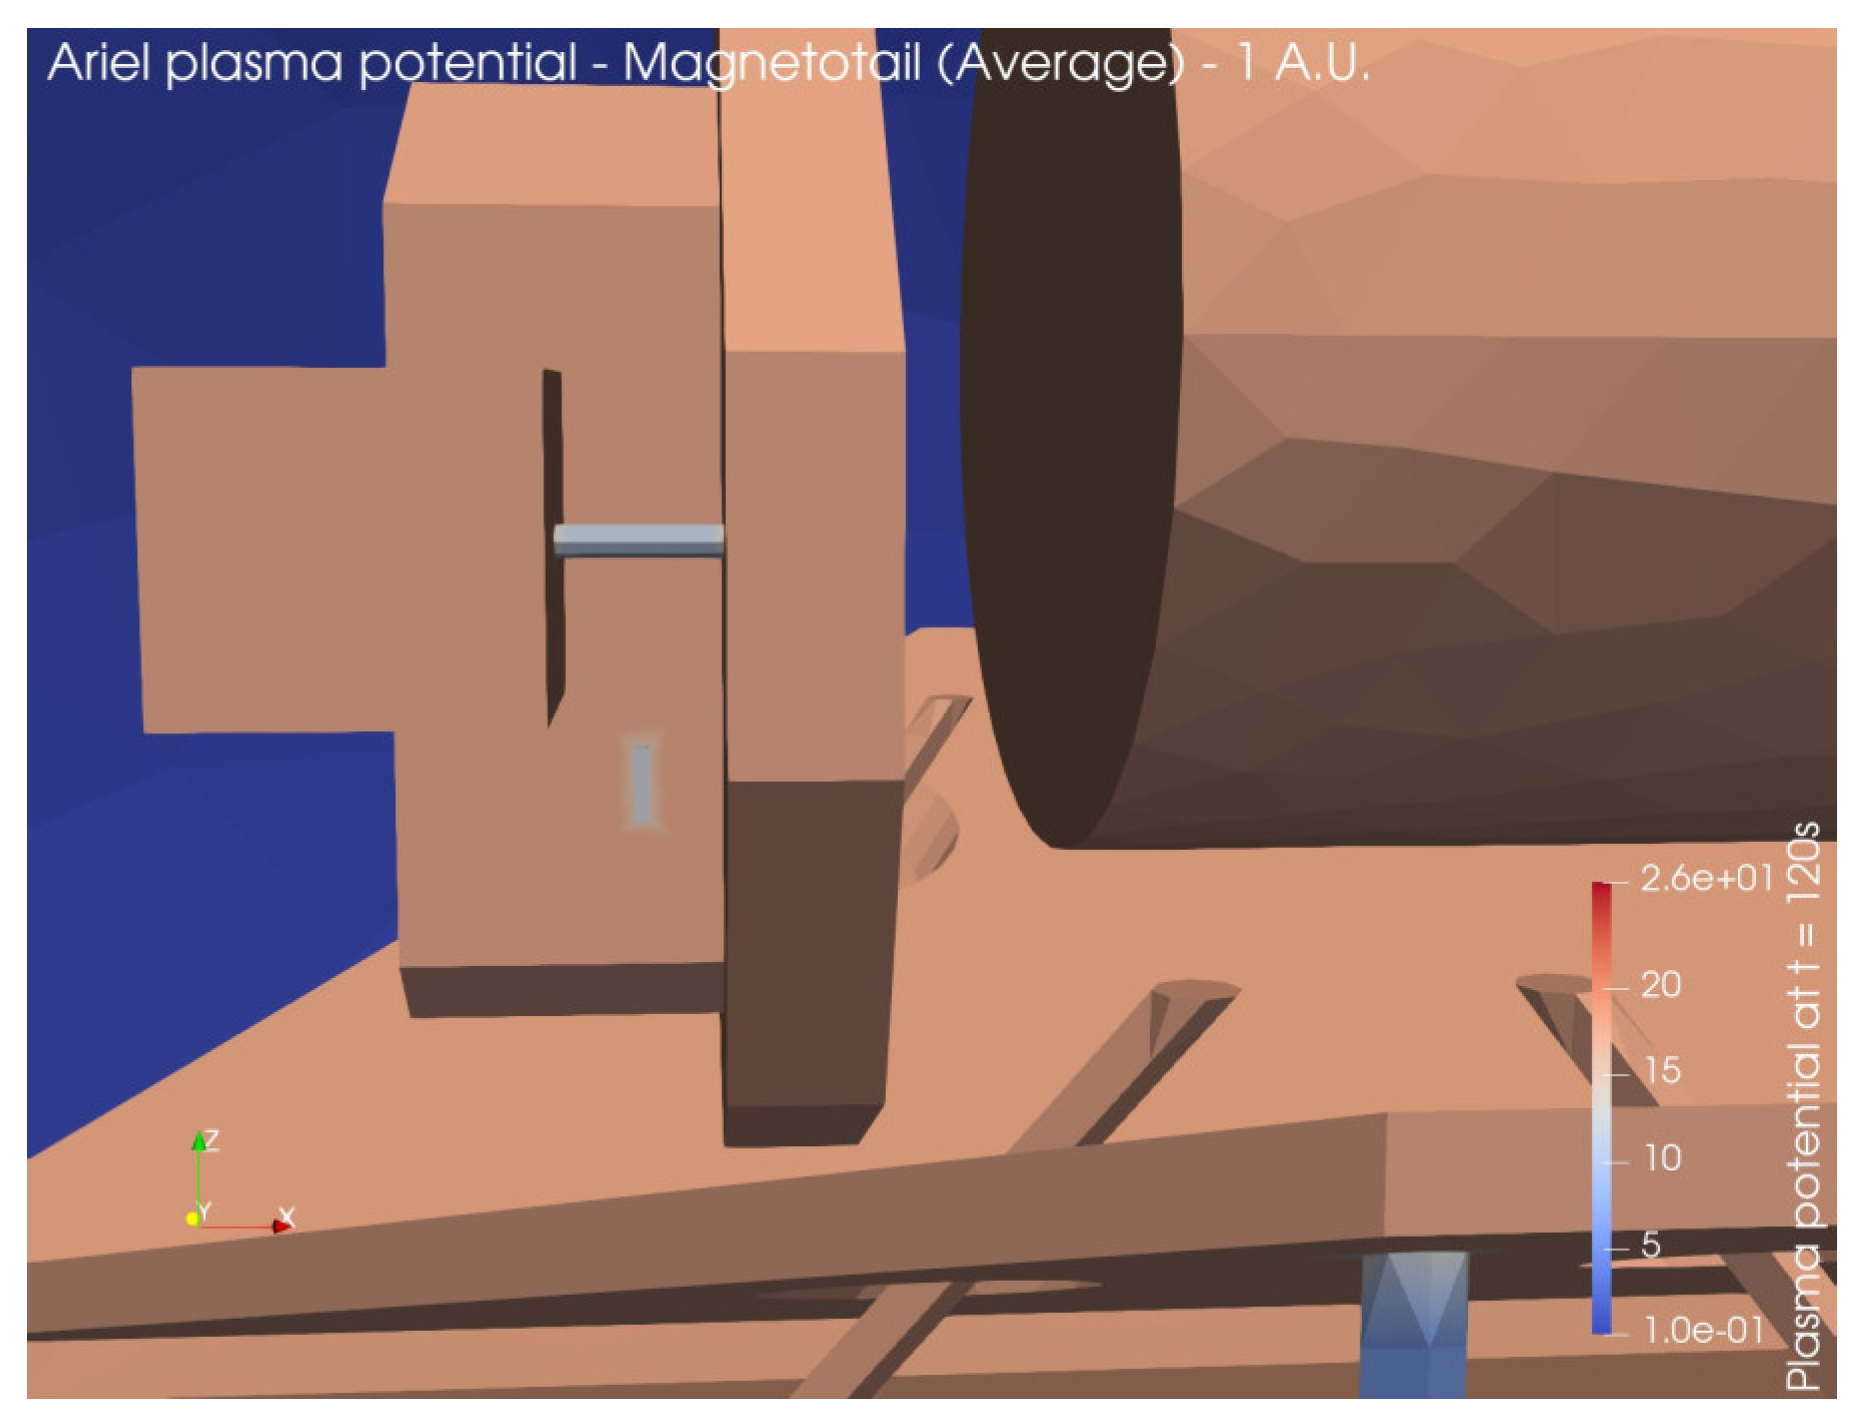
Figure 32.
3D map of plasma potential – Magnetotail (1 A.U.) – Average conditions: closeup on FPE-IC connector and FPE strut.
Figure 32.
3D map of plasma potential – Magnetotail (1 A.U.) – Average conditions: closeup on FPE-IC connector and FPE strut.
7.4.2. Magnetotail – 5% Conditions
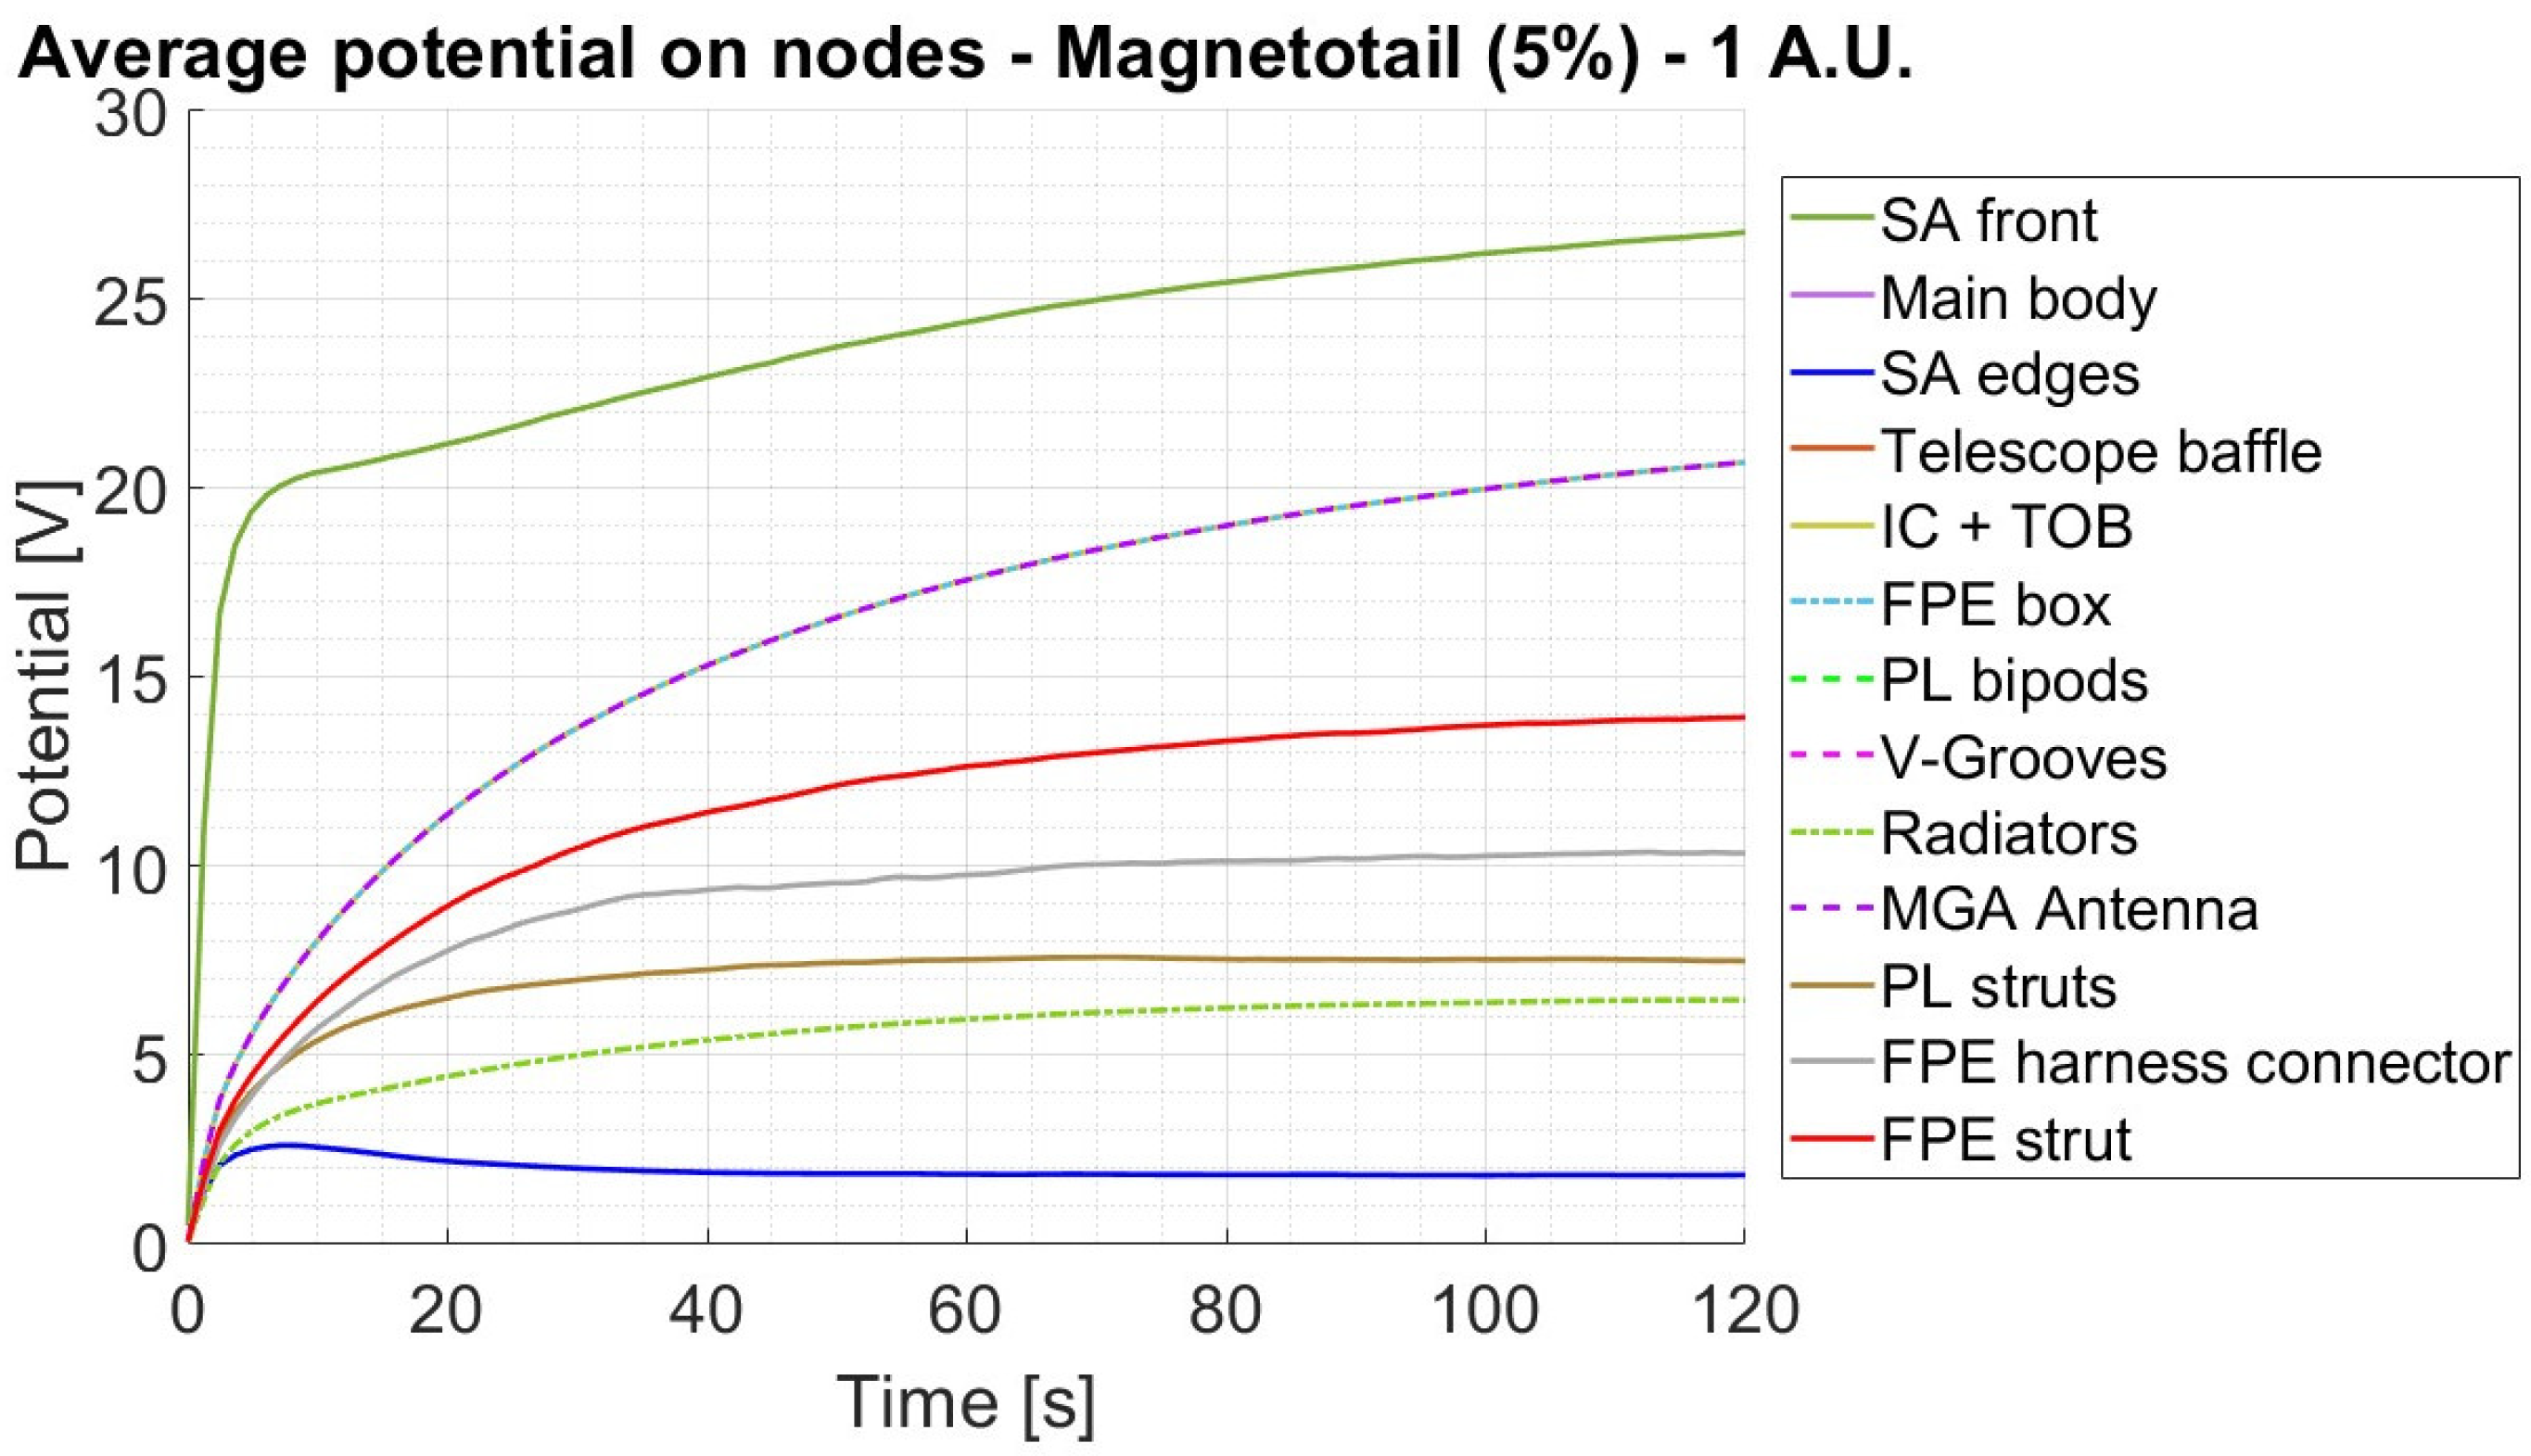
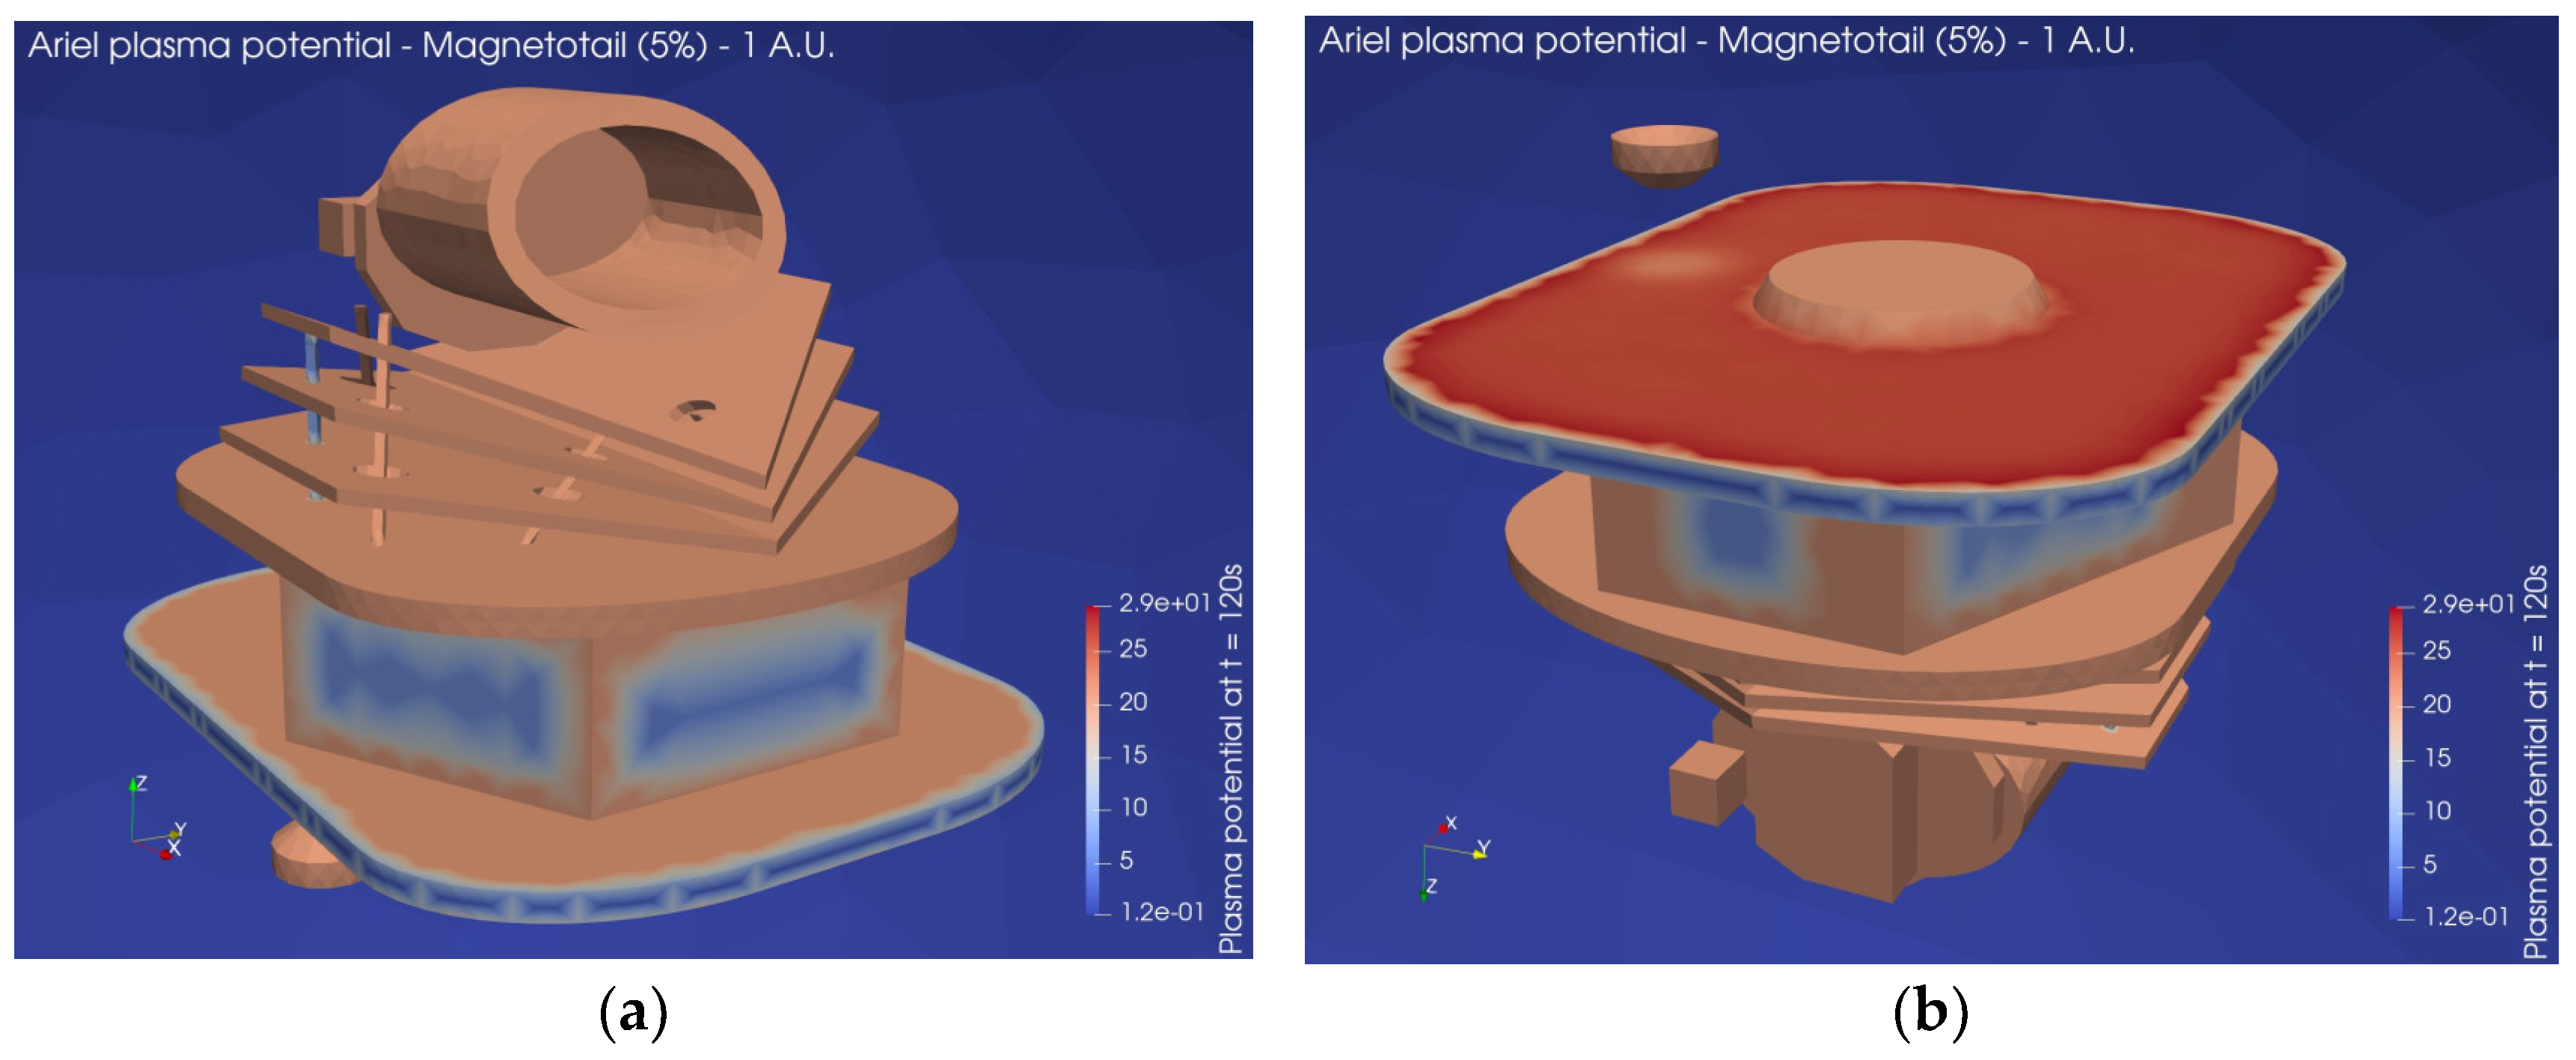
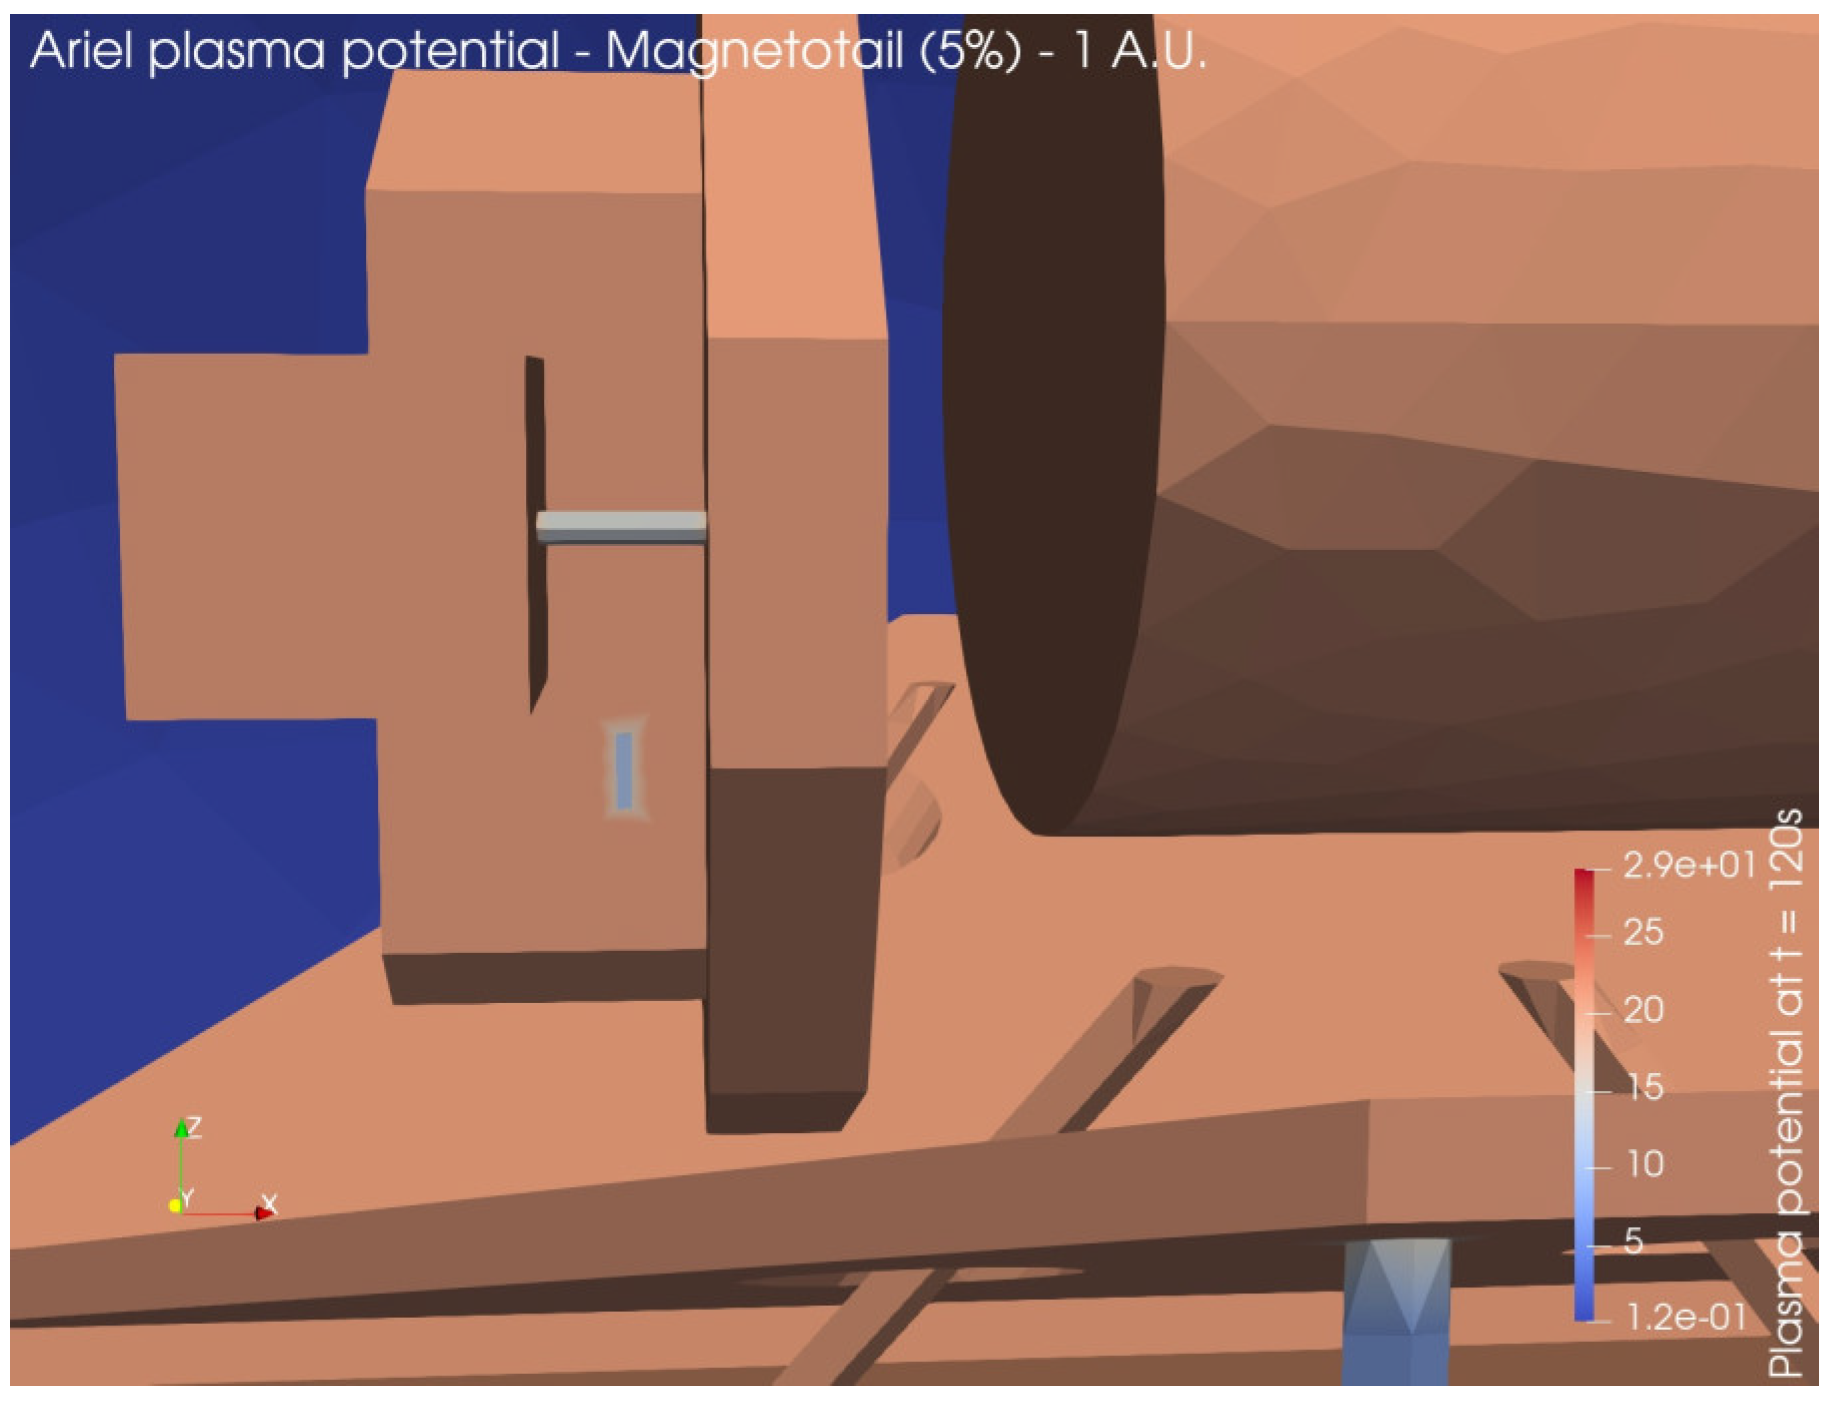
In this environment, the Ariel solar panels charge positively up to about 27 V due to the photoelectric effect for surfaces directly exposed to the sunlight. The solar array edges are instead charged to a potential of about 2V. As in the average conditions case, the resulting potential differences do not pose a significant risk of ESDs according to the ECSS standards [
13], either between different surfaces of the S/C or from the S/C surfaces to the surrounding plasma.
Figure 33.
Surface potential evolution – Magnetotail (1 A.U.) – 5% conditions.
Figure 33.
Surface potential evolution – Magnetotail (1 A.U.) – 5% conditions.
Figure 34.
3D map of plasma potential – Magnetotail (1 A.U.) – 5% conditions (a) Ariel front; (b) Ariel bottom.
Figure 34.
3D map of plasma potential – Magnetotail (1 A.U.) – 5% conditions (a) Ariel front; (b) Ariel bottom.
Figure 35.
3D map of plasma potential – Magnetotail (1 A.U.) – 5% conditions: closeup on FPE-IC connector and FPE strut.
Figure 35.
3D map of plasma potential – Magnetotail (1 A.U.) – 5% conditions: closeup on FPE-IC connector and FPE strut.
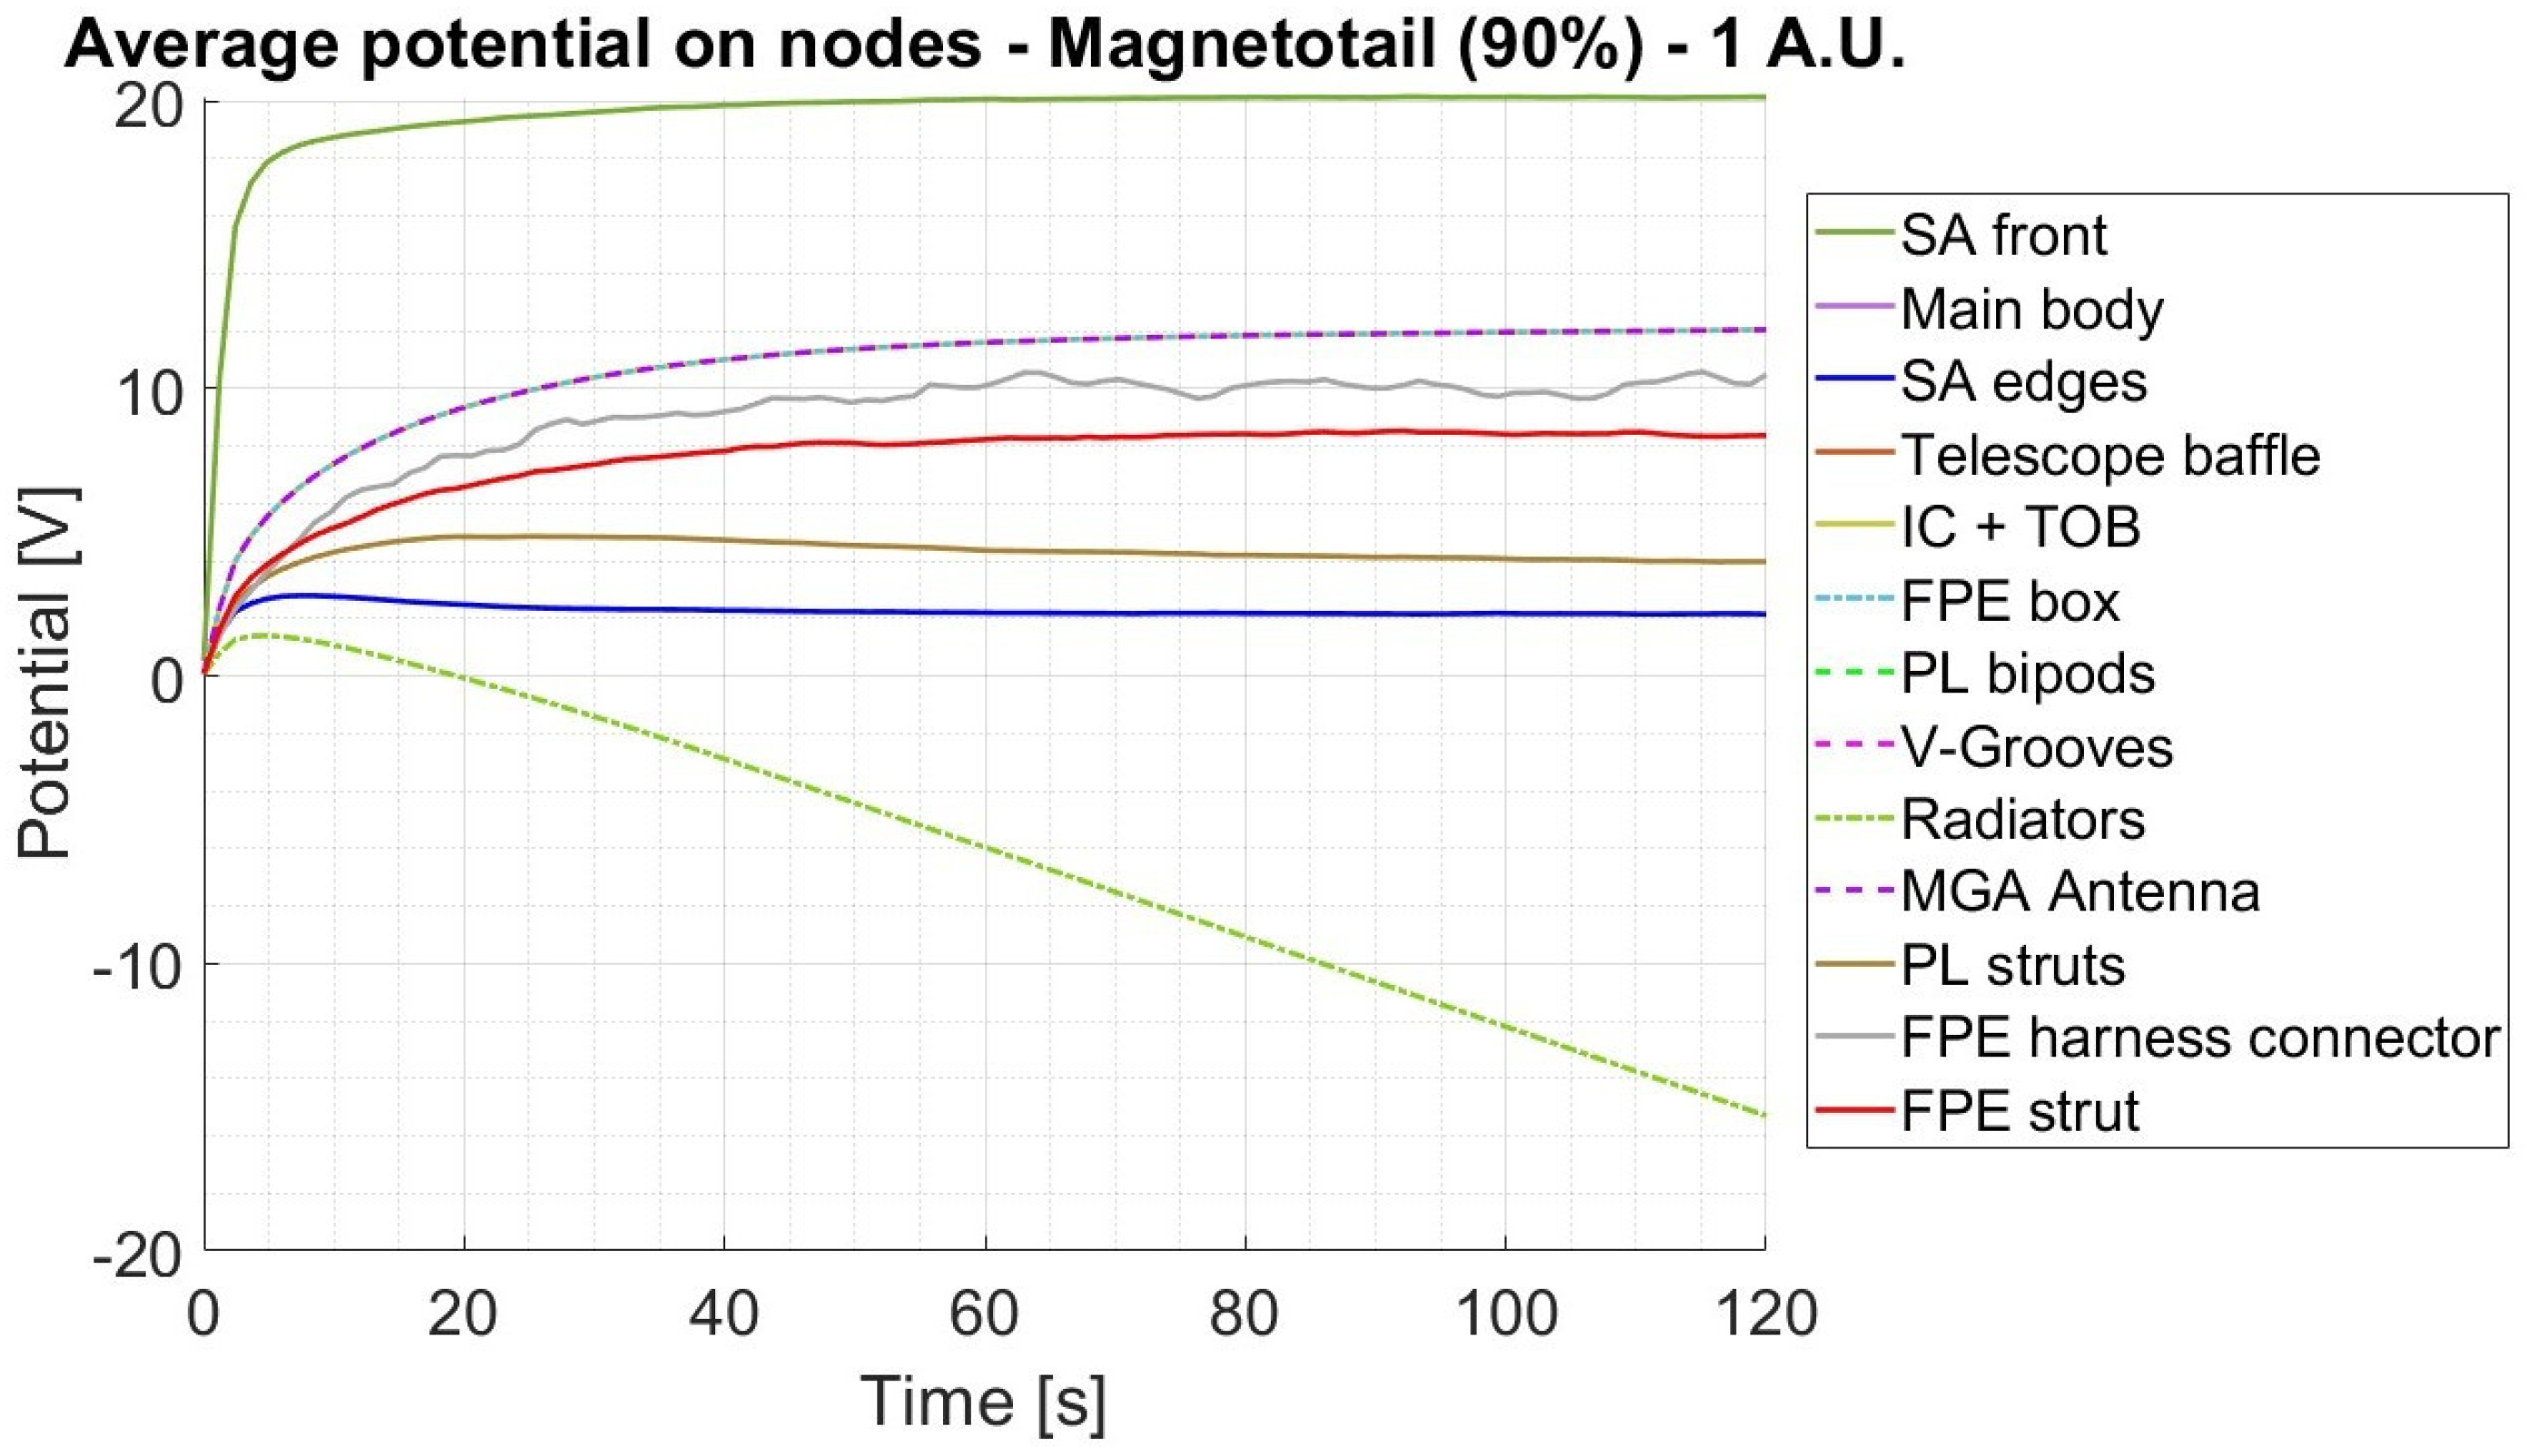
7.4.3. Magnetotail – 90% Conditions
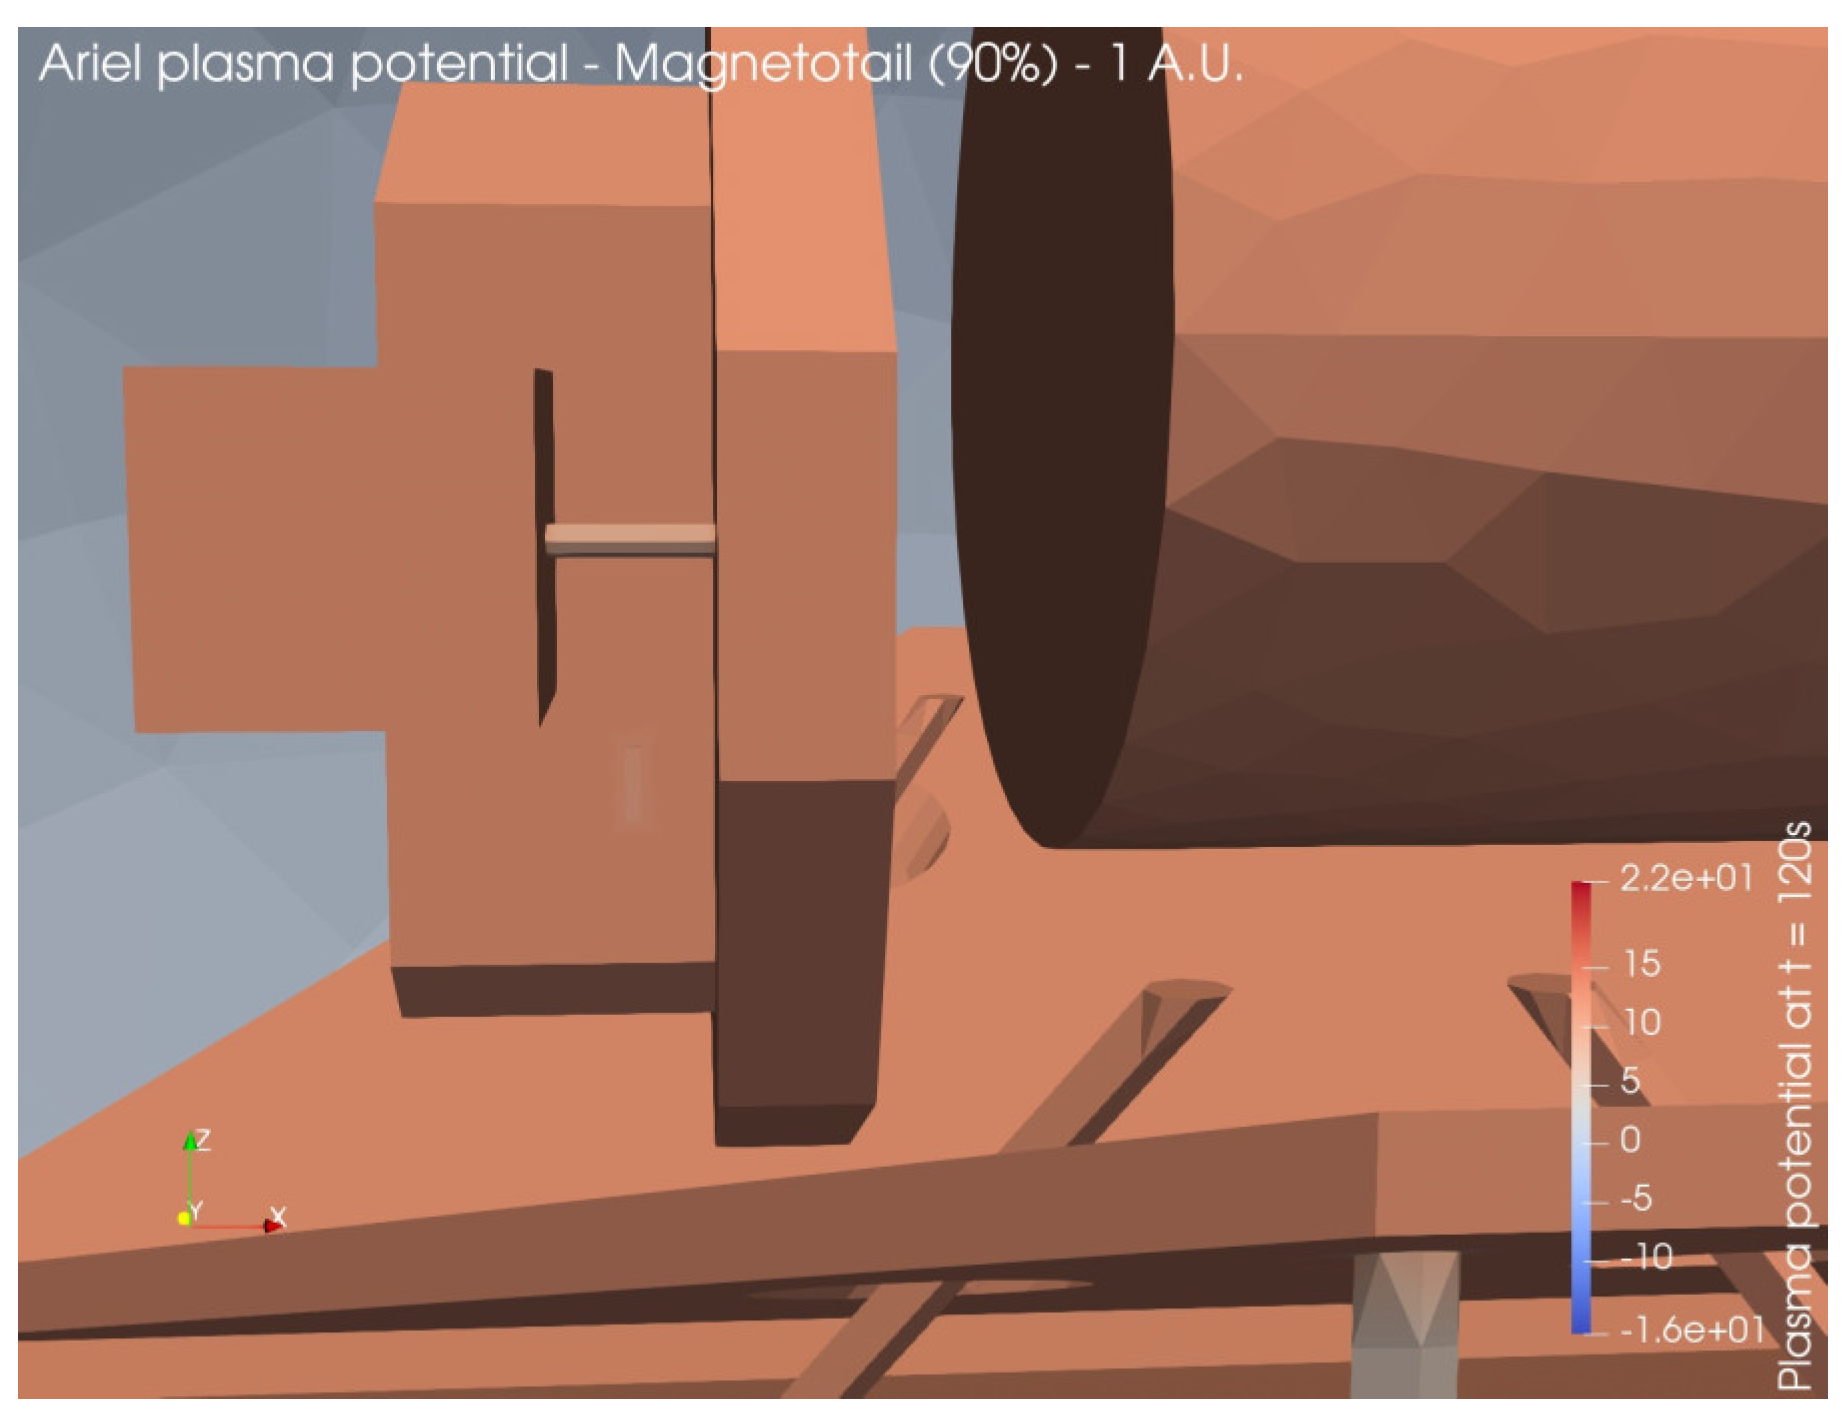
In this environment, the Ariel solar panels charge positively up to about 20 V while the radiators surfaces, covered with non-conductive paint, are charged to a potential of about -16V. The resulting potential differences do not pose a significant risk of ESDs according to the ECSS standards [
13], either between different surfaces of the S/C or from the S/C surfaces to the surrounding plasma, although longer simulation times would be needed to better understand the radiators potential behavior.
Figure 36.
Surface potential evolution – Magnetotail (1 A.U.) – 90% conditions.
Figure 36.
Surface potential evolution – Magnetotail (1 A.U.) – 90% conditions.
Figure 37.
3D map of plasma potential – Magnetotail (1 A.U.) – 90% conditions (a) Ariel front; (b) Ariel bottom.
Figure 37.
3D map of plasma potential – Magnetotail (1 A.U.) – 90% conditions (a) Ariel front; (b) Ariel bottom.
Figure 38.
3D map of plasma potential – Magnetotail (1 A.U.) – 90% conditions: closeup on FPE-IC connector and FPE strut.
Figure 38.
3D map of plasma potential – Magnetotail (1 A.U.) – 90% conditions: closeup on FPE-IC connector and FPE strut.
8. Final Considerations
As described in the previous paragraphs, no major ESD risk is foreseen for most of the L2-relevant plasma environments in quite conditions while a high risk of ESD is expected for the GEO early transfer orbit. The sensitive on-board payload instrumentation [
20] will remain powered off during the insertion orbit to L2, prior switching on for commissioning and in-flight instruments functional verification, to mitigate the risk of damage and/or interference with the PL telemetries (e.g., housekeeping and science telemetry corruption) caused by potential ESD-related transient electromagnetic waves. However, with absolute voltage differences reaching hundreds of volts in GEO, the risk of electrostatic discharge (ESD), and thus a not fully negligible satellite damage likelihood, remains till a charge redistribution occurs travelling towards milder plasma regimes.
Although some curves did not reach a steady state (plateau) or asymptotic behavior due to the physics of charging or simply due to the computational cost and time needed for a single simulation, it is worth noting that the actual payload grounding/bonding solutions and charging mitigations are not fully implemented and simulated in the Ariel SPIS model, representing thus a somewhat worst-case scenario. Additionally, the PL and FPE GFRP struts will be coated with MAP-PUK AQ black paint, as well as others PL sections for which a black (conductive) coating is mainly needed for thermal reason (e.g., TOB thermal radiative coupling with space) facilitating charge flowing and preventing ESDs. However, the ESD coating were deliberately not implemented in the SPIS simulations to assess the potential impact of payload charging in the absence of such a mitigation method and to confirm its usefulness.
9. Future Developments
In order to assess the order of magnitude of the charge redistribution times and voltage fluctuations during transients between different plasma regimes, along the S/C orbit and prior the PL switching-on, further simulations and analyses are needed accounting for the dynamics and evolution of plasma at the boundary conditions between different space environments (GEO to L2 in particular).
Author Contributions
Supervision, Mauro Focardi; Methodology, Maxsim Pudney and Pierpaolo Merola; Writing - review & editing, Ian Renouf, Vladimiro Noce, Marina Vela Nunez, Giacomo Dinuzzi, Simone Chiarucci
Funding
This study has been supported by the Italian Space Agency (ASI) thanks to the ASI-INAF agreement n. 2021-5-HH.2-2024 “Scientific activity for the Ariel Mission – B2/C/D1 Phases”.
Data Availability Statement
The original contributions presented in the study are included in the article/supplementary material, further inquiries can be directed to the corresponding author/s.
Acknowledgments
The authors would like to thank the Ariel Mission Consortium (AMC) and all the involved founding Agencies and Institutions, ESA in particular. A special thanks to UCL – University College of London (UK) leading the Ariel Mission Consortium (AMC) in the person of Prof. Giovanni Tinetti as Ariel Principal Investigator (PI).
Conflicts of Interest
The authors declare no conflicts of interest.
Abbreviations
| ACS |
Active Cooler System |
| A-DCU |
AIRS Detector Control Unit |
| AIRS |
Ariel IR Spectrometer |
| AMC |
Ariel Mission Consortium |
| AOCS |
Attitude and Orbit Control System |
| ARIEL |
Atmospheric Remote-sensing Infrared Exoplanet Large-survey |
| ASI |
Agenzia Spaziale Italiana (Italian Space Agency) |
| AVG |
Average |
| CFEE |
Cold Front-End Electronics |
| CFRP |
Carbon Fiber Reinforced Polymer |
| ECSS |
European Cooperation for Space Standardization |
| ESA |
European Space Agency |
| ESD |
ElectroStatic Discharge |
| ESN |
Electrical Super Node |
| FGS |
Fine Guidance System |
| FPE |
Focal Plane Electronics |
| GCR |
Galactic Cosmic Ray |
| GEO |
GEostationary Orbit |
| GFRP |
Glass Fiber Reinforced Polymer |
| LEO |
Low Earth Orbit |
| IC |
Instrument Cavity |
| ICU |
Instrument Control Unit |
| IR |
InfraRed |
| MGA |
Medium Gain Antenna |
| MLI |
MultiLayer Insulator |
| PI |
Principal Investigator |
| PIC |
Particle-In-Cell |
| PIP |
Payload Interface Panel |
| PL |
Payload |
| PLM |
PayLoad Module |
|
Earth Radii |
| SA |
Solar Array |
| S/C |
SpaceCraft |
| SEE |
Secondary Electron Emission |
| SPICE |
Simulation Program with Integrated Circuit Emphasis |
| SPIS |
Spacecraft Plasma Interaction Software |
| SPINE |
Spacecraft Plasma Interaction Network in Europe |
| SVM |
Service Module |
| TA |
Telescope Assembly |
| TOB |
Telescope Optical Bench |
| VG |
V-Groove |
References
- Ariel Mission Consortium (AMC), Ariel Definition Study Report (Red Book), 2020.
- Ariel Project Team, Ariel Environment Specification, ESA-ARIEL-ENV-SP-001, 2020.
- S. T. Lai, Fundamentals of Spacecraft Charging, Princeton University Press: Princeton, New Jersey, USA, 2012.
- H. C. Koons, The impact of the space environment on space systems, 2000.
- SPINE and SPIS Suite. Available online: http://www.spis.org/.
- K. Skup et al., Ariel Fine Guidance System: design challenges and opportunities, 2022.
- K. Skup et al., he Ariel FGS: current design and implementation, In Proceedings of the SPIE AT&I Conference, Yokohama, Japan, 18 June 2024.
- J. Martignac et al., AIRS: Ariel IR spectrometer status, 2022.
- J. Martignac et al., Ariel IR Spectrometer development status, In Proceedings of the SPIE AT&I Conference, Yokohama, Japan, 18 June 2024.
- S.W. Evans, Natural Environment Near the Sun/Earth-Moon L2 Libration Point, 2003.
- NASA-HDBK-4002B, Mitigating In-Space Charging Effects – A Guideline, 2022.
- T. Mikaelian, Spacecraft Charging and Hazards to Electronics in Space, 2001.
- ECSS-E-ST-20-06C Rev.1, Spacecraft Charging, 2019.
- M. Pudney, AIRBUS EMC Analysis Report, 2023.
- M. Michelagnoli, Ariel charging analysis: effects of space plasma environments along the spacecraft orbit, Physics Master’s Degree Thesis work, University of Florence - Italy, 17 June 2024.
- M. Focardi et al., Consolidation of surface charging analyses on the Ariel payload dielectrics in the early transfer orbit and L2 space environments, 2024. [CrossRef]
- GMSH Web site. Available online: https://gmsh.info/.
- ECSS-E-ST-10-04C Rev.1, Space Environment, 2020.
- ] S. Guillemant et al., Simulation Study of Spacecraft Electrostatic Sheath Changes With the heliocentric Distances from 0.044 to 1 AU, 2013. [CrossRef]
- M. Focardi et al., The Ariel Payload electrical and electronic architecture: a summary of the current design and implementation status, 2024. [CrossRef]
|
Disclaimer/Publisher’s Note: The statements, opinions and data contained in all publications are solely those of the individual author(s) and contributor(s) and not of MDPI and/or the editor(s). MDPI and/or the editor(s) disclaim responsibility for any injury to people or property resulting from any ideas, methods, instructions or products referred to in the content. |
© 2024 by the authors. Licensee MDPI, Basel, Switzerland. This article is an open access article distributed under the terms and conditions of the Creative Commons Attribution (CC BY) license (http://creativecommons.org/licenses/by/4.0/).
