1. Introduction
Utility tunnel (UT) is the important infrastructure system containing kinds of municipal and energy transportation pipelines, cable, such as electricity, communication, broadcasting, water supply, drainage, heating, and gas in urban areas[
1]. UT provide space for daily maintenance and pipeline installation, eliminating the extensive and repeated excavation for underground pipelines and reducing the “spider web in the sky” [
2,
3].
Historically, underground structures were always regarded as a lower seismic vulnerability compared with structure in the ground [
4,
5], however, in 1995 Kobe earthquake Japan, lots of underground structure were damaged, such as subway stations and buried pipeline ,this opinion was challenged [
6,
7,
8], and Researchers pay more attentions on study the seismic response of underground structure , including utility tunnels. Tang et al.[14] conducted series of shaking table tests and numerical simulation on seismic response mechanism of utility tunnels, and found that the UT and surrounding soil often exhibited consistent motion during seismic excitation, UT is more easy damaged in the special geological units, , like fault, liquefaction, and non-homogenous stratum. Wang et al.[
9] studied the seismic risk of the shallow-buried utility tunnels in soft soil layers based on the numerical simulation, indicating a significant effect of multi-directional combined damping methods. Yue et al.[
10] investigated the dynamic response and failure mechanisms of prefabricated corrugated steel utility tunnels through a series of shaking table tests, and demonstrated that the acceleration response of the structure is basically in line with the surrounding soil, and the soil dynamic pressure acting on the tunnel sidewalls was greatly influenced by the tunnel mass distribution. Chen et al.[
11,
12] conducted shaking table tests and numerical simulations to study the seismic performance of utility tunnels under non-uniform seismic excitations, found that the structures exhibit a more pronounced response to non-uniform seismic events. Shamsabadi et al.[
13] studied the soil-tunnel-structure interaction mechanism and proposed a corresponding retrofitting solutions to reduce the seismic damage risk of UT. Konstandakopoulou et al.[
14] investigated the seismic response of utility tunnels considering the rock-structure-fluid systems.Some scholars have explored the seismic response features of utility tunnels in homogeneous soil in uniform and non-uniform seismic excitations. Some researches have also found the seismic performance of UT using centrifuge testing to check the effect on soil-structure interaction to seismic response of UT [
15,
16,
17].
Actually, UT is constructed across the river, How to assess the impact of seismic effects and fluctuating water pressure on UT is an interesting topic. In river basin, the site effect, nonhomogeneous soil and pore water pressure are often common acting on the UT in earthquake excitation, it is always difficult to estimate seismic response of UT. Based on an actual engineering project in Haikou, China, This study aims to develop a three-dimensional coupling numerical model of water-soil-utility tunnel to simulate the seismic response of UT across one river. The fluid-solid coupling interaction model is built on base of an acoustic-solid coupling, and a three-dimensional viscoelastic boundary model is used to simulate the boundary condition. The seismic response of UT across the river considering the seismic invading directions, water elevation change are studied using the ABAQUS software, and some valuable conclusions have been got.
2. Interaction between Hydrodynamic Pressure and Structures
2.1. Westergaard Formula
The Westergaard formula is used to study the interaction between structures and hydrodynamic pressure. Since its introduction by Westergaard [
18]in 1933 during his study of the Hoover Dam in the United States, the dynamic effects of water in reservoir on dams engineering during seismic events have been extensively studied.
The fundamental assumptions of the Westergaard formula are as follows: 1.the impervious surface is rigid and vertical; 2. the reservoir water extends infinitely upstream; 3. the fluid is inviscid and irrotational, undergoing small-amplitude oscillations, while neglecting the influence of surface waves.
In this equation, ρ is the density of water, denotes the hydrodynamic pressure, and is the bulk modulus of water, , are the displacements of the fluid in the and directions.
Boundary conditions :( Under simple harmonic motion with
)
The interpretation of the formula is as follows:
Setting x = 0 yields the hydrodynamic pressure at the dam face:
The distribution along the dam face :
2.2. Governing Equations for Dam Structure-Fluid Interactions
The flow of water in reservoir under earthquake stimulation is considered to be irrotational, with tiny amplitudes and negligible viscosity effects. The Helmholtz equation is satisfied.
At the free surface, boundary conditions apply
at the boundary between the dam and the liquid
The bottom and sides of the reservoir
is the Laplace operator;
is Differentiation of
with regard to time; A subscript after a comma in
indicates that
is partially differentiated with respect to space, where
represents the boundary's inward normal direction;
c denotes the compression wave velocity in water.
is the water's density; The acceleration of the upstream dam face is represented by
,whereas the free field acceleration of the reservoir bottom and sides is represented by
,which is dependent on the direction of the incoming seismic waves;
is the wave reflection coefficient, and
is the damping coefficient that describes the effects of hydrodynamic pressure waves being absorbed at the reservoir boundary, This is the reflected wave's amplitude divided by the pressure wave's normal incidence amplitude.
and
are connected by the following expressions:
where
,
stand for the elastic modulus, density and wave velocity of the dam foundation rock [
19].
2.3. Comparison and Validation of Numerical Solutions for Fluid-Structure Interaction with the Westergaard Analytical Solution
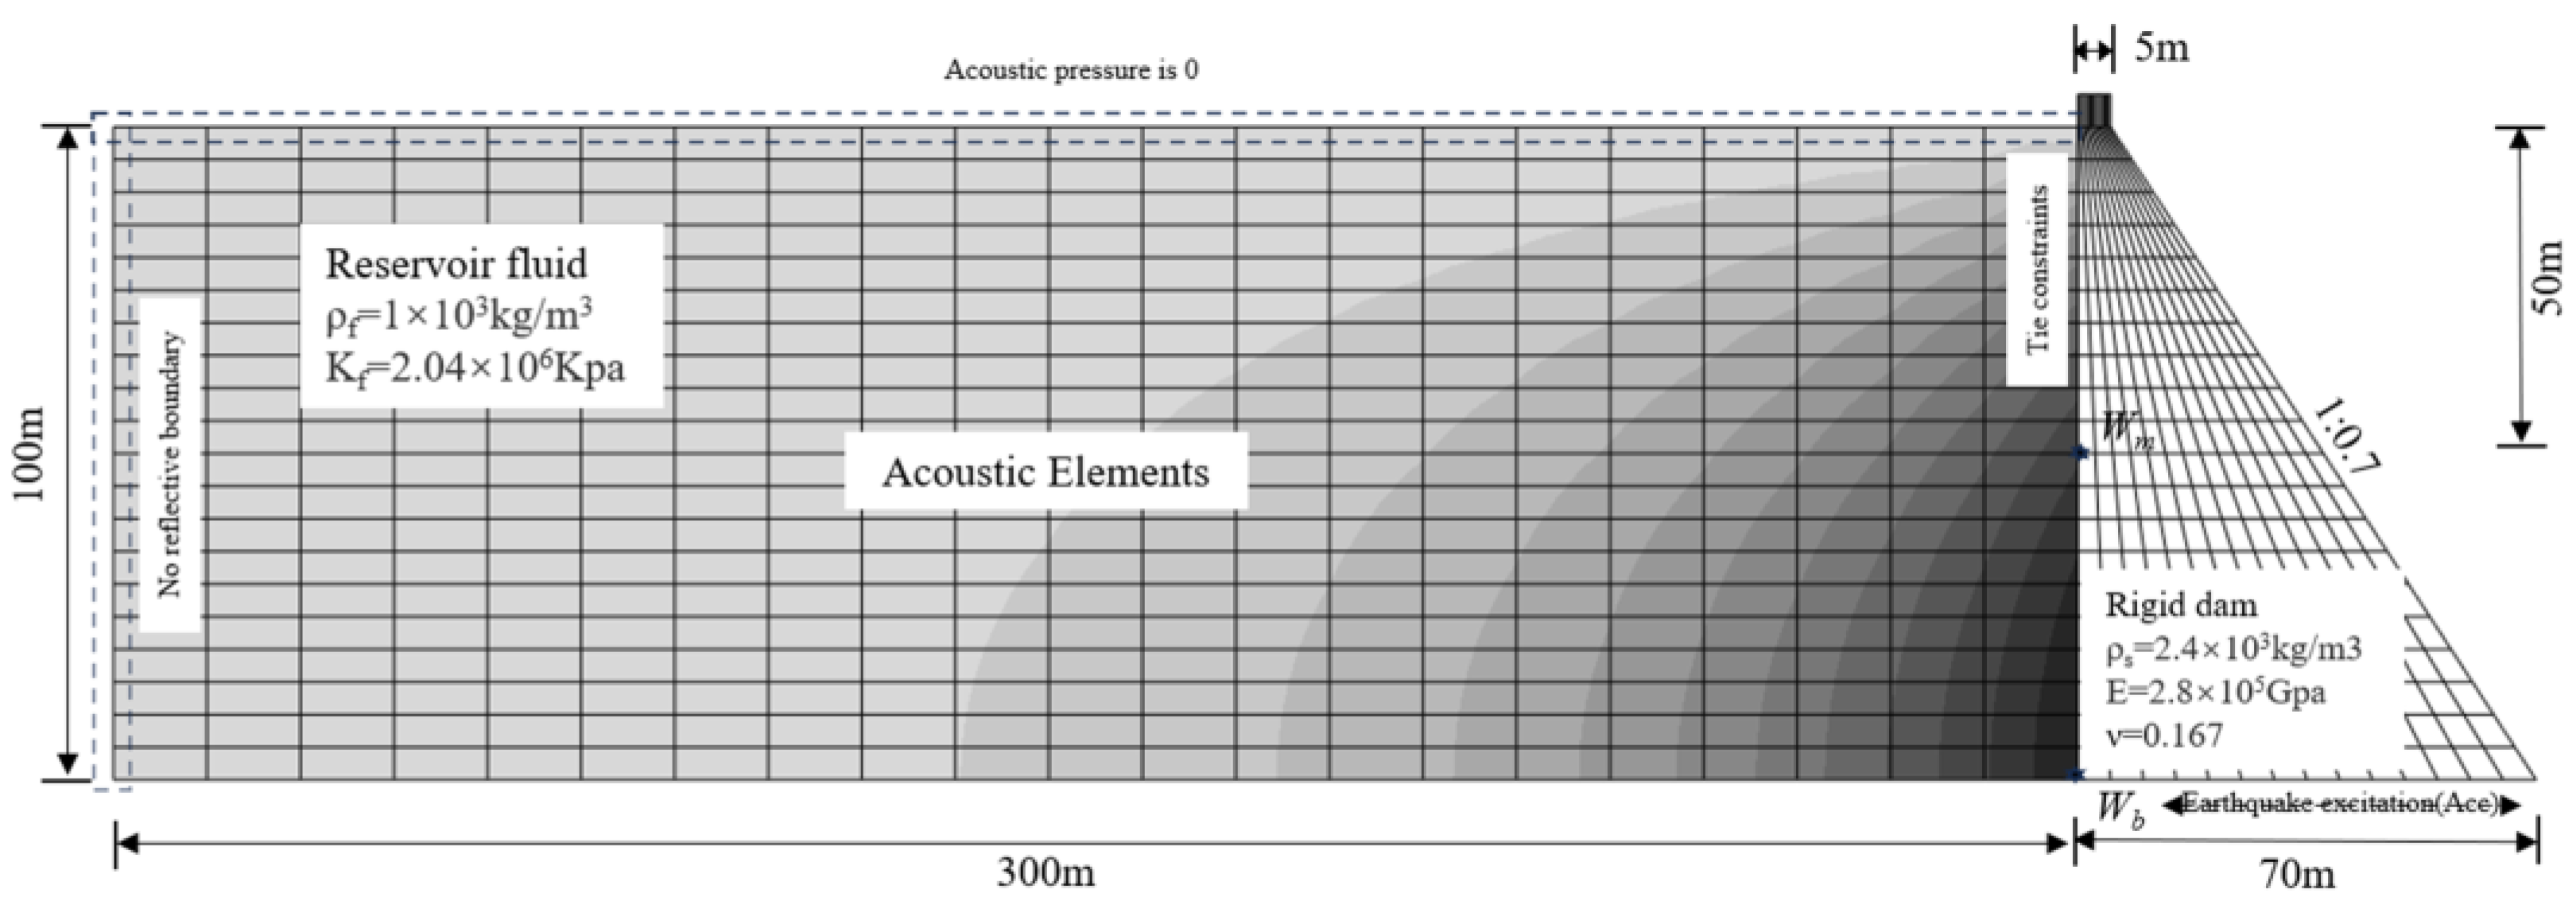
This study focuses on fluid-structure coupling interactions, treating acoustic elements as fluids to simulate the interactions between water and the structure. Based on the validation model by Fu et al.[
20] a two-dimensional coupling model of the water and dam is established. The geometric parameters and material properties of the model are outlined in
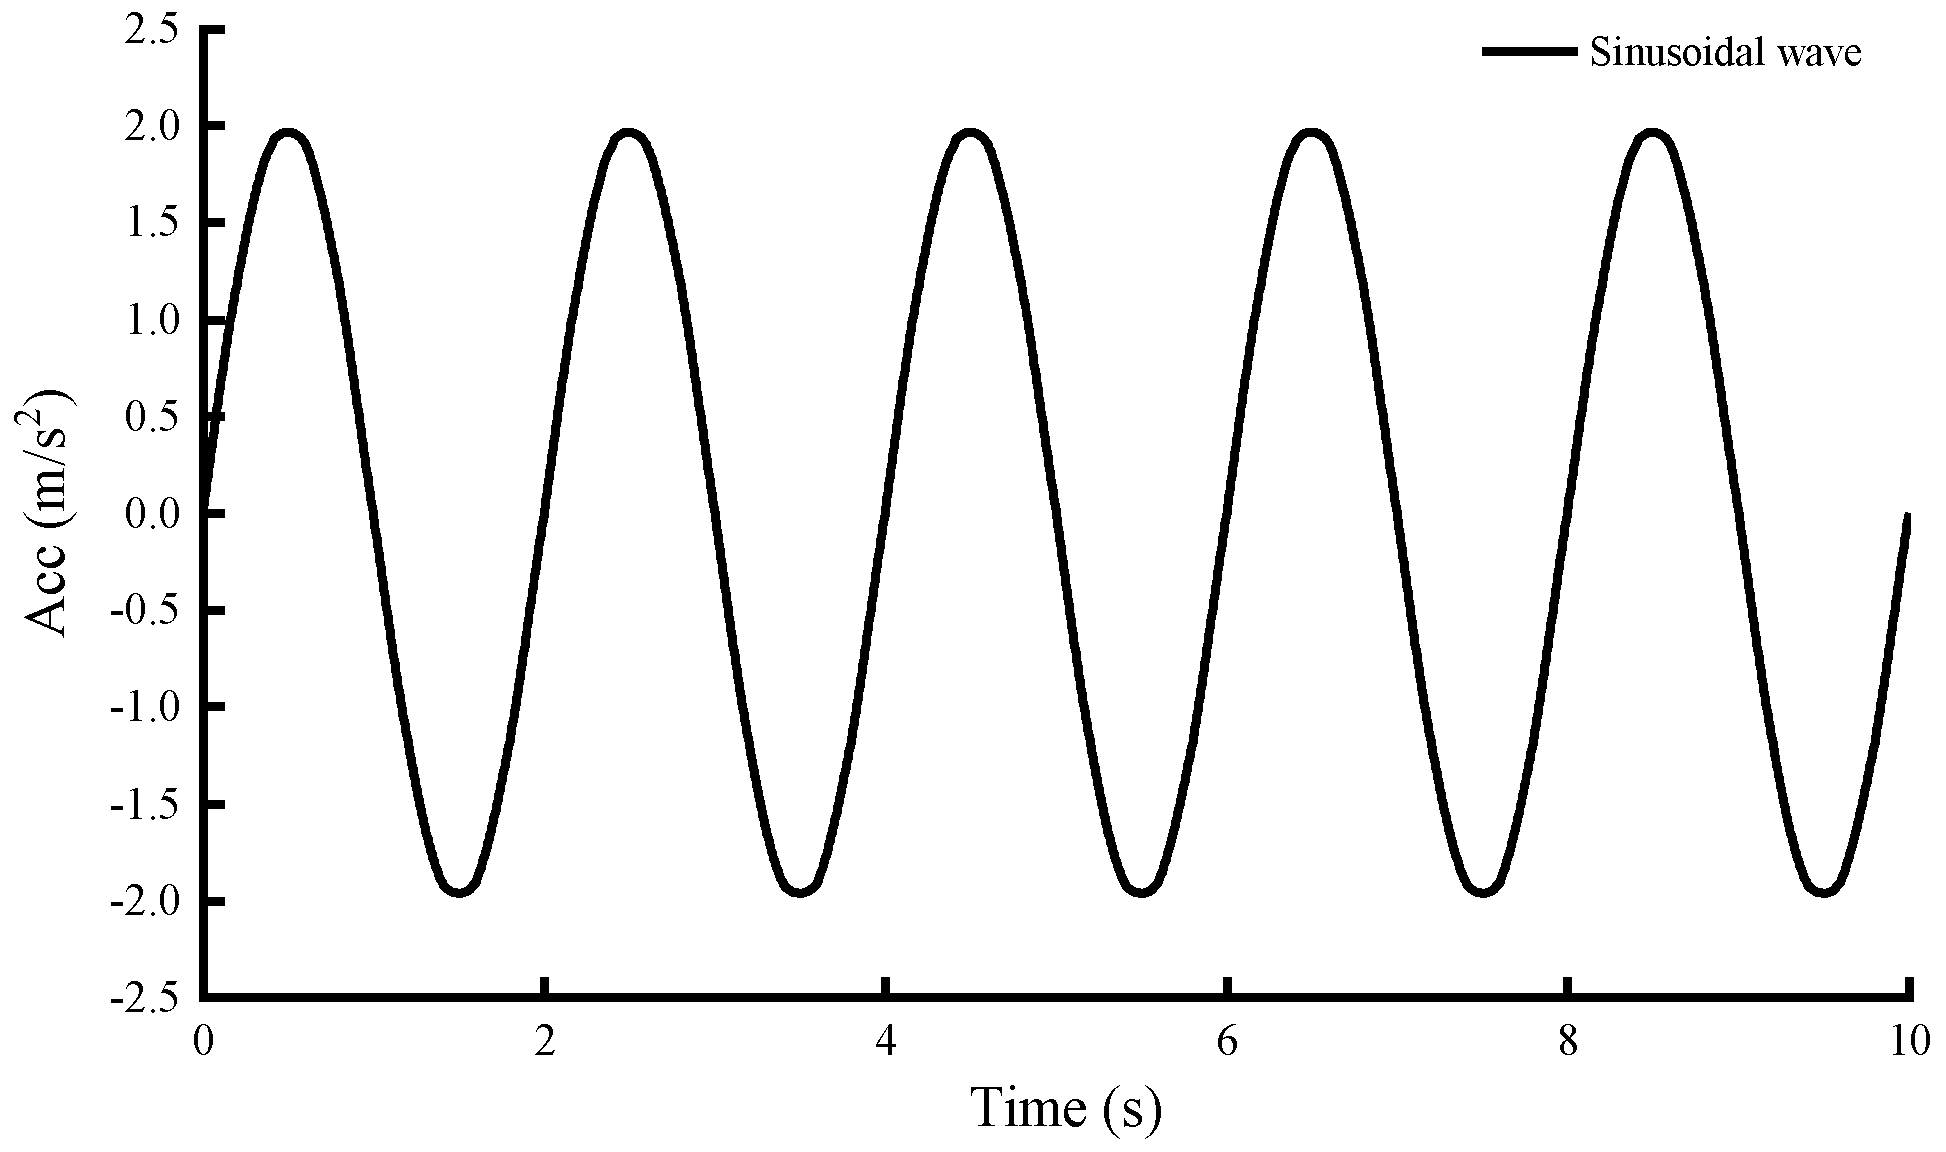
Figure 1, with a horizontal sinusoidal wave excitation applied at the base of the dam, as illustrated in
Figure 2. Constraints and acoustic impedance conditions are established for the free water surface, the water cutoff section, and the contact surface between the reservoir water and the dam. A comparative validation of the numerical simulation results against the Westergaard theoretical solution is conducted.
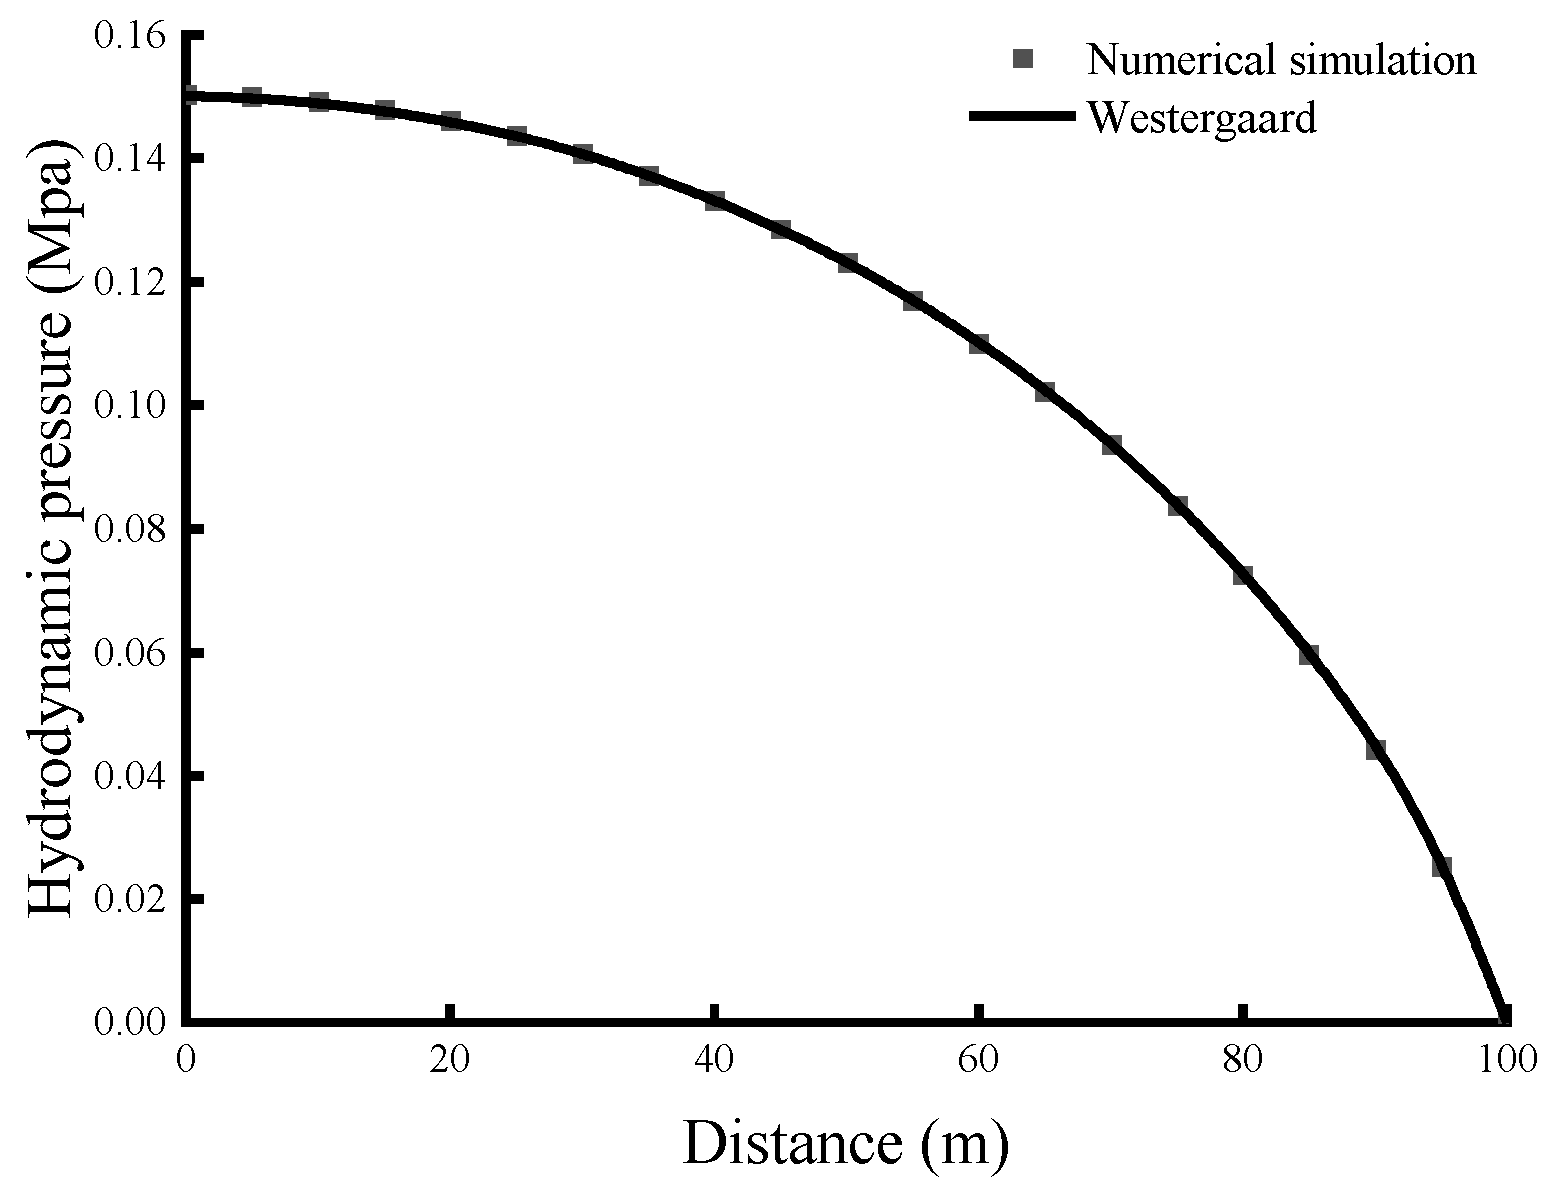
Figure 3 displays the maximum hydrodynamic pressure distributed along the dam face.
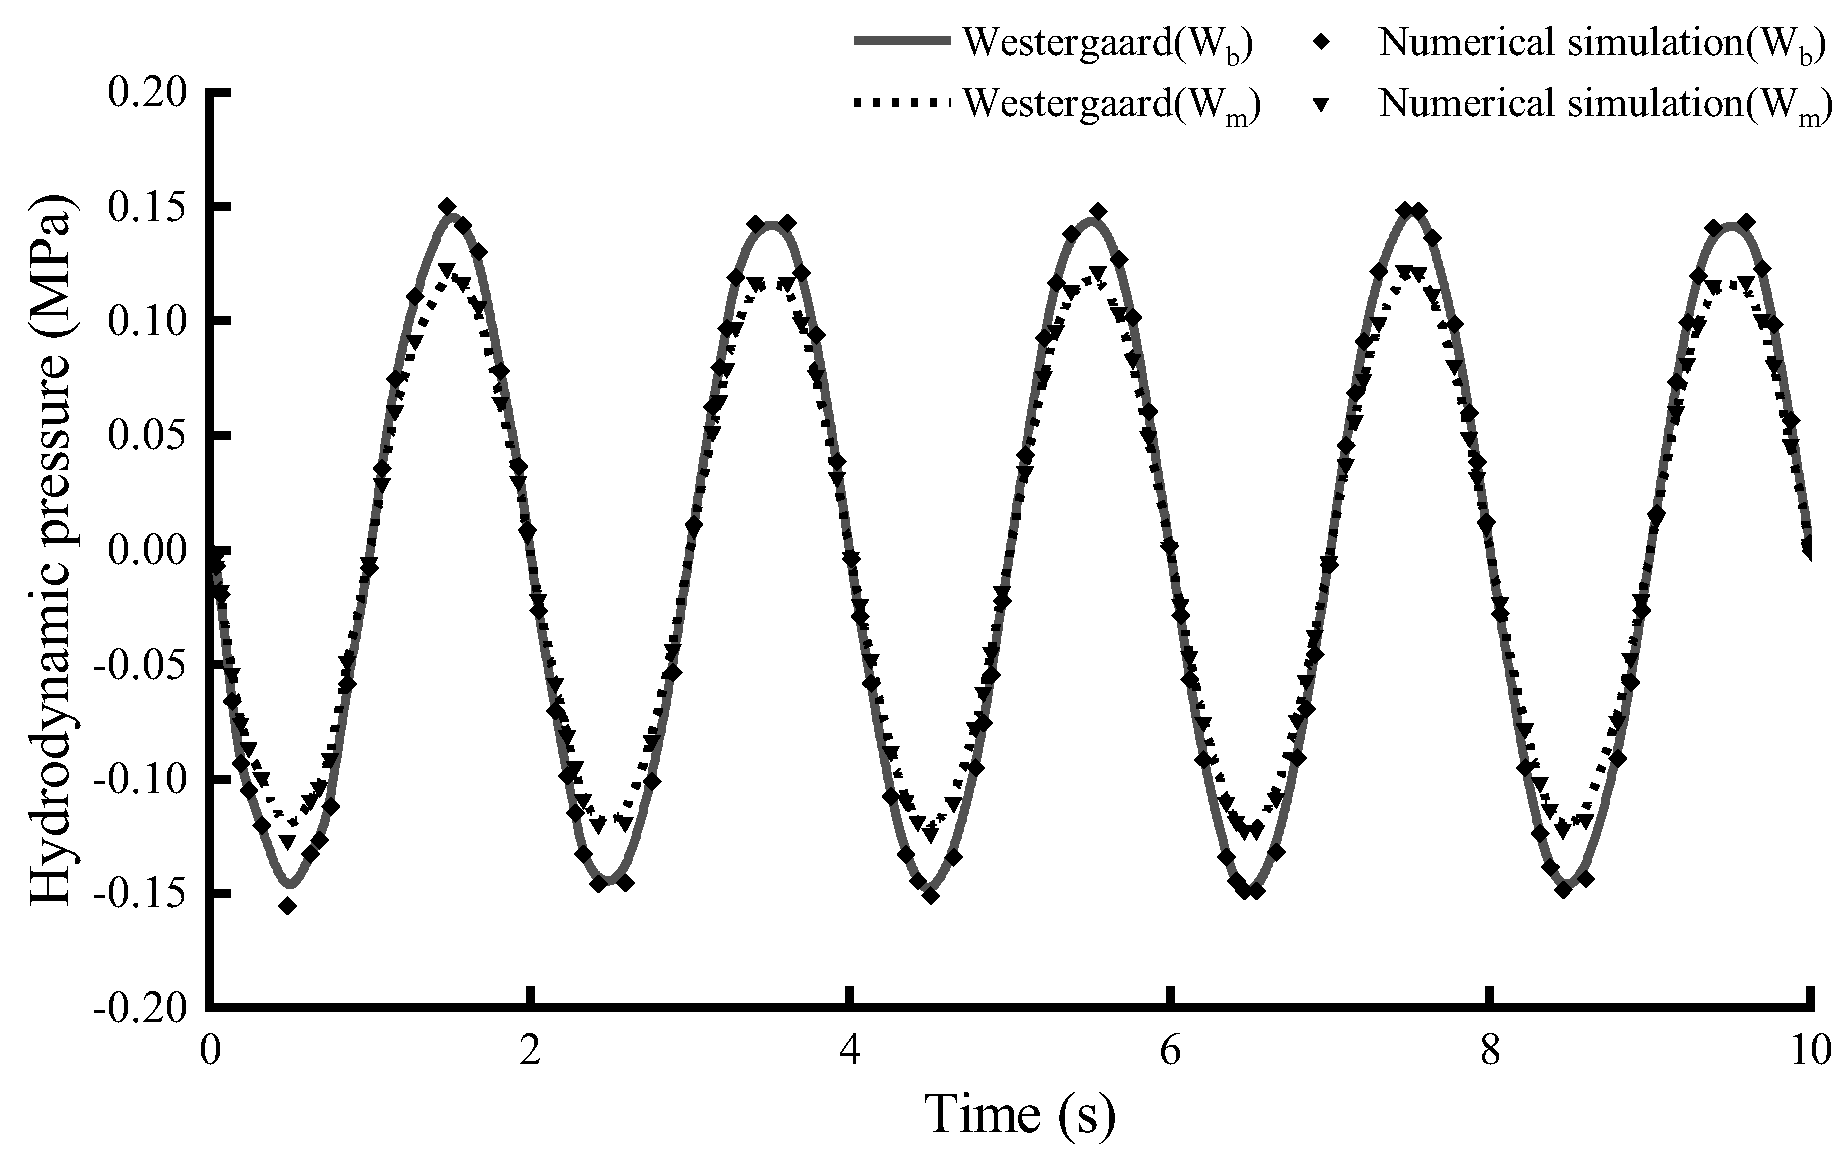
Figure 4 presents a comparison of the hydrodynamic pressure time history at the monitoring points W
b and W
m with the Westergaard analytical solution, which confirms the accuracy of the acoustic element in simulating water-structure dynamic interactions.
3. 3D Finite Element Simulation of River Water—Soil—Utility Tunnel Results
A 96.47 kilometers UT is constructing in the 13th Five-Year Plan period in Haikou, Hainan Province, China [
21], several utility tunnels are laid across river. Because of high seismic intensity in Haikou, It is necessary to assess the seismic damage risk for these utility tunnel across the river basin. Herein, a 3D FEA model is setup to simulate the seismic response of UT and explore the possible damage mechanism.
3.1. Geometric Parameters of the Finite Element Model
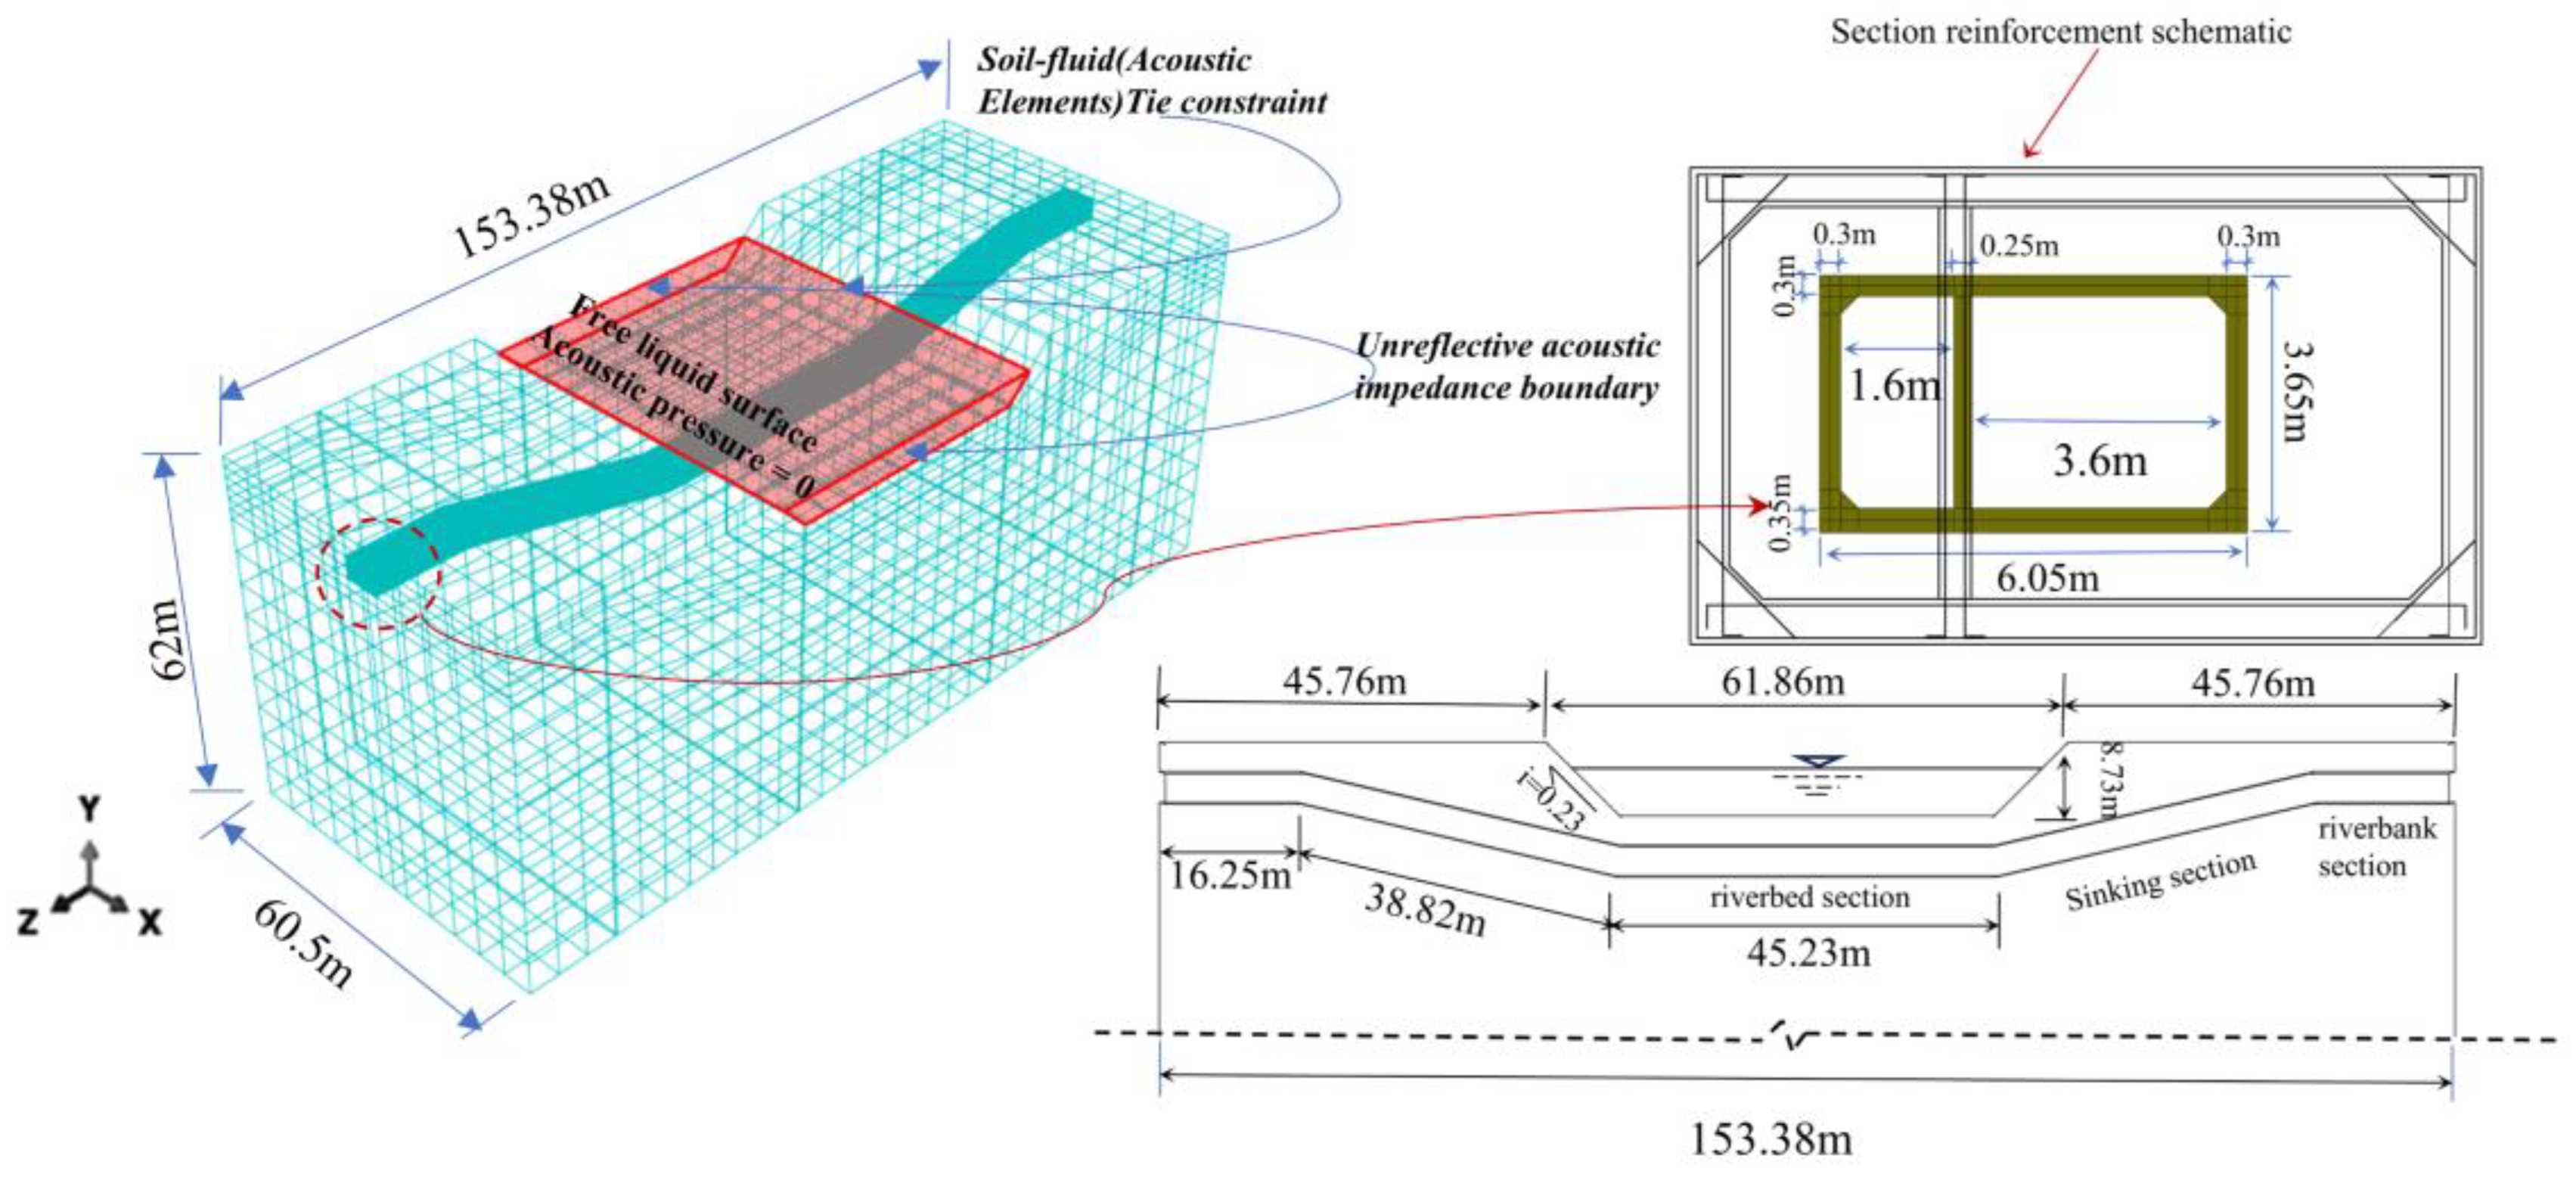
This paper focuses on a specific utility tunnel project in Haikou, China. On the platform of ABAQUS software, a coupled 3D model was established for a double-chamber cast-in-place concrete utility tunnel, soil, and river water. The tunnel is designed in an inverted siphon configuration, with a total axial length of 153.38 m. This includes a horizontal segment at the riverbed measuring 45.23 m and a 38.82 m segment across river bottom, with a cross-section width of 6.05 m and a height of 3.65 m. In the analysis of underground structures, the dimensions of the model and the surrounding soil significantly influence the finite element analysis results[
22], this study sets the soil parameters to a height of 62 m, a width of 60.5 m, and a length of 153.38 m to minimize the effects of size on the simulation outcomes. The river is 8.73 m deep, and the width of 44.4 m, and a span of 61.86 m. The initial water depth is set to half of the water level, and the river surface width is 53.13 m.
3.2. Material Properties, Mesh, and Contact Relationships
Most of the previous studies ignored the dynamic water pressure and the effect of water dissipation or simplified to consider the role of water gravity in studying the seismic response of structure across the river. but for tunnels, basements, buried pipelines, and other underground structures, the effect of seismic actions will lead to fluctuations in the dynamic pressure of the water, which will cause structural vibration, resonance, deformation, damage, leakage, and corrosion, and the role of water dissipation should not be ignored.[
23,
24,
25,
26]. On the basis of the validation of the relationship between acoustic-solid coupling and Westergaard's theoretical solution, the river water is considered as an acoustic medium for the simulation of the coupled fluid-solid interaction in this paper. The water density is 1000 kg/m³ and the bulk modulus is 2.04 GPa.
In ABAQUS, the contact surface between the river bank and the river water is constrained by a tie constraint. The ends of the river are set to plane wave reflection conditions, and the free water surface is assumed to have no relative pressure, with the acoustic pressure at the free surface of the river set to zero. The acoustic-structural coupling method is simple and efficient, assuming no material flow or mesh deformation within the model, with acoustic elements having only pressure degrees of freedom at each node. This significantly reduces the simulation computation time; however, due to the limitation of having only pressure degrees of freedom, it cannot represent the displacement changes of the river water[
27].
Soil-structure interaction is a key factor in seismic damage to underground structures. ABAQUS provides a modified Mohr-Coulomb elastoplastic model. This model addresses the convergence issues often encountered during the plasticity phase and has been widely applied in numerous geotechnical engineering. In this study, the soil is defined as a single-phase homogeneous medium, and the mechanical parameters are selected based on typical red clay from Hainan Province,
Table 1 presents the characteristics of these soil parameters. Considering both computational accuracy and efficiency, The soil mesh elements were refined along the UT perimeter and in the axial direction (Z-direction). A partition operation is applied to the soil to create a structured hexahedral mesh, with the mesh controlled by three-dimensional eight-node solid elements (C3D8R). During dynamic calculations, the element size must be chosen based on the input signal and the properties of the soil. The average element size used is less than the wavelengths of the lowest seismic wave velocity in the soil (λs=Vs/f)[
28], As shown in
Figure 5. The total soil is divided into 65416 linear hexahedral elements, 71325 nodes.
The utility tunnel is a cast-in-place concrete structure, modeled using the Concrete Damaged Plasticity (CDP) model in Abaqus, which is a continuous, plastic-based damage model for concrete. It is assumed that the two primary failure mechanisms are tensile cracking and compressive crushing of the concrete material. The tunnel model is meshed into a total of 4,774 elements (C3D8R). The reinforcement is modeled using an ideal elastoplastic constitutive model. The cross-sectional reinforcement of the tunnel are illustrated in
Figure 5. The element type is a two-node linear three-dimensional truss element (T3D2), with a global mesh size controlled to approximately 1.9, resulting in a total of 99,873 elements. The physical and material properties of the concrete and reinforcement is listed in
Table 2, and the compressive and tensile characteristics of the concrete is described in
Table 3, according to the Chinese Code for the Design of Concrete Structures [
29].
The contraction of tunnel and surrounding soil is modeled using the surface-to-surface contact element, where the primary surface is assigned to the outer surface of the tunnel and the slave surface to the surrounding soil. This contact relationship is based on penalty-based tangential behavior (with a friction coefficient of 0.3) and normal hard contact settings. The reinforcement is treated as embedded within the concrete tunnel.
3.3. Viscoelastic Boundaries and Seismic Waves
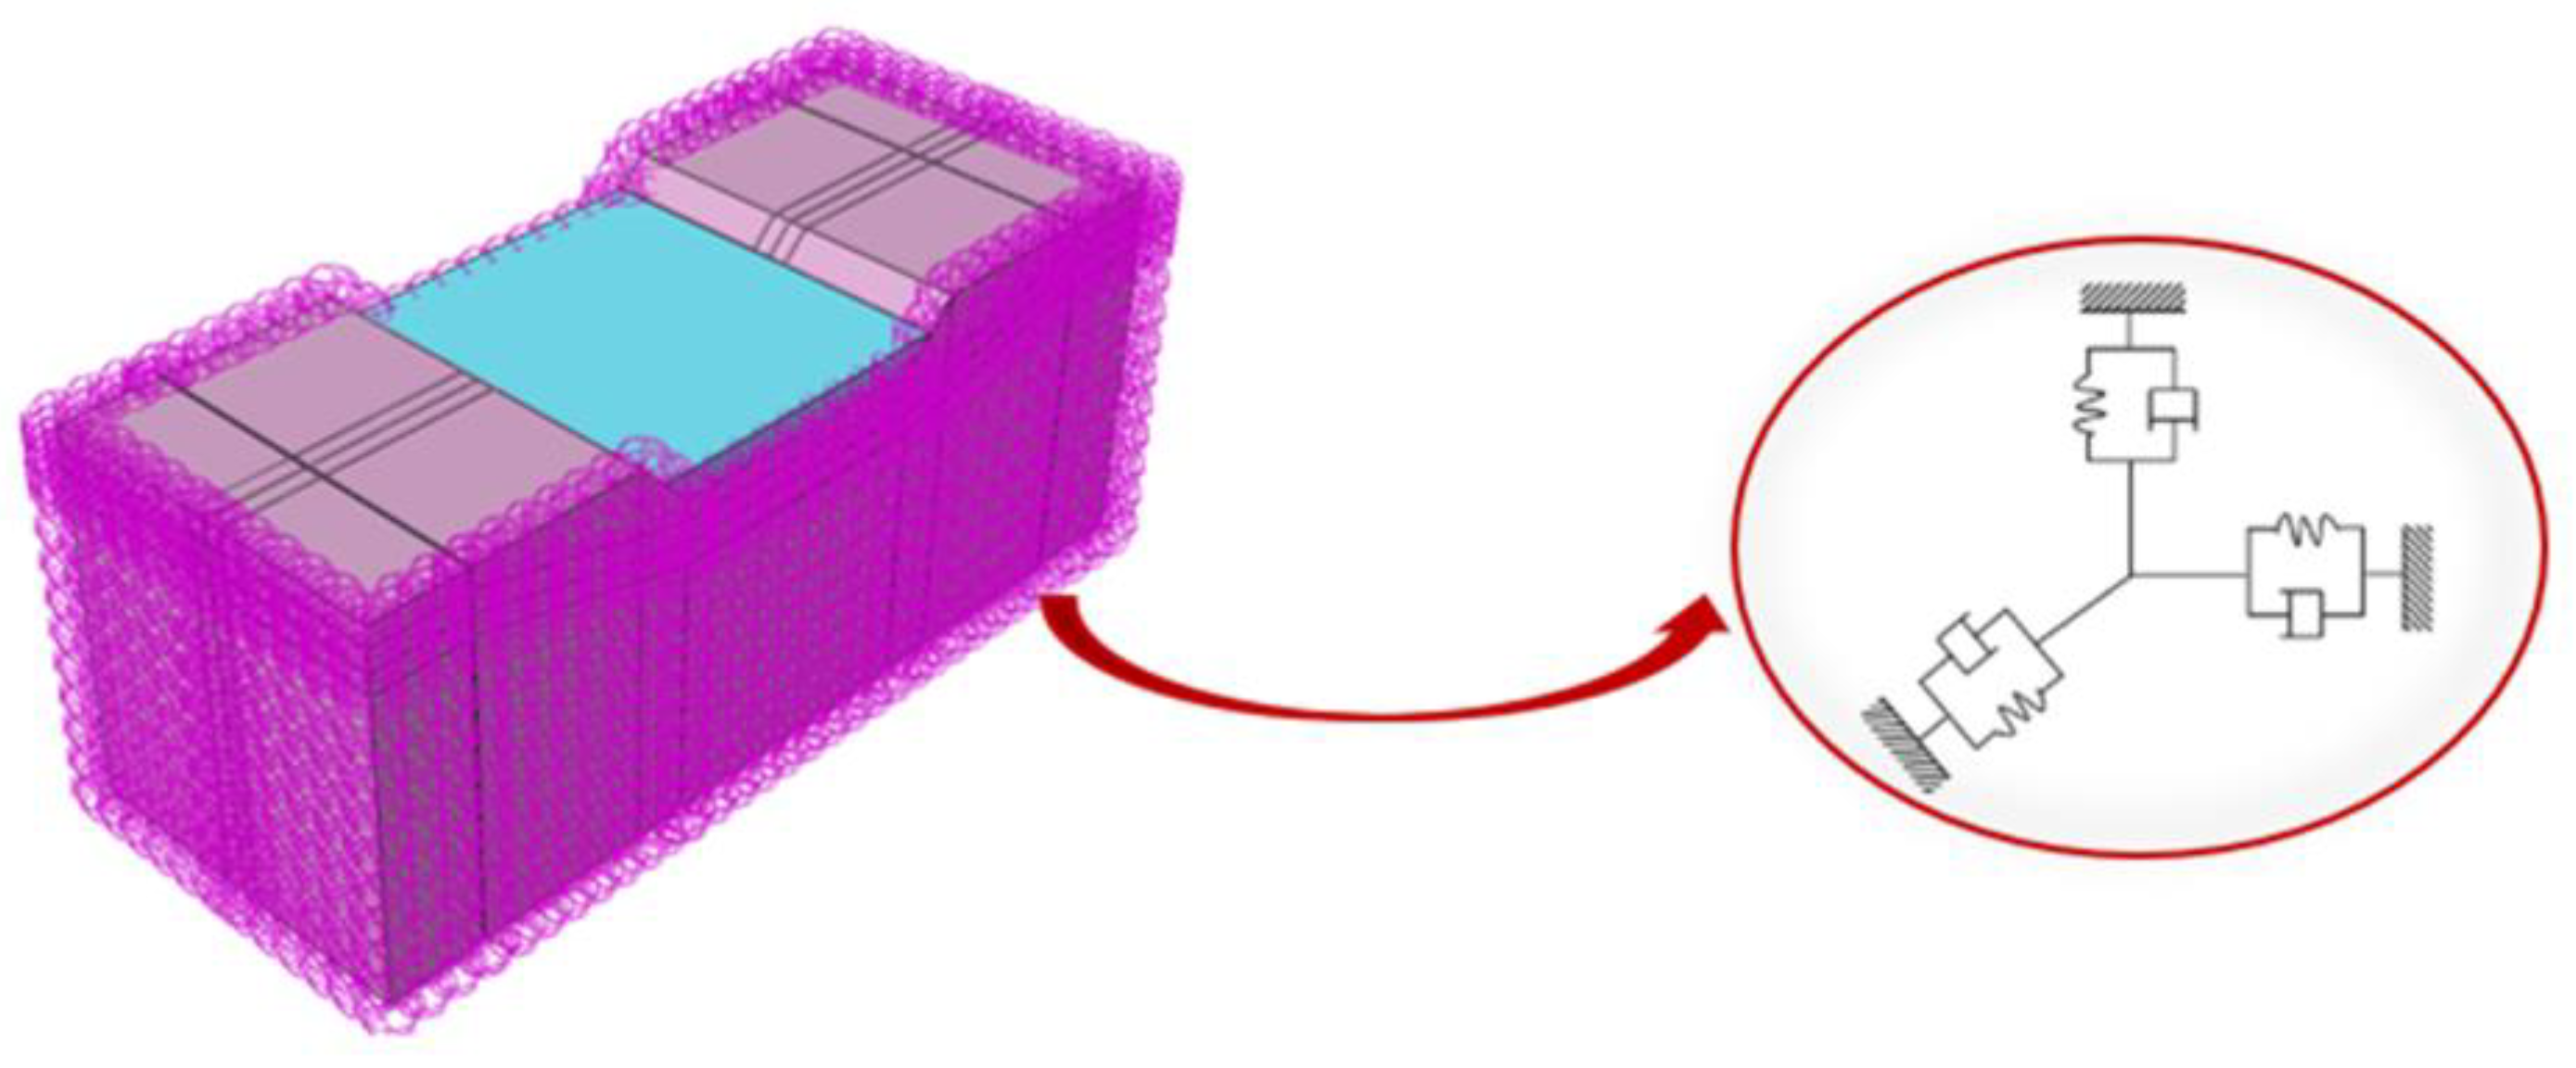
For a FEA model, a limited space is used to replace the infinite space based on artificial boundary element simulation to improve the calculation effect, However, seismic wave behavior often results in reflection phenomena on the assumption boundaries, which makes difficult to accurately simulate the propagation of seismic waves to infinity. The viscoelastic artificial boundary is implemented by placing springs and dampers in three directions at the boundary nodes. The viscoelastic artificial boundary can absorb seismic reflected waves and simulate the elastic recovery capability of the foundation, The stiffness and damping coefficients of the springs are as follows [
30]:
Here, and is the damping coefficients in the normal and tangential directions, respectively, and and is the springs' normal and tangential stiffness coefficients, respectively. The density of the medium is ; the Lame constants of the medium are represented by ; the shear modulus is symbolized by ; the velocities of the compressional and shear waves are represented by and , respectively; and the distance between the geometric center of the subterranean structure and the artificial boundary point or surface is indicated by . For parameters and , the suggested values are 0.8 and 1.1, respectively.
Figure 6.
Finite element model with viscoelastic boundary.
Figure 6.
Finite element model with viscoelastic boundary.
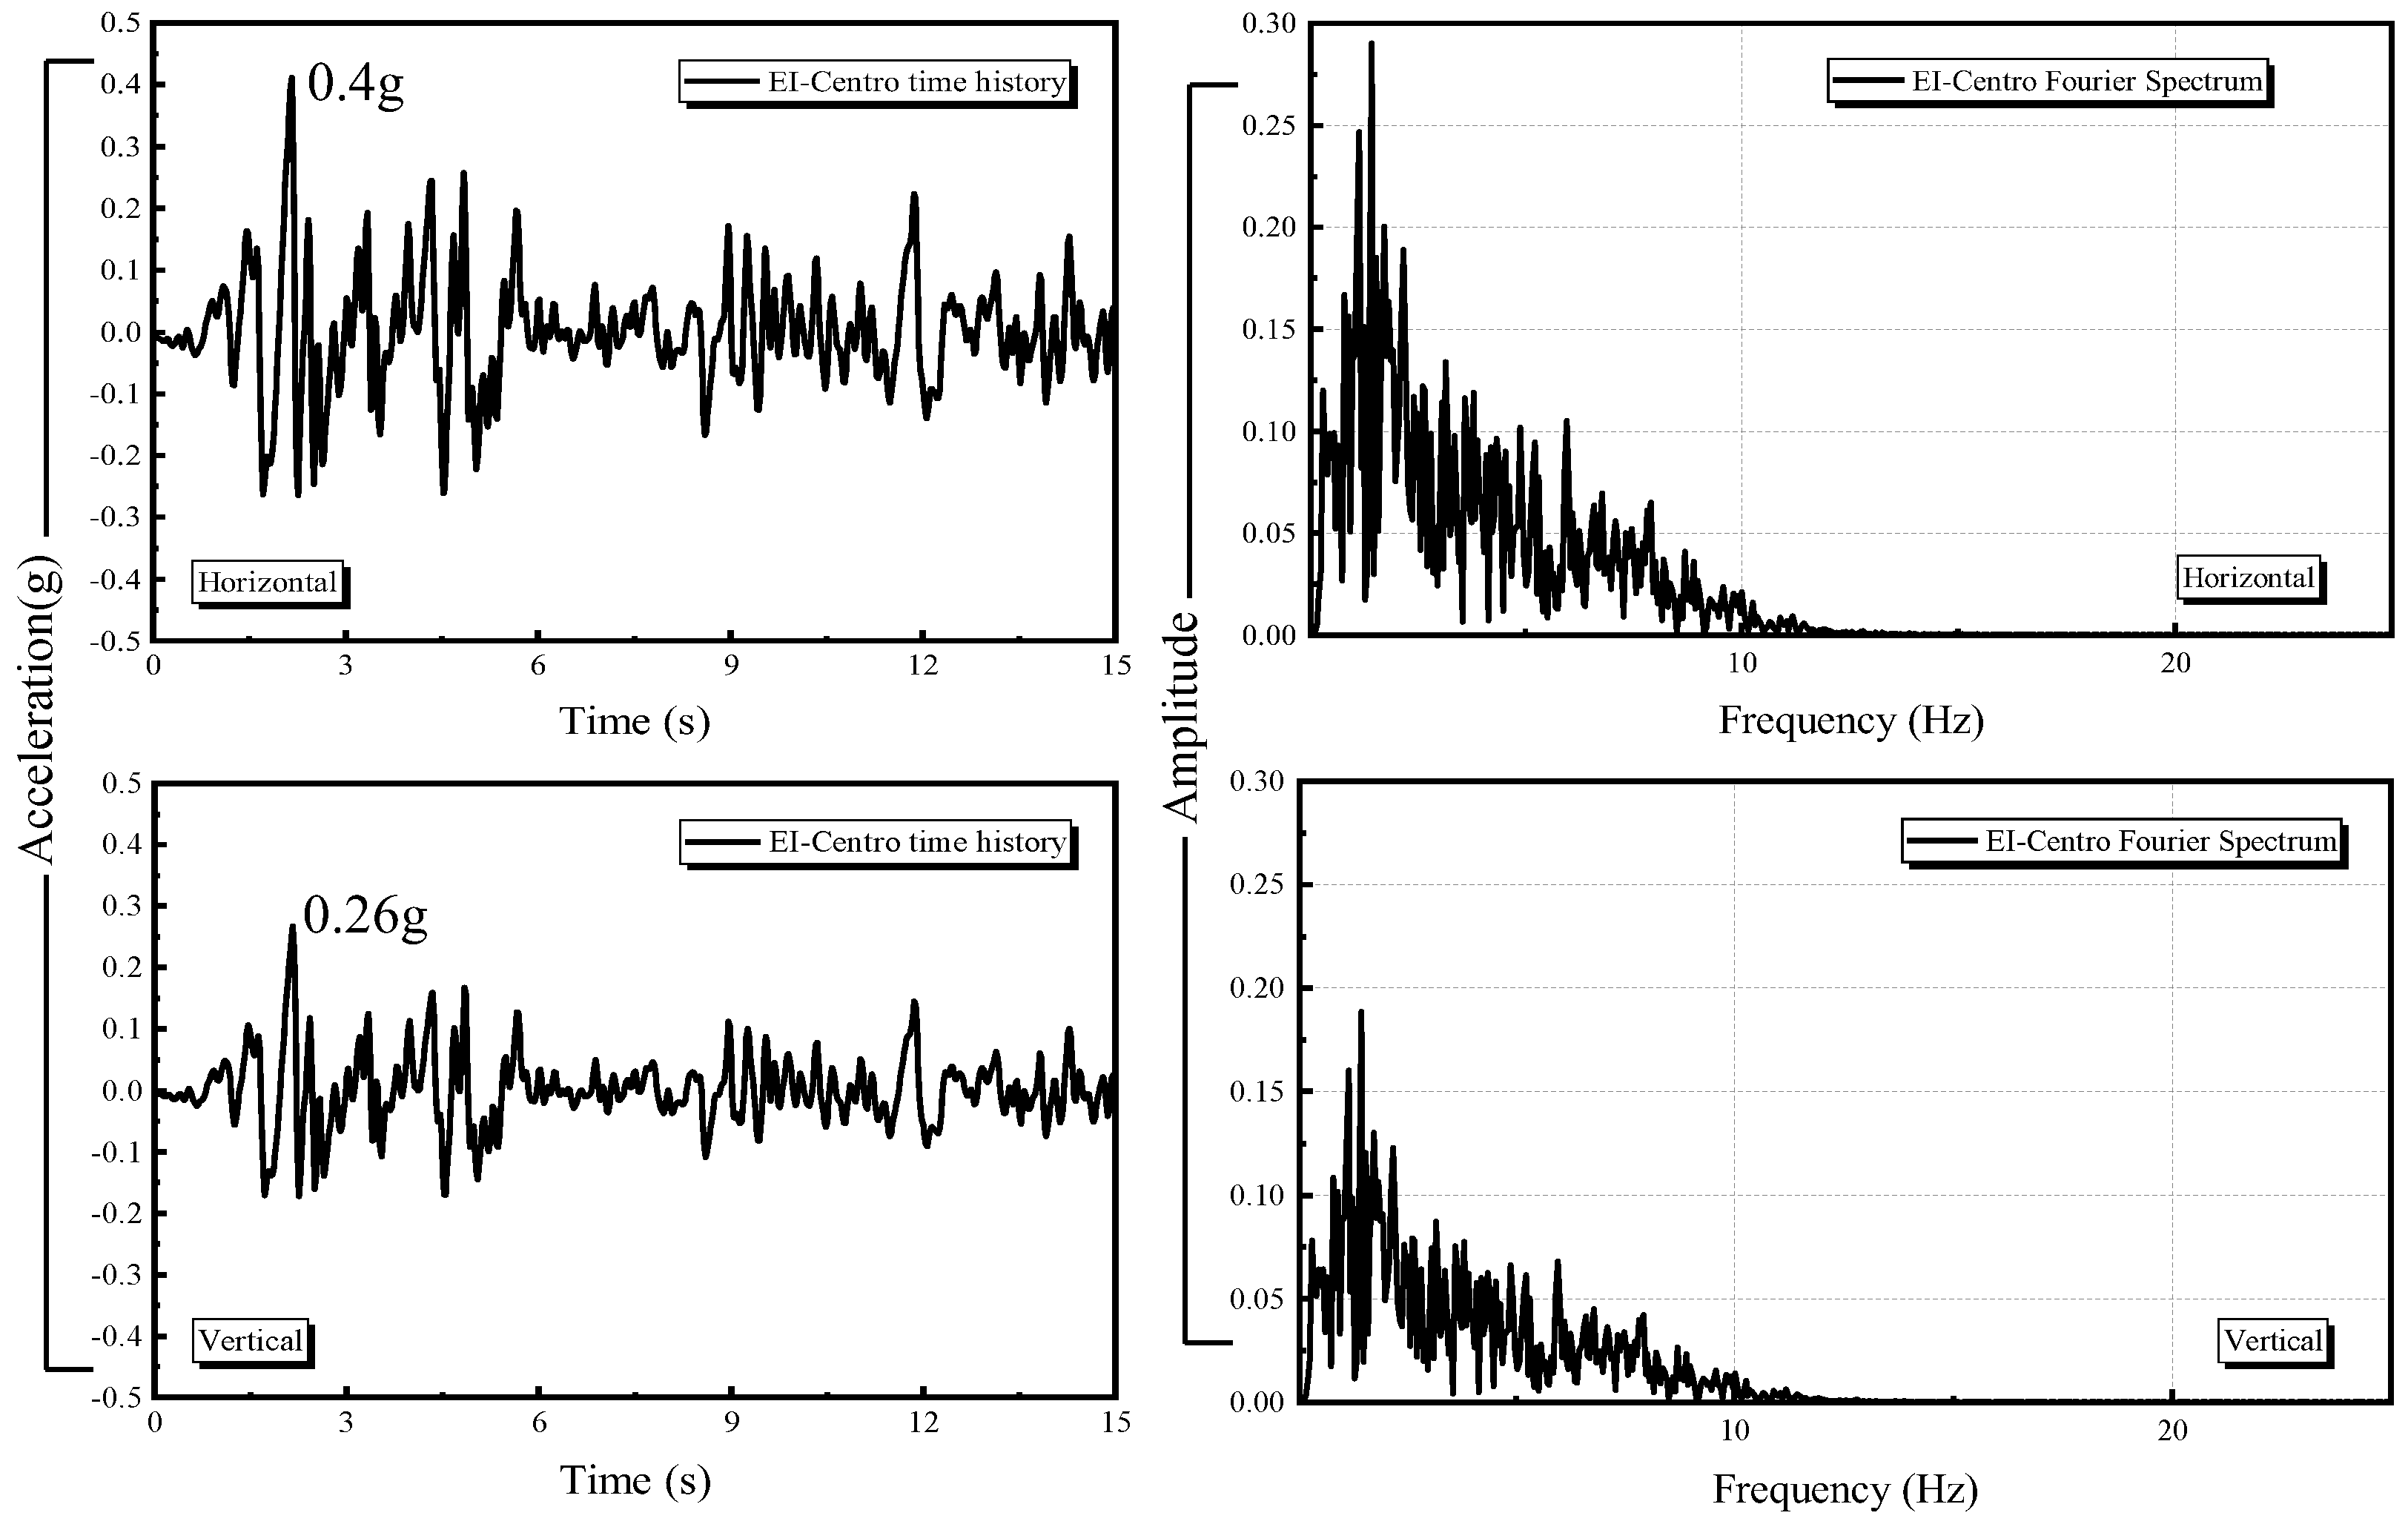
According to the seismic hazard zoning map of China, the seismic intensity in Haikou is bigger than Ⅷ and the seismic acceleration peak value of 0.3g[
31]. For UT, it is often designed to resist the Ⅸ intensity because of its importance for maintence the lifeline system safety. For utility tunnels under rivers, the hydrodynamic pressure fluctuations caused by ground motions in the transversal direction of river during an earthquake are greater than that in water flowing direction, and having been clearly observed in past earthquakes, the flowing direction can be regarded as an infinite flow domain in this paper.
Figure 7.
Acceleration time history curve of seismic motion.
Figure 7.
Acceleration time history curve of seismic motion.
In order to simulate the effects of near-field earthquakes, the first 15 seconds of seismic waves of the 1940 El Centro earthquake were used in this study. seismic waves are vertically inputted on the bottom of the soil body as equivalent nodal forces.[
32,
33]. For irregular subsurface structures, it is desirable to calculate both transverse and vertical horizontal seismic effects[
34], therefore, the effects of transverse (horizontal) and combined transverse + vertical seismic motions are discussed in this paper.
3.4. Condition Settings
In this model, three different river water volume are assumpted in the river: no water, half-full water and full water in river, corresponding to the dry season, normal flow period, and flood condition, respectively. Since the direction of seismic excitation directly affects the buried utility tunnels and hydrodynamic pressure, analyses were conducted using both unidirectional and bidirectional seismic waves. It should be noted that, unidirectional seismic input refers to transverse (horizontal) seismic motion, while bidirectional seismic input refers to the combination of transverse and vertical seismic motions.
Table 4.
Site conditions of models.
Table 4.
Site conditions of models.
| Site conditions |
Seismic excitation direction |
River water level |
| 1 |
One-way excitation
(Horizontal) |
Dry season(0m) |
| 2 |
Half water level(4.365m) |
| 3 |
Full water level(8.73m) |
| 4 |
Two-way excitation
(Horizontal+Vertical) |
Dry season(0m) |
| 5 |
Half water level(4.365m) |
| 6 |
Full water level(8.73m) |
4. Results Analysis of Simulation Based on ABAQUS
4.1. Acceleration Analysis
Previous global seismic damage has shown that site effects have severe impacts on structures[
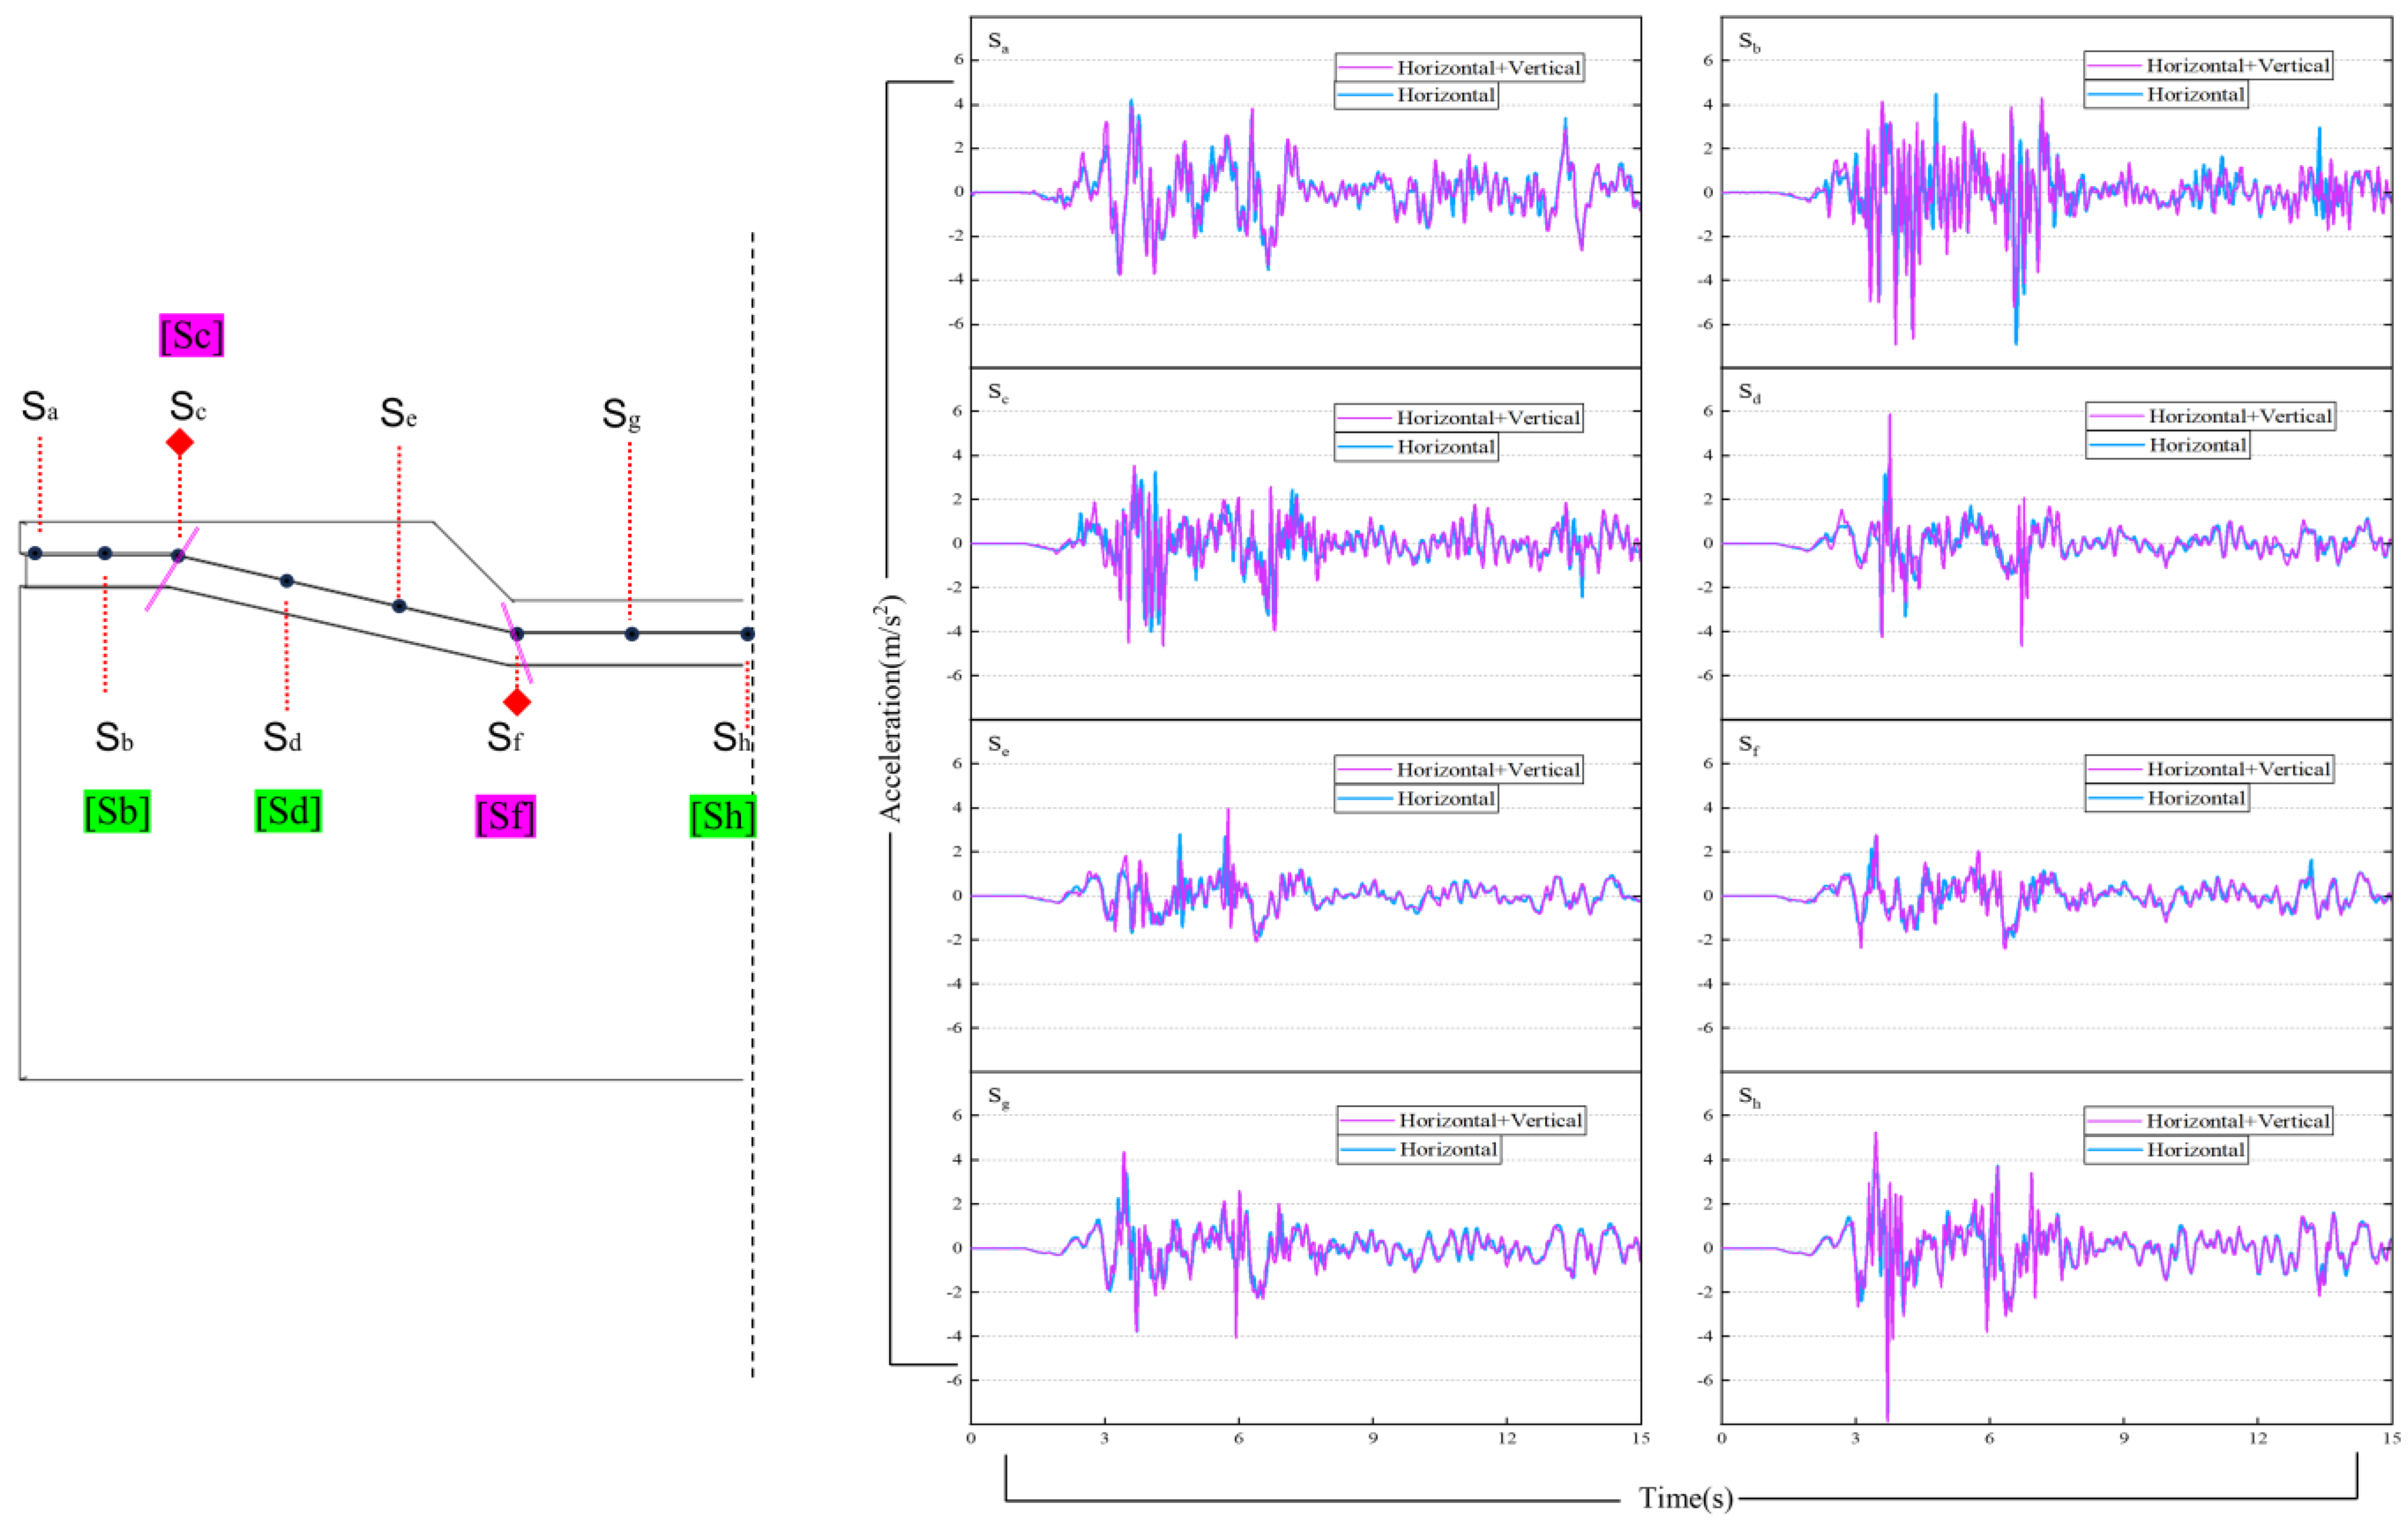
35]. For structures crossing the river, the seismic amplification effect caused by the topography of river basin cannot be ignored. To investigate this site effect and hydrodynamic pressure fluctuations due to seismic action on the lower utility tunnels, eight monitoring points (S
a, S
b, S
c, S
d, S
e, S
f, S
g, S
h) are arranged along the mid-section at the top of utility tunnel's in soil in (
Figure 8).
Figure 8 shows the time history of horizontal acceleration at various points during the dry season(with no hydrodynamic pressure influence). It can be seen that the amplitude of the acceleration history response curves varies from one monitoring point to another, and the peak acceleration at some monitoring points is greater than 3.92 m/s
2, indicating that the acceleration of the soil around the utility tunnels is affected by acceleration amplification effect. The peak acceleration and the peak acceleration amplification factors at each monitoring point under no hydrodynamic pressure influence is listed in
Table 5. Due to the topography effect, Large acceleration amplification are observed at the mid-section of the utility tunnel located in the horizontal riverbank section, the sinking section, and the riverbed horizontal section. Regardless of whether subjected to unidirectional or bidirectional seismic excitation, an amplification effect of acceleration is concentrated in the middle of the river, with the peak acceleration amplification factors of 1.93 and 1.95 occurring at the S
h point in the center of the river. When water is present in the river channel, the fluctuations of hydrodynamic pressure under seismic excitation and their interaction with the surrounding riverbank soil significantly affect the acceleration response characteristics of the soil around the utility tunnel.
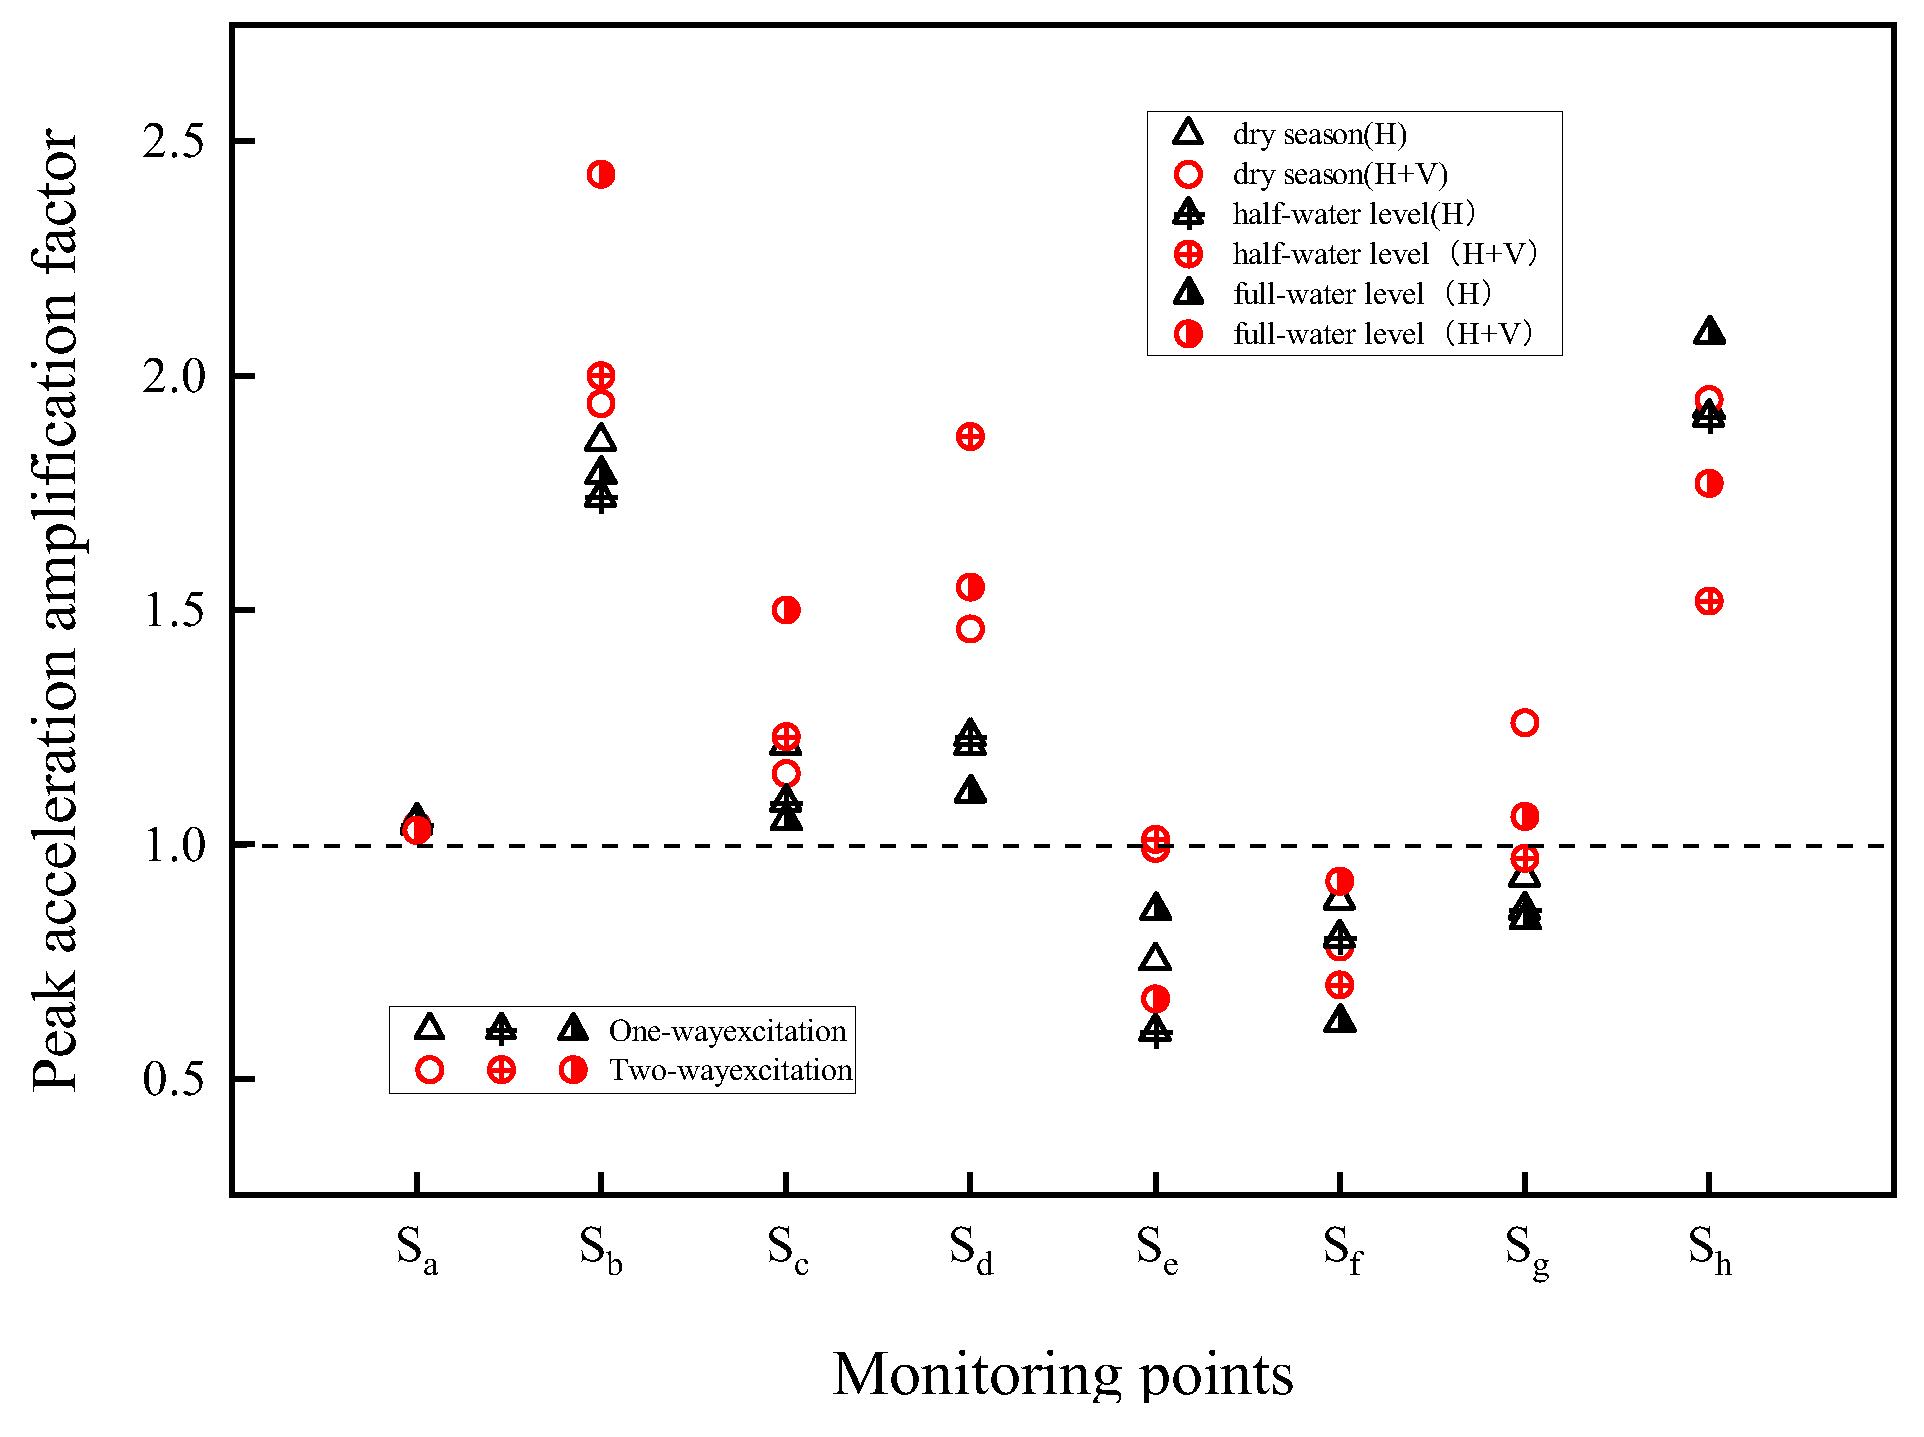
Figure 9 shows the peak acceleration amplification coefficients at each monitoring point under different seismic excitation directions and water level changes in the river channel. The acceleration response near the river channel is affected by the more obvious water level changes, and the peak acceleration amplification coefficients at the junction location of the river bank and the river bed, point S
f, under unidirectional seismic effects are 0.88, 0.8, and 0.62 under the conditions of no-water, half-water, and full-water, respectively, indicating that there is a decreasing trend of acceleration amplification coefficient at this point with the rise of water level, and point S
h at the centre shows the opposite. The maximum peak acceleration amplification coefficients at points S
g and S
h under bi-directional seismic excitation occur under the no-water condition, and the peak acceleration values at the monitoring points at the riverbank location are larger than those under the no-water condition at the half-water and full-water conditions.
The direction of seismic excitation has a significant effect on the peak acceleration at the monitoring point, and the amplification factor of the peak acceleration is higher in the case of bidirectional seismic excitation than in the case of unidirectional seismic excitation. This is different at the central monitoring site Sh, which may be related to the unpredictable and complex scattering of seismic waves within the flow field.
4.2. Influence of the Direction of Seismic Excitation
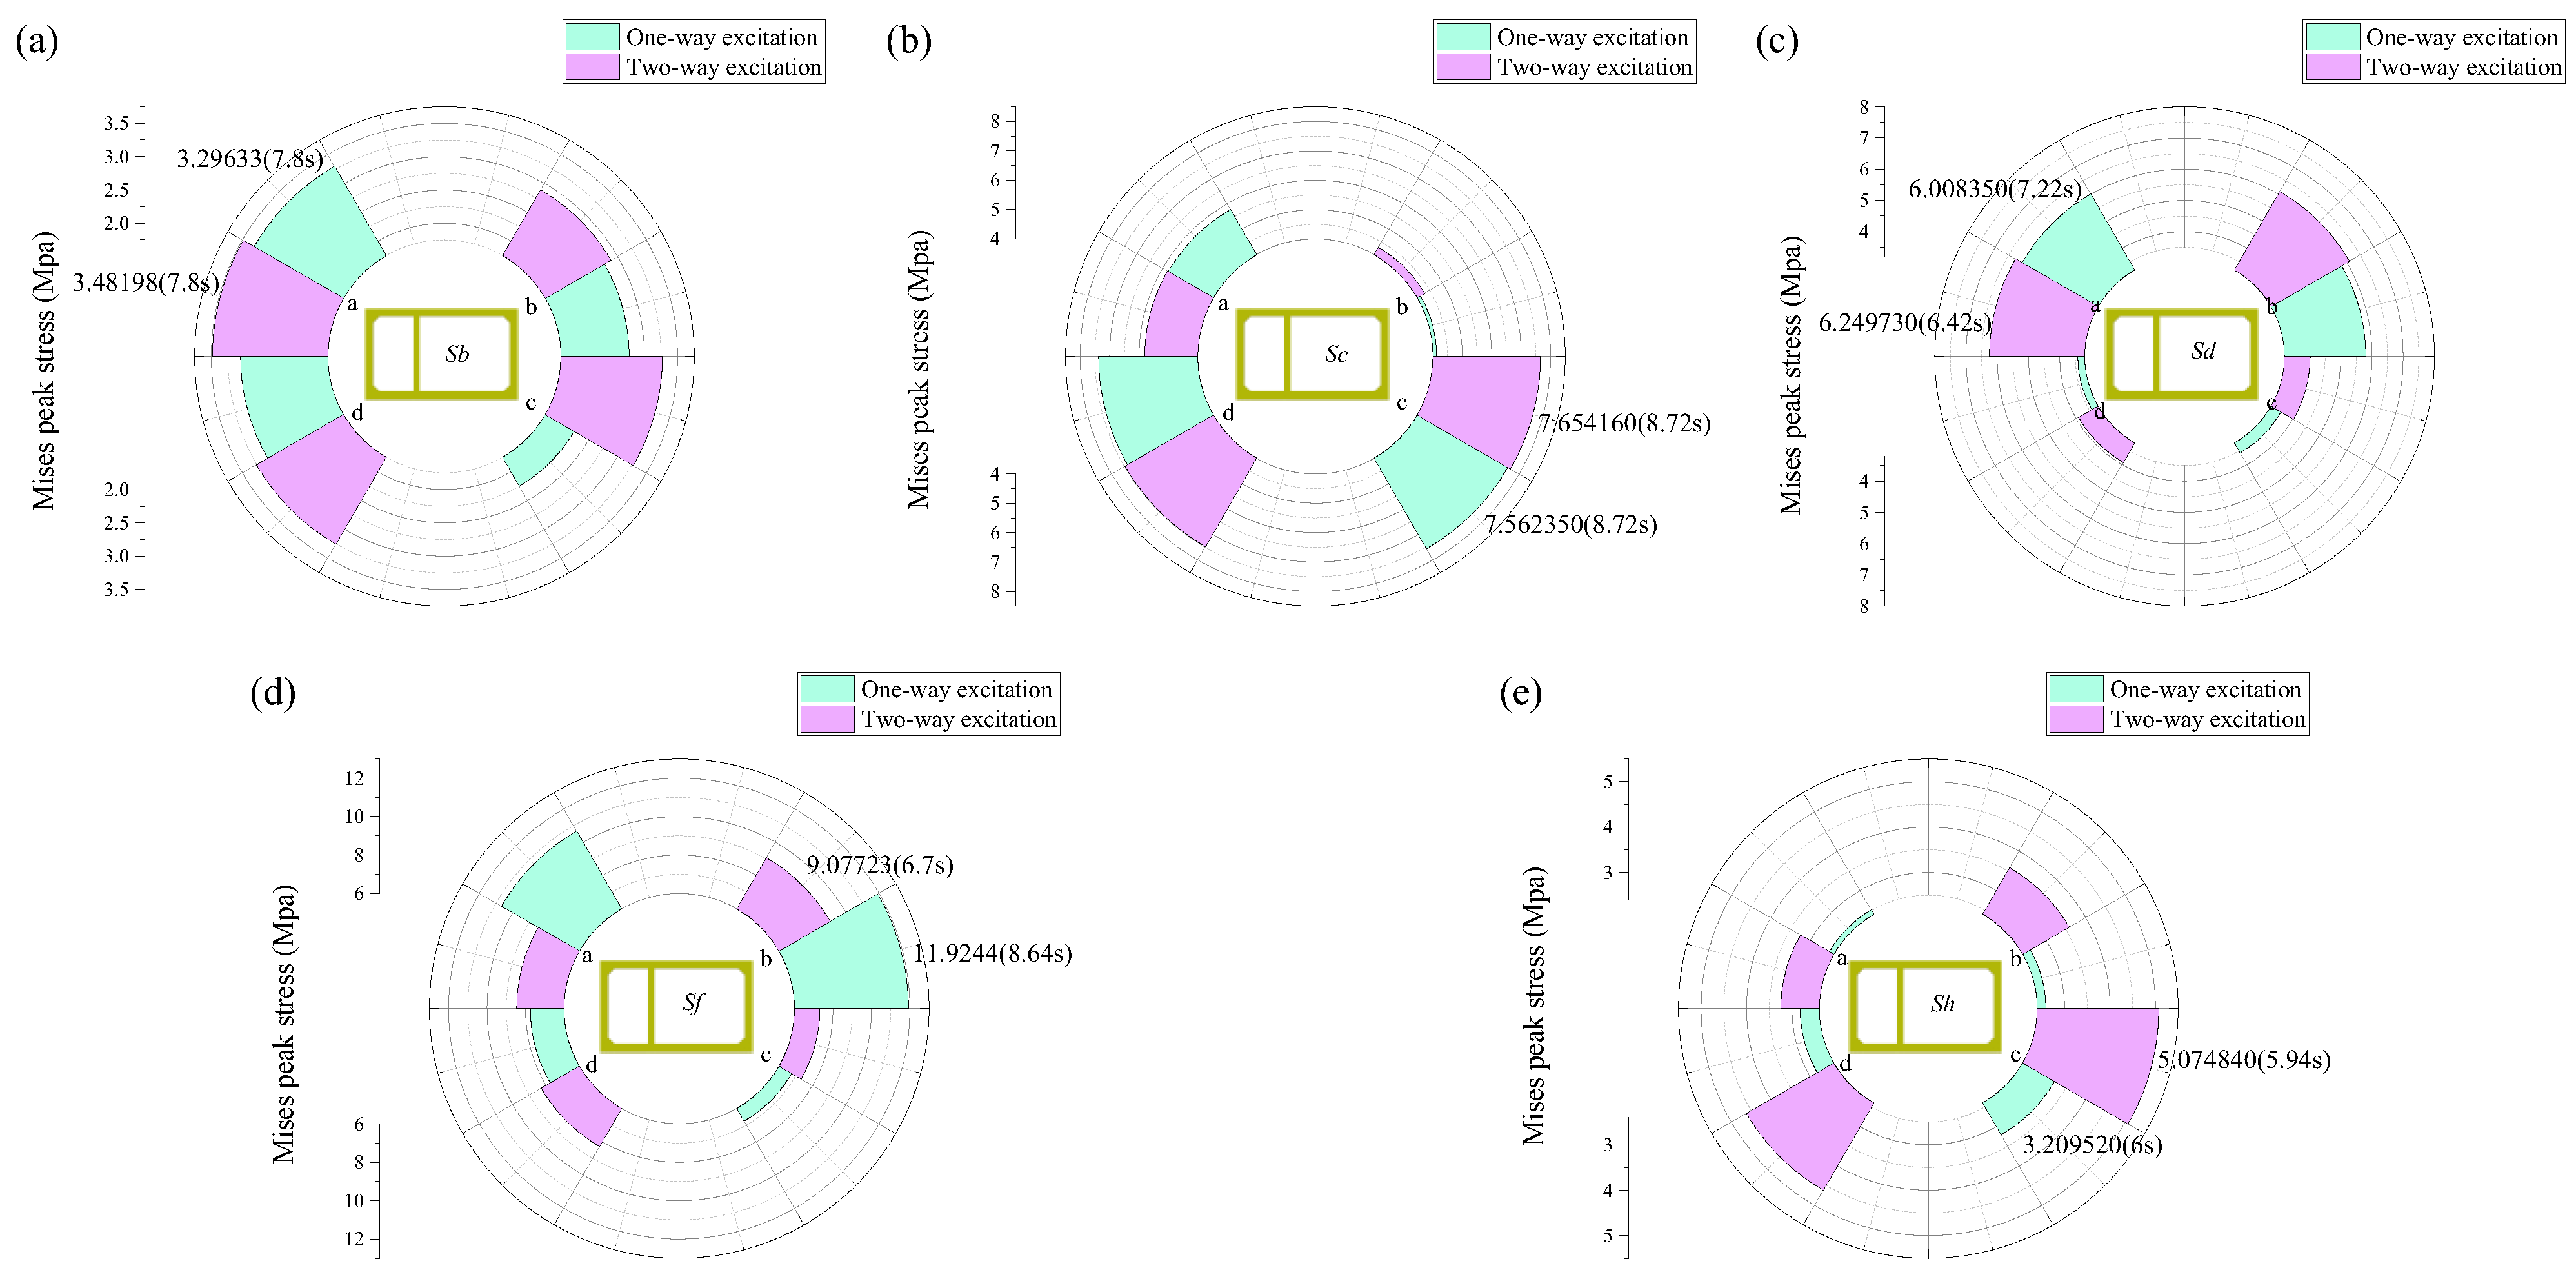
Herein, the paper takes the half-full water body condition of the river as an example to investigate the impact of seismic excitation direction on the river-crossing section of the utility tunnel. seismic waves are input into the model soil at the base, Sb, Sc, Sd, Sf, and Sh are established at the utility tunnel cross-section,points a, b, c, and d are positioned at the four corners of the reference sections. The reference section Sc represents the junction between the horizontal riverbank section and the sinking section. The reference section Sf marks the boundary between the sinking section and the horizontal riverbed section, while the reference section Sh is located at the midpoint of the horizontal riverbed section, As shown in
Figure 8.
Figure 10 illustrates the peak Mises stress at the vertices a, b, c, and d section. It is evident that the peak Mises stress under bidirectional earthquake excitation (
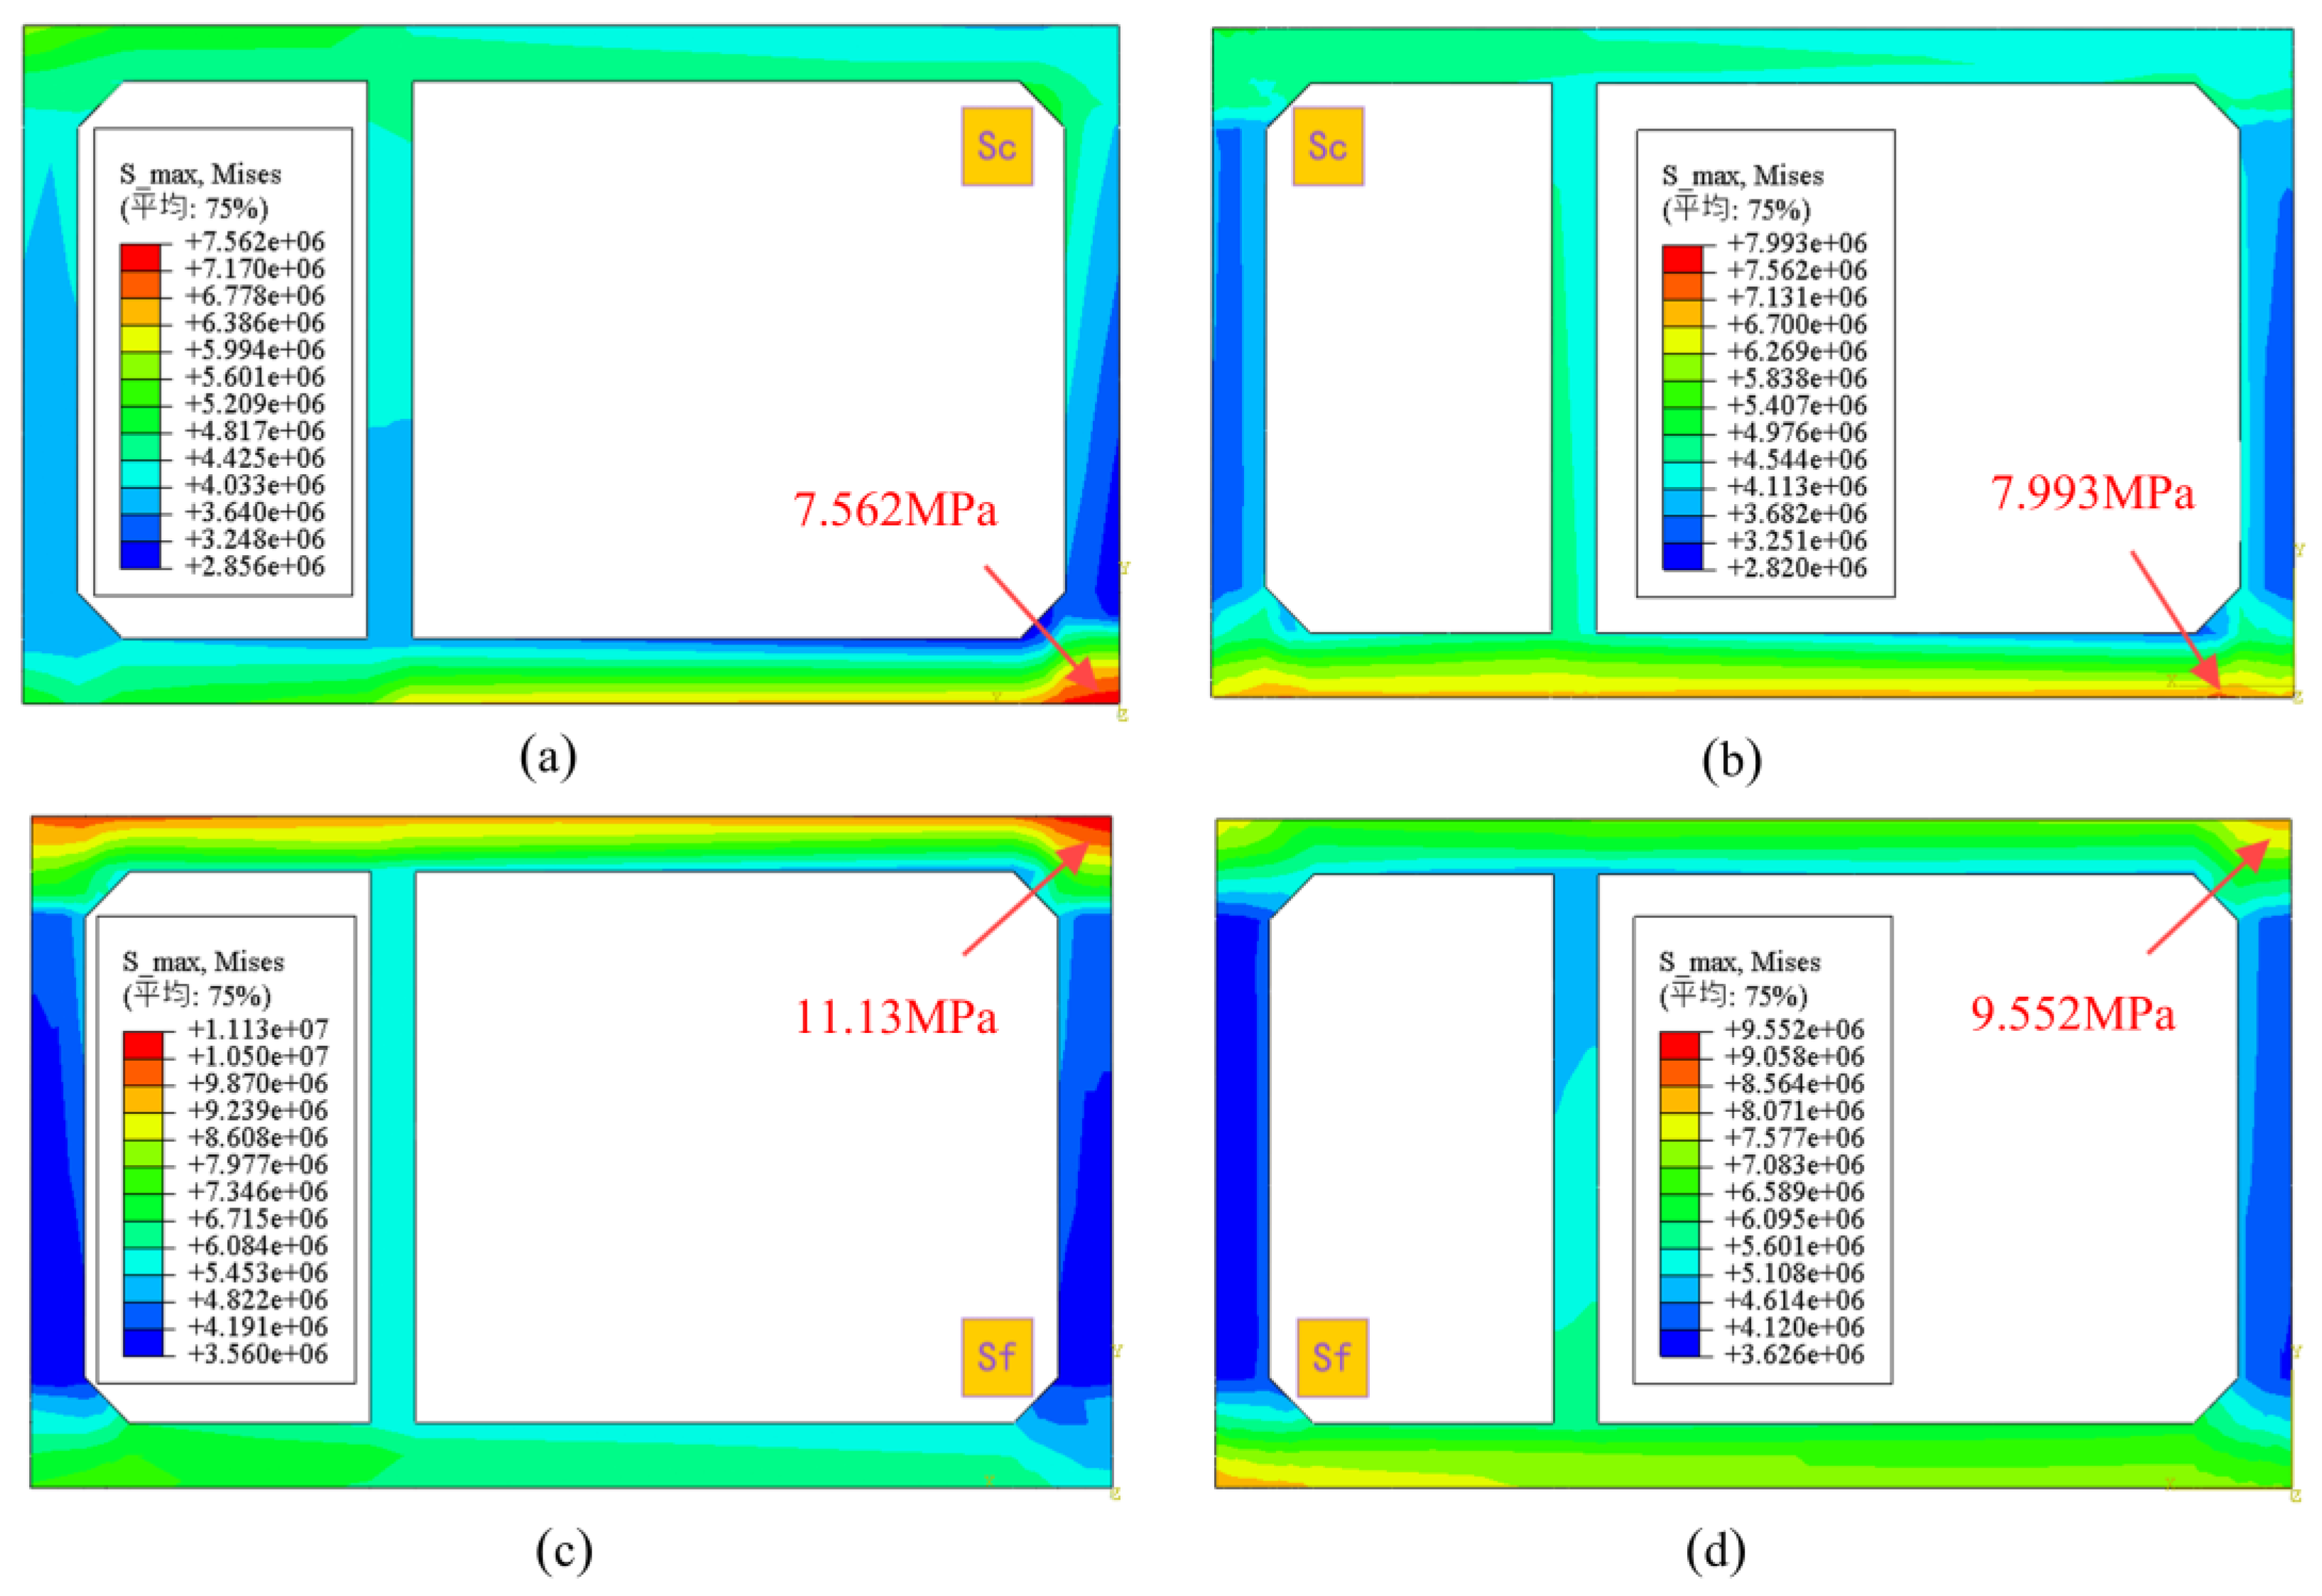
Figure 10 (a), (b), (c), (e)) is greater than that under unidirectional input, particularly in the middle of the horizontal riverbed section of the utility tunnel. Notably, regardless of whether the excitation is unidirectional or bidirectional, it can be observed that at the section Sc, located at the junction of the horizontal riverbank section and the sinking section, the Mises peak stress at the bottom points c and d is significantly greater than at the top reference points a and b, All over 50%. Conversely, at the Sf section, which encompasses the sinking section and the horizontal riverbed section, this trend is reversed. This indicates that under the influence of seismic forces, the utility tunnel, experiences greater forces at the bottom where the horizontal riverbank section transitions to the sinking section. In contrast, at the junction between the sinking section and the horizontal riverbed section, the UT bears the greater forces, To further analysis stress characteristic in UT,
Figure 11 shows the Mises stress cloud at the Sc and Sf sections a more intuitive observation of the stress distribution at the junctions under seismic loading.
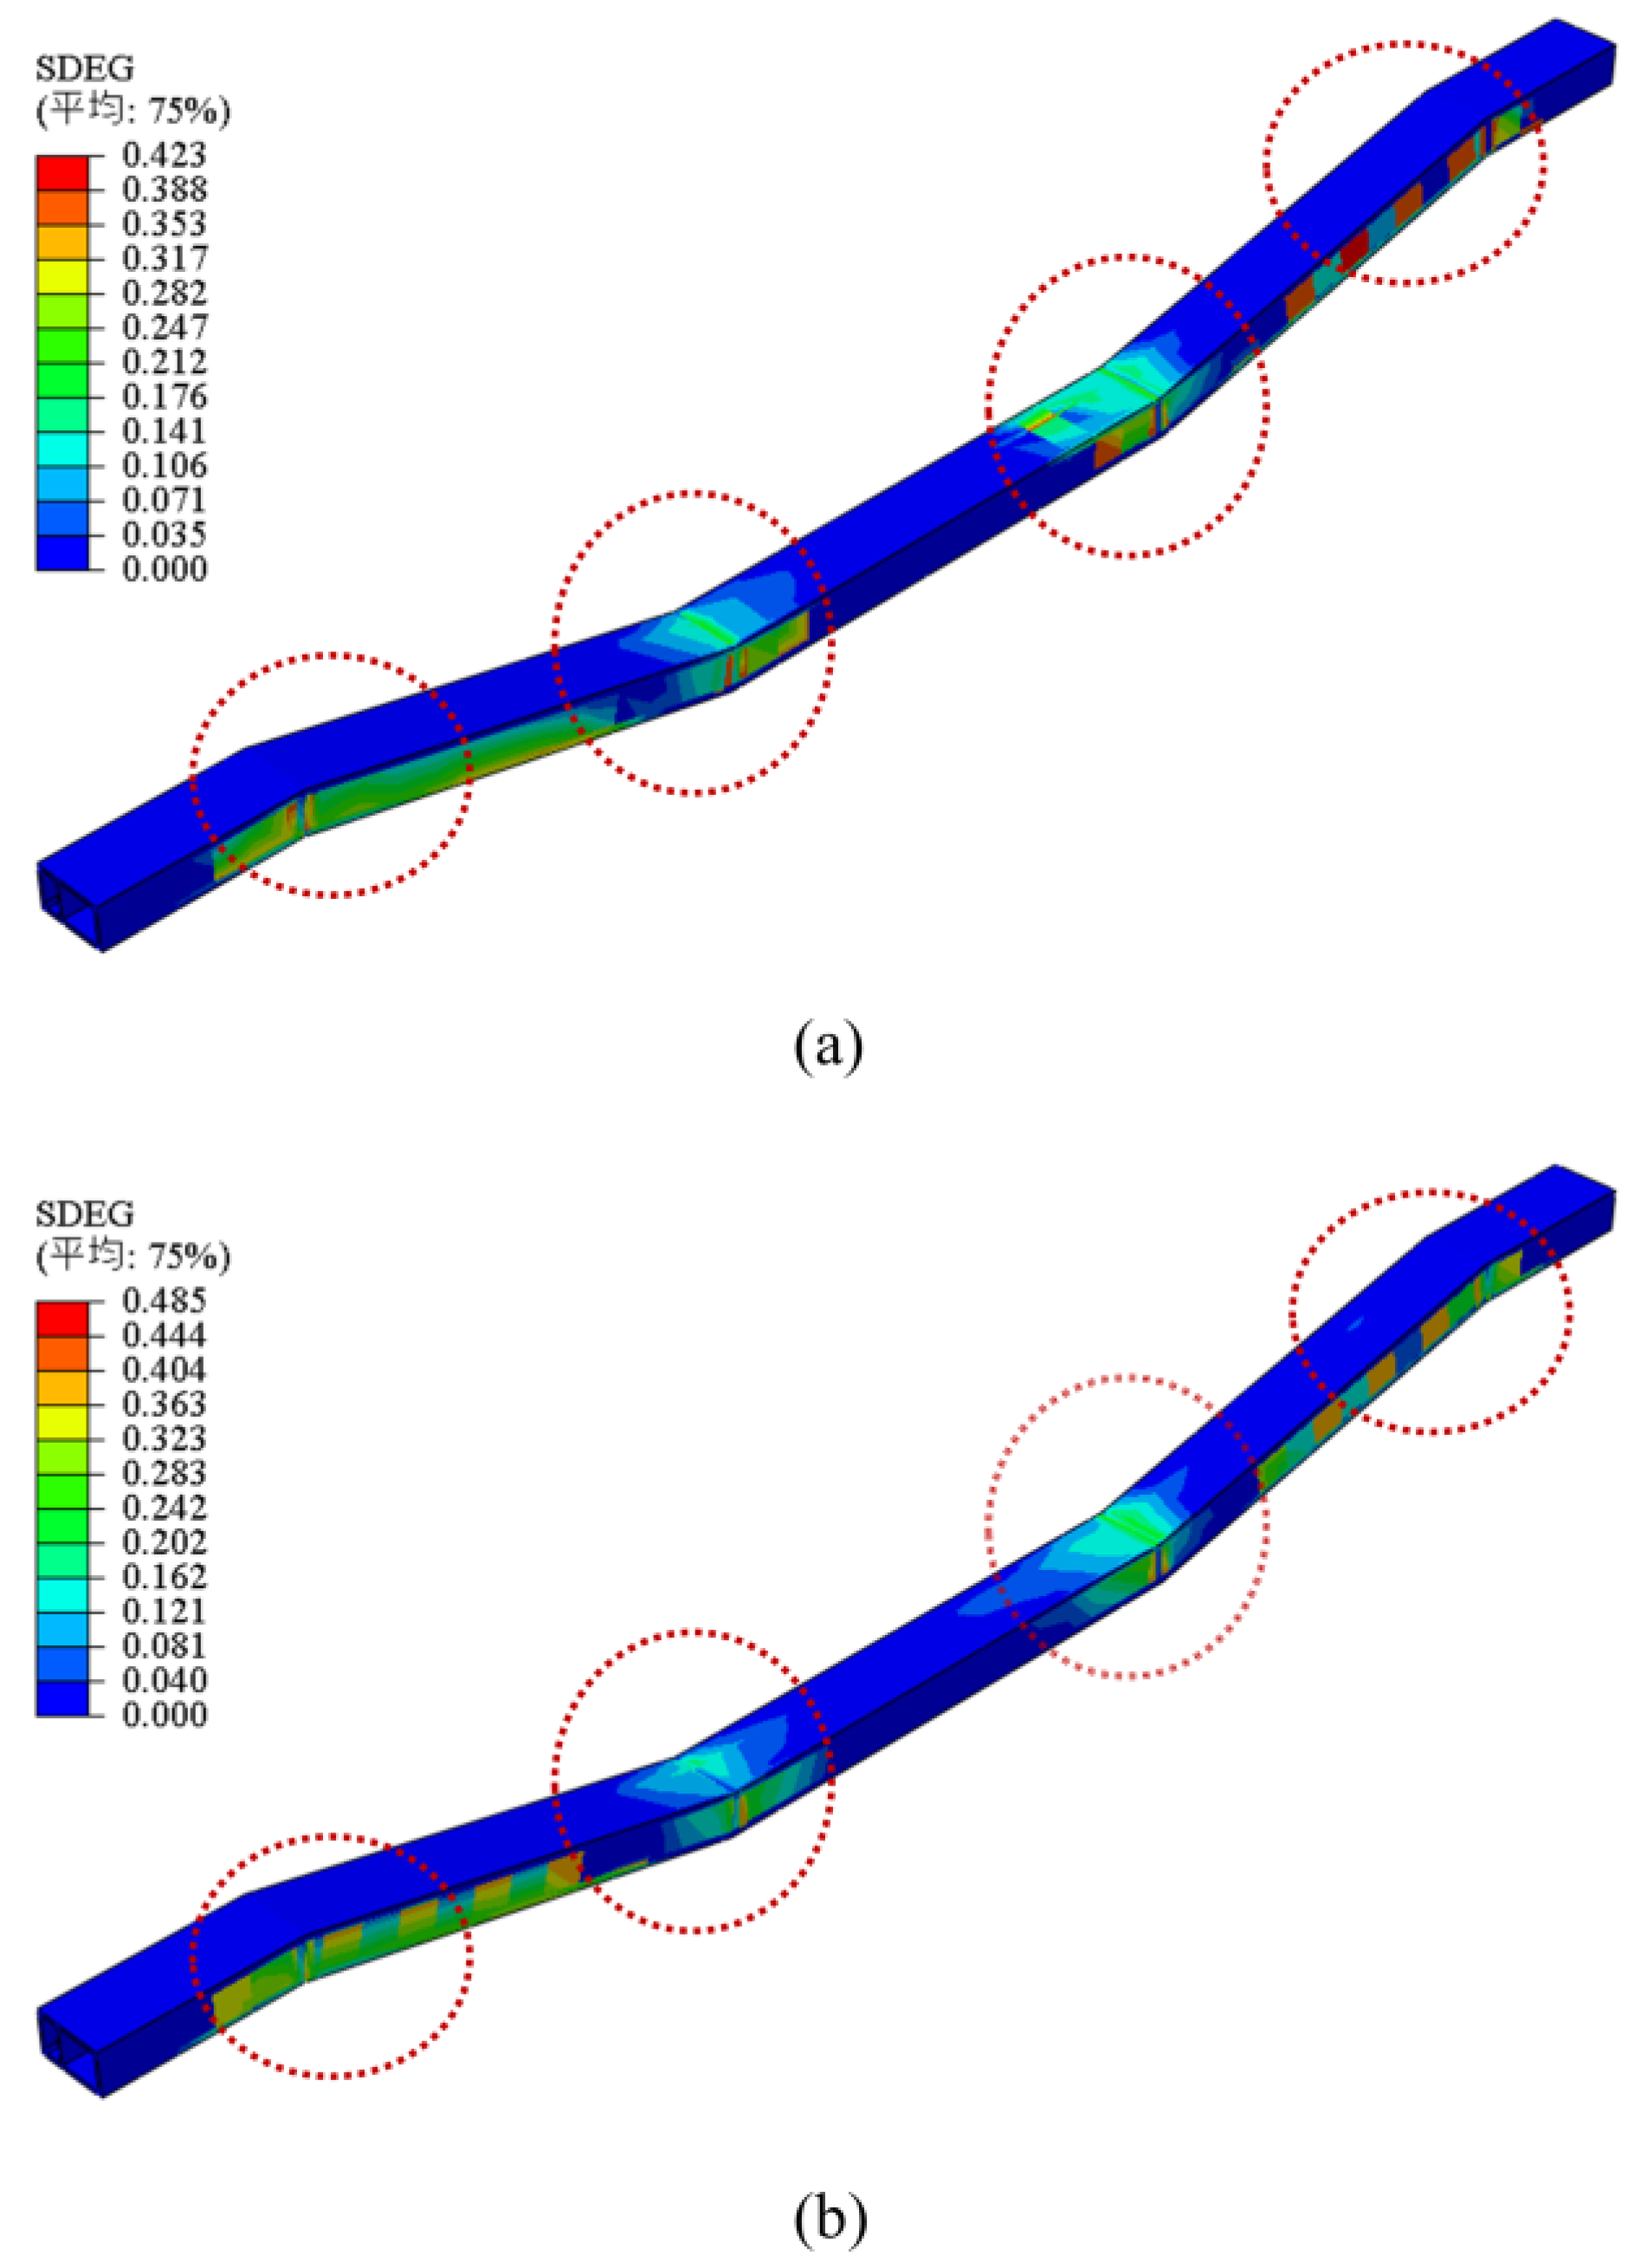
Figure 12 depicts the Overall plastic damage distribution cloud map of the utility tunnel under unidirectional and bidirectional seismic loading (15s). It is evident that under bidirectional seismic excitation, the response of utility tunnel is greater compared to unidirectional seismic loading. The bigger stress is primarily concentrated at the bottom and sides of the junction between the horizontal riverbank section and the sinking section of the utility tunnel, as well as at the top and side walls at the junction between the sinking section and the horizontal riverbed section. Combining the Mises peak stress contour plot at the junction sections, it is evident that the parallel section of the utility tunnel at the junction between the horizontal section and the sinking section is the most vulnerable area under seismic loading
Figure 10. Under bidirectional seismic excitation, stress concentration and damage evolution are greater than under unidirectional seismic excitation, it means that the utility tunnel, bidirectional seismic verification should be conducted to ensure the seismic resilience of local sections of the utility tunnel, especially in special site conditions such as river-crossing sections.
4.3. Characteristics of Hydrodynamic Pressure
To investigate the characteristics of hydrodynamic pressure response under varying seismic excitation directions and water level changes, a comparative analysis of hydrodynamic pressure was conducted.
Figure 13 illustrates the hydrodynamic pressure distribution across the river cross-section at maximum pressure locations for different water levels and seismic excitations. The hydrodynamic pressure distribution at the full water level as an example, the hydrodynamic pressure distributions under unidirectional and bidirectional seismic wave excitations is shown in
Figure 13 (b) and (d), respectively Under unidirectional seismic excitation, the maximum hydrodynamic pressure tends to concentrate on both riverbanks, increasing from the water surface to the riverbed and gradually decreasing towards the middle of the riverbed, with the maximum pressure on the left bank recorded at 21.72 kPa. Notably, under bidirectional seismic excitation, the distribution of hydrodynamic pressure in the river expands compared to unidirectional excitation. It gradually decreases from the free water surface to the riverbed, with the maximum hydrodynamic pressure concentrated at the bottom of the right bank, recorded at 36.77 MPa. This is due to the unidirectional seismic input being oriented transversely across the river, primarily causing the model to respond seismically in the transverse direction, resulting in significant oscillation of the water body in that direction and leading to the concentration of maximum hydrodynamic pressure on both riverbanks. Conversely, the bidirectional seismic excitation introduces vertical effects by simulating the concurrent action of seismic P-waves and shear waves. The dual-direction influence increases the vertical oscillation forces on the water body, resulting in an expanded range of hydrodynamic pressure and a noticeable increase in the maximum hydrodynamic pressure.
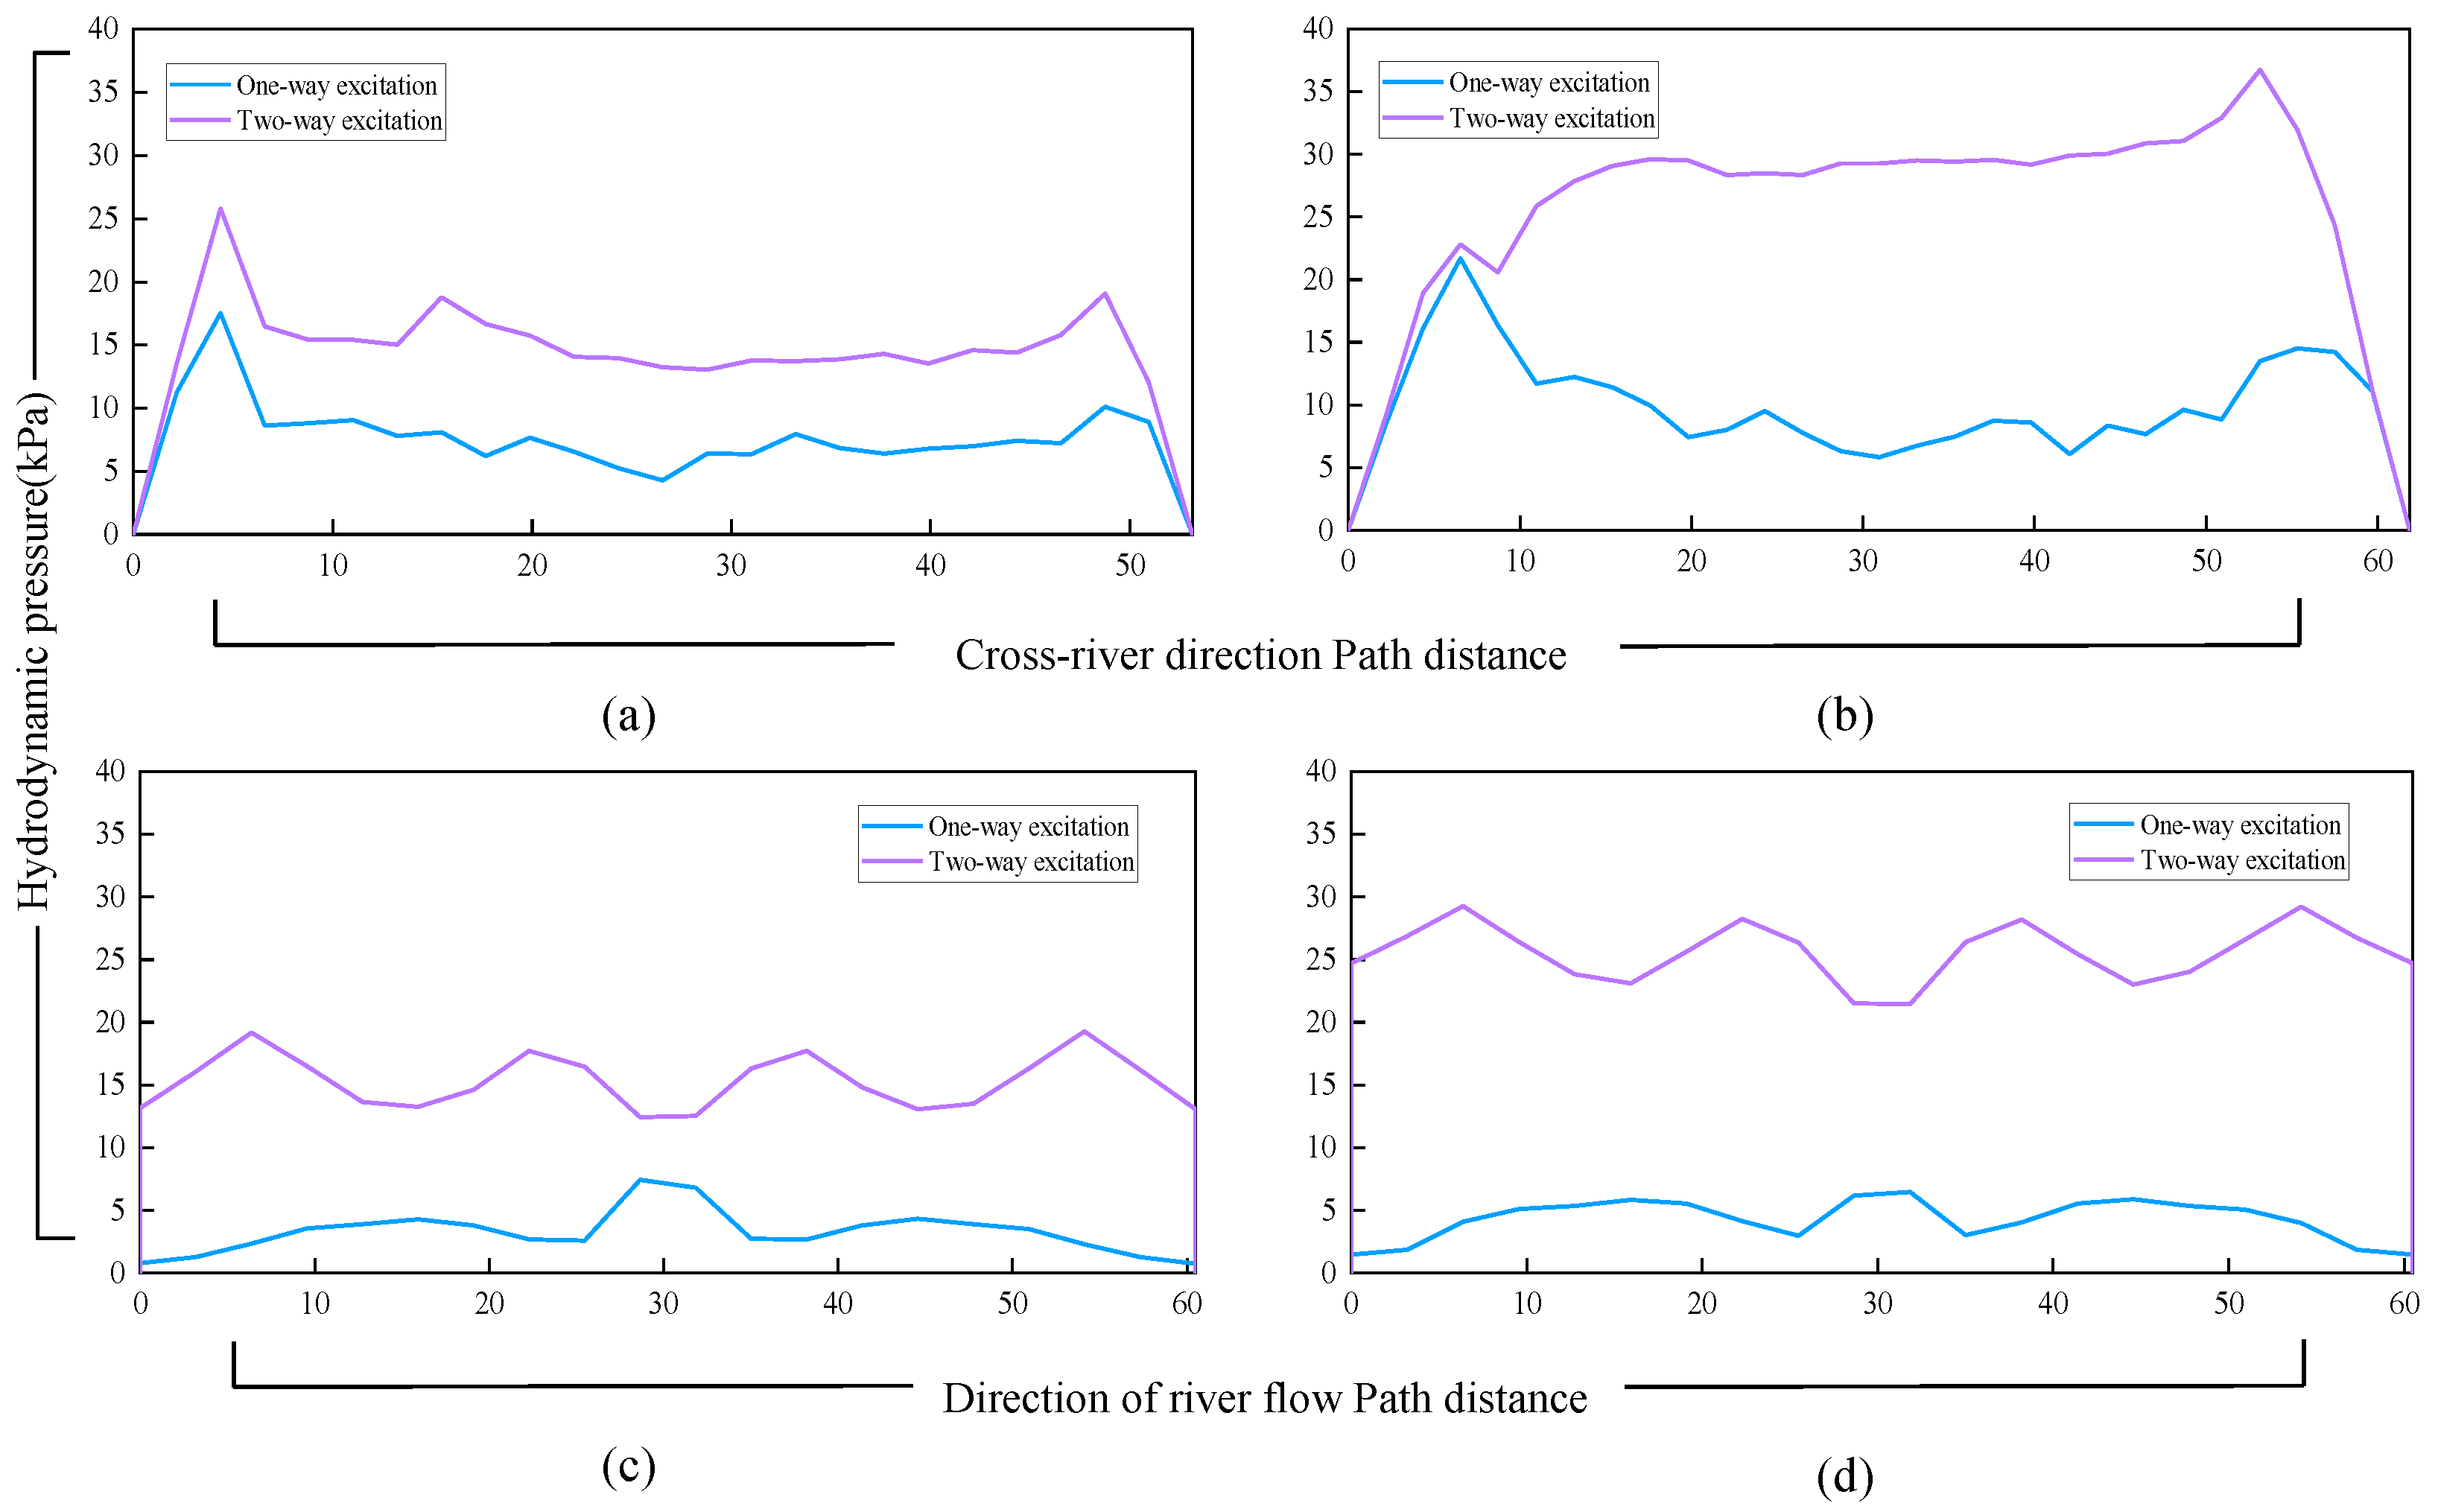
To further explore the spatial distribution of hydrodynamic pressure,reference paths(data observation paths set at the bottom of the water) were established along the transverse cross-section at maximum hydrodynamic pressure locations and at the bottom of the longitudinal mid-section of the river. These reference paths illustrate the spatial distribution characteristics of hydrodynamic pressure in the river channel.
Figure 14 (a) and (b) present the hydrodynamic pressure distribution curves along the transverse paths. The curves indicate peaks in hydrodynamic pressure at both riverbanks. This observation, in conjunction with the hydrodynamic pressure distribution maps in
Figure 14, shows that, the peaks of transverse hydrodynamic pressure concentrate at the riverbanks regardless of unidirectional or bidirectional seismic excitation. The curve for bidirectional seismic excitation is higher than that for unidirectional excitation,the unidirectional excitation displaying a minimum value in the middle of the river. the range of hydrodynamic pressure under bidirectional excitation is broader, and a significant hydrodynamic pressure is produced in the central transverse section of the river.
Figure 14(c) and (d) depict the hydrodynamic pressure distribution along the mid-section paths of the river in the longitudinal direction. Under bidirectional seismic excitation, the river experiences a minimum value directly above the central section of the utility tunnel. The hydrodynamic pressure distribution point identified by the water body model through a global search is also located on one side of the central longitudinal section. This further indicates that under bidirectional seismic excitation, a significant distribution of hydrodynamic pressure occurs on both sides of the central longitudinal position.
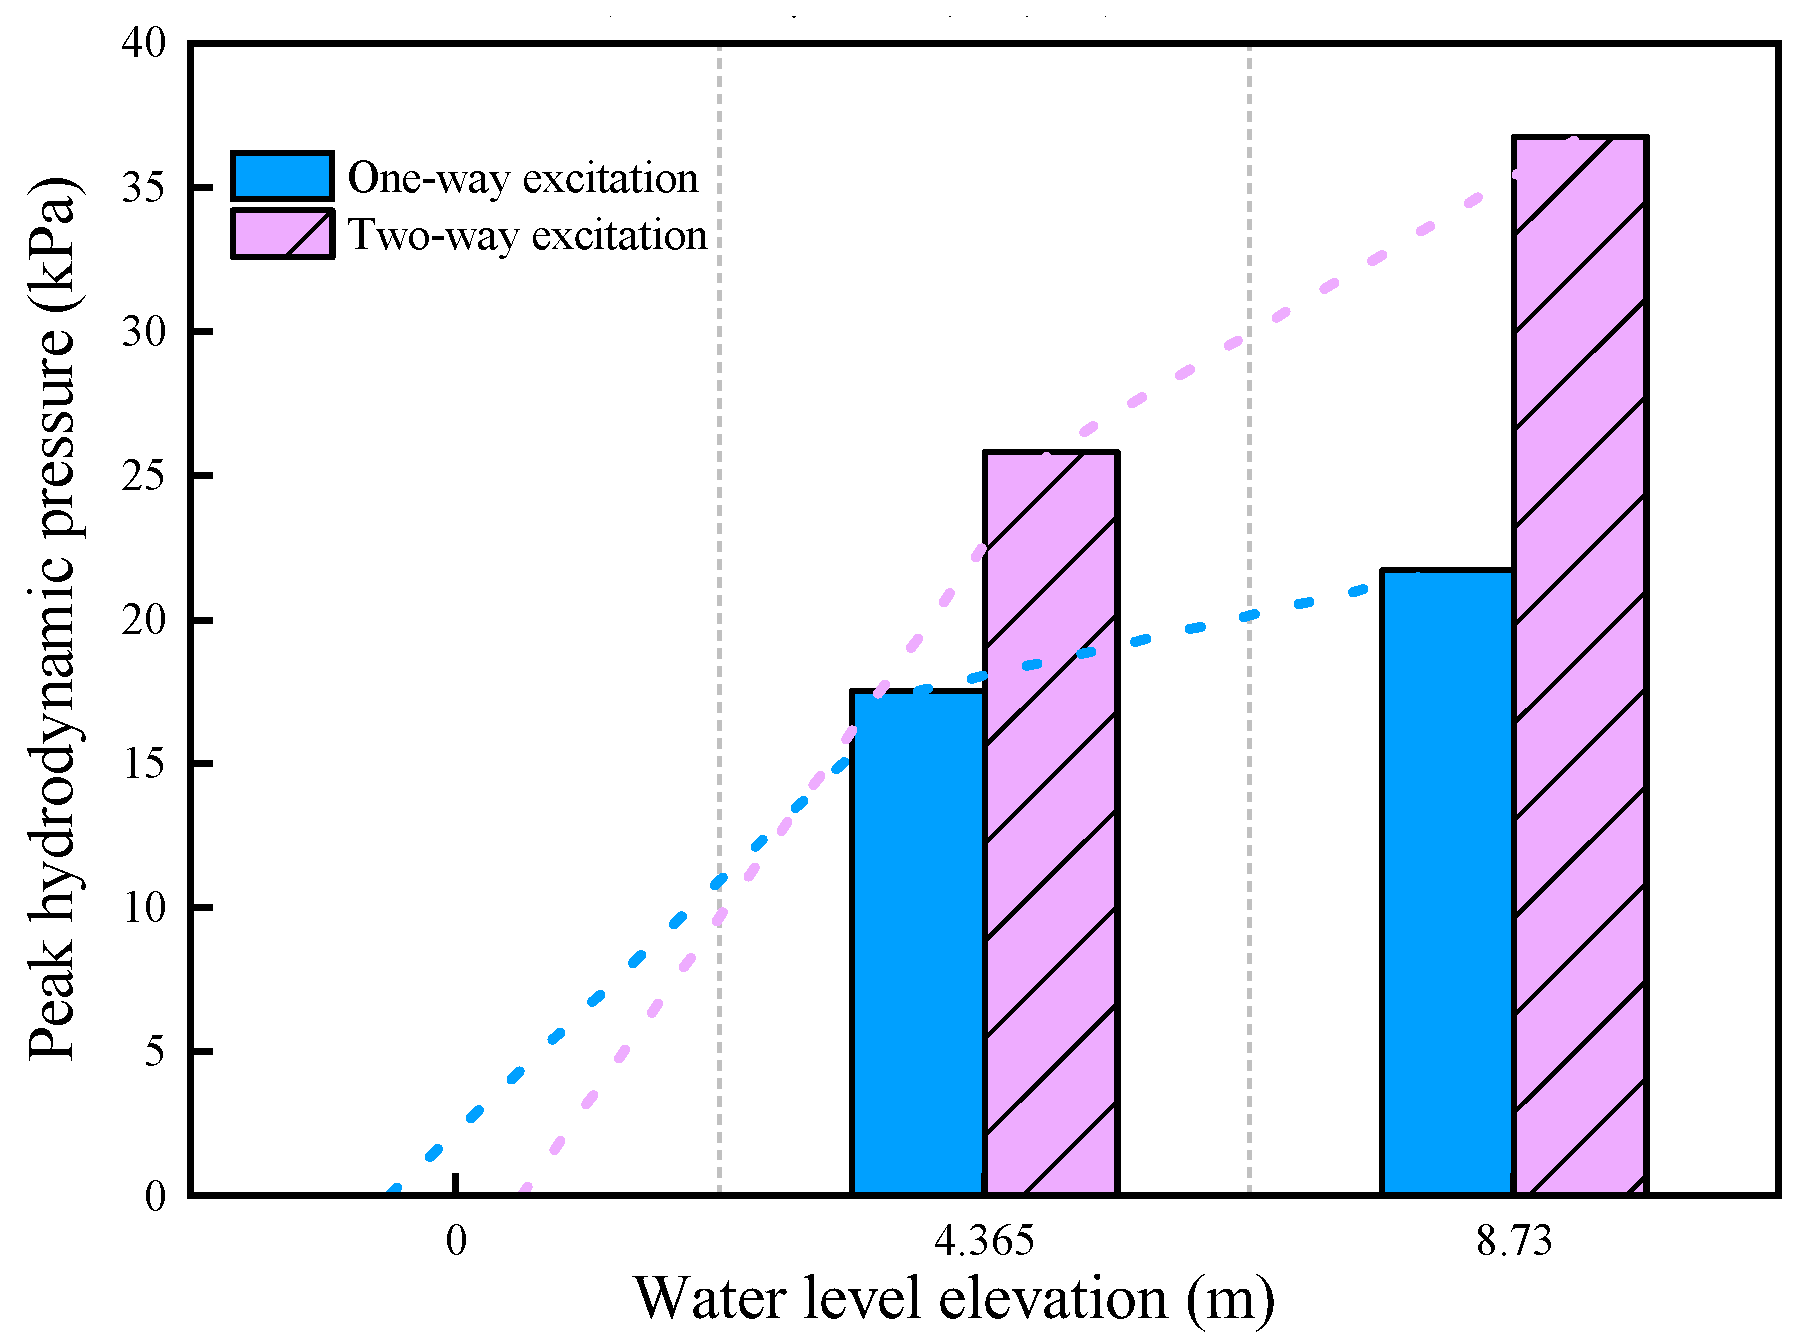
Figure 15 shows the maximum hydrodynamic pressure with water volume changes. From
Figure 13 and
Figure 14, it is evident that high water levels significantly elevate the maximum values of hydrodynamic pressure. It is important to note that the change in water level is not proportional to the change in the water storage per unit length of the channels. In this study, the model sets the half-channel water level at 4.365m, corresponding to a water storage of 212.9m
3 per unit length of the channel, and the full-channel water level at 8.73m, with a water storage of 463.9m
3 per unit length of the channel. different seismic excitation directions will have an impact on the distribution and peak values of the maximum hydrodynamic pressure in the river (
Figure 13–15). At the half-channel water the maximum hydrodynamic pressure in bi-directional seismic excitation is 47% higher than that in uni-directional seismic excitation. At the full-channel water level, the maximum hydrodynamic pressure under bi-directional seismic excitation is 69% higher than under uni-directional seismic excitation. In the same intensity uni-directional seismic excitation, the maximum hydrodynamic pressure at the full-channel water level is 24% higher than at the half-channel water level. Similarly, under the same bi-directional seismic excitation, the maximum hydrodynamic pressure at the full-channel water level is 42% higher than at the half-channel water level.
4.4. Influence of River Level on Seismic Response of Utility Tunnels
it is evident that the utility tunnel suffered relatively greater damage under bi-directional seismic excitation. To investigate the impact of water level variations in the river on the seismic response of the lower utility tunnel, this study focuses on analyzing the seismic response of the utility tunnel under bi-directional seismic excitation, particularly on the impact caused by water level changes.
Under seismic forces, the water in the river produces not only hydrodynamic pressure, but a certain energy dissipation and seismic reduction effect.
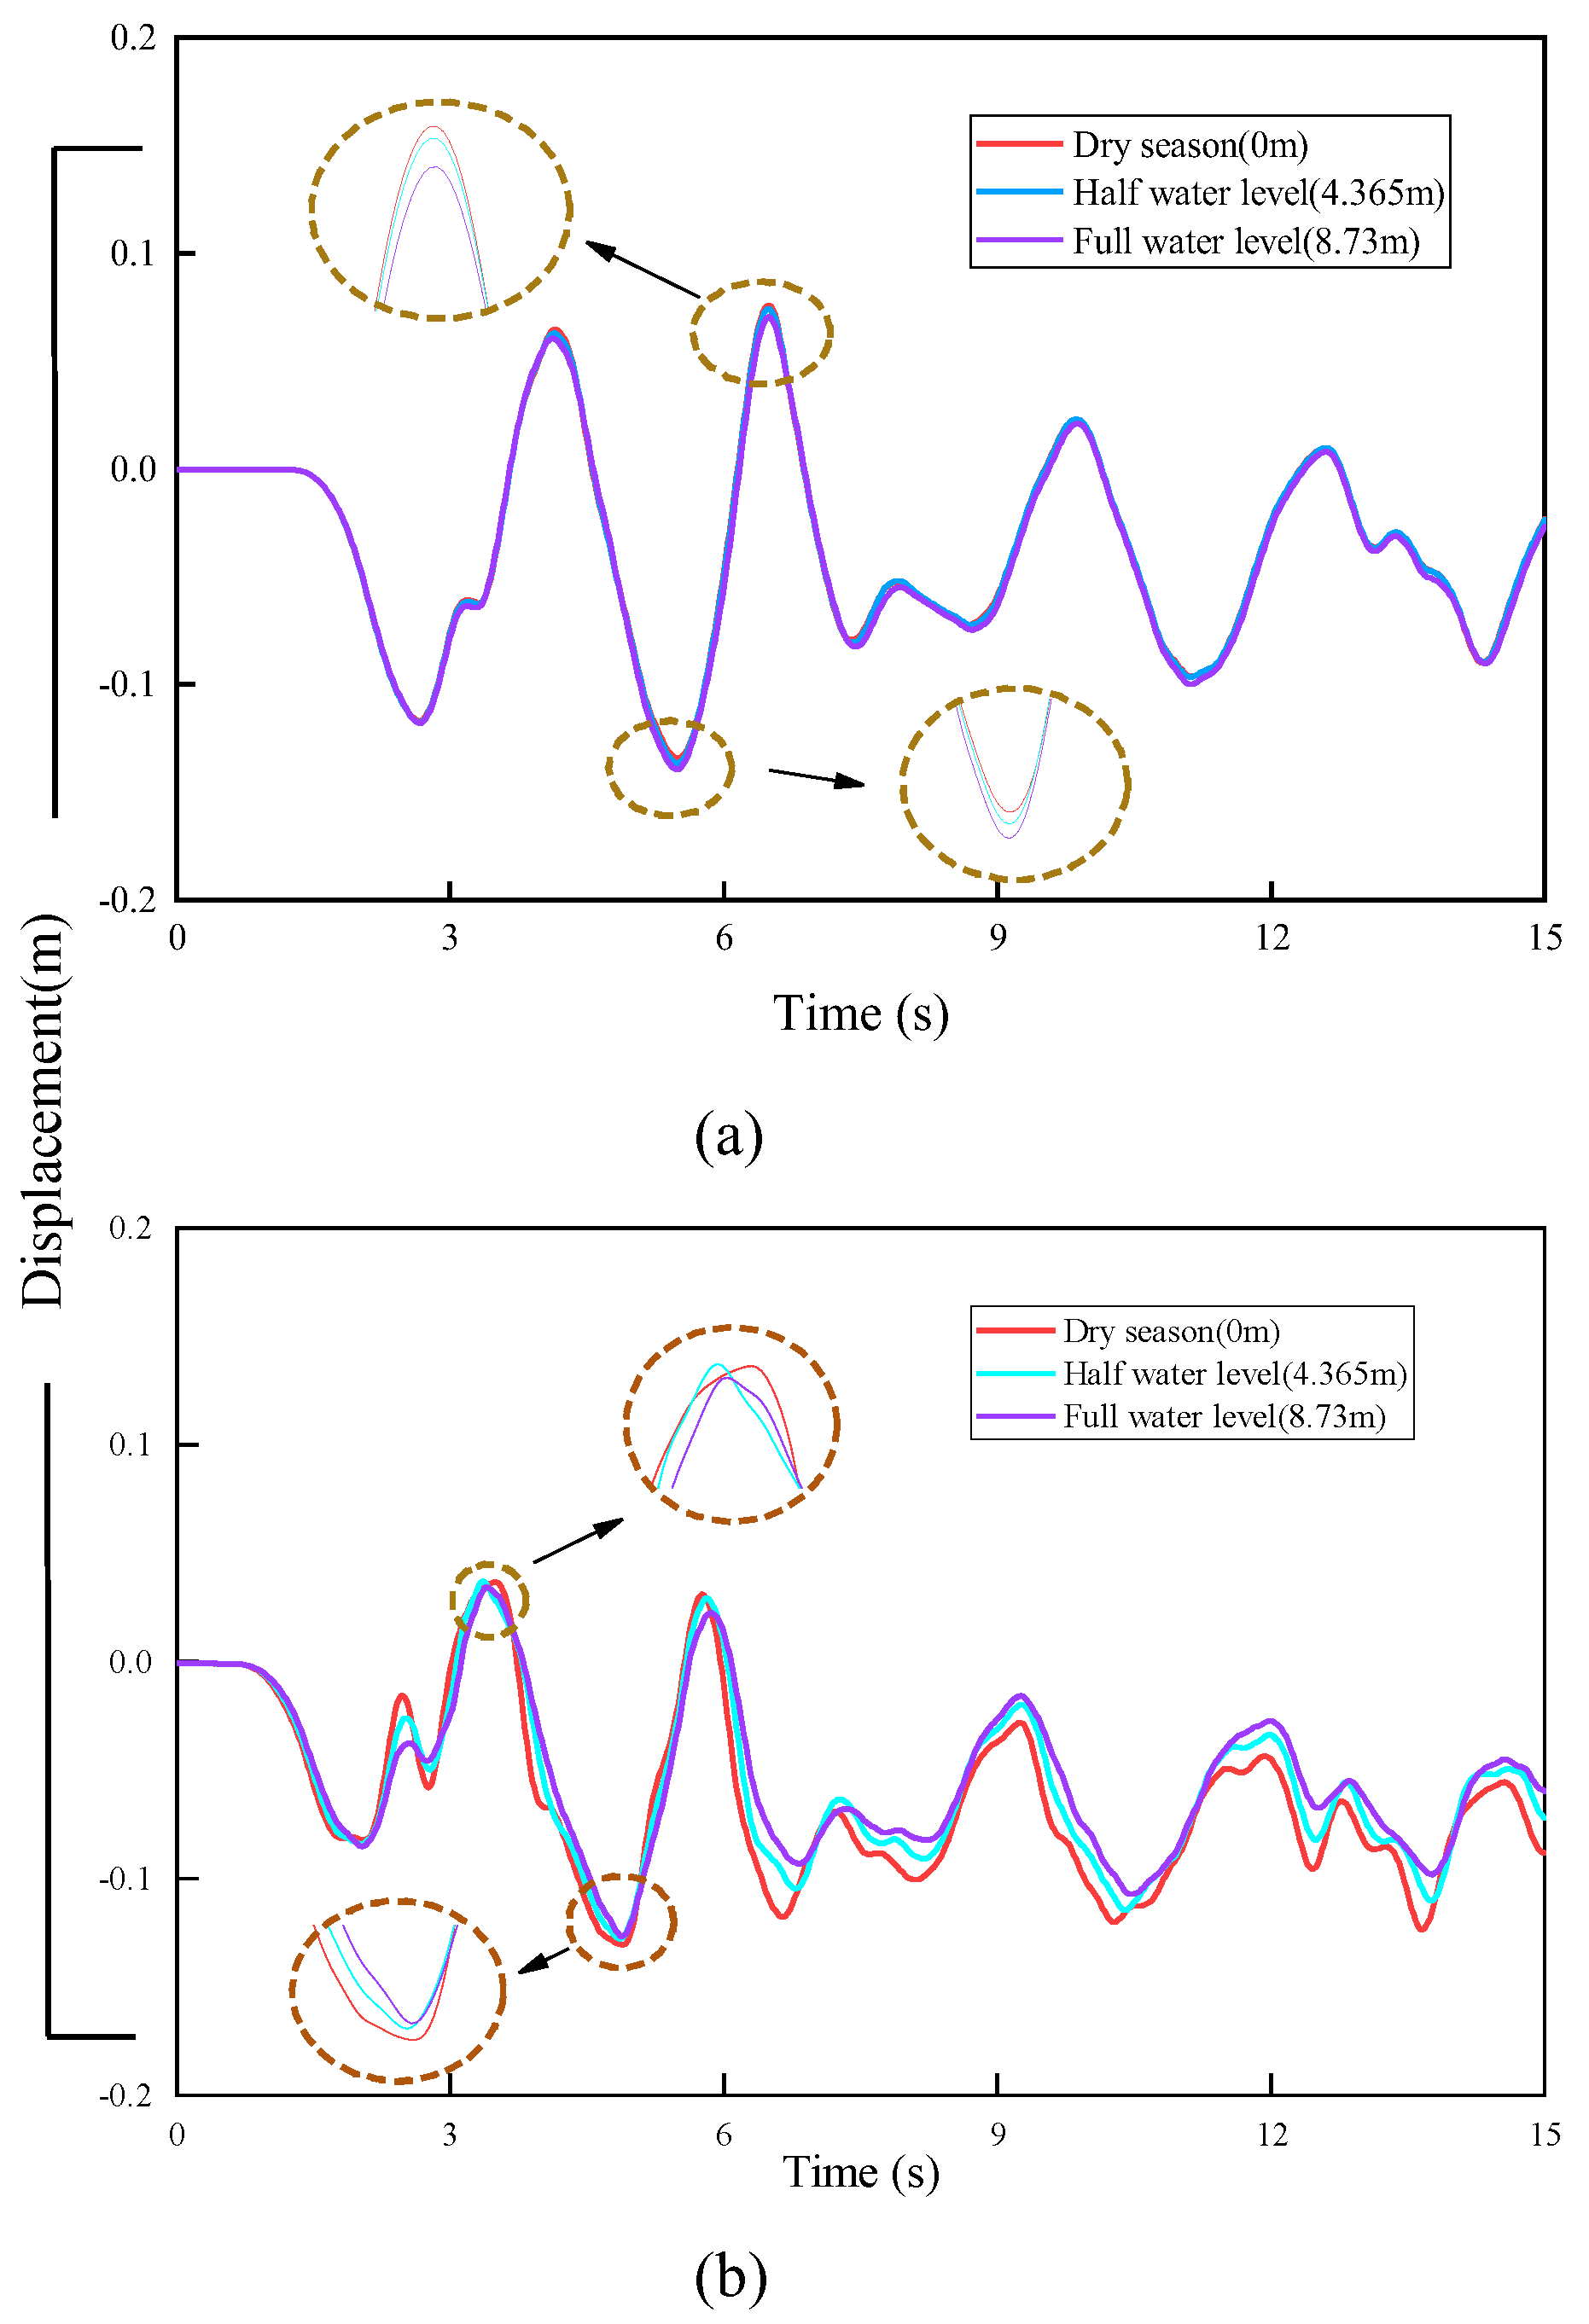
Table 6 below presents the peak values of combined displacement (U), Mises stress, compressive stress (DAMAGEC), tensile stress(DAMAGET), overall stress plastic (SDEG), and acceleration (ACC) under bidirectional seismic excitation for three water level conditions. to investigate the effect of river level on the displacement response characteristics of UT, the displacement time-history curves of UT in the transverse and vertical seismic excitation directions is illustrates in
Figure 16.
In bidirectional seismic excitation, there is a tendency for the displacement effect of the utility tunnels to decrease as the water level rises, but this effect is weak. This is due to the hydrodynamic pressure effect of the water body in the river channel directly affecting the soil attached stress around the river channel, which is then transferred to the buried utility tunnels, and the displacements of the soil surface of the river channel are greatly disturbed, which have a smaller effect on the displacement of the tube corridor at a greater depth of burial.
As shown in
Table 6, the maximum Mises stress of the tunnel decreases by 8% from a dry state to a half-water level and by 53% from a half-water level to a full-water level. This indicates that the presence of water in the river channel absorbs some of the seismic energy, thereby reducing the internal forces within the tunnel. However, it is important to note that seismic activity is a continuous force, and the presence of water in the river channel does not reduce the accumulation of internal forces at any given moment.
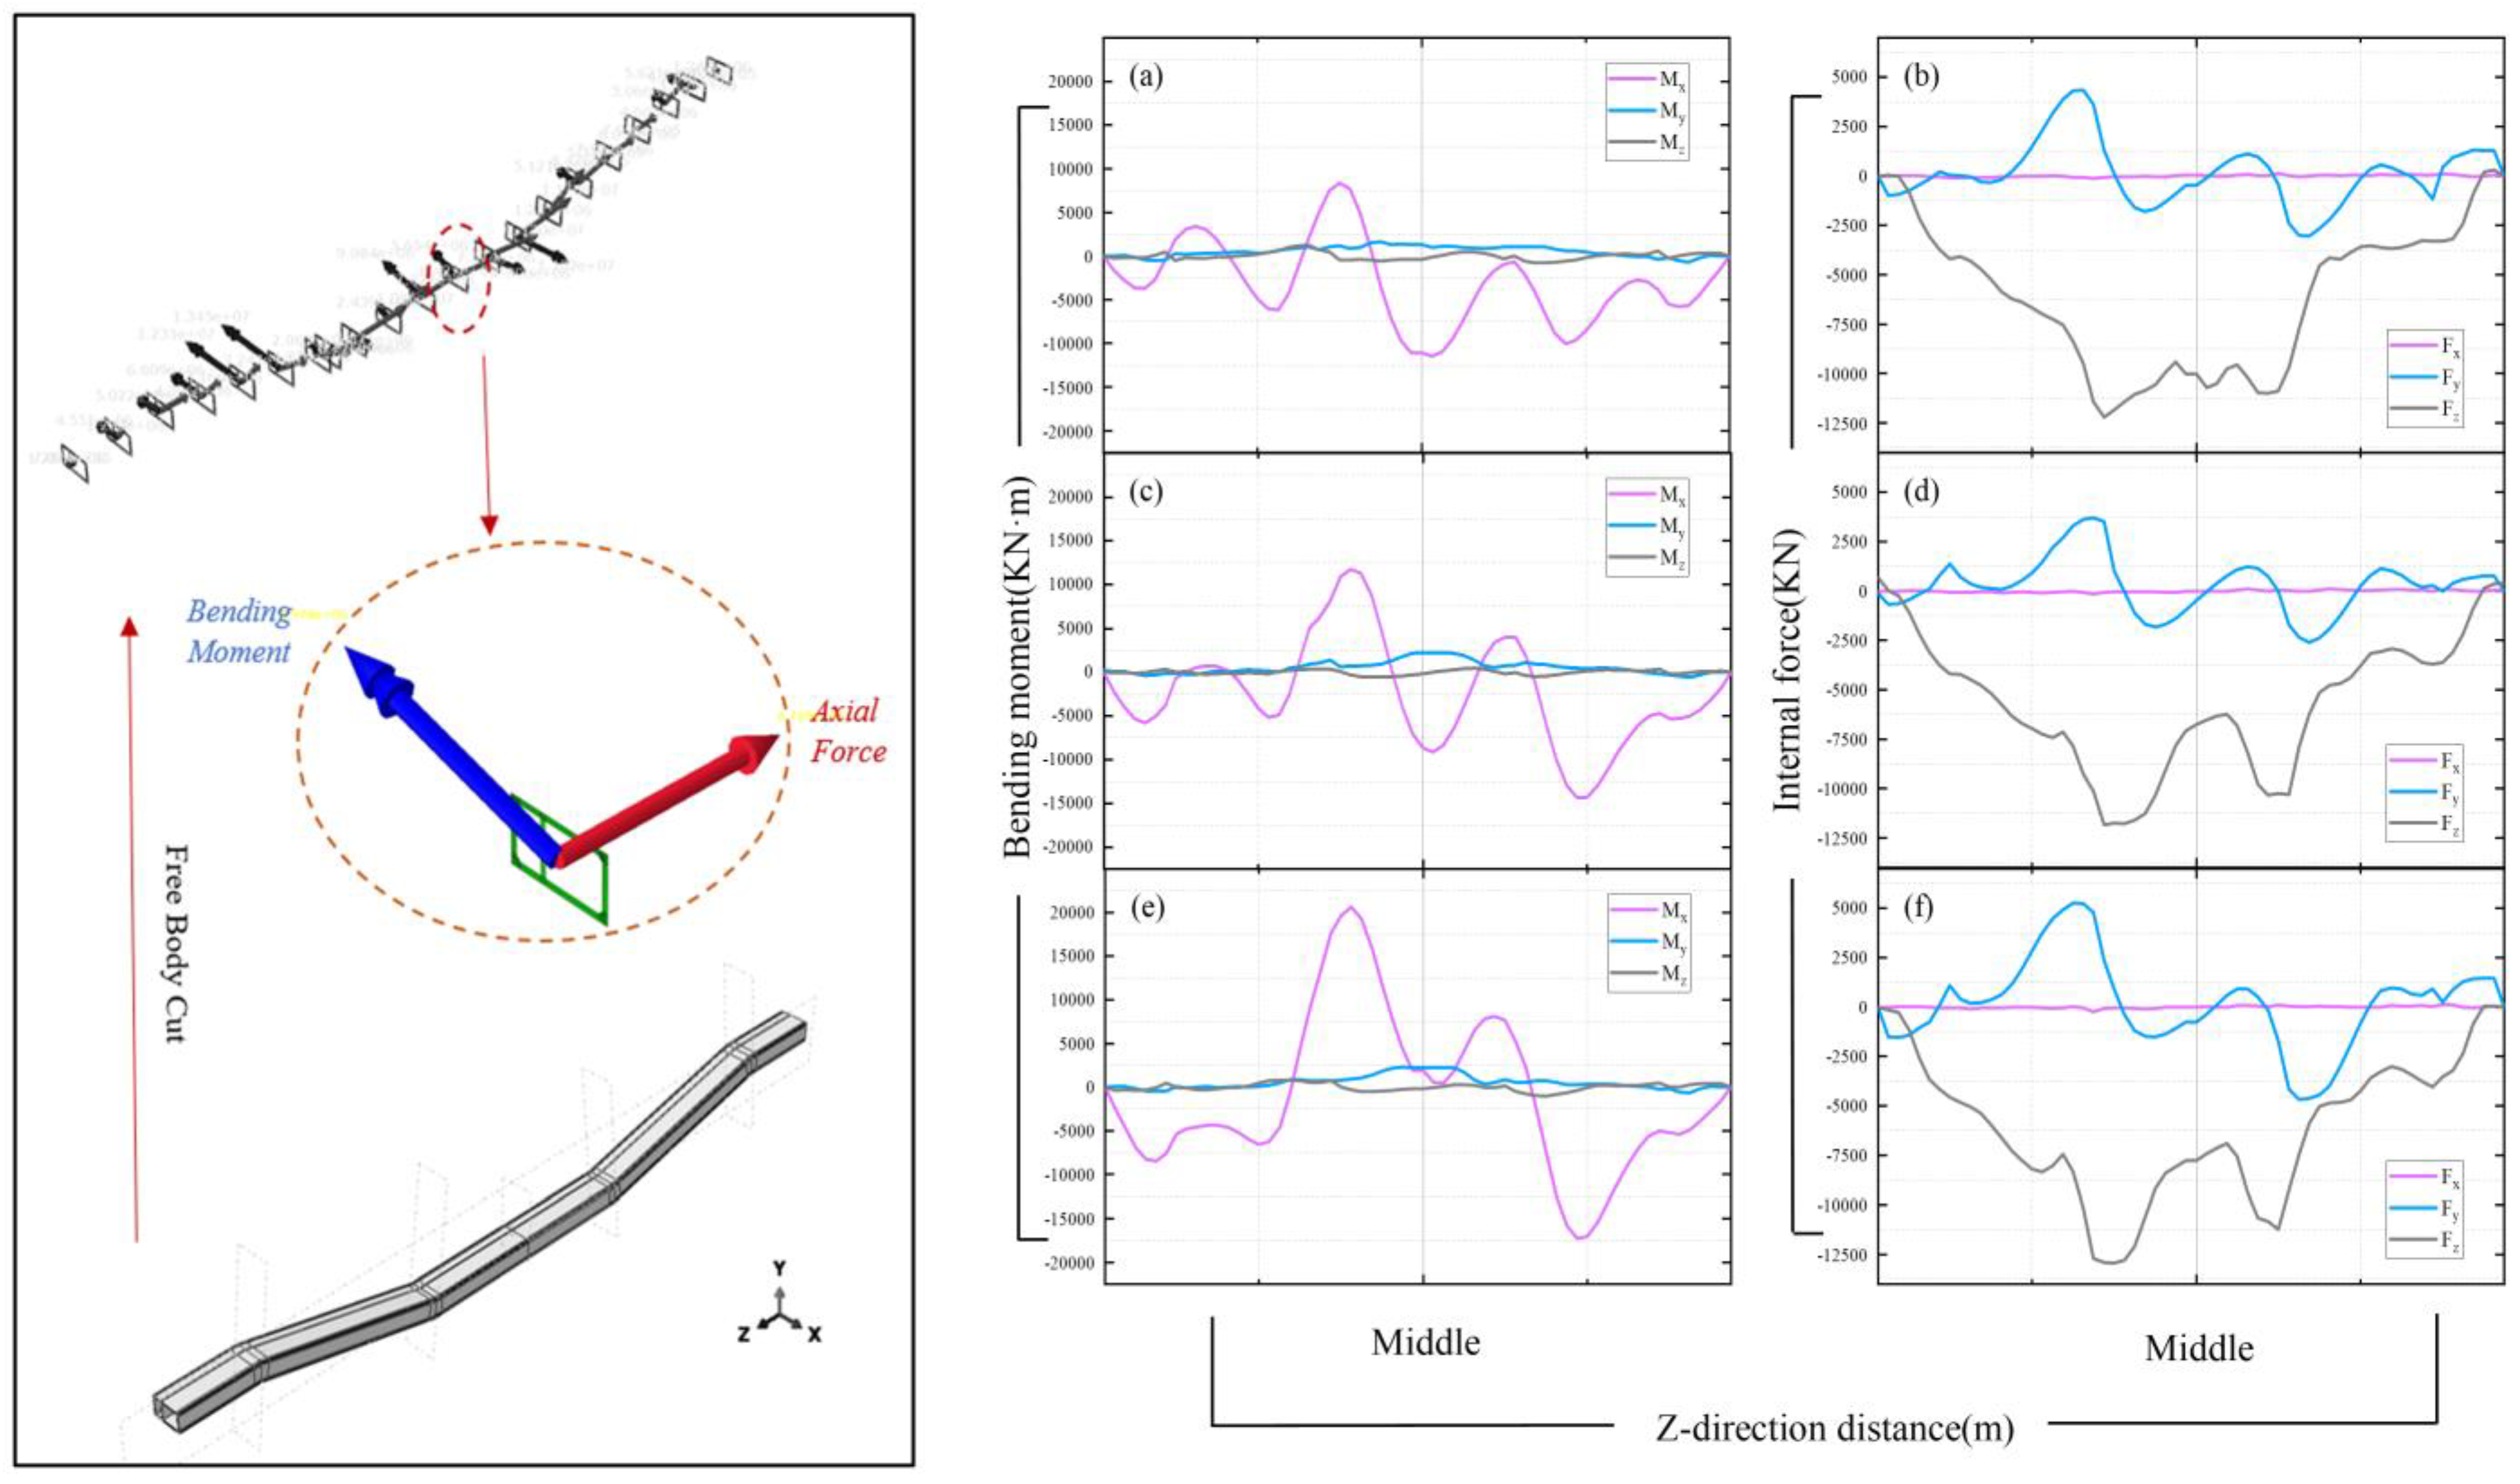
Figure 17 illustrates the internal force distribution curve of the tunnel along the route direction direction at the end of seismic activity (15 s). the section bending moment, shear force, and axial force increase with the rise of water level, and the bending moment vector is mainly concentrated in the z-direction, while the bending moments in the transverse direction (x, y) also appear, but they are significantly smaller than those in the z-direction, which indicates that the tunnel is mainly subjected to a larger tendency of vertical bending deformation. In the internal force diagrams shown in
Figure 17(b), (d), and (f), axial forces in the z-direction and shear forces in the y-direction are also the main internal forces acting, with the axial forces mainly manifested as compression. The rise in water level mitigates the damage to the tunnel to some extent, as can be seen in
Table 6, where the overall maximum compressive damage (DAMAGEC) and overall plastic damage (SDEG) are reduced.
To identify the seismic damage locations in the utility tunnel,
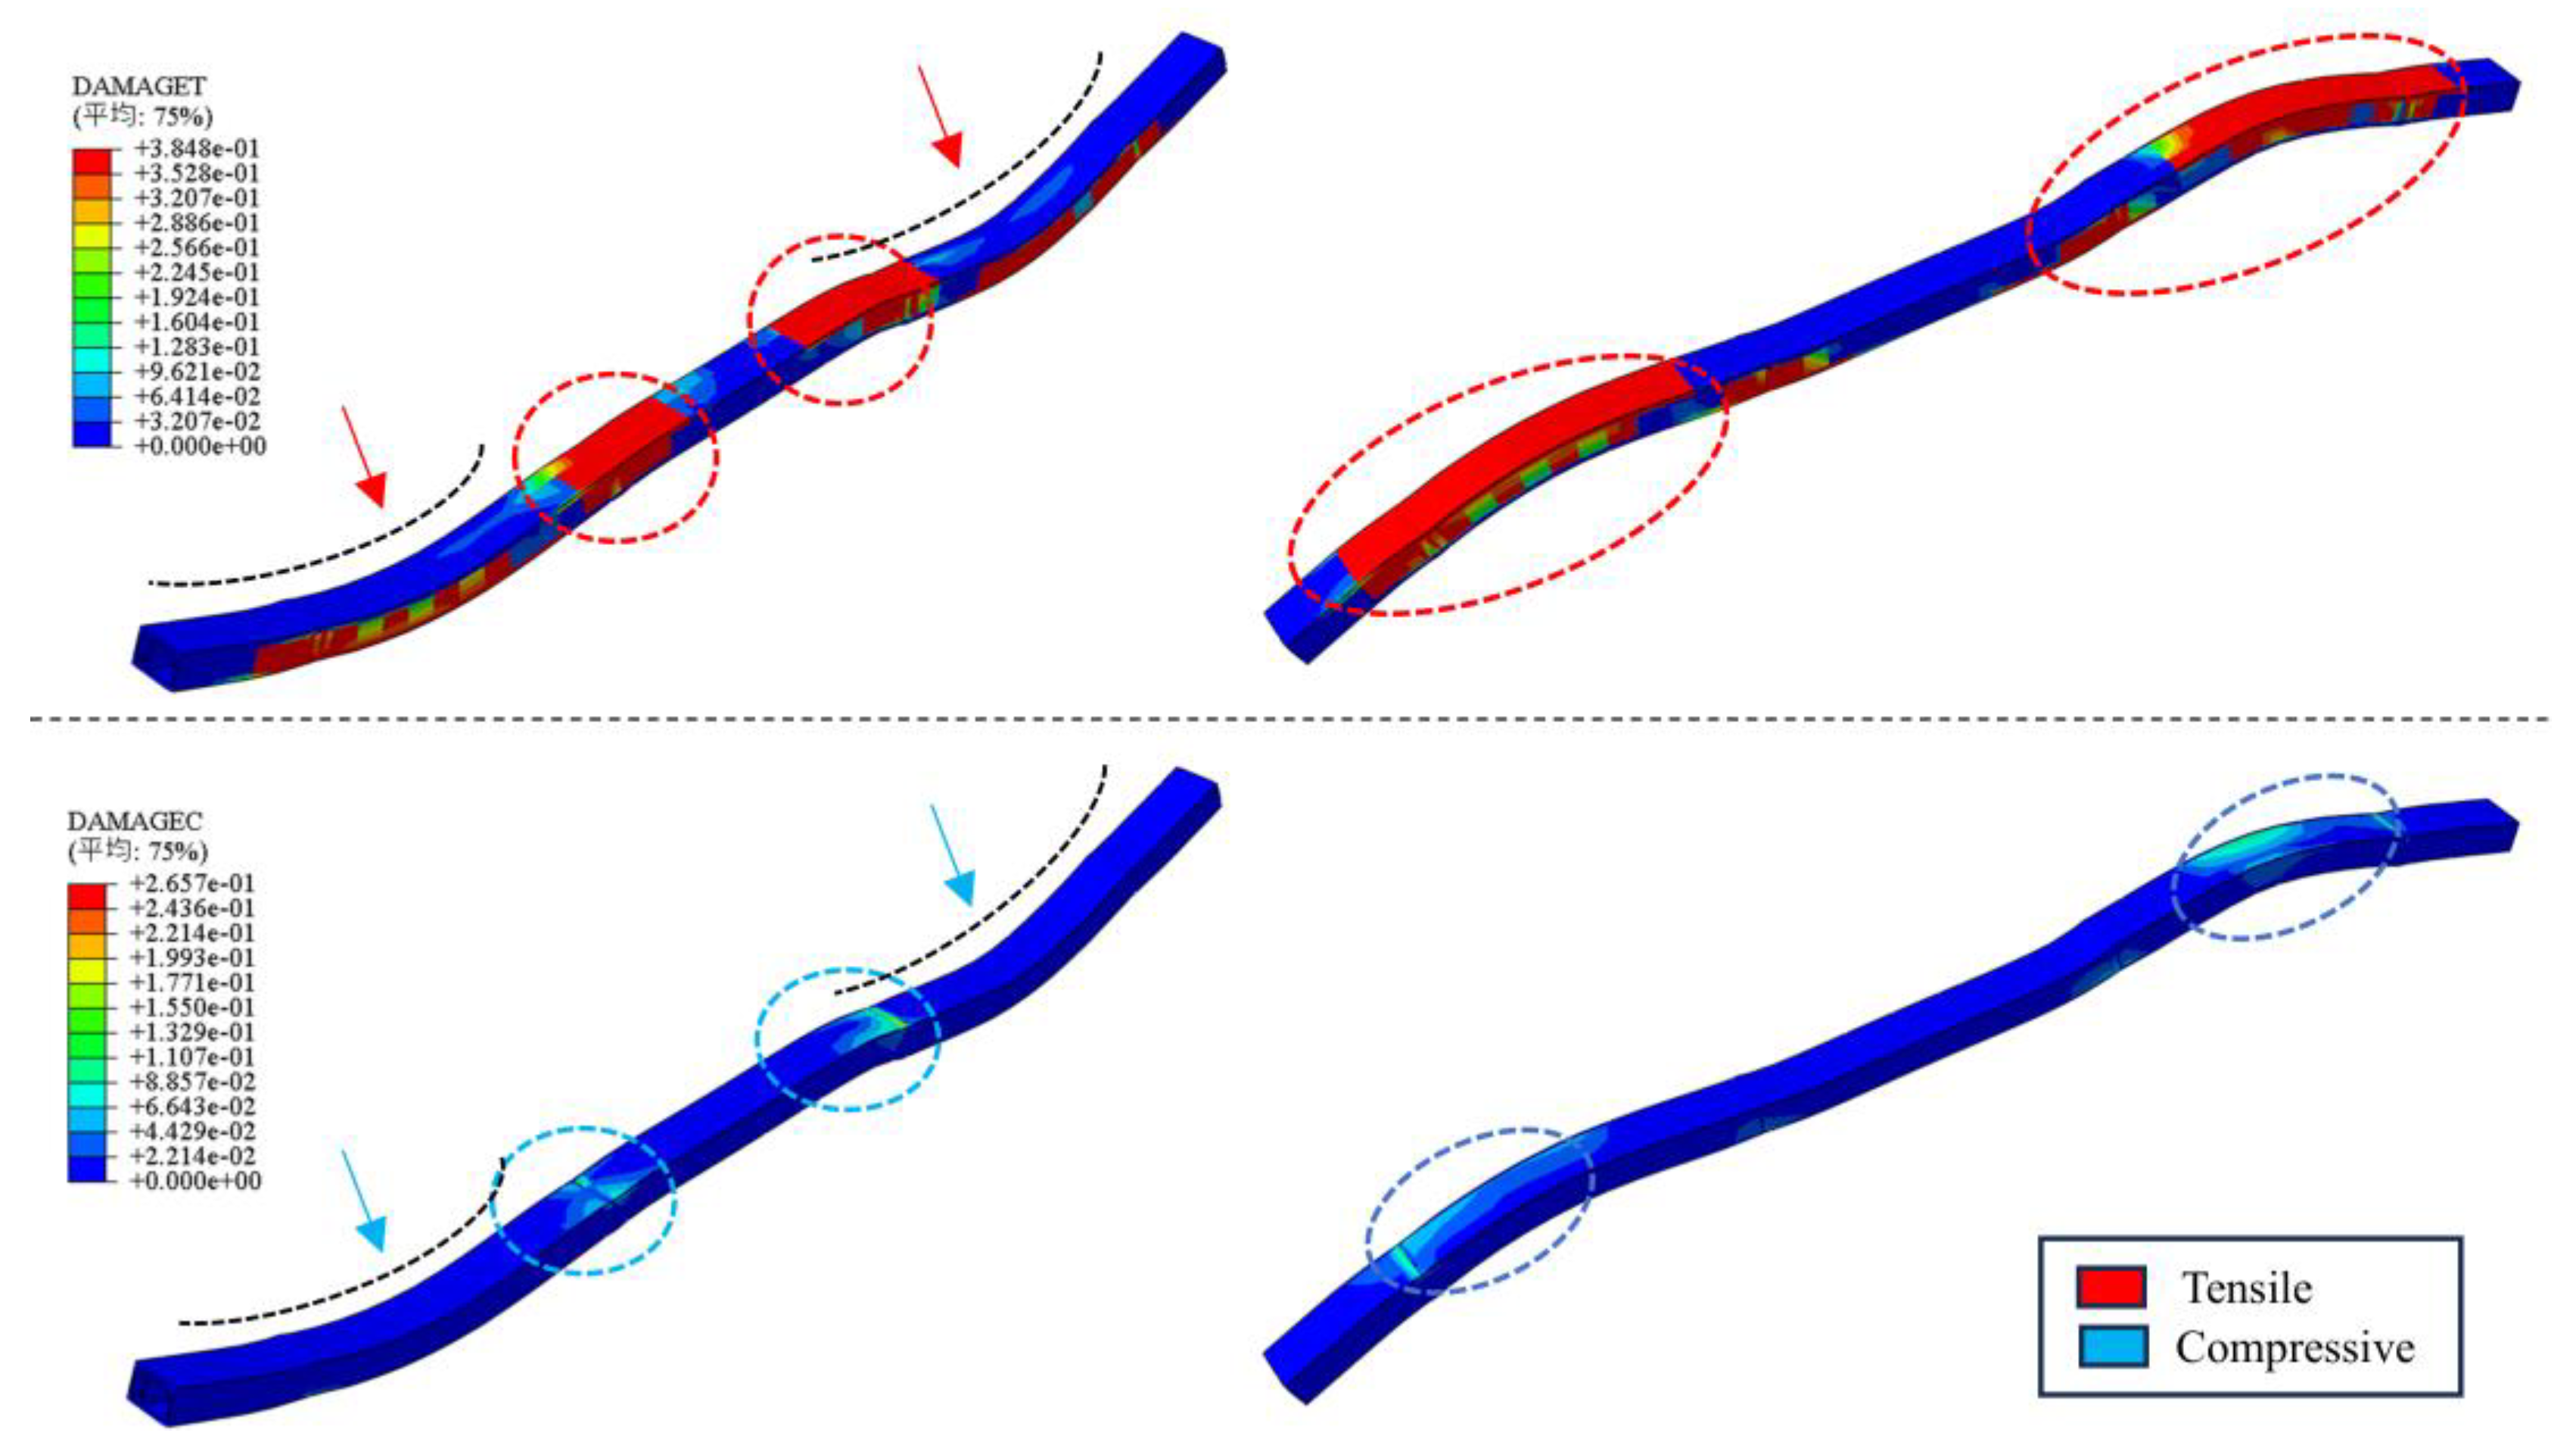
Figure 18 illustrates the tensile and compressive damage distribution cloud maps of UT. The deformation coefficients of these damage distribution cloud maps were scaled up proportionality in order to show the deformation trend of the utility tunnels more clearly.
Due to the effects of valley site conditions, the layout of the utility tunnel, and water coupling, damage to the utility tunnel is primarily concentrated at the junctions of the parallel and Sinking sections, extending towards both ends. The extent and area of tensile damage are significantly greater than those of compressive damage, as shown in
Figure 18. Additionally, as water depth increases, compressive damage to the utility tunnel tends to decrease (
Table 6), likely due to the suppressive effect of the overlying river water on the overall seismic response of the riverbed[
36]. At 15s of seismic action, the utility tunnel mainly is bending deformation. Further studies reveal that this damage characteristic is consistent under the specified conditions, indicating that the junctions are the primary damage points. It is recommended to design smooth transitions at the junctions of the utility tunnel in river-crossing sections to minimize stress concentration, Increasing the burial depth appropriately can improve the soil pressure on the upper of the tunnel.
According to the simulation, it has been found that the earthquake acton causes the water body in the river channel to oscillate. This oscillation leads to alternating water level fluctuations, the water elevation will be uplift in one side, but the other side the water level will drop down., the hydrodynamic pressure greatly changes across the river section and causes a concentrated increasment in soil pressure at the lower portion of the riverbed and river bank or soil pressure decrement in the part of water volume reduction . This changed soil pressure leads to increased tensile stress at the junction of the UT sinking section and the horizontal section of the riverbed, contributing significantly to potential damage at this zone.
Furthermore, the silt and slity clay in the river and bank is susceptible to take liquefaction and settlement under earthquake action. In liquefaction, UT will bear the the uplift force due to the ultra-pore water pressure in the beginning and then bear the downward pressure force afer the liquefacton. And the soil settlement is also easy to increase the stress of UT, and make the UT easily damage.
5. Conclusions
In this paper, a 3D model of a water-soil-utility tunnel is established with three-dimensional viscoelastic boundaries imposed at the truncated boundaries of the soil body, and the seismic load is equivalent as nodal forces. Based on the Westergaard solution and relation of acoustic-solid interaction to simulate the flow-solid coupling, seismic dynamic response characteristics and damage distribution of UT under the section of the river channel are investigated. The main conclusions are summarized below:
(1) By comparing with Westergaard's analytical solution, it is verified that the coupled flow-solid interaction simulation using the acoustic module in ABAQUS can accurately calculate the hydrodynamic pressure in the watershed.
(2) Buried utility tunnels across river will be subject to acceleration amplification and aggregation effects, and acceleration amplification effects will be exhibited around the soil-structure in the center section of the river channel, and changes in the water level of the river channel will make the distribution of this acceleration response affective; the peak acceleration amplification factors are larger under bidirectional seismic excitation than under unidirectional excitation, although this response characteristic varies from site to site, and in the different locations.
(3) Under seismic forces, areas of tensile and compressive damage in utility tunnels are concentrated at the horizontal-sinking junction and extend to both ends. The damage in the utility tunnel was exacerbated by the bi-directional seismic excitation.
(4) Under two-way seismic excitation, the water body generates large hydrodynamic pressures, which increase significantly as the water level rises. The maximum hydrodynamic pressure under unidirectional seismic excitation is mainly concentrated at the bottom of the riverbanks on both sides. However, bidirectional seismic excitation expands the range of maximum hydrodynamic pressure and exacerbates its effect on the riverbed.
(5) Mises stresses and DAMAGEC in the utility tunnels were reduced by the rise in the river level, which had a negligible effect on the displacement response. This reduction may be attributed to the damping effect and energy dissipation of the river water body that suppresses the river bed. This phenomenon deserves further investigation in future studies.
Author Contributions
Y.W.: Conceptualization, Investigation, Methodology, Software, Validation, Formal analysis, Date curation, Visualization,Writing – original draft. Y.Z.: Formal analysis. Z.H.: Software, Methodology, Formal analysis. K.W.: Software, Date curation, Methodology.A.T.: Validation, Project administration, Resources, Writing – review & editing, Supervision, Funding acquisition.
Funding
This research was funded by The Provincial Key R&D Program of Hainan, China (Grant No. ZDYF2022SHFZ089).
Data Availability Statement
The original contributions presented in the study are included in the article/supplementary material, further inquiries can be directed to the corresponding author/s.
Conflicts of Interest
The authors declare that they have no known competing financial interests or personal relationships that could have appeared to influence the work reported in this paper.
References
- General Office of the State Council of the P.R. China, The guidance on promoting the construction of urban underground comprehensive pipe gallery. Beijing,China. 2015.
- Yang C, Peng F-L, Xu K, Zheng L-N, Feasibility study on the geothermal utility tunnel system. Sustain Cities Soc. 2019;46. [CrossRef]
- Luo Y, Alaghbandrad A, Genger T K, Hammad A, History and recent development of multi-purpose utility tunnels. Tunn Undergr Sp Technol. 2020;103. [CrossRef]
- Hashash Y M, Hook J J, Schmidt B, John I, Yao C, Seismic design and analysis of underground structures. Tunn Undergr Sp Technol. 2001;16(4):247-293. [CrossRef]
- Debiasi E, Gajo A, Zonta D, On the seismic response of shallow-buried rectangular structures. Tunn Undergr Sp Technol. 2013;38:99-113. [CrossRef]
- AKAMATSU J, MORIKAWA H, SAITO H, JIDO M, Relation between the distribution of damage caused by the 1995 Hyogoken-nambu earthquake and ground vibration characteristics inferred from microseisms. Journal of natural disaster science. 1995;16(2):63-70.
- Motosaka M, Nagano M, Analysis of Ground-Motion Amplification Characteristics in Kobe City Considering a Deep Irregular Underground Structure Interpretation of Heavily Damaged Belt Zone during the 1995 Hyogo-ken Nanbu Earthquake. J Phys Earth. 1996;44(5):577-590. [CrossRef]
- USAMI M, TESHIGAWARA M, KITAGAWA Y, KAWASE H, Estimation of strong ground motion and building damage in the 1995 Hyogo-ken Nanbu earthquake, in: Proceedings of the 12th World Conference Earthquake Engineering, Auckland, New Zealand, 2000.
- Wang Z, Chang L, Ma H, Zhu L, Cui G, Shan H, He Z, Seismic isolation technology of shallow buried large section utility tunnel with soft soils in seismically vulnerable area. Front Earth Sc-Switz. 2024;12. [CrossRef]
- Yue F, Liu B, Zhu B, Jiang X, Chen S, Jaisee S, Chen L, Lv B, Shaking table investigations on seismic performance of prefabricated corrugated steel utility tunnels. Tunn Undergr Sp Technol. 2020;105. [CrossRef]
- Chen J, Shi X, Li J, Shaking table test of utility tunnel under non-uniform earthquake wave excitation. Soil Dynam Earthq Eng. 2010;30(11):1400-1416. [CrossRef]
- Chen J, Jiang L, Li J, Shi X, Numerical simulation of shaking table test on utility tunnel under non-uniform earthquake excitation. Tunn Undergr Sp Technol. 2012;30:205-216. [CrossRef]
- Shamsabadi A, Sedarat H, Kozak A, Seismic soil-tunnel-structure interaction analysis and retrofit of the posey-webster street tunnels, in: 2nd US-JAPAN Soil-Structure-Interaction Workshop: Tsukuba, Japan:[sn], 2001, pp. 1-21.
- Konstandakopoulou F D, Beskou N D, Hatzigeorgiou G D, Three-dimensional nonlinear response of utility tunnels under single and multiple earthquakes. Soil Dynam Earthq Eng. 2021;143. [CrossRef]
- Ulgen D, Saglam S, Ozkan M Y, Dynamic response of a flexible rectangular underground structure in sand: centrifuge modeling. Bull Earthq Eng. 2015;13(9):2547-2566. [CrossRef]
- Tsinidis G, Response characteristics of rectangular tunnels in soft soil subjected to transversal ground shaking. Tunn Undergr Sp Technol. 2017;62:1-22. [CrossRef]
- Hushmand A, Dashti S, Davis C, McCartney J S, Hushmand B, A centrifuge study of the influence of site response, relative stiffness, and kinematic constraints on the seismic performance of buried reservoir structures. Soil Dynam Earthq Eng. 2016;88:427-438. [CrossRef]
- Westergaard H M, Water pressures on dams during earthquakes. Trans Am Soc Civ Eng. 1933;98(2):418-433. [CrossRef]
- LLin G, Du J, Hu Z, Dynamic dam-reservoir interaction analysis including effect of reservoir boundary absorption. Sci China Ser E: Technol Sci. 2007;50(Suppl 1):1-10. [CrossRef]
- Fu Z-z, Chen S-s, Li G-y, Hydrodynamic pressure on concrete face rockfill dams subjected to earthquakes. J Hydrodyn. 2019;31(1):152-168. [CrossRef]
- Xu Y, Haikou's first underground integrated pipe corridor main body completed. Hainan Daily.haikou,China. 2016.
- National Standard of PR China, GB 50909-2014 Code for Seismic Design of Urban Rail Transit Structures. Shanghai,China. 2014.
- Ouyang Z, Cui J, Lu Y, Li Y, THE EFFECT OF OBLIQUELY INCIDENT SEISMIC WAVE ON DYNAMIC RESPONSE OF SEA TUNNEL, in: 14th International Symposium on Structural Engineering (ISSE-14), Beijing, PEOPLES R CHINA, 2016, pp. 1601-1607.
- Lyu D, Yu C, Ma S, Wang X, Nonlinear Seismic Response of a Hydraulic Tunnel Considering Fluid-Solid Coupling. Math Probl Eng. 2018;2018. [CrossRef]
- Lin H, Zhao J, Wu D, Huang W, Hydrodynamic pressures analysis of submerged floating tunnel under coaction of seismic SV wave and ocean wave. Adv Struct Eng. 2022;25(15):3101-3113. [CrossRef]
- Fan H, Zhu Z, Song Y, Zhang S, Zhu Y, Gao X, Hu Z, Guo J, Han Z, Water pressure evolution and structural failure characteristics of tunnel lining under hydrodynamic pressure. Eng Fail Anal. 2021;130. [CrossRef]
- Rawat A, Mittal V, Chakraborty T, Matsagar V, Earthquake induced sloshing and hydrodynamic pressures in rigid liquid storage tanks analyzed by coupled acoustic-structural and Euler-Lagrange methods. Thin Wall Struct. 2019;134:333-346. [CrossRef]
- Patil M, Choudhury D, Ranjith P, Zhao J, Behavior of shallow tunnel in soft soil under seismic conditions. Tunn Undergr Sp Technol. 2018;82:30-38. [CrossRef]
- Wang K, Chen Y, Huang Z, Tang A, Analysis of Influence Characteristics of Site Conditions on Seismic Response of Utility Tunnel. buildings. 2024;14(4):1042. [CrossRef]
- Du X, Zhao M, Wang J, A stress artificial boundary in FEA for near-field wave problem. Chinese Journal of Theoretical and Applied Mechanics. 2006;38(1):49. (in Chinese). [CrossRef]
- National Standard of PR China, GB 18306-2015 Seismic Ground Motion Parameters Zonation Map of China. Beijing,China. 2015.
- Huang J. Study On Nonlinear Seismic Response Of Rock Tunnels. PhD Thesis. China:Beijing University of Technology. 2015.
- Huang Z, Feng Y, Tang A, Liu Q, Influence of oblique incidence of P-waves on seismic response of prefabricated utility tunnels considering joints. Soil Dynam Earthq Eng. 2023;167:107797. [CrossRef]
- National Standard of PR China, GB 50011—2010 Code for Seismic Design of Buildings. Beijing,China. 2016.
- Tallett-Williams S, Gosh B, Wilkinson S, Fenton C, Burton P, Whitworth M, Datla S, Franco G, Trieu A, Dejong M, Novellis V, White T, Lloyd T, Site amplification in the Kathmandu Valley during the 2015 M 7.6 Gorkha, Nepal earthquake. Bull Earthq Eng. 2016;14(12):3301-3315. [CrossRef]
- Chen W, Lü Z, Xu L, Ruan B, Ma J, Chen G, Seismic response of subsea tunnels considering seawater seabed coupling effect. Journal of Engineering Geology. 2021;29(06):1878-1886. (in Chinese). [CrossRef]
Figure 1.
Parameters and settings for the reservoir-dam 2D coupled model.
Figure 1.
Parameters and settings for the reservoir-dam 2D coupled model.
Figure 2.
Sinusoidal wave time history curve.
Figure 2.
Sinusoidal wave time history curve.
Figure 3.
Maximum hydrodynamic pressure.
Figure 3.
Maximum hydrodynamic pressure.
Figure 4.
Hydrodynamic pressure at the nodes Wb and Wm.
Figure 4.
Hydrodynamic pressure at the nodes Wb and Wm.
Figure 5.
River Water—Soil—Utility Tunnel Spatial position and 3D model.
Figure 5.
River Water—Soil—Utility Tunnel Spatial position and 3D model.
Figure 8.
Monitoring point acceleration time course.
Figure 8.
Monitoring point acceleration time course.
Figure 9.
Relationship of acceleration amplification and water volume in the river.
Figure 9.
Relationship of acceleration amplification and water volume in the river.
Figure 10.
Peak Mises stress at the apex of the reference cross-sections.
Figure 10.
Peak Mises stress at the apex of the reference cross-sections.
Figure 11.
Mises stress clouds for reference sections Sc and Sf, ((a),(c) z unidirectional seismic excitation; (b),(d) z+y Bidirectional seismic excitations).
Figure 11.
Mises stress clouds for reference sections Sc and Sf, ((a),(c) z unidirectional seismic excitation; (b),(d) z+y Bidirectional seismic excitations).
Figure 12.
Plastic damage distribution cloud map,(15s).((a) one seismic excitation, (b) two seismic excitations.).
Figure 12.
Plastic damage distribution cloud map,(15s).((a) one seismic excitation, (b) two seismic excitations.).
Figure 13.
Hydrodynamic pressure distribution cloud map ((a), (b) one seismic excitation; (c), (d) two seismic excitation).
Figure 13.
Hydrodynamic pressure distribution cloud map ((a), (b) one seismic excitation; (c), (d) two seismic excitation).
Figure 14.
Hydrodynamic pressure on the reference path,( (a) and (b) Reference path across the river direction, (c) and (d) Reference path in the direction of along the river.).
Figure 14.
Hydrodynamic pressure on the reference path,( (a) and (b) Reference path across the river direction, (c) and (d) Reference path in the direction of along the river.).
Figure 15.
The variation of the maximum hydrodynamic pressure within the study area as a function of river water depth..
Figure 15.
The variation of the maximum hydrodynamic pressure within the study area as a function of river water depth..
Figure 16.
Displacement history curve of monitoring points in the middle of the utility tunnel.((a) Horizontal,(b) vertical).
Figure 16.
Displacement history curve of monitoring points in the middle of the utility tunnel.((a) Horizontal,(b) vertical).
Figure 17.
Bending moment and Internal force distribution curve of the utility tunnel.
Figure 17.
Bending moment and Internal force distribution curve of the utility tunnel.
Figure 18.
Tensile damage, Compressive damage distribution cloud map.
Figure 18.
Tensile damage, Compressive damage distribution cloud map.
Table 1.
Soil parameters in this model.
Table 1.
Soil parameters in this model.
| Soil Type |
Density (kg/m3) |
Elastic Modulus (MPa) |
Poisson’s Ratio |
Friction Angle (◦) |
Cohesion (kPa) |
DilationAngle (◦) |
| red clay |
1850 |
8 |
0.3 |
15 |
35 |
10 |
Table 2.
Concrete and steel bar physical and material properties.
Table 2.
Concrete and steel bar physical and material properties.
| |
Concrete |
Steel Bar |
| Density (kg/m3) |
2400 |
7800 |
| Elastic modulus (GPa) |
31.5 |
206 |
| Poisson’s ratio |
0.2 |
0.3 |
| Yield stress (MPa) |
- |
400 |
| Dilation angle (◦) |
30 |
- |
| Eccentricity |
0.1 |
- |
| Stress ratio |
1.16 |
- |
| K |
0.0667 |
- |
| Viscosity parameter |
0.005 |
- |
Table 3.
Concrete tensile and compressive parameters.
Table 3.
Concrete tensile and compressive parameters.
| Stress (MPa) |
Inelastic Strain |
Damage Factor |
Stress (MPa) |
Cracking Strain |
Damage Factor |
| 14.07 |
0 |
0 |
1.76 |
0 |
0 |
| 17.61 |
0.064 |
0.027 |
2.09 |
0.007 |
0.021 |
| 19.97 |
0.141 |
0.069 |
2.09 |
0.047 |
0.167 |
| 22.32 |
0.295 |
0.139 |
1.87 |
0.081 |
0.284 |
| 23.40 |
0.557 |
0.232 |
1.76 |
0.097 |
0.335 |
| 22.22 |
0.945 |
0.337 |
1.65 |
0.114 |
0.385 |
| 19.87 |
1.376 |
0.433 |
1.43 |
0.150 |
0.481 |
| 16.34 |
2.017 |
0.551 |
1.09 |
0.220 |
0.622 |
| 12.82 |
2.818 |
0.661 |
0.76 |
0.332 |
0.760 |
| 9.28 |
4.027 |
0.771 |
0.43 |
0.582 |
0.890 |
Table 5.
Peak acceleration and Peak acceleration amplification factors at each monitoring point.
Table 5.
Peak acceleration and Peak acceleration amplification factors at each monitoring point.
| Monitoring points |
Sa
|
Sb
|
Sc
|
Sd
|
Se
|
Sf
|
Sg
|
Sh
|
| |
z |
z+y |
- |
- |
- |
- |
- |
- |
- |
- |
- |
- |
- |
- |
- |
- |
| Peak Acc |
4.22 |
4.20 |
7.51 |
7.83 |
4.89 |
4.68 |
4.9 |
5.9 |
3.05 |
3.99 |
3.54 |
3.14 |
3.79 |
5.1 |
7.79 |
7.88 |
| PAAF 1
|
1.04 |
1.04 |
1.86 |
1.94 |
1.21 |
1.15 |
1.21 |
1.46 |
0.75 |
0.99 |
0.88 |
0.78 |
0.93 |
1.26 |
1.93 |
1.95 |
Table 6.
Peak field output.
Table 6.
Peak field output.
| Field output |
dry seasons |
half water level |
full water level |
| U(m) |
2.418×10⁻¹
|
2.334×10⁻¹
|
2.246×10⁻¹
|
| MISES(Pa) |
1.419×10⁷
|
1.299×10⁷
|
9.984×10⁶
|
| DAMAGEC |
3.060×10⁻¹
|
2.657×10⁻¹
|
2.414×10⁻¹
|
| DAMAGET |
3.848×10⁻¹
|
3.848×10⁻¹
|
3.848×10⁻¹
|
| SDEG |
5.174×10⁻¹
|
4.623×10⁻¹
|
4.530×10⁻¹
|
| ACC(m/s2) |
0.620×10 |
0.821×10 |
0.896×10 |
|
Disclaimer/Publisher’s Note: The statements, opinions and data contained in all publications are solely those of the individual author(s) and contributor(s) and not of MDPI and/or the editor(s). MDPI and/or the editor(s) disclaim responsibility for any injury to people or property resulting from any ideas, methods, instructions or products referred to in the content. |
© 2024 by the authors. Licensee MDPI, Basel, Switzerland. This article is an open access article distributed under the terms and conditions of the Creative Commons Attribution (CC BY) license (http://creativecommons.org/licenses/by/4.0/).
