1. Introduction
Global energy demand is expected to grow by about 25% over the next decade[
1]. Though renewable energy will take greater shares in the future energy supply, petroleum, as a primary chemical raw material, will remain in high demand. China’s oil reserves are dominated by low-permeability reservoirs. The ultimate oil recovery rate of low-permeability reservoirs are much lower than 35%, the global average[
2]. As one of enhanced oil recovery (EOR) technologies and meanwhile a carbon storage option, CO
2-EOR is double beneficial to oil reservoirs [
3]: not only enhancing oil recovery but also allowing for long-term geological storage of CO
2 to mitigate climate change [
4]. However, low injectivity poses many challenges for CO
2-EOR application in low-permeability oil reservoirs.[
5,
6].
In recent years, significant progress has been made in CO
2 enhanced oil recovery technology for improving the recovery rate in low permeability oil reservoirs. For instance, Gong and Gu (2015) showed that CO
2-EOR can significantly improve oil and gas recovery rates in sandstone and carbonate reservoirs, although fractures may reduce its efficiency[
7]. Additionally, Wang et al. (2017) found that during the CO
2-EOR process in ultra-low permeability reservoirs, phenomena such as gas breakthrough and the formation of extensive gas channels often occur, necessitating improved injection strategies[
8]. Experimental research by Zhou et al. (2019) emphasized that micro-pore characteristics of rocks, such as pore size distribution and connectivity, are critical factors determining the success of CO
2-EOR[
9]. Furthermore, research by Han et al. (2021) showed that the density and distribution of fracture networks directly affect the flow paths of CO
2 and ultimately the efficiency of oil recovery[
10]. Liu and Zhang (2015) through simulation studies indicated that adjustments in the pressure and rate of CO
2 injection can effectively control gas breakthrough, thereby enhancing recovery rates in low permeability reservoirs[
11]. Similarly, Abedini and Torabi (2014) conducted a series of experiments with cyclic CO
2 injection, pointing out that cyclic injection can significantly enhance the storage potential of CO
2 in reservoirs, as well as increase crude oil recovery[
12]. Li et al. (2018) determined the diffusion coefficients of supercritical CO
2 under tight reservoir conditions using the pressure decay method, providing important data for optimizing CO
2-EOR technology[
13].
Although CO
2-EOR holds great potential for enhancing oil recovery efficiency in low permeability reservoirs, some key areas deserve continuous attention. For instance, systematic quantitative analysis and in-depth mechanistic studies should be strengthened in the effects on CO
2 displacement of different physical conditions, such as pressure, temperature, and rock properties, especially under extreme or complex geological conditions [
14,
15,
16,
17]. In this study, we analyzed the CO
2 displacement process in low permeability reservoirs using Nuclear Magnetic Resonance (NMR) technology, particularly exploring the characteristics of displacement efficiency at different injection stages. The oil displacement behavior of CO
2 in low-permeability reservoirs and its impact on displacement efficiency are studied. The characteristics and efficiency of different displacement stages of the CO
2 displacement process in low permeability reservoirs are quantitatively described. This research not only enhances understanding of the CO
2 oil displacement mechanism in low permeability reservoirs but also provides quantitative data and analysis for optimizing development strategies, significantly impacting industrial practices.
2. Methodology
2.1. Material
The cores were sampled from the Yanchang Formation at the depths of 1200 to 1500m in the Xingzichuan oilfield in the Huaziping area, Ansai County, Shaanxi Province (
Table 1). The oilfield has 385 production wells and 100 water injection wells. The 6
th Section of Yanchang Formation (Chang 6) bears oil, and the overlying 4
th and 5
th sections (Chang 4+5) act as the caprock. The total thickness is 70 to 90 meters. Pores in the Chang 6 section have various types, including primary residual intergranular pores, dissolution intergranular pores, micropores, and microfractures. The sandstone grain size predominantly exhibits a fine-grained structure, with some parts showing medium-fine and silt-fine grain structures, and relatively fine grain sizes, with no coarse sandstone or conglomerate observed.
2.2. Equipment
The Oxford-MARAN DRX 2 Nuclear Magnetic Resonance (NMR) instrument from the UK is used to measure NMR parameters such as longitudinal and transverse relaxation times of rocks in a constant magnetic field (with a resonance frequency of 2 MHz). The synchronous core displacement NMR system comprises an oil injection system, gas injection system, confining pressure and temperature control system, core holder system, radio frequency and signal processing system, and displacement outlet control system. The experiment uses a specialized non-magnetic core holder, with the pressure of fluorine oil inside the holder controlled by the confining pressure and temperature control system.
2.3. Experimental Procedure
(1) Place the sample in an oven to dry for 48 hours and then weigh it. Determine the core permeability using a gas drive method.
(2) Evacuate the core sample and saturate it with formation water, then weigh the (wet) core sample. Calculate the porosity based on the ratio of the water volume in the core to the core volume. Perform NMR detection to obtain the T2 spectrum of the water-saturated core sample and determine the pore distribution within the core.
(3) Inject crude oil into the water-saturated core sample at a constant rate of 0.02 mL/min. After oil saturation, perform NMR detection to obtain the T2 spectrum of the oil-saturated core sample to determine the initial oil saturation.
(4) Wrap the core sample in heat shrink tubing and place it in the core holder. Tighten the screws at both ends of the holder to secure the core, setting the temperature to 46°C. Perform NMR testing to obtain the initial T2 relaxation spectrum and the saturated oil core image.
(5) Start the gas injection device and inject CO2 into the core at a constant or variable pressure. During the oil displacement process, record the oil displacement pressure differential and oil recovery rate in real-time until no more oil is produced at the production end.
(6) After the oil displacement test, perform NMR testing again to obtain the T2 relaxation spectrum and core image of the remaining oil. Calculate the oil saturation before and after CO2 displacement using the area method on each T2 spectrum.
(7) Shut off the gas injection device, open the gas control valve to release the injection pressure, adjust the pressure to reduce it to 0 MPa, and remove the core sample from the core holder.
To study the effect of different core permeabilities on CO2 oil displacement efficiency, select core samples with the same dimensions but different permeabilities and repeat the above experimental operations (steps 1 to 7) to conduct displacement experiments.
3. Results and Discussion
3.1. Pore Distribution
In the NMR experiments, the T2 spectrum is of significant value in characterizing oil saturation and multiphase flow. Based on the literature[
22], the correlation between T2 relaxation time and pore size was calculated. The pore size distribution of the rock samples is shown in
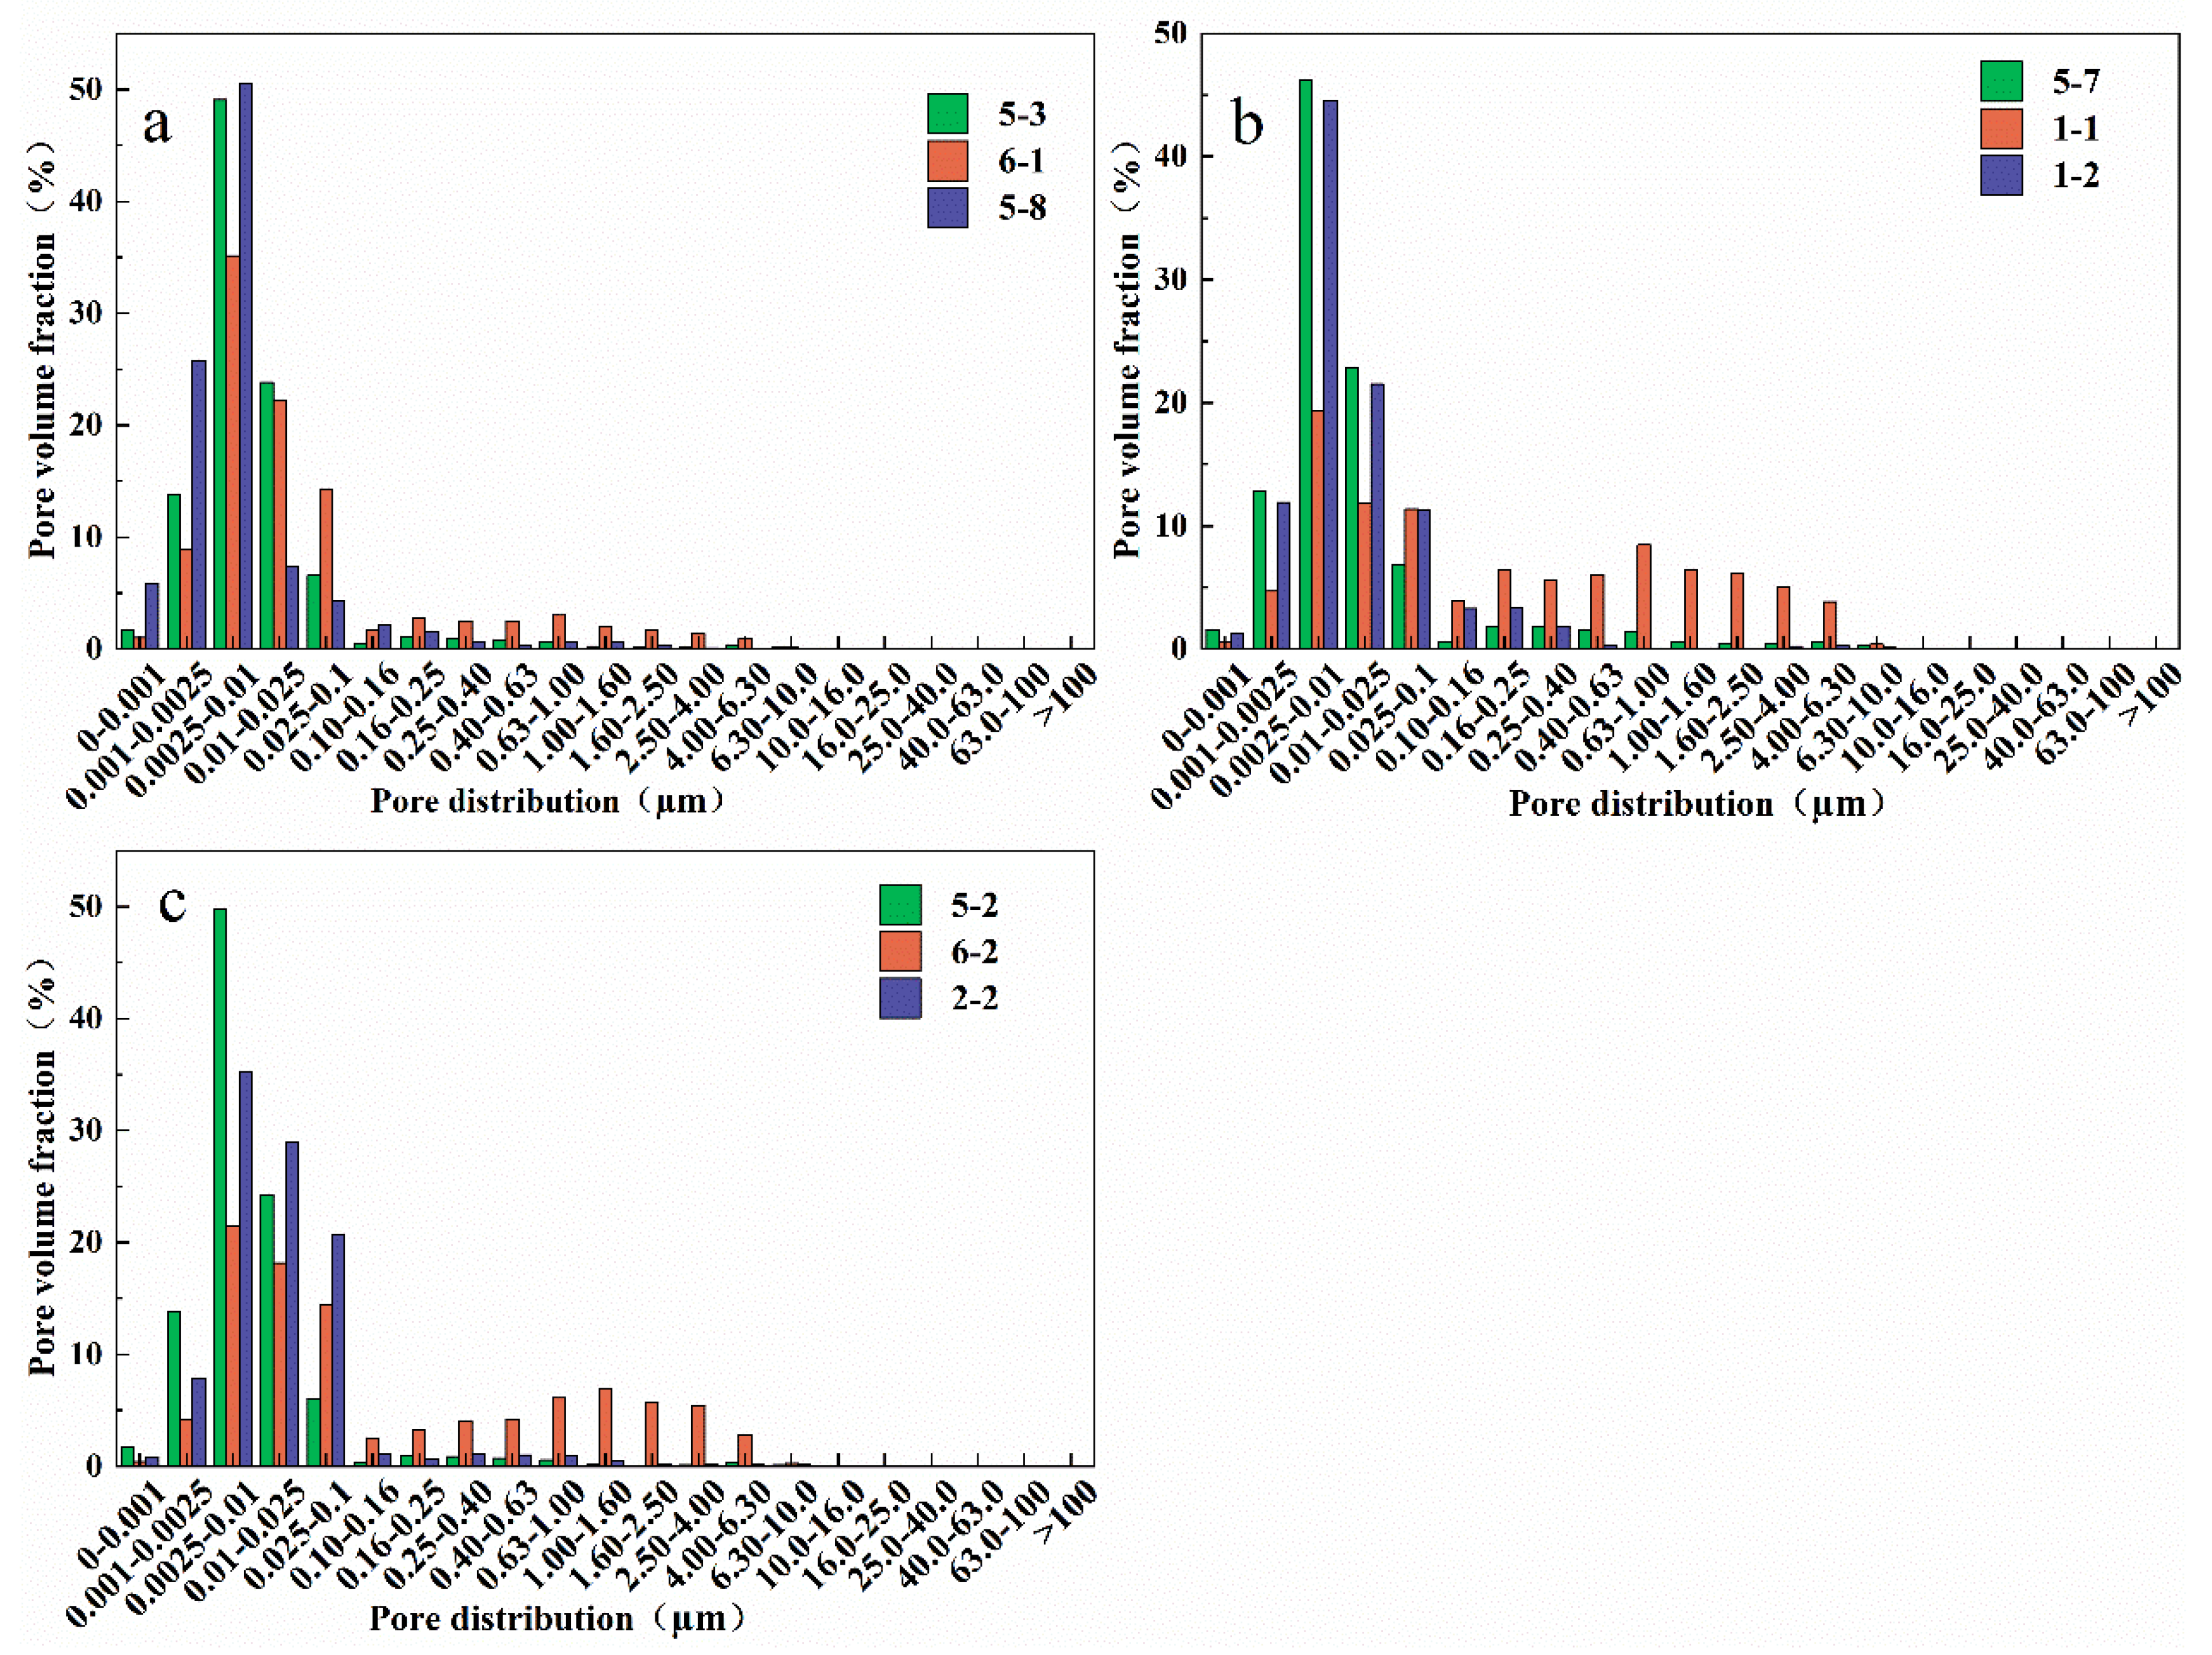
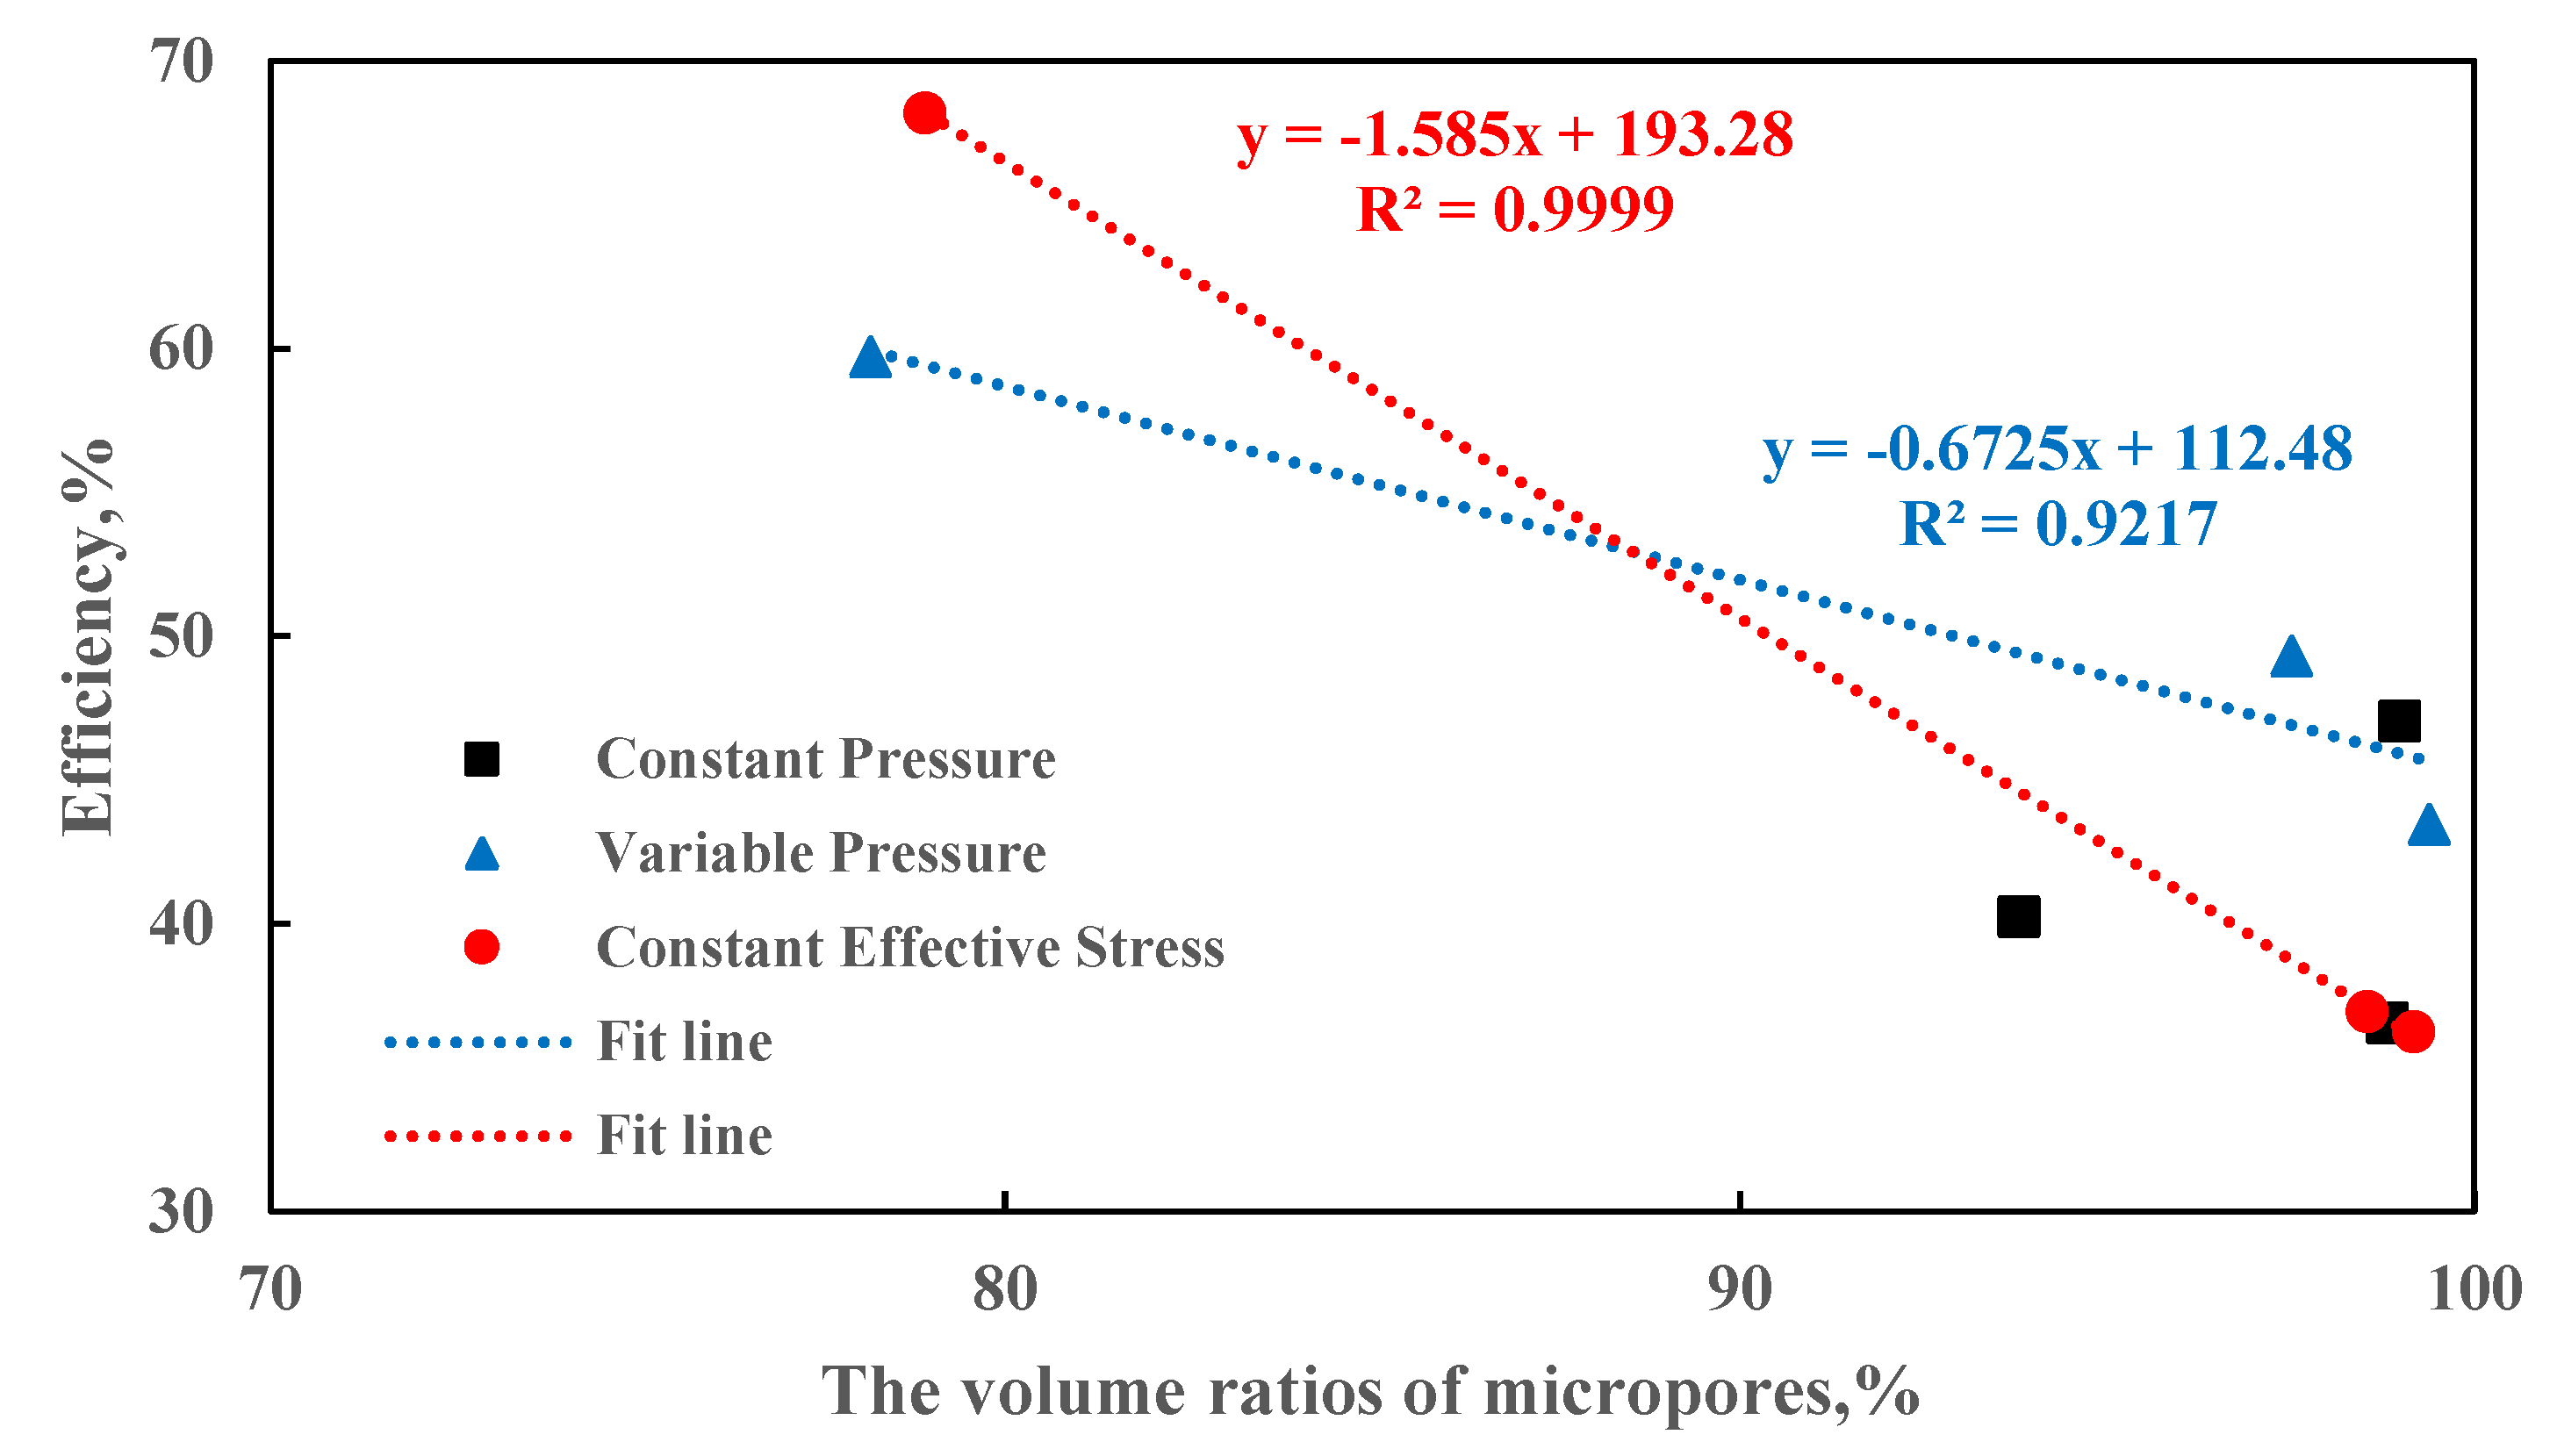
Figure 1, with the samples primarily consisting of micropores (0-1µm). The volume ratios of micropores for cores 5-3, 6-1, 5-8, 5-7, 1-1, 1-2, 5-2, 6-2, and 2-2 are 98.82%, 93.80%, 98.98%, 97.52%, 78.17%, 99.39%, 99.17%, 78.91%, and 98.54%, respectively; the CO
2 displacement efficiencies are 36.55%, 40.23%, 47.05%, 49.30%, 59.70%, 43.45%, 36.24%, 68.21%, and 36.94%, respectively. The measured porosity and permeability of the cores are shown in
Table 2. Among them, cores 5-3, 5-7, and 5-2 are tight cores, cores 6-1, 1-1, and 6-2 are ultra-low permeability cores, and fractured cores 5-8, 1-2, and 2-2 are extremely low permeability cores. Compared to previous studies, the cores used in this experiment have a higher volume proportion of micropores, with most reaching over 90%[
23]. Under the same displacement conditions, there is a significant negative correlation between the volume proportion of micropores in the rock samples and CO
2 displacement efficiency (
Figure 2). This implies that a higher proportion of micropores generally results in lower displacement efficiency of the rock samples[
24]. This relationship is attributed to the obstruction of fluid flow by the microporous structure; a high proportion of micropores impedes the effective passage of fluids through the core, thereby reducing displacement efficiency[
25].
3.2. T2 Spectra Change During Core Flooding
When CO
2 displaces oil in the core, the T2 spectrum is used to dynamically monitor changes in oil flow and the distribution of residual oil. Based on previous studies[
23,
26], the horizontal coordinate intervals in the T2 spectrum are defined as follows: <1ms is defined as the micropore region, 1-10ms as the small pore region, 10-100ms as the medium pore region, and 100-1000ms as the large pore region. Additionally, since the oil in the fracture experiences less force from the solid surface of the core compared to the oil in the matrix, the relaxation time of oil in the fractures is longer.
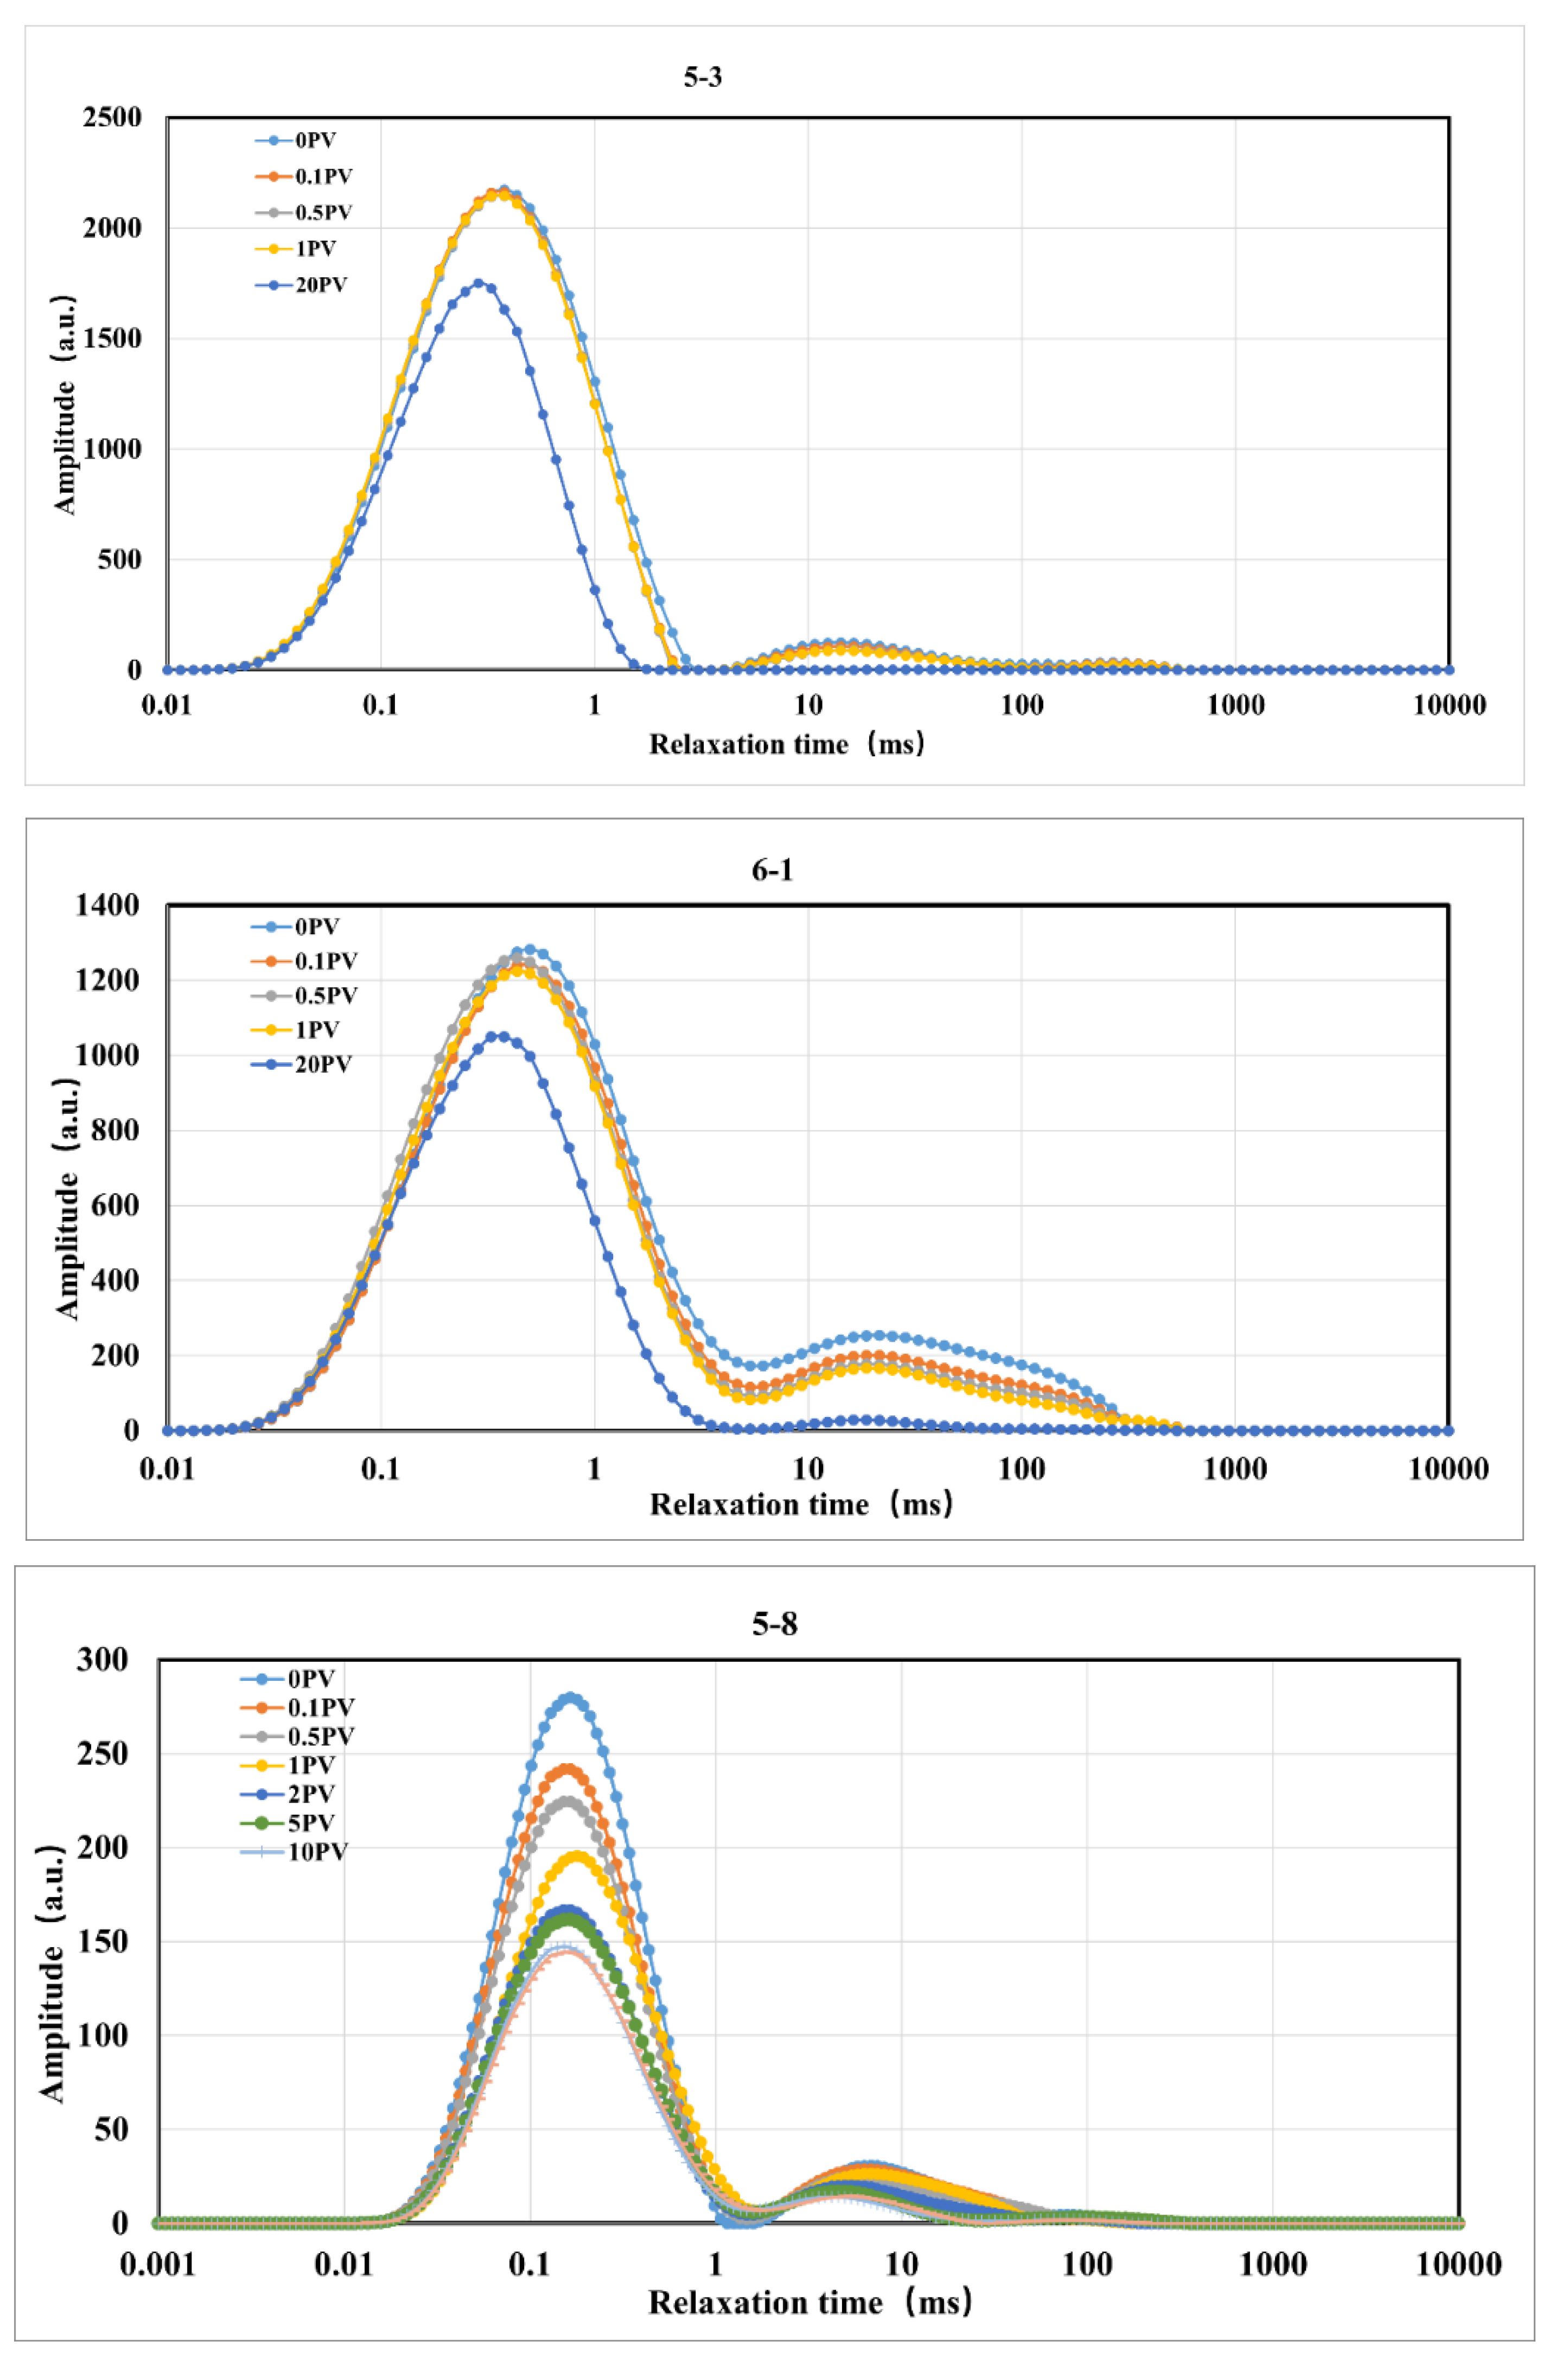
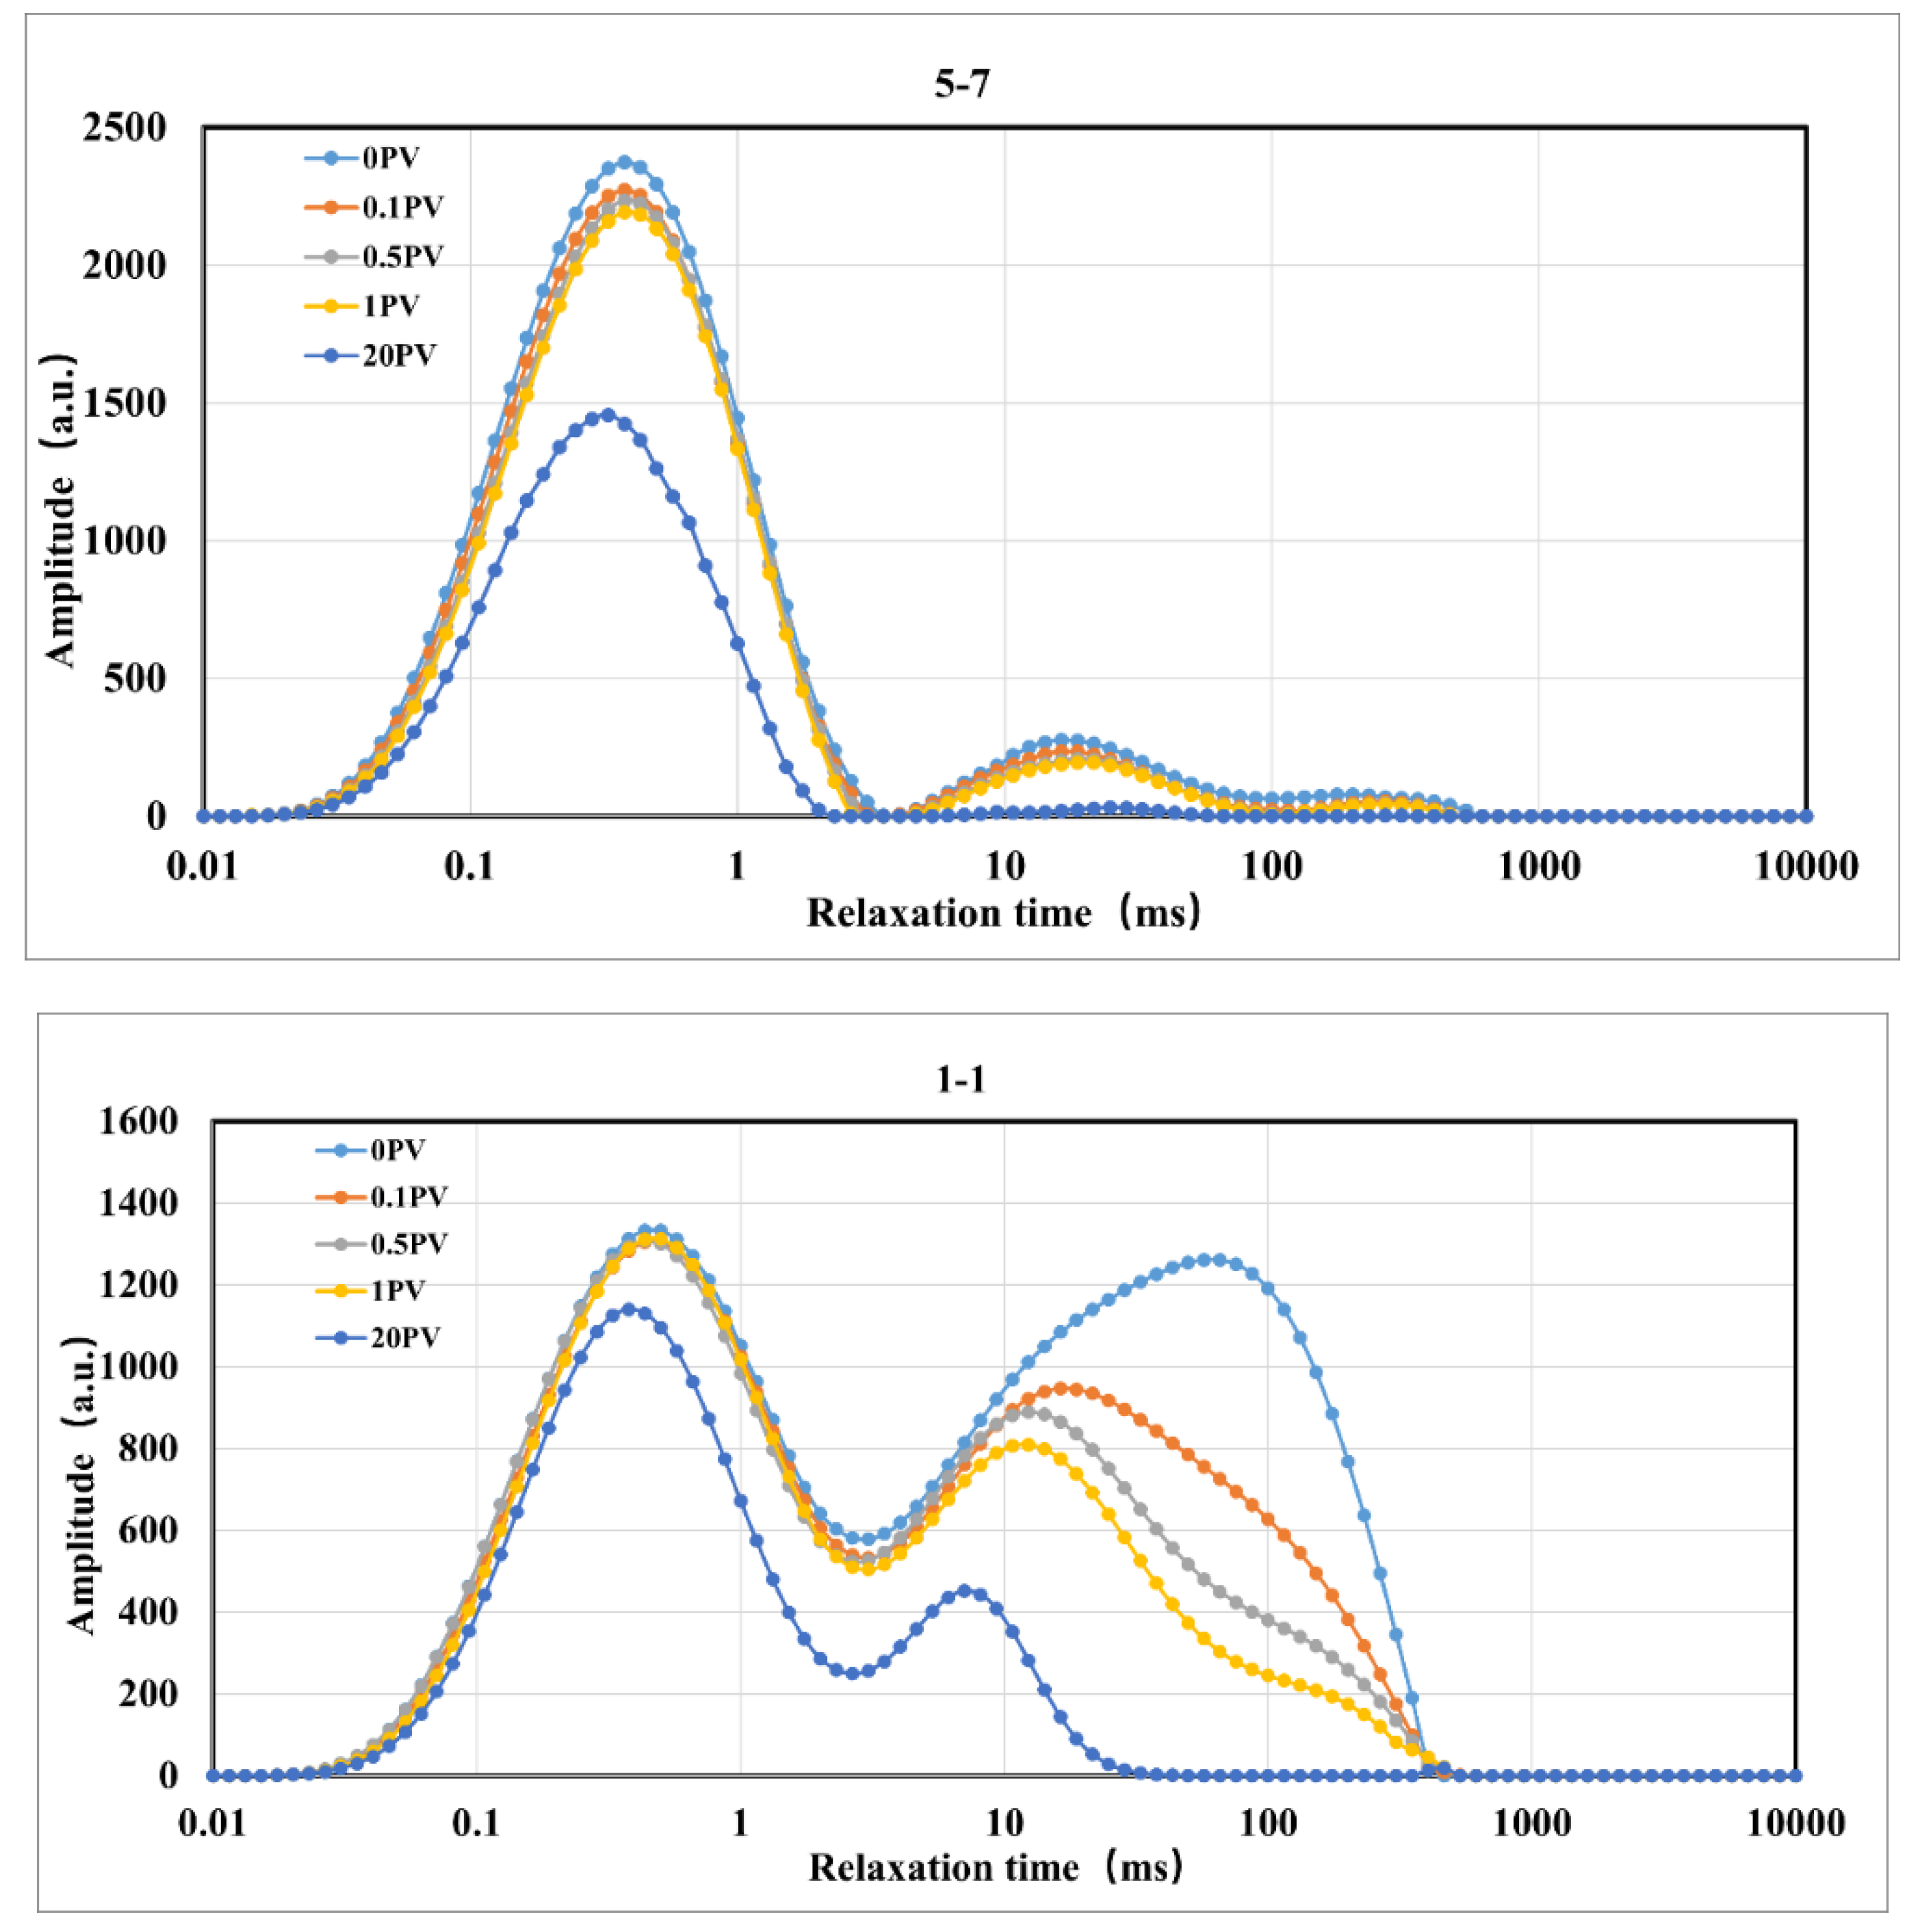
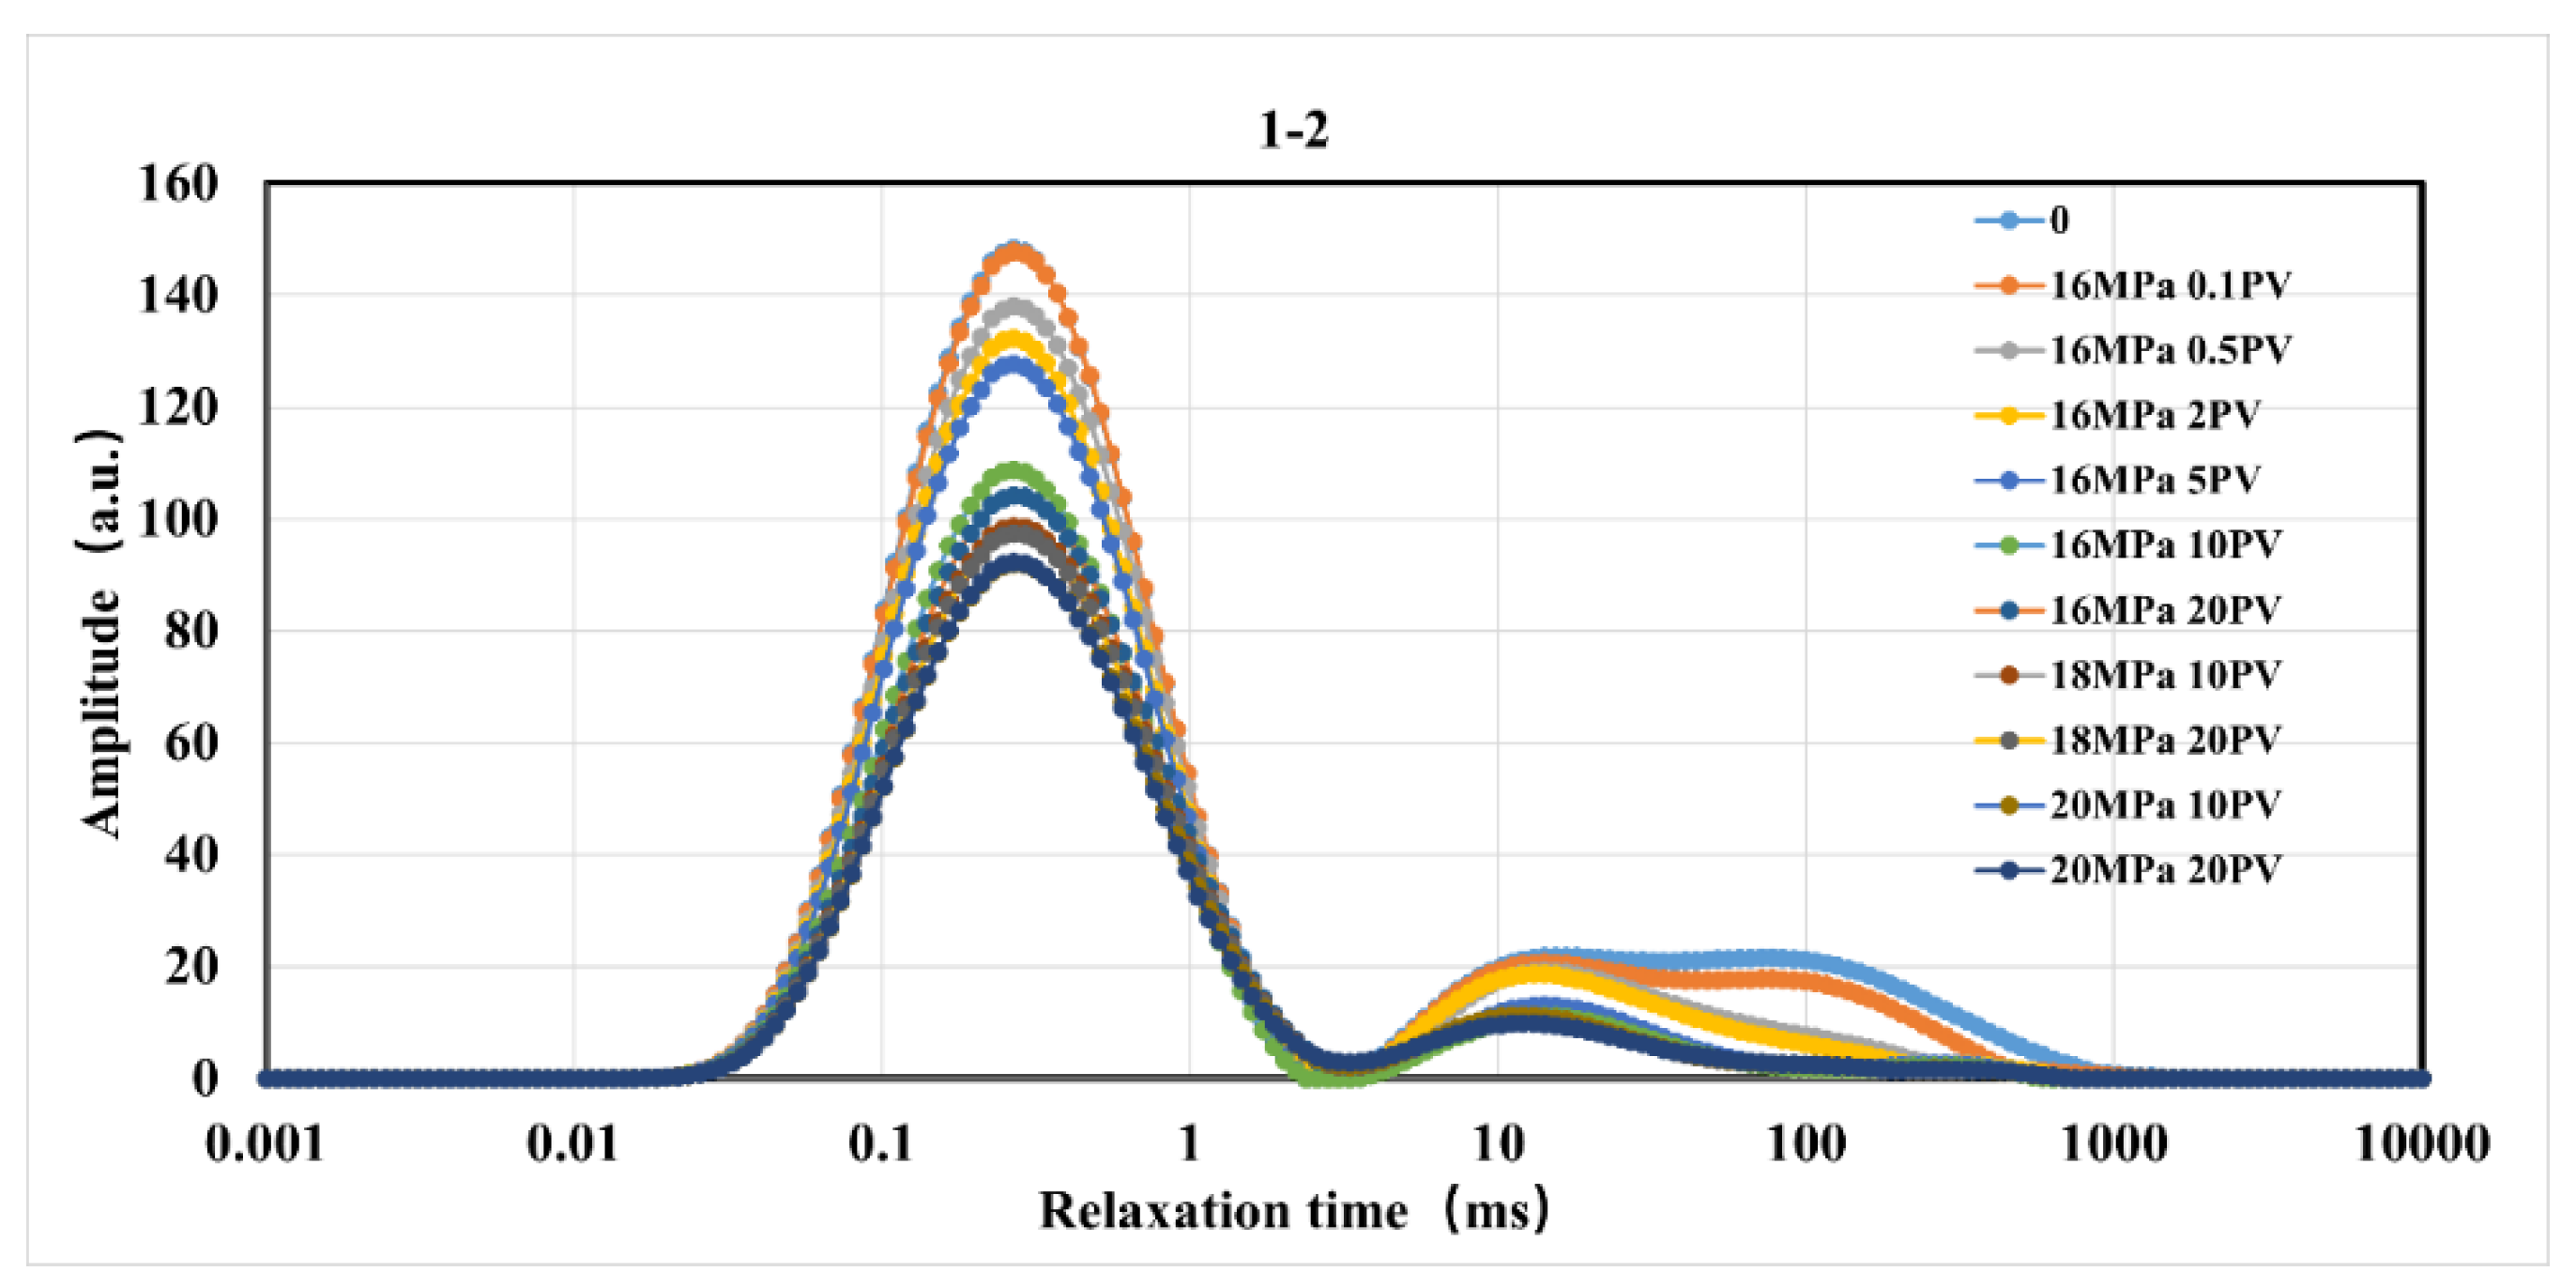
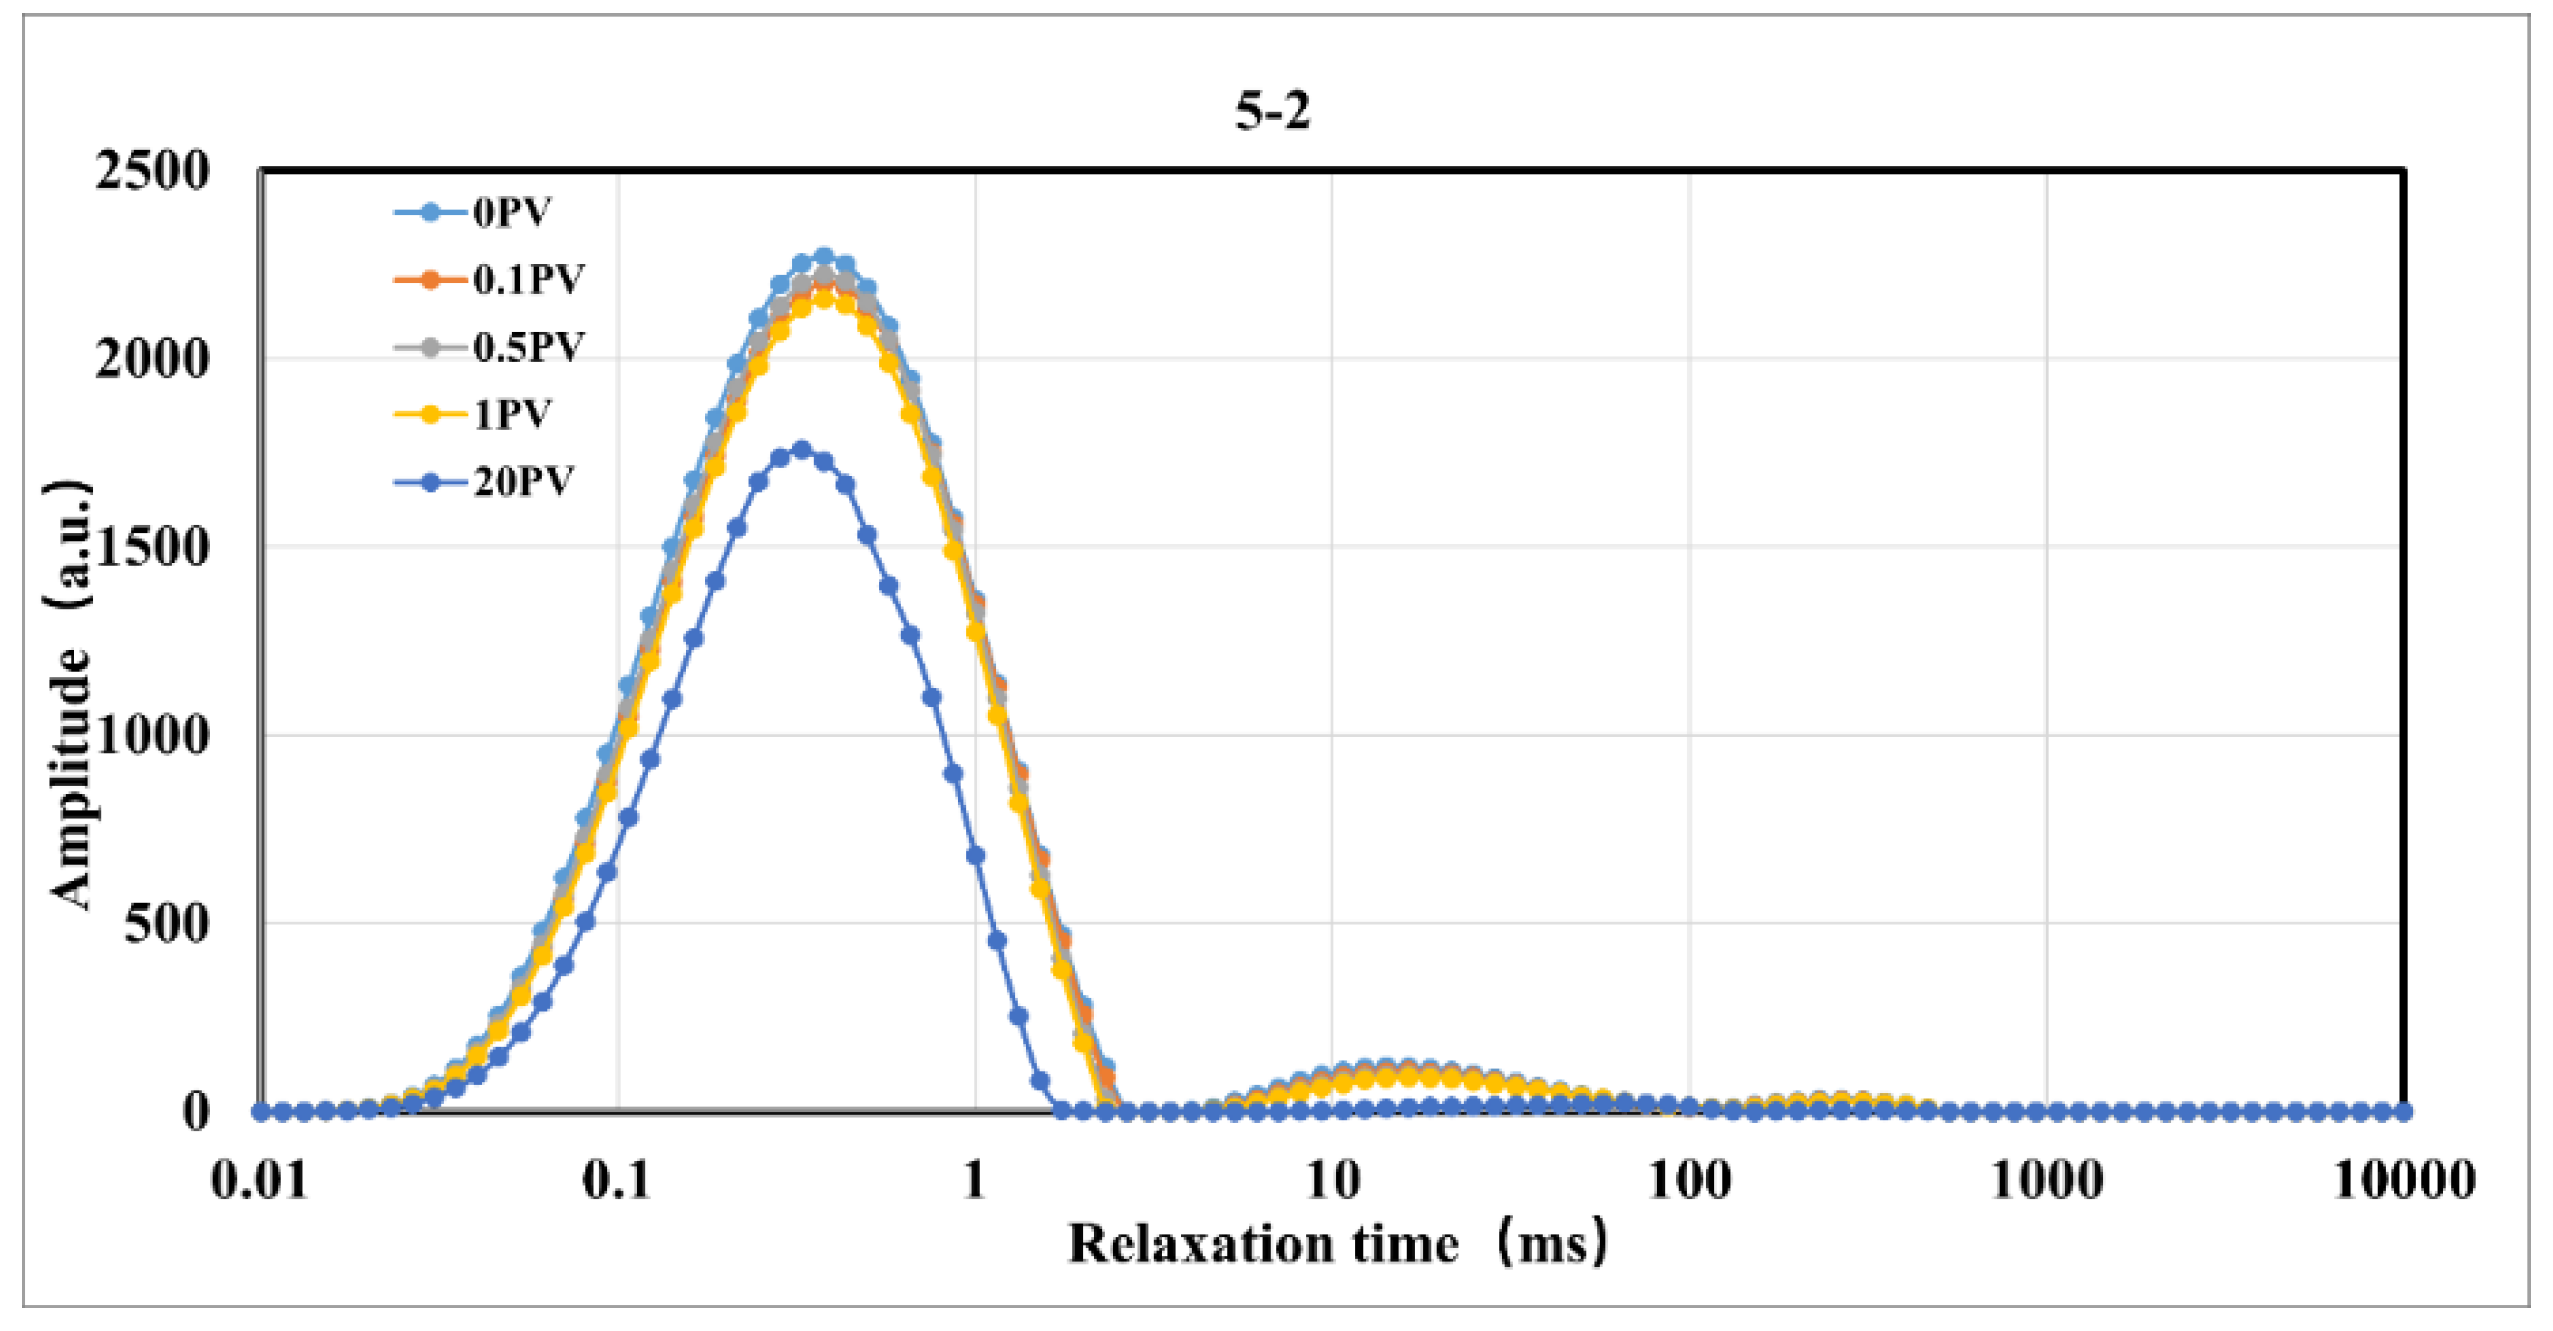
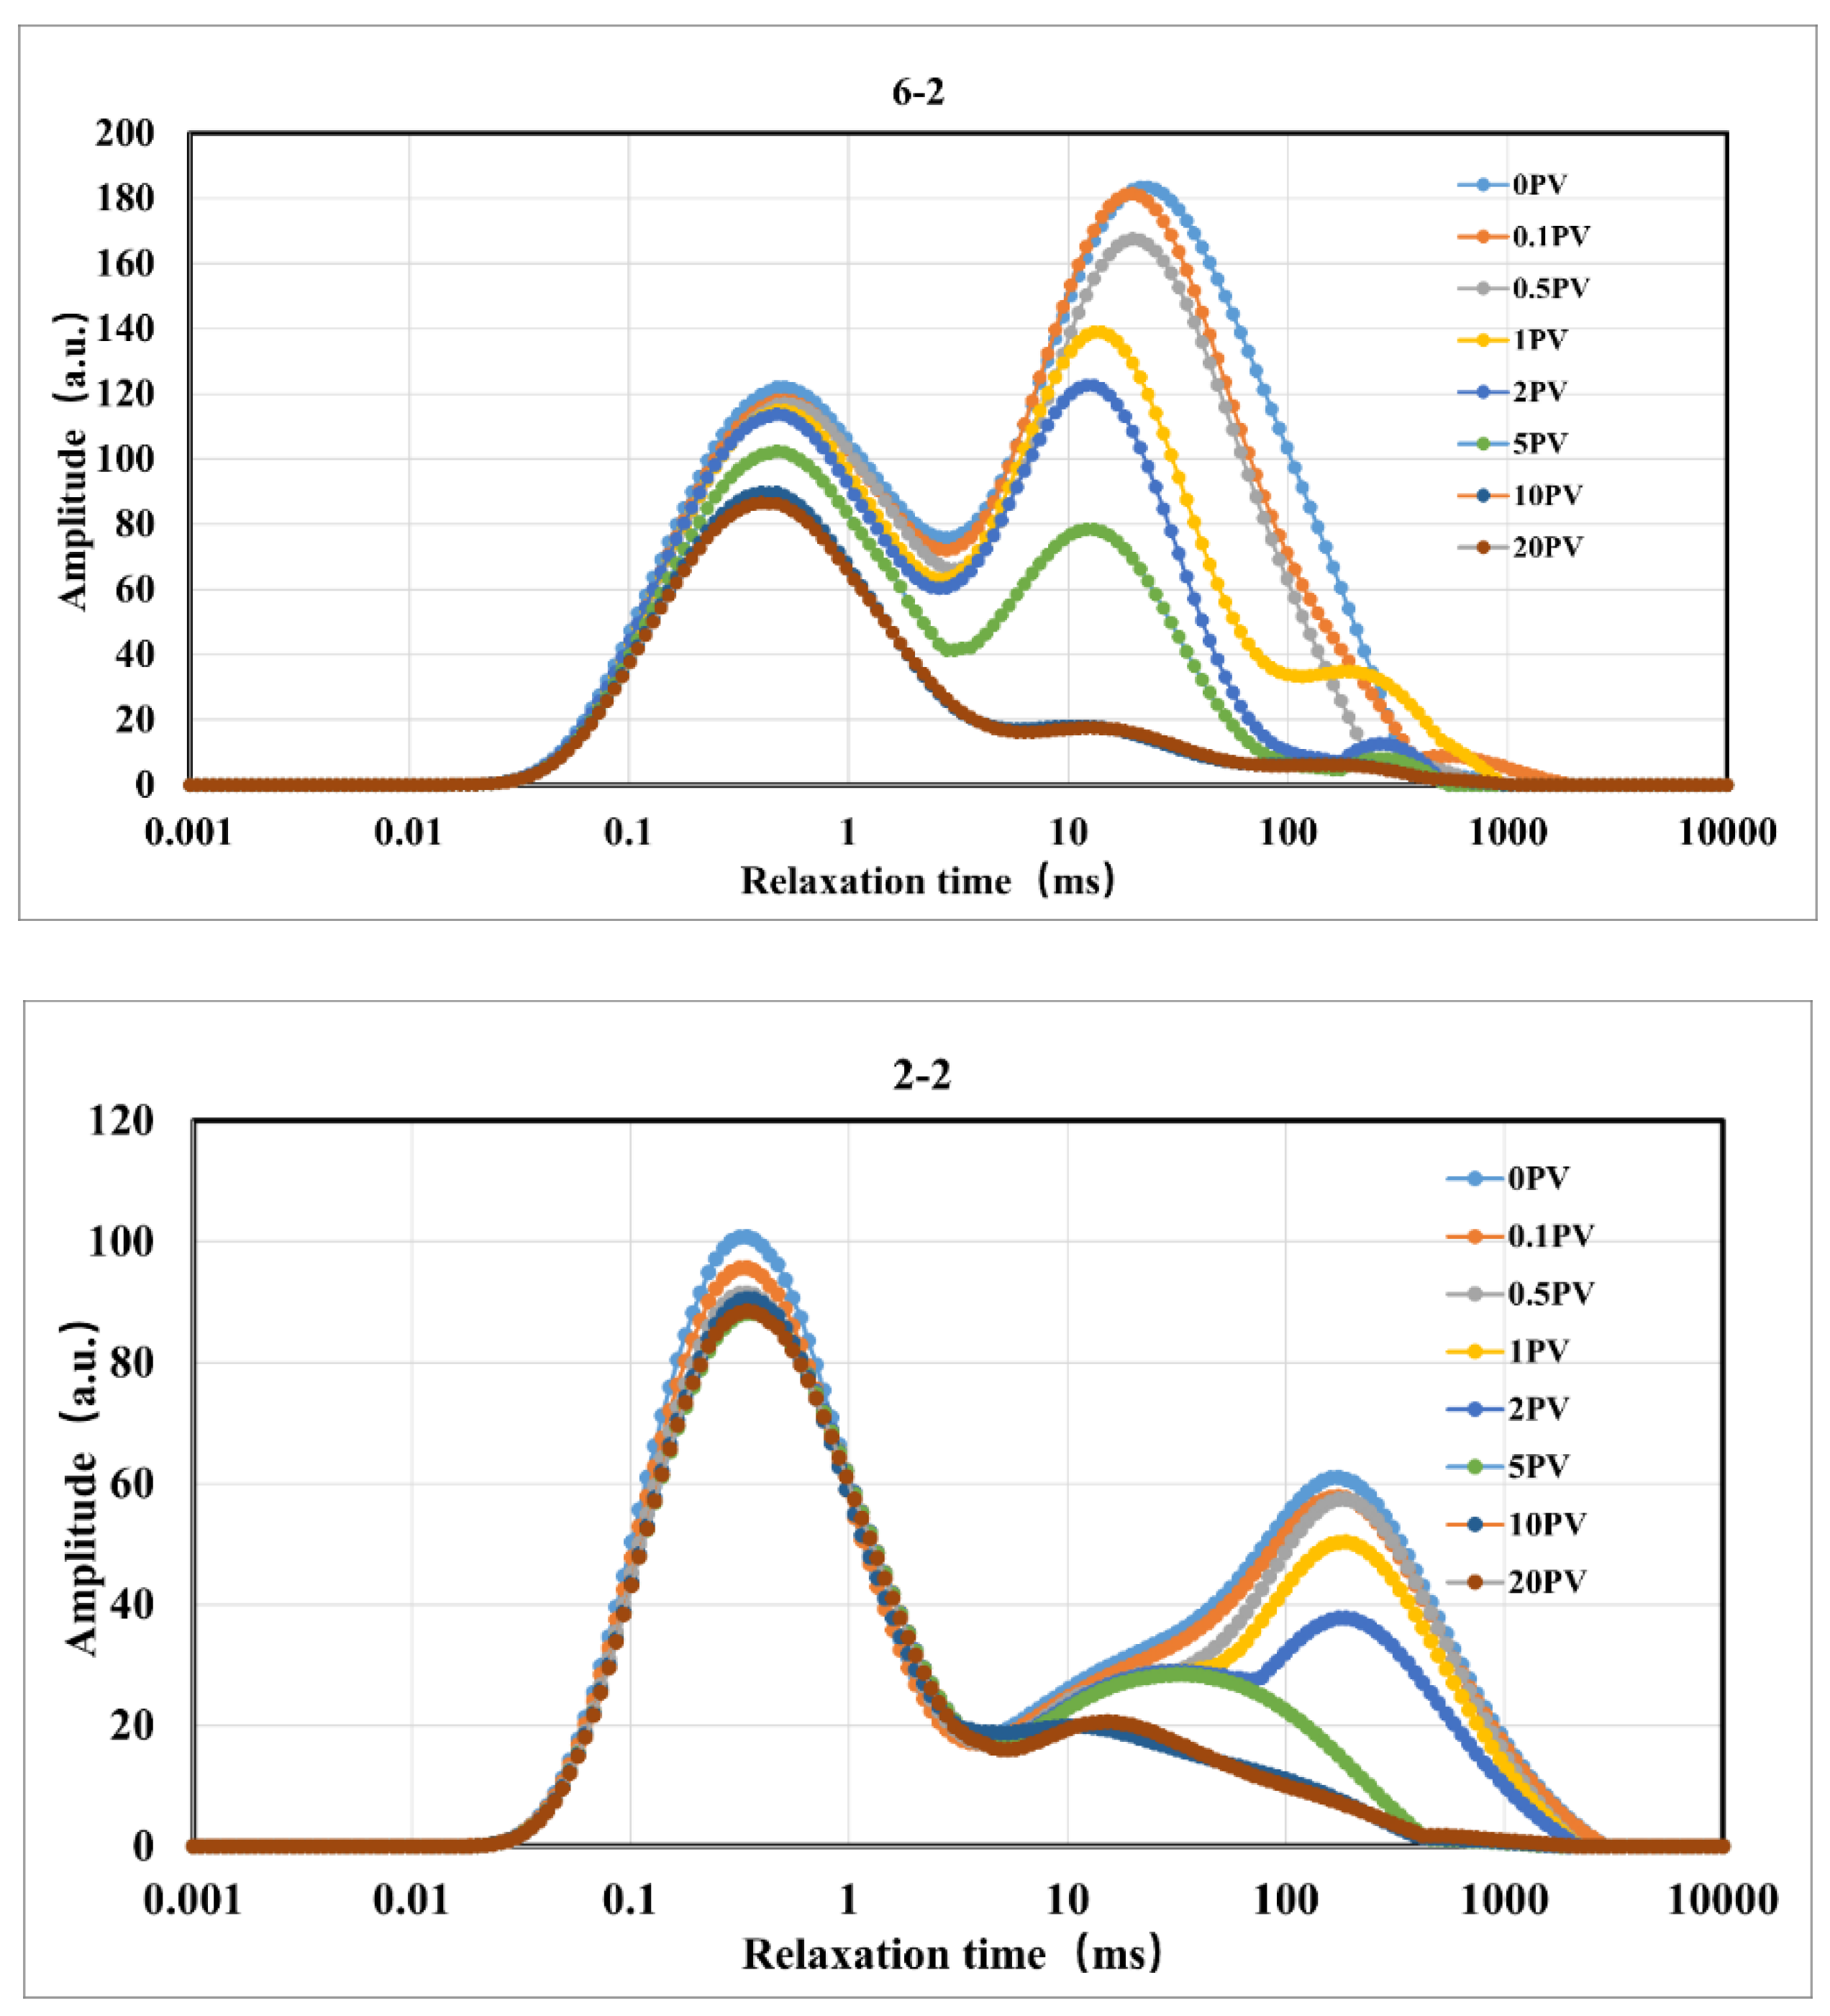
As shown in
Figure 3,
Figure 5, and
Figure 7, the T2 spectra of the cores in the residual oil state under constant pressure, variable pressure, and constant effective stress conditions exhibit significant fluctuations with the increase in injection volume. Compared to the initial state, the amplitude of the T2 spectrum gradually decreases with the increase in CO
2 injection volume, and the T2 spectrum in the micropore region of all cores decreases significantly, indicating that oil is displaced to varying degrees from the cores[
27]. Under constant injection pressure conditions, the micropore region contributes significantly to the recovery rate; under variable injection pressure and constant effective stress conditions, the medium pore region also contributes significantly to the recovery rate[
28].
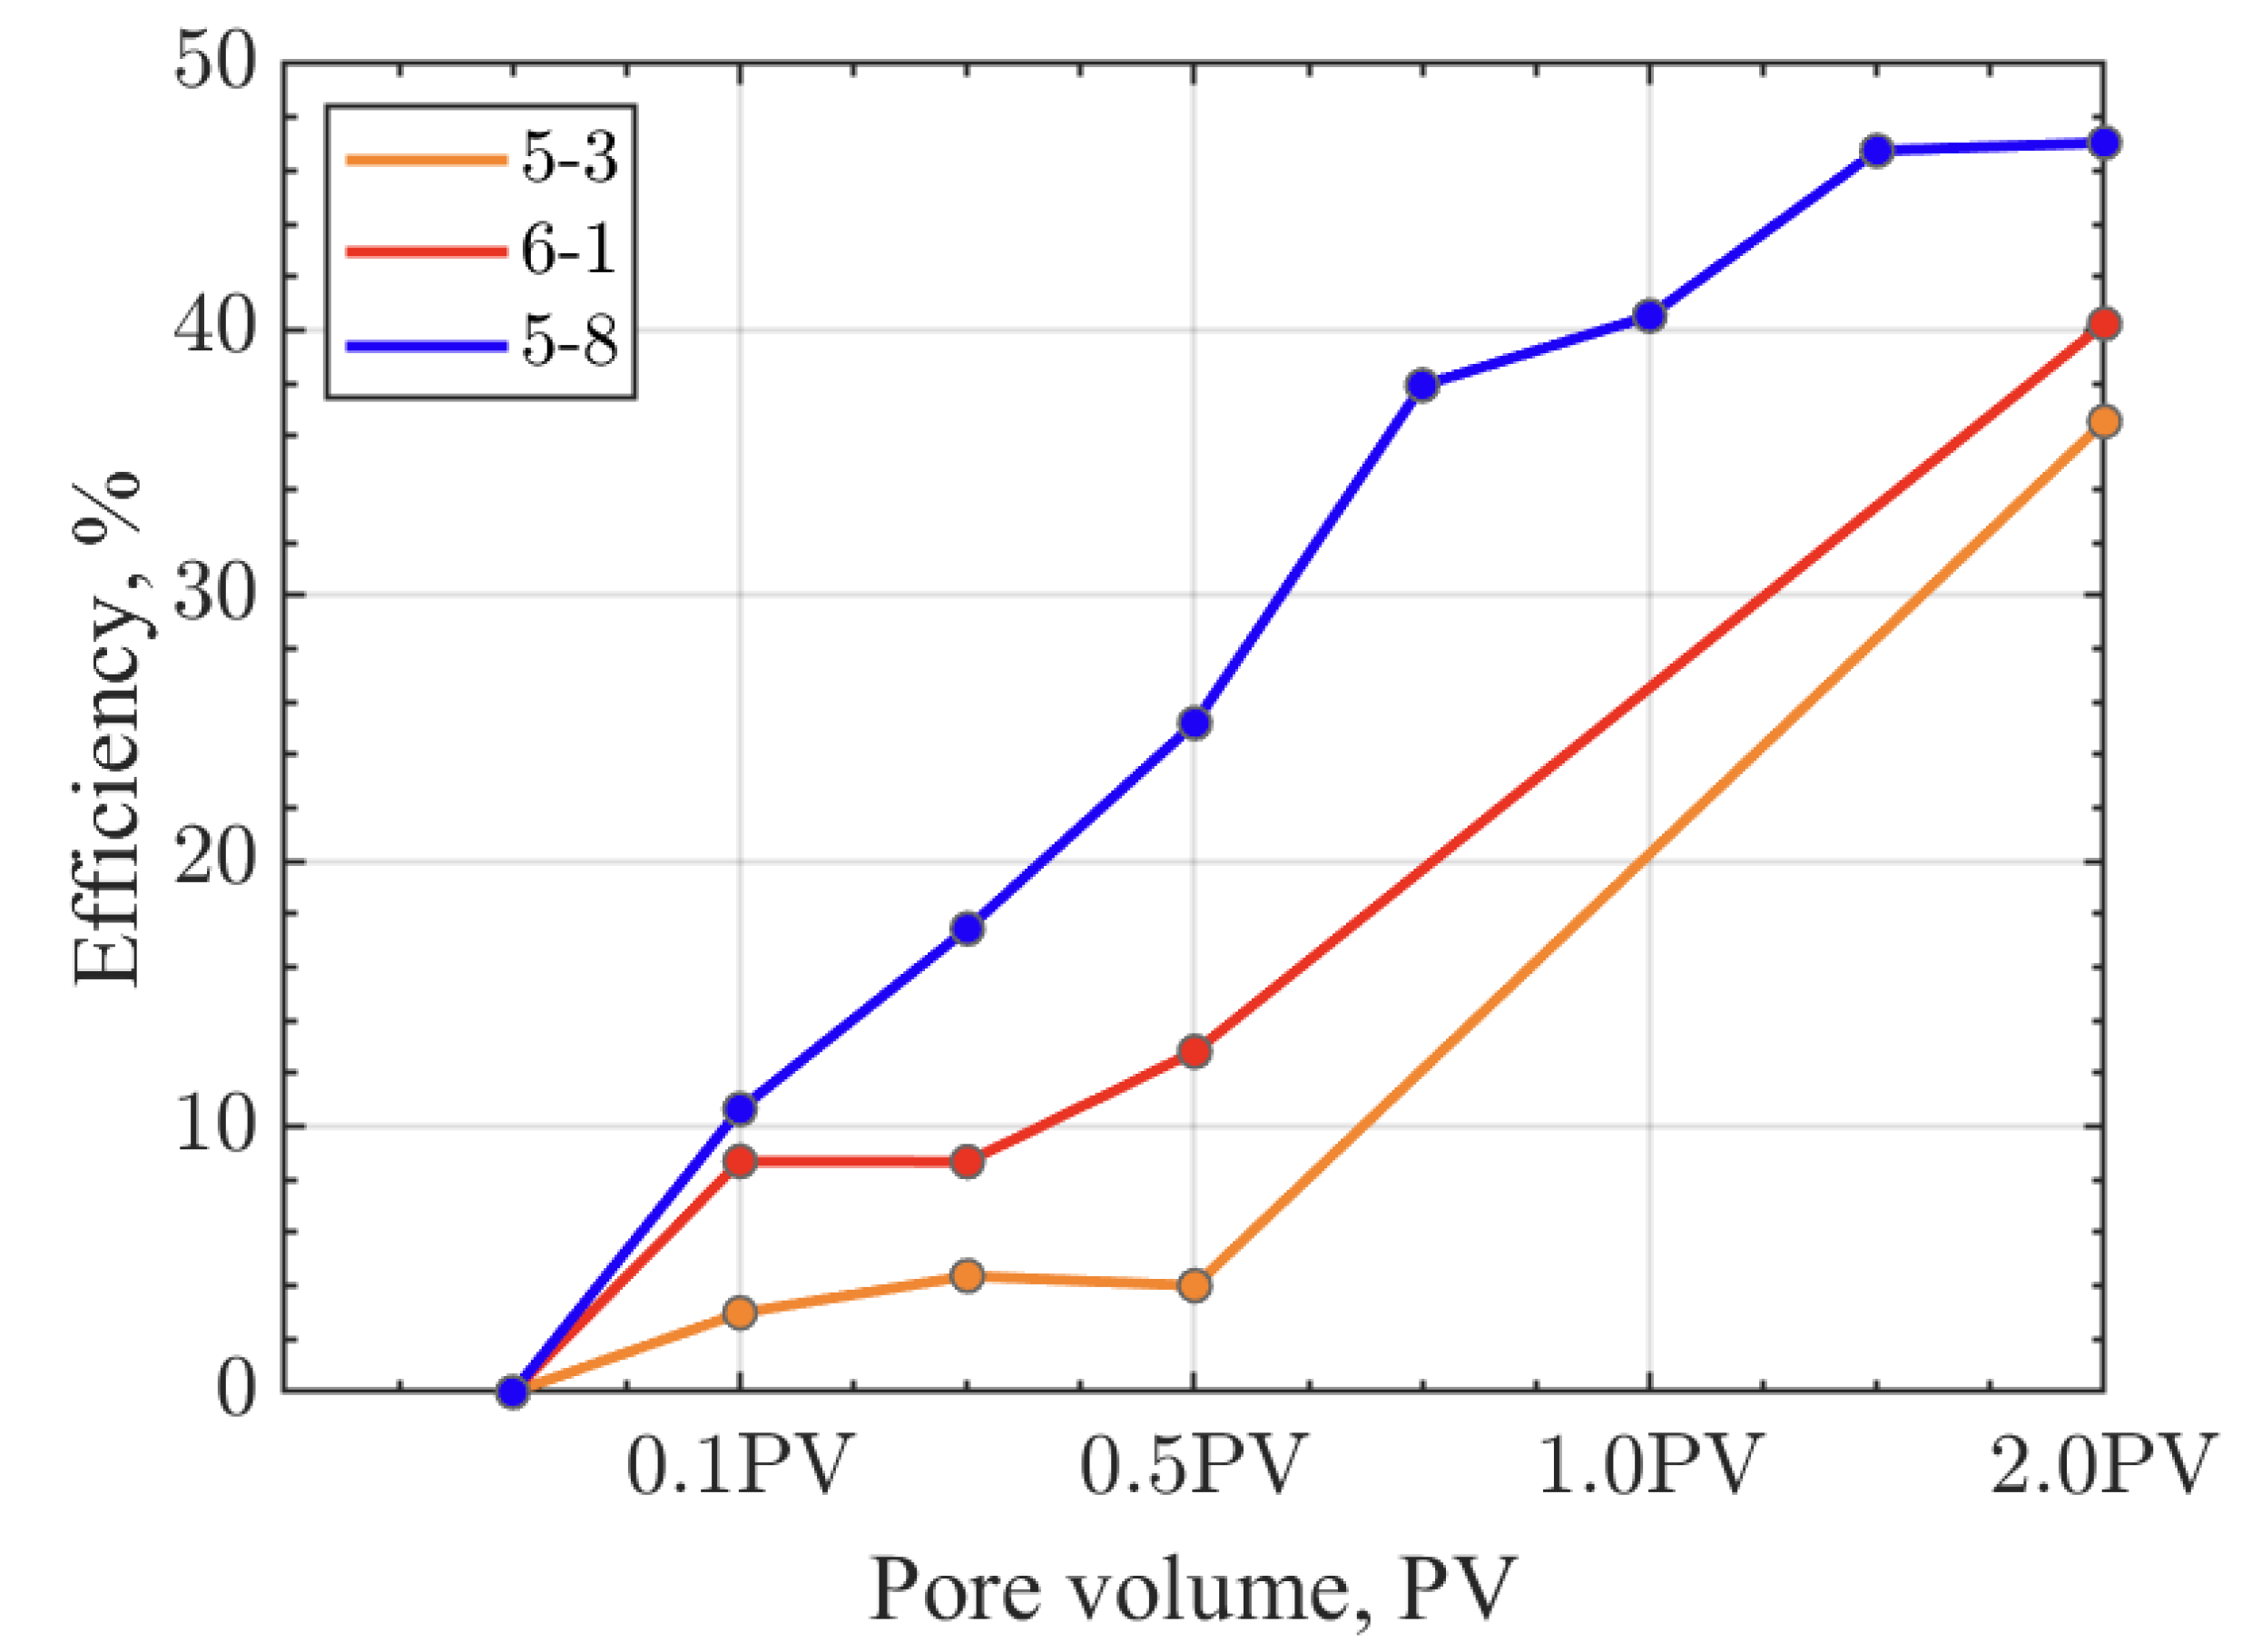
Under constant injection pressure conditions, the oil displacement efficiency for low permeability, medium permeability, and fractured cores are 36.55%, 40.23%, and 47.05%, respectively (
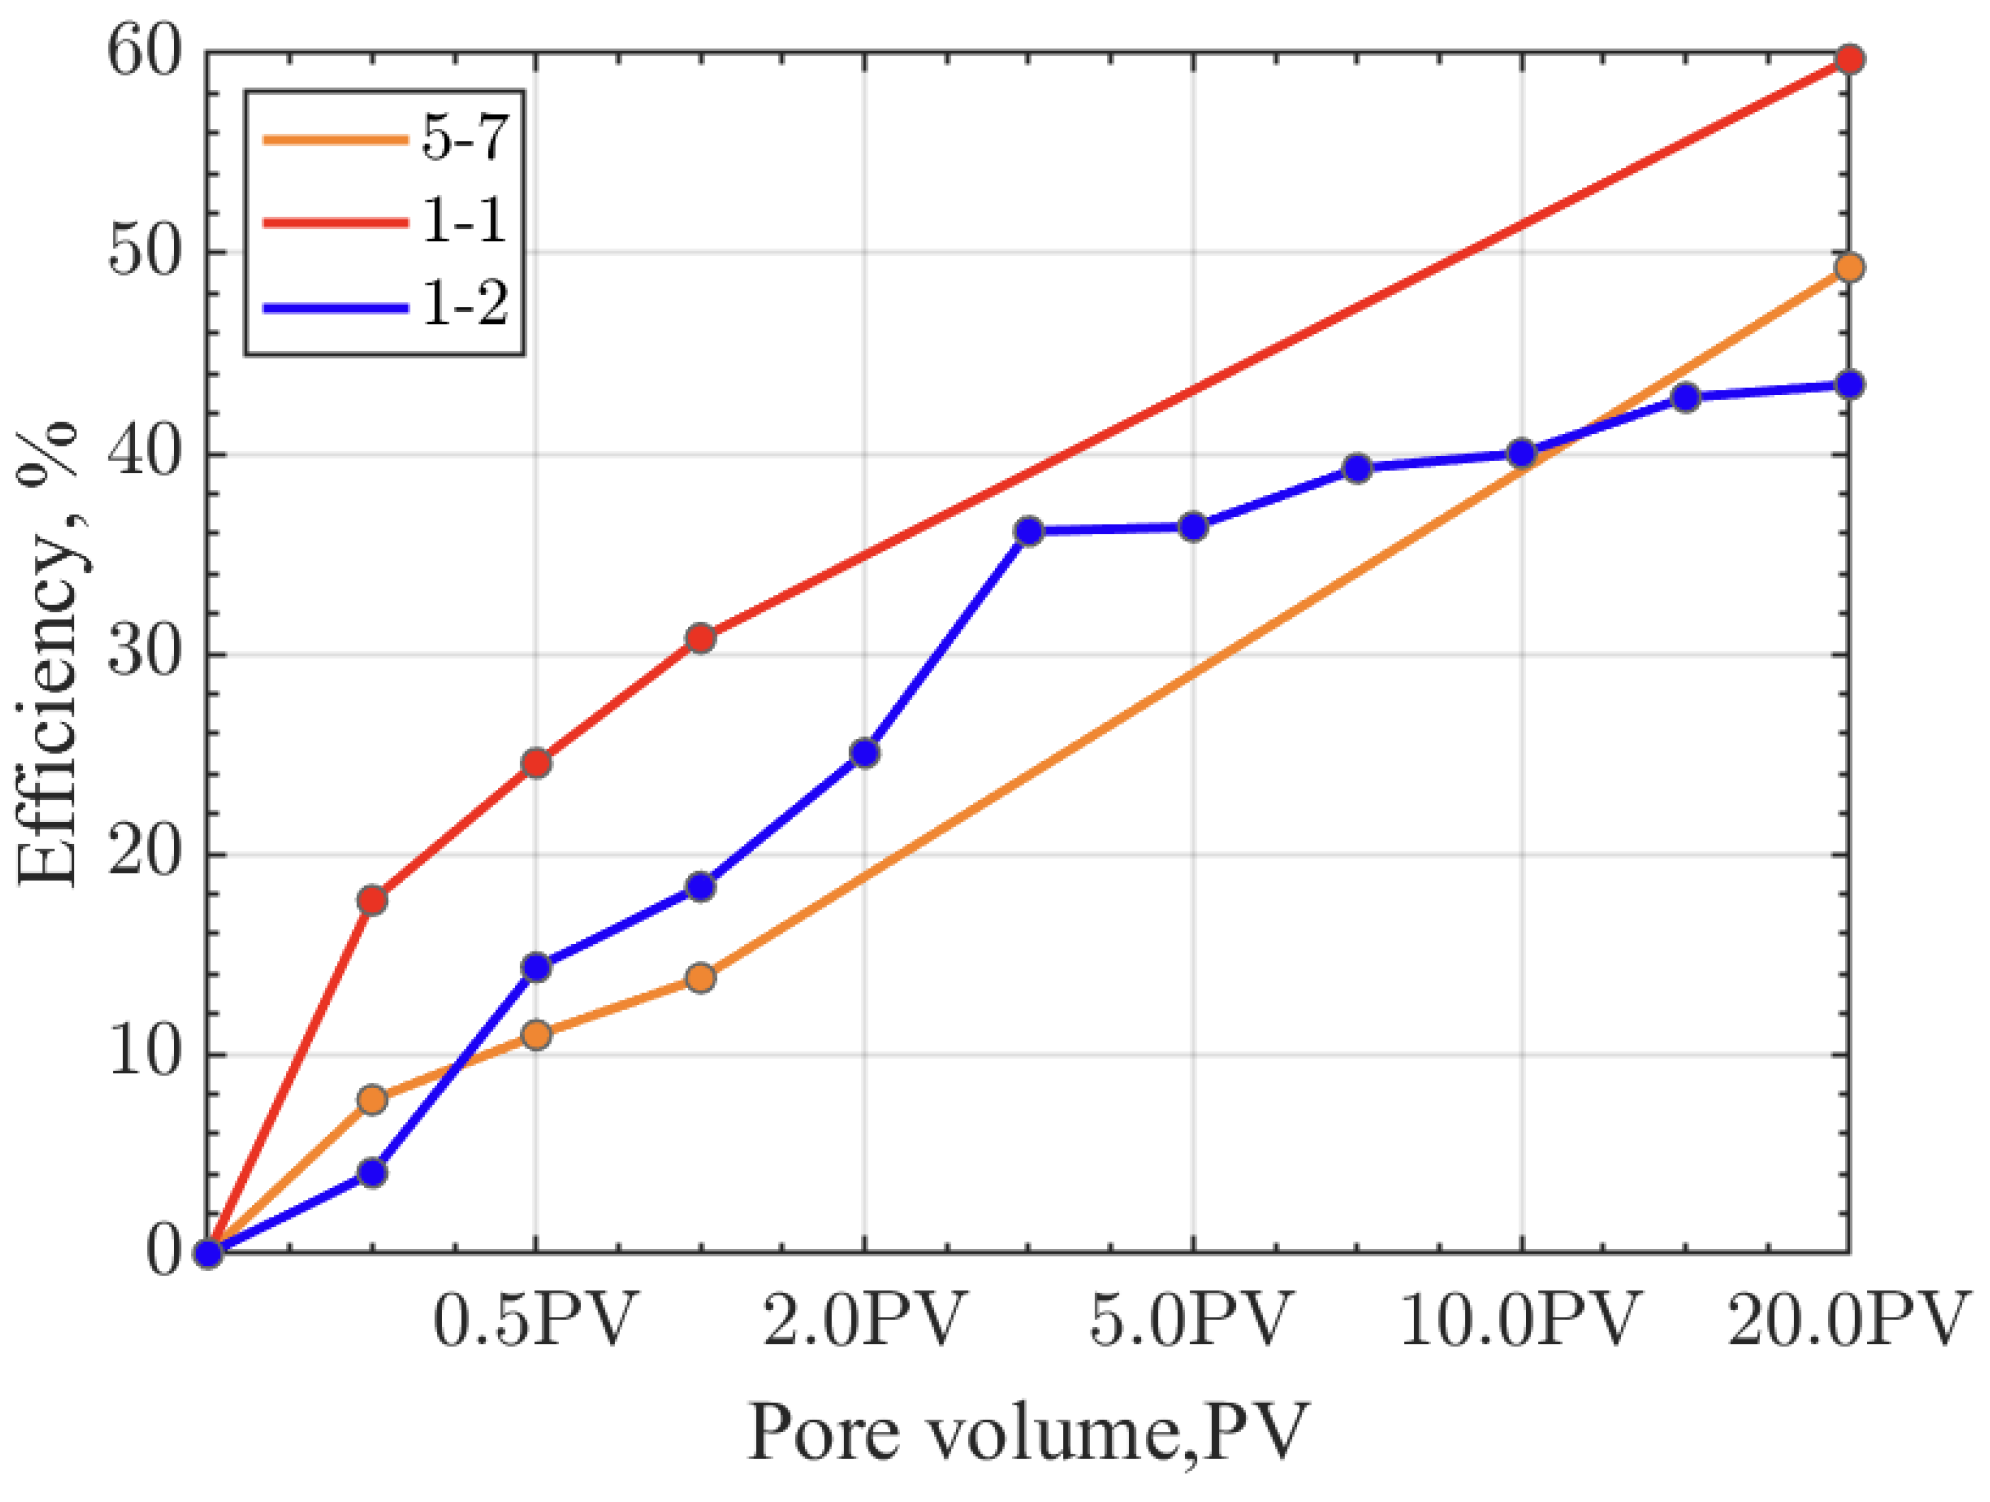
Figure 4), with fractures significantly enhancing the displacement efficiency. Under variable injection pressure conditions, the oil displacement efficiency for low permeability, medium permeability, and fractured cores are 49.30%, 59.70%, and 43.45%, respectively (
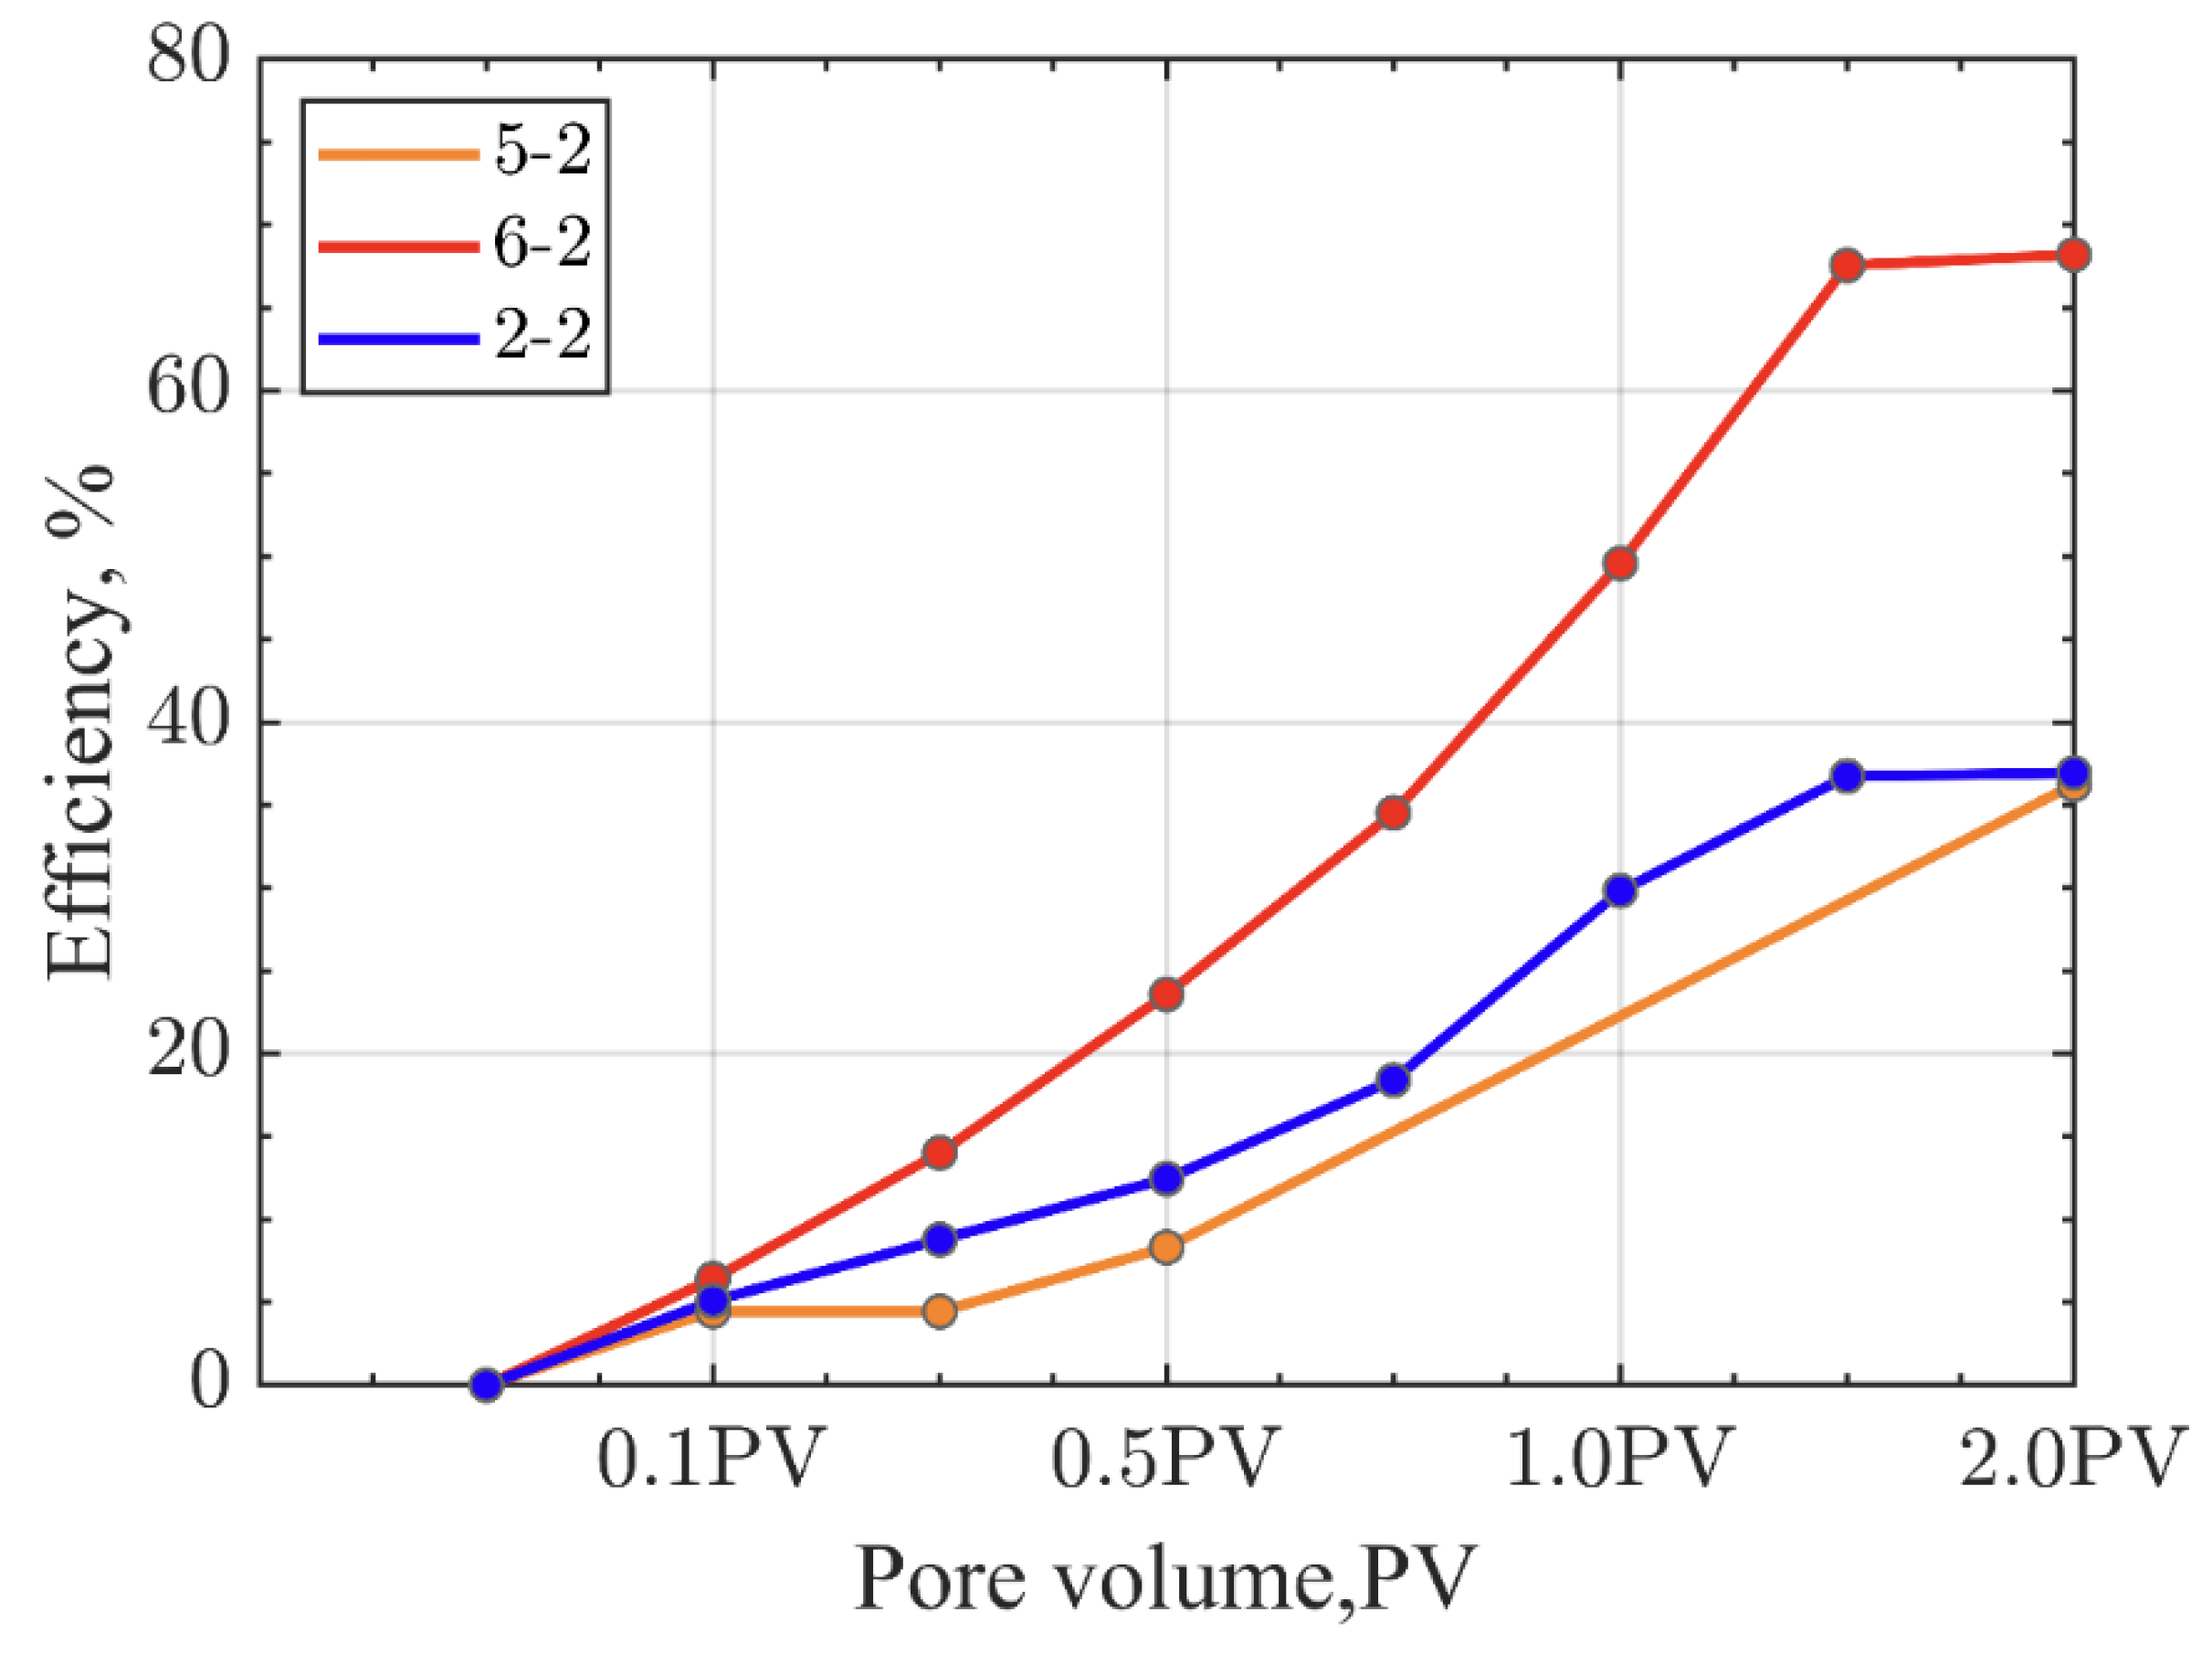
Figure 6), with the highest displacement efficiency observed in medium permeability cores, and fractures not enhancing the displacement efficiency. Under constant effective stress conditions, the oil displacement efficiency for low permeability, medium permeability, and fractured cores are 36.24%, 68.21%, and 36.94%, respectively (
Figure 8), with the highest displacement efficiency observed in medium permeability cores, and fractures not enhancing the displacement efficiency. The CO
2 displacement efficiency of fractured cores under variable injection pressure and constant effective stress conditions is not the highest, as the applied confining pressure during displacement can lead to fracture closure, reducing the permeability of the rock samples and the efficiency of CO
2 displacement. By comparing with similar studies [
26,
29], the CO
2 displacement efficiency observed in this study are consistent with other experimental reports, confirming the effectiveness of our experimental design and the reliability of our results.
Figure 3.
T2 Spectrum Variation of Rock Samples During Displacement Under Constant Injection Pressure Conditions.
Figure 3.
T2 Spectrum Variation of Rock Samples During Displacement Under Constant Injection Pressure Conditions.
Figure 4.
Displacement Efficiency of Different Rock Samples During Displacement Under Constant Injection Pressure Conditions.
Figure 4.
Displacement Efficiency of Different Rock Samples During Displacement Under Constant Injection Pressure Conditions.
Figure 5.
T2 Spectrum Variation of Rock Samples During Displacement Under Variable Injection Pressure Conditions.
Figure 5.
T2 Spectrum Variation of Rock Samples During Displacement Under Variable Injection Pressure Conditions.
Figure 6.
Displacement Efficiency of Different Rock Samples During Displacement Under Variable Injection Pressure Conditions.
Figure 6.
Displacement Efficiency of Different Rock Samples During Displacement Under Variable Injection Pressure Conditions.
Figure 7.
T2 Spectrum Variation of Rock Samples During Displacement Under Constant Effective Stress Conditions.
Figure 7.
T2 Spectrum Variation of Rock Samples During Displacement Under Constant Effective Stress Conditions.
Figure 8.
Displacement Efficiency of Different Rock Samples During Displacement Under Constant Effective Stress Conditions.
Figure 8.
Displacement Efficiency of Different Rock Samples During Displacement Under Constant Effective Stress Conditions.
3.3. Recovery Stages
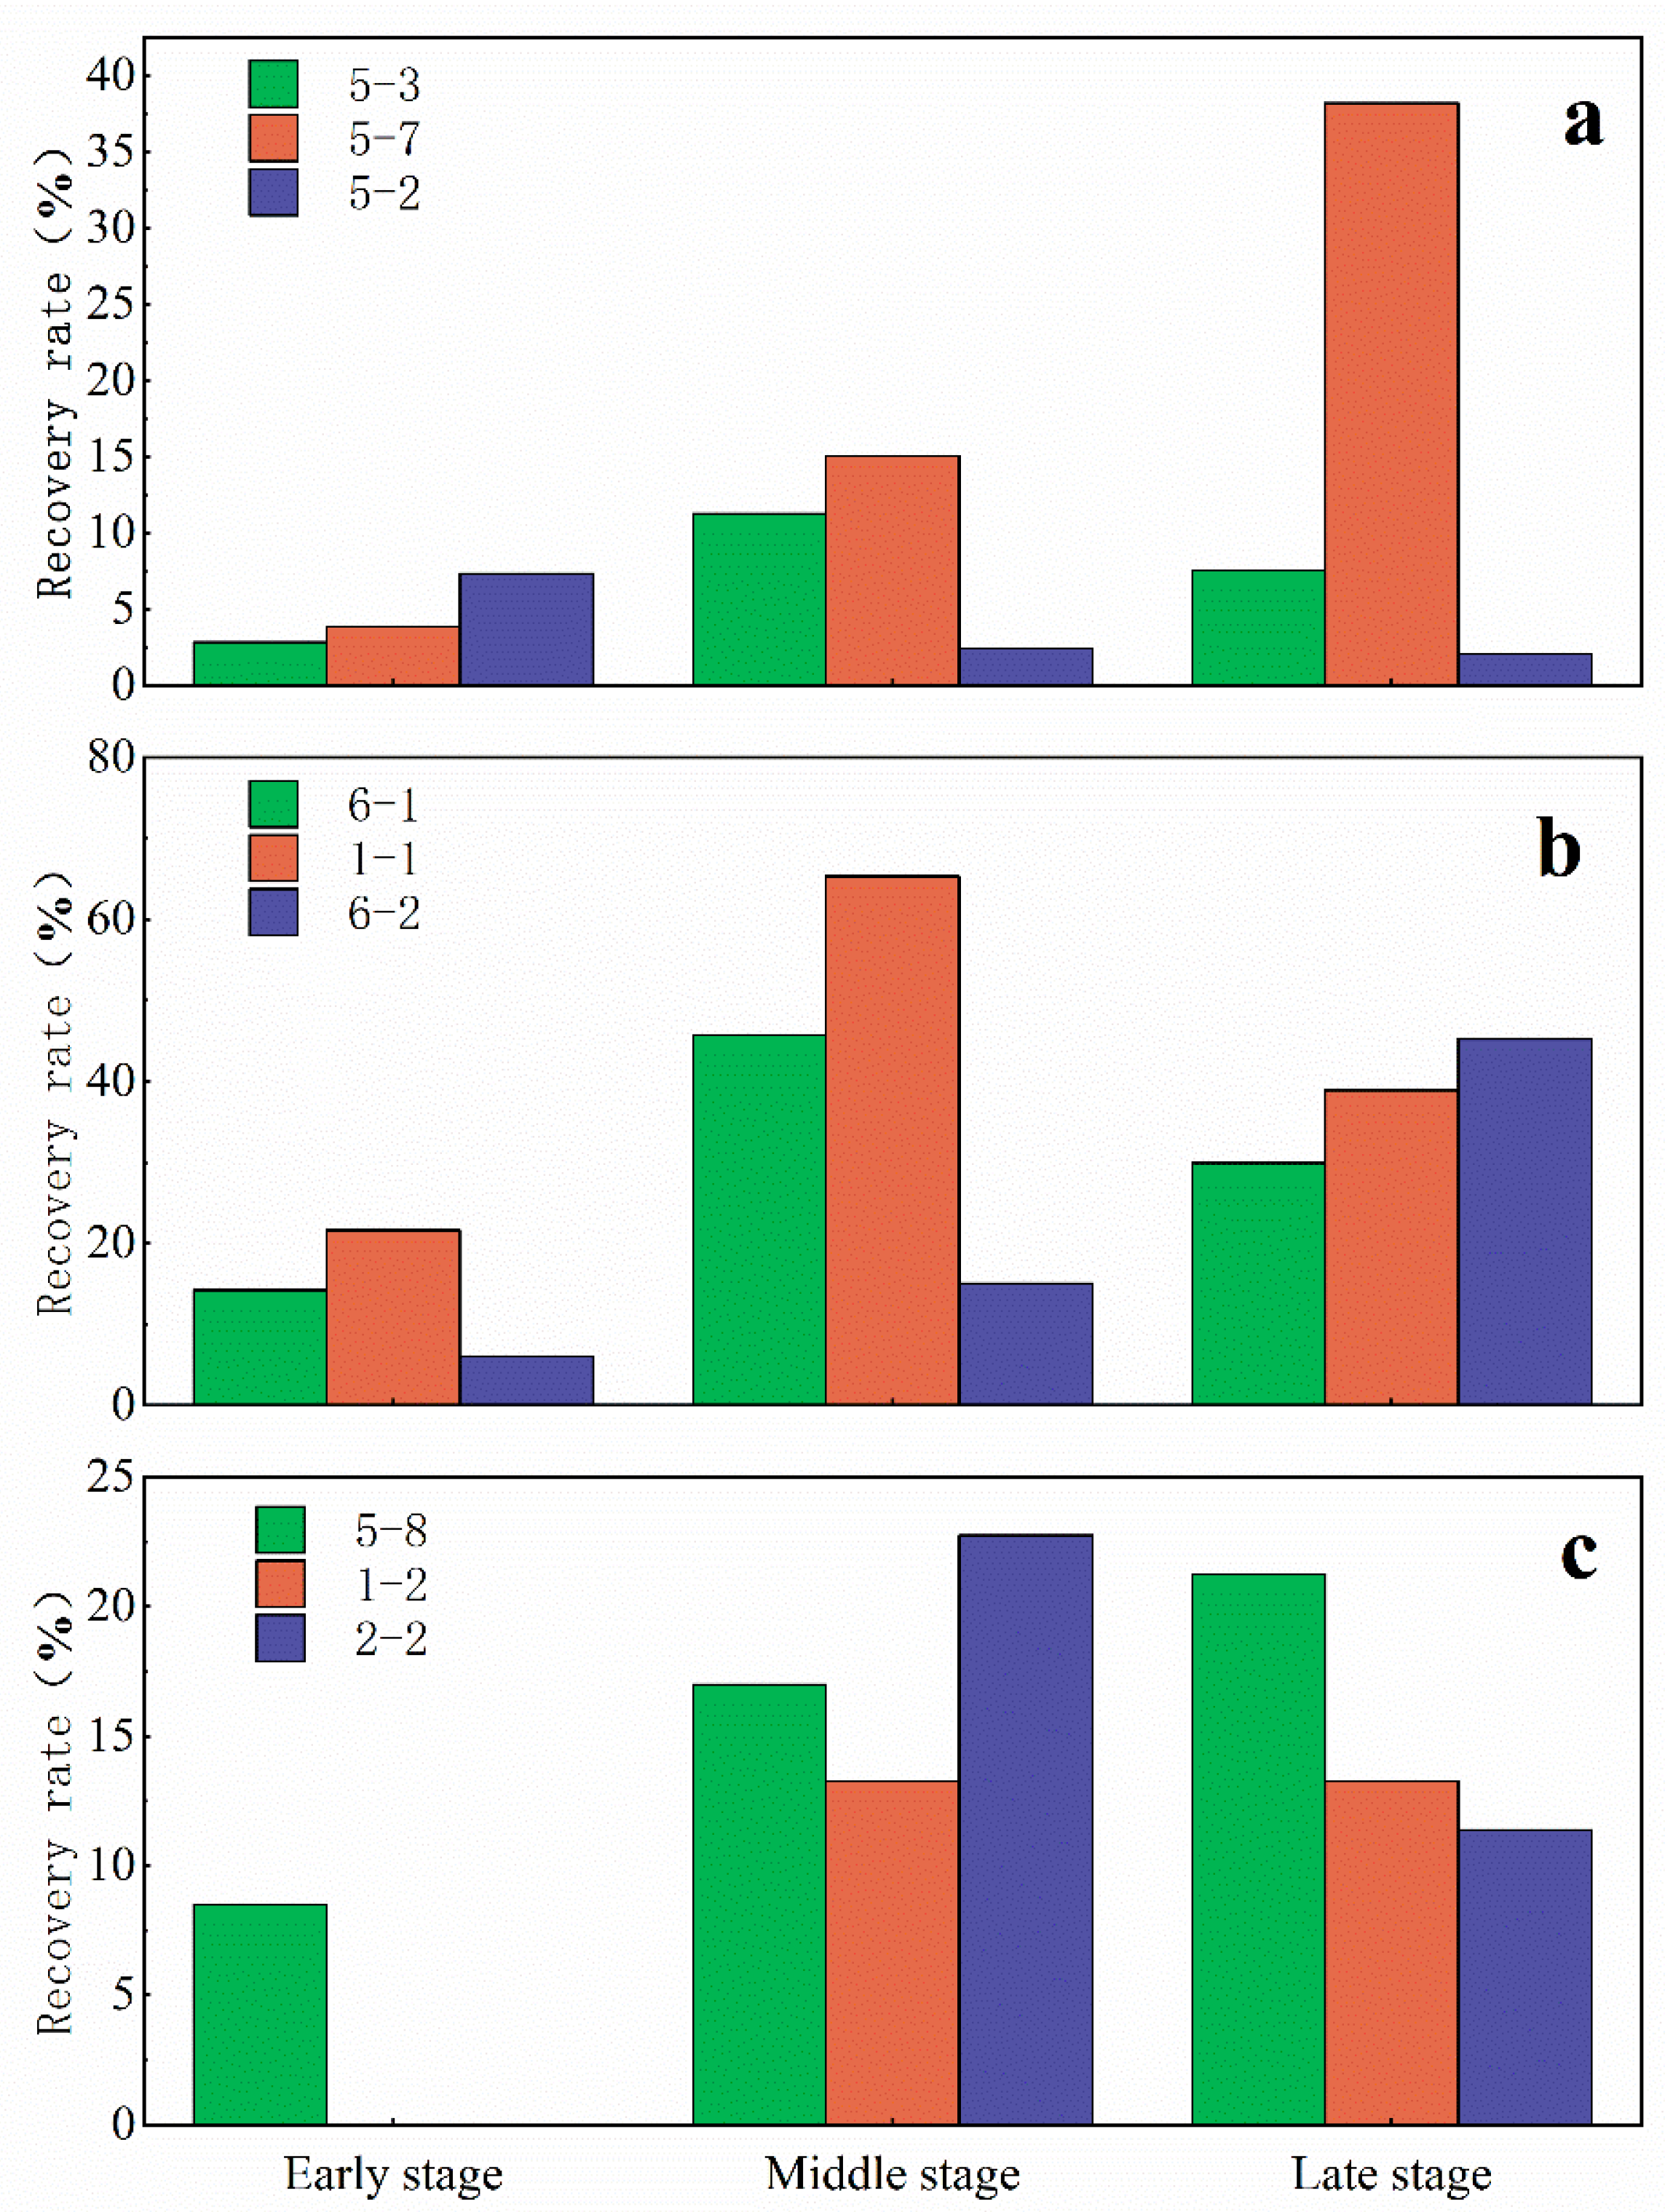
Based on the recovery rate, the CO
2 oil displacement recovery stages are divided into early, middle, and late stages. The recovery rates of rock samples under different gas injection conditions vary significantly, with the overall displacement efficiency being higher during the middle stage (
Figure 9).
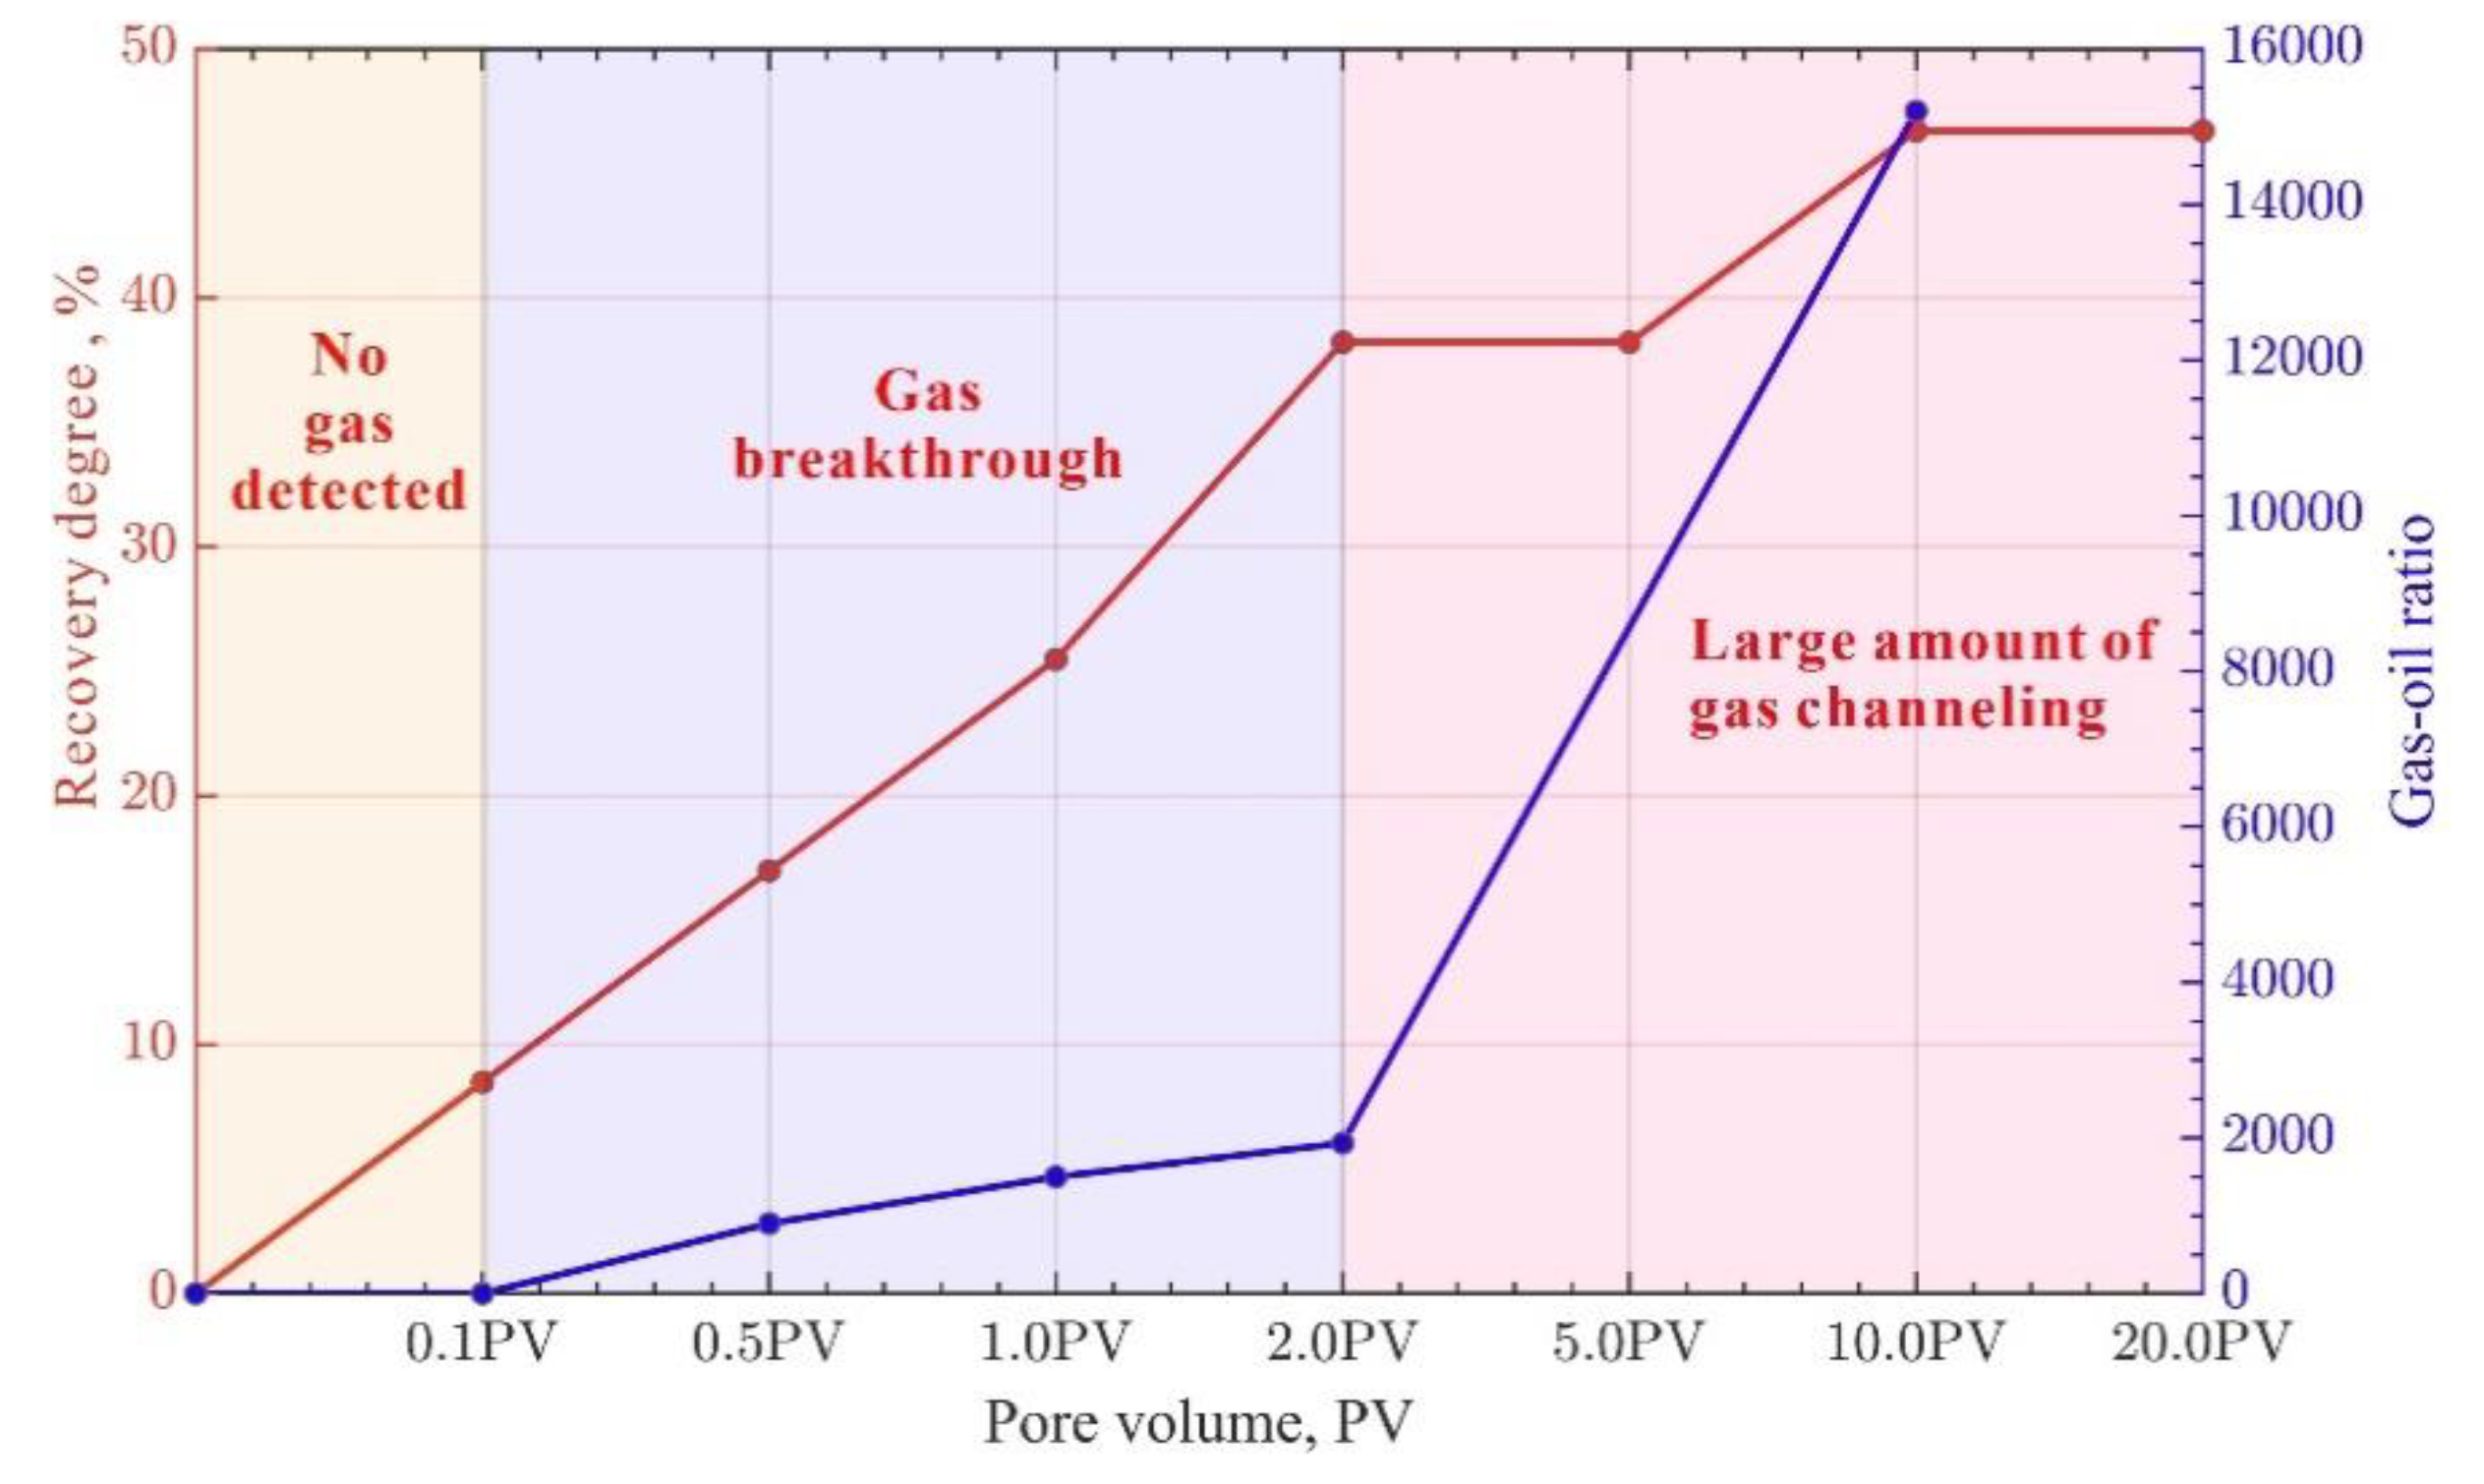
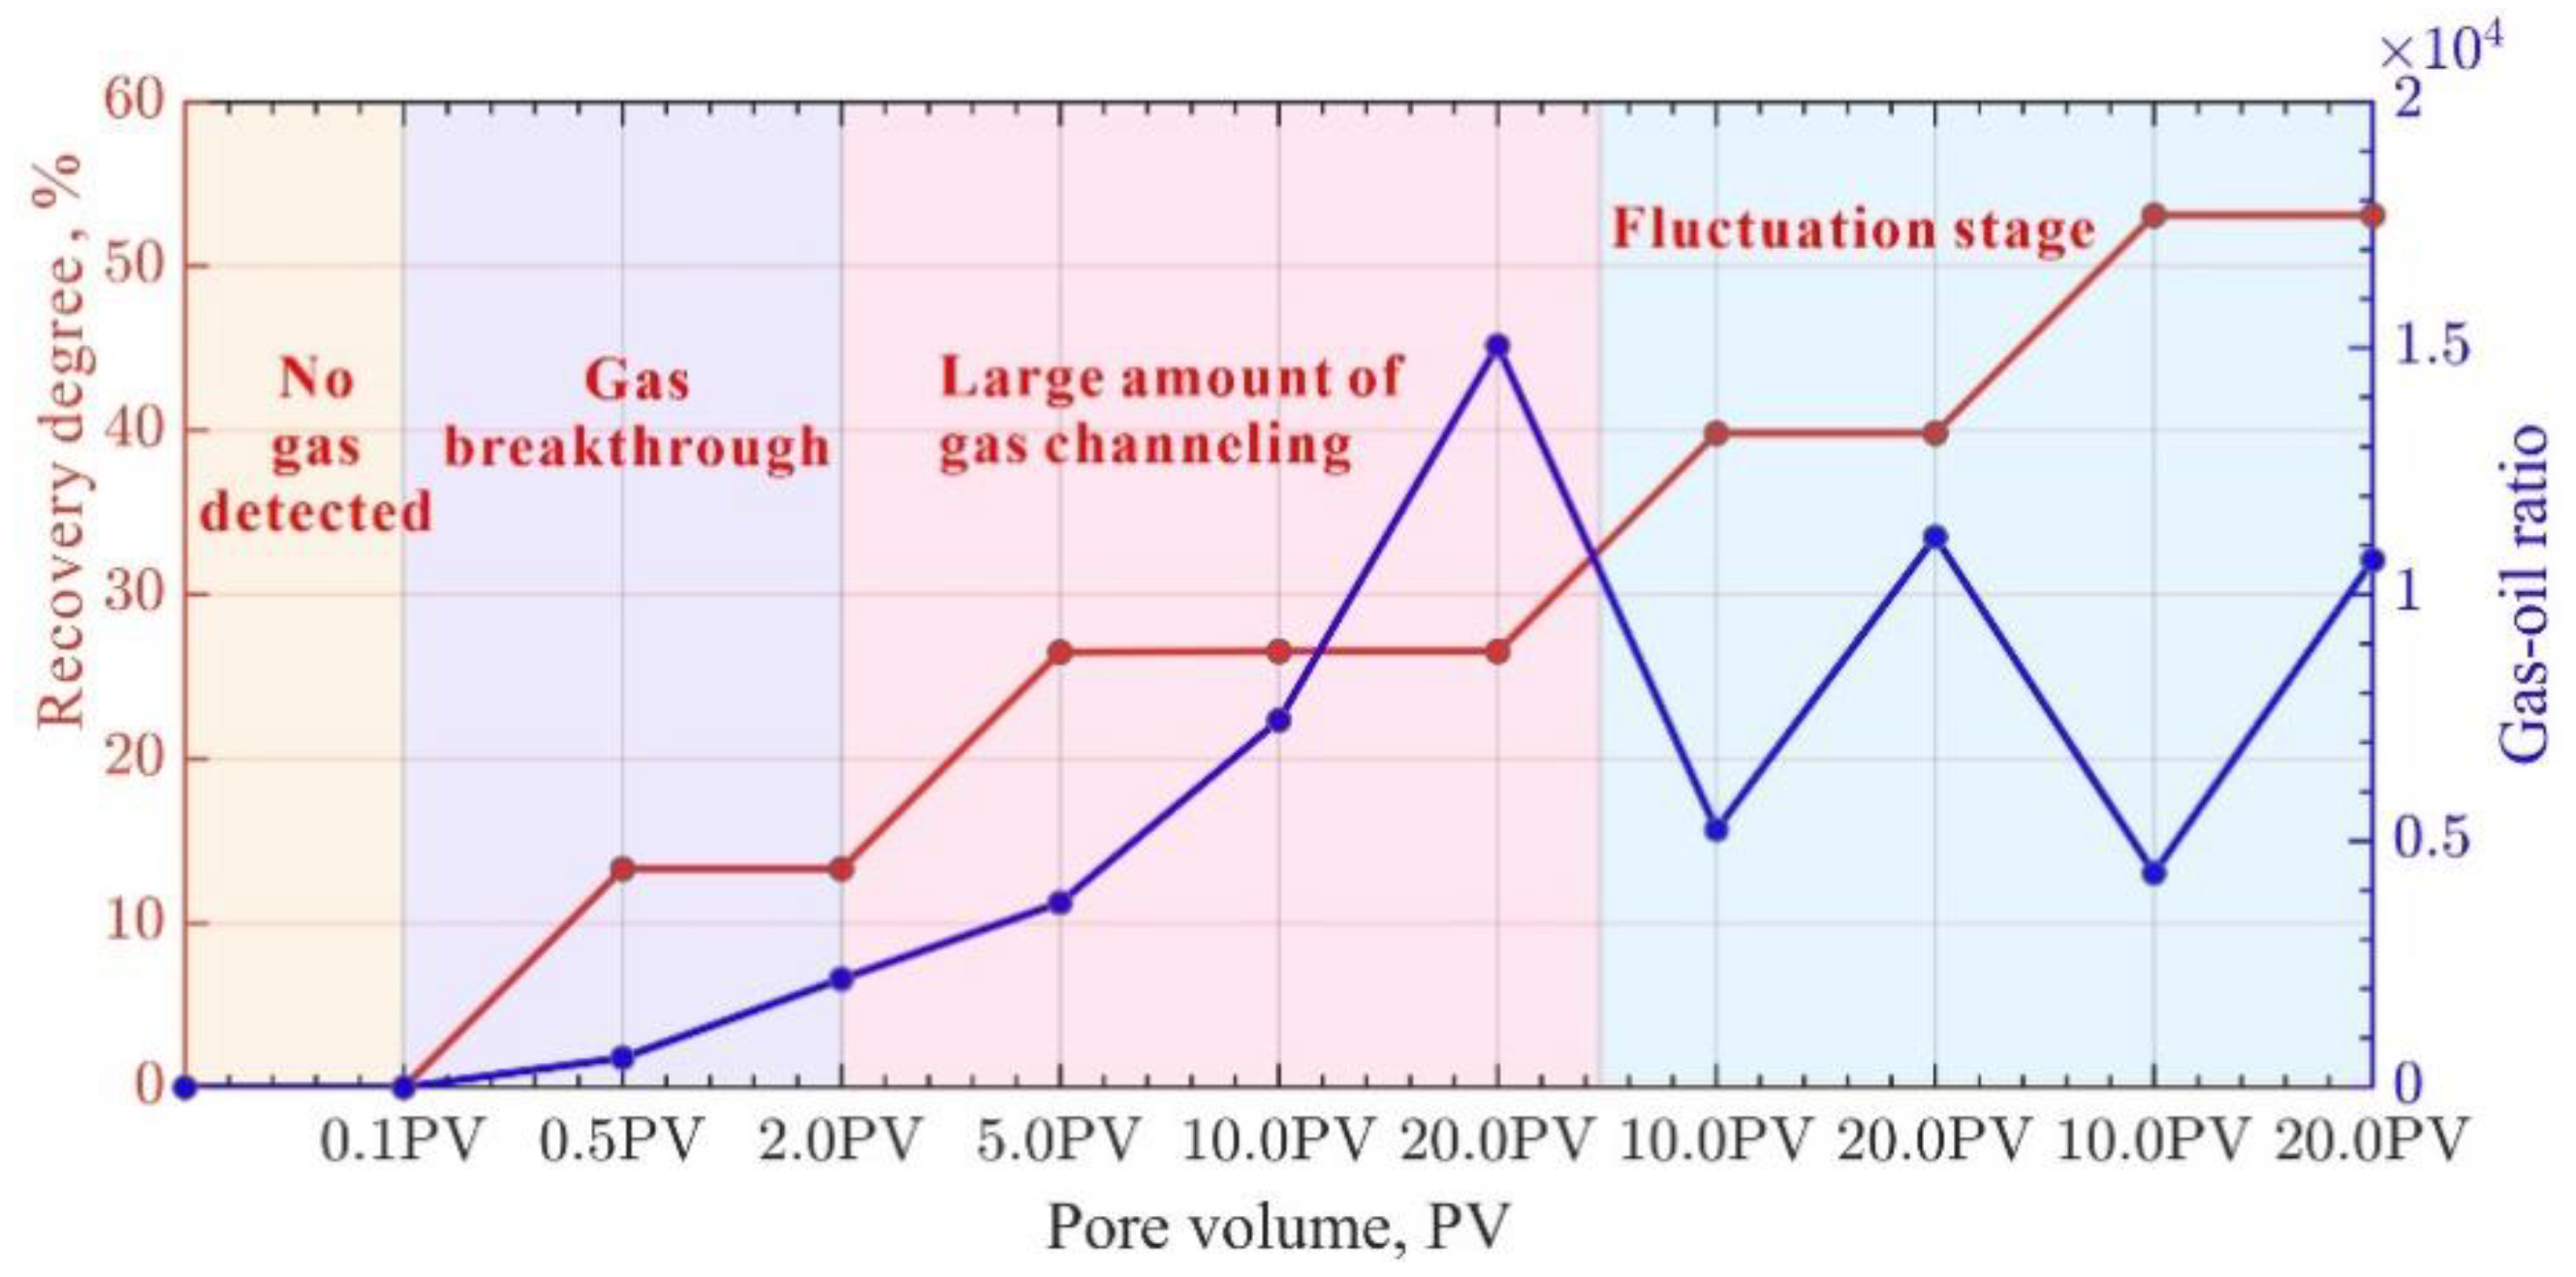
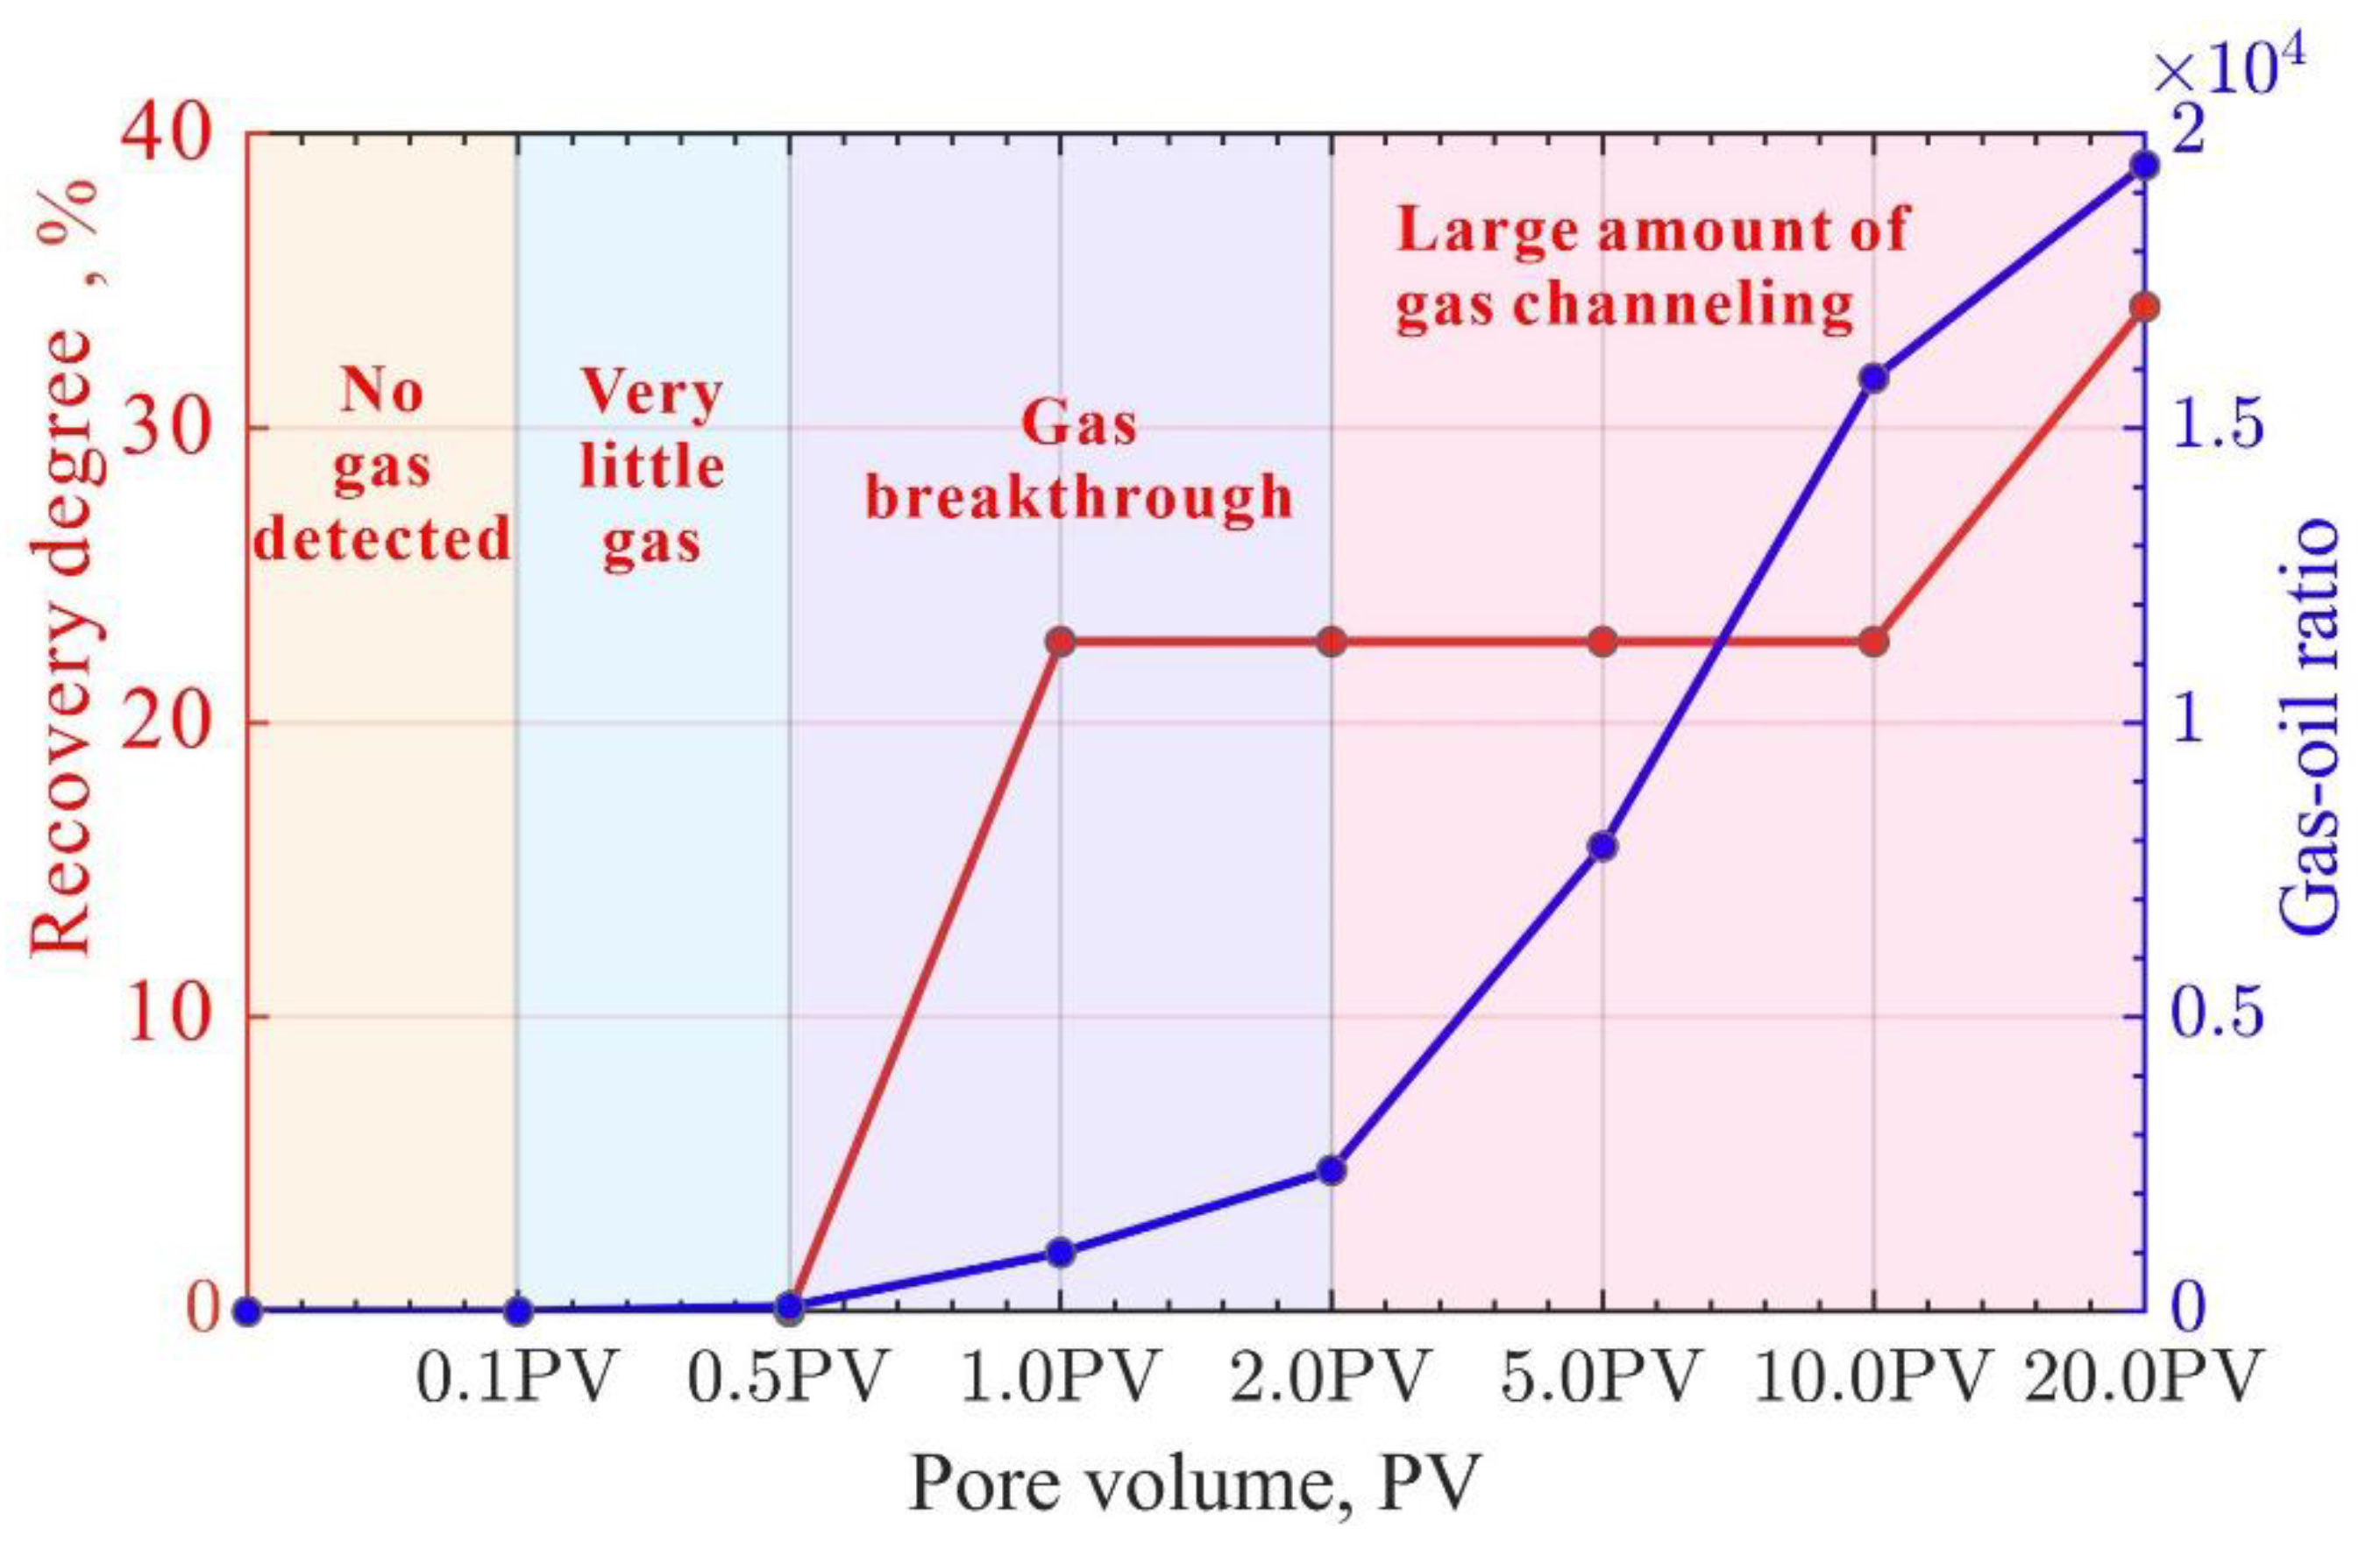
The displacement process of fractured rock samples was closely monitored. Based on the gas-oil ratio and recovery degree at the outlet section of the fractured rock samples, the CO
2 oil displacement exhibited "no gas detected" and "gas detected" stages. Depending on the injection conditions, the "gas detected" stage can include various sub-stages such as "very little gas, gas breakthrough, large gas channeling, gas fluctuation" (
Figure 10,
Figure 11 and
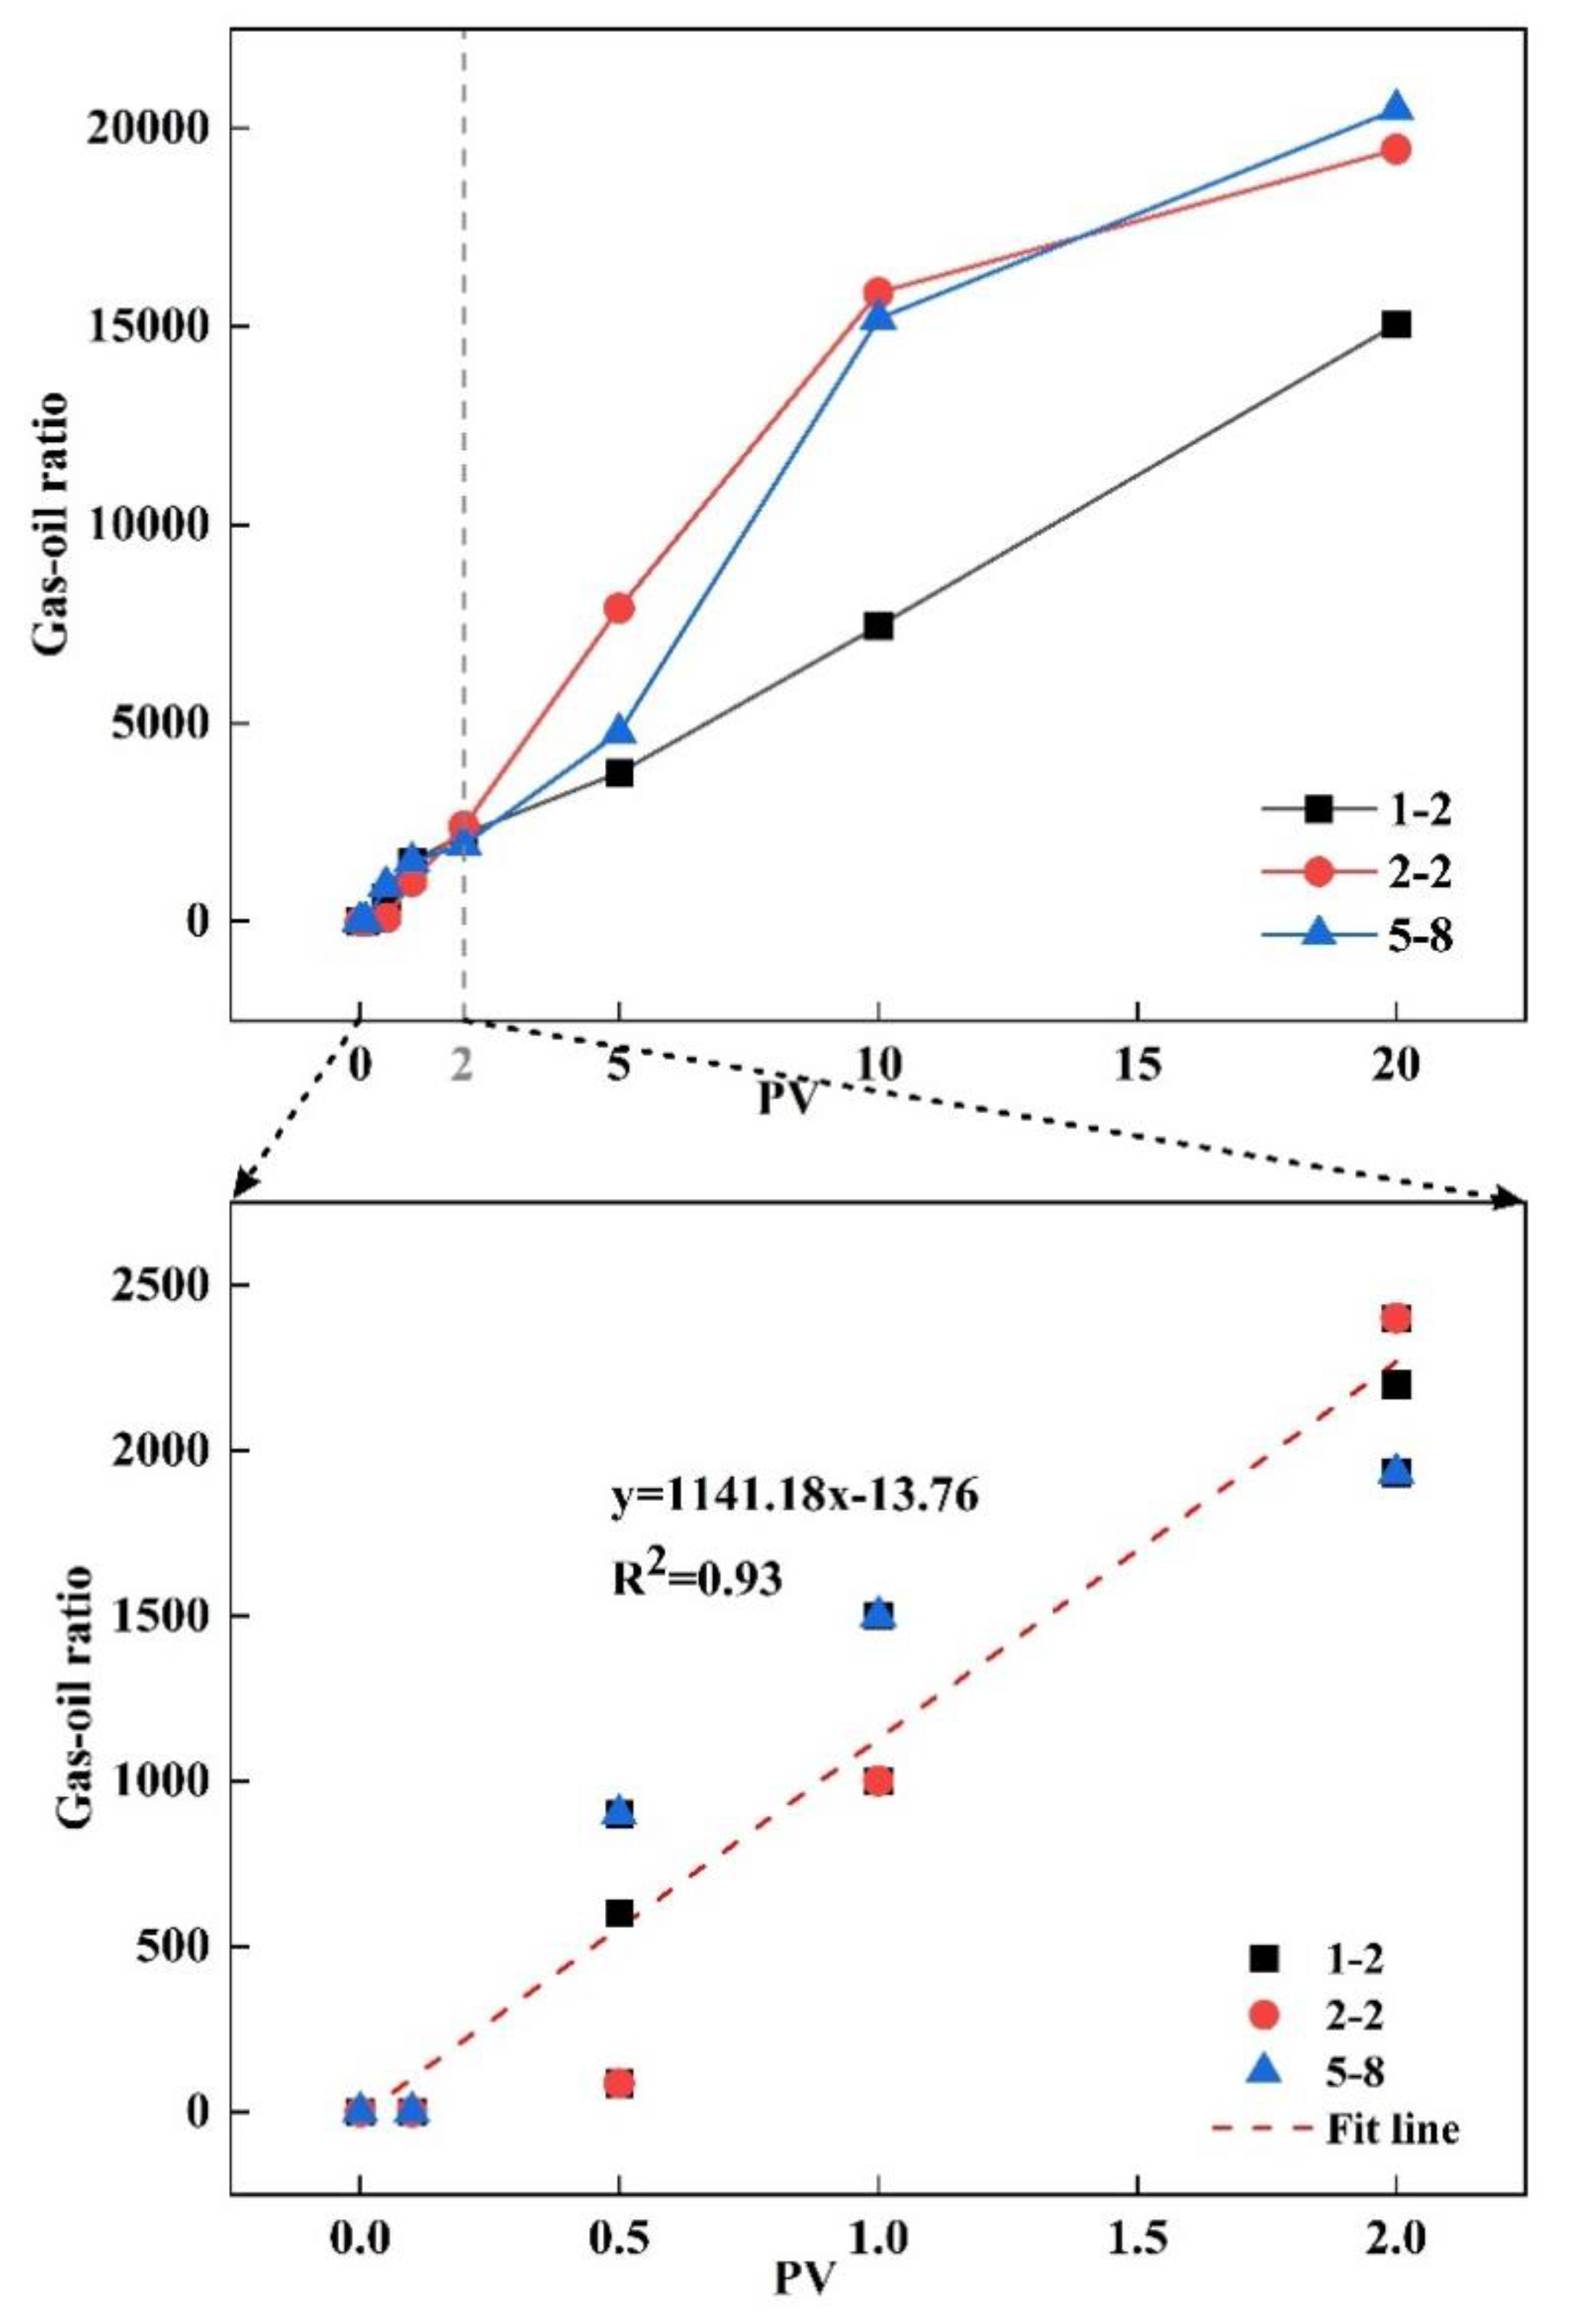
Figure 12). Specifically, during the "no gas detected" stage, the gas-oil ratio is zero, and the recovery degree is zero under both variable injection pressure and constant effective stress conditions. In the range of 0.1-0.5 PV under constant effective stress conditions, the gas-oil ratio is 85, which is classified as the very little gas stage. Under constant and variable injection pressure conditions, the gas breakthrough stage begins at 0.1 PV of injection volume and ends at 2 PV. During this stage, the recovery degree ranges from 0 to 40%, and the gas-oil ratio ranges from 100 to 4000. The large gas channeling stage has a gas-oil ratio greater than 4000. Although the displacement stages vary for different cores, the gas-oil ratio is in the breakthrough stage within the range of 0-2 PV. During this stage, the gas-oil ratio of different cores shows significant variation and follows the trend of the fitted line (y = 1141.18x - 13.76, R² = 0.93) (
Figure 13).
4. Conclusions
In this study, displacement experiments were conducted on sandstone cores from the Chang 6 reservoir in the Huaziping area using a multifunctional core displacement apparatus and Nuclear Magnetic Resonance (NMR) technology. The CO2 displacement process was dynamically monitored under constant pressure, variable pressure, and constant effective stress conditions. Injection stages were quantitatively categorized, providing valuable guidance for improving recovery rates. The conclusions from this study are obtained as follows:
(1) The distribution characteristics of rock sample pores are a key factor affecting CO2 displacement efficiency. Under the same conditions, rock samples with a higher proportion of large pores exhibit higher CO2 displacement efficiency.
(2) Fractures can contribute to improving CO2 displacement efficiency. However, the applied confining pressure during displacement can cause fracture closure, reducing the permeability of the rock samples and the efficiency of CO2 displacement.
(3) Based on the recovery rate, the CO2 oil displacement recovery stages are divided into early, middle, and late stages. The recovery rates of rock samples under different gas injection conditions vary significantly, with the overall displacement efficiency being higher during the middle stage. Based on the gas-oil ratio and recovery degree at the outlet section of fractured rock samples, CO2 oil displacement process can be divided into five stages :no gas detected, very little gas, gas breakthrough, large gas channeling, and gas fluctuation. Although the displacement stages differ among rock samples, the breakthrough stage tend to occur within the 2 PV range.
Author Contributions
Yutong Zhu conducted the experiments and drafted the manuscript. Xinwen Wang analyzed the experimental results. Yulong Kang provided the core samples and partial funding. Chaobin Guo designed the experiments and helped manuscript editing. Qingcheng He sought funding. Cai Li supervised the experiment and reviewed and edited the manuscript.
Funding
This work was supported by China National Science Foundation (grant No. U2244215, U2344226, 42372286,42002255), the China Geological Survey Project (DD20221819) and the Fundamental Research Funds of the Chinese Academy of Geological Sciences (JKY202413, JKYQN202306).
Conflicts of Interest
The authors declare no conflict of interest.
References
- Sambo, C.; Liu, N.; Shaibu, R.; Ahmed, A.A.; Hashish, R.G.J.G.S.; Engineering. A technical review of CO2 for enhanced oil recovery in unconventional oil reservoirs. 2023, 221, 111185. arXiv:10.1016/j.petrol.2022.111185.
- Zhou, W.; Niu, M.-y.; Luo, W.-j.; Liu, X.-t. Research Progress on Enhanced Oil Recovery by CO2 Flooding in Low Permeability Reservoirs. In Proceedings of the International Field Exploration and Development Conference, 2023; pp. 343–366.
- Syed, F.I.; Muther, T.; Van, V.P.; Dahaghi, A.K.; Negahban, S.J.F. Numerical trend analysis for factors affecting EOR performance and CO2 storage in tight oil reservoirs. 2022, 316, 123370. [CrossRef]
- Farajzadeh, R.; Eftekhari, A.A.; Dafnomilis, G.; Lake, L.; Bruining, J.J.A.e. On the sustainability of CO2 storage through CO2–Enhanced oil recovery. 2020, 261, 114467. [CrossRef]
- Al-Abri, H.; Pourafshary, P.; Mosavat, N.; Al Hadhrami, H.J.P. A study of the performance of the LSWA CO2 EOR technique on improvement of oil recovery in sandstones. 2019, 5, 58–66. [CrossRef]
- Yang, Z.-p.; Liao, X.-w.; Wang, X.-c. Optimization Study of Injection-Production Parameters for CO2 Enhanced Oil Recovery and Storage in Low Permeability Oil Reservoirs. In Proceedings of the Journal of Physics: Conference Series, 2023; p. 012055. [CrossRef]
- Gong, Y.; Gu, Y.J.E.; Fuels. Experimental study of water and CO2 flooding in the tight main pay zone and vuggy residual oil zone of a carbonate reservoir. 2015, 29, 6213–6223. [CrossRef]
- Wang, S.; Kadhum, M.J.; Chen, C.; Shiau, B.; Harwell, J.H.J.E.; fuels. Development of in situ CO2 generation formulations for enhanced oil recovery. 2017, 31, 13475–13486. [CrossRef]
- Zhou, X.; Yuan, Q.; Zhang, Y.; Wang, H.; Zeng, F.; Zhang, L.J.F. Performance evaluation of CO2 flooding process in tight oil reservoir via experimental and numerical simulation studies. 2019, 236, 730–746. [CrossRef]
- Han, B.; Cui, G.; Wang, Y.; Zhang, J.; Zhai, Z.; Shi, Y.; Yan, F.; Li, W.J.J.o.P.S.; Engineering. Effect of fracture network on water injection huff-puff for volume stimulation horizontal wells in tight oil reservoir: Field test and numerical simulation study. 2021, 207, 109106. [CrossRef]
- Liu, P.; Zhang, X.J.i.j.o.h.e. Enhanced oil recovery by CO2–CH4 flooding in low permeability and rhythmic hydrocarbon reservoir. 2015, 40, 12849–12853.
- Abedini, A.; Torabi, F.J.F. On the CO2 storage potential of cyclic CO2 injection process for enhanced oil recovery. 2014, 124, 14–27. [CrossRef]
- Li, S.; Qiao, C.; Zhang, C.; Li, Z.J.J.o.C.U. Determination of diffusion coefficients of supercritical CO2 under tight oil reservoir conditions with pressure-decay method. 2018, 24, 430–443. [CrossRef]
- Li, H.-B.; Yang, Z.-M.; Li, R.-S.; Zhou, T.-Y.; Guo, H.-K.; Liu, X.-W.; Dai, Y.-X.; Hu, Z.-G.; Meng, H.J.P.S. Mechanism of CO2 enhanced oil recovery in shale reservoirs. 2021, 18, 1788–1796. [CrossRef]
- Wang, T.; Wang, L.; Meng, X.; Chen, Y.; Song, W.; Yuan, C.J.G.S.; Engineering. Key parameters and dominant EOR mechanism of CO2 miscible flooding applied in low-permeability oil reservoirs. 2023, 225, 211724. [CrossRef]
- Zhang, Y.; Shi, L.; Ye, Z.; Chen, L.; Yuan, N.; Chen, Y.; Yang, H.J.A.o. Experimental Investigation of Supercritical CO2–Rock–Water Interactions in a Tight Formation with the Pore Scale during CO2–EOR and Sequestration. 2022, 7, 27291–27299.
- Su, X.; Yue, X.-a.J.J.o.P.S.; Engineering. Mechanism study of the relation between the performance of CO2 immiscible flooding and rock permeability. 2020, 195, 107891. [CrossRef]
- Zhang, X.; Wei, B.; You, J.; Liu, J.; Wang, D.; Lu, J.; Tong, J.J.E. Characterizing pore-level oil mobilization processes in unconventional reservoirs assisted by state-of-the-art nuclear magnetic resonance technique. 2021, 236, 121549. [CrossRef]
- Cai, M.; Su, Y.; Hao, Y.; Guo, Y.; Elsworth, D.; Li, L.; Li, D.; Li, X.J.F. Monitoring oil displacement and CO2 trapping in low-permeability media using NMR: A comparison of miscible and immiscible flooding. 2021, 305, 121606. [CrossRef]
- Wei, B.; Zhang, X.; Wu, R.; Zou, P.; Gao, K.; Xu, X.; Pu, W.; Wood, C.J.F. Pore-scale monitoring of CO2 and N2 flooding processes in a tight formation under reservoir conditions using nuclear magnetic resonance (NMR): A case study. 2019, 246, 34–41. [CrossRef]
- Dongjiang, L.; Zengmin, L.; Chengyuan, L.; Haitao, W.; Qingmin, Z.; Sheng, H.J.P.E.; Development. Nuclear magnetic resonance experimental study of CO2 injection to enhance shale oil recovery. 2021, 48, 702–712.
- Zhou, H; Gao, F; Zhou, X; Liu, H; Guo, B; Progress in Geophysics. NMR T2 Spectrum of Different Types of Sandstone in the Yungang Grottoes: Study on the Conversion of Capillary Pressure by Mercury Injection. 2013, 28, 2759–2766. (in Chinese.
- Zhang, T.; Tang, M.; Ma, Y.; Zhu, G.; Zhang, Q.; Wu, J.; Xie, Z.J.E. Experimental study on CO2/Water flooding mechanism and oil recovery in ultralow-Permeability sandstone with online LF-NMR. 2022, 252, 123948.
- Du, Q.; Liu, X.; Wang, E.; Zuo, J.; Wang, W.; Zhu, Y.J.J.o.R.M.; Engineering, G. Effects of CO2–water interaction with coal on mineral content and pore characteristics. 2020, 12, 326–337.
- Lin, Q.; Bijeljic, B.; Foroughi, S.; Berg, S.; Blunt, M.J.J.C.E.S. Pore-scale imaging of displacement patterns in an altered-wettability carbonate. 2021, 235, 116464. [CrossRef]
- Lang, DJ; Lun, ZM; Lv, CY; Wang, HT; CT Theory and Applications. NMR Experimental Study on the Characteristics of CO2 Flooding in Tight Sandstone Reservoirs. 2016, 25, 141–147. (in Chinese. [CrossRef]
- Zhang, T.; Zhu, M.; Zhou, G.; Wu, J.; Yang, X.; Li, R.J.S.J. Experimental Study on CO2 Flooding Characteristic in Low-Permeability Sandstone Considering the Influence of In-Situ Stress. 2024, 1-10. [CrossRef]
- Luo, Y.; Zheng, T.; Xiao, H.; Liu, X.; Zhang, H.; Wu, Z.; Zhao, X.; Xia, D.J.J.o.P.S.; Engineering. Identification of distinctions of immiscible CO2 huff and puff performance in Chang-7 tight sandstone oil reservoir by applying NMR, microscope and reservoir simulation. 2022, 209, 109719. [CrossRef]
- Ren, J.; Xiao, W.; Pu, W.; Tang, Y.; Bernabé, Y.; Cheng, Q.; Zheng, L.J.E. Characterization of CO2 miscible/immiscible flooding in low-permeability sandstones using NMR and the VOF simulation method. 2024, 297, 131211. [CrossRef]
|
Disclaimer/Publisher’s Note: The statements, opinions and data contained in all publications are solely those of the individual author(s) and contributor(s) and not of MDPI and/or the editor(s). MDPI and/or the editor(s) disclaim responsibility for any injury to people or property resulting from any ideas, methods, instructions or products referred to in the content. |
© 2024 by the authors. Licensee MDPI, Basel, Switzerland. This article is an open access article distributed under the terms and conditions of the Creative Commons Attribution (CC BY) license (http://creativecommons.org/licenses/by/4.0/).
