Preprint
Article

DLK1 Is Associated with Stemness Phenotype in Medullary Thyroid Carcinoma Cell Lines

Altmetrics

Downloads

82

Views

51

Comments

0

A peer-reviewed article of this preprint also exists.

Submitted:

07 October 2024

Posted:

08 October 2024

You are already at the latest version

Alerts
Abstract
Medullary thyroid carcinoma (MTC) is a rare and aggressive tumor, often requiring systemic treatment in advanced or metastatic stages, where drug resistance presents a significant challenge. Given the role of cancer stem cells (CSCs) in cancer recurrence and drug resistance, we aimed to identify CSC subpopulations within two MTC cell lines harboring pathogenic variants in the two most common MEN2-associated codons. We analyzed 15 stemness-associated markers, along with well-established thyroid stem cell markers (CD133, CD44, and ALDH1), a novel candidate (DLK1), and multidrug resistance proteins (MRP1 and MRP3). The ability to efflux the fluorescent dye Hoechst 3342 and form spheroids, representing CSC behavior, was also assessed. MZ-CRC-1 cells (p.M918T), displayed higher expression of canonical markers, DLK1 and MRP proteins than TT cells (p.C634W). MZ-CRC-1 cells also formed more spheroids and showed lower dye accumulation (p < 0.0001). Finally, we found that DLK1+ cells (populations of cells expressing DLK1), exhibited significantly higher expression of stemness markers compared to DLK1- cells (populations of cells negative for DLK1). These findings highlight the role of DLK1 in promoting the stemness phenotype and offer new insights into MTC progression and resistance, with potential therapeutic implications.
Keywords: 
Subject: Medicine and Pharmacology  -   Oncology and Oncogenics

1. Introduction

Medullary thyroid carcinoma (MTC) is a rare tumor that arises from calcitonin-secreting parafollicular C-cells in the thyroid gland. Approximately 25-40% of MTC cases are hereditary, occurring as part of multiple endocrine neoplasia type 2A or 2B (MEN 2A or MEN 2B) syndromes, while the remaining 60-75% are sporadic cases [1,2].
Familial cases are attributed to germline-activating pathogenic variants in the RET gene, located at 10q11.21 [2]. Despite a well-established genotype-phenotype correlation between RET pathogenic variants and MEN 2 syndromes, there exists significant variability in the age of onset, disease aggressiveness, and outcomes both within and among families with the same RET pathogenic variant [1,2,3,4,5,6,7]. Additionally, somatic pathogenic variants in the RET gene, and less frequently in the RAS genes, are identified in sporadic MTCs [8,9,10].
Both hereditary and sporadic forms of MTC often present with cervical lymph node involvement at diagnosis, occurring in approximately 50% of cases. The primary treatment is extensive and meticulous surgical resection. However, distant metastases are observed in 10-15% of patients, underscoring the need for thorough assessment of disease extent and severity [1,2].
In the absence of a standardized risk-stratification system, clinical-pathological prognostic factors -such as age at diagnosis, gender, tumor stage, tumor volume doubling time, regional lymph node involvement, and distant metastases -are used to identify high-risk patients who may benefit from more aggressive treatment [2,11].
For patients with progressive or symptomatic metastatic disease not amenable to surgery, radiotherapy and targeted systemic therapies are effective interventions. However, despite their efficacy and generally favorable tolerability, resistance mechanisms have been documented, highlighting the need of ongoing research and drug development to overcome these challenges [12,13,14,15,16,17,18,19,20,21,22,23,24,25].
In our prior study, we discovered recurrent somatic copy number alterations (CNAs) affecting the DLK1 locus (14q32.2) in both sporadic and hereditary cases of MTC [26]. A correlation was observed between DLK1 copy number alterations (CNA) and pathological features indicative of more aggressive disease and poorer outcomes (larger tumor size and advanced AJCC tumor stages).
Delta-like non-canonical Notch ligand 1 (DLK1) is a maternally imprinted and paternally expressed gene that belongs to the DLK1-DIO3 gene cluster on chromosome 14q34. It was initially identified as a non-canonical Notch ligand with established roles during development and supportive functions in several aggressive cancers [27]. Elevated DLK1 expression has been documented across a spectrum of cancers affecting various organ systems, including the endocrine system, gastrointestinal tract, lungs, liver, kidneys, brain, breast, sarcomas, and both pediatric and adult blood cancers. Its increased expression often correlates with advanced disease stages and is associated with worse outcomes in terms of progression-free survival (PFS), recurrence-free survival (RFS), and overall survival (OS). Moreover, elevated DLK1 levels have been linked to increased self-renewal capacity and resistance to chemotherapy and other treatment modalities across diverse malignancies [28,29,30].
In this study, we conducted a meticulous examination of the expression of a range of well-established stemness markers, alongside potential stem cell markers identified in the MTC literature [20,21,31]. Given that multicellular spheroid generation is often used as an experimental model to measure the self-renewal, multidrug resistance, and multipotent nature of the cancer stem cell (CSC) subpopulation within a tumor or cancer cell line, we further investigated the ability of these cell lines to form multicellular spheroids and express multidrug resistance proteins. We next investigated DLK1 expression in medullary and non-medullary thyroid carcinoma cells, isolated subpopulations of MTC cells expressing DLK1 (DLK1+) and those lacking DLK1 expression (DLK1-) and subjected them to a detailed characterization of their expression of stem cell markers.

2. Results

2.1. Distinct Molecular Signatures of Stem Cell Markers in MTC Cell Lines

The stemness profile of two MTC cell lines was performed using a semi-quantitative antibody-based array for parallel detection of 15 established stem cell markers (Table 1). Across both MZ-CRC-1 cells and TT cells, most markers associated with pluripotency, cell self-renewal, maintenance of stem cell properties, and angiogenesis exhibited elevated expression levels. Remarkably, the expression of OCT3/4 (p = 0.009), SOX2 (p = 0.0428), NANOG (p = 0.031), OTX2 (p=0.0423), VEGF (p=0.0139), SOX17 (p=0.0282) and PDX-1 (p=0.0247), was significantly higher in MZ-CRC-1 cells compared to TT cells (Figure 1A,B). Unpredictably, the expression of hCG, primarily produced by the placenta during pregnancy, was notably higher in MZ-CRC-1 cells compared to TT cells (p= 0.0035). On the other hand, the expression of SNAIL (p=0.0059) and E-Cadherin (p=0.0017) were significantly higher in TT cells compared to MZ-CRC-1 cells. The expression levels of GSC, FOXA2, TP63, GATA-4, and AFP were not found to differ significantly between the two cell lines (Figure 1B, Table 1). These results underscore distinct molecular signatures and potential functional differences between the MTC cell lines.

2.2. Validation Analysis Confirmed Higher Expression of Stemness Markers in MZ-CRC-1 Cells

To validate the findings from the proteomic profile array, we investigated the expression of the widely recognized stemness markers OCT3/4, SOX2, and NANOG using flow cytometry (FC). The histograms from the FC analysis illustrate the expression levels of these pluripotency factors in both MZ-CRC-1 and TT cells. The rightward shift of the red peaks (staining) in the histograms demonstrates the expression of OCT3/4, SOX2, and NANOG. This shift clearly distinguishes the signal from the secondary antibody (green peak) and negative control (black peak), confirming specific binding to the target proteins. The negative control cells were treated solely with the secondary antibody, as indicated by the green peak (Figure 1C). Upon examination of the histogram bar graphs, we observe a significant increase in the MFI of SOX2 (p = 0.001) and NANOG (p < 0.0001) in MZ-CRC-1 cells compared to TT cells (Figure 1D). Although the MFI of OCT3/4 was slightly higher in MZ-CRC-1 cells, this difference did not achieve statistical significance relative to TT cells. Importantly, the percentage of positive cells for these markers was significantly higher in MZ-CRC-1 compared to TT cells: OCT3/4 (40.3% vs. 26.5%), SOX2 (96.5% vs. 60.5%), and NANOG (63.8% vs. 1.7%) (Figure 1E). These findings underscore the heightened stemness profile exhibited by MZ-CRC-1 cells.

2.3. The Expression of Hypothetical Thyroid Cancer Stem Cell in MTC Cell Lines

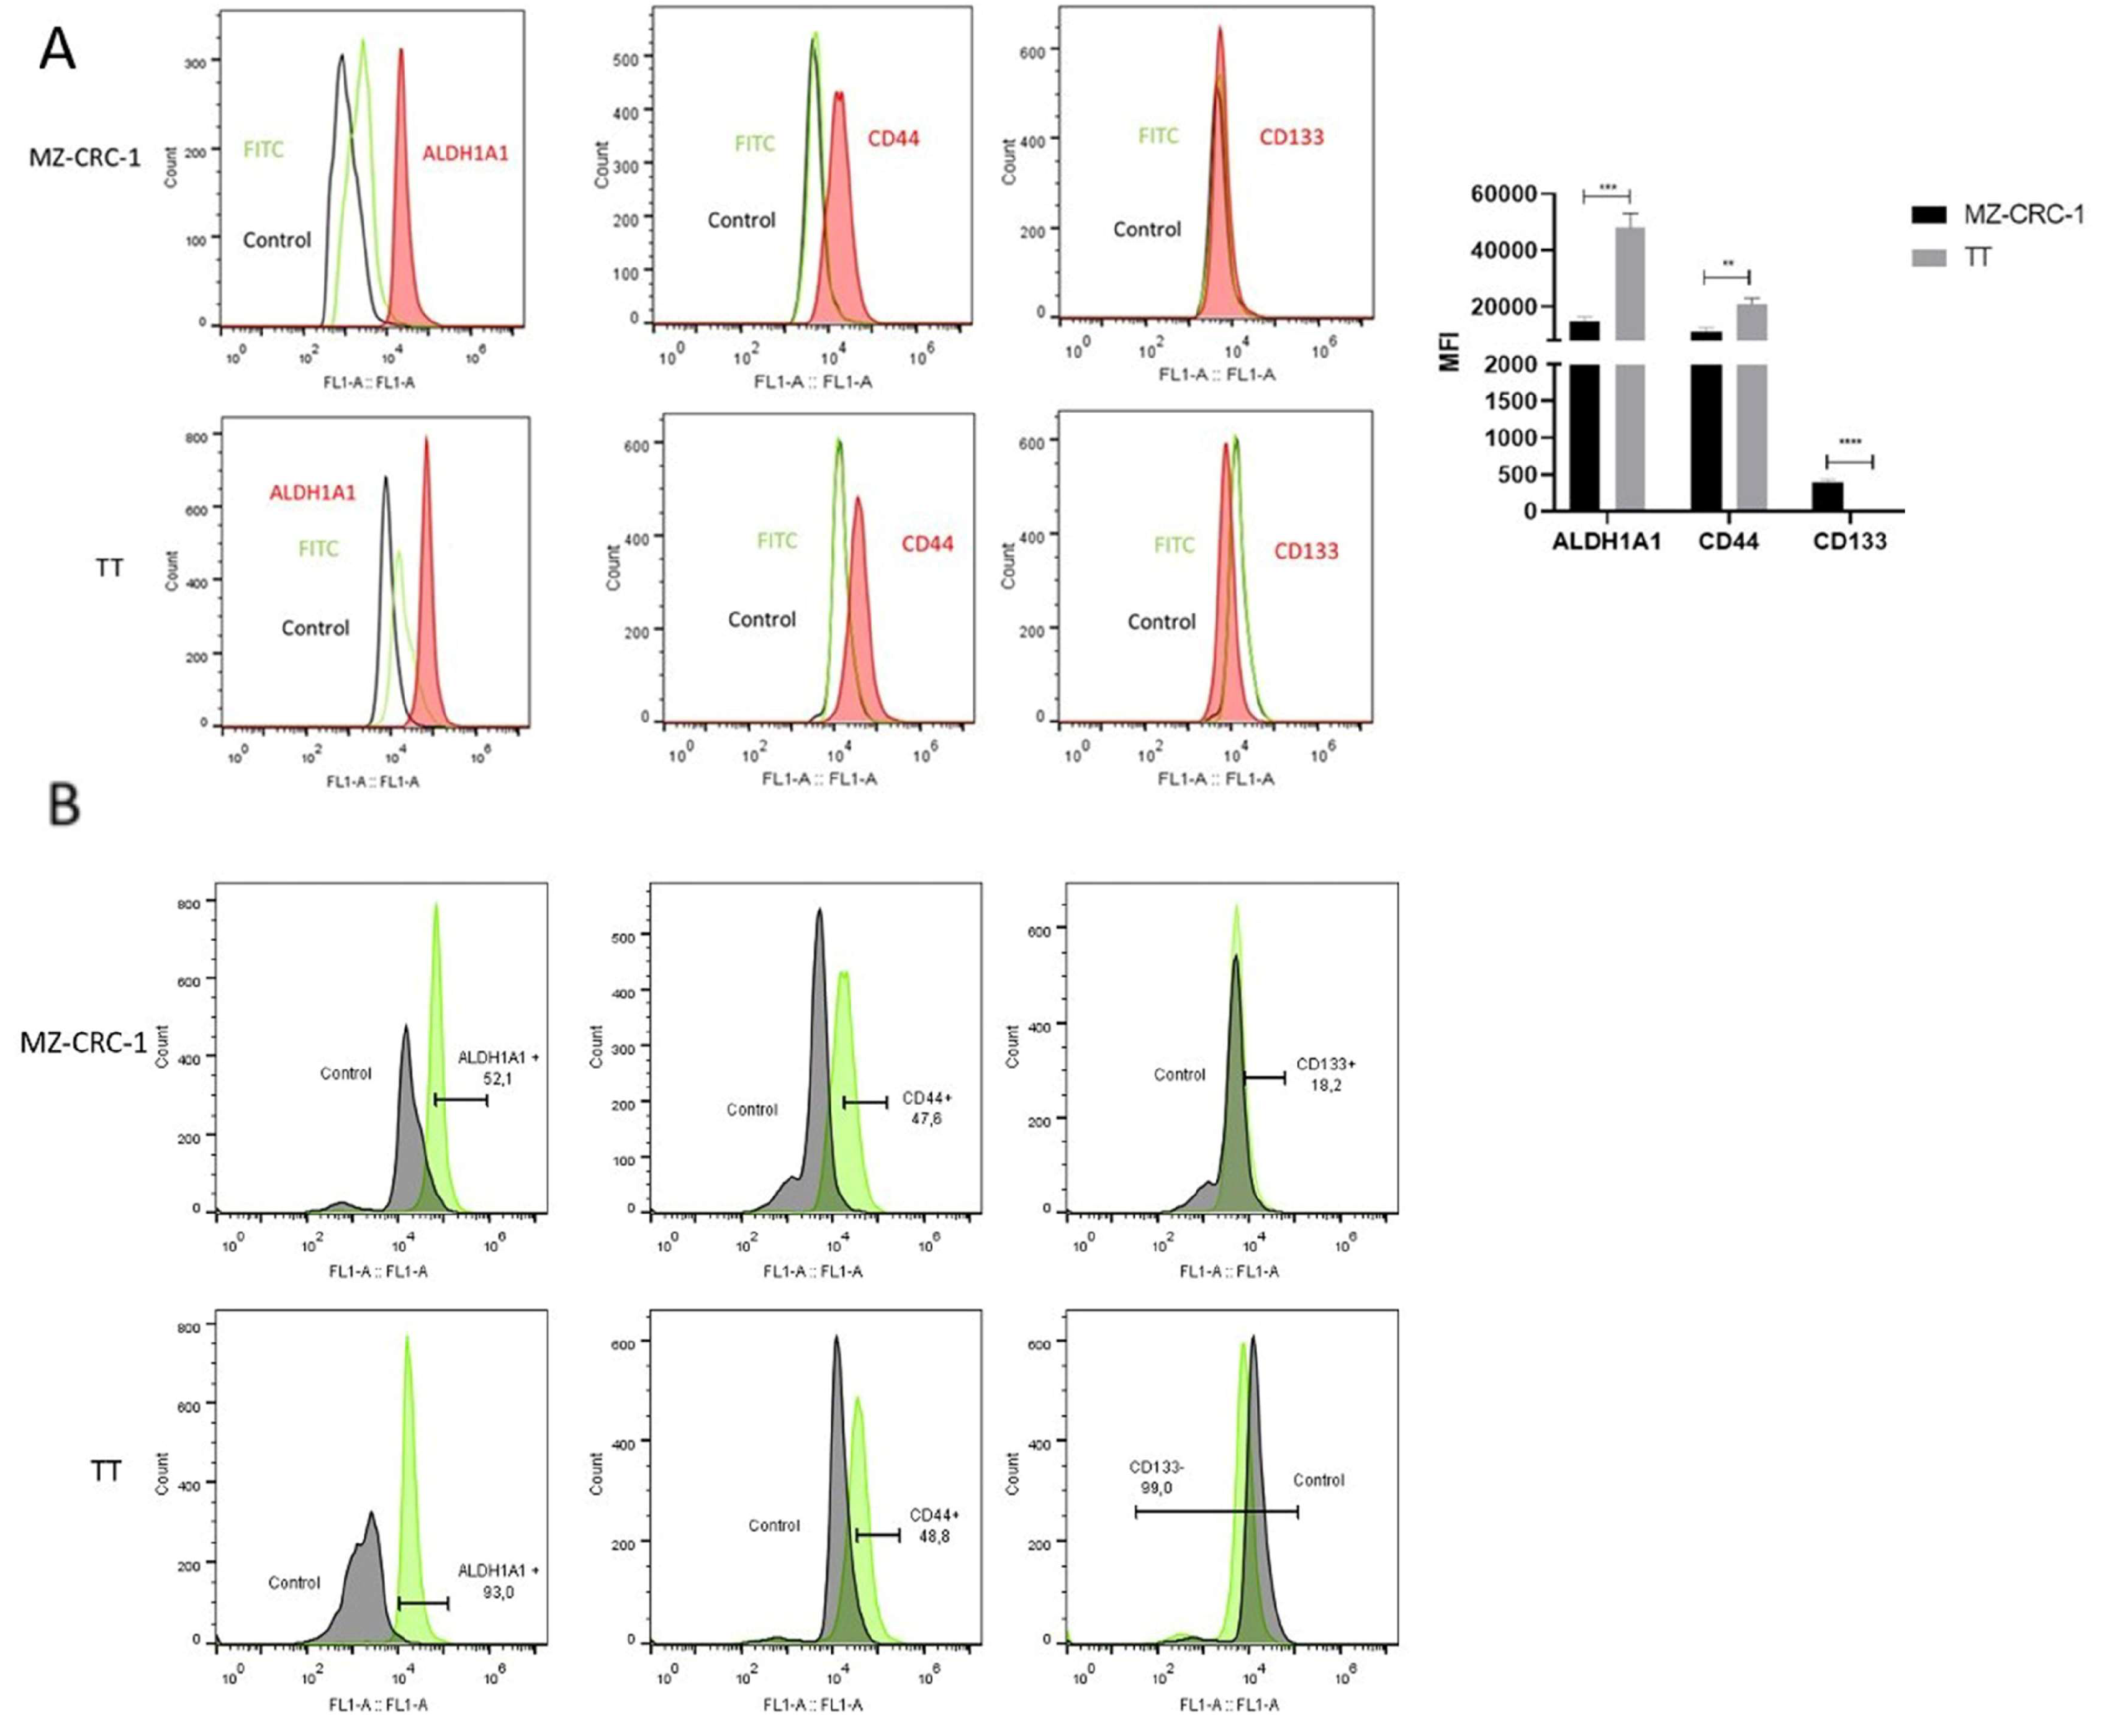
Flow cytometry was employed to assess the expression of putative thyroid cancer stem cell markers CD44 and CD133, as well as ALDH1A1, in MTC cell lines. Our analysis revealed that both MZ-CRC-1 and TT cells expressed ALDH1A1 and CD44 markers, whereas CD133 expression was specifically detected in MZ-CRC-1 cells (Figure 2A). As illustrated in the histogram bar graphs, the MFI levels of ALDH1A1 (p = 0.0003) and CD44 (p = 0.0022) were higher in TT cells compared to MZ-CRC-1 cells. Conversely, CD133 exhibited higher expression levels in MZ-CRC-1 cells (p < 0.0001). Moreover, the proportion of cells expressing ALDH1A1 (52.1% in MZ-CRC-1 vs. 93% in TT) and CD44 (47.6% in MZ-CRC-1 vs. 48.8% in TT) was higher in TT cells. Conversely, the proportion of cells expressing CD133 was greater in MZ-CRC-1 cells (18.2% vs. 1%) (Figure 2B). These findings highlight the distinct expression patterns and proportions of cells expressing these potential biomarkers in the two MTC cell lines.

2.4. DLK1 Is Specifically Expressed in MTC Cell Lines

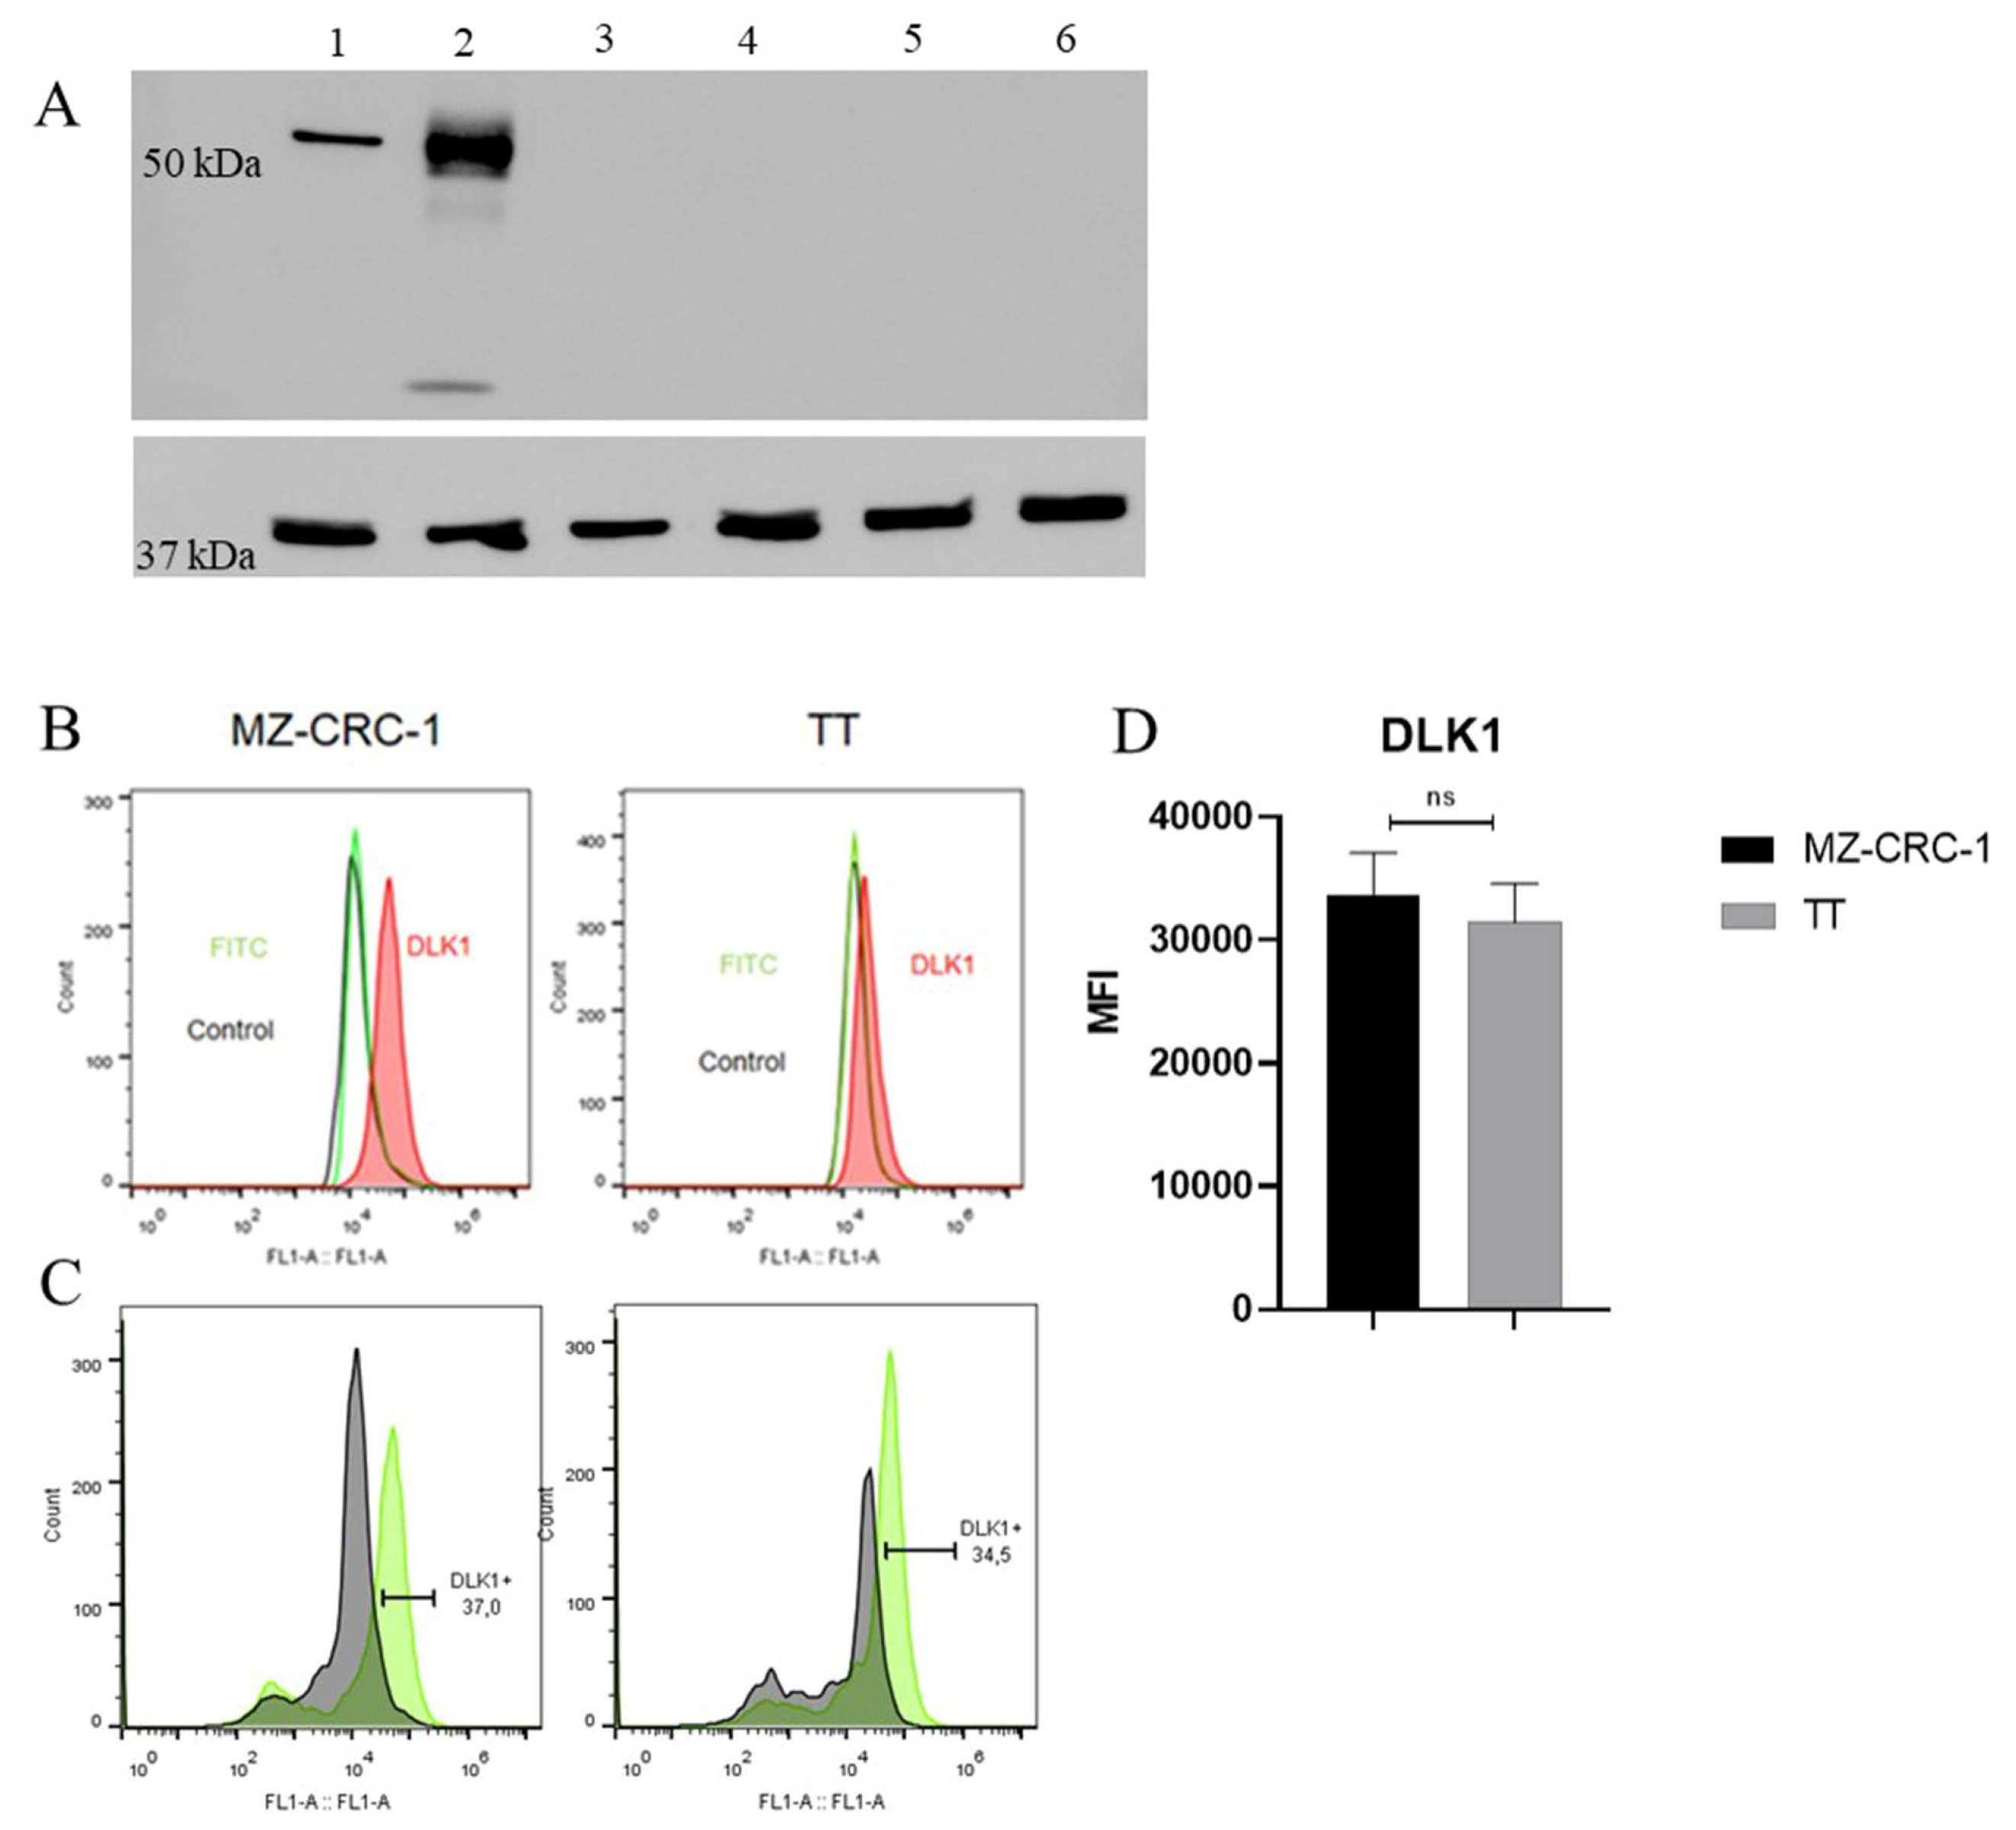
DLK1, a surface protein belonging to the NOTCH noncanonical ligand family, is co-expressed with stem cell markers in various human cancers and, therefore, implicated in regulating stem cell properties. This study investigates the DLK1 expression in six thyroid carcinoma cells. Despite DLK1 expression typically decreasing in most tissues post-birth, including normal thyroid tissue, protein isolated from medullary (MZ-CRC-1 and TT) and non-medullary thyroid carcinoma cell lines (BCPAP, XTC.UC1, KTC2, and 8505) showed that DLK1 expression in MTC cells, substantiating its pathogenic in MTC. Moreover, its expression was significantly higher in MZ-CRC-1 compared to TT cells. Interestingly, in the MZ-CRC-1 cell line, two isoforms of DLK1 were identified: the full-length isoform (50-55 kDa) and a smaller isoform of approximately 24-27 kDa (Figure 3A).
Flow cytometry analysis confirmed DLK1 expression in both MZ-CRC-1 and TT cells (Figure 3B), suggesting that the membrane-bound isoform of DLK1 is expressed in both MTC cell lines and may contribute to the maintenance of the stem cell phenotype in these cells. Although the proportion of cells expressing DLK1 was slightly higher in MZ-CRC-1 than in TT cells, the difference was not statistically significant between the two MTC cell lines (Figure 3C). For FC analysis, two independent experiments were conducted in triplicate. About 10.000 events were recorded and reported as median fluorescence intensity (MFI) (Figure 3D).

2.5. Medullary Thyroid Carcinoma Cells Exhibit Expression of Multidrug Resistance Proteins

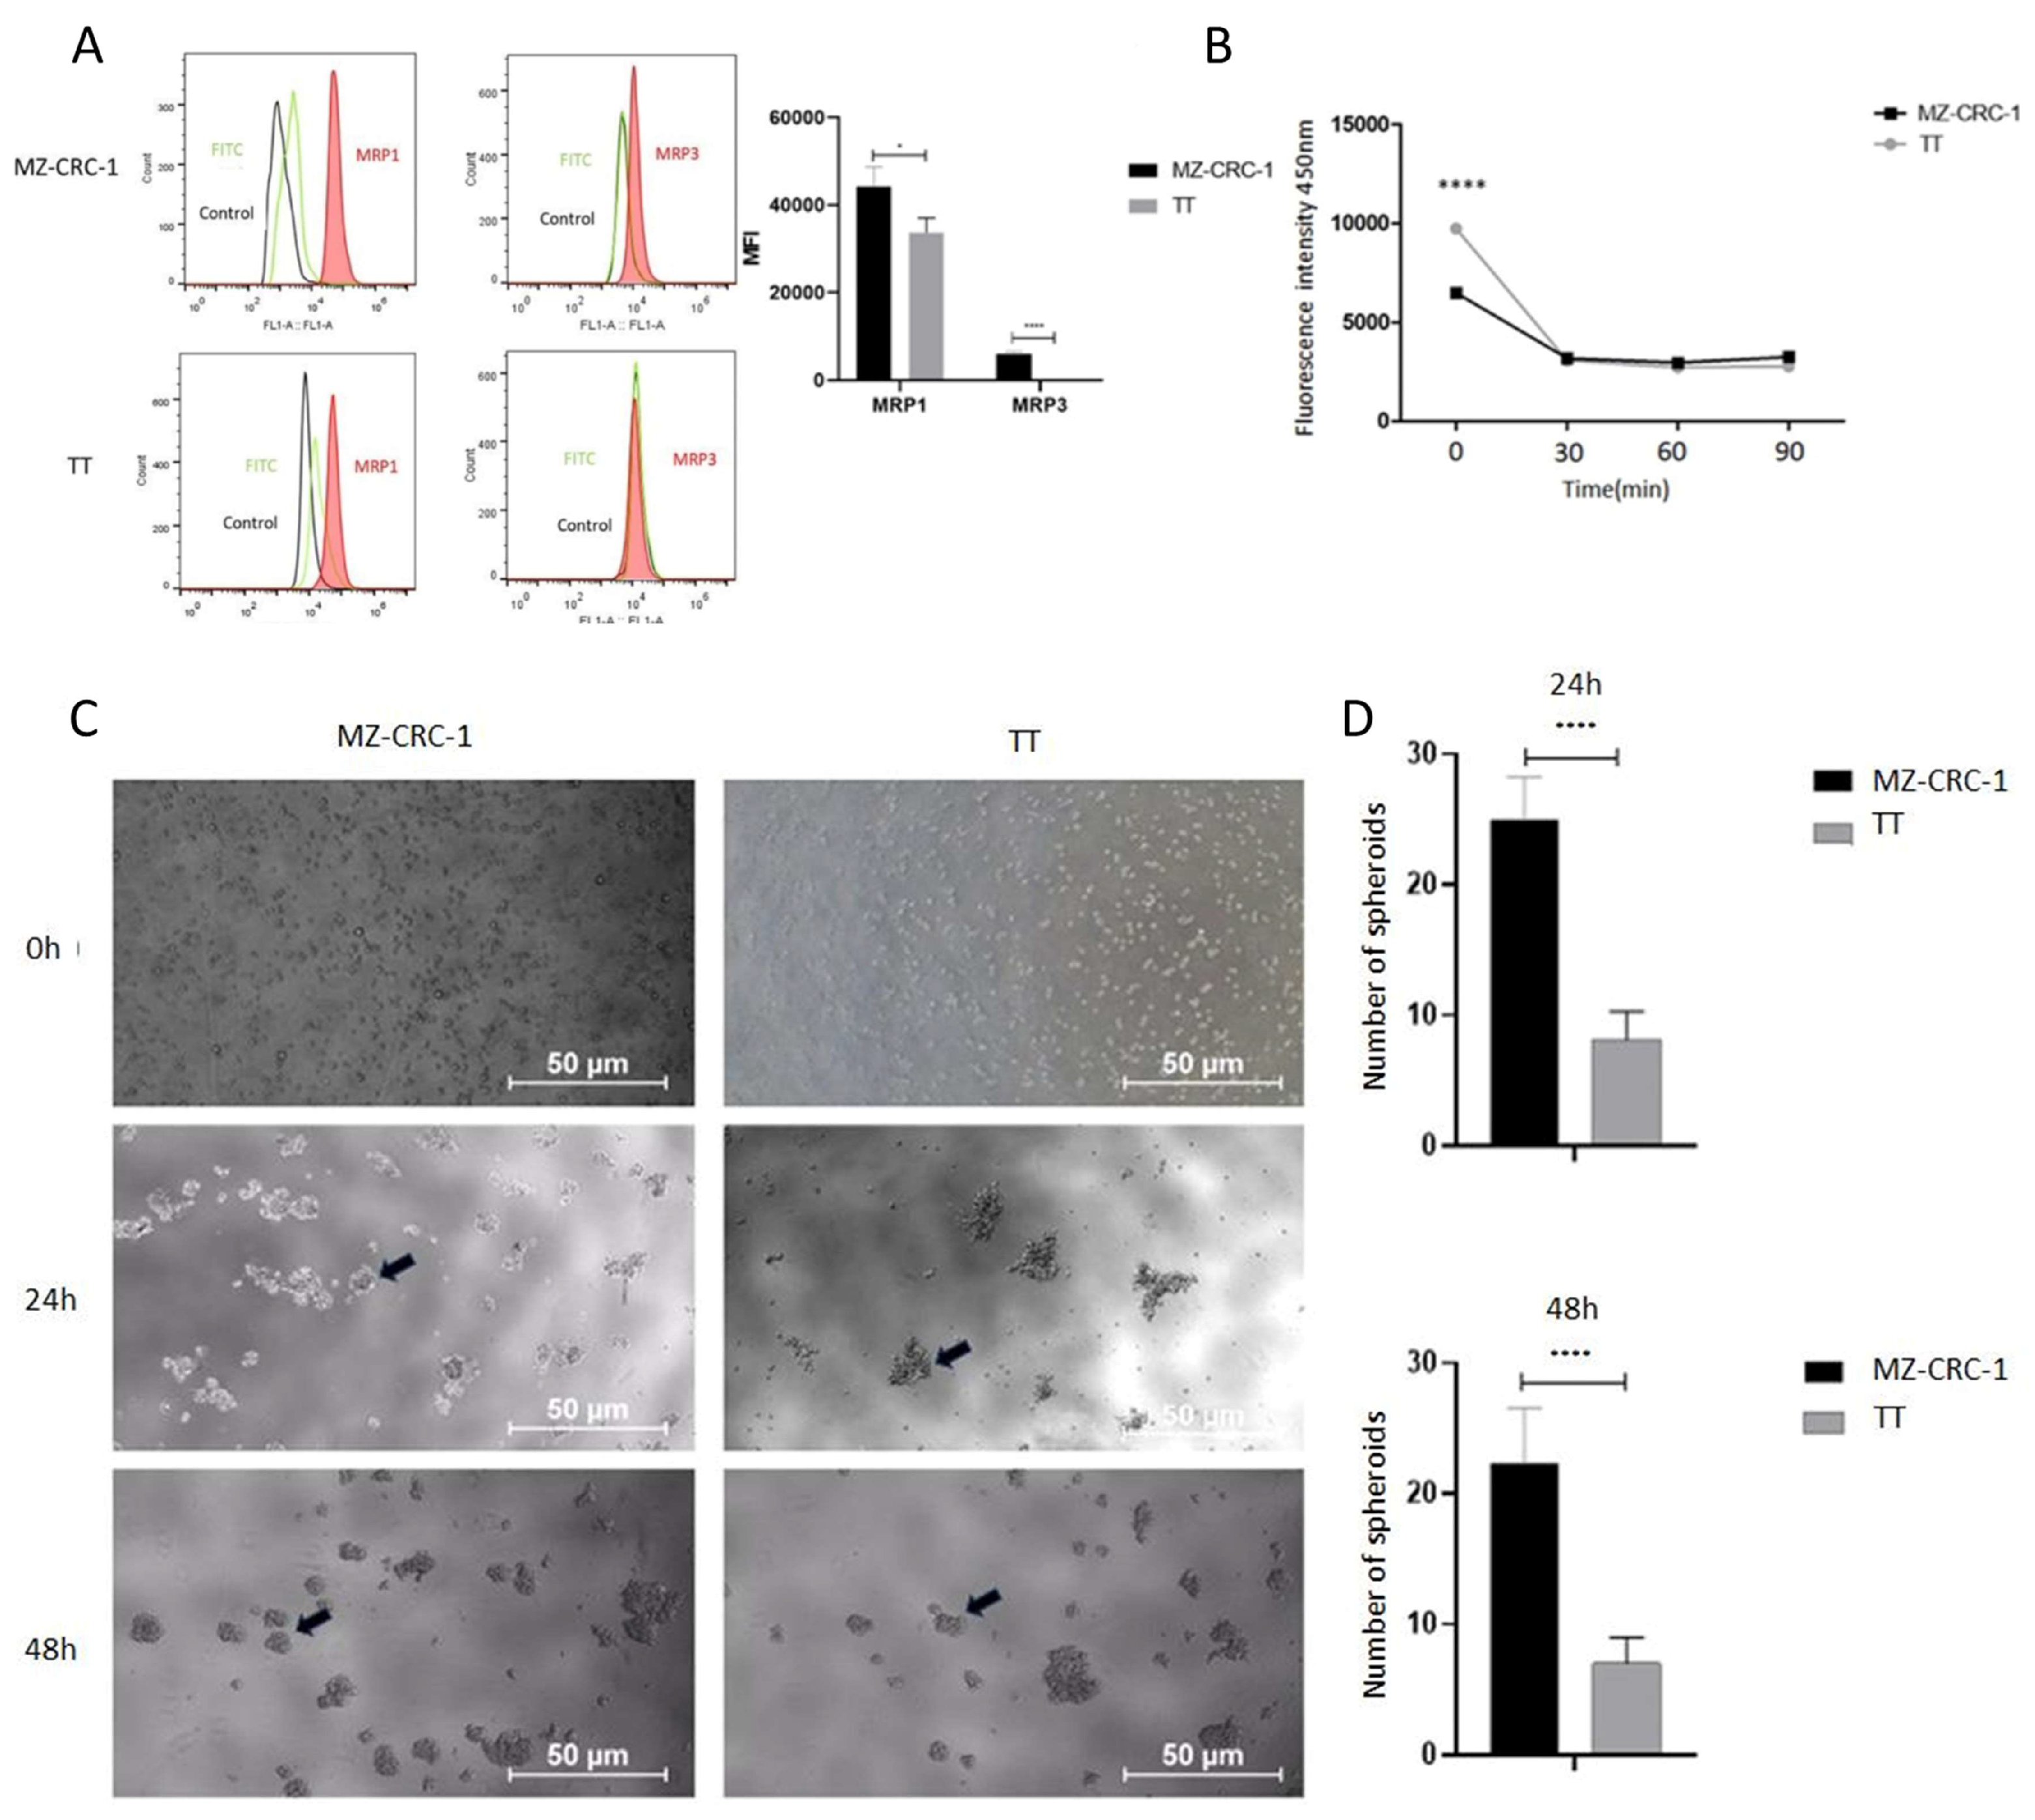
As CSCs are associated with resistance to conventional therapies, primarily due to the overexpression of multidrug resistance proteins (MRPs) which leads to reduced concentrations of chemotherapeutic drugs within cells, we assessed the expression levels of MRP1 and MRP3 proteins in MTC cells using flow cytometry. Upon examination of the histogram bar graphs, we observed that the MZ-CRC-1 cell line expresses higher levels of MRP1 (p = 0.0302) and MRP3 (p < 0.0001) compared to TT cells (Figure 4A). These findings suggest that the MZ-CRC-1 cell line may have a greater potential for developing drug resistance and maintaining a stem cell phenotype compared to TT cells.
As CSC possess the ability to efflux the fluorescent dye Hoechst 3342, often mediated by multidrug resistance efflux pumps, we conducted an exclusion assay in both MTC cell lines. As showed in Figure 4B, the intracellular accumulation of the dye is significantly lower in MZ-CRC-1 than in TT cells (p < 0.0001) (Figure 4B). These findings align with the observed expression levels of the MRP1 and MRP3 efflux pumps in MZ-CRC-1 and TT cells.

2.6. Enhanced Spheroid Generation Ability in MZ-CRC-1 Cells

Previous studies in medullary thyroid carcinoma (MTC) have indicated that the MZ-CRC-1 cell line, harboring the p.M918T RET mutation, exhibits greater numbers of CD133+ cells and enhanced sphere-forming ability compared to the TT cell line. To confirm whether these two cell lines (TT and MZ-CRC-1) differ in their ability to grow under adherence-free conditions, we conducted the multicellular spheroid generation assay. MZ-CRC-1 and TT cell lines were seeded into such plates with serum-free medium. Spheroid growth was monitored for 24 and 48 hours using an inverted phase-contrast microscope. Representative images of the spheroids are shown in Figure 4C. While both cell lines formed spheroids indicating CSC presence and stemness marker expression, notable differences were observed in spheroid number and size between them. Specifically, MZ-CRC-1 demonstrated a higher number of spheroid formations compared to TT cells at both time points (p< 0.0001). Results, presented as mean ± standard deviation, are shown in Figure 4D. Regarding the size of spheroids, no significant difference was observed between MZ-CRC-1 and TT cells at 48 hours (Figure S1).

2.7. Cell Sorting and Characterization of DLK1-Positive Cells

To investigate the association between DLK1 and stem cell phenotype, we isolate DLK1 positive (DLK1+) and DLK1 negative (DLK1-) subpopulations from the TT and MZ-CRC-1 cell lines via flow cytometry.
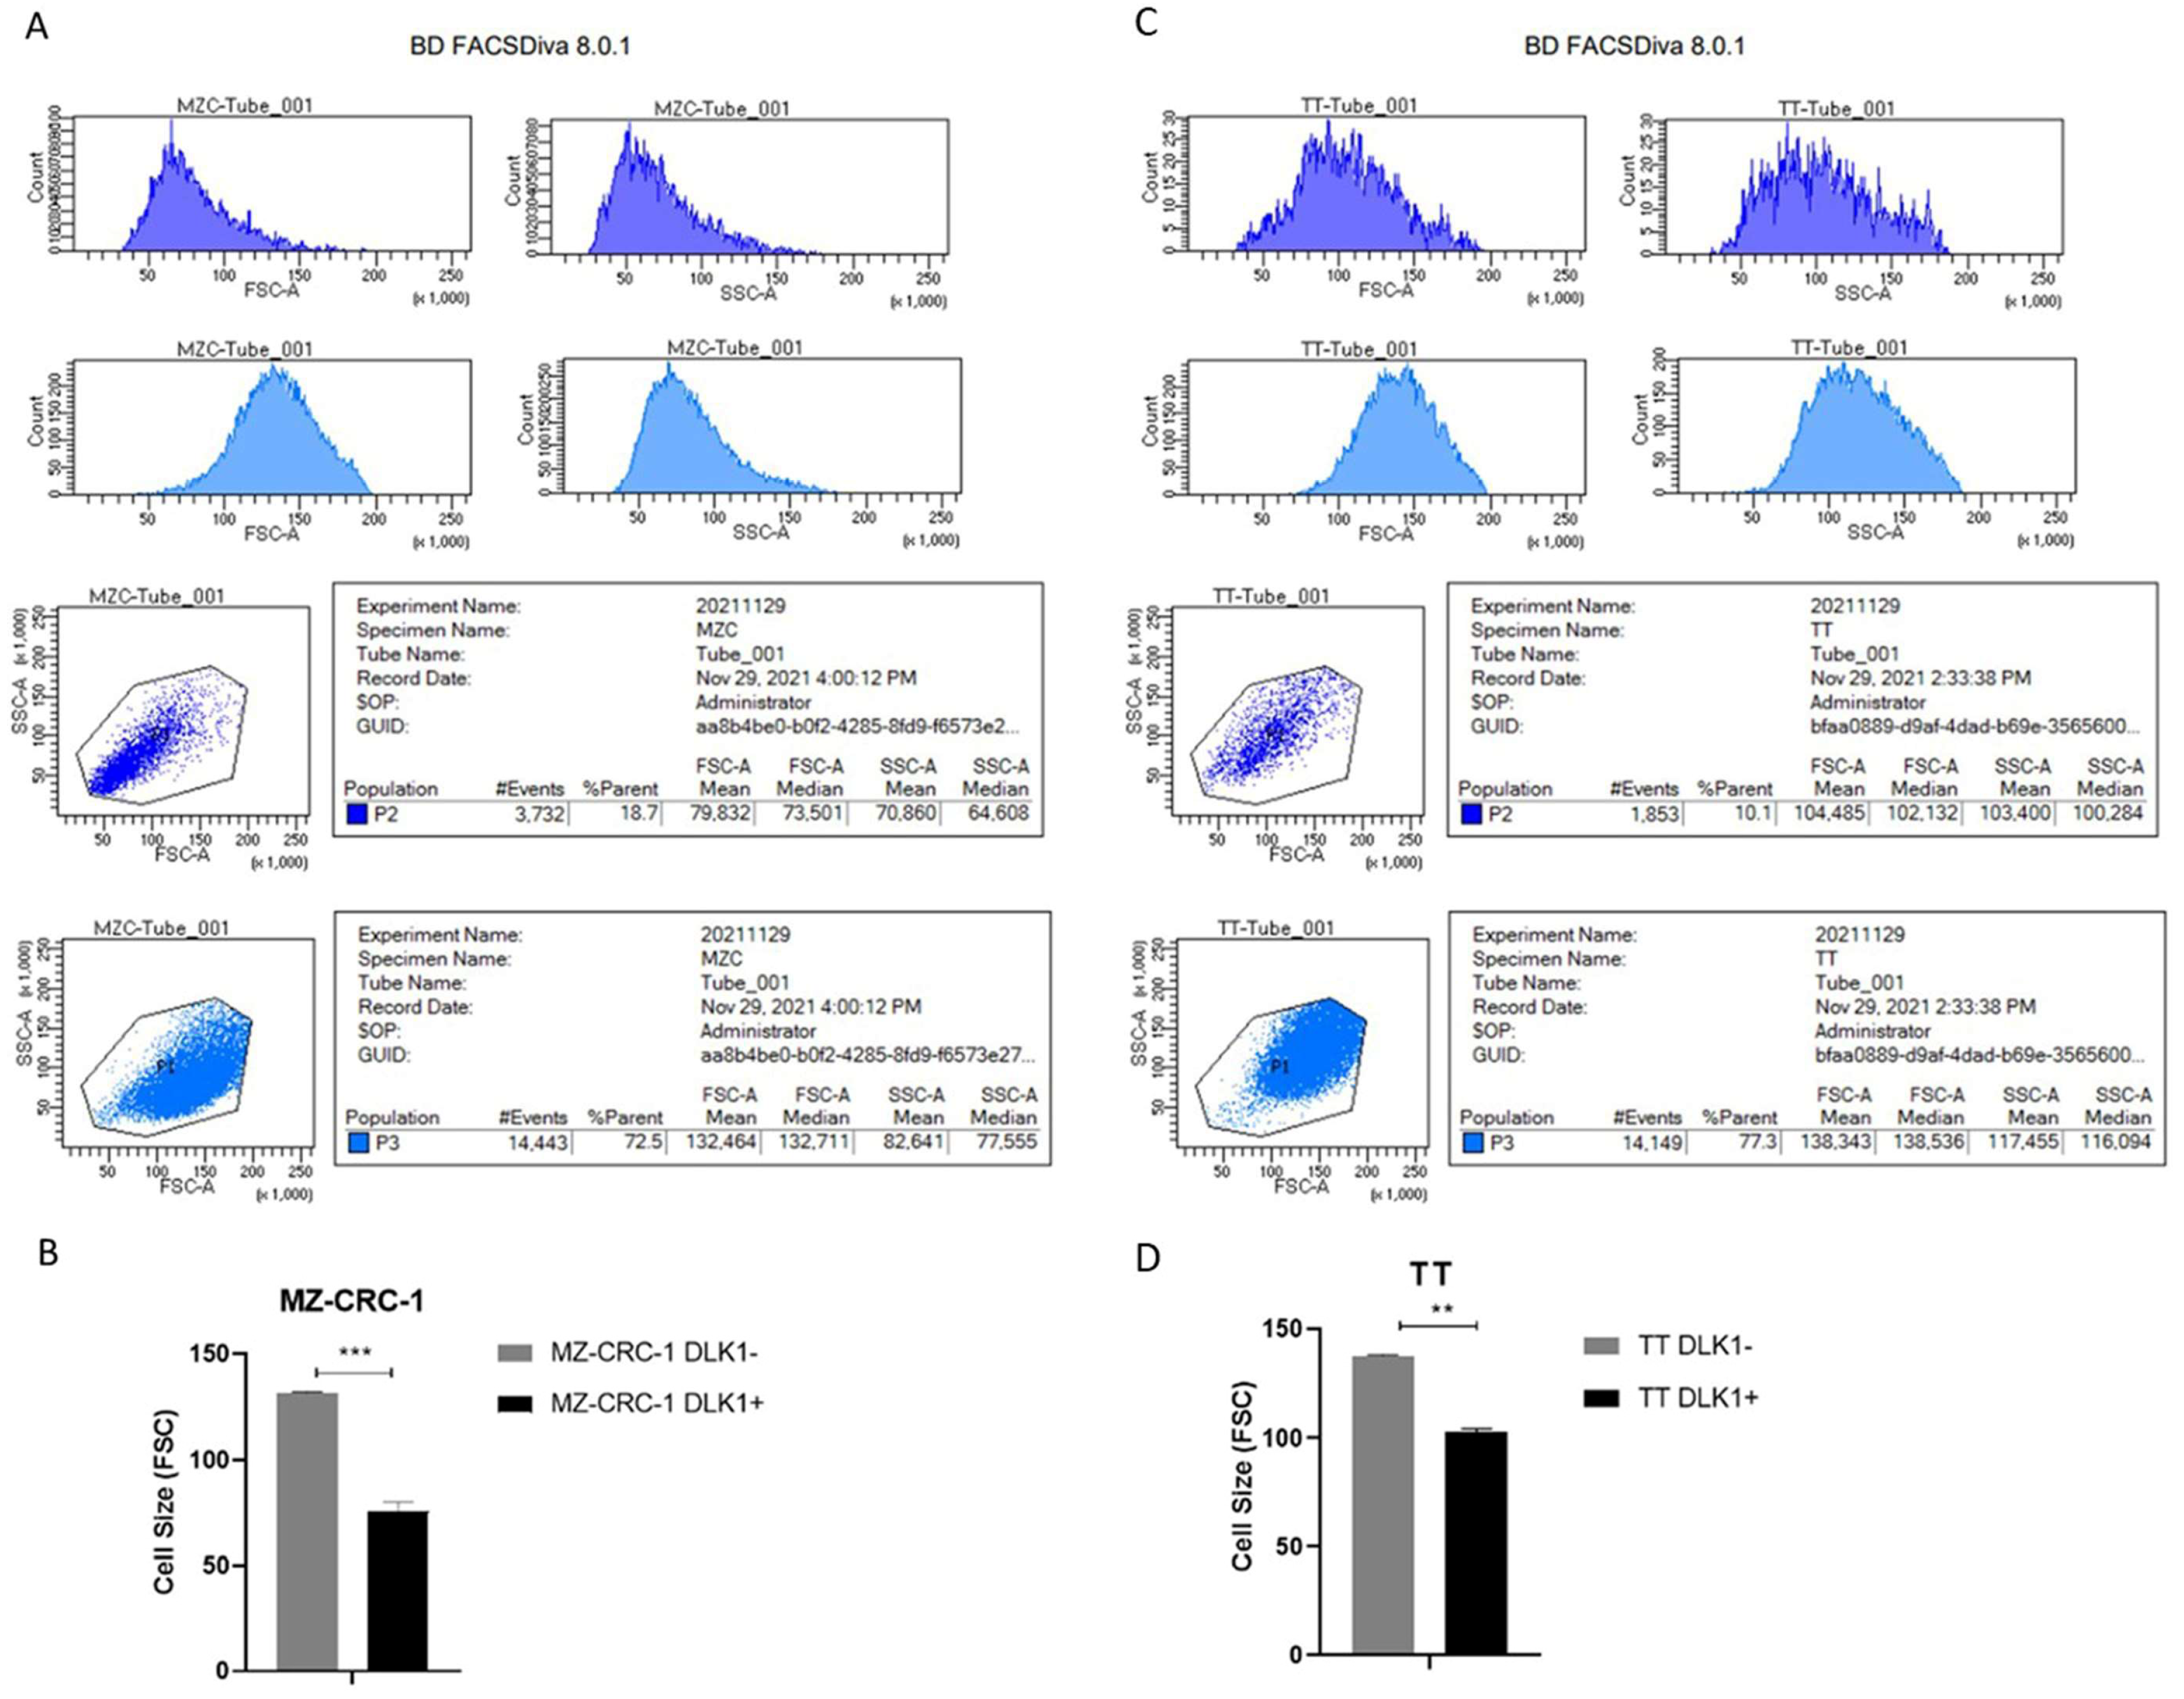
Since smaller size can be a key parameter for isolating and studying stem cell-like populations, we first compared the cell sizes of DLK1+ and DLK1- subpopulations. In both MZ-CRC-1 and TT cells, the DLK1+ subpopulations were smaller than the DLK1- cells (p < 0.01). Notably, this difference was more pronounced in the MZ-CRC-1 cells (p < 0.001) (Figure 5).
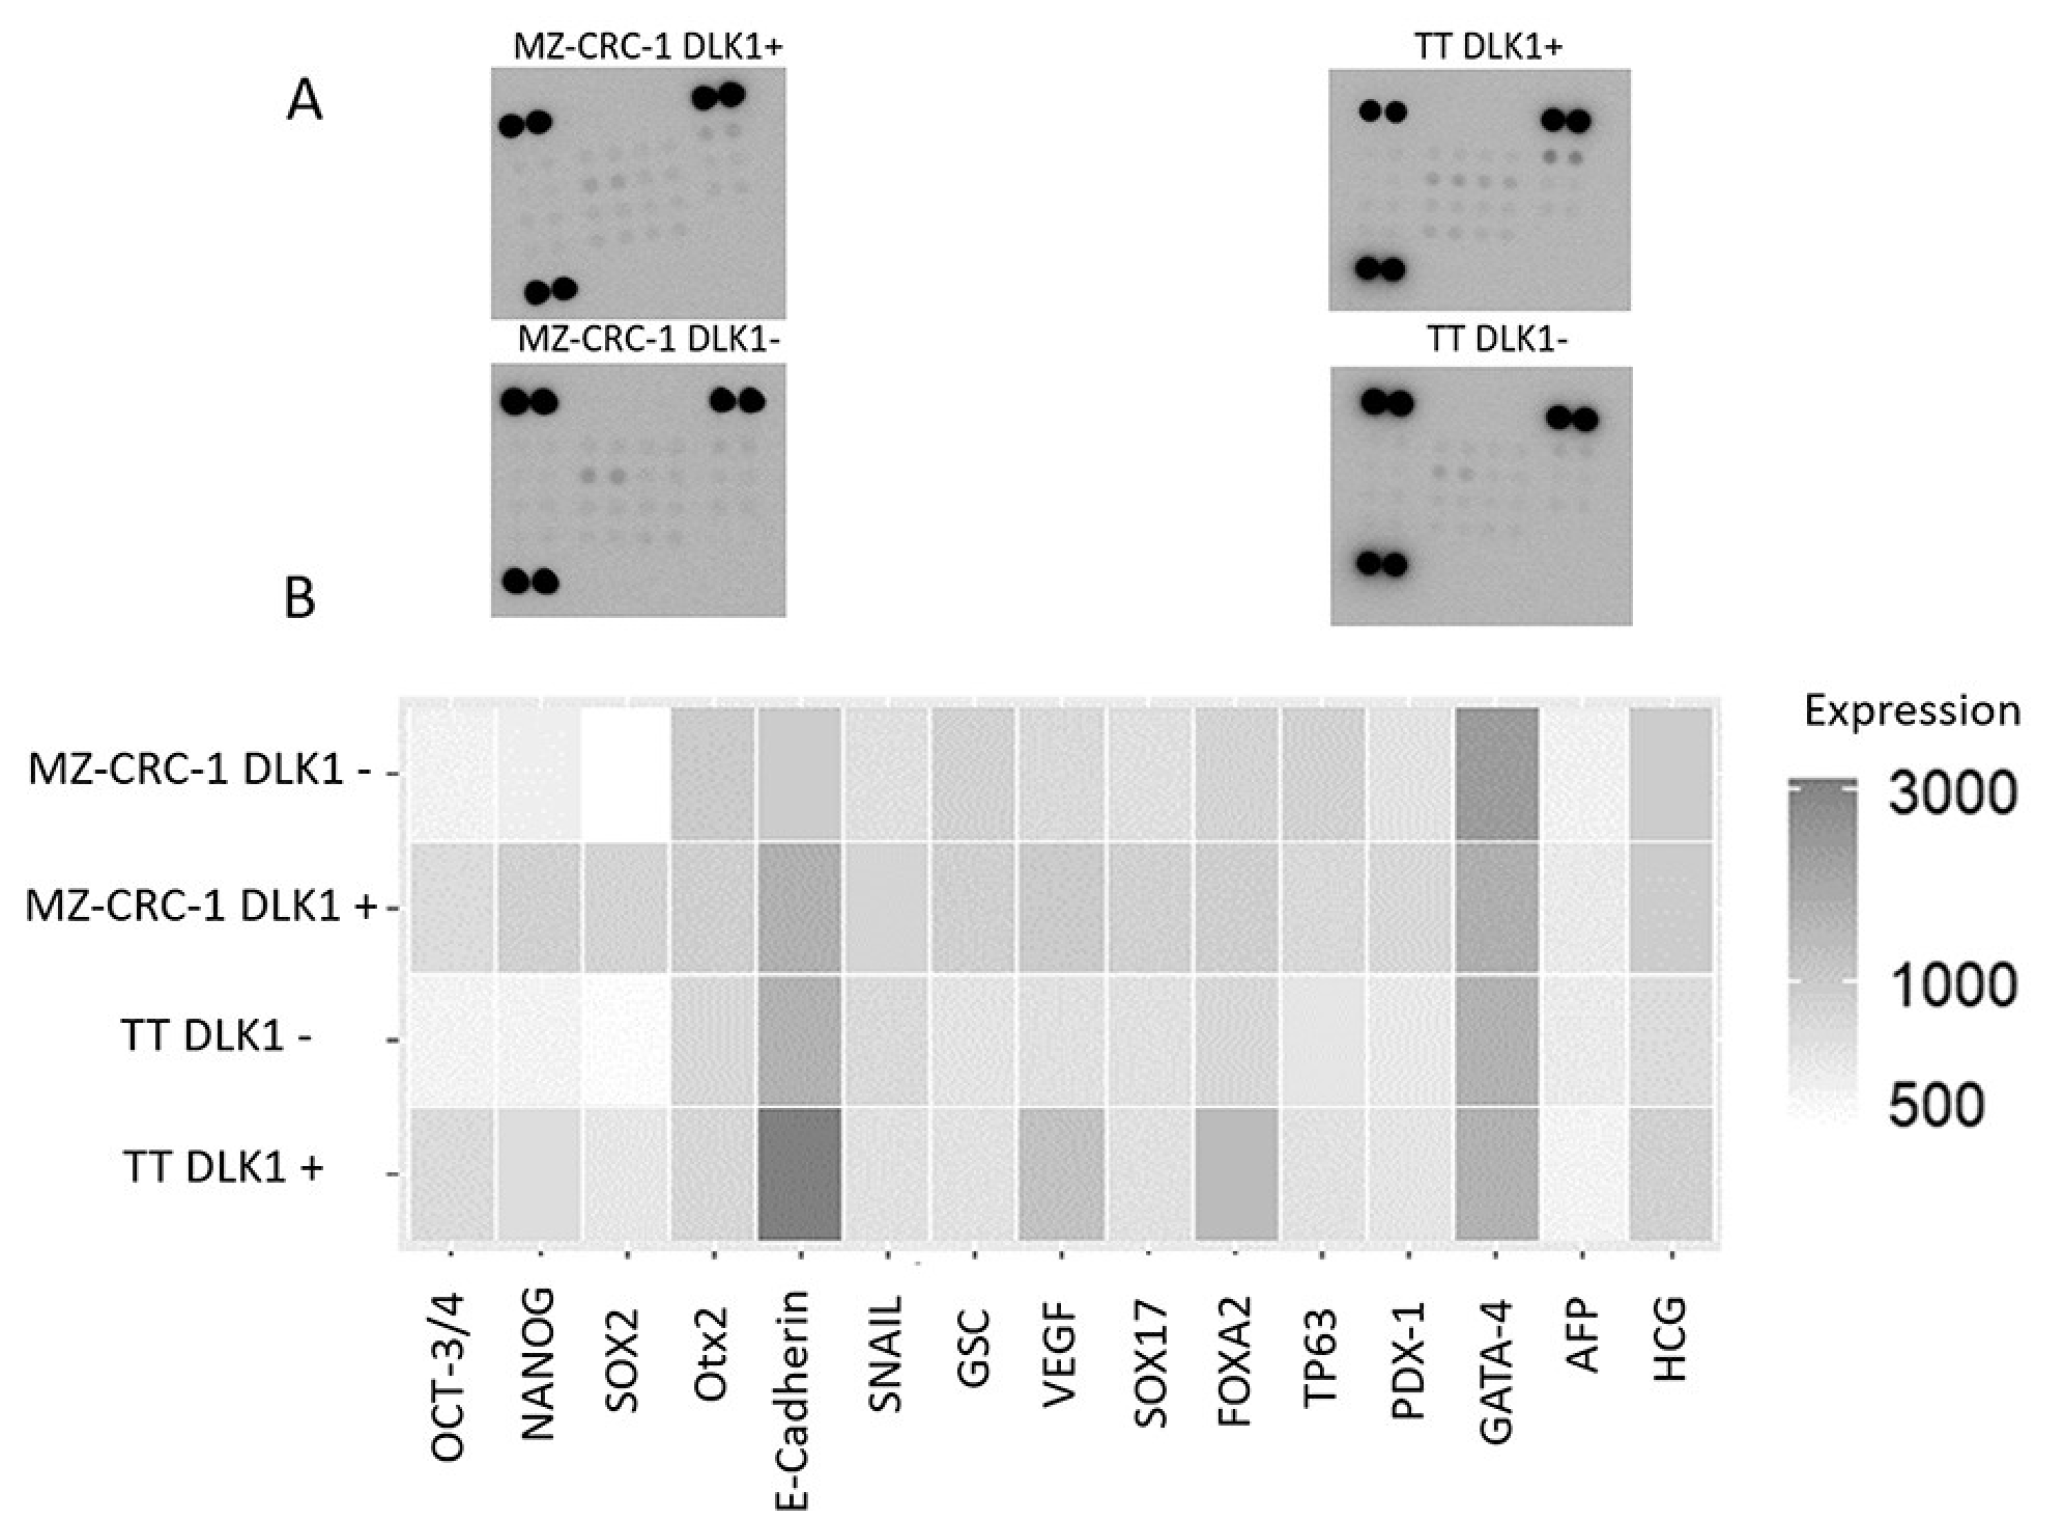
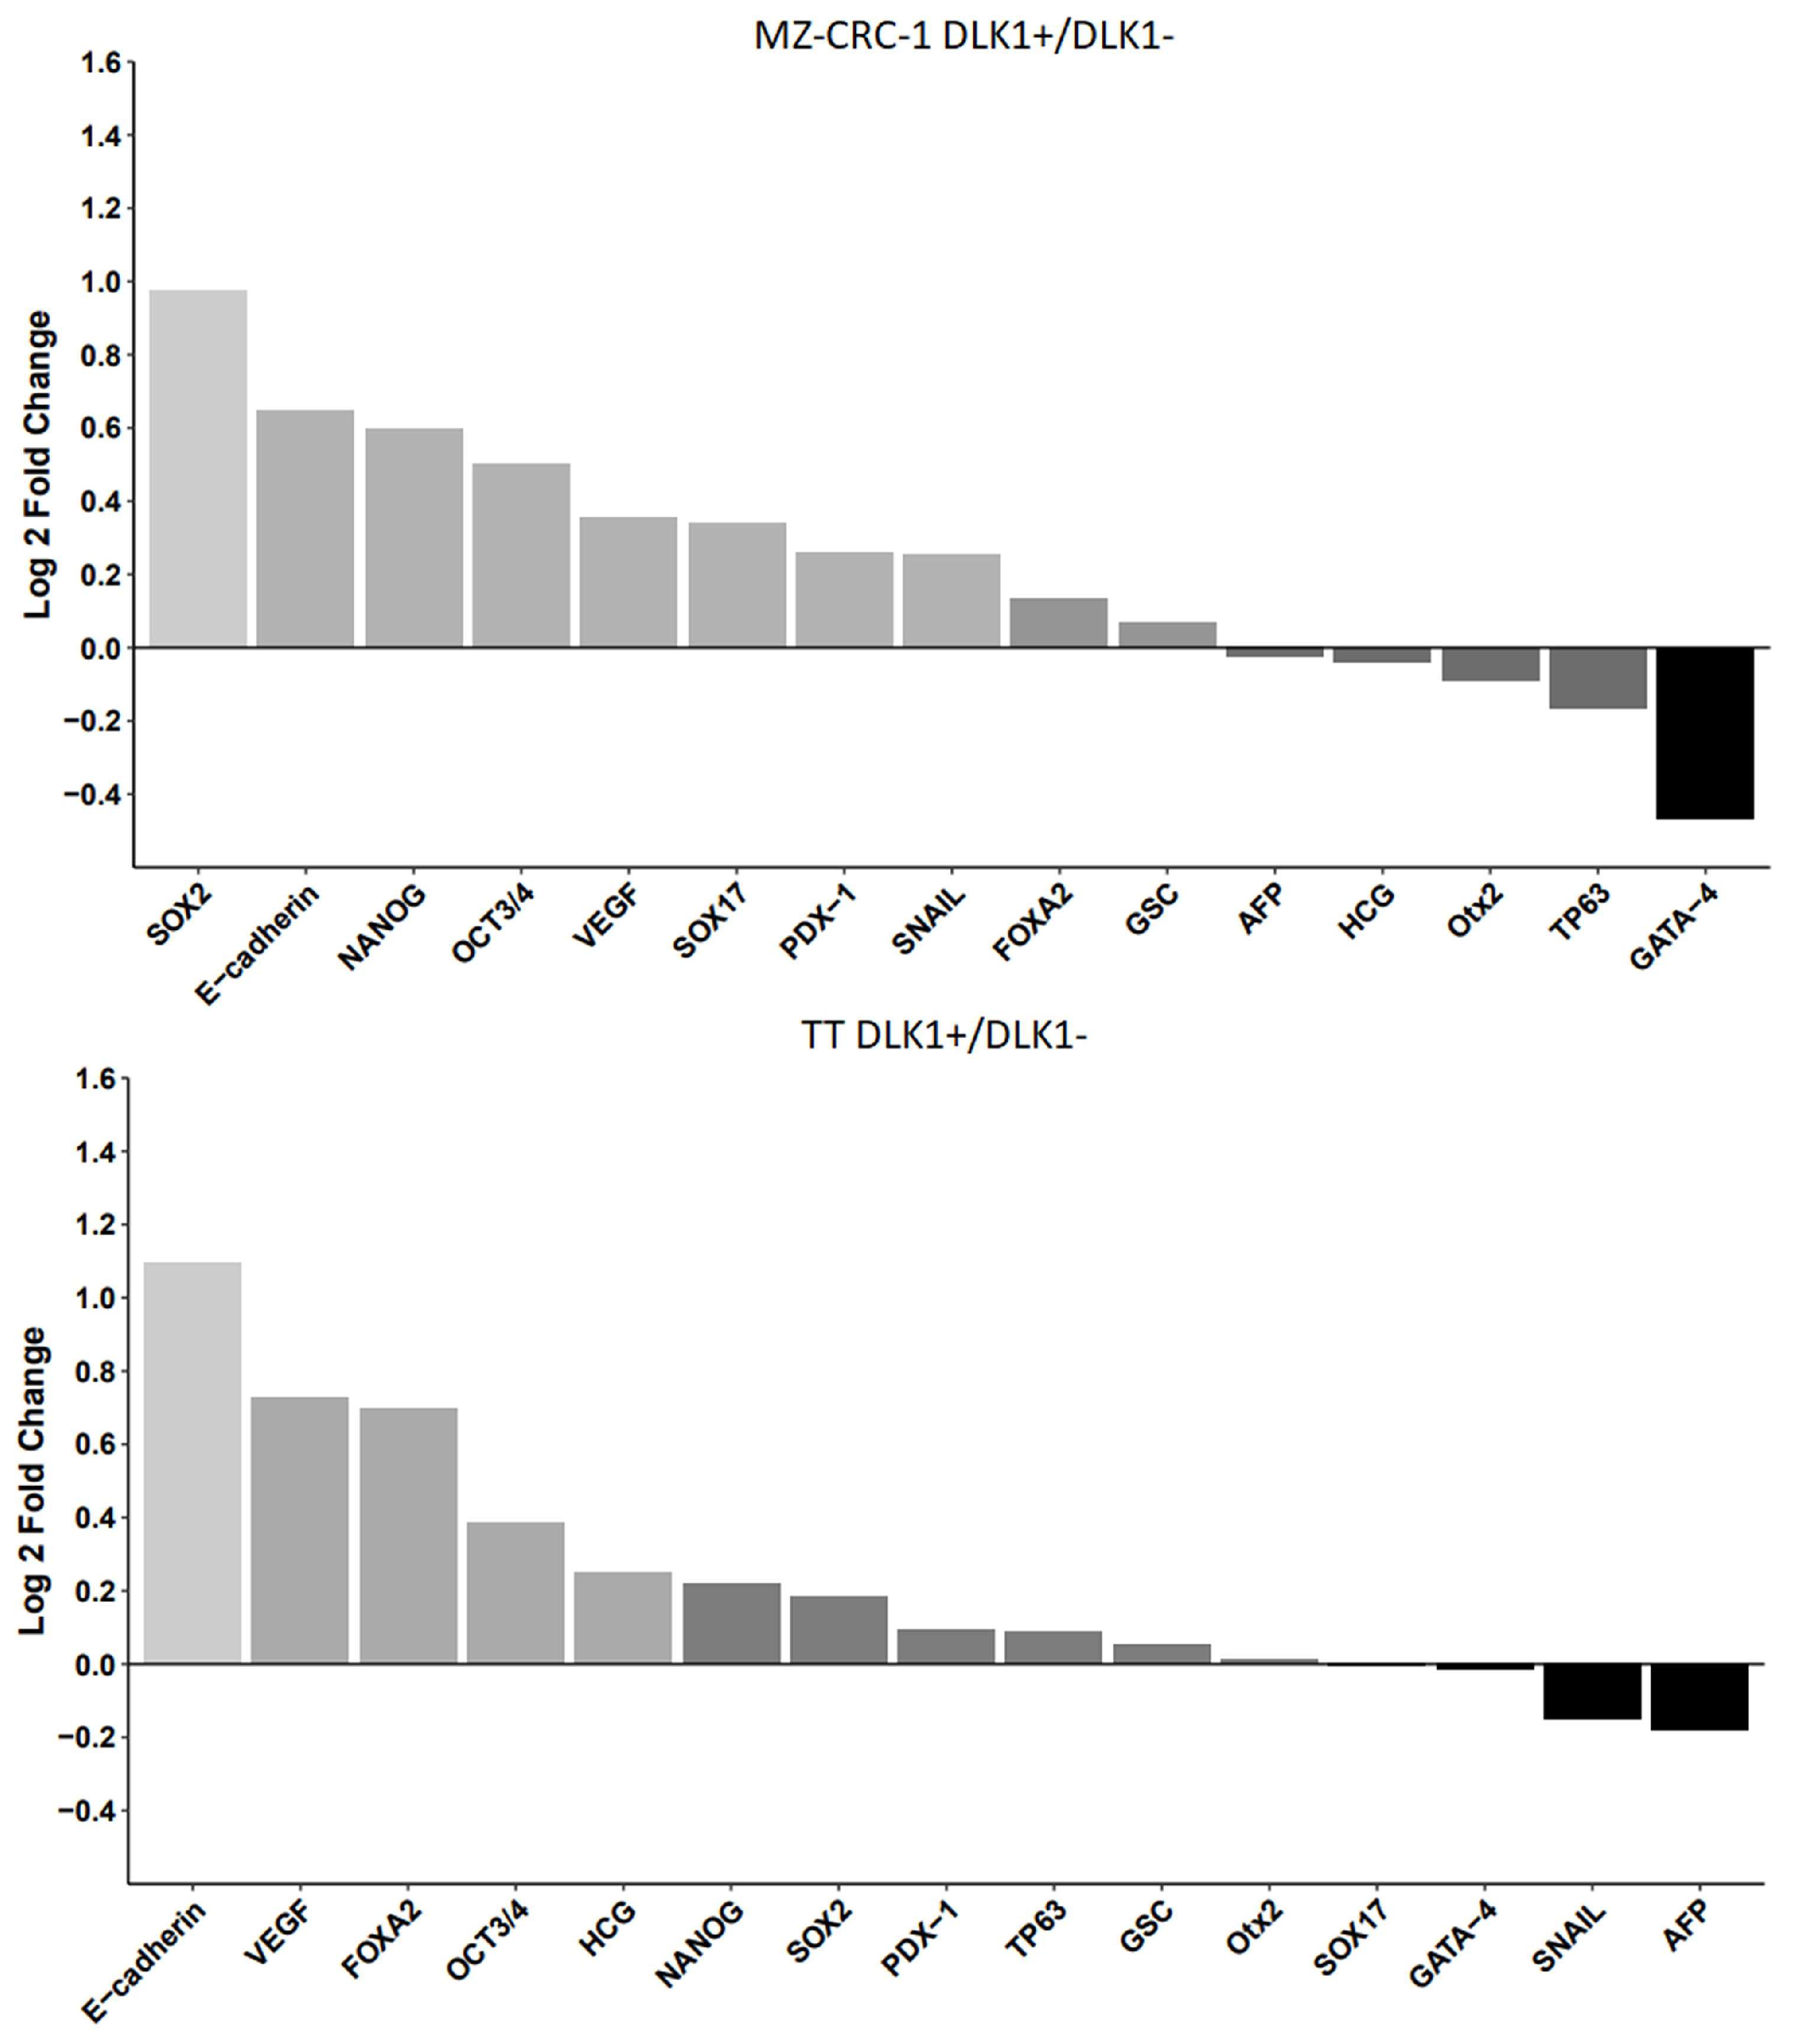
We then evaluated the expression levels of established CSC markers in these isolated cell populations using an antibody-based array (Figure S2). DLK1+ subpopulations from both cell lines displayed heightened expression levels of pluripotency markers, such as SOX2, OCT3/4, and NANOG (p< 0.05), underscoring the association of DLK1 with the preservation of the CSC phenotype in MTC cell lines (Table 2 and Figure 6). Furthermore, besides the core transcription factors, other elements contributing to self-renewal capacity and pluripotency were also expressed at elevated levels in DLK1+ cells, indicating a link between DLK1 expression and the stem cell phenotype. Few genes showed reduced expression in DLK1+ cells, such as GATA-4 (Figure 6).
To better visualize the differences in expression, the data was log-transformed to maintain proportionality in both positive and negative fold changes. To improve the clarity and accuracy of visualizations, a histogram was generated using RStudio software to compare the relative expression levels between DLK1+ and DLK1- cells in both cell lines (Figure 7).

3. Discussion

Although MTC is less prevalent compared to differentiated thyroid carcinomas, its prognosis is usually worse. Approximately 50% of patients experience involvement of cervical lymph node metastasis, while about 30% develop distant metastasis, affecting organs such as the liver, lungs, bones, and occasionally the skin and brain [32].
The primary treatment for MTC involves total thyroidectomy with neck dissection for lymph nodes. Due to their ineligibility for radioactive iodine therapy, patients with progressive disease may undergo radiotherapy or systemic therapy, which encompasses cytotoxic chemotherapy, RET-selective inhibitors, multi-tyrosine kinase inhibitors (TKIs), or immunotherapy [33]. Although response rates vary, systemic chemotherapy typically yields partial or transient responses. Among cytotoxic drugs, doxorubicin, either as a monotherapy or combined with cisplatin, is the most employed in MTC patients [34]. However, cytotoxic chemotherapy, while capable of controlling tumor burden, is not considered the first-line therapy for patients with persistent or recurrent MTC due to its low efficacy. Instead, targeted therapies such as tyrosine kinase inhibitors (e.g., vandetanib, cabozantinib) are typically preferred as first-line options for managing persistent or recurrent MTC in many countries [32,33,34,35,36]. New Selective RET inhibitors (e.g., Selpercatinib or pralsetinib), have revolutionized the treatment of cancer have been approved as treatment option for cancer with RET gene alterations. While targeted therapies have demonstrated superior efficacy and tolerability when compared to conventional chemotherapy in treating MTC, they may not achieve complete eradication of cancer cells. Regrettably, clinical responses for advanced MTC are often partial, and patients may eventually develop resistance to these drugs, leading to disease progression over time. Understanding the mechanisms of resistance is crucial for devising more effective and durable therapeutic strategies [37,38,39,40,41,42].
Emerging evidence suggests that drug resistance in cancers may arise from the survival of cancer cells displaying a stem cell phenotype. Indeed, CSCs have been shown to play a critical role in tumor initiation and progression, as evidenced by their ability to initiate new tumors when injected into animal models. CSCs represent a small fraction of cells within the tumor microenvironment, typically ranging from 0.1% to 30% depending on the tumor type and its stage [43].
These CSCs express canonical markers linked to self-renewal and pluripotency, including core proteins, drug efflux transporters, and surface factors such as CD44 and CD133. Such molecular features significantly contribute to tumor progression and metastasis by enhancing the survival and proliferation of CSCs [20,21,27,44,45,46].
Moreover, CSCs exhibit the unique ability to form multicellular spheroids, potentially enabling their dissemination via bloodstream or lymphatic circulation, thereby facilitating development of distant metastases. This multifaceted role of CSCs underscores their pivotal significance in tumor biology and emphasizes the need for innovative therapeutic strategies targeting cancer progression and metastasis [47,48,49] Consequently, several groups have suggested that CSC markers can be used to predict the prognosis of patients [50,51].
There is evidence that CSC markers can distinguish CSCs from other cancer cells, enabling the identification of circulating CSCs before metastasis formation through liquid biopsy. These markers also hold potential as targets for innovative therapeutic approaches [52,53].
In the field of thyroid research, substantial experimental evidence has provided support to the hypothesis CSCs are central in both the initiation of cancer and the formation of metastases [54,55,56,57,58,59,60,61,62,63]. The upregulation of cell surface markers such as CD44, CD133, and ALDH1A1 has been linked to a poorer prognosis and increased resistance to chemotherapy and radiotherapy in both differentiated (DTC) and undifferentiated thyroid carcinomas (UTC) [21,64,65].
We have previously demonstrated recurrent somatic copy number gain of the region (14q32.2), comprising the gene DLK1, in MTC, which correlates with larger tumor size and advanced tumor stage (III and IV) [26]. Furthermore, our findings, corroborated by others, indicate that the DLK1 gene is frequently overexpressed in MTC [26,66].
DLK1, located on chromosome band 14q32.2 in humans, is an imprinted gene encoding secreted and membrane-bound isoforms. While its expression is widespread in various human tissues during embryonic development, in adults, it is predominantly restricted to (neuro)endocrine tissues and other immature stem/progenitor cells. Notably, DLK1 exhibits elevated expression levels in numerous common malignancies, including liver, breast, brain, pancreas, colon, and lung cancers, as well as endocrine-related cancers such as ovarian tumors and pheochromocytoma. Indeed, DLK1’s elevated expression has been identified in pediatric cancers as well as aggressive and therapy-resistant adult cancers [28,67,68,69,70].
Emerging evidence suggests that drug resistance in cancers may stem from the survival of cancer cells exhibiting a stem cell phenotype, and DLK1 may play a crucial role in regulating and maintaining this phenotype [30,71].
In this study, to assess their stem cell-like properties, we characterized two MTC cell lines for the expression of 15 known stem cell markers. These lines harbor pathogenic variants in the two most common MEN2A and MEN2B-associated codons (p.C634 and p.M918), enabling us to investigate the relationship between these RET variants and the stem cell phenotype. MZ-CRC-1 cells, which carry the pathogenic variant (p.M918T) associated with MEN2B syndrome, exhibited higher expression levels of most canonical markers compared to TT cells, which possess the p.C634W variant linked to MEN2A.
The protein-array analysis revealed that most markers that are fundamental for the initiation and maintenance of pluripotent states were expressed in both cell lines, with MZ-CRC-1 exhibiting higher levels of most markers. This suggests that MZ-CRC-1 possesses a robust stem cell phenotype, characterized not only by the presence of key pluripotency factors such as OCT3/4, SOX2, and NANOG but also by additional markers that may enhance stemness. Validation of the canonical stem cell markers (OCT3/4, SOX2, NANOG) by flow cytometry confirmed their expression in both cell lines and increased expression in MZ-CRC-1 cells.
Subsequent assessment of CD44, CD133, ALDH1, multidrug resistance proteins (MRP1 and MRP3), and DLK1 revealed varied expression patterns. CD133 and MRP proteins were higher in MZ-CRC-1, while CD44 and ALDH1A1 were elevated in TT cells. Notably, DLK1 was specifically identified in MTC cell lines and showed significantly higher expression in MZ-CRC-1 cells compared to TT cells, indicating its potential role as a marker for MTC.
These findings suggest that both cell lines harbor a subpopulation of cells with a CSC phenotype, potentially influencing tumor progression, aggressiveness, and drug resistance. Differences observed in specific markers like CD133 and MRP proteins in MZ-CRC-1 and CD44 in TT cells may be attributed to varying levels of DLK1 isoforms or interactions with signaling proteins such as Notch or RET, potentially influencing cell maintenance and self-renewal as well as treatment resistance.
Notably, MZ-CRC-1 cells exhibited not only increased DLK1 expression but also enhanced spheroid-forming ability compared to TT cells.
Further investigation involved sorting cells into DLK1-positive and negative populations and assessing stem cell marker levels in both groups. The DLK1-positive subpopulation in both cell lines expressed stemness markers, with notably higher expression in MZ-CRC-1 compared TT cells.
While this study uncovers novel insights, it’s acknowledged that further investigations, including gene knockdown experiments and in vivo analyses, are needed to elucidate DLK1’s role comprehensively. We also acknowledge that besides somatic copy number alteration, other mechanisms may exert an influence on DLK1 expression.

4. Materials and Methods

4.1. Cell Culture

This study utilized two RET-driven MTC cell lines: MZ-CRC-1 (harboring p.M918T mutation) and TT (harboring p.C634W mutation). Additionally, four non-MTC carcinoma cell lines were included: B-CPAP (Papillary thyroid carcinoma), XTC.UC1 (oncocytic cell carcinoma), as well as 8505c and KTC-2 (undifferentiated thyroid carcinoma).
The TT cell line was obtained from the ATCC (Cat# CRL-1803), while the MZ-CRC-1 cell line was generously provided by Prof. Barry Nelkin from Johns Hopkins University. The XTC.UC1 cell line was kindly donated by Prof. Ian Ganly from Memorial Sloan Kettering Cancer Center (New York, USA). The B-CPAP (ACC 273) and 8505c (ACC 219) cell lines were purchased from DSMZ (Germany). The TT cell line was cultured in F-12K medium supplemented with 10% FBS and 100 U/mL penicillin/streptomycin. The MZ-CRC-1 and XTC.UC1 cell lines were cultured in a 1:1 mixture of DMEM and Ham’s F12, supplemented with 10% FBS and 100 U/mL penicillin/streptomycin. B-CPAP and 8505c cell lines were grown in RPMI-1640 medium supplemented with 10% FBS and 100 U/mL penicillin/streptomycin. The KTC-2 cell line was grown in RPMI-1640 medium supplemented with 5% FBS and 100 U/mL penicillin/streptomycin. All cells were maintained at 37°C in a 5% CO2 humidified atmosphere. To ensure the reliability and authenticity of the thyroid cancer cell lines used in our study, we conducted a panel of short tandem repeat (STR) profiling. This step was essential to mitigate concerns about potential cross-contamination and to maintain the integrity of our experimental results.

4.2. Protein Array Analysis

To explore the expression of known CSC markers in the TT and MZ-CRC-1 cell lines, protein extracts isolated from the cells underwent analysis using the antibody-based human pluripotent stem cell proteomic array (Cat # ARY010; R&D Systems, Minneapolis, MN, USA). This array simultaneously detects 15 established stem cell markers (Table 1 and Figure S2). Approximately 107 TT and MZ-CRC-1 cells were used for protein lysate isolation, and quantification was carried out as previously described [72].
Nitrocellulose membranes, each spotted with 15 different antibodies in duplicate, were incubated with 300 μg of cellular extract for 16 h at 4°C. After two washes, the membranes were incubated with streptavidin-HRP secondary antibody and revealed with a chemiluminescent reagent (R&D Systems). The intensity score of each duplicated spot was analyzed using the ImageQuant LAS4000 Analyzer (GE Healthcare, Chicago, Illinois, USA) and quantified using ImageQuant TL software (GE Healthcare), as described previously [72]. The averaged intensity signal of the duplicate spots was calculated by subtracting the averaged background signal (negative control) from each spot, following the manufacturer’s instructions. Fold changes were then calculated based on the average density values of each protein expressed in the MZ-CRC-1 cells, divided by the average density values obtained in the TT cells.

4.3. Flow Cytometry Analysis

FC analysis was employed for validation, assessing the expression of recognized stem cell markers (OCT3/4, SOX2, NANOG), immunophenotyping cells for the expression of both recognized (ALDH1A1, CD44, and CD133), and a hypothetical (DLK1) stem cell markers in the thyroid, and measuring cell size at the single-cell level. FC was also utilized to measure the expression of multidrug resistance markers, MRP1 and MRP3.
To prepare for FC, cells were fixed with 4% paraformaldehyde, blocked with 5% BSA, and then incubated with the appropriate primary antibodies as detailed in Table S1. Subsequently, cells were incubated with the secondary labeled antibody, goat anti-rabbit IgG-FITC (Thermo Fisher Scientific, Waltham, Massachusetts, USA), and washed in 1X PBS. Two independent experiments were performed, each performed in triplicate. For each flow cytometric analysis, 10.000 events were recorded and analyzed on a BD Accuri C6 flow cytometer with a filter in FL1 (BD Biosciences, Franklin Lakes, New Jersey, USA). The resulting files were exported and analyzed using FlowJo software (Tree Star Inc., Ashland, Oregon, USA).
Negative controls included cells without primary and secondary antibodies, as well as cells incubated solely with the secondary antibody in a blocking buffer. Statistical analyses were based on the median fluorescence intensity (MFI), with results presented as flow cytometry histograms and bar graphs, following the recommendations [73].

4.4. Hoechst 33342 Efflux Assay

To evaluate the cells’ ability to efflux the fluorescent dye Hoechst 33342, approximately 8 x10³ cells per well were cultured in a 96-well plate and exposed to 5 µg/mL of Hoechst 33342 (Thermo Fisher Scientific) for approximately 90 minutes at 37°C. Following the staining period, the cells were washed once with PBS, and the medium was replaced. The plate was then transferred to a SpectraMax Plus M3 microplate reader (Molecular Devices, San José, CA, USA) and the blue fluorescence of Hoechst 33342 was excited at 350 nm, and its fluorescence was measured at 450 nm (Time 0). Subsequently, fluorescence readings were taken at 30, 60, and 90-minute time points (cumulative time points). Two independent experiments were performed in triplicates. Statistical analysis was performed using GraphPad Prism software, and the results were presented graphically to illustrate the efflux kinetics of Hoechst 33342 from the cells over the specified time intervals.

4.6. Generation of Spheroids Cultures

To confirm the ability of MTC cell lines to form multicellular spheroids [74], 2x10⁴ cells were cultured in serum-free medium in 24-well ultra-low attachment plates (Corning, New York, USA). The spheroid formation efficiency (SFE) was monitored using a Nikon Eclipse TE2000 inverted microscope system (Nikon, Melville, New York, USA) equipped with optical system and a TCapture software. Images were captured at 0-, 24-, and 48-h post-seeding. The quantification of spheroids generated by MTC cells was conducted by counting the number and measuring the size of spheroids at specific time points. Two independent experiments were conducted, and each experiment performed in triplicate.

4.7. Western Blot Analysis

Cell homogenates were prepared from 2 medullary and four non-medullary thyroid cell lines and incubated on ice in radio-immunoprecipitation (RIPA) buffer supplemented with protease and phosphatase inhibitor cocktails (Merck, New Jersey, USA). After centrifugation at 14.000 rpm for 10 minutes, protein concentration was quantified using the BCA protein assay kit (Pierce Biotechnology, Rockford, Illinois, USA). Fifty micrograms of reduced protein were loaded onto a 10% polyacrylamide gel. The proteins were then transferred onto a nitrocellulose membrane (Bio-Rad, California, USA) and blocked for 1 hour in TBS with 0.1% Tween and 5% nonfat dry milk before probing with primary antibodies against DLK1 (Ab21682, 1:500) and β-actin (4967, Cell Signaling, 1:10,000). Primary antibodies were incubated overnight at 4°C in blocking buffer, followed by washing with TBST (150 mM NaCl, 2.7 mM KCl, 25 mM Tris, 0.1% Tween). The membrane was then incubated with anti-rabbit horseradish peroxidase-conjugated secondary antibodies (Dako, P0448, 1:1.000) for 1 hour at room temperature. Detection was performed using Immobilon Western Chemiluminescent HRP substrate (Millipore, Massachusetts, USA) and visualized with an ImageQuant LAS 4000 imaging system (GE Healthcare).

4.8. Fluorescence-Activated Cell Sorting (FACS)

To isolate a subpopulation of MZ-CRC-1 and TT cells expressing DLK1, approximately 2 x 10⁷ cells/mL were blocked with 2% BSA, followed by incubation with the primary antibody targeting DLK1 for 1 hour. Subsequently, cells were fluorescently labeled with a secondary antibody before being subjected to FACS analysis using the BD FACS Aria II system (BD Bioscience). The DLK1-positive (DLK1+) and DLK1-negative (DLK1-) subpopulations were collected and subjected to protein isolation. Subsequently, the isolated proteins were analyzed using the Proteome Profiler Human Pluripotent Stem Cell array, as aforementioned. The obtained data was analyzed to determine differential protein expression patterns between the DLK1+ and DLK1- subpopulations.

4.9. Statistical Analysis

Protein array analysis involved calculating fold changes based on average density values of each protein expressed in MZ-CRC-1 cells divided by those in TT cells. Flow cytometry utilized the MFI from 10,000 events, analyzed with an unpaired t-test. The Hoechst 33342 assay was conducted in two independent experiments, each performed in triplicate, and analyzed using a t-test. Spheroid formation was quantified by counting and measuring spheroid number and size using TCapture software, with statistical analysis performed using a t-test in GraphPad Prism software. Relative expression levels between DLK1+ and DLK1- cells in both cell lines were compared after log-transforming the data (Log2) to enhance normality, maintain proportionality in fold changes (both positive and negative), and improve interpretability. A histogram was generated using RStudio software to visualize these comparisons.

5. Conclusions

Our study reveals the characteristics of cancer stem cell subpopulations within medullary thyroid carcinoma (MTC) cell lines, highlighting the potential role of DLK1 in promoting the stemness phenotype. These findings enhance our understanding of the underlying mechanisms in MTC and underscore the importance of targeting cancer stem cell populations to develop more effective therapeutic strategies.

Supplementary Materials

The following supporting information can be downloaded at the website of this paper posted on Preprints.org, Figure S1: Spheroid size in MTC cells is at 48h after plating. Figure S2: Human Pluripotent Stem Cell Array Coordinates. Table S1: List of antibodies used in flow cytometry

Author Contributions

DDS: writing-original draft, methodology, conceptualization, validation, and formal analysis. RPA: conceptualization, methodology, supervision, formal analysis and writing-review and editing. MRB and WGR: methodology, validation, and writing-review. RMBM: Funding acquisition and writing- review and editing. JMC, conceptualization, supervision, funding acquisition, project administration and writing- review and editing. All authors have read and agreed to the published version of the manuscript.

Funding

This research was funded by research grants (2022/09713-9 and 2021/02752-6) from the São Paulo State Research Foundation (FAPESP). DDS acknowledges support as a CAPES scholar (grant 88882.430339/2019-01). MRB and WGR received scholarship from FAPESP (2023/16471-4 and 2022/16827-0). JMC and RMBM are investigators of the Brazilian Research Council (CNPq) (Grants 305690/2022-1 and 308338/2020-0).

Data Availability Statement

The datasets generated during the current study are available from the corresponding author upon reasonable request.

Conflicts of Interest

The authors declare that no conflict of interest could be perceived as prejudicing the impartiality of the research reported.

References

  1. American Thyroid Association Guidelines Task Force; Kloos RT, Eng C, Evans DB, Francis GL, Gagel RF, Gharib H, Moley JF, Pacini F, Ringel MD, Schlumberger M, Wells SA Jr. Medullary thyroid cancer: management guidelines of the American Thyroid Association. Thyroid. 2009 Jun;19(6):565-612. Erratum in: Thyroid. 2009 Nov;19(11):1295. [CrossRef] [PubMed]
  2. Wells SA Jr, Asa SL, Dralle H, Elisei R, Evans DB, Gagel RF, Lee N, Machens A, Moley JF, Pacini F, Raue F, Frank-Raue K, Robinson B, Rosenthal MS, Santoro M, Schlumberger M, Shah M, Waguespack SG; American Thyroid Association Guidelines Task Force on Medullary Thyroid Carcinoma. Revised American Thyroid Association guidelines for the management of medullary thyroid carcinoma. Thyroid. 2015 Jun;25(6):567-610. [CrossRef] [PubMed]
  3. Cerutti JM, Maciel RM. An unusual genotype-phenotype correlation in MEN 2 patients: should screening for RET double germline mutations be performed to avoid misleading diagnosis and treatment? Clin Endocrinol (Oxf). 2013 Oct;79(4):591-2. Epub 2013 May 11. [CrossRef] [PubMed]
  4. Araujo AN, Moraes L, França MI, Hakonarson H, Li J, Pellegrino R, Maciel RM, Cerutti JM. Genome-wide copy number analysis in a family with p.G533C RET mutation and medullary thyroid carcinoma identified regions potentially associated with a higher predisposition to lymph node metastasis. J Clin Endocrinol Metab. 2014 Jun;99(6):E1104-12. Epub 2014 Mar 6. [CrossRef] [PubMed]
  5. Signorini PS, França MI, Camacho CP, Lindsey SC, Valente FO, Kasamatsu TS, Machado AL, Salim CP, Delcelo R, Hoff AO, Cerutti JM, Dias-da-Silva MR, Maciel RM. A ten-year clinical update of a large RET p.Gly533Cys kindred with medullary thyroid carcinoma emphasizes the need for an individualized assessment of affected relatives. Clin Endocrinol (Oxf). 2014 Feb;80(2):235-45. Epub 2013 Jun 28. [CrossRef] [PubMed]
  6. Ceolin L, Duval MADS, Benini AF, Ferreira CV, Maia AL. Medullary thyroid carcinoma beyond surgery: advances, challenges, and perspectives. Endocr Relat Cancer. 2019 Aug 1;26(9):R499-R518. [CrossRef] [PubMed]
  7. Maciel RMB, Camacho CP, Assumpção LVM, Bufalo NE, Carvalho AL, de Carvalho GA, Castroneves LA, de Castro FM, Ceolin L, Cerutti JM, Corbo R, Ferraz TMBL, Ferreira CV, França MIC, Galvão HCR, Germano-Neto F, Graf H, Jorge AAL, Kunii IS, Lauria MW, Leal VLG, Lindsey SC, Lourenço DM, Maciel LMZ, Magalhães PKR, Martins JRM, Martins-Costa MC, Mazeto GMFS, Impellizzeri AI, Nogueira CR, Palmero EI, Pessoa CHCN, Prada B, Siqueira DR, Sousa MSA, Toledo RA, Valente FOF, Vaisman F, Ward LS, Weber SS, Weiss RV, Yang JH, Dias-da-Silva MR, Hoff AO, Toledo SPA, Maia AL. Genotype and phenotype landscape of MEN2 in 554 medullary thyroid cancer patients: the BrasMEN study. Endocr Connect. 2019 Mar 1;8(3):289-298. [CrossRef] [PubMed]
  8. Moura MM, Cavaco BM, Pinto AE, Leite V. High prevalence of RAS mutations in RET-negative sporadic medullary thyroid carcinomas. J Clin Endocrinol Metab. 2011 May;96(5):E863-8. Epub 2011 Feb 16. [CrossRef] [PubMed]
  9. Agrawal N, Jiao Y, Sausen M, Leary R, Bettegowda C, Roberts NJ, Bhan S, Ho AS, Khan Z, Bishop J, Westra WH, Wood LD, Hruban RH, Tufano RP, Robinson B, Dralle H, Toledo SP, Toledo RA, Morris LG, Ghossein RA, Fagin JA, Chan TA, Velculescu VE, Vogelstein B, Kinzler KW, Papadopoulos N, Nelkin BD, Ball DW. Exomic sequencing of medullary thyroid cancer reveals dominant and mutually exclusive oncogenic mutations in RET and RAS. J Clin Endocrinol Metab. 2013 Feb;98(2):E364-9. Epub 2012 Dec 21. [CrossRef] [PubMed]
  10. Oczko-Wojciechowska M, Czarniecka A, Gawlik T, Jarzab B, Krajewska J. Current status of the prognostic molecular markers in medullary thyroid carcinoma. Endocr Connect. 2020 Dec;9(12):R251-R263. [CrossRef] [PubMed]
  11. Yeh T, Yeung M, Sherman EJ, Tuttle RM, Sabra MM. Structural Doubling Time Predicts Overall Survival in Patients with Medullary Thyroid Cancer in Patients with Rapidly Progressive Metastatic Medullary Thyroid Cancer Treated with Molecular Targeted Therapies. Thyroid. 2020 Aug;30(8):1112-1119. Epub 2020 Apr 20. [CrossRef] [PubMed]
  12. Elisei R, Cosci B, Romei C, Bottici V, Renzini G, Molinaro E, Agate L, Vivaldi A, Faviana P, Basolo F, Miccoli P, Berti P, Pacini F, Pinchera A. Prognostic significance of somatic RET oncogene mutations in sporadic medullary thyroid cancer: a 10-year follow-up study. J Clin Endocrinol Metab. 2008 Mar;93(3):682-7. Epub 2007 Dec 11. [CrossRef] [PubMed]
  13. Moura MM, Cavaco BM, Leite V. RAS proto-oncogene in medullary thyroid carcinoma. Endocr Relat Cancer. 2015 Oct;22(5):R235-52. [CrossRef] [PubMed]
  14. Ciampi R, Romei C, Ramone T, Prete A, Tacito A, Cappagli V, Bottici V, Viola D, Torregrossa L, Ugolini C, Basolo F, Elisei R. Genetic Landscape of Somatic Mutations in a Large Cohort of Sporadic Medullary Thyroid Carcinomas Studied by Next-Generation Targeted Sequencing. iScience. 2019 Oct 25;20:324-336. Epub 2019 Sep 26. [CrossRef] [PubMed]
  15. Kim M, Kim BH. Current Guidelines for Management of Medullary Thyroid Carcinoma. Endocrinol Metab (Seoul). 2021 Jun;36(3):514-524. Epub 2021 Jun 22. [CrossRef] [PubMed]
  16. Pezzani R, Bertazza L, Cavedon E, Censi S, Manso J, Watutantrige-Fernando S, Pennelli G, Galuppini F, Barollo S, Mian C. Novel Prognostic Factors Associated with Cell Cycle Control in Sporadic Medullary Thyroid Cancer Patients. Int J Endocrinol. 2019 Feb 18;2019:9421079. [CrossRef] [PubMed]
  17. Subbiah V, Gouda MA, Iorgulescu JB, Dadu R, Patel K, Sherman S, Cabanillas M, Hu M, Castellanos LE, Amini B, Meric-Bernstam F, Shen T, Wu J. Adaptive Darwinian off-target resistance mechanisms to selective RET inhibition in RET driven cancer. NPJ Precis Oncol. 2024 Mar 4;8(1):62. [CrossRef] [PubMed]
  18. Subbiah V, Shen T, Terzyan SS, Liu X, Hu X, Patel KP, Hu M, Cabanillas M, Behrang A, Meric-Bernstam F, Vo PTT, Mooers BHM, Wu J. Structural basis of acquired resistance to selpercatinib and pralsetinib mediated by non-gatekeeper RET mutations. Ann Oncol. 2021 Feb;32(2):261-268. Epub 2020 Nov 5. [CrossRef] [PubMed]
  19. Maliszewska A, Leandro-Garcia LJ, Castelblanco E, Macià A, de Cubas A, Goméz-López G, Inglada-Pérez L, Álvarez-Escolá C, De la Vega L, Letón R, Gómez-Graña Á, Landa I, Cascón A, Rodríguez-Antona C, Borrego S, Zane M, Schiavi F, Merante-Boschin I, Pelizzo MR, Pisano DG, Opocher G, Matias-Guiu X, Encinas M, Robledo M. Differential gene expression of medullary thyroid carcinoma reveals specific markers associated with genetic conditions. Am J Pathol. 2013 Feb;182(2):350-62. Epub 2012 Nov 28. [CrossRef] [PubMed]
  20. Bi Y, Meng Y, Wu H, Cui Q, Luo Y, Xue X. Expression of the potential cancer stem cell markers CD133 and CD44 in medullary thyroid carcinoma: A ten-year follow-up and prognostic analysis. J Surg Oncol. 2016 Feb;113(2):144-51. Epub 2016 Jan 12. [CrossRef] [PubMed]
  21. Cordero-Barreal A, Caleiras E, López de Maturana E, Monteagudo M, Martínez-Montes ÁM, Letón R, Gil E, Álvarez-Escolá C, Regojo RM, Andía V, Marazuela M, Guadalix S, Calatayud M, Robles-Díaz L, Aguirre M, Cano JM, Díaz JÁ, Saavedra P, Lamas C, Azriel S, Sastre J, Aller J, Leandro-García LJ, Calsina B, Roldán-Romero JM, Santos M, Lanillos J, Cascón A, Rodríguez-Antona C, Robledo M, Montero-Conde C. CD133 Expression in Medullary Thyroid Cancer Cells Identifies Patients with Poor Prognosis. J Clin Endocrinol Metab. 2020 Nov 1;105(11):dgaa527. [CrossRef] [PubMed]
  22. Vargas CVF, Ceolin L, Scheffel RS, Benini AF, Graudenz MS, Maia AL. The tissue expression pattern of CA 19.9 is associated with oncological features in medullary thyroid carcinoma. Endocrine. 2020 Dec;70(3):544-551. Epub 2020 Jun 13. [CrossRef] [PubMed]
  23. Pitoia F, Trimboli P, Abelleira E. Primary resistance to selpercatinib in a patient with advanced medullary thyroid cancer. Endocrine. 2024 May 27. Epub ahead of print. [CrossRef] [PubMed]
  24. Barbet J, Campion L, Kraeber-Bodéré F, Chatal JF; GTE Study Group. Prognostic impact of serum calcitonin and carcinoembryonic antigen doubling-times in patients with medullary thyroid carcinoma. J Clin Endocrinol Metab. 2005 Nov;90(11):6077-84. Epub 2005 Aug 9. [CrossRef] [PubMed]
  25. Williams JF, Zhao M, Najdawi F, Ahmadi S, Hornick JL, Wong KS, Barletta JA. Grading of Medullary Thyroid Carcinoma: an Interobserver Reproducibility Study. Endocr Pathol. 2022 Sep;33(3):371-377. Epub 2022 May 13. [CrossRef] [PubMed]
  26. Araujo AN, Camacho CP, Mendes TB, Lindsey SC, Moraes L, Miyazawa M, Delcelo R, Pellegrino R, Mazzotti DR, Maciel RMB, Cerutti JM. Comprehensive Assessment of Copy Number Alterations Uncovers Recurrent AIFM3 and DLK1 Copy Gain in Medullary Thyroid Carcinoma. Cancers (Basel). 2021 Jan 9;13(2):218. [CrossRef] [PubMed]
  27. Helman LJ, Thiele CJ, Linehan WM, Nelkin BD, Baylin SB, Israel MA. Molecular markers of neuroendocrine development and evidence of environmental regulation. Proc Natl Acad Sci U S A. 1987 Apr;84(8):2336-9. [CrossRef] [PubMed]
  28. Pittaway JFH, Lipsos C, Mariniello K, Guasti L. The role of delta-like non-canonical Notch ligand 1 (DLK1) in cancer. Endocr Relat Cancer. 2021 Oct 15;28(12):R271-R287. [CrossRef] [PubMed]
  29. Kim HS, Ahn SH, Kim HJ, Park JW, Han I. Delta-like Factor 1 as a Possible Therapeutic Target for Sarcomas. Clin Orthop Surg. 2020 Sep;12(3):404-412. Epub 2020 Jun 26. [CrossRef] [PubMed]
  30. Grassi ES, Pietras A. Emerging Roles of DLK1 in the Stem Cell Niche and Cancer Stemness. J Histochem Cytochem. 2022 Jan;70(1):17-28. Epub 2021 Oct 4. [CrossRef] [PubMed]
  31. Nagayama Y, Shimamura M, Mitsutake N. Cancer Stem Cells in the Thyroid. Front Endocrinol (Lausanne). 2016 Feb 29;7:20. [CrossRef] [PubMed]
  32. Hadoux J, Pacini F, Tuttle RM, Schlumberger M. Management of advanced medullary thyroid cancer. Lancet Diabetes Endocrinol. 2016 Jan;4(1):64-71. Epub 2015 Oct 23. [CrossRef] [PubMed]
  33. Angelousi A, Hayes AR, Chatzellis E, Kaltsas GA, Grossman AB. Metastatic medullary thyroid carcinoma: a new way forward. Endocr Relat Cancer. 2022 May 31;29(7):R85-R103. [CrossRef] [PubMed]
  34. Shimaoka K, Schoenfeld DA, DeWys WD, Creech RH, DeConti R. A randomized trial of doxorubicin versus doxorubicin plus cisplatin in patients with advanced thyroid carcinoma. Cancer. 1985 Nov 1;56(9):2155-60. [CrossRef] [PubMed]
  35. Pelizzo MR, Boschin IM, Bernante P, Toniato A, Piotto A, Pagetta C, Nibale O, Rampin L, Muzzio PC, Rubello D. Natural history, diagnosis, treatment and outcome of medullary thyroid cancer: 37 years experience on 157 patients. Eur J Surg Oncol. 2007 May;33(4):493-7. Epub 2006 Nov 27. [CrossRef] [PubMed]
  36. Torresan, F., Armellin, C., & Iacobone, M. (2020). Management of medullary thyroid carcinoma. Annals Of Thyroid, 5. [CrossRef]
  37. Gild ML, Clifton-Bligh RJ, Wirth LJ, Robinson BG. Medullary Thyroid Cancer: Updates and Challenges. Endocr Rev. 2023 Sep 15;44(5):934-946. [CrossRef] [PubMed]
  38. Bruce JY, Bible KC, Chintakuntlawar AV. Emergence of Resistant Clones in Medullary Thyroid Cancer May Not Be Rescued by Subsequent Salvage Highly Selective Rearranged During Transfection-Inhibitor Therapy. Thyroid. 2021 Feb;31(2):332-333. Epub 2020 Aug 4. [CrossRef] [PubMed]
  39. Solomon BJ, Tan L, Lin JJ, Wong SQ, Hollizeck S, Ebata K, Tuch BB, Yoda S, Gainor JF, Sequist LV, Oxnard GR, Gautschi O, Drilon A, Subbiah V, Khoo C, Zhu EY, Nguyen M, Henry D, Condroski KR, Kolakowski GR, Gomez E, Ballard J, Metcalf AT, Blake JF, Dawson SJ, Blosser W, Stancato LF, Brandhuber BJ, Andrews S, Robinson BG, Rothenberg SM. RET Solvent Front Mutations Mediate Acquired Resistance to Selective RET Inhibition in RET-Driven Malignancies. J Thorac Oncol. 2020 Apr;15(4):541-549. Epub 2020 Jan 24. [CrossRef] [PubMed]
  40. Hadoux J, Elisei R, Brose MS, Hoff AO, Robinson BG, Gao M, Jarzab B, Isaev P, Kopeckova K, Wadsley J, Führer D, Keam B, Bardet S, Sherman EJ, Tahara M, Hu MI, Singh R, Lin Y, Soldatenkova V, Wright J, Lin B, Maeda P, Capdevila J, Wirth LJ; LIBRETTO-531 Trial Investigators. Phase 3 Trial of Selpercatinib in Advanced RET-Mutant Medullary Thyroid Cancer. N Engl J Med. 2023 Nov 16;389(20):1851-1861. Epub 2023 Oct 21. [CrossRef] [PubMed]
  41. Kim M, Kim BH. Current Guidelines for Management of Medullary Thyroid Carcinoma. Endocrinol Metab (Seoul). 2021 Jun;36(3):514-524. Epub 2021 Jun 22. [CrossRef] [PubMed]
  42. Guo M, Sun Y, Wei Y, Xu J, Zhang C. Advances in targeted therapy and biomarker research in thyroid cancer. Front Endocrinol (Lausanne). 2024 Mar 4;15:1372553. [CrossRef] [PubMed]
  43. Okafor C, Hogan J, Raygada M, Thomas BJ, Akshintala S, Glod JW, Del Rivero J. Update on Targeted Therapy in Medullary Thyroid Cancer. Front Endocrinol (Lausanne). 2021 Aug 19;12:708949. [CrossRef] [PubMed]
  44. Adams JM, Strasser A. Is tumor growth sustained by rare cancer stem cells or dominant clones? Cancer Res. 2008 Jun 1;68(11):4018-21. [CrossRef] [PubMed]
  45. Grange C, Tapparo M, Collino F, Vitillo L, Damasco C, Deregibus MC, Tetta C, Bussolati B, Camussi G. Microvesicles released from human renal cancer stem cells stimulate angiogenesis and formation of lung premetastatic niche. Cancer Res. 2011 Aug 1;71(15):5346-56. Epub 2011 Jun 13. [CrossRef] [PubMed]
  46. Vinogradov S, Wei X. Cancer stem cells and drug resistance: the potential of nanomedicine. Nanomedicine (Lond). 2012 Apr;7(4):597-615. [CrossRef] [PubMed]
  47. Mai Y, Su J, Yang C, Xia C, Fu L. The strategies to cure cancer patients by eradicating cancer stem-like cells. Mol Cancer. 2023 Oct 18;22(1):171. [CrossRef] [PubMed]
  48. Kulesza J, Paluszkiewicz E, Augustin E. Cellular Effects of Selected Unsymmetrical Bisacridines on the Multicellular Tumor Spheroids of HCT116 Colon and A549 Lung Cancer Cells in Comparison to Monolayer Cultures. Int J Mol Sci. 2023 Oct 30;24(21):15780. [CrossRef] [PubMed]
  49. Gheytanchi E, Naseri M, Karimi-Busheri F, Atyabi F, Mirsharif ES, Bozorgmehr M, Ghods R, Madjd Z. Morphological and molecular characteristics of spheroid formation in HT-29 and Caco-2 colorectal cancer cell lines. Cancer Cell Int. 2021 Apr 13;21(1):204. [CrossRef] [PubMed]
  50. Lytle NK, Barber AG, Reya T. Stem cell fate in cancer growth, progression and therapy resistance. Nat Rev Cancer. 2018 Nov;18(11):669-680. [CrossRef] [PubMed]
  51. Huang JL, Oshi M, Endo I, Takabe K. Clinical relevance of stem cell surface markers CD133, CD24, and CD44 in colorectal cancer. Am J Cancer Res. 2021 Oct 15;11(10):5141-5154. [PubMed]
  52. Sun S, Yang Q, Jiang D, Zhang Y. Nanobiotechnology augmented cancer stem cell guided management of cancer: liquid-biopsy, imaging, and treatment. J Nanobiotechnology. 2024 Apr 12;22(1):176. [CrossRef] [PubMed]
  53. Lone SN, Nisar S, Masoodi T, Singh M, Rizwan A, Hashem S, El-Rifai W, Bedognetti D, Batra SK, Haris M, Bhat AA, Macha MA. Liquid biopsy: a step closer to transform diagnosis, prognosis and future of cancer treatments. Mol Cancer. 2022 Mar 18;21(1):79. [CrossRef] [PubMed]
  54. Zito G, Richiusa P, Bommarito A, Carissimi E, Russo L, Coppola A, Zerilli M, Rodolico V, Criscimanna A, Amato M, Pizzolanti G, Galluzzo A, Giordano C. In vitro identification and characterization of CD133(pos) cancer stem-like cells in anaplastic thyroid carcinoma cell lines. PLoS One. 2008;3(10):e3544. Epub 2008 Oct 28. [CrossRef] [PubMed]
  55. Todaro M, Iovino F, Eterno V, Cammareri P, Gambara G, Espina V, Gulotta G, Dieli F, Giordano S, De Maria R, Stassi G. Tumorigenic and metastatic activity of human thyroid cancer stem cells. Cancer Res. 2010 Nov 1;70(21):8874-85Epub 2010 Oct 19. [CrossRef] [PubMed]
  56. Hardin H, Montemayor-Garcia C, Lloyd RV. Thyroid cancer stem-like cells and epithelial-mesenchymal transition in thyroid cancers. Hum Pathol. 2013 Sep;44(9):1707-13. Epub 2013 Mar 22. [CrossRef] [PubMed]
  57. Yasui K, Shimamura M, Mitsutake N, Nagayama Y. SNAIL induces epithelial-to-mesenchymal transition and cancer stem cell-like properties in aldehyde dehydroghenase-negative thyroid cancer cells. Thyroid. 2013 Aug;23(8):989-96. Epub 2013 Jul 20. [CrossRef] [PubMed]
  58. Ahn SH, Henderson YC, Williams MD, Lai SY, Clayman GL. Detection of thyroid cancer stem cells in papillary thyroid carcinoma. J Clin Endocrinol Metab. 2014 Feb;99(2):536-44. Epub 2013 Dec 3. [CrossRef] [PubMed]
  59. Shimamura M, Nagayama Y, Matsuse M, Yamashita S, Mitsutake N. Analysis of multiple markers for cancer stem-like cells in human thyroid carcinoma cell lines. Endocr J. 2014;61(5):481-90. Epub 2014 Feb 15. [CrossRef] [PubMed]
  60. Gianì F, Vella V, Nicolosi ML, Fierabracci A, Lotta S, Malaguarnera R, Belfiore A, Vigneri R, Frasca F. Thyrospheres From Normal or Malignant Thyroid Tissue Have Different Biological, Functional, and Genetic Features. J Clin Endocrinol Metab. 2015 Sep;100(9):E1168-78. Epub 2015 Jul 7. [CrossRef] [PubMed]
  61. Zane M, Scavo E, Catalano V, Bonanno M, Todaro M, De Maria R, Stassi G. Normal vs cancer thyroid stem cells: the road to transformation. Oncogene. 2016 Feb 18;35(7):805-15. Epub 2015 May 11. [CrossRef] [PubMed]
  62. Takano, T. Fetal cell carcinogenesis of the thyroid: a modified theory based on recent evidence. Endocr J. 2014;61(4):311-20. Epub 2014 Jan 22. [CrossRef] [PubMed]
  63. Hardin H, Zhang R, Helein H, Buehler D, Guo Z, Lloyd RV. The evolving concept of cancer stem-like cells in thyroid cancer and other solid tumors. Lab Invest. 2017 Oct;97(10):1142-1151. Epub 2017 Apr 10. [CrossRef] [PubMed]
  64. Lloyd RV, Hardin H, Montemayor-Garcia C, Rotondo F, Syro LV, Horvath E, Kovacs K. Stem cells and cancer stem-like cells in endocrine tissues. Endocr Pathol. 2013 Mar;24(1):1-10. [CrossRef] [PubMed]
  65. Kucerova L, Feketeova L, Kozovska Z, Poturnajova M, Matuskova M, Nencka R, Babal P. In vivo 5FU-exposed human medullary thyroid carcinoma cells contain a chemoresistant CD133+ tumor-initiating cell subset. Thyroid. 2014 Mar;24(3):520-32. Epub 2013 Dec 13. [CrossRef] [PubMed]
  66. Turányi E, Dezso K, Paku S, Nagy P. DLK is a novel immunohistochemical marker for adrenal gland tumors. Virchows Arch. 2009 Sep;455(3):295-9. Epub 2009 Aug 14. [CrossRef] [PubMed]
  67. van Limpt V, Chan A, Caron H, Sluis PV, Boon K, Hermus MC, Versteeg R. SAGE analysis of neuroblastoma reveals a high expression of the human homologue of the Drosophila Delta gene. Med Pediatr Oncol. 2000 Dec;35(6):554-8. [CrossRef] [PubMed]
  68. Yin D, Xie D, Sakajiri S, Miller CW, Zhu H, Popoviciu ML, Said JW, Black KL, Koeffler HP. DLK1: increased expression in gliomas and associated with oncogenic activities. Oncogene. 2006 Mar 23;25(13):1852-61. [CrossRef] [PubMed]
  69. López-Terrada D, Gunaratne PH, Adesina AM, Pulliam J, Hoang DM, Nguyen Y, Mistretta TA, Margolin J, Finegold MJ. Histologic subtypes of hepatoblastoma are characterized by differential canonical Wnt and Notch pathway activation in DLK+ precursors. Hum Pathol. 2009 Jun;40(6):783-94. Epub 2009 Feb 5. [CrossRef] [PubMed]
  70. Grassi ES, Jeannot P, Pantazopoulou V, Berg TJ, Pietras A. Niche-derived soluble DLK1 promotes glioma growth. Neoplasia. 2020 Dec;22(12):689-701. Epub 2020 Oct 23. [CrossRef] [PubMed]
  71. Grassi ES, Pantazopoulou V, Pietras A. Hypoxia-induced release, nuclear translocation, and signaling activity of a DLK1 intracellular fragment in glioma. Oncogene. 2020 May;39(20):4028-4044. Epub 2020 Mar 24. [CrossRef] [PubMed]
  72. Moraes L, Zanchin NIT, Cerutti JM. ABI3, a component of the WAVE2 complex, is potentially regulated by PI3K/AKT pathway. Oncotarget. 2017 Jun 29;8(40):67769-67781. [CrossRef] [PubMed]
  73. Xu B, Fuchs TL, Ahmadi S, et al. International Medullary Thyroid Carcinoma Grading System: A Validated Grading System for Medullary Thyroid Carcinoma. Journal of Clinical Oncology : Official Journal of the American Society of Clinical Oncology. 2022 Jan;40(1):96-104. [CrossRef] [PubMed]
  74. Zhu W, Hai T, Ye L, Cote GJ. Medullary thyroid carcinoma cell lines contain a self-renewing CD133+ population that is dependent on ret proto-oncogene activity. J Clin Endocrinol Metab. 2010 Jan;95(1):439-44. Epub 2009 Nov 6. [CrossRef] [PubMed]
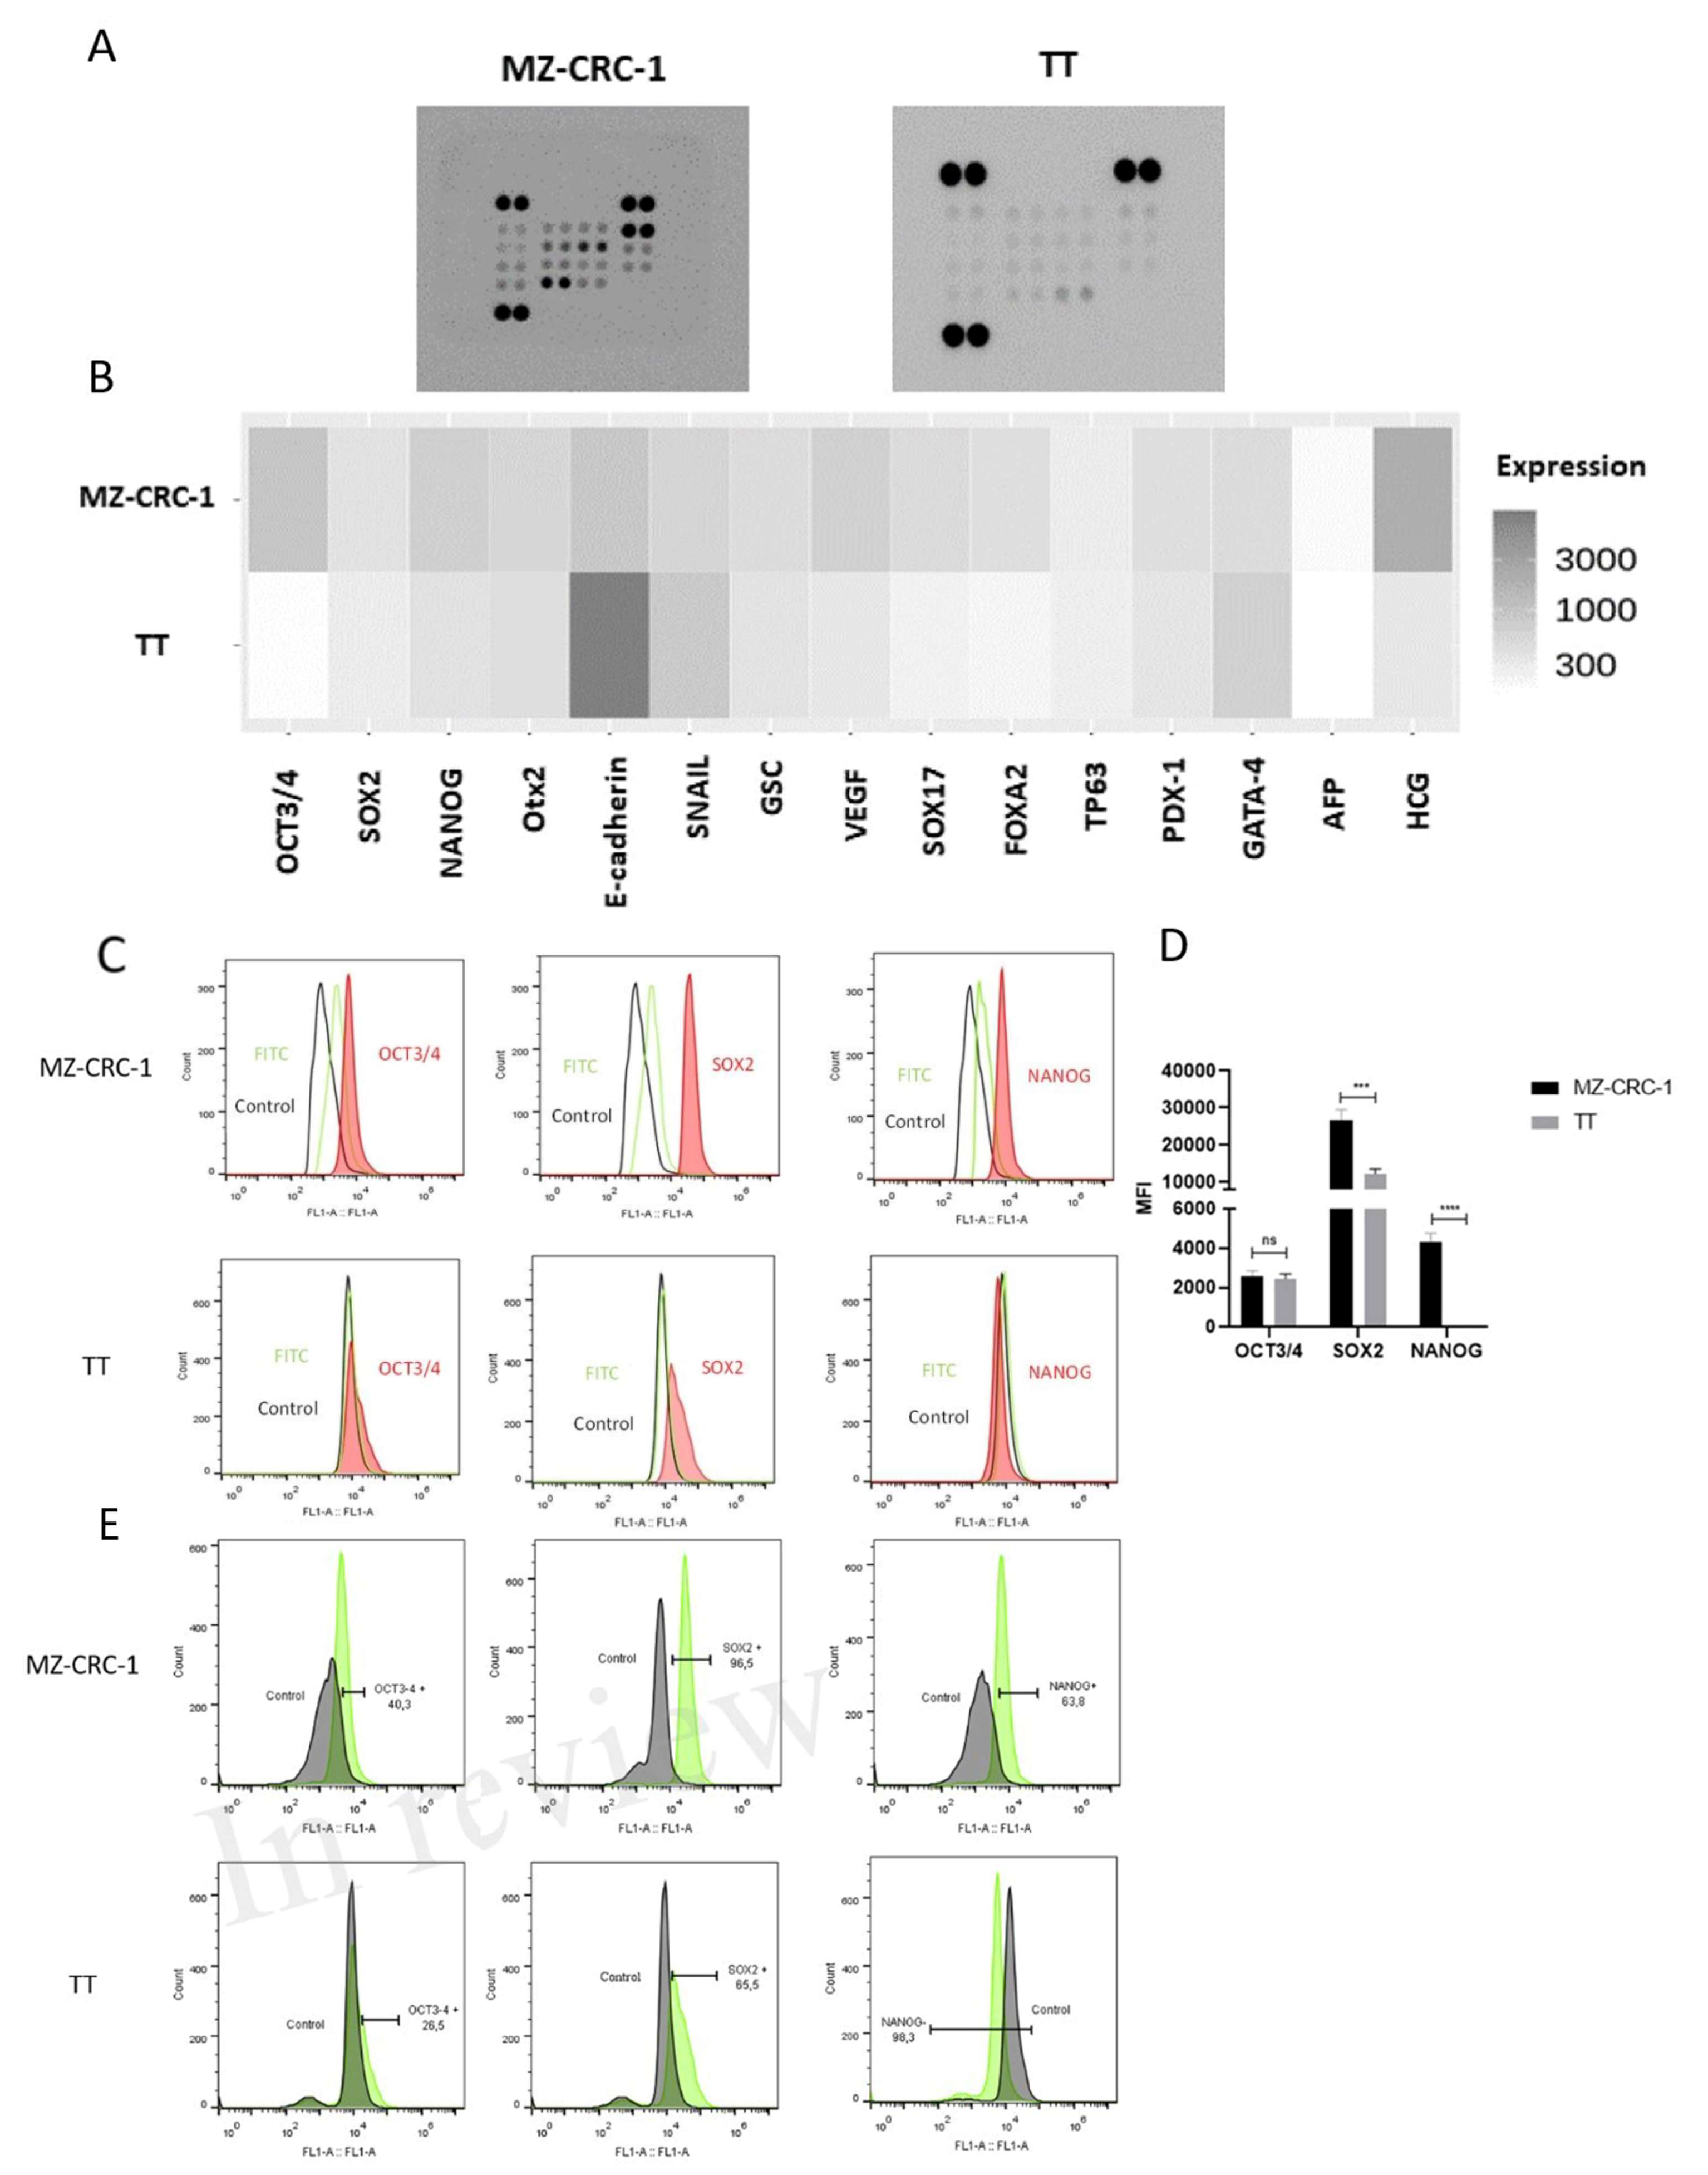
Figure 1. The figure provides a comprehensive analysis of stem cell markers in medullary thyroid carcinoma (MTC) cell lines. (A) shows results from antibody array membrane analysis, while (B) displays a heatmap illustrating the differential expression of 15 analysed proteins. Notably, the MZ-CRC-1 cell line, characterized by the RET p.M918T variant, shows elevated expression of most proteins associated with the stem cell phenotype compared to the TT cell line, characterized by the RET p.C634W variant. (C) (F was employed to assess the expression of recognized stem cell markers (OCT3/4, SOX2, NANOG) in MZ-CRC-1 and TT cell lines. Representative histograms illustrate the red peak indicating target protein expression, distinctly separated from the green peak (secondary antibody) and black peak (negative control). (D) For FC analysis, two independent experiments were conducted in triplicate. About 10,000 events were recorded and reported as median fluorescence intensity (MFI). (E) FC indicates that the percentage of MZ-CRC-1 and TT cells positive for OCT3/4 (40.3%, 26.5%), SOX2 (96.5%, 60.5%), and NANOG (63.8%, 1.7%), respectively. Statistical significance was determined using unpaired t-tests and denoted as follows: >0.05 (ns), *** p ≤ 0.001, and **** p ≤ 0.000.1.
Preprints 120490 g001
Figure 2. The figure describes FC analysis of ALDH1A1, CD44, CD133, MRP1, and MRP3. (A) Shows representative histograms of ALDH1A1, CD44, and CD133 expression, with the red peak indicating target protein expression. This distinct shift separates it from the secondary antibody signal (green peak) and the negative control (black peak). For FC analysis, two independent experiments were conducted in triplicate. About 10.000 events were recorded and reported as median fluorescence intensity (MFI). (B) Shows the percentage of MZ-CRC-1 and TT cells positive for ALDH1A1 (52.1%, 93%), CD44 (47.6%, 48.8%), and CD133 (18.2%, 1%), respectively. Statistical significance was determined using unpaired t-tests and denoted as follows: ** p ≤ 0.01, *** p ≤ 0.001, and **** p ≤ 0.0001.
Preprints 120490 g002
Figure 3. (A) Representative Western blot results showing DLK1 expression in TT (line 1) and MZ-CRC-1 cells (line 2) and BCPAP, XTC.UC1, KTC2, and 8505 cells (lines 1-6). β-actin was used as a loading control. (B) Representative histograms from FC analysis depict DLK1 expression in MZ-CRC-1 and TT cells. The red peak in the histograms indicates DLK1 protein expression, clearly distinguishable from the secondary antibody signal (green peak) and the negative control (black peak). (C) Illustrates the proportion of cells expressing DLK1 in MZ-CRC-1 (37%) and TT cells (34,5%). (D) FC analyses was performed in triplicate across two independent experiments and reported median fluorescence intensity (MFI). Statistical significance was assessed using unpaired t-tests and is denoted as >0.05 (ns).
Preprints 120490 g003
Figure 4. The figure discribed FC analysis of MRP1 and MRP3 and spheroid formation in MTC cells. (A) Representative histograms of FC analysis illustrate the red peak indicating target protein expression, distinctly separated from the green peak (secondary antibody) and black peak (negative control). FC analyses was performed in triplicate across two independent experiments and reported median fluorescence intensity (MFI).(B) Illustrates the concentration of Hoechst 33342 dye in cell supernatant at specified time points. Two independent experiments were conducted in triplicate. (C) Displays representative photographs of spheroid formation in MTC cells taken at distinct time points (24h and 48h after plating). (D) Two independent experiments were conducted in triplicate. The total numbers of multicellular spheroids at each time point are graphically represented. Statistical significance was assessed using an unpaired t-test (**** p < 0.000).
Preprints 120490 g004
Figure 5. The figure illustrates the cell size (FSC) and granularity (SSC) of MZ-CRC-1 and TT cell lines sorted by DLK1 expression, either positive (DLK1+) or negative (DLK1-). The bar chart presents the mean cell size of each populations highlighting that the DLK1+ subpopulation (P2) exhibits significantly smaller size compared to DLK1- subpopulation (P3) (** p ≤ 0.01, ***p<0.001). .
Preprints 120490 g005
Figure 6. (A) presents results from an antibody array membrane analysis comparing DLK1-positive (DLK1+) and DLK1-negative (DLK1-) subpopulations from the MZ-CRC-1 and TT cell lines. (B) displays a heatmap illustrating the differential expression of 15 analysed proteins between the DLK1+ and DLK1- subpopulations (see Table 2).
Preprints 120490 g006
Figure 7. This figure presents the analysis of stem cell markers in DLK1-positive (DLK1+) compared to DLK1-negative (DLK1-) subpopulations in both MZ-CRC-1 (A) and TT (B) cell lines. The data presented in Table 2 were log-transformed, and a histogram was generated using RStudio software to compare the relative expression levels between DLK1+ and DLK1- cells in both cell lines. The bar chart depicts the fold change (log2) on the y-axis, highlighting 15 stemness markers. Proteins significantly upregulated in the DLK1+ subpopulation are represented in light gray, while those showing downregulation are depicted in darker gray or black for each cell line.
Preprints 120490 g007
Table 1. Expression of Stem Cell Markers in Medullary Thyroid Carcinoma cell lines.
Protein Average intensity in TT cells Average intensity in MZ-CRC-1 cells Fold Change* P-value
OCT3/4 173 941 5.439306 0,009
SOX2 283 389 1.374558 0.0428
NANOG 398 786 1.974874 0.031
OTX2 452 570 1.261062 0.0423
E-Cadherin 7956 893 0.112242 0.0017
Snail 846 589 0.696217 0.0059
GSC 430 479 1.113953 NS
VEGF 339 662 1.952802 0.0139
SOX17 249 492 1.975904 0.0282
FOXA2 218 435 1.995413 NS
TP63 272 341 1.253676 NS
PDX-1 359 434 1.208914 0.0247
GATA-4 660 469 0.710606 NS
AFP 163 192 1.177914 NS
HCG 335 2048 6.113433 0.0035
* The fold change was calculated based on the average density value of each protein expressed in MZ-CRC-1 divided by the average density values of TT cells. NS, not significant.
Table 2. Expression of Stem Cell Markers in Medullary Thyroid Carcinoma Cell Lines Stratified by DLK1 Status.
Protein Average intensity in TT DLK1- cells Average
intensity in TT DLK1+ cells
P-value Average intensity in MZ-CRC-1
DLK1- cells
Average intensity
in MZ-CRC-1 DLK1+ cells
P-value
OCT-3/4 528 689 0.0255 544 771 0.0041
NANOG 628 731 0.0119 569 859 0.0042
SOX2 563 639 0.0241 440 864 0.013
OTX2 810 818 NS 995 936 NS
E-cadherin 1495 3194 0.038 985 1544 0.011
Snail 781 703 NS 708 844 0.0091
GSC 669 695 NS 884 926 NS
VEGF 699 1156 0.0033 783 1002 NS
SOX17 703 700 NS 716 907 NS
FOXA2 803 1302 0.0245 856 941 NS
TP63 650 691 NS 887 792 NS
PDX-1 618 660 NS 679 811 NS
GATA-4 1511 1495 NS 2192 1587 0.0105
AFP 603 533 NS 619 608 NS
HCG 757 901 NS 988 962 NS
NS, not significant. .
Disclaimer/Publisher’s Note: The statements, opinions and data contained in all publications are solely those of the individual author(s) and contributor(s) and not of MDPI and/or the editor(s). MDPI and/or the editor(s) disclaim responsibility for any injury to people or property resulting from any ideas, methods, instructions or products referred to in the content.
Copyright: This open access article is published under a Creative Commons CC BY 4.0 license, which permit the free download, distribution, and reuse, provided that the author and preprint are cited in any reuse.
Prerpints.org logo

Preprints.org is a free preprint server supported by MDPI in Basel, Switzerland.

Subscribe

© 2024 MDPI (Basel, Switzerland) unless otherwise stated