
Submitted:
08 October 2024
Posted:
08 October 2024
You are already at the latest version
Abstract
Background/Objectives: This study aimed to evaluate the impact of image enhancement techniques on the interobserver reliability of tear breakup time (TBUT), tear meniscus height (TMH), corneal fluorescein staining (CFS) scoring, and conjunctivochalasis detection using the Smart Eye Camera (SEC), a portable device for anterior segment examination. Methods: A retrospective analysis was conducted on video recordings captured by SEC from 46 patients with dry eye disease (DED). Three video sets were created: unenhanced (G0), mildly enhanced (G3), and strongly enhanced (G7). Three observers—two DED specialists and one general ophthalmologist—assessed TBUT, TMH, CFS scores, and conjunctivochalasis. Interobserver reliability was evaluated using intraclass correlation coefficients (ICCs) for each image set. Results: Interobserver reliability for CFS scores significantly improved with G3, yielding an ICC of 0.8413. In contrast, G7 improved reliability for TBUT measurements (ICC = 0.7381) but led to a notable decrease in reliability for both CFS scoring (ICC = 0.2259) and conjunctivochalasis detection (ICC = 0.0786). Furthermore, the assessment of TMH demonstrated a progressive decline in accuracy with increasing levels of image enhancement. Conclusions: Image enhancement using SEC improves diagnostic consistency between dry eye specialists and general ophthalmologists, especially for TBUT and CFS assessments. However, excessive enhancement may obscure key diagnostic features, indicating the need for careful optimization of image processing techniques depending on the diagnostic focus.
Keywords:
dry eye disease
; smart eye camera
; tear meniscus height
; conjunctivochalasis
; interobserver reliability
; image enhancement
1. Introduction
Dry eye disease (DED) is a multifactorial disease characterized by unstable tear film causing a variety of symptoms and/or visual impairment, potentially accompanied by ocular surface damage[1]. Contributing factors include age, female gender, the use of certain medications, underlying medical conditions, refractive surgery, and hormonal imbalances[2]. Environmental influences such as hot, dry weather and outdoor occupations may also play a role[3]. DED can have a significant impact on quality of life, visual performance, and general health[2]. The economic costs are considerable, with healthcare expenditures for DED patients in Japan estimated at $323 annually, and productivity losses ranging from $741 to $6160 per year[4]. Objective methods for evaluating DED include the tear breakup time (TBUT) test, which measures tear film stability, and fluorescein staining, used to assess corneal and conjunctival damage. Subjective symptoms can be evaluated using the Ocular Surface Disease Index (OSDI) questionnaire[5,6]. The Asia Dry Eye Society highlights the essential role of TBUT assessment, in which fluorescein is employed[1].
To evaluate TBUT and other anterior segment abnormalities caused by dry DED, examination using a slit-lamp biomicroscope is typically required[1]. However, conventional slit lamps are costly and require trained professionals for operation, limiting their use to hospitals or specialized eye clinics. Consequently, they are impractical for deployment in remote or underserved regions. Portable slit lamps offer a more accessible alternative due to their portability; however, their high cost and inability to capture images for documentation remain significant limitations[7]. In response to this limitation, the Smart Eye Camera (SEC), a novel portable device designed for ophthalmological examinations, offers a practical solution[8]. This innovative technology converts a standard smartphone camera into a tool capable of performing basic assessments of the anterior segment, including the ocular surface. SEC is as reliable as the conventional non-portable slit-lamp microscope for evaluating nuclear cataracts, anterior chamber depth evaluation, TBUT, corneal fluorescein staining, and tear meniscus height (TMH)[8,9].
TBUT reliability can be influenced by measurement techniques, observer experience, and assessment methods[10]. The high reliability of interobserver assessment indicates that DED diagnosis using video taken with SEC[11]. The corneal fluorescein staining (CFS) score is commonly employed in the assessment of ocular surface damage[12]. While TMH is a reliable metric for diagnosing DED, the measurement can vary considerably depending on the instrument used, with the SEC demonstrating sufficient validity and reliability in assessing TMH, showing concordance with the conventional slit lamp examination [11]. As previously mentioned, the use of SEC for diagnosing DED has shown results comparable to conventional slit-lamp examination. However, a future challenge will be enabling general ophthalmologists, who do not specialize in cornea, to achieve the same diagnostic accuracy as dry eye specialists. One potential solution is the application of image processing techniques to enhance the clarity of key visual features. In fact, in other fields, various applications of image processing have been reported, as exemplified by the following cases. Color enhancement and achromatization using digital-assisted vitrectomy offer advantages to enhance the visibility of indocyanine green-stained internal limiting membrane for peeling[13]. Texture and color enhancement imaging optimizes the visualization of structure, color tone, and brightness and improves the visibility of gastric tumors allowing their early detection when performing esophagogastroscopy[14,15]. By applying appropriate image processing techniques to the videos captured by the SEC, it may become possible to enhance the visibility of desired features, thereby facilitating a more accurate assessment of the ocular surface condition.
The goal of the present study is to investigate whether applying various image enhancement techniques to SEC video influences the agreement rates between dry eye specialists and a general ophthalmologist, specifically in the measurement of TBUT, the assessment of TMH, and the evaluation of CFS score, as well as the diagnosis of conjunctivochalasis.
2. Materials and Methods
2.1. Study Population
This retrospective, monocentric study was carried out at the Yokohama Keiai Eye Clinic, Japan, between July 2020 and December 2021. This research project received approval from the Institutional Ethics Review Board of the Minamiaoyama Eye Clinic, Tokyo, Japan (IRB No. 202101) and Ethics Review Committee of the Kobanawa Medical Corporation (Committee No. 21000056), ensuring compliance with the ethical standards outlined in the Declaration of Helsinki. Written informed consent was not obtained because the study was retrospective. Patients were recruited from among those attending routine visits at the Yokohama Keiai Eye Clinic. The Japanese version of the OSDI questionnaire was used to measure subjective indicators of DED.
2.2. Inclusion and Exclusion Criteria
To be eligible for this study, the subjects had to meet the inclusion criteria, i.e., exhibit no signs of active ocular inflammation; have no history of ocular diseases or surgeries, except cataract surgery performed at least six months before the study; and be between 18 and 95 years old. This specific age range was chosen to exclude the older population, which is more prone to developing senile ocular surface alterations. Conversely, the exclusion criteria were as follows: use of ocular hypotensive drops, wearing contact lenses, and a confirmed diagnosis of any chronic ocular disease. This careful selection of participants was designed to ensure a homogeneous study population and reliable results.
2.2. Smart Eye Camera
The SEC is a portable device that functions as a slit lamp. This device has received medical device approval in Japan (registration number: 13B2X10198030101), Europe (bearing the “CE” mark), Kenya, Vietnam, Cambodia, and Indonesia. The SEC's main body is constructed from polyamide 12 using 3D printing technology, and it is designed to be mounted on an iPhone 8 (Apple Inc., Cupertino, CA, USA). The video capture resolution is 1080p at 30 frames per second, yielding an output of 2.1 megapixels (2,073,600 pixels) per file[8]. The SEC is equipped with interchangeable lenses, including a convex macro lens (focal length = 20 mm, magnification = ×20) for diffuse illumination, a slit lamp converter with a fixed slit width of 1 mm, and a blue filter. The slit illumination is achieved using a cylindrical lens positioned over the smartphone camera at a fixed angle of 40°[8]. The blue filter, composed of acrylic resin, emits light at a wavelength of 488 nm[16]. The lenses can be manually switched by sliding them along the base structure's designated guides, ensuring precise and stable positioning during examination. This imaging system is operated through a user-friendly dedicated application, enabling seamless access to the smartphone's camera for video capture. The app also provides secure storage options, both online and offline. Additionally, a teleconsultation feature is integrated into the app, facilitating remote ophthalmological evaluations. This feature allows users to engage in virtual consultations with healthcare professionals, offering a practical solution for both patients and clinicians in ophthalmology[17].
2.4. Capturing the Anterior Segment Videos
In this study, each patient received 2 μL of a 1% sodium fluorescein solution, which was carefully instilled into the inferior conjunctival sac using a micropipette to ensure precise and uniform dosing across all participants[16]. Following instillation, videos were recorded using the SEC exactly 3 minutes after administration. This interval was critical to ensure adequate distribution and interaction of the fluorescein with the ocular surface. The videographic session was performed in a dark room to limit bias due to high illumination. Each patient was subjected to SEC videography with a blue filter at around 4 cm distance from the corneal apex as the convex lens in front of the camera was designed to be in the best focus by 4 cm. 2.3.
2.5. Image Enhancement
Three versions of videos were prepared for evaluation using the following methods.
Parameter Adjustment: In this study, the green (G) channel of the RGB color model was selectively enhanced by multiplying its intensity by a factor of n. This adjustment was made to emphasize the green component without causing excessive brightness or saturation that could obscure important visual details in the video. To ensure the quality of the enhancement, a manual inspection of each processed video was performed to confirm that the image remained clear and that excessive brightness or “blown-out” areas did not occur.
Software and Tools: The analysis and processing of the videos were conducted using Python programming language, specifically leveraging the MoviePy and OpenCV libraries. These tools were utilized for frame extraction, RGB manipulation, and recombination into video files. OpenCV was used to read and modify pixel values, while MoviePy was employed for handling video input and output operations, including the application of the RGB adjustments to each frame and the re-encoding of the video.
Procedure and Code Implementation: The process involved iterating through each frame of the input video files, adjusting the RGB color channels, and re-saving the processed videos. The core function, process_frame, manipulated the pixel values by scaling the red, green, and blue channels according to predefined ratios. The green channel was adjusted by multiplying its values by n, while the red and blue channels were left unchanged or scaled by different ratios depending on the experiment.
Video Processing: The videos were processed frame-by-frame, with each frame’s green channel being multiplied by the specified factor (e.g., 7x) while leaving the other channels unchanged. After processing, the frames were recombined into a video file, which was saved in MP4 format using the H.264 codec. During this procedure, the resolution of the videos was maintained at their original values to ensure consistency in visual quality.
Manual Review: Following the video processing, each output file was visually inspected to verify that the image quality was maintained, ensuring that excessive brightness (“blown-out” highlights) did not occur due to the green channel enhancement. This step was crucial to confirm that the adjusted videos were suitable for further analysis or presentation.
2.6. Image Analysis
In this study, the tear breakup time (TBUT), tear meniscus height (TMH), corneal fluorescein staining (CFS) score, and the presence of conjunctivochalasis, as assessed from video recordings captured by SEC, were evaluated by three independent observers (E.S. and S.S., dry eye specialists; T.M., general ophthalmologist). Three versions of videos were prepared for evaluation by three independent observers based on the following criteria. The original video without image enhancement was designated as G0, the video with mild enhancement using the method mentioned above was labeled G3, and the video with stronger enhancement was labeled G7. Representative images for each condition (G0, G3, and G7) are shown in Figure 1.
・TBUT was measured three times per eye for each patient, and the average TBUT by each observer was used for analysis.
・TMH was evaluated for each eye on a three-point scale by the observers (High = 2, Middle = 1, Low = 0).
・The CFS score was graded using the Ocular Surface Disease Index proposed by Ogawa et al., dividing the cornea into upper, middle, and lower regions[18]. Each region was scored on a scale of 0 to 3, with a maximum score of 9 (Grade 0 = no staining, Grade 1 = minimal staining, Grade 2 = mild/moderate staining, Grade 3 = severe staining).
・For conjunctivochalasis, a score of 1 was assigned if present and 0 if absent.
Statistical Analysis
Descriptive statistics were used to describe the sample in terms of mean and standard deviation (SD). p < 0.05 was considered statistically significant in all analyses. Inter-rater reliability of the above parameters (TBUT, TMH, CFS score, and conjunctivochalasis) was analyzed using intraclass correlation coefficients (ICC). The values were considered poor (ICC < 0.5), moderate (0.5 ≥ ICC < 0.75), good (0.75 ≥ ICC < 0.90), and excellent (ICC ≥ 0.90)[19]. All analyses were performed using JMP Pro 17 software (SAS Institute, Cary, NC, USA).
3. Results
3.1. Patients’ Characteristics
The study obtained a total of 92 eyes of 46 subjects. The sample characteristics of the study were as follows: 20 males (43.5%) and 26 females (56.5%), with a mean age of 52.22 ± 18.68 years. The mean OSDI score was 22.75 ± 22.03.
3.2. Tear Film Break-Up Time
The TBUT was evaluated at G0, G3, and G7. The more intensive image enhancement was applied, the easier it became to detect subtle tear film break-up (Figure 2). At G0, the tear film break-up was not clearly discernible; however, with stronger image enhancement at G3 and G7, it became progressively more apparent.
3.3. Corneal Fluorescein Staining Scores
An evaluation of CFS scores at grades G0, G3, and G7 reveals that moderate image enhancement, as observed in G3, improves the detection of staining (Figure 3). In contrast, excessive enhancement, exemplified by G7, reduces the visibility of staining, thereby impairing detection accuracy.
3.4. Conjunctivochalasis
Evaluation of conjunctivochalasis under three conditions (G0, G3, G7) demonstrated that the detection of conjunctivochalasis becomes progressively more difficult as the level of image enhancement increases (Figure 4).
3.5. Tear Meniscus Height
The evaluation of TMH under three image enhancement conditions (G0, G3, and G7) demonstrates that higher levels of enhancement progressively impair the accuracy of TMH assessment (Figure 5).
3.6. Inter-Observer Reliability
The inter-observer reliability statistics are summarized in Table 1. The ICC values for TBUT were 0.3046, 0.6124, and 0.7381 for G0, G3, and G7, respectively. For the CFS score, the ICC values were 0.4656, 0.8413, and 0.2259 for G0, G3, and G7, respectively. TMH showed ICC values of 0.7221, 0.5774, and 0.6650 for G0, G3, and G7, respectively. Finally, the ICC values for conjunctivochalasis were 0.5618, 0.2820, and 0.0786 for G0, G3, and G7, respectively.
4. Discussion
The objective of this study was to evaluate how interobserver reliability in the measurement of tear break-up time (TBUT) and tear meniscus height (TMH), corneal fluorescein staining (CFS) scoring, and the detection of conjunctivochalasis is affected by different levels of image enhancement: no enhancement (G0), mild enhancement (G3), and strong enhancement (G7). The results demonstrated that as the intensity of image enhancement increased, TBUT became more easily detectable. G7 was considered optimal for the detection of subtle tear film break-up. In contrast, for CFS scoring, mild enhancement (G3) improved the visibility of corneal staining, while excessive enhancement (G7) reduced clarity. Therefore, G3 was deemed most suitable for CFS evaluation. Regarding the detection of conjunctivochalasis, greater image enhancement progressively hindered its identification, making G0 the most appropriate setting. Similarly, higher levels of enhancement impaired the accuracy of TMH measurements, suggesting that G0 is preferable for TMH assessment. These findings underscore the importance of selecting an appropriate level of image enhancement tailored to the specific diagnostic parameter under investigation. Furthermore, the study indicates that with appropriate image enhancement, general ophthalmologists can achieve diagnostic accuracy comparable to that of dry eye specialists.
The Smart Eye Camera (SEC) is a novel, portable device specifically developed for ophthalmic examinations. This innovative technology converts a standard smartphone camera into a tool capable of performing fundamental assessments of the ocular surface[8]. In addition to its diagnostic utility, the SEC has demonstrated outstanding interobserver reproducibility in the evaluation of allergic conjunctivitis and tear break-up time (TBUT) measurements[11]. It is well established that the application of appropriate image enhancement techniques can significantly improve the visualization of target structures during surgeries and in the interpretation of diagnostic images. In ocular surgery, digital technology for three-dimensional (3D) visualization employs real-time filters to enhance contrast and optimize the clarity of anatomical structures[20,21]. Several studies have demonstrated improved visualization using digital imaging systems, particularly in cataract surgery and during the staining of epiretinal membranes in surgical procedures[22,23]. The Olympus Corporation introduced texture and color enhancement imaging in colonoscopy, which enhances subtle tissue textures, selectively brightens dark areas, and accentuates the contrast between red and white colors. These enhancements have been shown to improve the adenoma detection rate[24,25].
In this study, we hypothesized that with appropriate image processing, general ophthalmologists could achieve diagnostic accuracy comparable to that of dry eye specialists when using SEC for anterior segment imaging. To test this, we prepared three versions of the images: the original, unprocessed version (G0), a mildly enhanced version (G3), and a highly enhanced version (G7). We then examined the differences in diagnostic outcomes for TBUT, CFS score, TMH, and conjunctivochalasis across these image versions. The findings indicate that, even when diagnosing from the same images, it is essential to select an appropriate level of image enhancement based on the specific structures or conditions being assessed. By applying suitable image processing techniques, general ophthalmologists can achieve diagnostic accuracy comparable to that of dry eye specialists. In addition, it is anticipated that with appropriate image enhancement, it will be possible to generate images comparable to those obtained using a blue-free filter (525 nm bandpass filter) without the need for the filter itself[16]. In the field of image-based diagnostics, the use of artificial intelligence (AI) is becoming increasingly prevalent, and its application is expected to expand further in the future[26,27,28]. To ensure that AI systems provide highly accurate diagnoses, it is important to train them using appropriately processed images tailored to the condition being evaluated.
The limitations of this study include its retrospective design and the small sample size. Additionally, the images used in this study were captured using SEC, which may limit the generalizability of the findings to images obtained from other imaging devices. For the diagnosis of other conditions, such as cataracts, specific image processing parameters would need to be identified for each disease individually. Further studies with larger and more diverse samples would be beneficial to validate these results.
5. Conclusions
Appropriate image processing techniques can significantly enhance the visibility of target diagnostic features, improving diagnostic accuracy. This enables general ophthalmologists to achieve diagnostic accuracy comparable to dry eye specialists. However, as the optimal image processing parameters may vary depending on the diagnostic target, it is essential to adjust these parameters accordingly for each condition.
Author Contributions
Conceptualization, T.M., and E.S.; methodology, T.M., K.A., T.I., and E.S.; validation, T.M., and E.S.; formal analysis, T.M., and E.S.; investigation, T.M., S.S., and E.S.; data curation, T.M., S.S., and E.S.; writing—original draft preparation, T.M.; writing—review and editing, E.S.; supervision, J.S. and Y.S.; project administration, J.S. and Y.S.; All authors have read and agreed to the published version of the manuscript.
Funding
This research was funded by the Japan Agency for Medical Research and Development, grant number 24hk0102084h0003.
Institutional Review Board Statement
This research project received approval from the Institutional Ethics Review Board of the Minami Aoyama Eye Clinic, Tokyo, Japan (IRB No. 202101) and the Ethics Review Committee of the Kobanawa Medical Corporation (Committee No. 21000056), ensuring compliance with the ethical standards outlined in the Declaration of Helsinki.
Informed Consent Statement
Written informed consent was not obtained because the study was retrospective.
Data Availability Statement
The data used and analyzed for this study are available from the corresponding author on reasonable request.
Conflicts of Interest
The authors declare no conflicts of interest.
References
- Tsubota K, Yokoi N, Shimazaki J, Watanabe H, Dogru M, Yamada M, et al. New Perspectives on Dry Eye Definition and Diagnosis: A Consensus Report by the Asia Dry Eye Society. Ocul Surf. 2017, 15, 65–76. [Google Scholar] [CrossRef] [PubMed]
- The epidemiology of dry eye disease: report of the Epidemiology Subcommittee of the International Dry Eye WorkShop (2007). Ocul Surf. 2007, 5, 93–107. [CrossRef] [PubMed]
- Khurana AK, Choudhary R, Ahluwalia BK, Gupta S. Hospital epidemiology of dry eye. Indian J Ophthalmol. 1991, 39, 55–8. [Google Scholar]
- Uchino, M. What We Know About the Epidemiology of Dry Eye Disease in Japan. Invest Ophthalmol Vis Sci. 2018, 59, Des1–des6. [Google Scholar] [CrossRef]
- Craig JP, Nichols KK, Akpek EK, Caffery B, Dua HS, Joo CK, et al. TFOS DEWS II Definition and Classification Report. Ocul Surf. 2017, 15, 276–83. [Google Scholar] [CrossRef]
- Wolffsohn JS, Arita R, Chalmers R, Djalilian A, Dogru M, Dumbleton K, et al. TFOS DEWS II Diagnostic Methodology report. Ocul Surf. 2017, 15, 539–74. [Google Scholar] [CrossRef]
- Hu S, Wu H, Luan X, Wang Z, Adu M, Wang X, et al. Portable Handheld Slit-Lamp Based on a Smartphone Camera for Cataract Screening. J Ophthalmol. 2020, 2020, 1037689. [Google Scholar]
- Shimizu E, Ogawa Y, Yazu H, Aketa N, Yang F, Yamane M, et al. "Smart Eye Camera": An innovative technique to evaluate tear film breakup time in a murine dry eye disease model. PLoS One. 2019, 14, e0215130. [Google Scholar]
- Borselli M, Toro MD, Rossi C, Taloni A, Khemlani R, Nakayama S, et al. Feasibility of Tear Meniscus Height Measurements Obtained with a Smartphone-Attachable Portable Device and Agreement of the Results with Standard Slit Lamp Examination. Diagnostics (Basel) 2024, 14.
- Cho P, Brown B, Chan I, Conway R, Yap M. Reliability of the tear break-up time technique of assessing tear stability and the locations of the tear break-up in Hong Kong Chinese. Optom Vis Sci. 1992, 69, 879–85. [Google Scholar] [CrossRef]
- Handayani AT, Valentina C, Suryaningrum I, Megasafitri PD, Juliari I, Pramita IAA, et al. Interobserver Reliability of Tear Break-Up Time Examination Using "Smart Eye Camera" in Indonesian Remote Area. Clin Ophthalmol. 2023, 17, 2097–107. [Google Scholar] [CrossRef] [PubMed]
- Bron AJ, Evans VE, Smith JA. Grading of corneal and conjunctival staining in the context of other dry eye tests. Cornea. 2003, 22, 640–50. [Google Scholar] [CrossRef] [PubMed]
- Imai H, Iwane Y, Kishi M, Sotani Y, Yamada H, Matsumiya W, et al. Color enhancement and achromatization to increase the visibility of indocyanine green-stained internal limiting membrane during digitally assisted vitreoretinal surgery. Jpn J Ophthalmol. 2024, 68, 105–11. [Google Scholar] [CrossRef] [PubMed]
- Sakai H, Iwai N, Dohi O, Oka K, Okuda T, Tsuji T, et al. Effect of texture and color enhancement imaging on the visibility of gastric tumors. Sci Rep. 2024, 14, 19125. [Google Scholar] [CrossRef]
- Ishikawa T, Matsumura T, Okimoto K, Nagashima A, Shiratori W, Kaneko T, et al. Efficacy of Texture and Color Enhancement Imaging in visualizing gastric mucosal atrophy and gastric neoplasms. Sci Rep. 2021, 11, 6910. [Google Scholar] [CrossRef]
- Kawai M, Yamada M, Kawashima M, Inoue M, Goto E, Mashima Y, et al. Quantitative evaluation of tear meniscus height from fluorescein photographs. Cornea. 2007, 26, 403–6. [Google Scholar] [CrossRef]
- Shimizu E, Kamezaki M, Nishimura H, Nakayama S, Toda I. A Case of Traumatic Hyphema Diagnoses by Telemedicine Between a Remote Island and the Mainland of Tokyo. Cureus. 2024, 16, e65153. [Google Scholar]
- Ogawa Y, Kim SK, Dana R, Clayton J, Jain S, Rosenblatt MI, et al. International Chronic Ocular Graft-vs-Host-Disease (GVHD) Consensus Group: proposed diagnostic criteria for chronic GVHD (Part I). Sci Rep. 2013, 3, 3419. [Google Scholar] [CrossRef]
- Koo TK, Li MY. A Guideline of Selecting and Reporting Intraclass Correlation Coefficients for Reliability Research. J Chiropr Med. 2016, 15, 155–63. [Google Scholar] [CrossRef]
- Weinstock RJ, Diakonis VF, Schwartz AJ, Weinstock AJ. Heads-up Cataract Surgery: Complication Rates, Surgical Duration, and Comparison With Traditional Microscopes. J Refract Surg. 2019, 35, 318–22. [Google Scholar] [CrossRef]
- Sandali O, El Sanharawi M, Tahiri Joutei Hassani R, Roux H, Bouheraoua N, Borderie V. Early corneal pachymetry maps after cataract surgery and influence of 3D digital visualization system in minimizing corneal oedema. Acta Ophthalmol. 2022, 100, e1088–e94. [Google Scholar]
- Sandali O, Tahiri Joutei Hassani R, Armia Balamoun A, Franklin A, Sallam AB, Borderie V. Operative Digital Enhancement of Macular Pigment during Macular Surgery. J Clin Med. 2023, 12. [Google Scholar]
- Sandali O, Tahiri JHR, Armia Balamoun A, Duliere C, El Sanharawi M, Borderie V. Use of Black-and-White Digital Filters to Optimize Visualization in Cataract Surgery. J Clin Med. 2022, 11.
- Toyoshima O, Nishizawa T, Hiramatsu T, Matsuno T, Yoshida S, Mizutani H, et al. Colorectal adenoma detection rate using texture and color enhancement imaging versus white light imaging with chromoendoscopy: a propensity score matching study. J Gastroenterol Hepatol. 2024.
- Sato, T. TXI: Texture and Color Enhancement Imaging for Endoscopic Image Enhancement. J Healthc Eng. 2021, 2021, 5518948. [Google Scholar] [CrossRef]
- Yoshitsugu K, Shimizu E, Nishimura H, Khemlani R, Nakayama S, Takemura T. Development of the AI Pipeline for Corneal Opacity Detection. Bioengineering (Basel). 2024, 11.
- Son KY, Ko J, Kim E; et al. Deep Learning-Based Cataract Detection and Grading from Slit-Lamp and Retro-Illumination Photographs: Model Development and Validation Study. Ophthalmol Sci. 2022, 2, 100147. [Google Scholar] [CrossRef]
- Ueno Y, Oda M, Yamaguchi T, Fukuoka H, Nejima R, Kitaguchi Y, et al. Deep learning model for extensive smartphone-based diagnosis and triage of cataracts and multiple corneal diseases. Br J Ophthalmol. 2024. [Google Scholar]
Figure 1.
This figure illustrates the same photograph subjected to three different image enhancement techniques, demonstrating how it appears at G0 (left upper panel), G3 (right upper panel), and G7 (left lower panel).
Figure 1.
This figure illustrates the same photograph subjected to three different image enhancement techniques, demonstrating how it appears at G0 (left upper panel), G3 (right upper panel), and G7 (left lower panel).
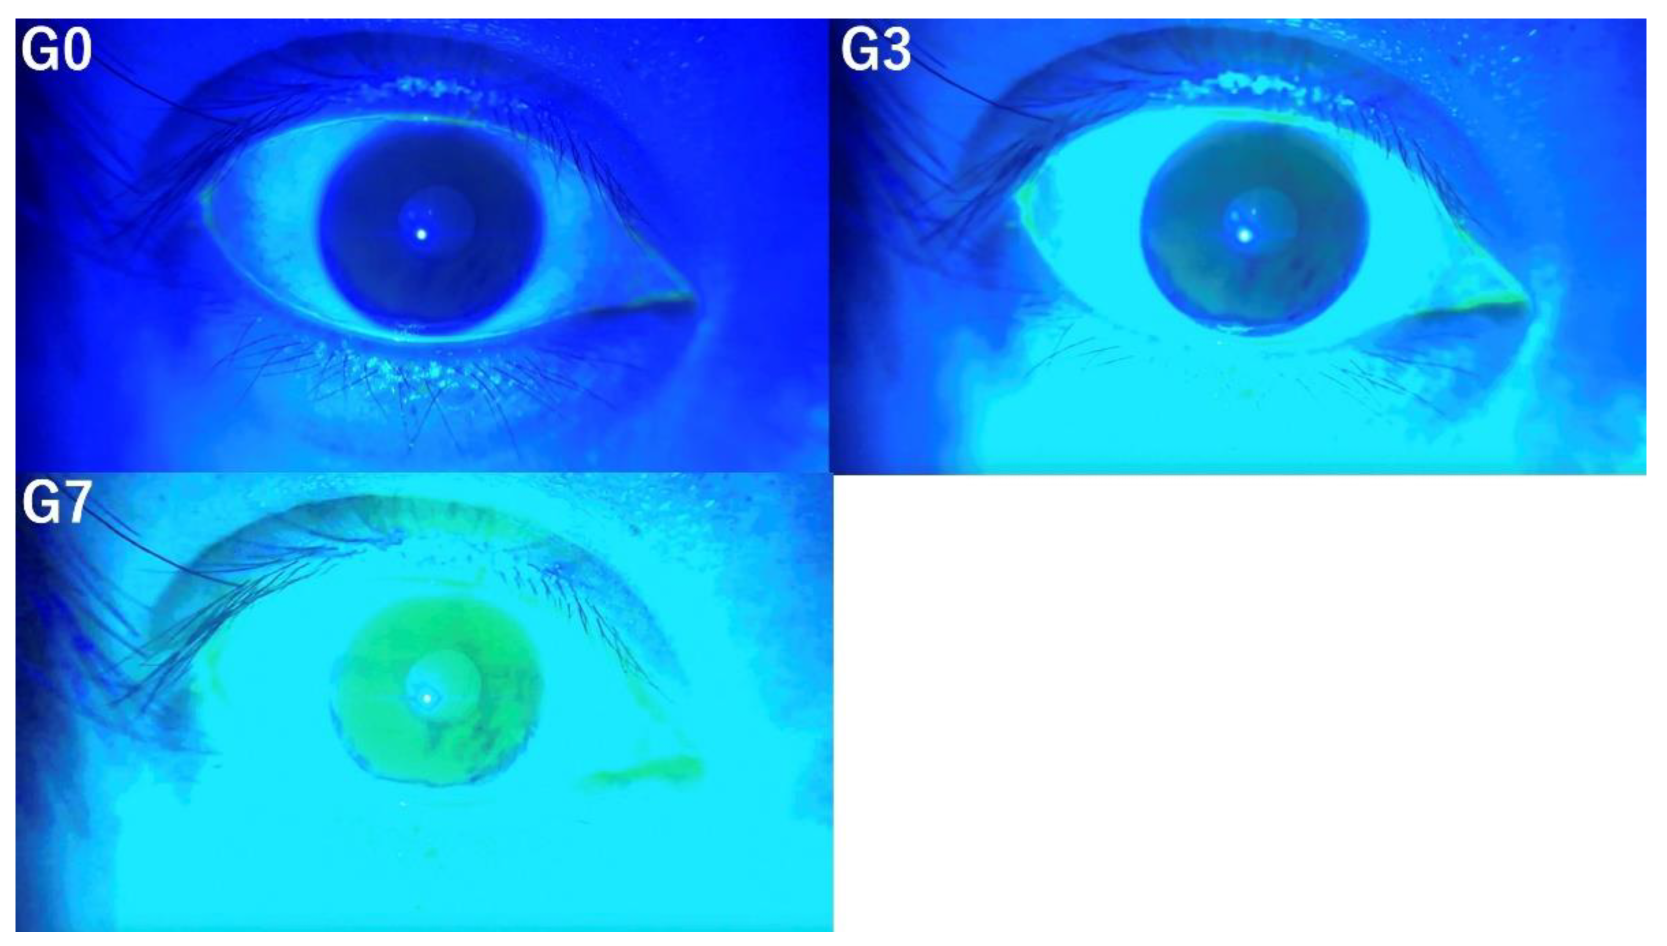
Figure 2.
The TBUT was evaluated at G0 (left upper panel), G3 (right upper panel), and G7 (left lower panel). The more intensive image enhancement was applied, the easier it became to detect subtle tear film break-ups. At G0, the tear film break-up was not clearly discernible; however, with stronger image enhancement at G3 and G7, it became progressively more apparent (arrow).
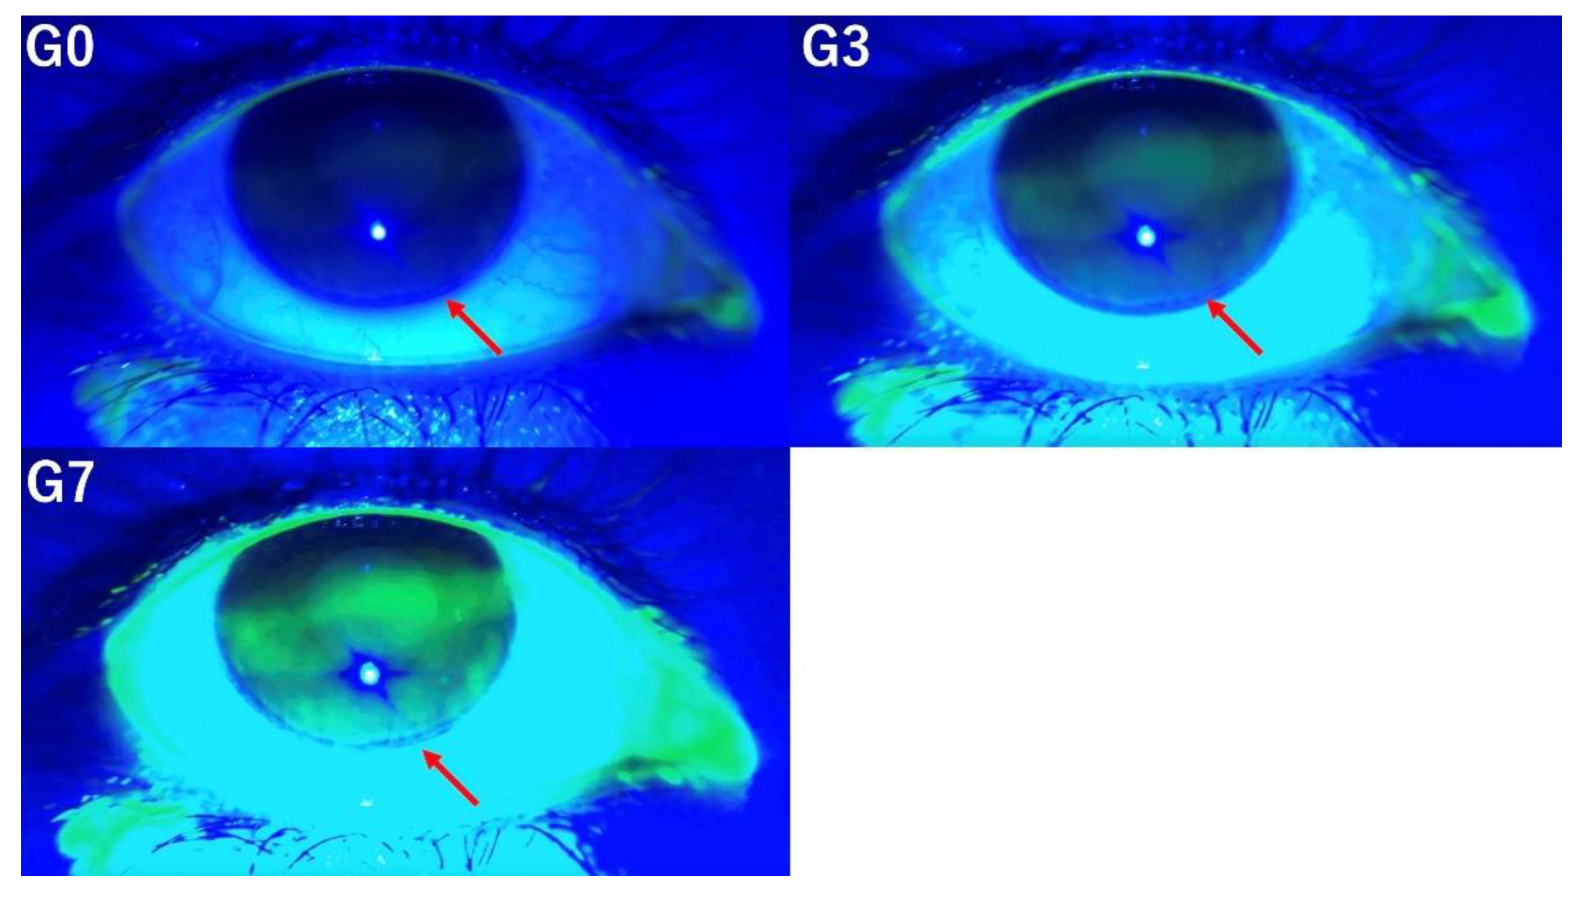
Figure 3.
An evaluation of CFS scores at G0 (left upper panel), G3 (right upper panel), and G7 (left lower panel) revealed that moderate image enhancement, as observed in G3, improves the detection of staining. In contrast, excessive enhancement, exemplified by G7, reduces the visibility of staining, thereby impairing detection accuracy.
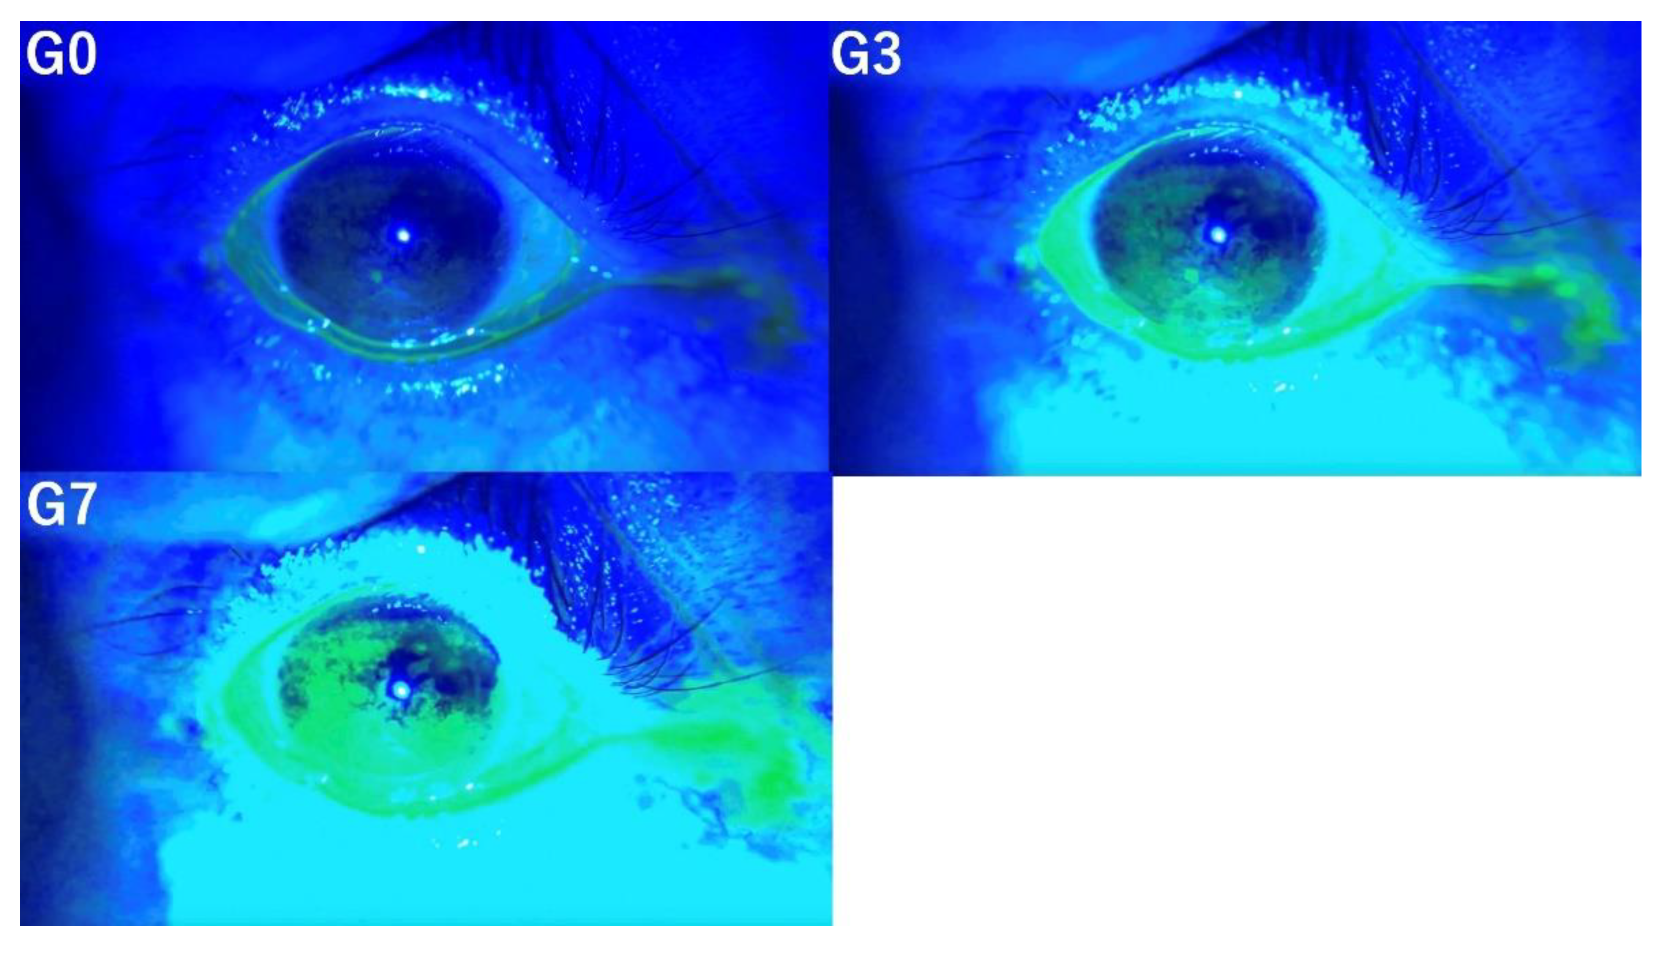
Figure 4.
Evaluation of conjunctivochalasis at G0 (left upper panel), G3 (right upper panel), and G7 (left lower panel) demonstrated that the detection of conjunctivochalasis becomes progressively more difficult as the level of image enhancement increases (arrow).
Figure 4.
Evaluation of conjunctivochalasis at G0 (left upper panel), G3 (right upper panel), and G7 (left lower panel) demonstrated that the detection of conjunctivochalasis becomes progressively more difficult as the level of image enhancement increases (arrow).
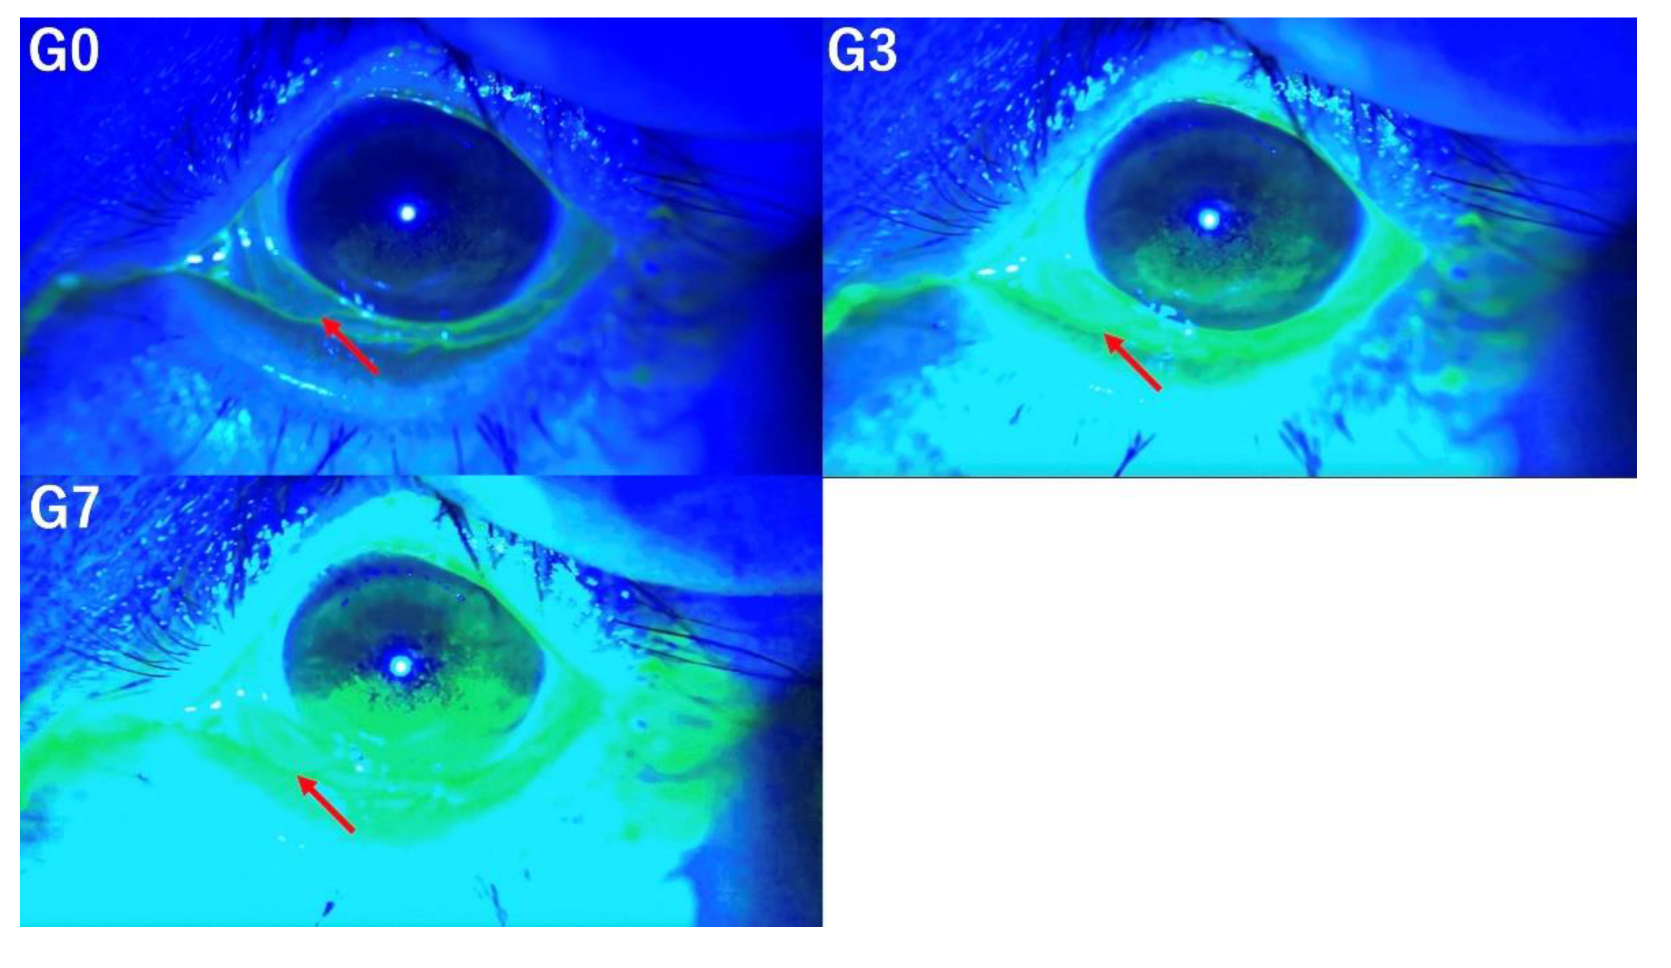
Figure 5.
The evaluation of TMH at G0 (left upper panel), G3 (right upper panel), and G7 (left lower panel) demonstrated that higher levels of enhancement progressively impair the accuracy of TMH assessment (arrow).
Figure 5.
The evaluation of TMH at G0 (left upper panel), G3 (right upper panel), and G7 (left lower panel) demonstrated that higher levels of enhancement progressively impair the accuracy of TMH assessment (arrow).
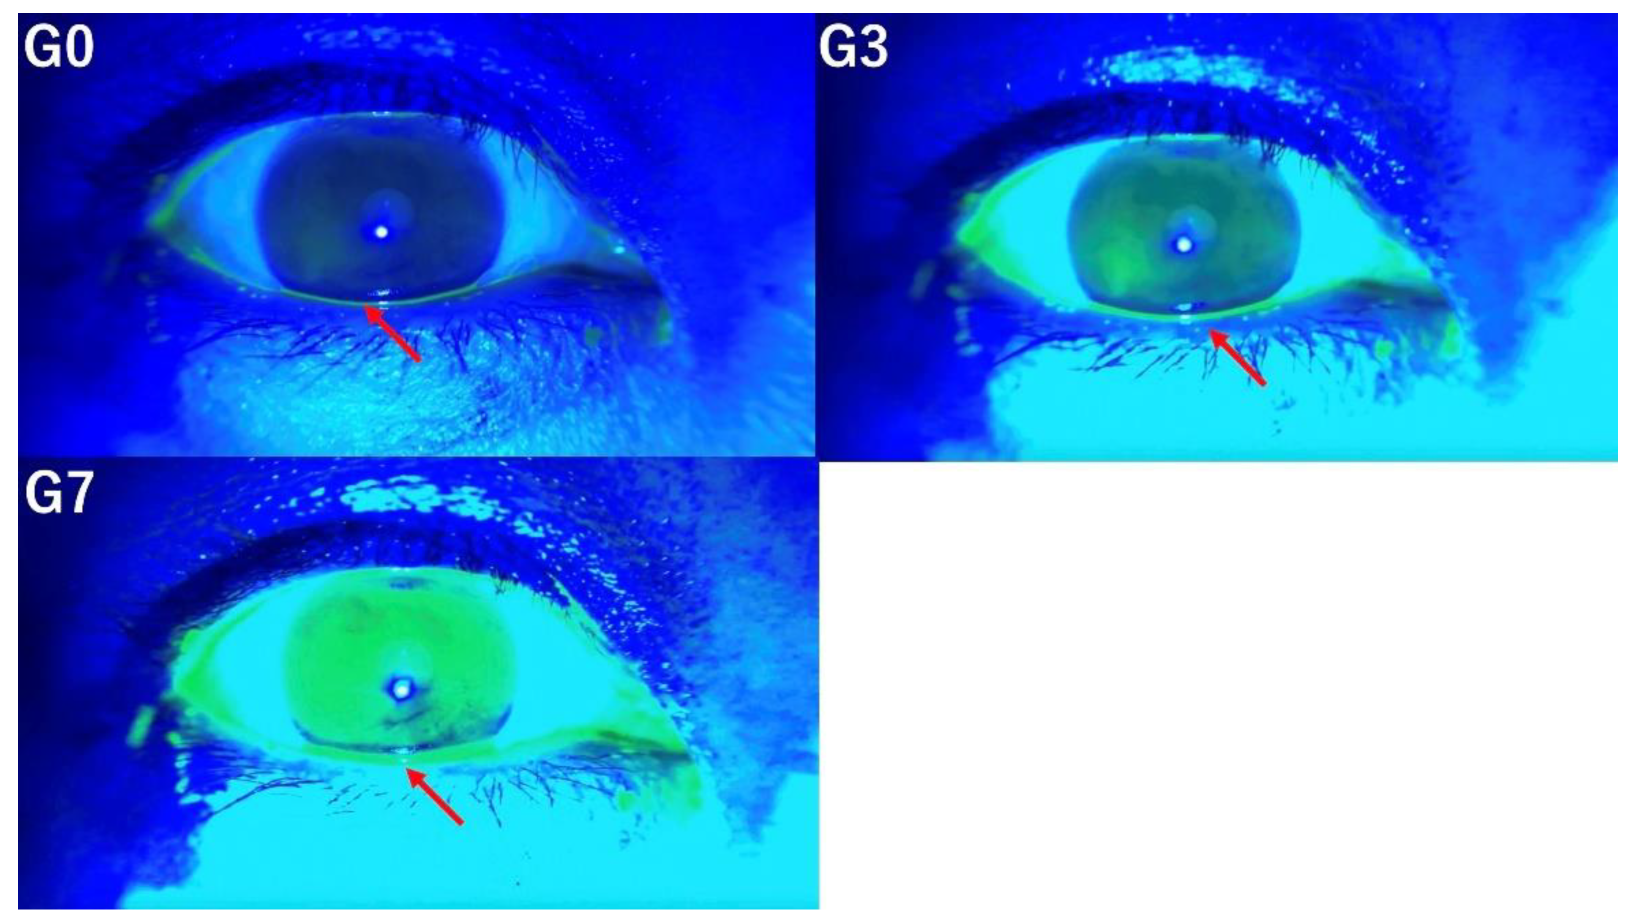

Table 1.
Inter-observer reliability statistics.
| Image Enhancement | ICC values | |
|---|---|---|
| TBUT | G0 | 0.3046 |
| G3 | 0.6124 | |
| G7 | 0.7381 | |
| CFS scores | G0 | 0.4656 |
| G3 | 0.8413 | |
| G7 | 0.2259 | |
| Conjunctivochalasis | G0 | 0.5618 |
| G3 | 0.2820 | |
| G7 | 0.0786 | |
| TMH | G0 | 0.7221 |
| G3 | 0.5774 | |
| G7 | 0.6650 |
CFS, corneal fluorescein staining; G0, no enhancement; G3, mild enhancement; G7, high enhancement; ICC, intraclass correlation coefficients; TBUT, tear break-up time; TMH, tear meniscus height.
Disclaimer/Publisher’s Note: The statements, opinions and data contained in all publications are solely those of the individual author(s) and contributor(s) and not of MDPI and/or the editor(s). MDPI and/or the editor(s) disclaim responsibility for any injury to people or property resulting from any ideas, methods, instructions or products referred to in the content. |
© 2024 by the authors. Licensee MDPI, Basel, Switzerland. This article is an open access article distributed under the terms and conditions of the Creative Commons Attribution (CC BY) license (http://creativecommons.org/licenses/by/4.0/).
Copyright: This open access article is published under a Creative Commons CC BY 4.0 license, which permit the free download, distribution, and reuse, provided that the author and preprint are cited in any reuse.


