1. Introduction
The literature in AML patients with CNS involvement is limited in terms of its associated risks [
1]. Previous studies have acknowledged that invasion of AML cells into the CNS in adults at diagnosis is relatively rare with incidence rate of (0.4-0.6 to 5.1%) [
1,
2,
3,
4,
5,
6]. It can be manifested clinically or occult as leukemia meningitis or myeloid sarcoma [
7]. While CNS+ in ALL is seemingly more common than AML, when investigated in depth the opposite may be true [
7]. The signs and symptoms in CNS+ may include headache, nausea / vomiting, or other neurological symptoms [
8]. Thus far, the true incidence in adult AML is not well known
6. Equally unfamiliar and contentious is the prognostic factors associating the clinical outcome of AML patients with CNS+ [
9,
10]. The issue in part, is attributed to the lack of diagnostic lumbar puncture (LP) as a routine practice in asymptomatic patients [
11]. The timing for CNS+ detection by a LP, either symptomatic or at physician
’s discretion, is entirely controversial. When examining the findings from two large patient series; one study produced significantly higher CNS involvement yield (from 3.3% to 19%) when LP was done at diagnosis [
4], compared to patients whose low yield of CNS infiltration (overall 1.11%) irrespective of whether LP is routinely done or not [
12]. The latter author reported no significant difference in OS between CNS+ and CNS- cohorts.
The primary objective of this study is to conduct a single center retrospective chart review in order to, establish the correlation between CNS+ and molecular profile in AML patients at Princess Margaret Cancer Centre (PMH). In particular, to estimate the association by:
1.- the use of flow, cytogenetic molecular and clinical characteristic at diagnosis, at the occurrence of CNS+, at CNS relapse, in order to ascertain the predisposing risk factors described in our cohort of AML patients. Next generation sequencing (NGS) was used to predict CNS+ risk. The processes also involved the use of potential threshold characteristics to define the criteria for performing LP for our patients.
2.- as a secondary objective: to correlate the presence of CNS+ and molecular gene mutations, in terms of CIR and OS.
2. Materials and Methods
A retrospective electronic medical chart review was performed on 435 patients with AML and received standard induction chemotherapy, at PMH between February 2015 and December 2018 approved by the institutional Research Ethics Board (REB). Acute Promyelocytic leukemia and isolated myeloid sarcoma were excluded. Patients presented with neurological symptoms, and / or with hyperleukocytosis underwent LP at diagnosis after clearing blasts from the peripheral blood, satisfied the inclusion criteria. NGS was performed on DNA samples isolated from peripheral blood or bone marrow samples at diagnosis. Analysis was performed using the TruSight Myeloid Sequencing Panel on the MiSeq sequencer (Illumina; San Diego, CA). Cytogenetic, molecular, FLT3 gene mutation, CD56, NGS, clinical, and laboratory parameters were analysed to identify potential risk factors. CNS+ was diagnosed by CSF morphology / cytology and / or flow cytometry (FCM) of the CSF. Demographic and clinical data were obtained from the Leukemia Database of the PMH Registry.
Statistical Methods
Categorical variables such as gender, cytogenetics, and type of diagnosis, were summarized with counts and percentages. Continuous variables such as age, WBC and Platelet at Diagnosis and follow-up were summarized with medians and range. The main outcome variables of interest are CNS infiltration, Time to Death (OSTIME) and time to relapse were calculated in months from the start date of diagnosis to time of event, for the last follow-up date whichever comes first. Chi-square or Fisher’s exact test were used as appropriate to comparing categorical variables of interest for patients with and without CNS involvement, and the student’s t-test was used to comparing continuous variables of interest for patients with and without CNS involvement. OS rates are calculated using the Kaplan-Meier product-limit method and the impact of covariates of interest were assessed using the Log-rank test. Cumulative incidence of relapse (CIR) rates was obtained with Grey’s competing risk analysis method while considering death without relapse as competing event. Logistic regression model was used to assess the impact of each of the potential predictor as well as joint effect of those variables of interest to the binary outcome CNS infiltration. Cox regression model was performed for multivariable analysis for OS as well as Grey’s method for CiR to assess joint effect of those factors that were found in the univariate analysis. All P-values are 2-sided and for the statistical analyses, P < 0.05 indicates a statistically significant result. Statistical analysis performed using version 9.4 of the SAS system for Windows, Copyright © 2002-2012 SAS Institute, Inc., Cary, NC and open source statistical software R version 4.3.0 (R Core Team (2023), R Foundation for Statistical Computing, Vienna, Austria).
4. Results
435 evaluable AML patients received induction chemotherapy. Since the focus of our study was primarily about CNS infiltration, we confirmed 259 (59.5%) patients who had completed LP and from whom 31 (11.97%), [13 (41.9%) female and 18 (58.1%) male] were diagnosed with CNS+.
4.1. Patient Characteristics
Patient characteristics with and without CNS+ were compared (
Table 1); there was no significant difference in gender (p=0.3994), and median age of 58 years with and without CNS+ (p=0.9252). CNS+ patients at diagnosis had significantly higher WBC median counts, 92.7 vs. 8.1 (p=0.0008), lower median platelet counts, 44 vs 63 (p=0.0374), higher median blast percentage, 76% vs. 53% (p=0.0202) and higher median lactate dehydrogenase (LDH≥2ULN), 789 vs. 359 (p=0.0114). Median Hemoglobin, 90 vs 91 (p=0.2295) was similar between groups. Patients with CNS+ exhibited NPM1 mutations (48.4% vs 24.6%, P=0.0053). However, the presence of FLT3 mutations in the CNS+ group did not show significant difference by NGS (25.8% vs 14.9%, P= 0.1226).
4.2. ELN Classification
Of the entire study cohort of 435 patients, two patients (%) were without ELN classifications. Of the remaining 433 patients, 116 (26.8%) had Favourable, 98 (22.6%) had Intermediate, while 219 (50.6%) had adverse classification.
From the 259 patients who had completed LP, 57 patients with favourable risk, 68 patients had intermediate risk and 133 patients had adverse risk. One without ELN classification.
Of the 31 patients with CNS+, 11 patients had favourable risk, 7 had intermediate risk and 10 had adverse risk. Three patients were not determined. When compared to CNS- patients, CNS+ patients had significantly higher proportion of favorable risk (p=0.0197)
Table 2. Four of 14 were cord-binding positive. There were 15 patients who had NPM1 mutation. From these 15pts, 10 were favourable risk and 5 were intermediate risk due to FLT3 mutation.
The type of induction treatment and the treatment response
There were no significant differences between the treatment responses (p=0.1623), but a significant difference by the type of induction (p=0.0011) between the two groups (
Table 1). Patients who were known to have adverse risk cytogenetic or secondary leukemias were treated with FLAG IDA as first line induction chemotherapy.
All 31 CNS tested positive patients (100%) received 3+7 as induction treatment, compared to only 74.1% of non-CNS involved patients received the same induction treatment. The CR/CRi/MLFS rate was 81.1%,
Table 1. None of the CNS+ patients received FLAG-IDA, compared to 56 (24.6%) of non-CNS patients received the same treatment. CNS+ patients received intrathecal chemotherapy twice weekly until CSF is cleared, followed by two LP to confirm negativity.
In terms of treatment response in the 31 CNS+ patients, 25 (80.6%) of whom had CR, CRi or MLFS, 5 (16.1%) patients had partial response and 1 (3.2%) patient had early death (p=0.1623)
Table 1.
4.3. Risk Classification Analysis
The comparison between CNS+ (n= 31) and CNS- (n=228) in terms of risk groups cytogenetics, MRC showed no-significant differences among low, intermediate and poor risk groups (p=0.1216)
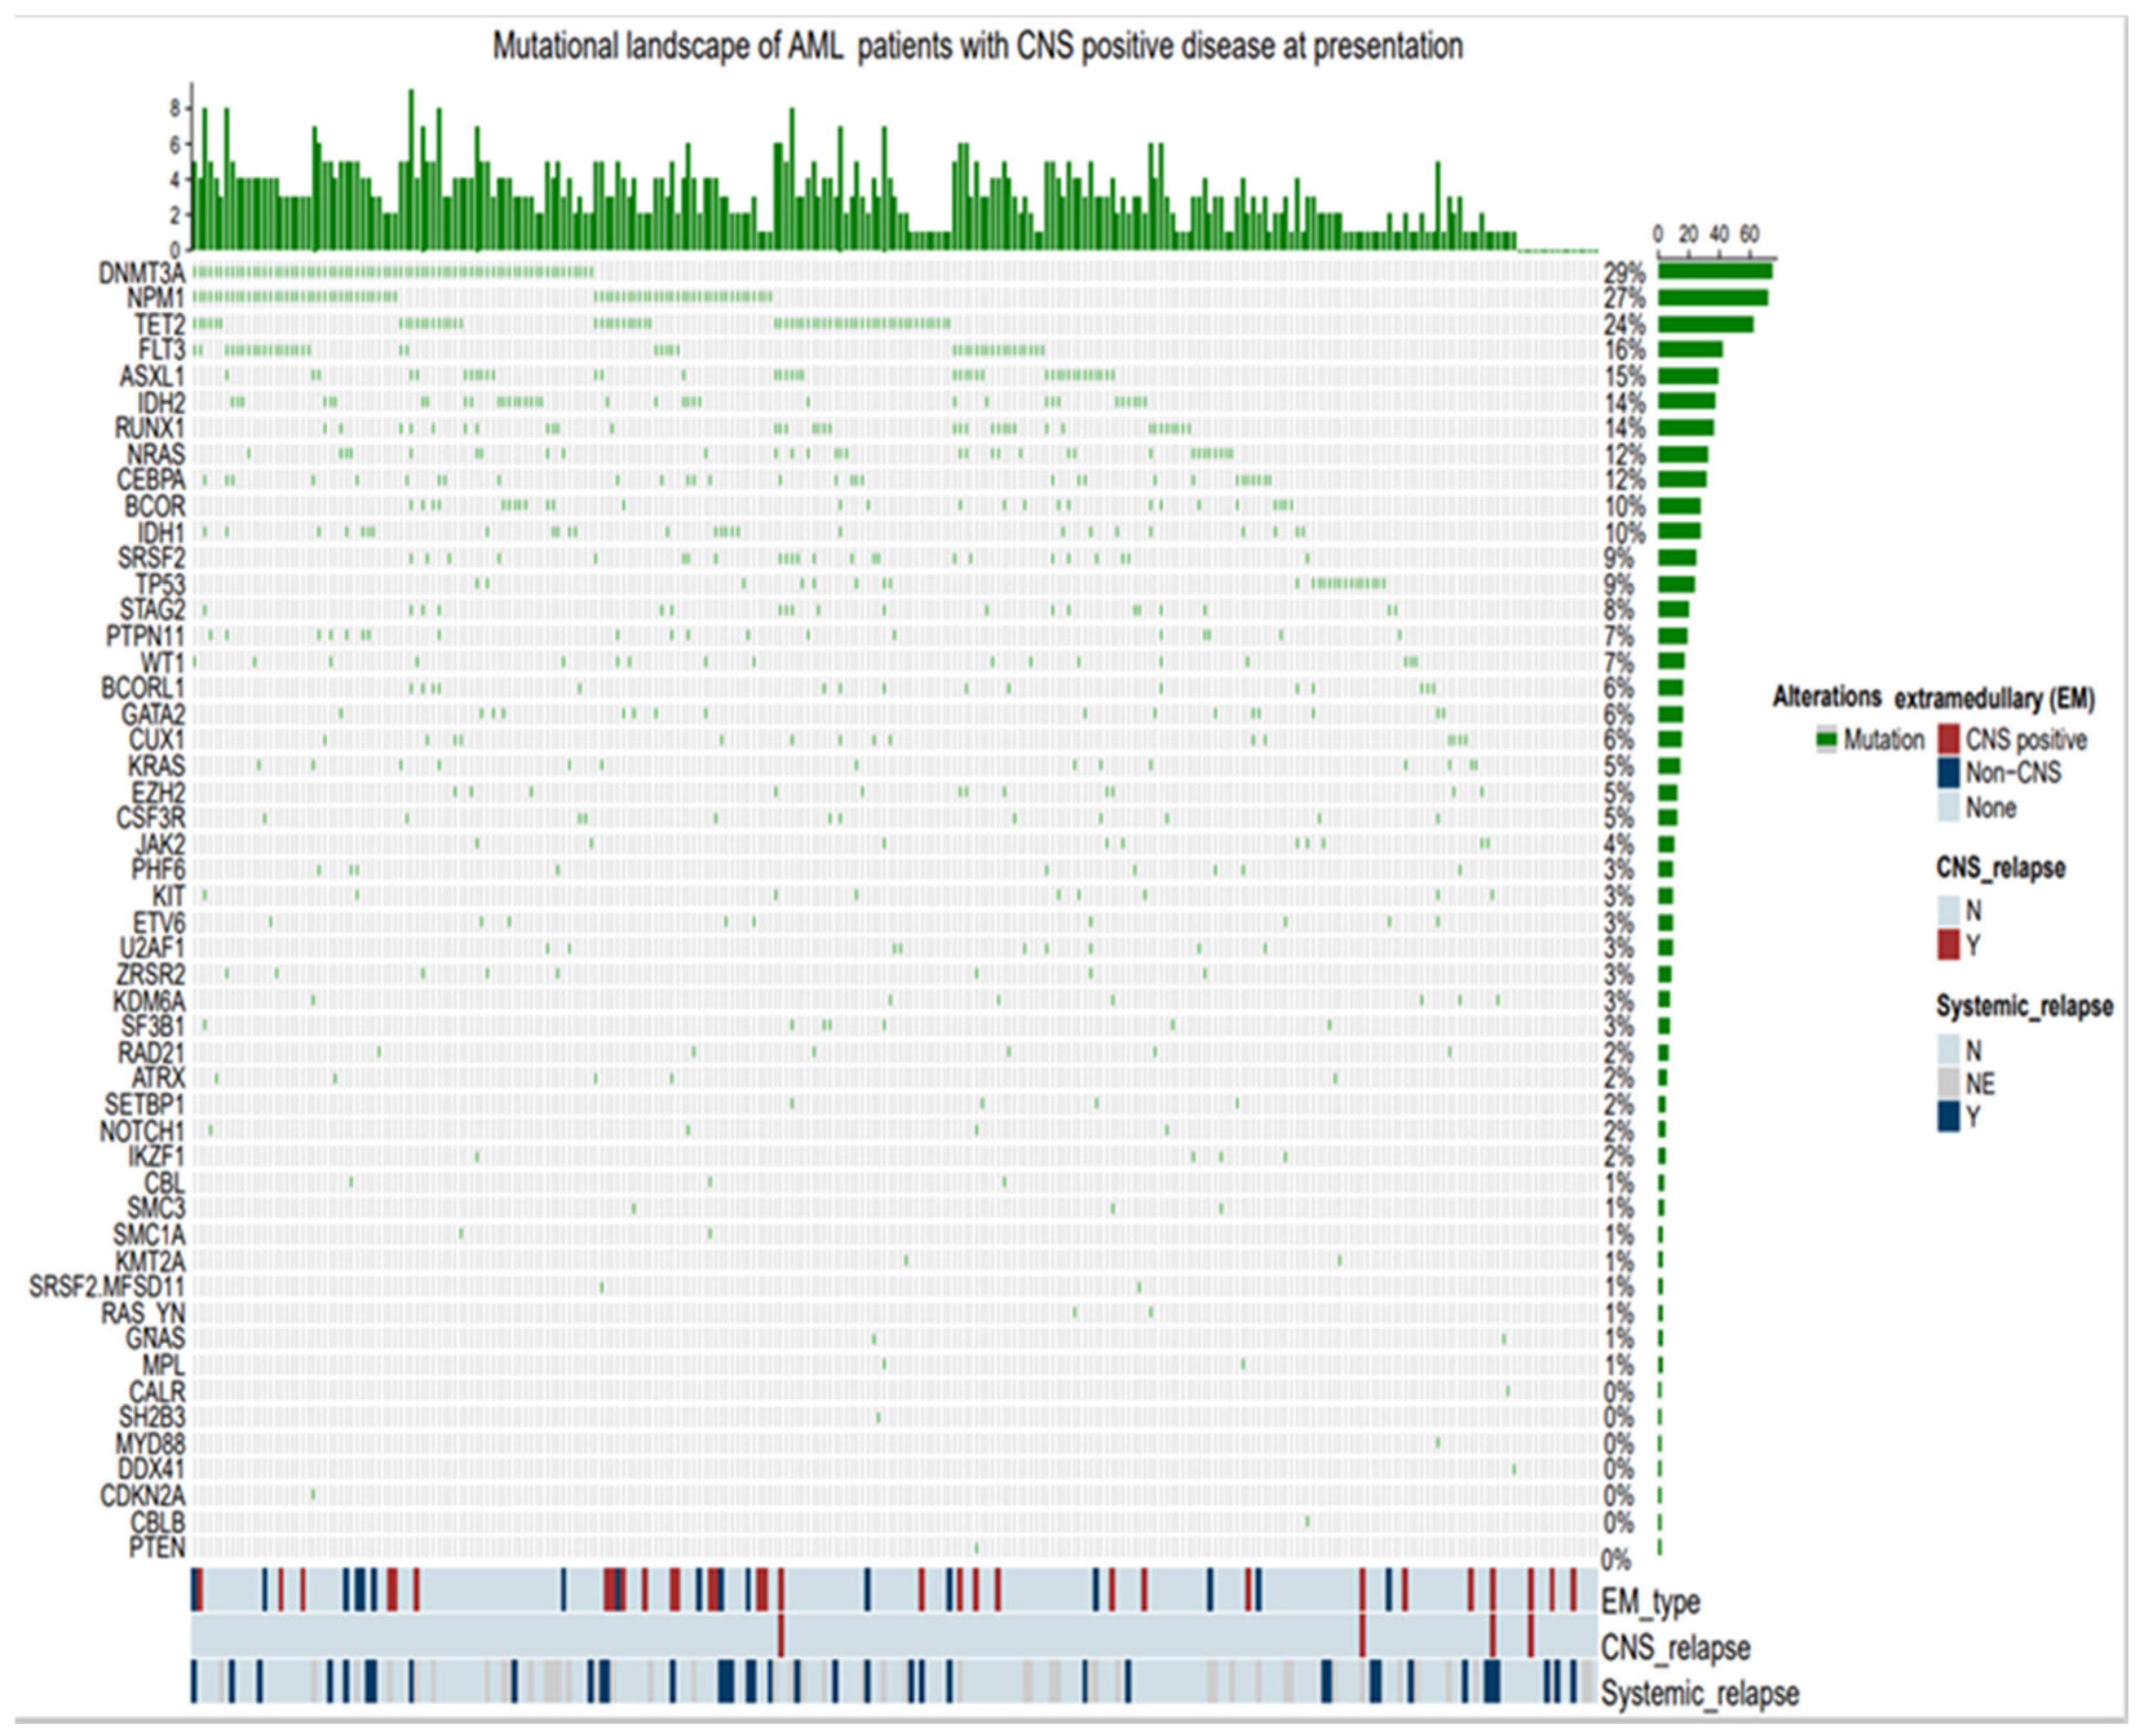
Table 2. NGS panel with 52 gene did not consistently predict CNS+. The most common molecular mutations, in terms of frequency of greater than 10%, in the CNS+ patients vs. in the total patients analyzed (n=259), were MPN1 [(48.3%) vs. (27.4%)], FLT3 [(22.5%) vs. (16.2%)], NPM1 with concomitant FLT3 [(12.9%) vs. (8.8%)], TET2 [(25.8%) vs. (23.9)], RAS / KRAS [(25.8%) vs. (10.8%), DMNT3 [(19.3%) vs. (28.5%)], ASXL1 [(16.1%) vs. (15.1), respectively (Chemoplot
Figure 6). Incidentally, MPN1 in the CNS- patients (n=228) was 24.6%.
A number of cytogenetic and molecular markers were examined in CNS+ patients, among those identified were translocation t(8;21), chromosome inv16, 11q23 abnormality and deletion-7/7q. The remaining markers (deletion -5/5q, Translocation t(6;9), and trisomy +8 were not present in the CNS+ patients. 11q23 abnormality was the only marker that was found significantly more frequent in CNS+ patients compared to the CNS- cohort (P=0.0139) (
Table 2). Chromosomal abnormalities such as t(8:21), deletion -5/5q, deletion -7/7q, t(6:9), Inv16 / t(16,16), and Trisomy 8, all had non-significant difference between the two groups
Table 2).
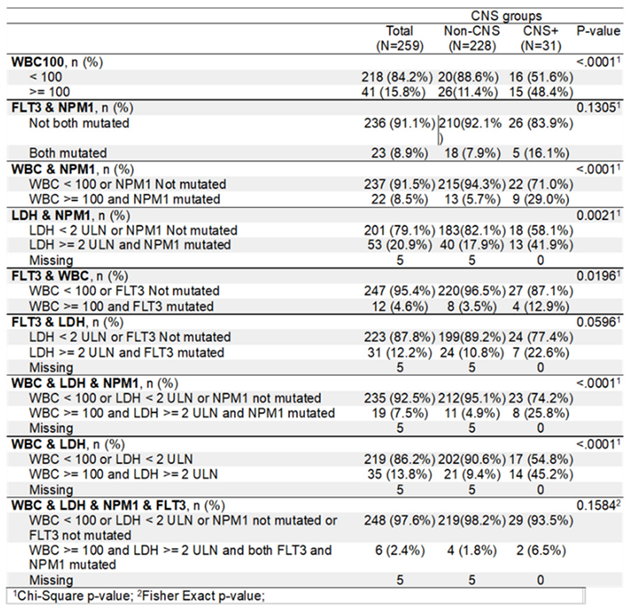
However, when compared using individually defined threshold levels and combined parameters, a clear distinction was visible between CNS+ and CNS- cohort of patients (
Table 3). WBC (<100 vs. ≥100), WBC & NPM1, FLT3 & WBC, LDH & NPM1, WBC & LDH & NPM1, and WBC & LDH showed significant difference in terms of risks for CNS+. Whereas FLT3 & NPM1, FLT3 & LDH, WBC & LDH & NPM1 & FLT3 combined pairs showed no significant differences (
Table 3).
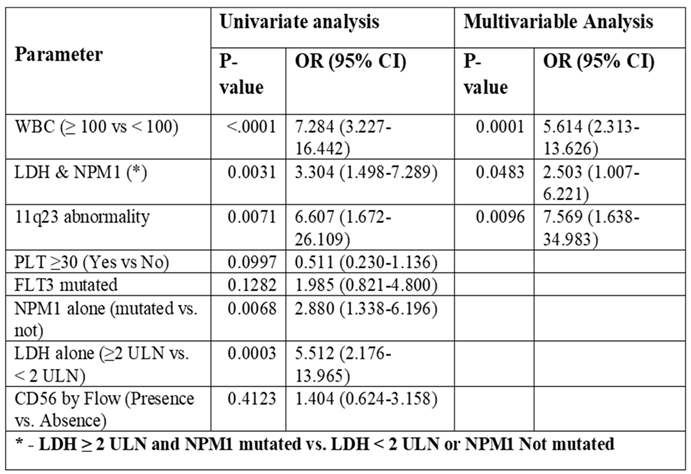
Univariate and multivariable analysis of risk factors for CNS involvement utilizing NGS Panel
Univariate and multivariable analysis were conducted to identify potential risk factors associated with CNS+. WBC ≥ 100 alone, 11q23, abnormality, LDH ≥ 2 ULN & NPM1 alone and combined with NPM1, are found significant as risk factors. However, under univariate analysis, our NGS panel of 52 gene mutations and other factors including PLT≥30, FLT3 mutated and CD56 as individual entities were deemed insignificant as risk factors (
Table 4). On multivariable analysis WBC ≥ 100 (OR=5.614, 95% CI 2.313-13.626, p=0.0001), LDH ≥ 2 ULN & NPM1 (OR=2.503 95% CI 1.007-6.221, p=0.0483), and 11q23 abnormality (OR=7.569 95% CI 1.638-34.983, p=0.0096) were found to be significant risk factors for CNS involvement.
4.4. Cumulative Incidence of Relapse (CIR) Stratified by CNS Involvement
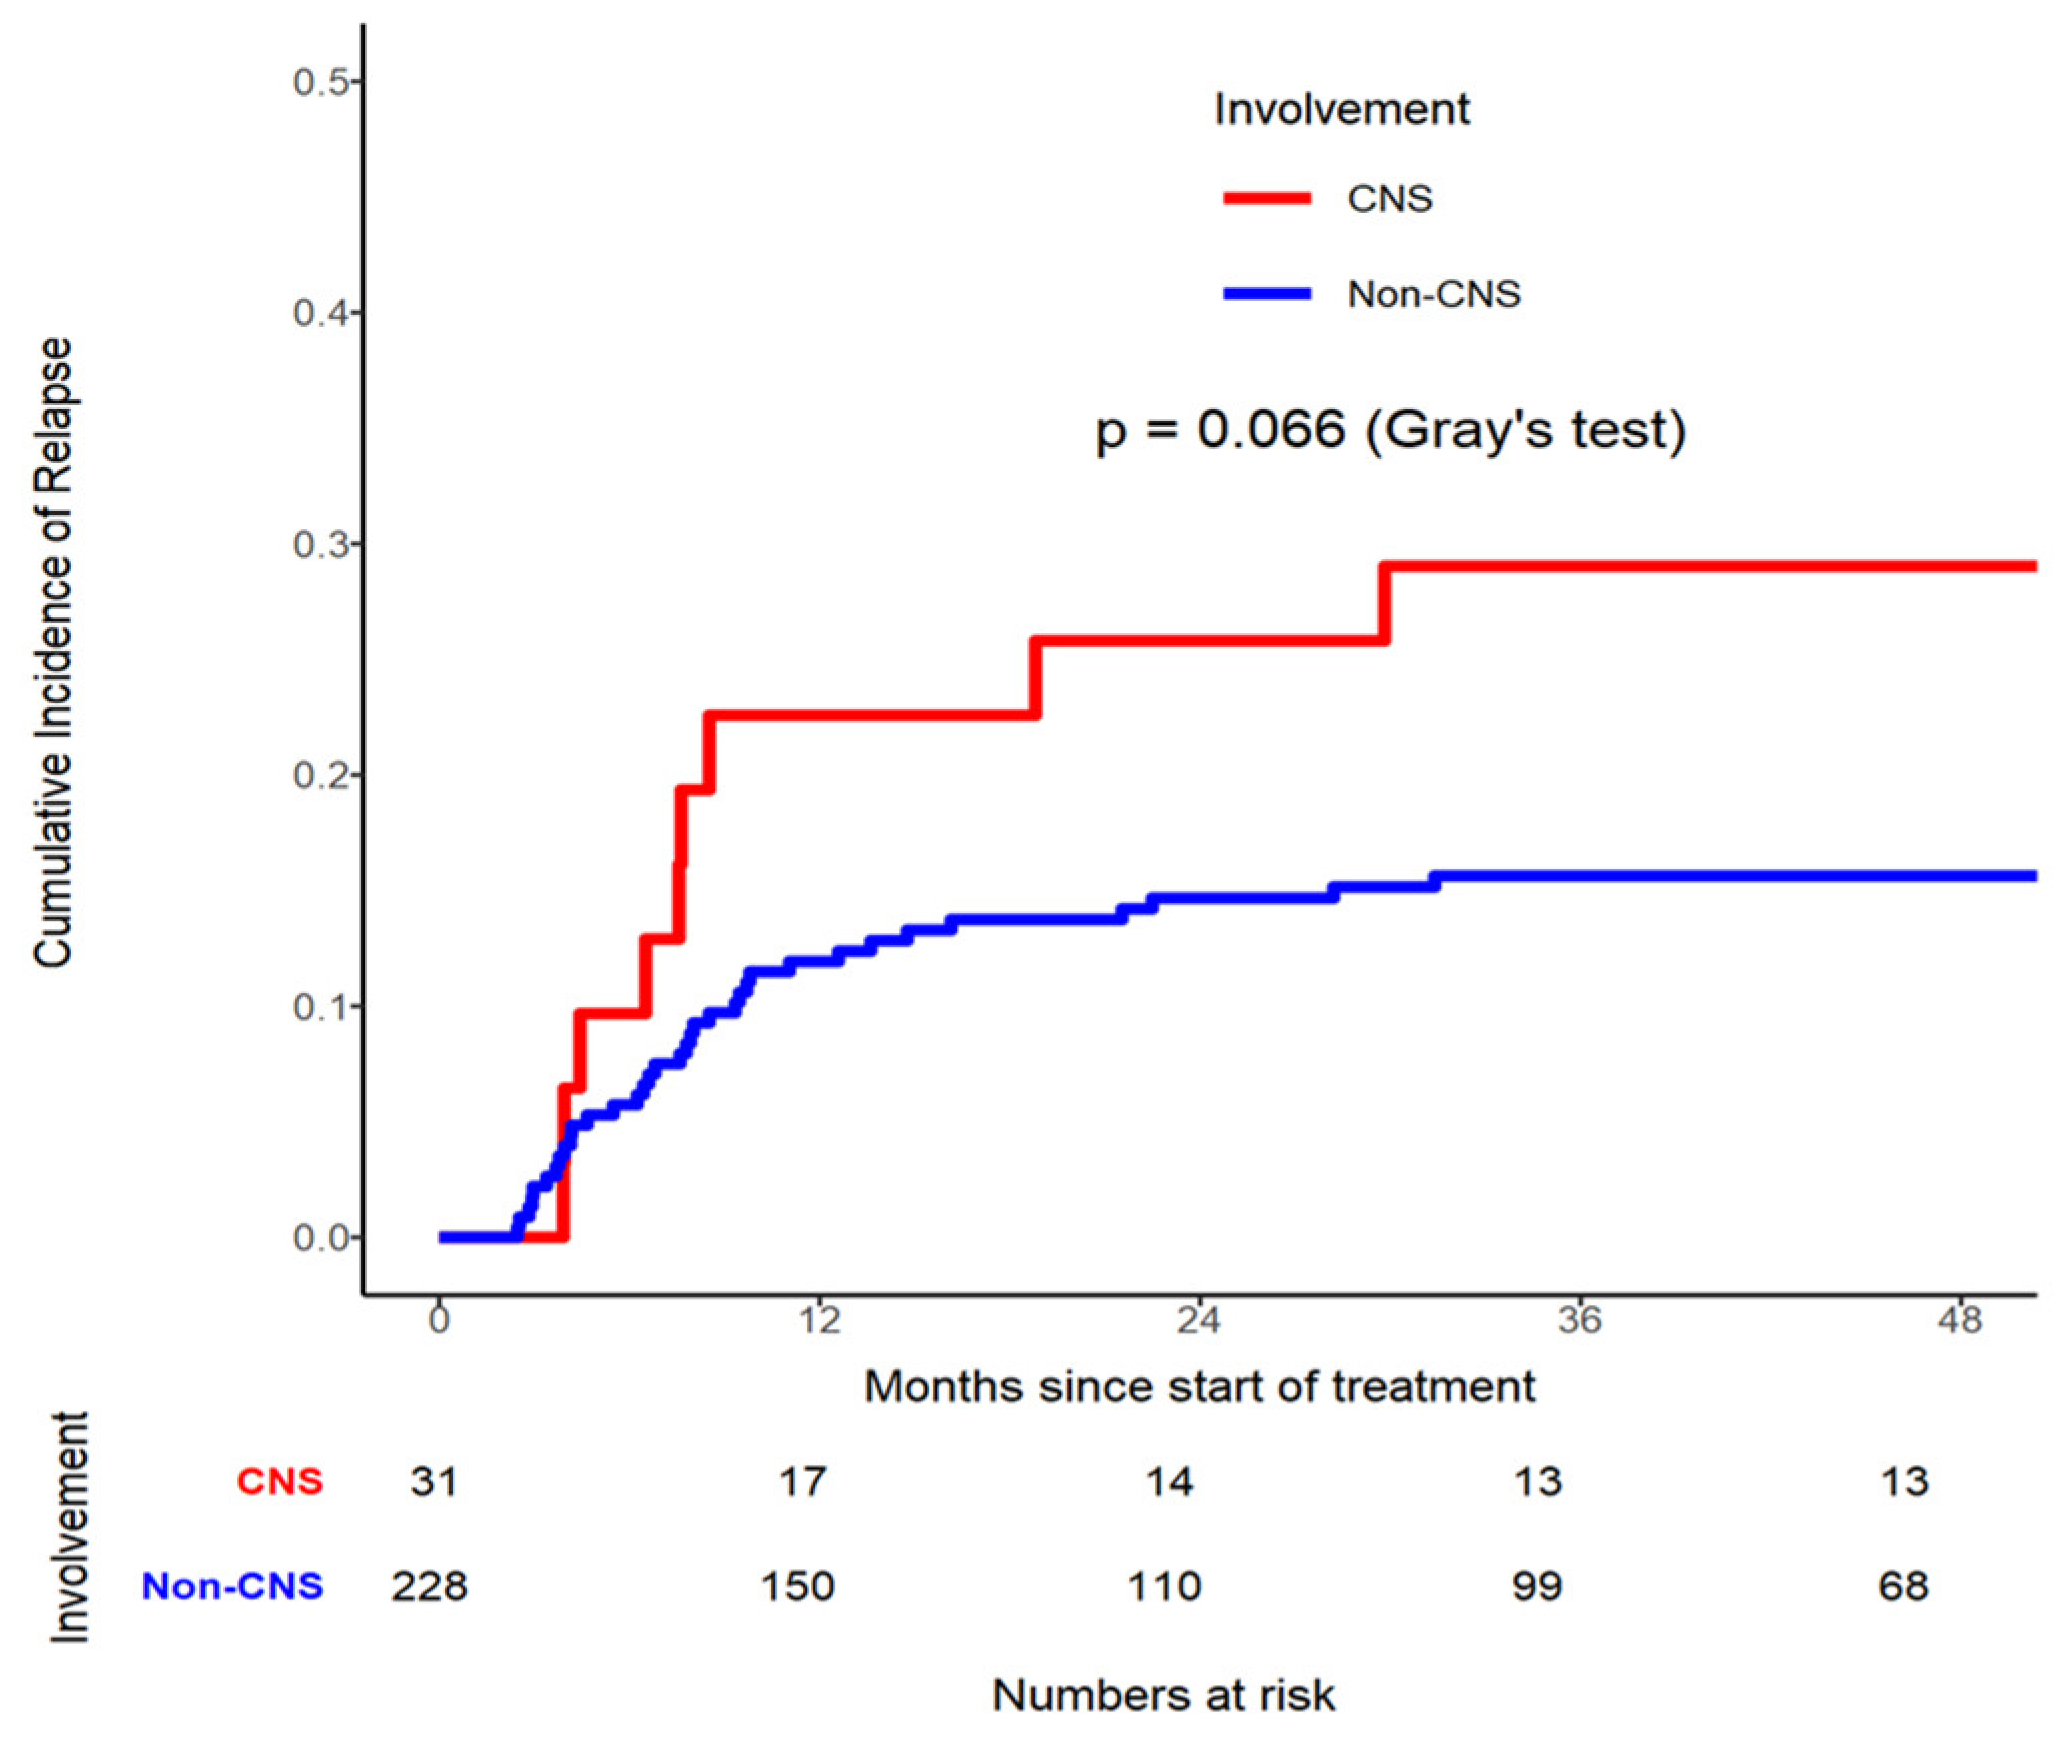
A CIR analysis stratified by CNS involvement was conducted, which showed that the relationship between CNS+ and CNS- patients was not significantly different (p=0.0662) in
Figure 1. The CIR rate in CNS+ patients at month 36 was 0.290 (95% CI 0.142- 0.457), compared to CNS- 0.156 (95% CI 0.112 - 0.207). Four (12.9%) of the 31 patients who had CNS+ at diagnosis developed CNS relapse (
Figure 1).
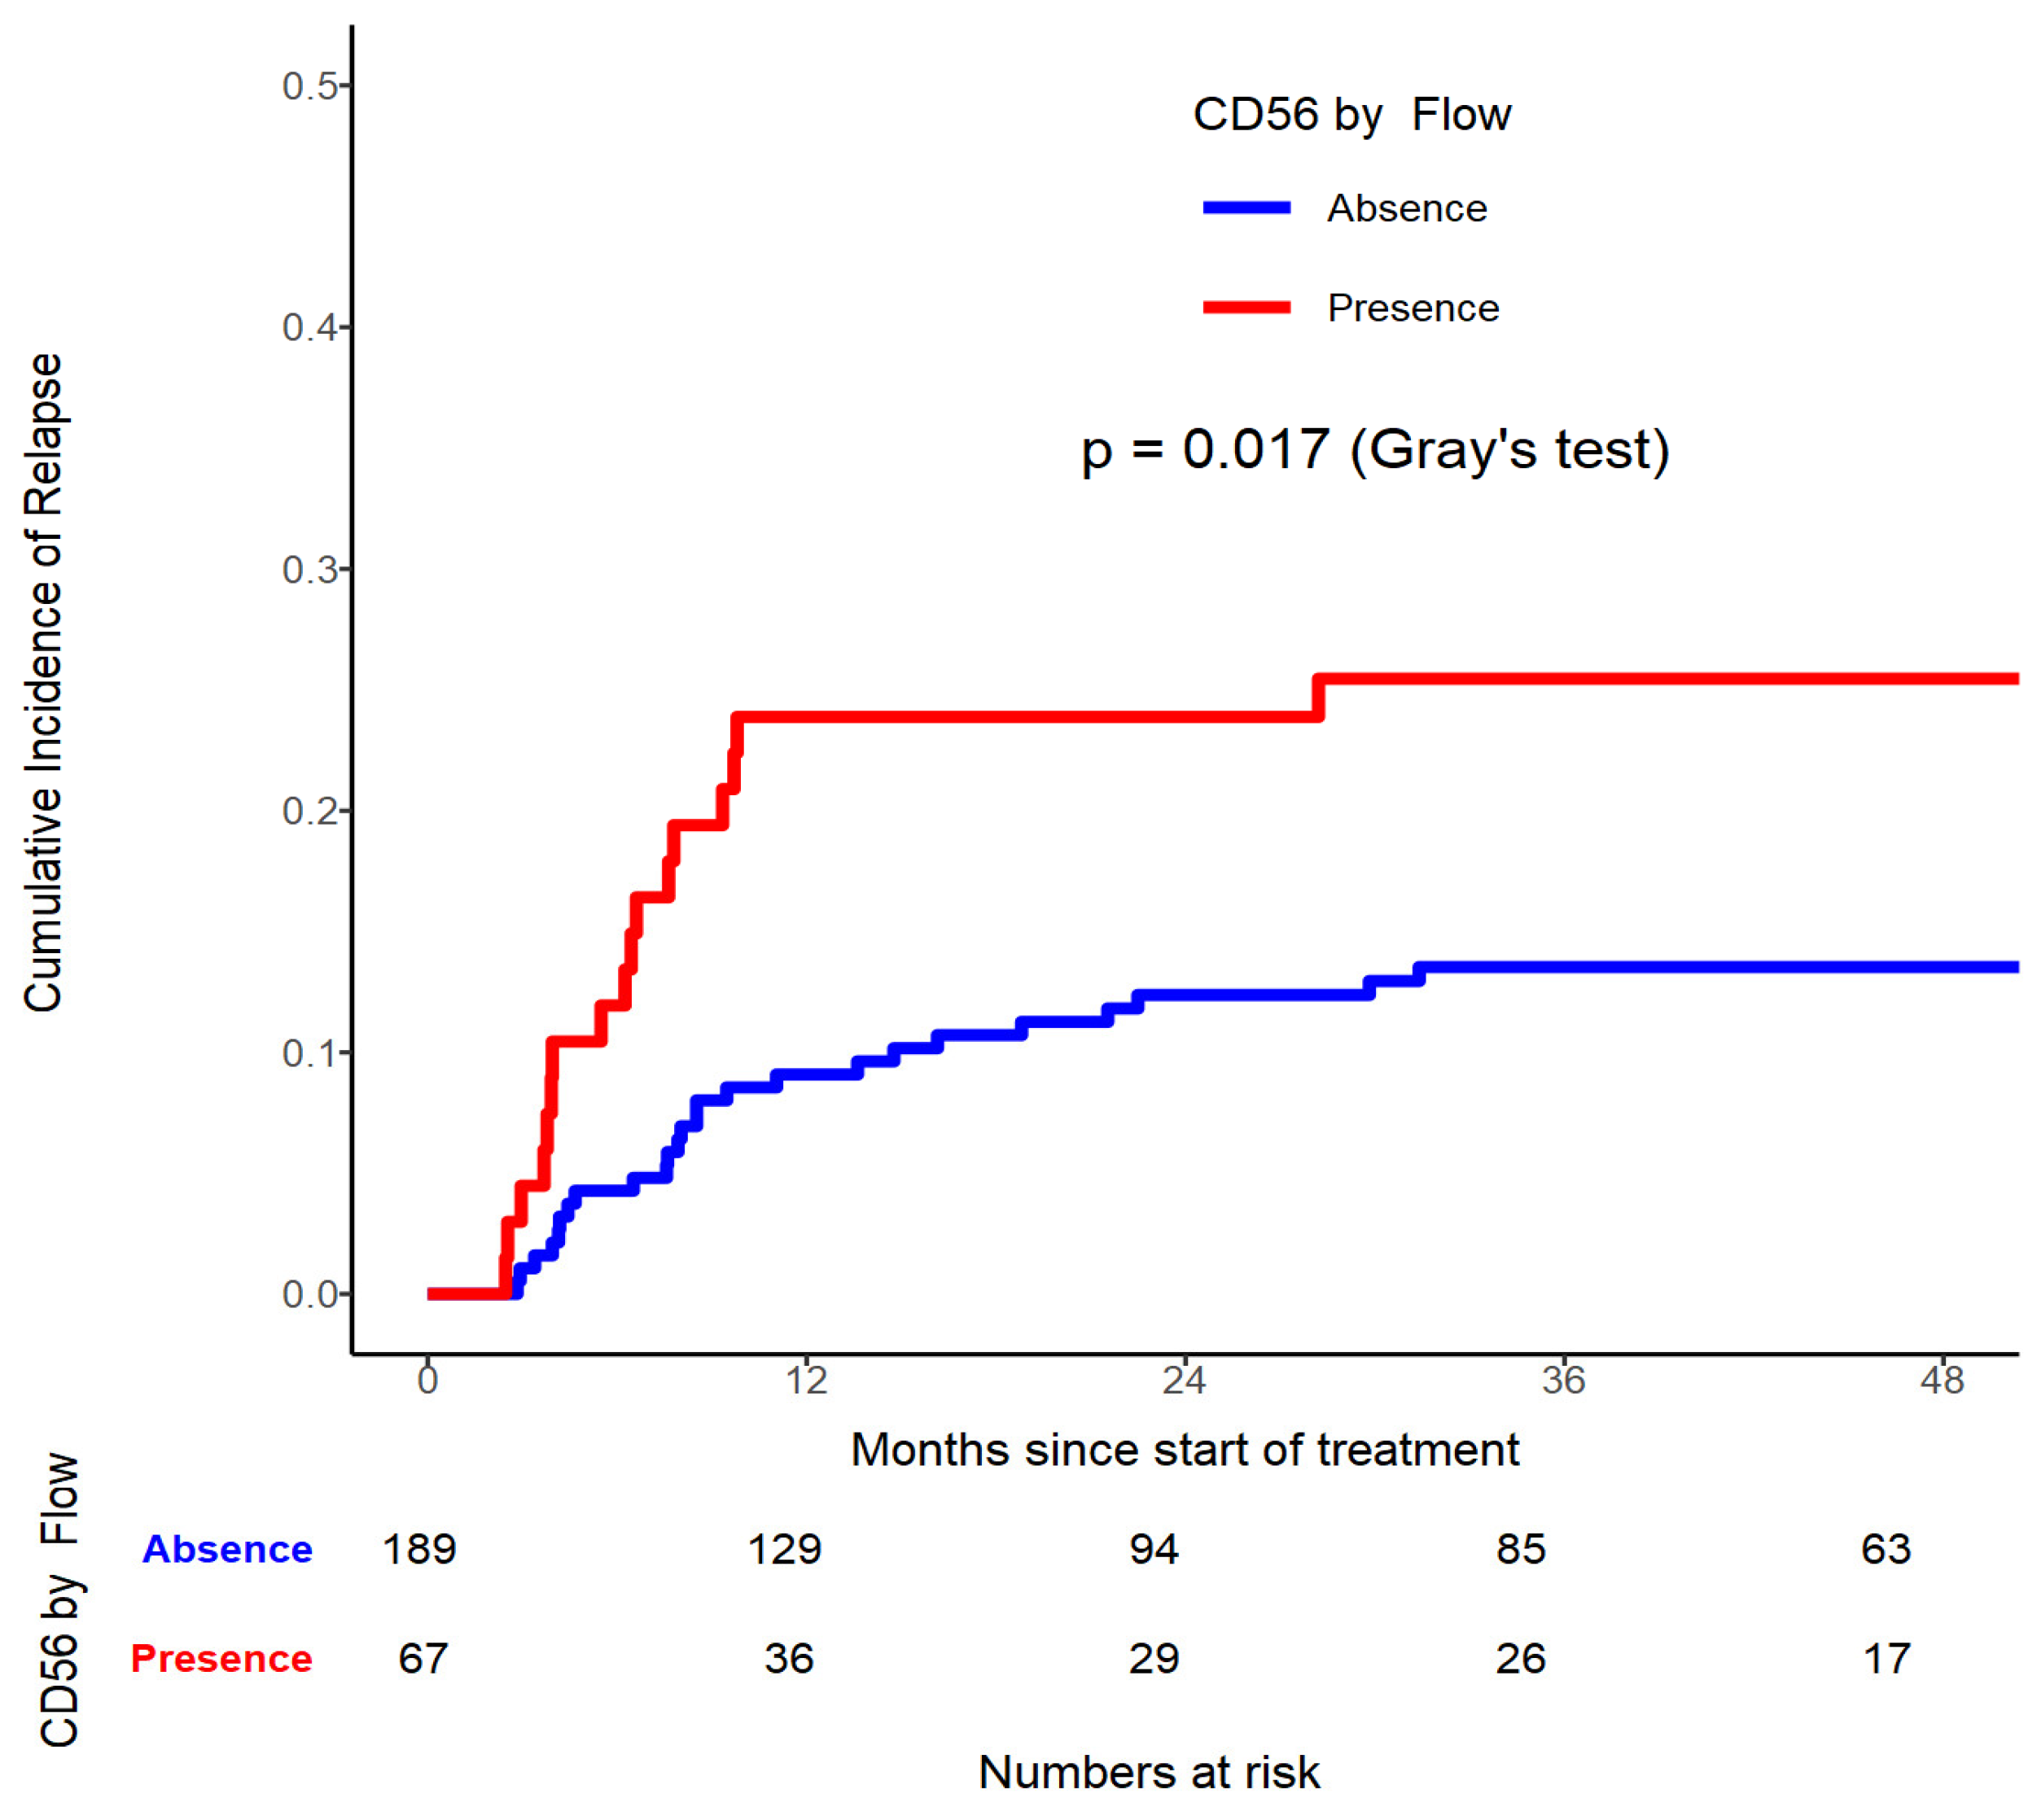
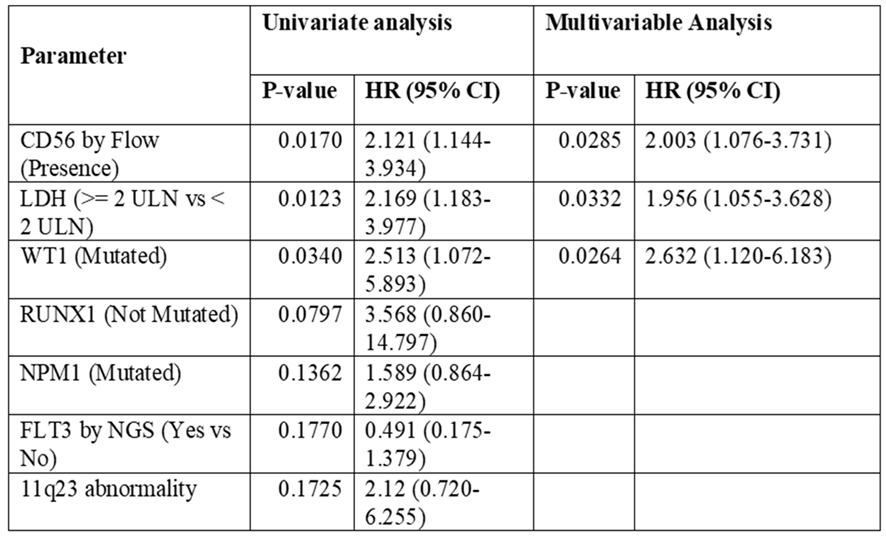
On the contrary evident by univariate analysis, when selectively targeting CD56 by Flow, patients with CD56 presence had significantly higher relapse risk (p=0.017,
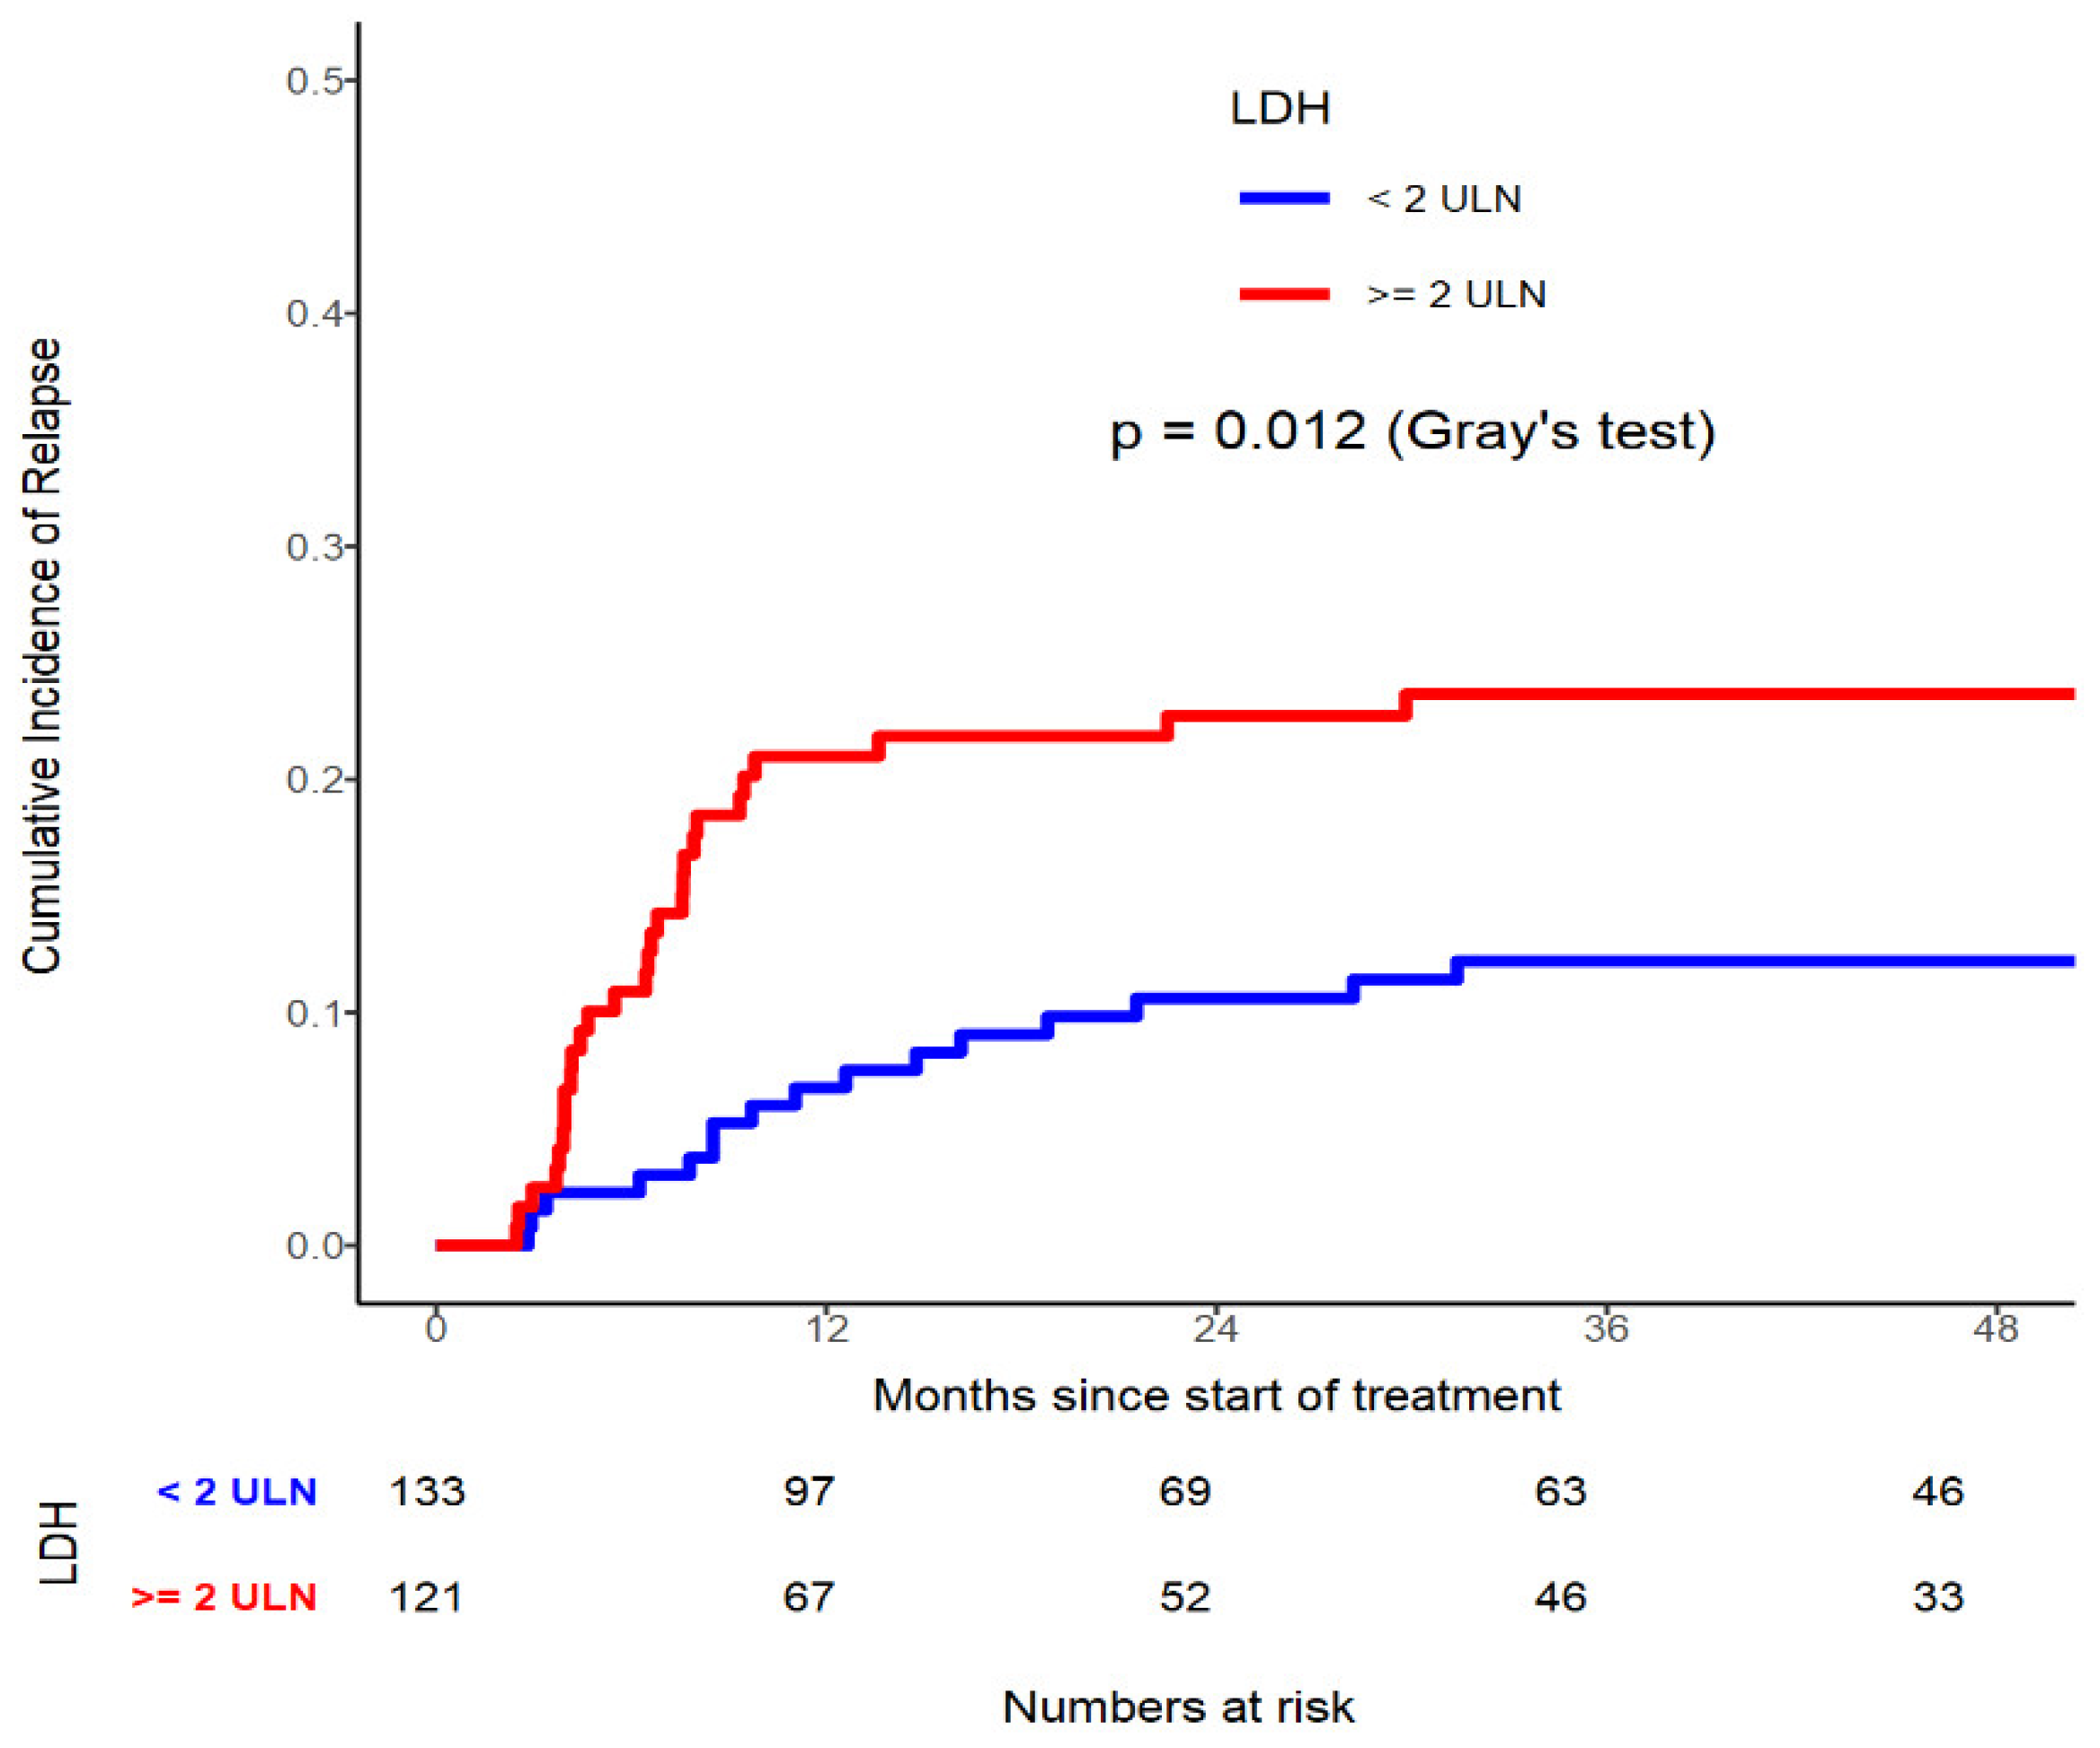
Table 5). Similarly in patients who possess LDH≥ 440U/L had significantly higher CIR compared to those with < 440U/L: (p=0.012,
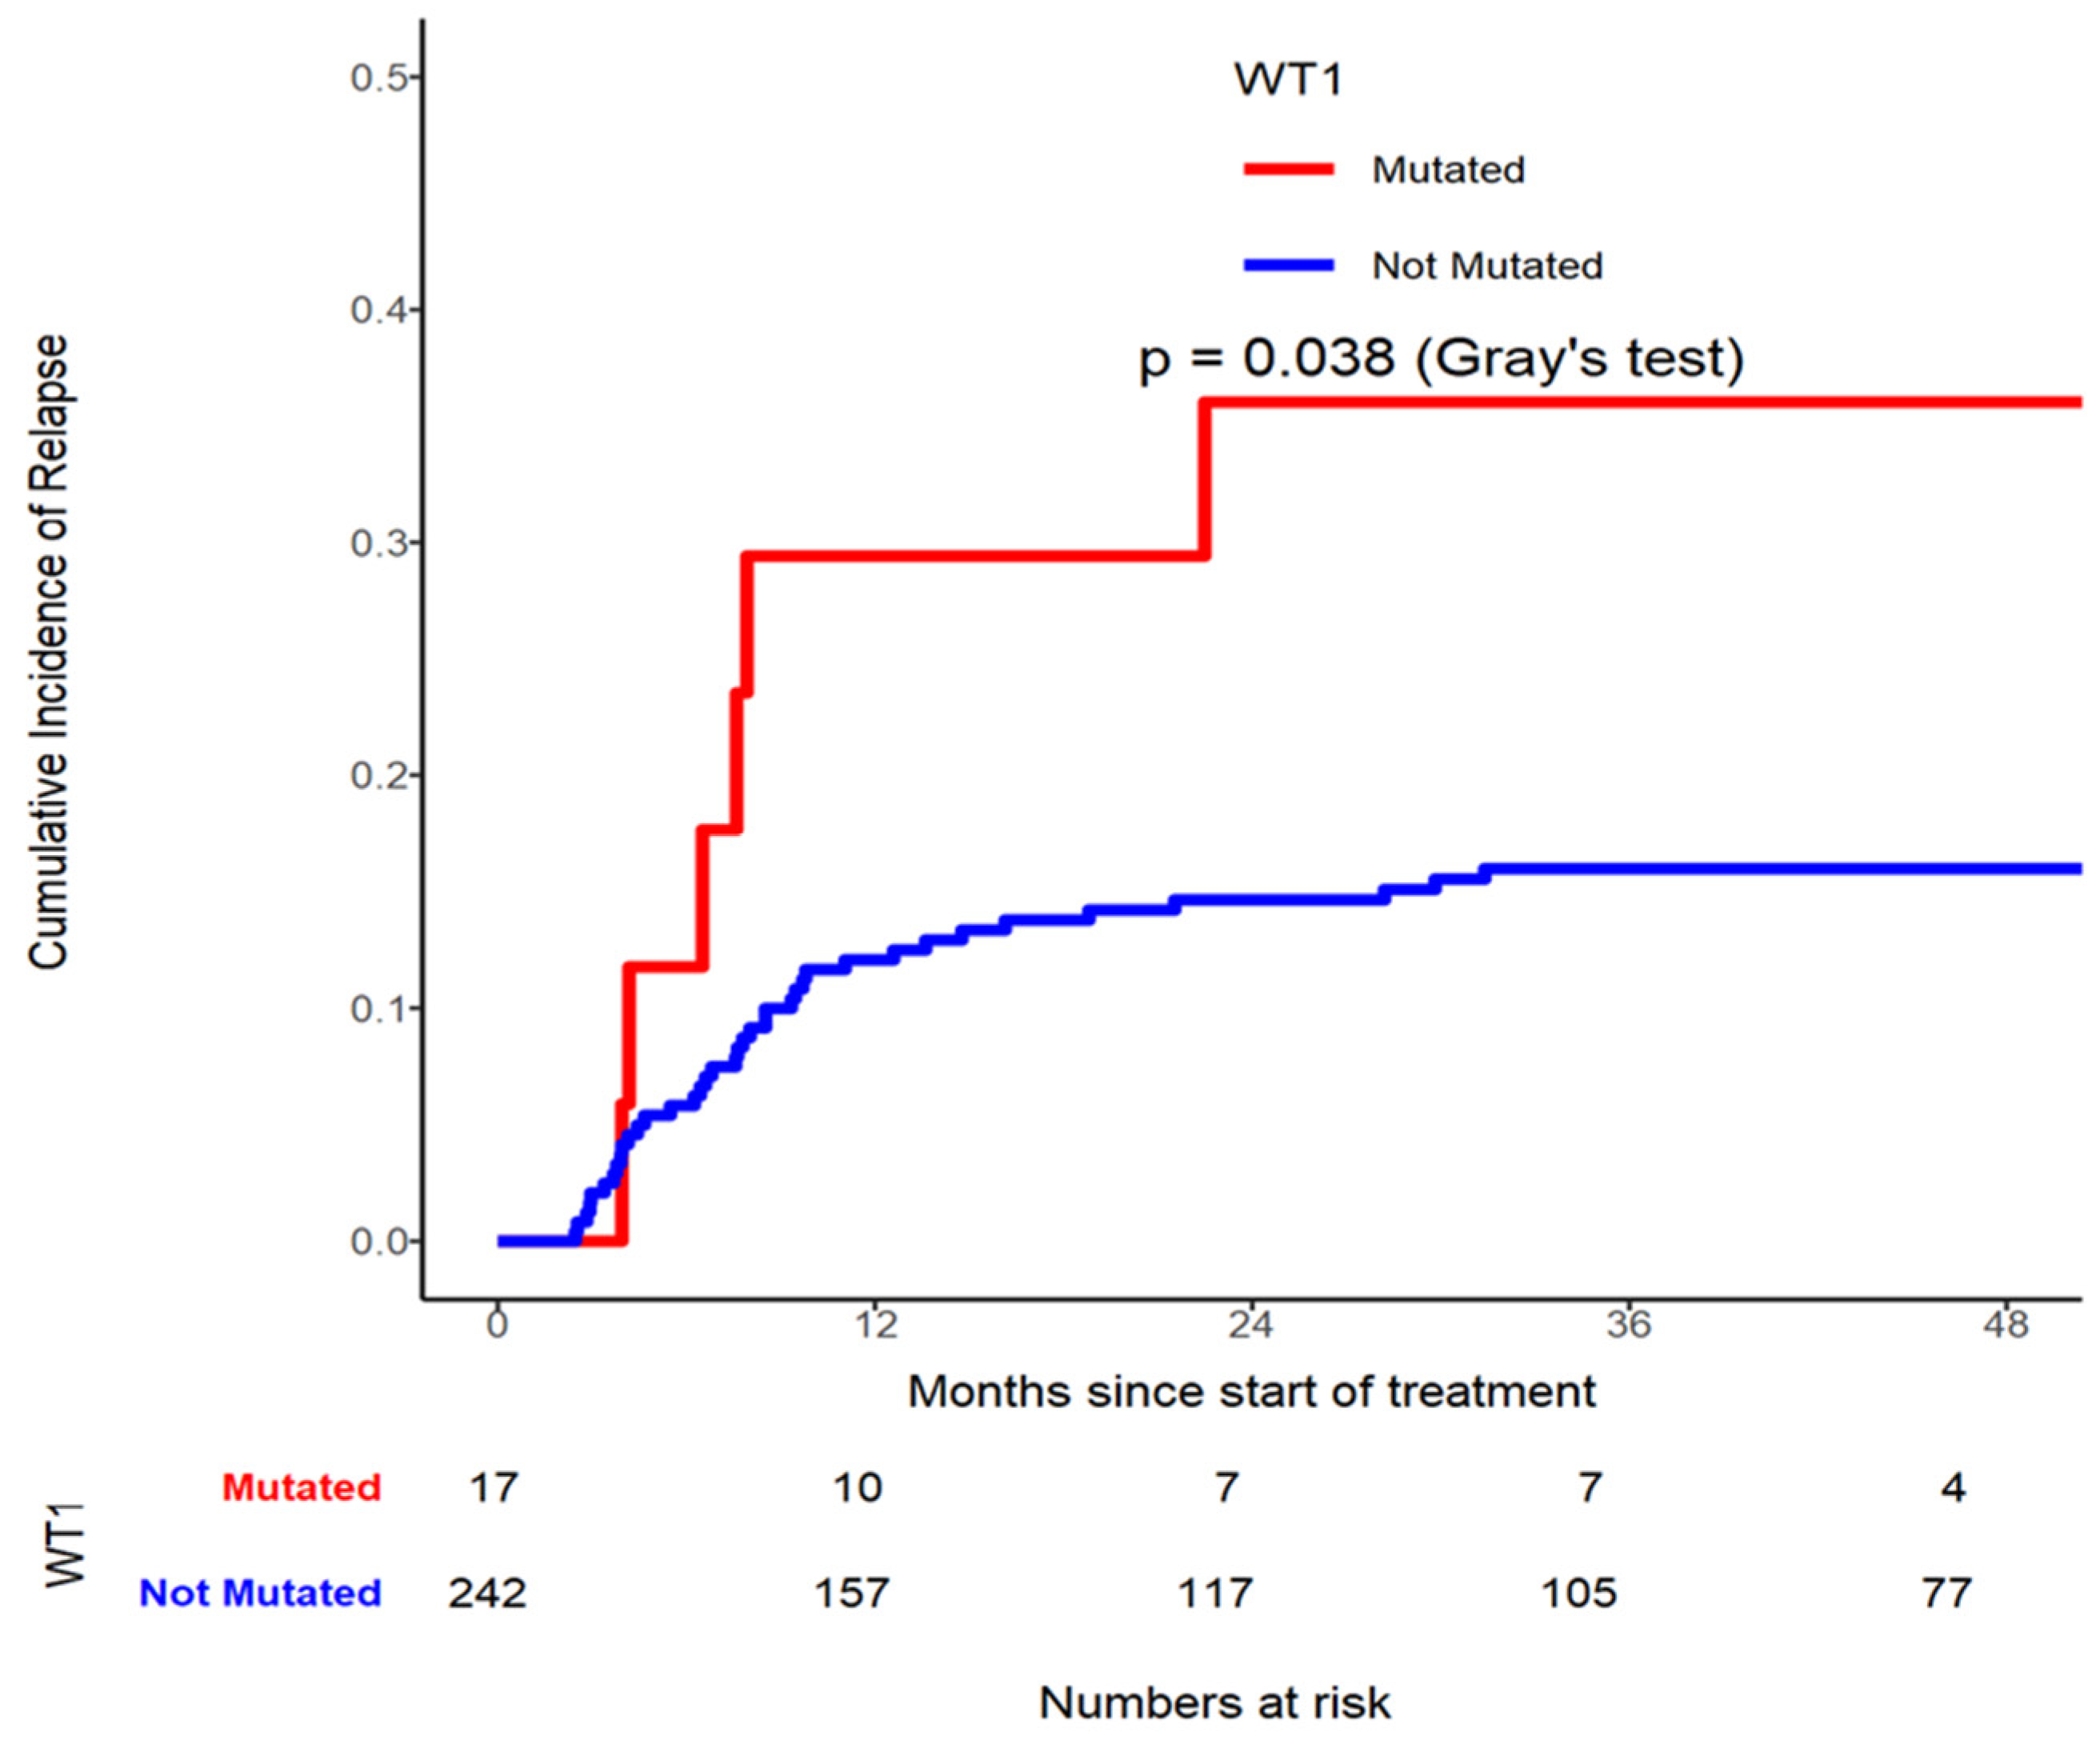
Table 5). In addition, WT1 mutated patients had higher CIR risk (p=0.038, Grey’s test (
Figure 4)) compared to those not mutated gene (
Table 5,
Figure 2, 3 and 4). On multivariable analysis CD56 by Flow (HR=2.003, 95% CI 1.076-3.731, p=0.0285), LDH≥ 440U/L (HR=1.956, 95% CI 1.055-3.628, p=0.0332), and WT1 mutated (HR=2.632, 95% CI 1.120-6.183, p=0.0264) were found to be significantly contributing to have a higher CIR rate.
4.5. Univariate and Multivariable Analysis on Risk Factors for Overall Survival
The median follow-up period was 30 (range 1-85) months.
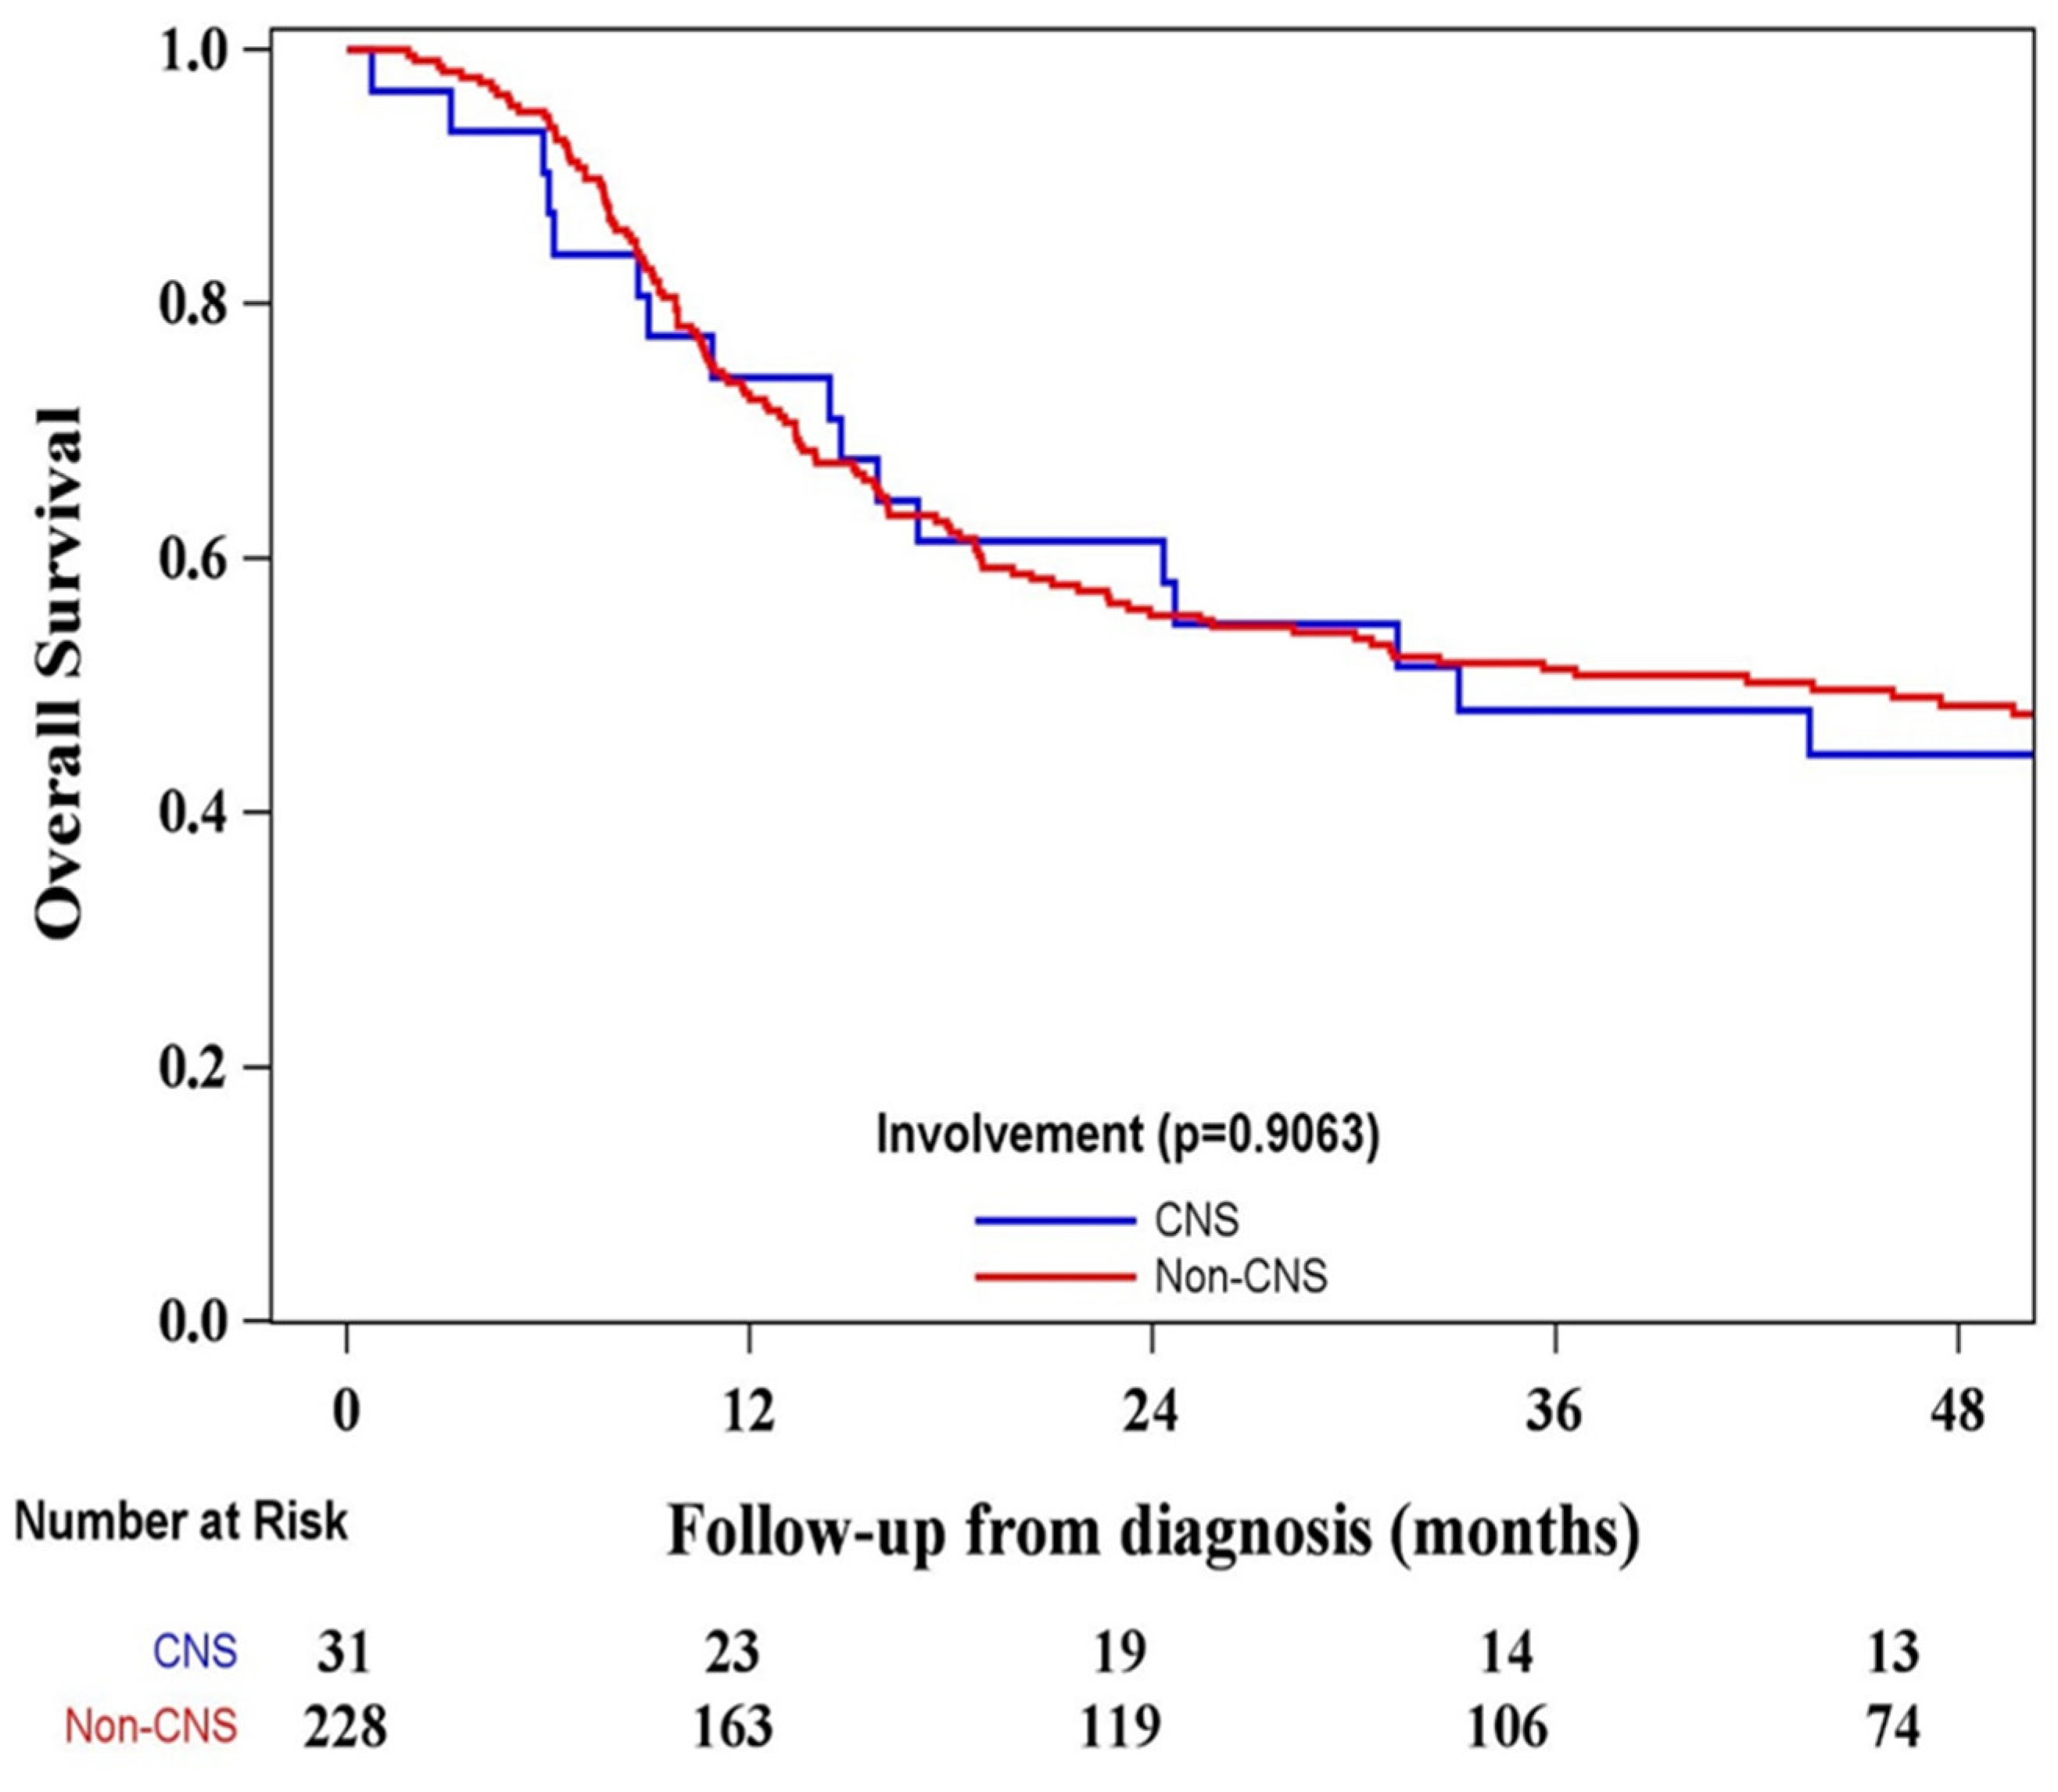
59% (n= 259) of all patients was included in this analysis. The 1-year OS of the whole population was 73% (95% CI 0.668- 0.777) (
Figure 5).
Figure 5.
OS distribution stratified by CNS Involvement.
Figure 5.
OS distribution stratified by CNS Involvement.
Figure 6.
Mutational Landscape of AML patients with CNS positive disease at presentation.
Figure 6.
Mutational Landscape of AML patients with CNS positive disease at presentation.
When we examined the OS there was no significant difference between CNS+ and CNS- patient cohorts (p=0.9063)
Figure 5.
5. Discussion
The incidence of CNS+ in newly diagnosed adult AML is not clear. The incidence rate of 11.97% CNS+ in our patient population is moderate in comparison to the recently reported rates that ranged widely (<1% vs 32%) [
1,
6,
11,
13]. One raises the question of the true rate of CNS+ at presentation
6.
The criteria for conducting an LP in AML varied. While laboratory results are pending, the status of the patient’s signs and symptoms may change over a short period of time post hospital admission, affecting the subsequent decision to perform LP. In the events where patients are being ruled in for LP, the following steps are taken. We have included brisk laboratory reports on WBC, CD56 positivity, mounting neurological signs and symptoms or the combination of the above. Virijevic M. et al
. [
14] reported that CD56 is identified as the most important risk factor for CNS disease at diagnosis by multivariable analysis.
Our clinical observations provided support that patients diagnosed with CNS involvement fair worse outcome. However, the published data to date have argued that on the one hand patients identified with CNS involvement suffered poorly [
15], whereas other reports disputed indifference irrespective of CNS status [
5,
12,
16]. It is reasonable to assume that there will always be variations in every uniquely designed study (e.g.
, non-controlled trials), resulting in diverse conclusions.
5.1. Risk Factors in the Development of CNS Disease
One potential risk factor attributable to CNS disease in AML patients is the high WBC counts and/or high blast counts (76 vs. 53) (
P = 0.0202). Our current practice is consistent with a report advocating for LP in patients with higher WBC counts greater than 40 x10
9/L [
17]. This is one of the parameters we relied on as a trigger for conducting LP at diagnosis. We incorporated the use of the Youden Index in determining the potential value of the diagnostic test using higher WBC threshold [
18]. We concluded that WBC count at ≥100 x10
9/L (P<0.0001) can be considered as an alert for LP eligibility. Elsewhere on this issue, Alberta Health Services identified AML patients with CNS involvement fitting for LP for those having hyperleukocytosis (WBC >40), elevated LDH, chromosomal 11 abnormality among other risk factors [
19]. In a retrospective study, an LP eligibility is considered for CNS symptomatic patients characterized with increased WBC counts (≥30 x10
9/L), FLT3 mutation, CD56 and CD15 antigen expression, younger age and monocyte phenotype [
14]. One can appreciate that not all the risk factors are being considered equally at risk for CNS disease, and for the same token, being incorporated for the purpose of initiating LP, including the various WBC threshold levels discussed thus far. Our study results indicated that NPM1 mutated vs. not mutated (p=0.0053), elevated LDH (p=0.048) and 11q23 abnormality (p=0.0096) in addition to high WBC, also stood out as significant risk factors for CNS disease under multivariable analysis, and that LP should be initiated (
Table 4).
MLL mutations or rearrangements of 11q23 are prevalent in adult AML associated with CNS involvement. Chromosome 11 and inv16 are apparent risk factors in AML [
1]. It is interesting that FLT3 mutated vs not mutated as a single entity did not pose a significant risk for CNS+ (P=0.1226) in our report. However, when a patient presented with WBC (≥100) and FLT3 mutation, its impact on the risk of CNS disease appeared to have enhanced significantly (12.9% vs. 3.5%, p=0.0196) (Table3B). The same is seemingly true for patients with the following risk factor combinations simultaneously, such as WBC&NPM1, LDH&NPM1, WBC&LDH, WBC&LDH&NPM1, and even FLT3&WBC, the risk for CNS infiltration heightened significantly (
Table 3B). Interestingly, in addition to high WBC counts and high LDH levels, ethnicity could play a role in predicting CNS involvement [
4].
Molecular markers such as NPM1 mutations, FLT3 mutations either alone or in coexistence by NGS and PCR, are implicated for both primary and secondary myeloid infiltration of the CNS [
8]. Their presence with the elevated-level of FLT3-ITD allelic ratios (≥0.5) are more commonly seen in this group of patients. We observed 10 (29.4%) CNS+ patients harbouring both NPM1 and FLT3- ITD mutations concurrently, whereas FLT3-ITD alone consisted of 14 (41.2%) samples. Our experience characterized by the strong presence of NPM1 at diagnosis is indicative of CNS+ risk. The frequency of NPM1 mutated gene occurrence observed in our study was high at 28.3% (n=123). When compared, the CNS+ portion of the NPM1 mutated form alone was significantly higher (p=0.0053 [50% (n=16) than CNS- group 26.6% (n=107)]. In terms of cytogenetics, 11q23 translocation was the only abnormality found with a significant difference between groups (p=0.0139) (
Table 3A). This is consistent with the two findings [
1,
5]. However, one other author showed conflicting results [
6]. Certain authors [
15,
20,
21] have documented not only 11q23 associated with increased incidence of CNS+, but also the presence of this abnormality posed significant risk of isolated CNS relapse with poor outcome. At this juncture, our data showed that prominent WBC count at ≥100, NPM1, CD56, LDH (≥2ULN), and 11q23 abnormality are risk factors for CNS involvement, and their presence along with neurological symptoms at diagnosis can be considered for LP.
5.2. Relapse Incidence in CNS+ vs. CNS- Patients
CNS relapse is well defined [
9]. In the course of disease, it is said to be more prevalent to find CNS+ at relapse/refractory in comparison to that at the time of initial diagnosis [
22]. Our incidence rate of CNS relapse is only slightly higher (4 patients, 12.9%) compared to the initial CNS+ group of 31 patients (11.97%). Our CNS+ patient cohort at 12, 24, 36, and at 48 months showed a similar relationship when compared to the CNS- cohort in terms of CIR (p=0.066) (
Figure 1). That is, CNS+ status of whether it is positive or negative did not serve as a predictor for CIR. Having that said, intuitively, patients endured from their preliminary CNS disease should have higher likelihood of recurrent disease despite treatment. For instance, in a cohort of AML patients diagnosed with CNS+ prior to initial treatment, a number of risk factors including high LDH level, FAB M5, AML relapse, FLT3-ITD mutations, other EMD and complex karyotype were subsequently identified as prognostic indicators [
6]. CNS infiltration with complex karyotype before HSCT at diagnosis is predictive of CNS relapse [
23,
24]. CNS relapse was associated with high LDH (3% vs 0%, p=0.06), lysozyme >30 (8% vs 1%, p=0.06), FAB M4–M5 (5% vs 1%, p=0.04) and in earlier period of transplant (5% vs 0.3%, p<0.01).
While CNS relapse is said to be more prevalent in patients with 11q23 abnormality than without CNS relapse, it was found positive in only one of our four patients (25%) described above, who had undergone Allo-HSCT and suffered relapsed post, and died of progressive disease [
5]. In younger patients with high WBC (median 79.2 x10
9/L), chromosome 11 abnormality among other risk factors are at significantly higher risk for CNS relapse [
21]. CD56+ is found frequently in any phases of the disease and patients tend to have higher CNS relapse rates and overall relapse rates [
7,
25]. This is certainly true in our patients who exhibit CD56 positivity when compared to those without this marker in the multivariable model (p=0.0285). This is also true if the concurrent risk factor is hyperleukocytosis [
26].
While prognostic value of surface antigen expression is not definitively proven, CD56 has been shown to have shortened remission rates and OS in AML patients with t(8;21) [
15,
27,
28]. However, we found no difference in terms of CIR between groups post induction. Perhaps the sample size of the original CNS cohort is too small to see the difference.
Same argument is said in a subset of our patients harbouring significantly higher LDH (≥2 ULN) level (p=0.0332) resulting in elevated CIR, qualifying for preventative measures especially when other risk factors are present [
29]. CNS relapse is one of the worse clinical presentations of AML relapse, and it often occurred in the Core-Binding factor AML [
30].
5.3. Survival Impact in CNS+ vs. CNS- Patients
With reference to CNS relapse on OS, our data on the follow up period showed that the CNS+ patients 0.34913 (95% CI 0.09447 – 0.60379) had similar experience, as it compared to those with CNS- 0.23944 (95% CI 0.16366 – 0.31522) at the initial onset. When we examined the OS rate in patients with events, those with CNS+ corresponded closely to CNS- groups at 12 (0.77 vs. 0.68), 24 (0.61 vs.0.50) and 36 (0.47 vs.0.45) months. We found no difference between groups and its impact on CRI and OS over 36 months period. In younger patients, CNS relapse exerts no significant effect on OS when compared with the entire study population [
20]. Del Principe et al.[
11]stated that there was a significantly shorter five-year DFS in CNS + patients, in the presence of high cumulative relapse rate (78%). As mentioned earlier that a recent study of 11 ECOG-ACRIN clinical trial data demonstrated that CNS + status (CNS + or CNS- with EMD) did not influence initial response or OS outcome [
12]. Our findings reflected similar results from these studies.
5.4. Limitation
This retrospectively abstracted study with data represented only those high-risk patients who have undergone LP procedure. The methodology excluded patients treated with low intensity induction chemotherapy, and those with isolated EMD. Since our institution does not routinely perform LP to all AML patients, as the result, only 259 patients experienced any one of these entities alone or in combination are subject to LP, CNS symptoms, CD56+ or elevated WBC counts at the initial assessment were scheduled for LP. Subsequently, 31 patients were identified with CNS positivity. This resulted in potential study bias, and hence a relatively high incidence of CNS+.
6. Conclusions
There is a lack of available guidelines utilizing specific risk factors toward performing LP given the clinical characteristics presented on admission. Our analysis indicated that the characteristic features for the purpose of diagnosing CNS involvement is quite diverse. The inconsistent pattern in the “risk factors” making therapeutic decisions difficult. The jury is still out as to whether CNS leukemia impacts clinical outcome. However, in terms of CNS involvement and potential risk factors, our results suggested that patients with higher WBC count (≥100), higher bone marrow blasts, LDH ranges (2≥ULN), NPM1+ and 11q23 positivity are triggers for conducting LP. Risk factors in combination (
Table 3) may serve as potential triggers for initiating LP. In the presence of CNS infiltration, the data on the relapse incidence such as CD56, LDH and WT1 appeared to be significantly higher in this group than in patients without CNS involvement. However, CNS involvement does not influence the outcome of CIR in this study. As for the impact on the overall survival outcome, our patients with CNS infiltration appeared to fair equally with those of CNS negative cohort [
14]. Despite positive findings of the above NGS panel did not predict CNS positivity. Larger sample size, prospective design study including all potential risk factors is needed, in order to better understand the incidence and outcome of CNS involvement in AML.
Author Contributions
G S D-R performed the research, HS designed the research study, JTS, HS, G S D-R, JS, AB and EGA analyzed the data. EGA also provided statistical analysis, G S D-R, TY, SC, KY, VG, MM, DM, AS and AS reviewed the manuscript and contributed toward patient assessment and enrolment JTS wrote the manuscript.
Funding
Please add: “This research received no external funding” The funding of this retrospective chart review is provided by the Division of the Medical Oncology & Hematology services (DMOH) at the Princess Margaret Cancer Centre.
Institutional Review Board Statement
Princess Margaret Cancer Centre, Cancer Research Ethics Borad approved this retrospective chart review (all experimental protocols). Coordinated Approval Process Clinical Research (CAPCR): CAPCR-ID: 19-5397.0.
Informed Consent Statement
The consent for publication was not applicable since we did not use any identifiable information. This study was not a prospective human subject study but rather a retrospective in nature, therefore informed consent was not necessary or unable to obtain from all subjects and/or their legal guardian(s). The study population was in acute myeloid leukemia with relatively short life expectancy.
Data Availability Statement
The study data and materials are available from the senior author Hassan Sibai.
Acknowledgments
Not applicable for this section
Conflicts of Interest
The authors declare no competing interests
Authorship statement
All authors reviewed and provided final approval for submission and publication. We confirmed that all methods were carried out in accordance with relevant guidelines and regulations. None of the authors has any scholarship-sponsorship
References
- Shihadeh F, Reed V, Faderl S, L. Medeiros J, Mazloom A, Hadziahmetovic M et al. Cytogenetic Profile of Patients with Acute Myeloid Leukemia and Central Nervous System Disease. Cancer 2012;118:112-7. [CrossRef]
- Castagnola C, Nozza A, Corso A, Bernasconi C. The value of combination therapy in adult acute myeloid leukemia with central nervous system involvement. Haematologica. 1997; 82:577–580. [CrossRef]
- Peterson BA, Brunning RD, Bloomfield CD, et al. Central nervous system involvement in acute nonlymphocytic leukemia. A prospective study of adults in remission. Am J Med. 1987; 83:464– 470. [CrossRef]
- Rozovski U, Ohanian M, Ravandi F, Garcia-Manero G, Faderl S, Pierce S, et al. Incidence of and risk factors for involvement of the central nervous system in acute myeloid leukemia. Leuk Lymphoma. 2015;56(5):1392-1397. [CrossRef]
- Cheng Chieh-Lung, Li Chi-Cheng, Hou Hsin-An, Fang Wei-Quan, Chang Chin-Hao, Lin Chien-Ting et al. Risk factors and clinical outcomes of acute myeloid leukaemia with central nervous system involvement criptin adults. BMC Cancer (2015)15:344. (Published on line May 2. 2015). [CrossRef]
- Alakel N, Stölzel F, Mohr B, Kramer M, Oelschlägel U, Röllig C. et al. Symptomatic central nervous system involvement in adult patients with acute myeloid leukemia. Cancer Management and Research 2017:9,97-102. [CrossRef]
- Deak D, Gorcea-Andronic N, Sas V, Teodorescu P, Constantinescu C, Iluta S A narrative review of central nervous system involvement in acute leukemias. Ann Transl Med 2021;9(1):68. [CrossRef]
- Patkowska E, Szczepaniak A, Barańska M, Kaźmierczak M, Paluszewska M, Jędrzejczak WW et al. Primary and Secondary Central Nervous System Involvement in Acute Myeloid Leukemia J Leuk 2019; 7: 257. [CrossRef]
- Bharucha J, Cao Q, Sachs Z, Smith A, Williams S , Amin K et al. Prognostic factors for clinical outcomes of patients with central nervous system leukemia. Hematol Oncol Stem Cell Ther 14 (2021) 240– 245. [CrossRef]
- Felix A, Leblanc T, Petit A Nelkem B, Bertrand Y, Virginie Gandemer V et al. Acute Myeloid Leukemia With Central Nervous System Involvement in Children: Experience From the French Protocol Analysis ELAM02. J Pediatr Hematol Oncol 2018;40:43–47. [CrossRef]
- Del Principe MI, Buccisano F, Soddu S, Maurillo L, Cefalo M, Piciocchi A et al.Involvement of central nervous system in adult patients with acute myeloid leukemia: Incidence and impact on outcome. Seminars in Hematology 55 (2018) 209–214. [CrossRef]
- Ganzel C, Lee J-W, Fernandez HF, Paietta EM, Luger SM, Lazarus HM, Cripe LD, Douer D, Wiernik PH, Rowe JM, Tallman MS, and Litzow MR. CNS involvement in AML at diagnosis is rare and does not affect response or survival: data from 11 ECOG-ACRIN trials. Blood Advances First Edition 1 October 2021; final version published online 12 November 2021. [CrossRef]
- Eckardt J-N, Stölzel F, Desiree Kunadt, Röllig C, Stasik S, Lisa Wagenführ L. et al. Molecular profiling and clinical implications of patients with acute myeloid leukemia and extramedullary manifestations. Journal of Hematology & Oncology (2022) 15:60. [CrossRef]
- Virijevic M, Irena Djunic I, Mitrovic M, Pantic N, Pravdic Z, Sabljic N, Novkovic A, Cvetovic M, Rajic J, Vidovic A, Todorovic-Balint M, Suvajdzic-Vukovic N. P567 Cemtral Nervous System involvement in adult patients with Acute Myeloid Leukemia – Incidence and Outcome Topic: 04. Acute myeloid leukemia - Clinical Marijana. HemaSphere | 2022; 6:S3. EHA2022 Hybrid Congress. HemaSphere, 2022;6:(S3):pages. The individual abstract DOIs can be found at https://journals.lww.com/hemasphere/pages/default.aspx.
- Chang H, Brandwein J, Yi Q-L, Chun K, Patterson B, Brien B. Extramedullary infiltrates of AML are associated with CD56 expression, 11q23 abnormalities and inferior clinical outcome. Leukemia Research 28 (2004) 1007–1011. [CrossRef]
- Tatarian J, Kenneth Byrd, Heather J. Male, Tara L. Lin. Central nervous system involvement in adult acute myeloid leukemia patients. Leukemia Research 118 (2022) 106882. [CrossRef]
- Cassileth PA, Sylvester LS, Bennett JM, Begg CB. High peripheral blast count in adult acute myelogenous leukemia is a primary risk factor for CNS leukemia. Journal of Clinical Oncology 6, no. 3 (March 01, 1988) 495-8. [CrossRef]
- Anders Kallner, in Laboratory Statistics, Methods in Chemistry and Health Sciences (Second Edition), 2018 (pages 117-129) 14.1 Youden Index.
- Alberta Health Services. CLINICAL PRACTICE GUIDELINE LYHE-006 Version 6. Acute Myeloid Leukemia Effective Date: July 2019. www.albertahealthservices.ca.
- Kalwinsky DK, Raimondi SC, Schell MJ, et al. Prognostic importance of cytogenetic subgroups in de novo pediatric acute nonlymphocytic leukemia. J Clin Oncol. 1990; 8:75–83. [CrossRef]
- Johnston DL, Alonzo TA, Gerbing RB, et al. Risk factors and therapy for isolated central nervous system relapse of pediatric acute myeloid leukemia. J Clin Oncol. 2005; 23:9172–9178. [CrossRef]
- Kwon JH, Koh Y-i· Yoon S-S, Park S, Kim I. Clinical outcome and efficacy of current anti-leukemic therapy for leptomeningeal involvement in acute myeloid leukemia. Int J Hematol (2016) 104:574–581. [CrossRef]
- Chen Q, Xiao-Lu Zhu, Xin Zhao, Xiao Liu, Hai-Xia Fu, Yuan-Yuan Zhang et al. Prognosis and risk factors for central nervous system relapse after allogeneic hematopoietic stem cell transplantation in acute myeloid leukemia. Annals of Hematology (2021) 100:505–516. [CrossRef]
- Montesinos P, Guillermo Martin, Mari-luz Perez-sirvent, Jaime Sanz et al. Incidence and Risk Factors for Central Nervous System Relapse in Adult Patients with Acute Myeloid Leukemia: A Single Center Experience. Blood (2006) 108 (11): 4579. [CrossRef]
- Chaudhri NA, Almhareb F, Walter CU, et al. Expression of CD56 in Acute Myeloid Leukemia (AML) Is Associated with Poor Outcome When Patients Treated with Stem Cell Transplant in Second Remission but Not in the First Remission. Blood 2011;118:4880. [CrossRef]
- Ono T, Takeshita A, Kishimoto Y, et al. Expression of CD56 is an unfavorable prognostic factor for acute promyelocytic leukemia with higher initial white blood cell counts. Cancer Sci 2014;105:97-104. [PMC free article] [PubMed] [CrossRef] [Google Scholar] [Ref list]]. [CrossRef]
- Alegretti AP, Matzenbacher Bittar C, Bittencourt R, Kirchner Piccoli A, Schneider L Lúcia, Silla M et al. The expression of CD56 antigen is associated with poor prognosis in patients with acute myeloid leukemia. Rev Bras Hematol Hemoter. 2011;33(3):202-6. [CrossRef]
- Baer MR, Stewart CC, Lawrence D, Arthur DC, Byrd JC, Davey FR. Expression of the Neural Cell Adhesion Molecule CD56 Is Associated with Short Remission Duration and Survival in Acute Myeloid Leukemia With t(8;21)(q22;q22). Blood, Vol 90, No 4 (August 15), 1997: pp 1643-1648.
- Jabbour E, Guastad Daver N, Short NJ, Huang X, Chen H-C, Maiti A et al. Factors associated with risk of central nervous system relapse in patients with non-core binding factor acute myeloid leukemia. Am J Hematol. 2017;92:924–928. [CrossRef]
- Ferrara, F, Palmieri S, Mele G. Prognostic factors and therapeutic options for relapsed or refractory acute myeloid leukemia. Haematologica 2004;89:998-1008.
|
Disclaimer/Publisher’s Note: The statements, opinions and data contained in all publications are solely those of the individual author(s) and contributor(s) and not of MDPI and/or the editor(s). MDPI and/or the editor(s) disclaim responsibility for any injury to people or property resulting from any ideas, methods, instructions or products referred to in the content. |
© 2024 by the authors. Licensee MDPI, Basel, Switzerland. This article is an open access article distributed under the terms and conditions of the Creative Commons Attribution (CC BY) license (http://creativecommons.org/licenses/by/4.0/).
