Submitted:
08 October 2024
Posted:
09 October 2024
You are already at the latest version
Abstract
Keywords:
1. Introduction
2. Materials and Methods
2.1. Cell Lines
2.2. Plasmid Construction and Establishment of Stable Transfectants
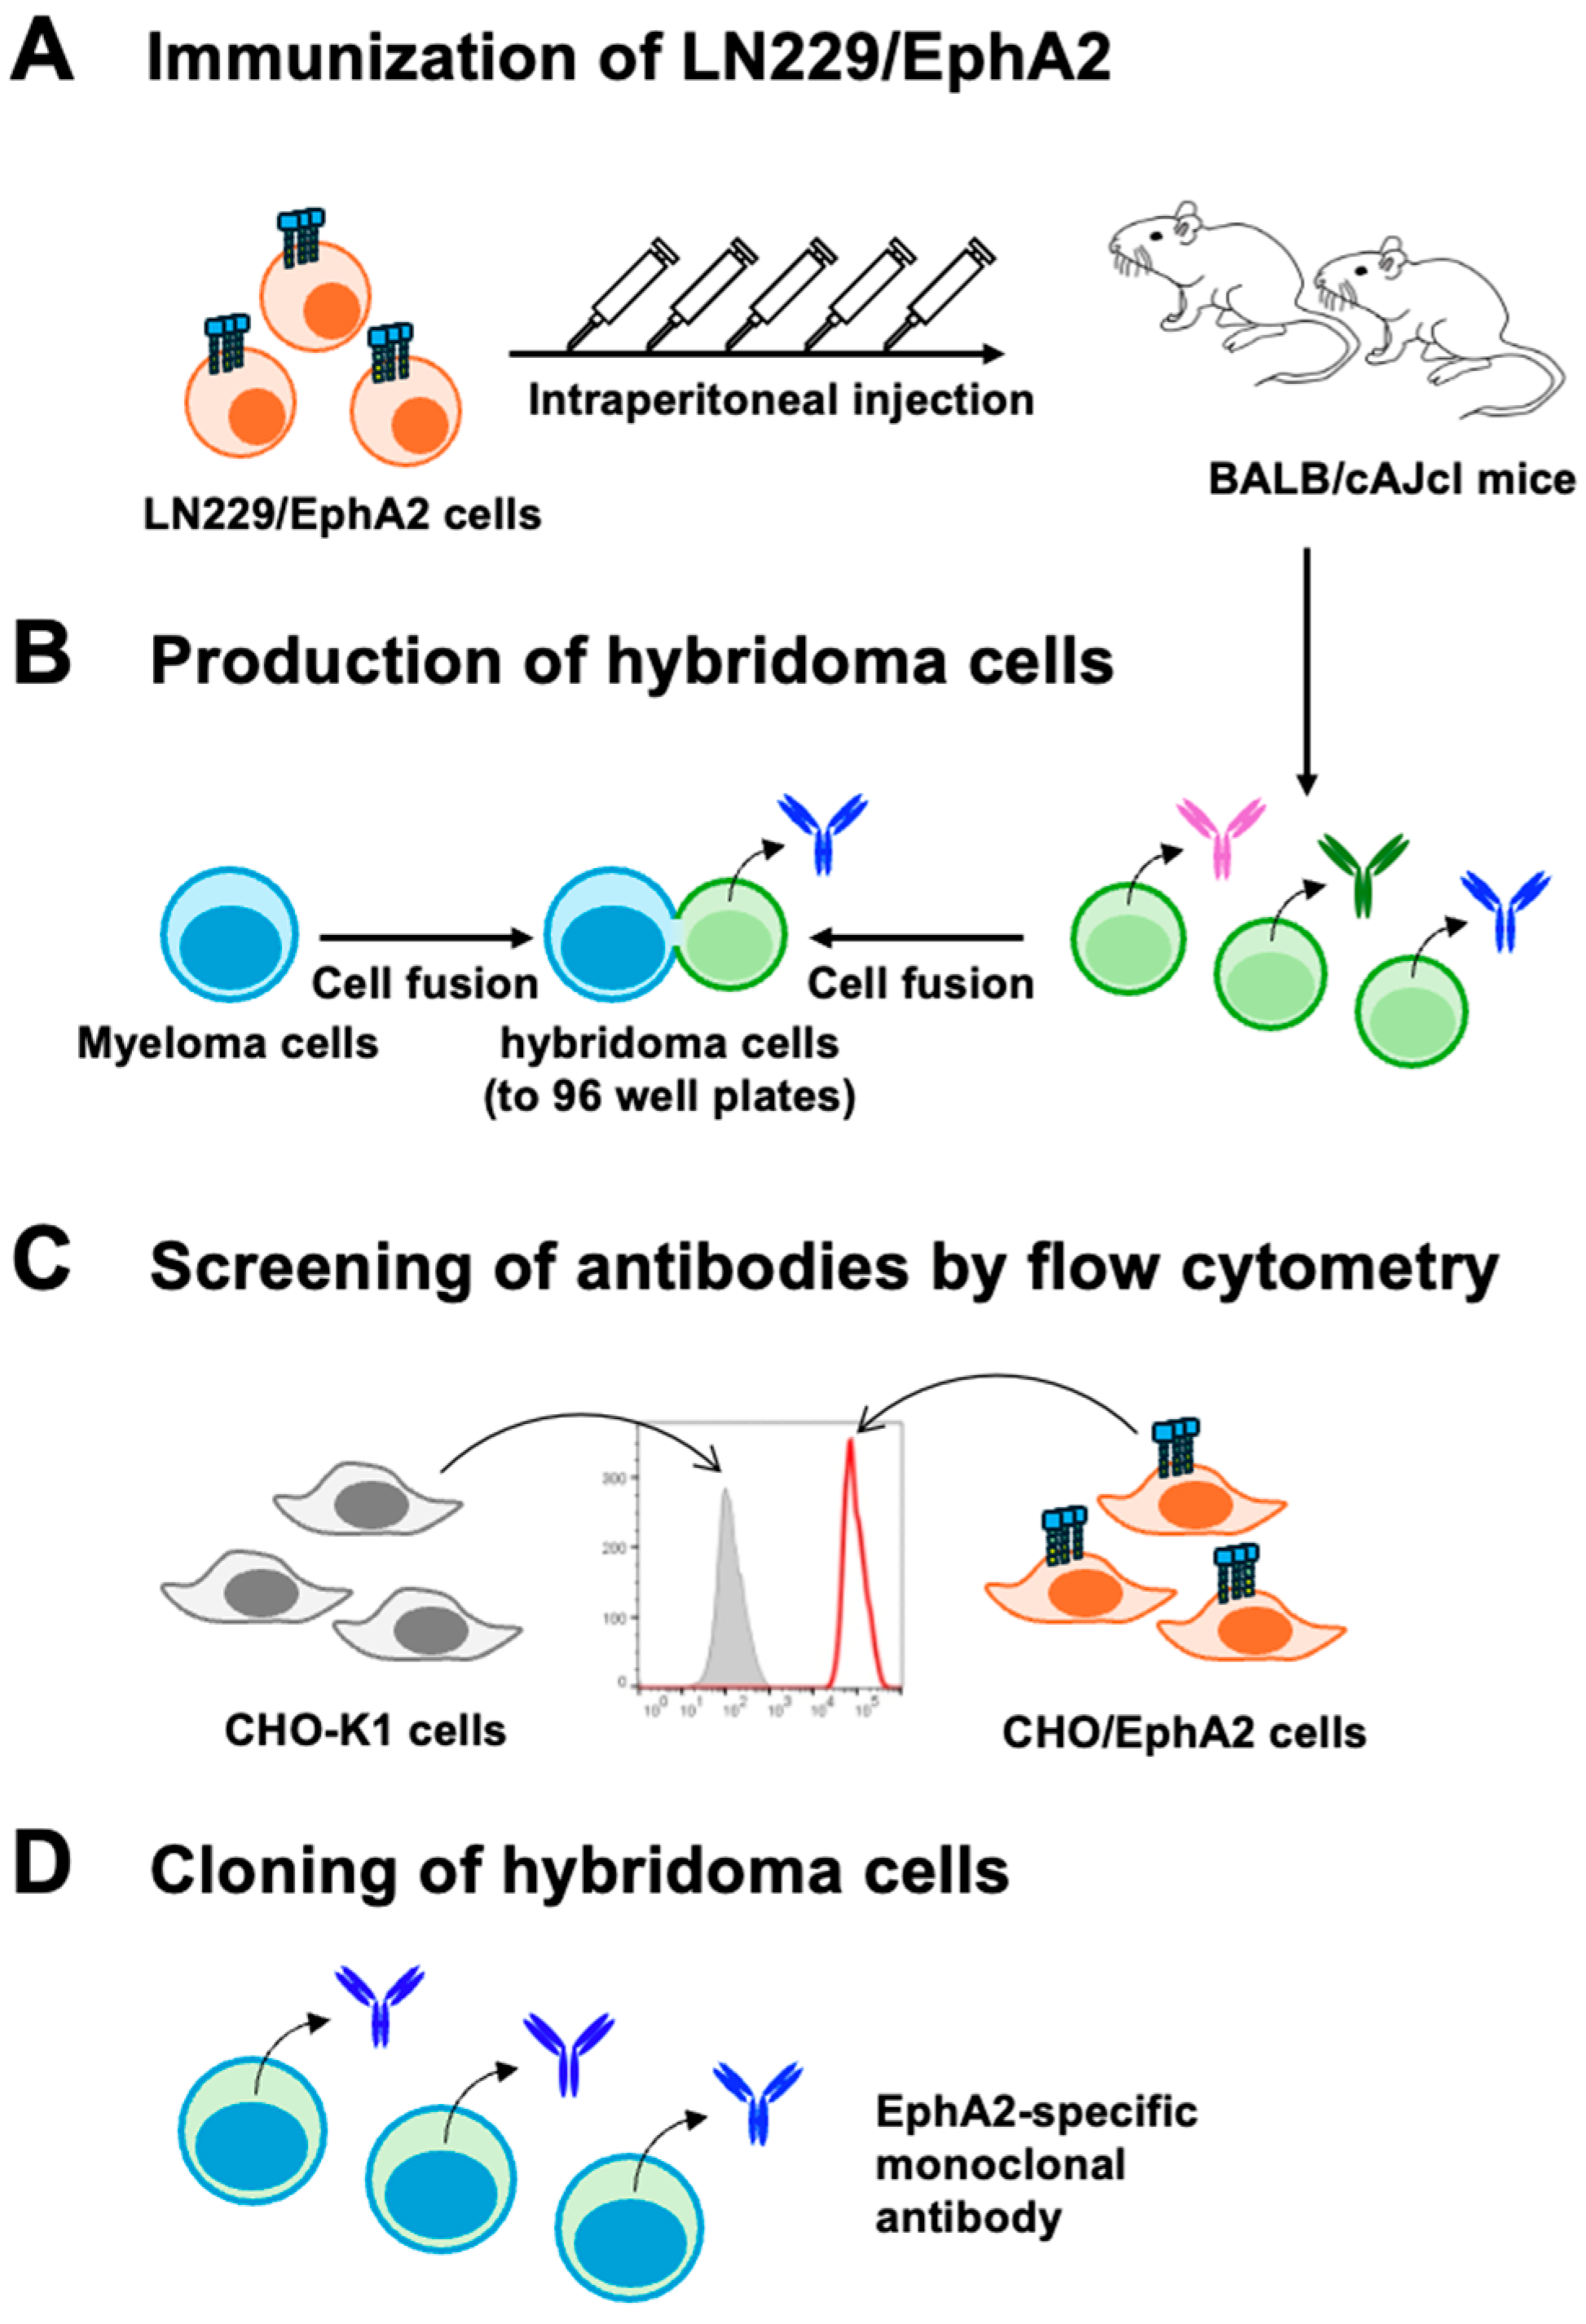
2.3. Development of Hybridomas
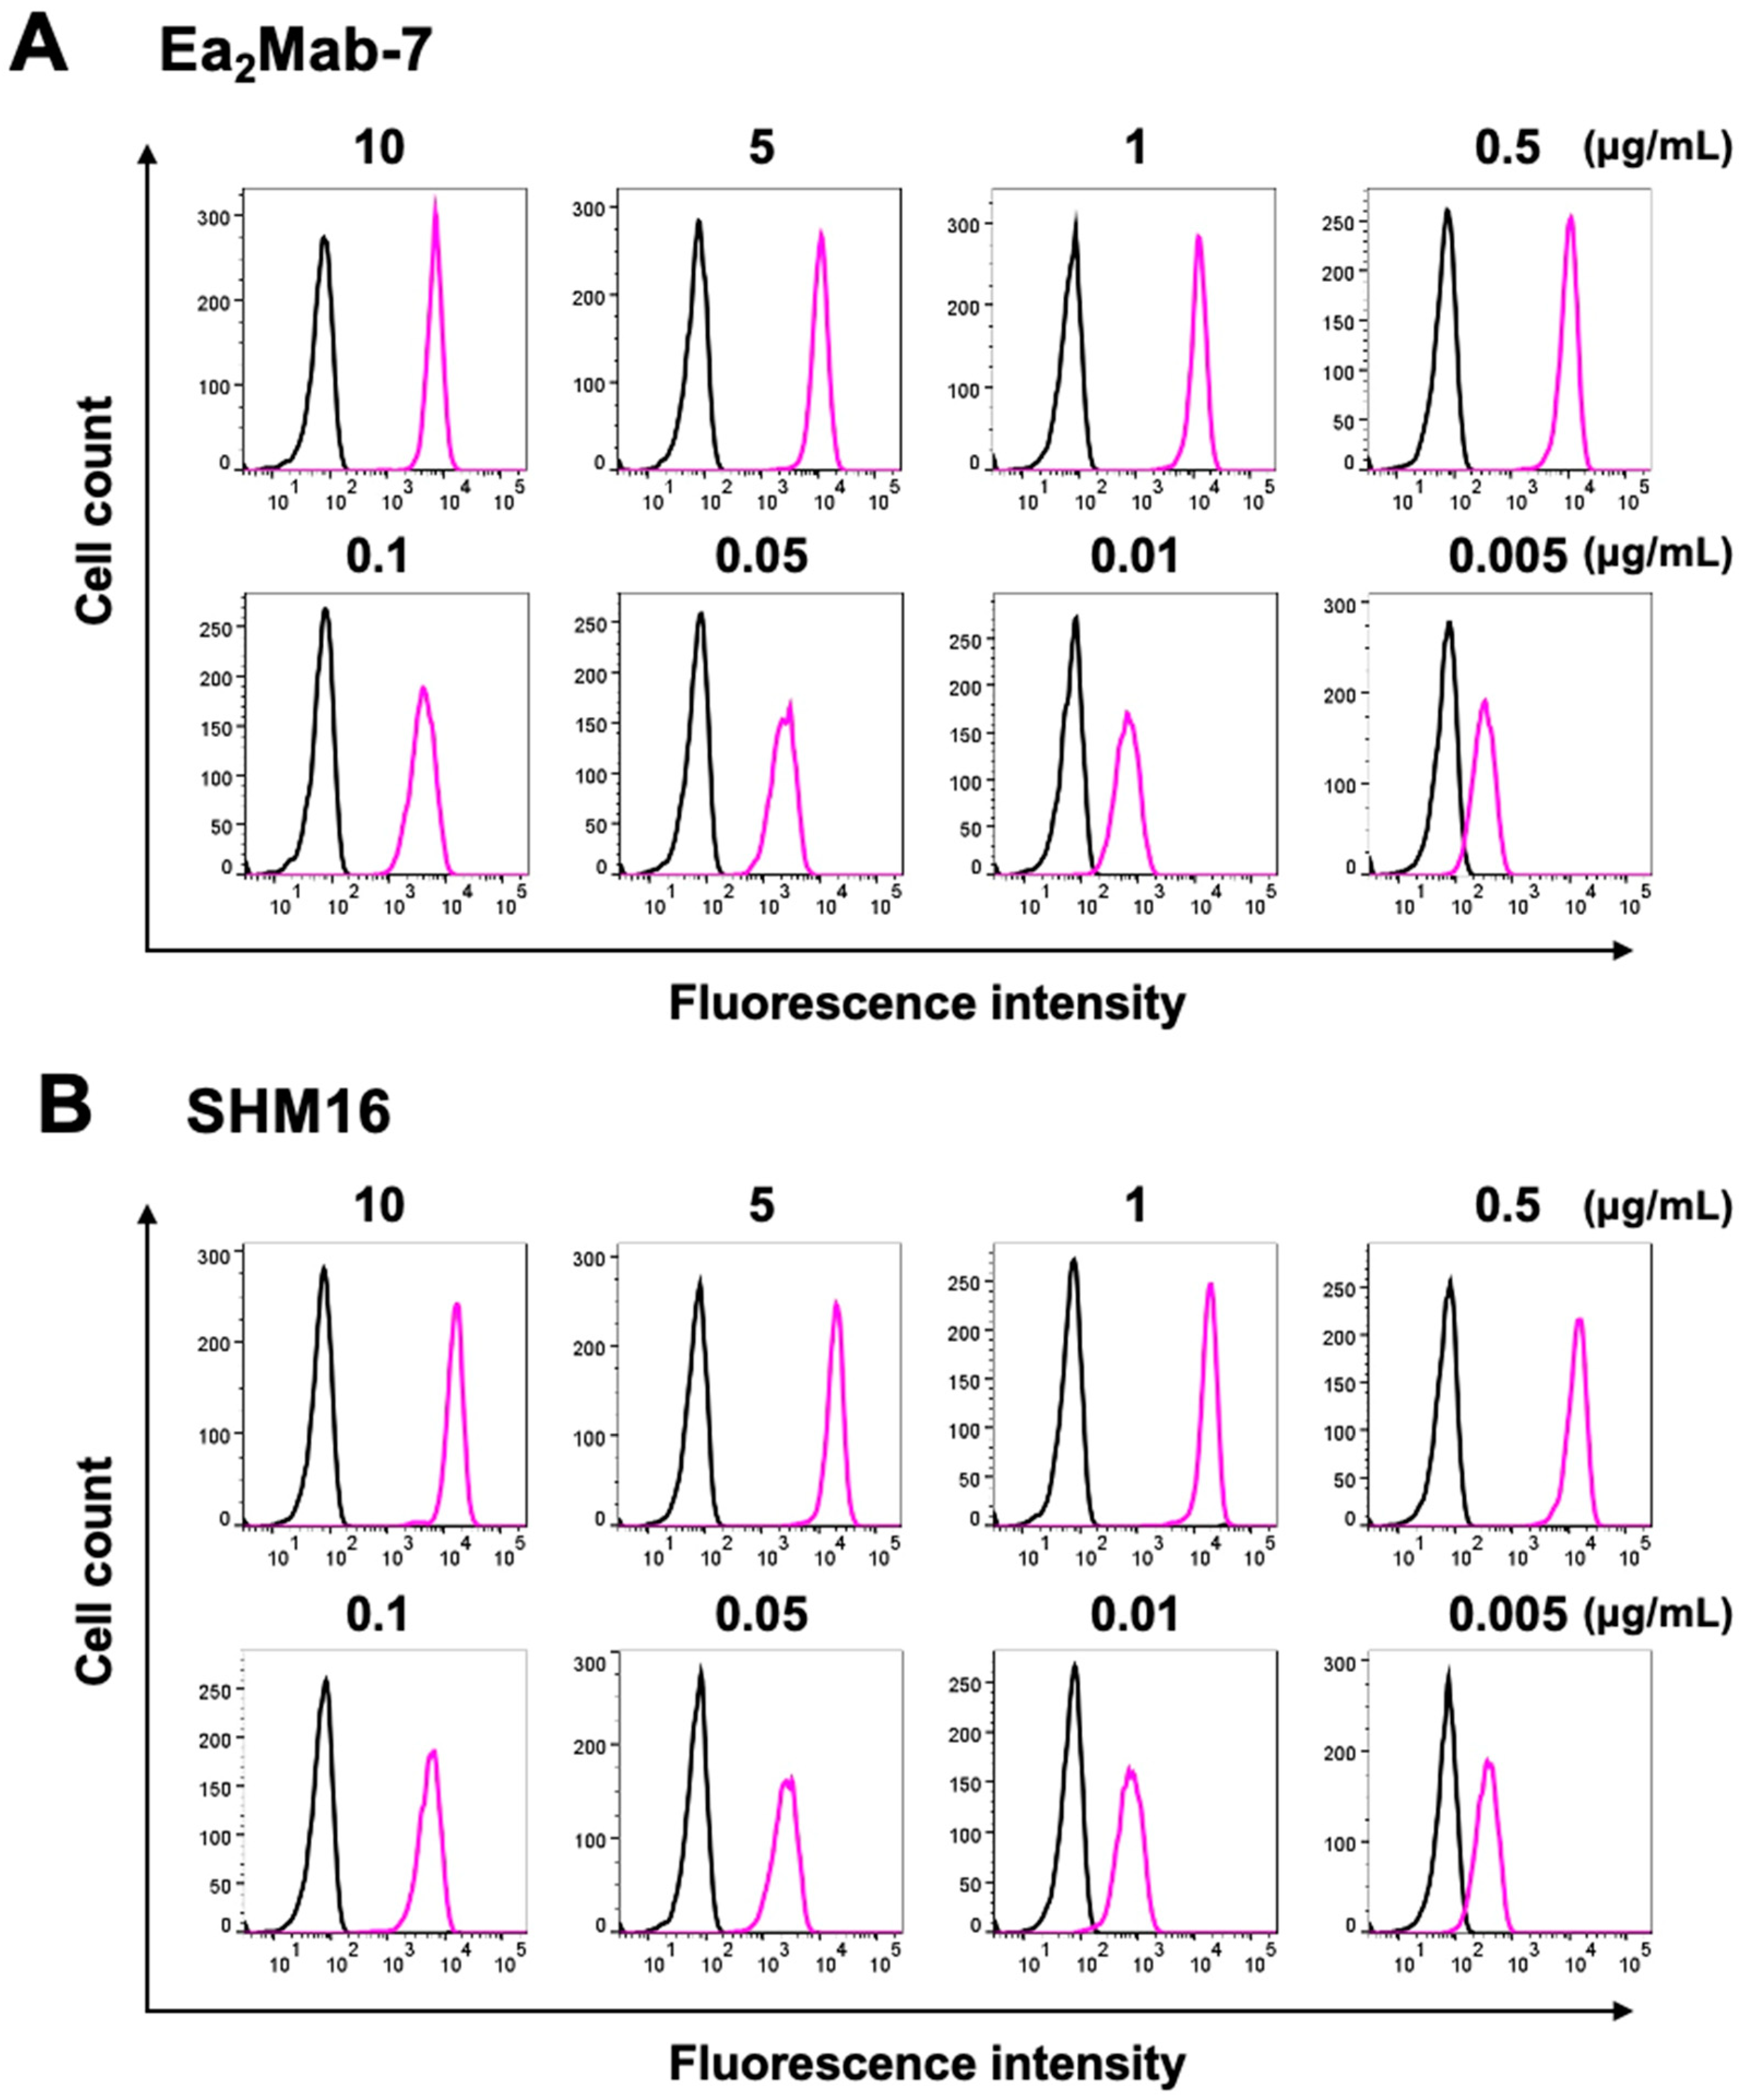
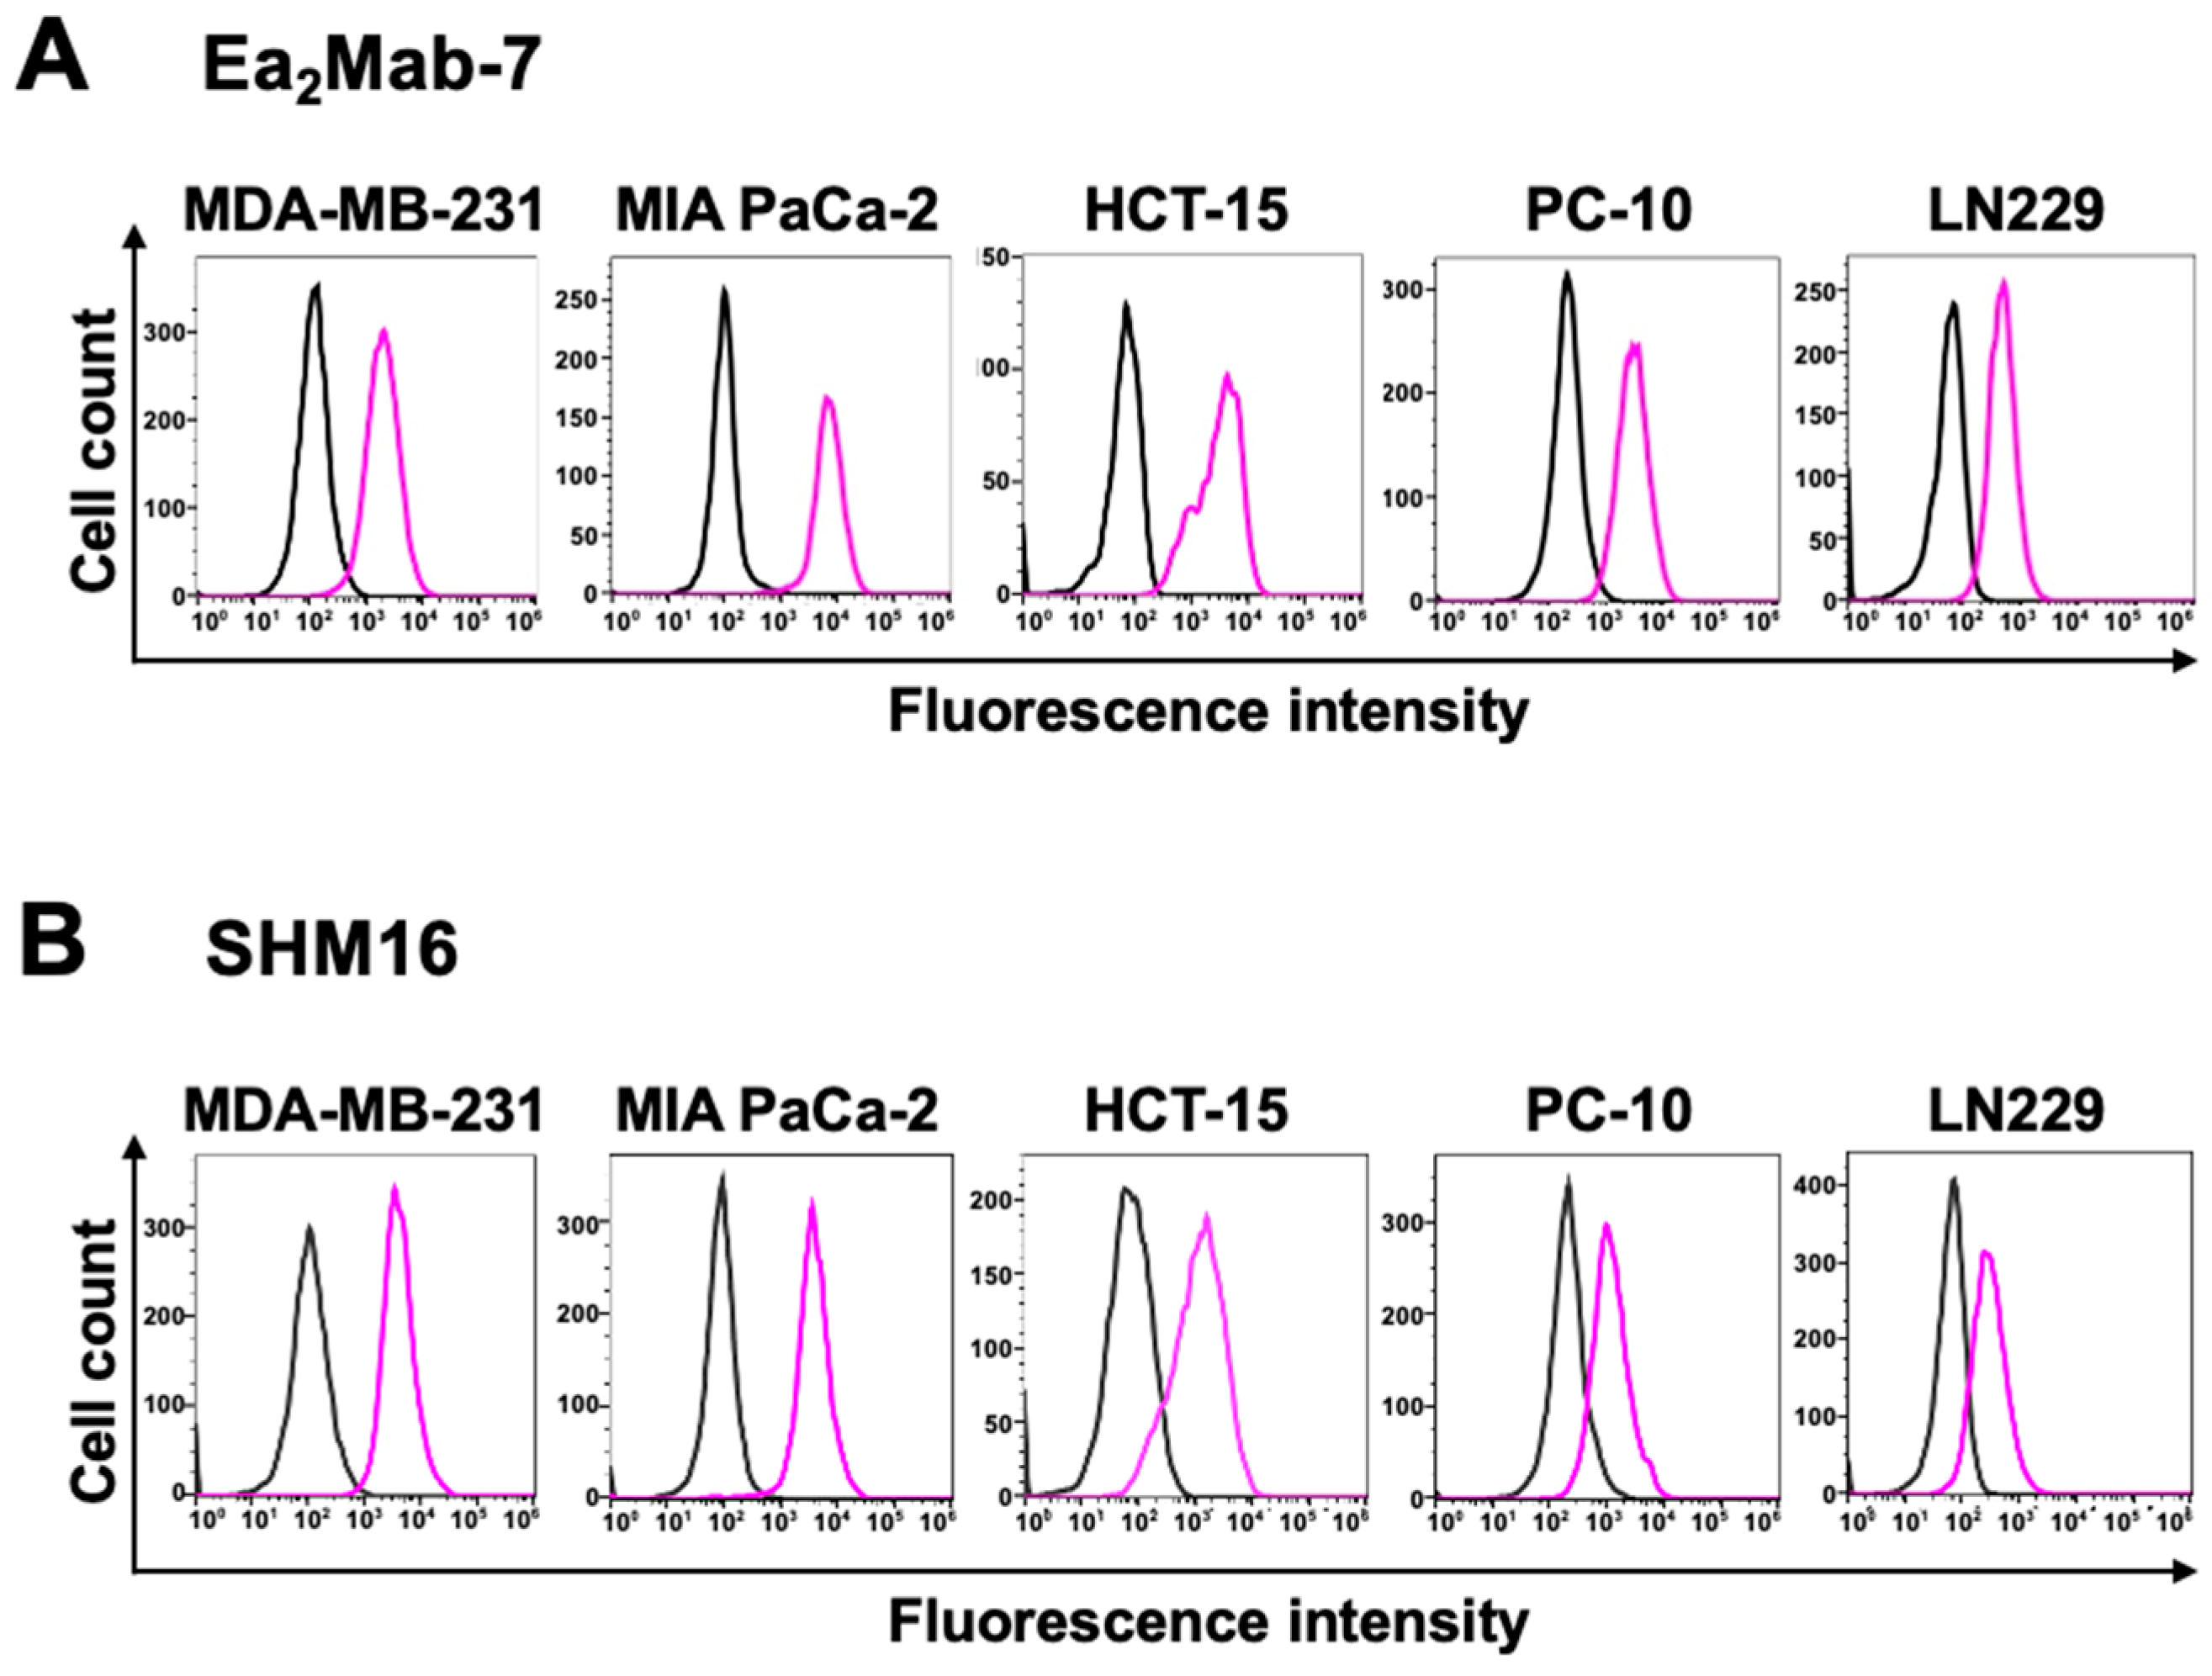
2.4. Flow Cytometric Analysis
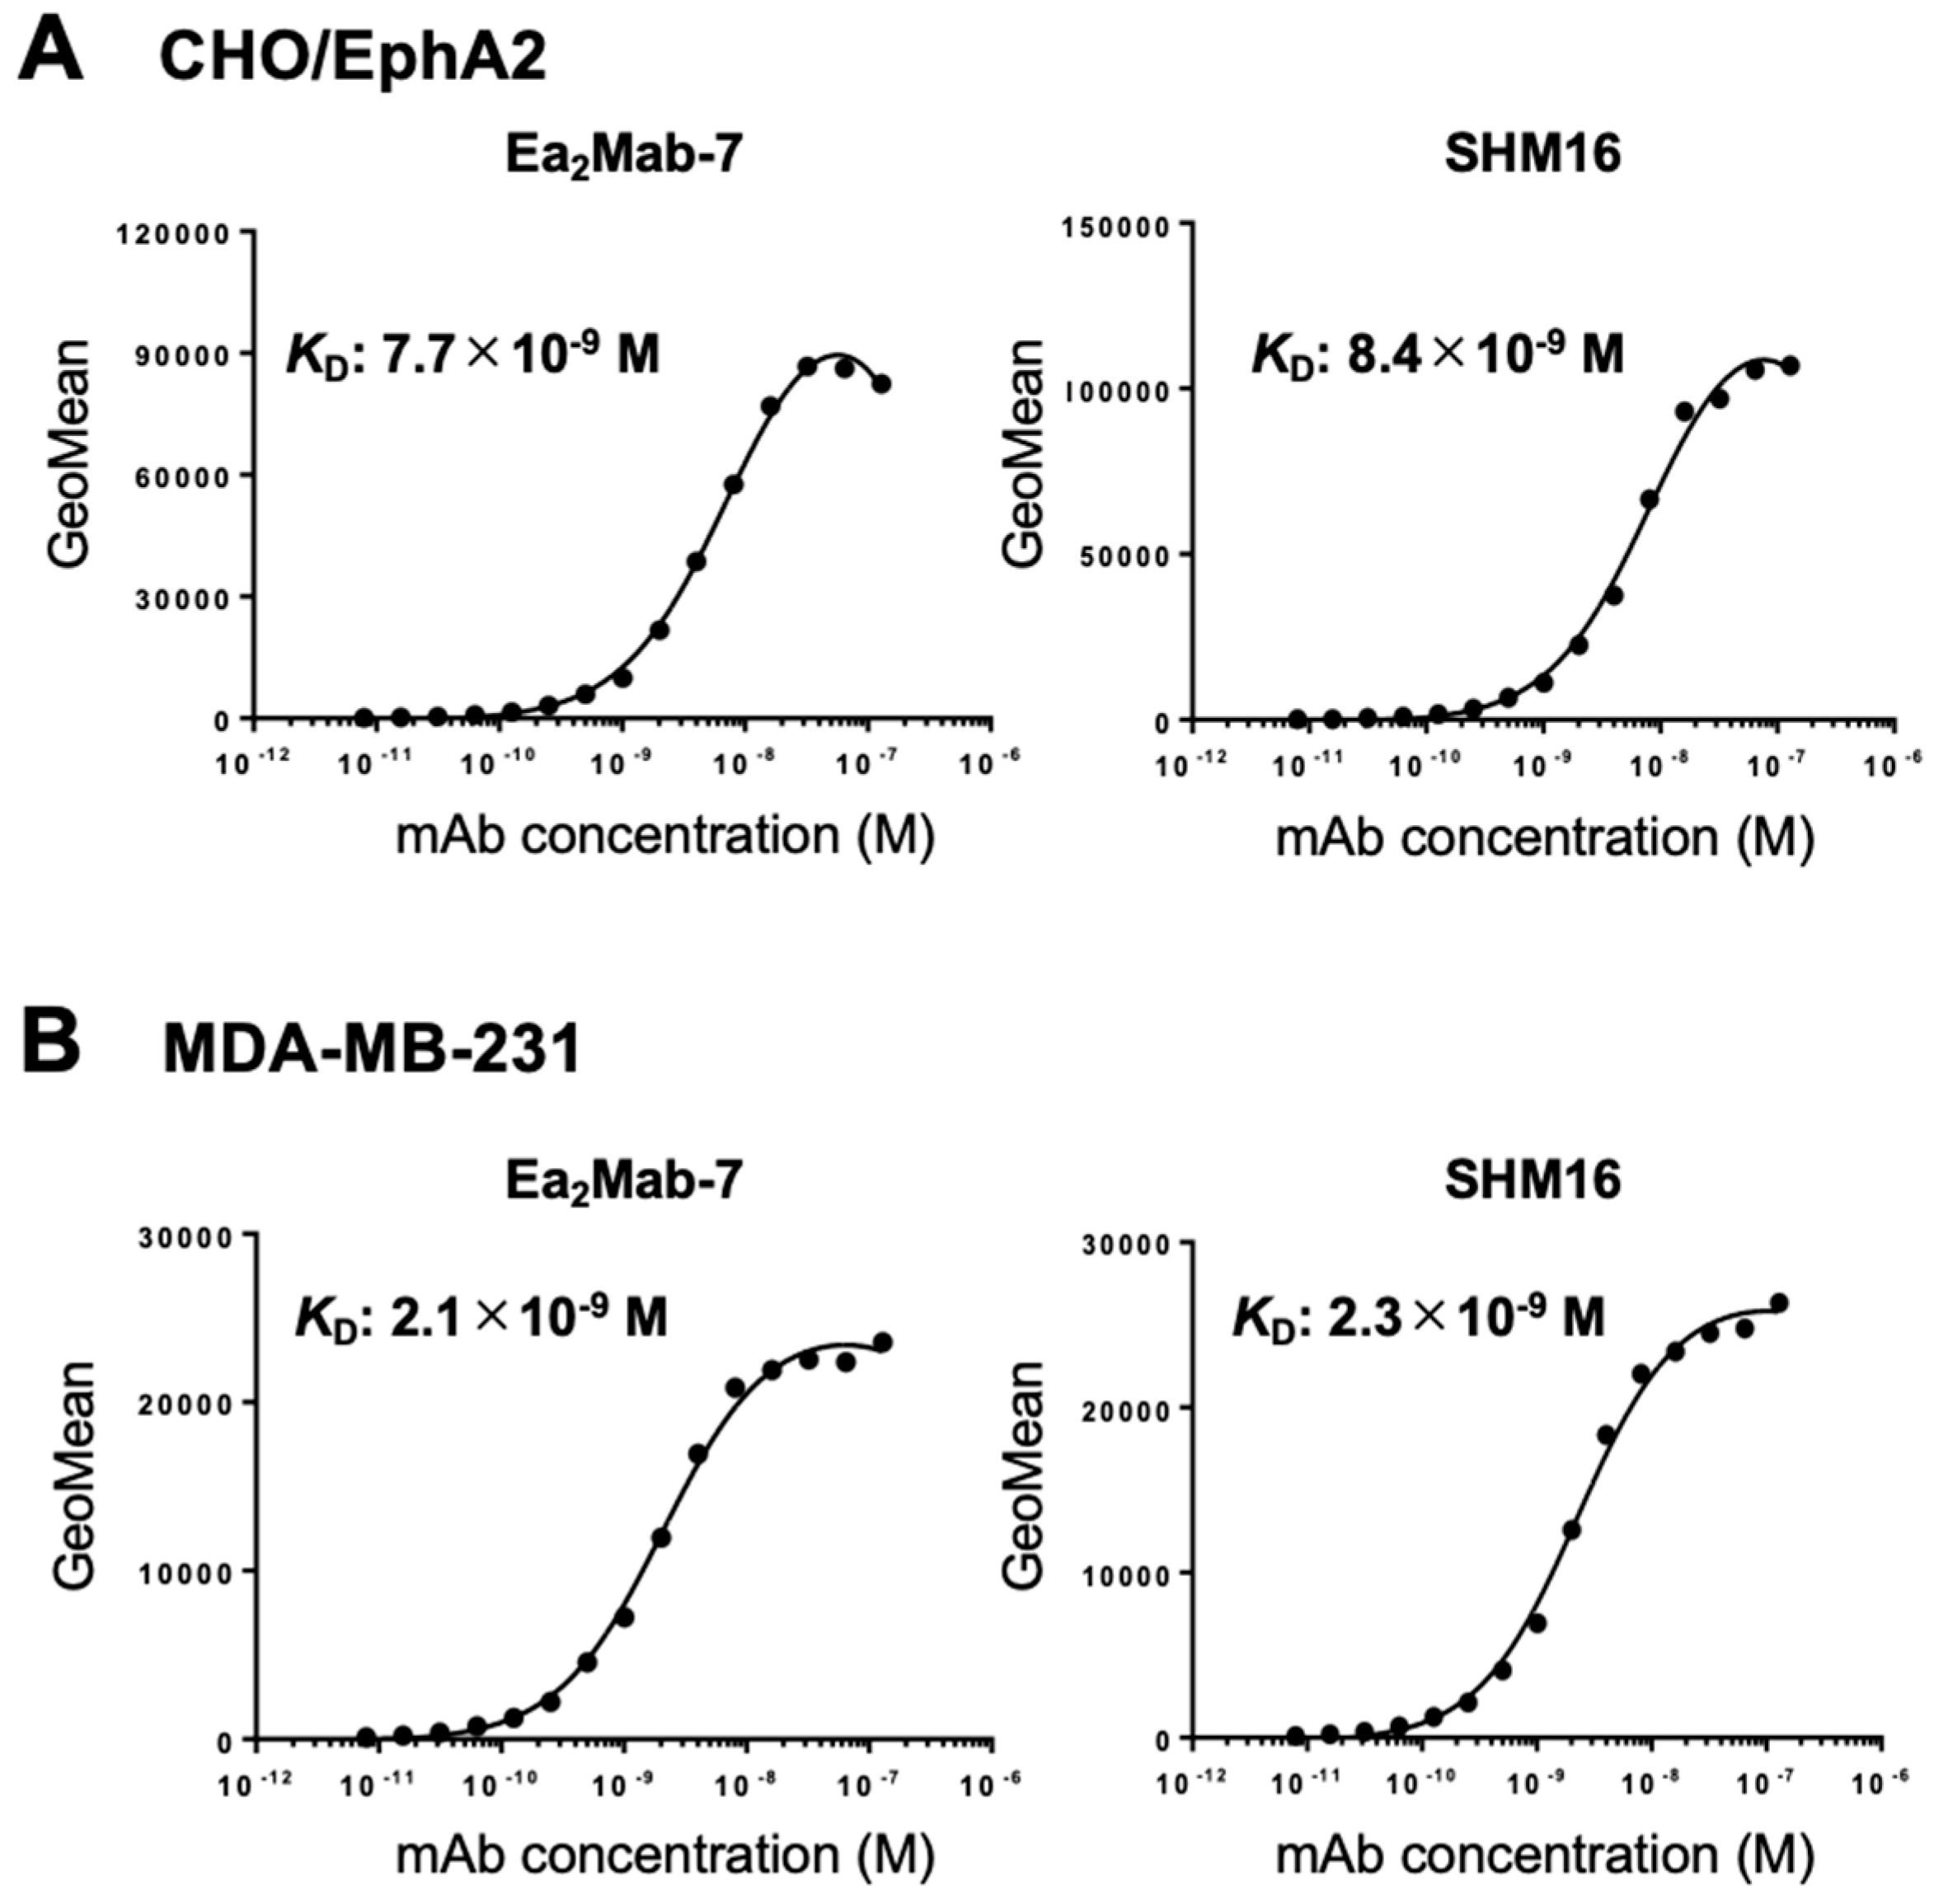
2.5. Determination of Dissociation Constant (KD) by Flow Cytometry
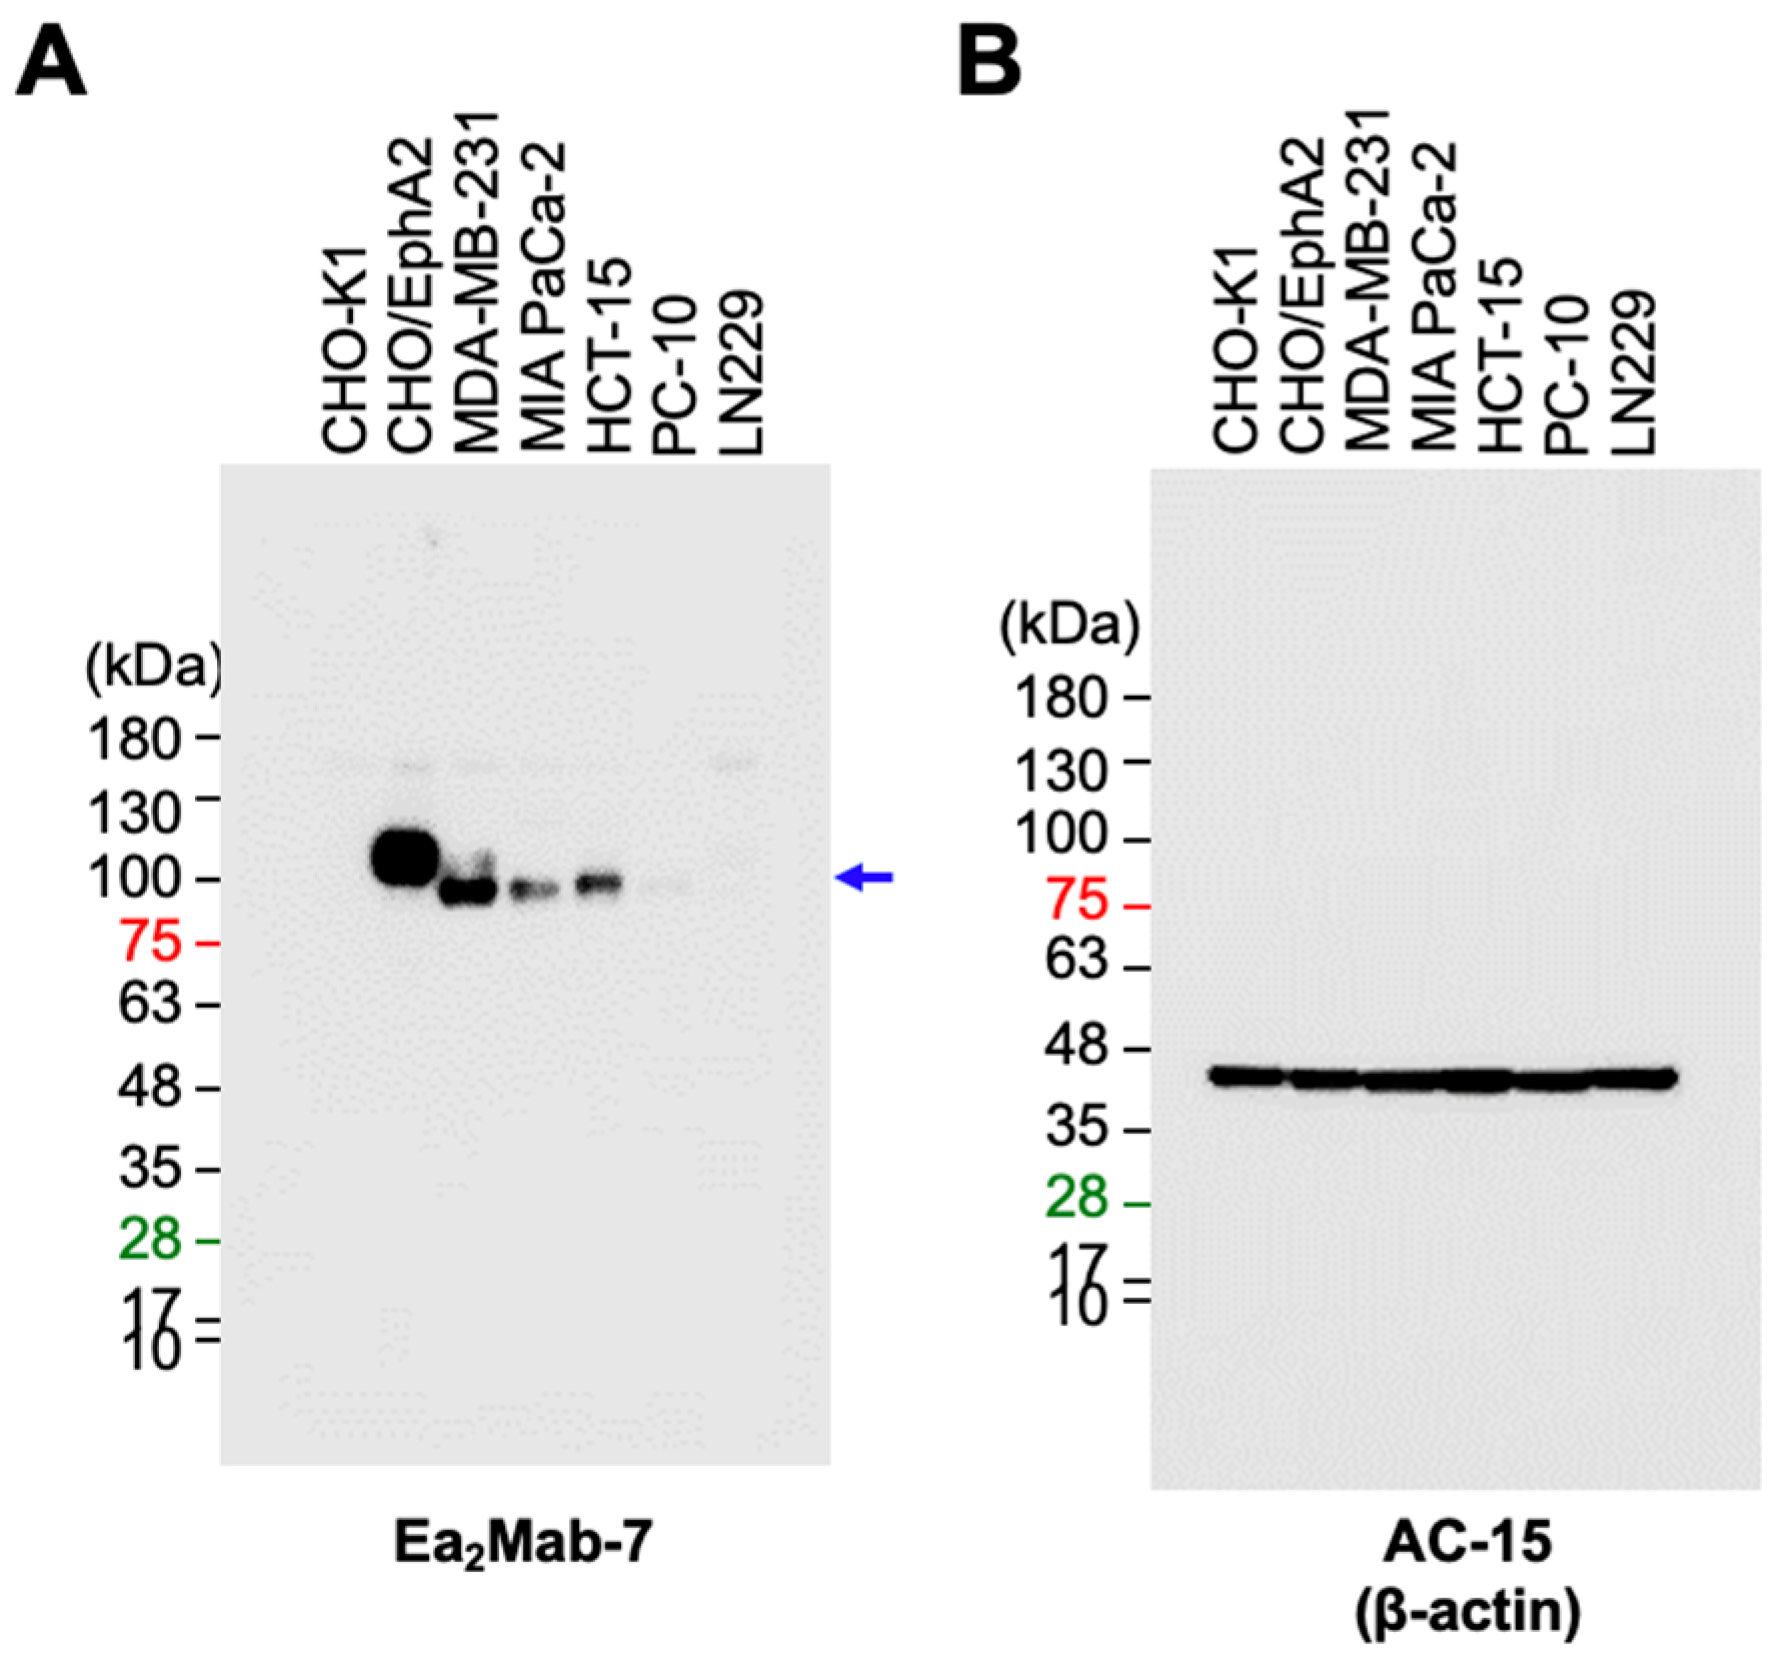
2.6. Western Blot Analysis
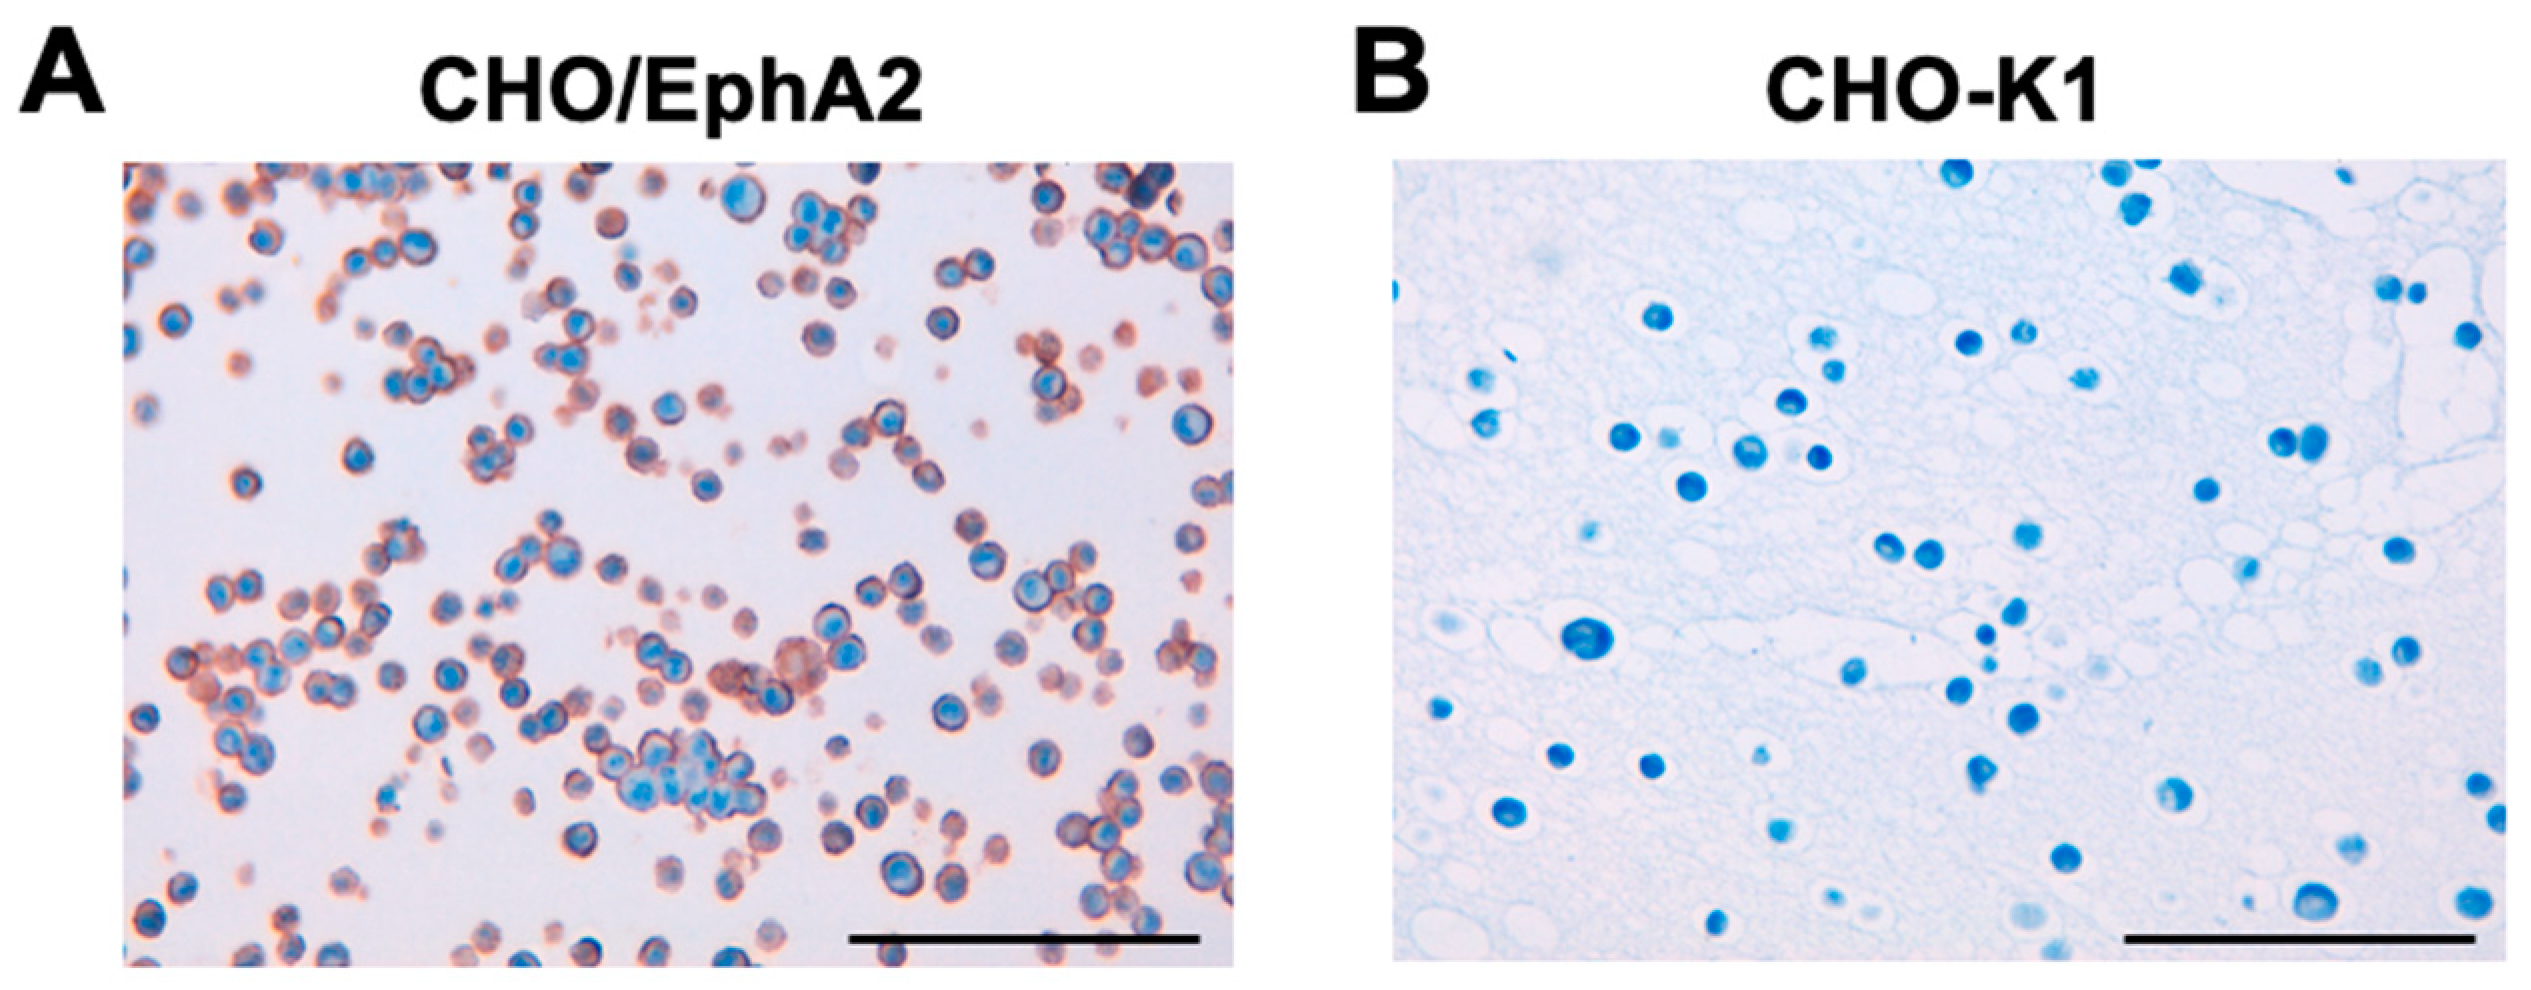
2.7. Immunocytochemical Analysis (ICC)
2.8. Immunohistochemical Analysis (IHC)
3. Results
3.1. Development of Anti-Human EphA2 mAbs
3.2. Flow Cytometry
3.3. Determination of KD Values
3.4. Western Blot Analysis
3.5. ICC
3.6. IHC
4. Discussion
Supplementary Materials
Author Contributions
Funding
Institutional Review Board Statement
Informed Consent Statement
Data Availability Statement
Conflicts of Interest
References
- Biao-xue, R.; Xi-guang, C.; Shuan-ying, Y.; Wei, L.; Zong-juan, M. EphA2-dependent molecular targeting therapy for malignant tumors. Curr Cancer Drug Targets 2011;11(9): 1082-1097. [CrossRef]
- Tandon, M.; Vemula, S.V.; Mittal, S.K. Emerging strategies for EphA2 receptor targeting for cancer therapeutics. Expert Opin Ther Targets 2011;15(1): 31-51. [CrossRef]
- Pasquale, E.B. Eph receptors and ephrins in cancer progression. Nat Rev Cancer 2024;24(1): 5-27. [CrossRef]
- Pasquale, E.B. Eph receptor signalling casts a wide net on cell behaviour. Nat Rev Mol Cell Biol 2005;6(6): 462-475. [CrossRef]
- Pasquale, E.B. Eph receptors and ephrins in cancer: bidirectional signalling and beyond. Nat Rev Cancer 2010;10(3): 165-180. [CrossRef]
- Zhou, Y.; Sakurai, H. Emerging and Diverse Functions of the EphA2 Noncanonical Pathway in Cancer Progression. Biol Pharm Bull 2017;40(10): 1616-1624. [CrossRef]
- Kurose, H.; Ueda, K.; Kondo, R.; et al. Elevated Expression of EPHA2 Is Associated With Poor Prognosis After Radical Prostatectomy in Prostate Cancer. Anticancer Res 2019;39(11): 6249-6257. [CrossRef]
- Amato, K.R.; Wang, S.; Tan, L.; et al. EPHA2 Blockade Overcomes Acquired Resistance to EGFR Kinase Inhibitors in Lung Cancer. Cancer Res 2016;76(2): 305-318. [CrossRef]
- Miyazaki, T.; Kato, H.; Fukuchi, M.; Nakajima, M.; Kuwano, H. EphA2 overexpression correlates with poor prognosis in esophageal squamous cell carcinoma. Int J Cancer 2003;103(5): 657-663. [CrossRef]
- Martini, G.; Cardone, C.; Vitiello, P.P.; et al. EPHA2 Is a Predictive Biomarker of Resistance and a Potential Therapeutic Target for Improving Antiepidermal Growth Factor Receptor Therapy in Colorectal Cancer. Mol Cancer Ther 2019;18(4): 845-855. [CrossRef]
- Wu, D.; Suo, Z.; Kristensen, G.B.; et al. Prognostic value of EphA2 and EphrinA-1 in squamous cell cervical carcinoma. Gynecol Oncol 2004;94(2): 312-319. [CrossRef]
- Lin, Y.G.; Han, L.Y.; Kamat, A.A.; et al. EphA2 overexpression is associated with angiogenesis in ovarian cancer. Cancer 2007;109(2): 332-340. [CrossRef]
- Mo, J.; Zhao, X.; Dong, X.; et al. Effect of EphA2 knockdown on melanoma metastasis depends on intrinsic ephrinA1 level. Cell Oncol (Dordr) 2020;43(4): 655-667. [CrossRef]
- Youngblood, V.M.; Kim, L.C.; Edwards, D.N.; et al. The Ephrin-A1/EPHA2 Signaling Axis Regulates Glutamine Metabolism in HER2-Positive Breast Cancer. Cancer Res 2016;76(7): 1825-1836. [CrossRef]
- Wykosky, J.; Debinski, W. The EphA2 receptor and ephrinA1 ligand in solid tumors: function and therapeutic targeting. Mol Cancer Res 2008;6(12): 1795-1806. [CrossRef]
- Kinch, M.S.; Moore, M.B.; Harpole, D.H. Predictive value of the EphA2 receptor tyrosine kinase in lung cancer recurrence and survival. Clin Cancer Res 2003;9(2): 613-618.
- Garcia-Monclús, S.; López-Alemany, R.; Almacellas-Rabaiget, O.; et al. EphA2 receptor is a key player in the metastatic onset of Ewing sarcoma. Int J Cancer 2018;143(5): 1188-1201. [CrossRef]
- Zhou, L.; Lu, X.; Zhang, B.; Shi, Y.; Li, Z. EphA2 as a new target for breast cancer and its potential clinical application. Int J Clin Exp Pathol 2021;14(4): 484-492.
- Xiao, T.; Xiao, Y.; Wang, W.; et al. Targeting EphA2 in cancer. J Hematol Oncol 2020;13(1): 114. [CrossRef]
- Coffman, K.T.; Hu, M.; Carles-Kinch, K.; et al. Differential EphA2 epitope display on normal versus malignant cells. Cancer Res 2003;63(22): 7907-7912.
- Goldgur, Y.; Susi, P.; Karelehto, E.; et al. Generation and characterization of a single-chain anti-EphA2 antibody. Growth Factors 2014;32(6): 214-222. [CrossRef]
- Sakamoto, A.; Kato, K.; Hasegawa, T.; Ikeda, S. An Agonistic Antibody to EPHA2 Exhibits Antitumor Effects on Human Melanoma Cells. Anticancer Res 2018;38(6): 3273-3282. [CrossRef]
- Burvenich, I.J.; Parakh, S.; Gan, H.K.; et al. Molecular Imaging and Quantitation of EphA2 Expression in Xenograft Models with 89Zr-DS-8895a. J Nucl Med 2016;57(6): 974-980. [CrossRef]
- Yi, Z.; Prinzing, B.L.; Cao, F.; Gottschalk, S.; Krenciute, G. Optimizing EphA2-CAR T Cells for the Adoptive Immunotherapy of Glioma. Mol Ther Methods Clin Dev 2018;9: 70-80. [CrossRef]
- Li, N.; Liu, S.; Sun, M.; et al. Chimeric Antigen Receptor-Modified T Cells Redirected to EphA2 for the Immunotherapy of Non-Small Cell Lung Cancer. Transl Oncol 2018;11(1): 11-17. [CrossRef]
- Asano, T.; Nanamiya, R.; Takei, J.; et al. Development of Anti-Mouse CC Chemokine Receptor 3 Monoclonal Antibodies for Flow Cytometry. Monoclon Antib Immunodiagn Immunother 2021;40(3): 107-112. [CrossRef]
- Nanamiya, R.; Takei, J.; Asano, T.; et al. Development of Anti-Human CC Chemokine Receptor 9 Monoclonal Antibodies for Flow Cytometry. Monoclon Antib Immunodiagn Immunother 2021;40(3): 101-106. [CrossRef]
- Nanamiya, R.; Suzuki, H.; Kaneko, M.K.; Kato, Y. Development of an Anti-EphB4 Monoclonal Antibody for Multiple Applications Against Breast Cancers. Monoclon Antib Immunodiagn Immunother 2023;42(5): 166-177. [CrossRef]
- Saito, M.; Suzuki, H.; Tanaka, T.; et al. Development of an Anti-Mouse CCR8 Monoclonal Antibody (C. Monoclon Antib Immunodiagn Immunother 2022;41(6): 333-338. [CrossRef]
- Suzuki, H.; Tanaka, T.; Li, G.; et al. Development of a Sensitive Anti-Mouse CCR5 Monoclonal Antibody for Flow Cytometry. Monoclon Antib Immunodiagn Immunother 2024;43(4): 96-100. [CrossRef]
- Tanaka, T.; Nanamiya, R.; Takei, J.; et al. Development of Anti-Mouse CC Chemokine Receptor 8 Monoclonal Antibodies for Flow Cytometry. Monoclon Antib Immunodiagn Immunother 2021;40(2): 65-70. [CrossRef]
- Tateyama, N.; Asano, T.; Suzuki, H.; et al. Epitope Mapping of Anti-Mouse CCR3 Monoclonal Antibodies Using Flow Cytometry. Antibodies (Basel) 2022;11(4). [CrossRef]
- Yoshida, S.; Kato, T.; Kanno, N.; et al. Cell type-specific localization of Ephs pairing with ephrin-B2 in the rat postnatal pituitary gland. Cell Tissue Res 2017;370(1): 99-112. [CrossRef]
- Yasuta, Y.; Kaminaka, R.; Nagai, S.; et al. Cooperative function of oncogenic MAPK signaling and the loss of Pten for melanoma migration through the formation of lamellipodia. Sci Rep 2024;14(1): 1525. [CrossRef]
- Nikas, I.; Giaginis, C.; Petrouska, K.; et al. EPHA2, EPHA4, and EPHA7 Expression in Triple-Negative Breast Cancer. Diagnostics (Basel) 2022;12(2). [CrossRef]
- Okada, Y.; Suzuki, H.; Tanaka, T.; Kaneko, M.K.; Kato, Y. Epitope Mapping of an Anti-Mouse CD39 Monoclonal Antibody Using PA Scanning and RIEDL Scanning. Monoclon Antib Immunodiagn Immunother 2024;43(2): 44-52. [CrossRef]
- Asano, T.; Kaneko, M.K.; Takei, J.; Tateyama, N.; Kato, Y. Epitope Mapping of the Anti-CD44 Monoclonal Antibody (C(44)Mab-46) Using the REMAP Method. Monoclon Antib Immunodiagn Immunother 2021;40(4): 156-161. [CrossRef]
- Asano, T.; Kaneko, M.K.; Kato, Y. Development of a Novel Epitope Mapping System: RIEDL Insertion for Epitope Mapping Method. Monoclon Antib Immunodiagn Immunother 2021;40(4): 162-167. [CrossRef]
- Sano, M.; Kaneko, M.K.; Aasano, T.; Kato, Y. Epitope Mapping of an Antihuman EGFR Monoclonal Antibody (EMab-134) Using the REMAP Method. Monoclon Antib Immunodiagn Immunother 2021;40(4): 191-195. [CrossRef]
- Nanamiya, R.; Sano, M.; Asano, T.; et al. Epitope Mapping of an Anti-Human Epidermal Growth Factor Receptor Monoclonal Antibody (EMab-51) Using the RIEDL Insertion for Epitope Mapping Method. Monoclon Antib Immunodiagn Immunother 2021;40(4): 149-155. [CrossRef]
- Zhou, Y.; Yamada, N.; Tanaka, T.; et al. Crucial roles of RSK in cell motility by catalysing serine phosphorylation of EphA2. Nat Commun 2015;6: 7679. [CrossRef]
- Miao, H.; Li, D.Q.; Mukherjee, A.; et al. EphA2 mediates ligand-dependent inhibition and ligand-independent promotion of cell migration and invasion via a reciprocal regulatory loop with Akt. Cancer Cell 2009;16(1): 9-20. [CrossRef]
- Macrae, M.; Neve, R.M.; Rodriguez-Viciana, P.; et al. A conditional feedback loop regulates Ras activity through EphA2. Cancer Cell 2005;8(2): 111-118. [CrossRef]
- Harly, C.; Joyce, S.P.; Domblides, C.; et al. Human γδ T cell sensing of AMPK-dependent metabolic tumor reprogramming through TCR recognition of EphA2. Sci Immunol 2021;6(61). [CrossRef]
- Koshikawa, N.; Hoshino, D.; Taniguchi, H.; et al. Proteolysis of EphA2 Converts It from a Tumor Suppressor to an Oncoprotein. Cancer Res 2015;75(16): 3327-3339. [CrossRef]
- Chen, Z.; Liu, Z.; Zhang, M.; et al. EPHA2 blockade reverses acquired resistance to afatinib induced by EPHA2-mediated MAPK pathway activation in gastric cancer cells and avatar mice. Int J Cancer 2019;145(9): 2440-2449. [CrossRef]
- Mitra, D.; Bhattacharyya, S.; Alam, N.; et al. Phosphorylation of EphA2 receptor and vasculogenic mimicry is an indicator of poor prognosis in invasive carcinoma of the breast. Breast Cancer Res Treat 2020;179(2): 359-370. [CrossRef]
- Ishikawa, K.; Suzuki, H.; Ohishi, T.; et al. Antitumor activities of anti-CD44 monoclonal antibodies in mouse xenograft models of esophageal cancer. Oncol Rep 2024;52(5). [CrossRef]
- Ishikawa, K.; Suzuki, H.; Ohishi, T.; et al. Anti-CD44 Variant 10 Monoclonal Antibody Exerts Antitumor Activity in Mouse Xenograft Models of Oral Squamous Cell Carcinomas. Int J Mol Sci 2024;25(17). [CrossRef]
- Cioce, M.; Fazio, V.M. EphA2 and EGFR: Friends in Life, Partners in Crime. Can EphA2 Be a Predictive Biomarker of Response to Anti-EGFR Agents? Cancers (Basel) 2021;13(4). [CrossRef]
- Jin, P.; Zhang, J.; Sumariwalla, P.F.; et al. Novel splice variants derived from the receptor tyrosine kinase superfamily are potential therapeutics for rheumatoid arthritis. Arthritis Res Ther 2008;10(4): R73. [CrossRef]
- Lévêque, R.; Corbet, C.; Aubert, L.; et al. ProNGF increases breast tumor aggressiveness through functional association of TrkA with EphA2. Cancer Lett 2019;449: 196-206. [CrossRef]
- Li, Y.; Peng, Q.; Wang, L. EphA2 as a phase separation protein associated with ferroptosis and immune cell infiltration in colorectal cancer. Aging (Albany NY) 2023;15(22): 12952-12965. [CrossRef]
- Boissier, P.; Chen, J.; Huynh-Do, U. EphA2 signaling following endocytosis: role of Tiam1. Traffic 2013;14(12): 1255-1271. [CrossRef]
- Marco, S.; Neilson, M.; Moore, M.; et al. Nuclear-capture of endosomes depletes nuclear G-actin to promote SRF/MRTF activation and cancer cell invasion. Nat Commun 2021;12(1): 6829. [CrossRef]

Disclaimer/Publisher’s Note: The statements, opinions and data contained in all publications are solely those of the individual author(s) and contributor(s) and not of MDPI and/or the editor(s). MDPI and/or the editor(s) disclaim responsibility for any injury to people or property resulting from any ideas, methods, instructions or products referred to in the content. |
© 2024 by the authors. Licensee MDPI, Basel, Switzerland. This article is an open access article distributed under the terms and conditions of the Creative Commons Attribution (CC BY) license (http://creativecommons.org/licenses/by/4.0/).


