Submitted:
07 October 2024
Posted:
09 October 2024
You are already at the latest version
Abstract

Keywords:
Introduction
Methodology
Reagents and Chemicals
Analytical Methods
Rotating Photo Disk Reactor (RFR)
Doping Process
Catalyst Characterization Tests
SEM Tests
Diffuse Reflectance
X-Rays
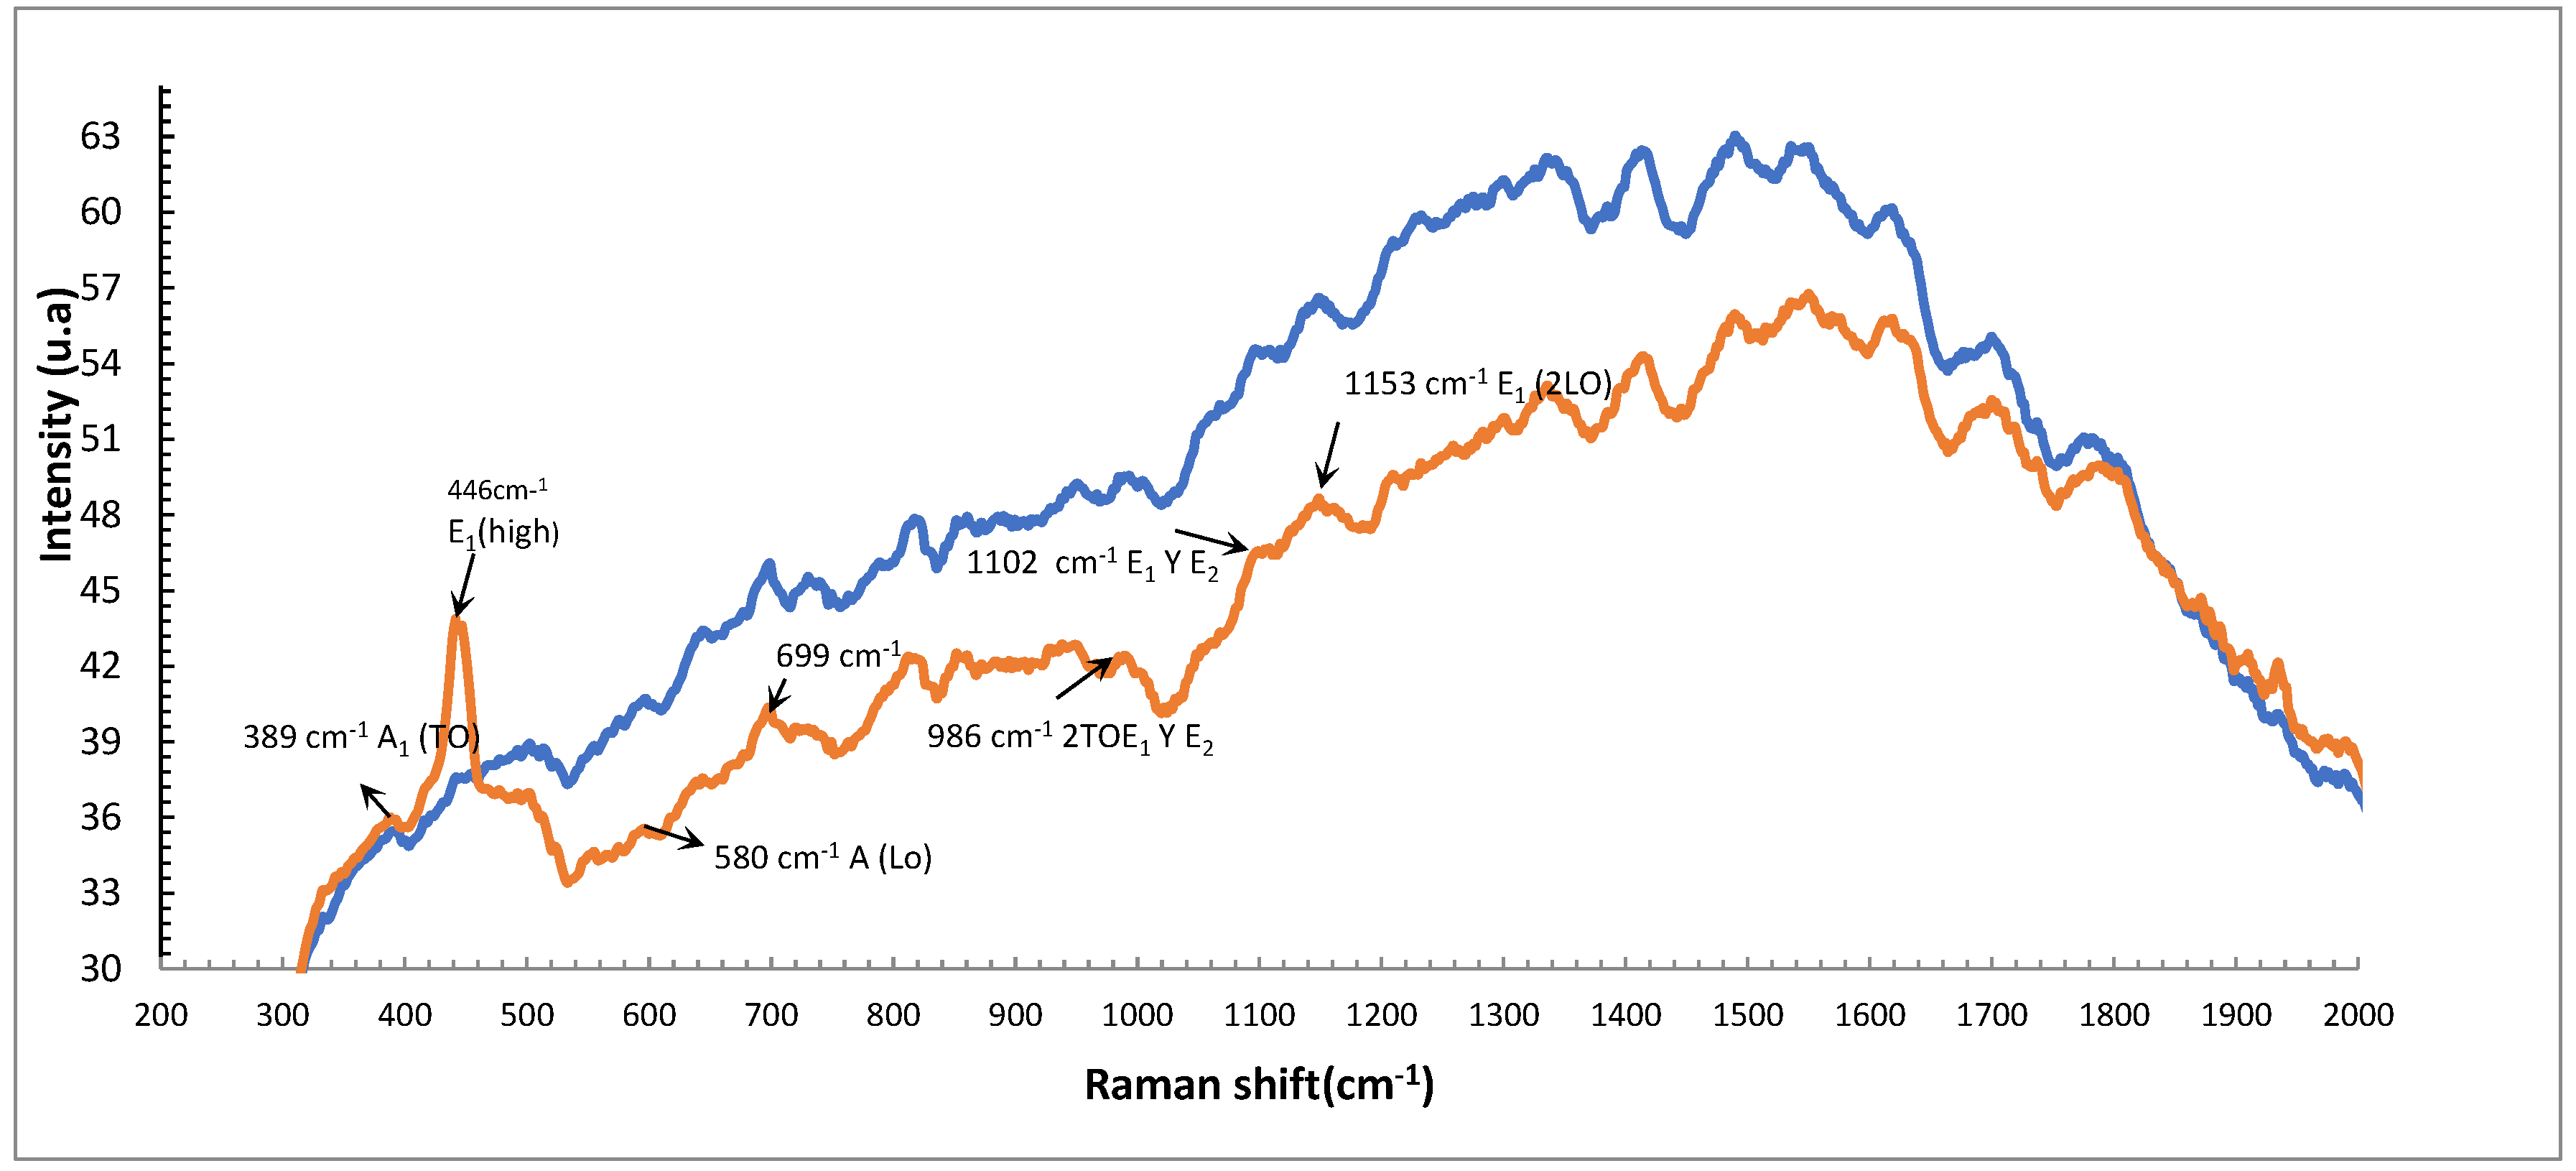
Raman
Preparation of Pyridine Solutions
Degradation Tests
Gases Masses
Results
X-Rays
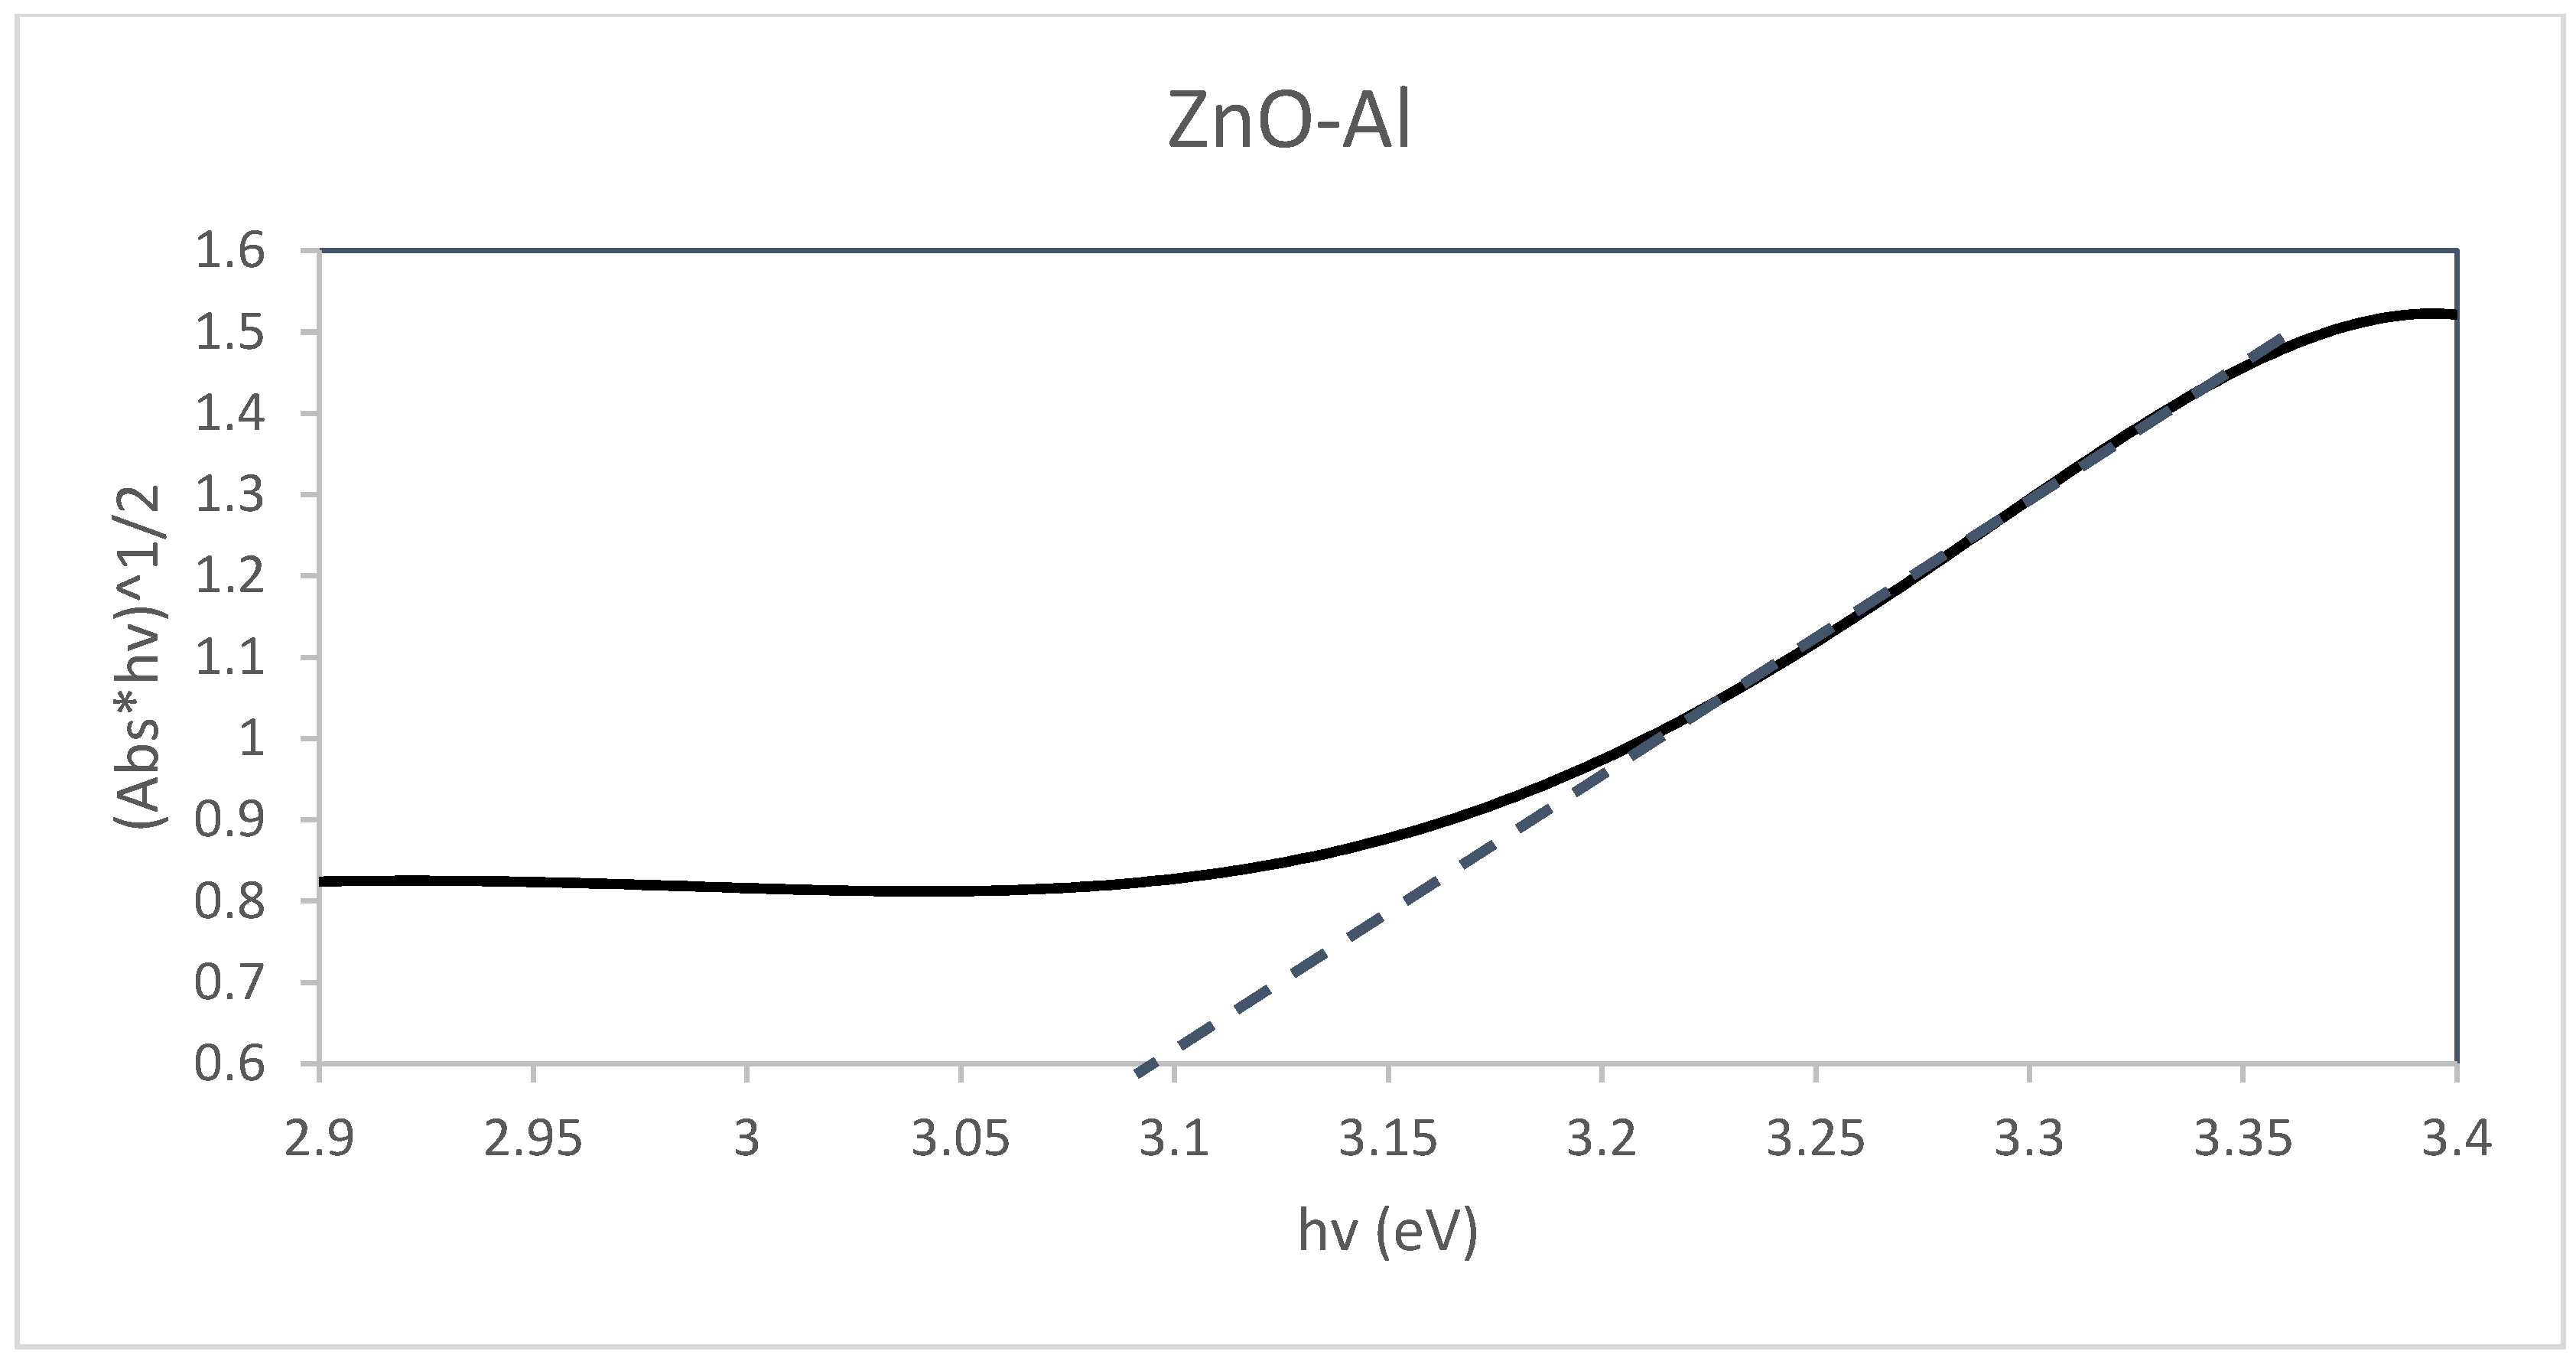
Diffuse Reflectance
Raman Spectroscopy
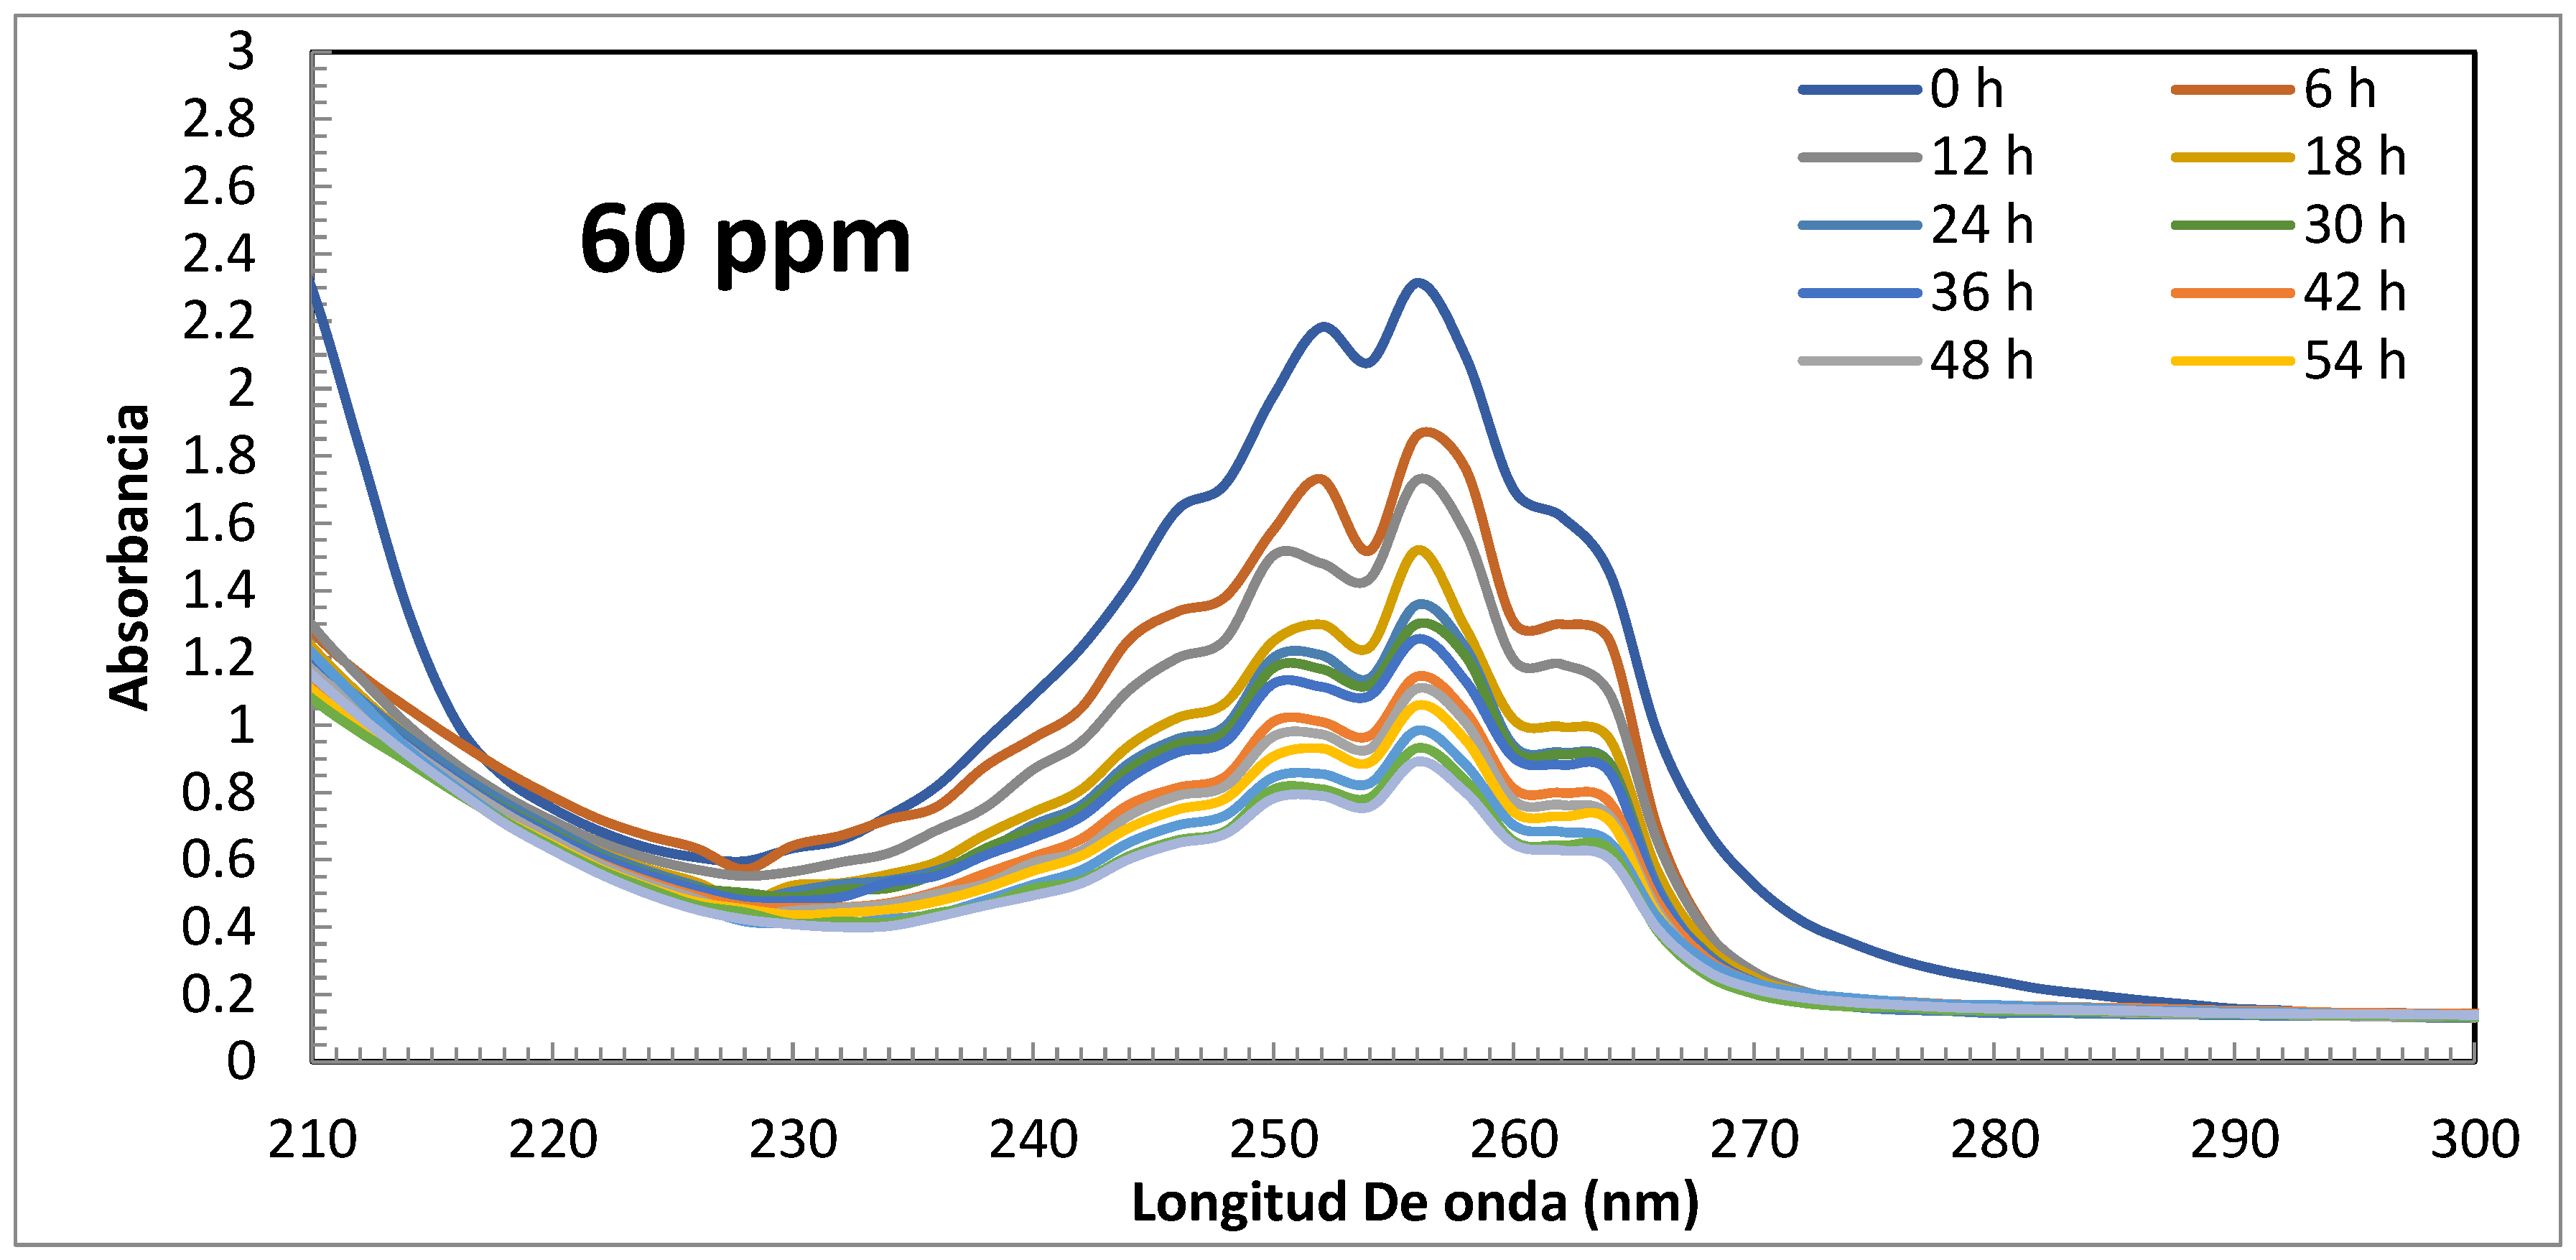
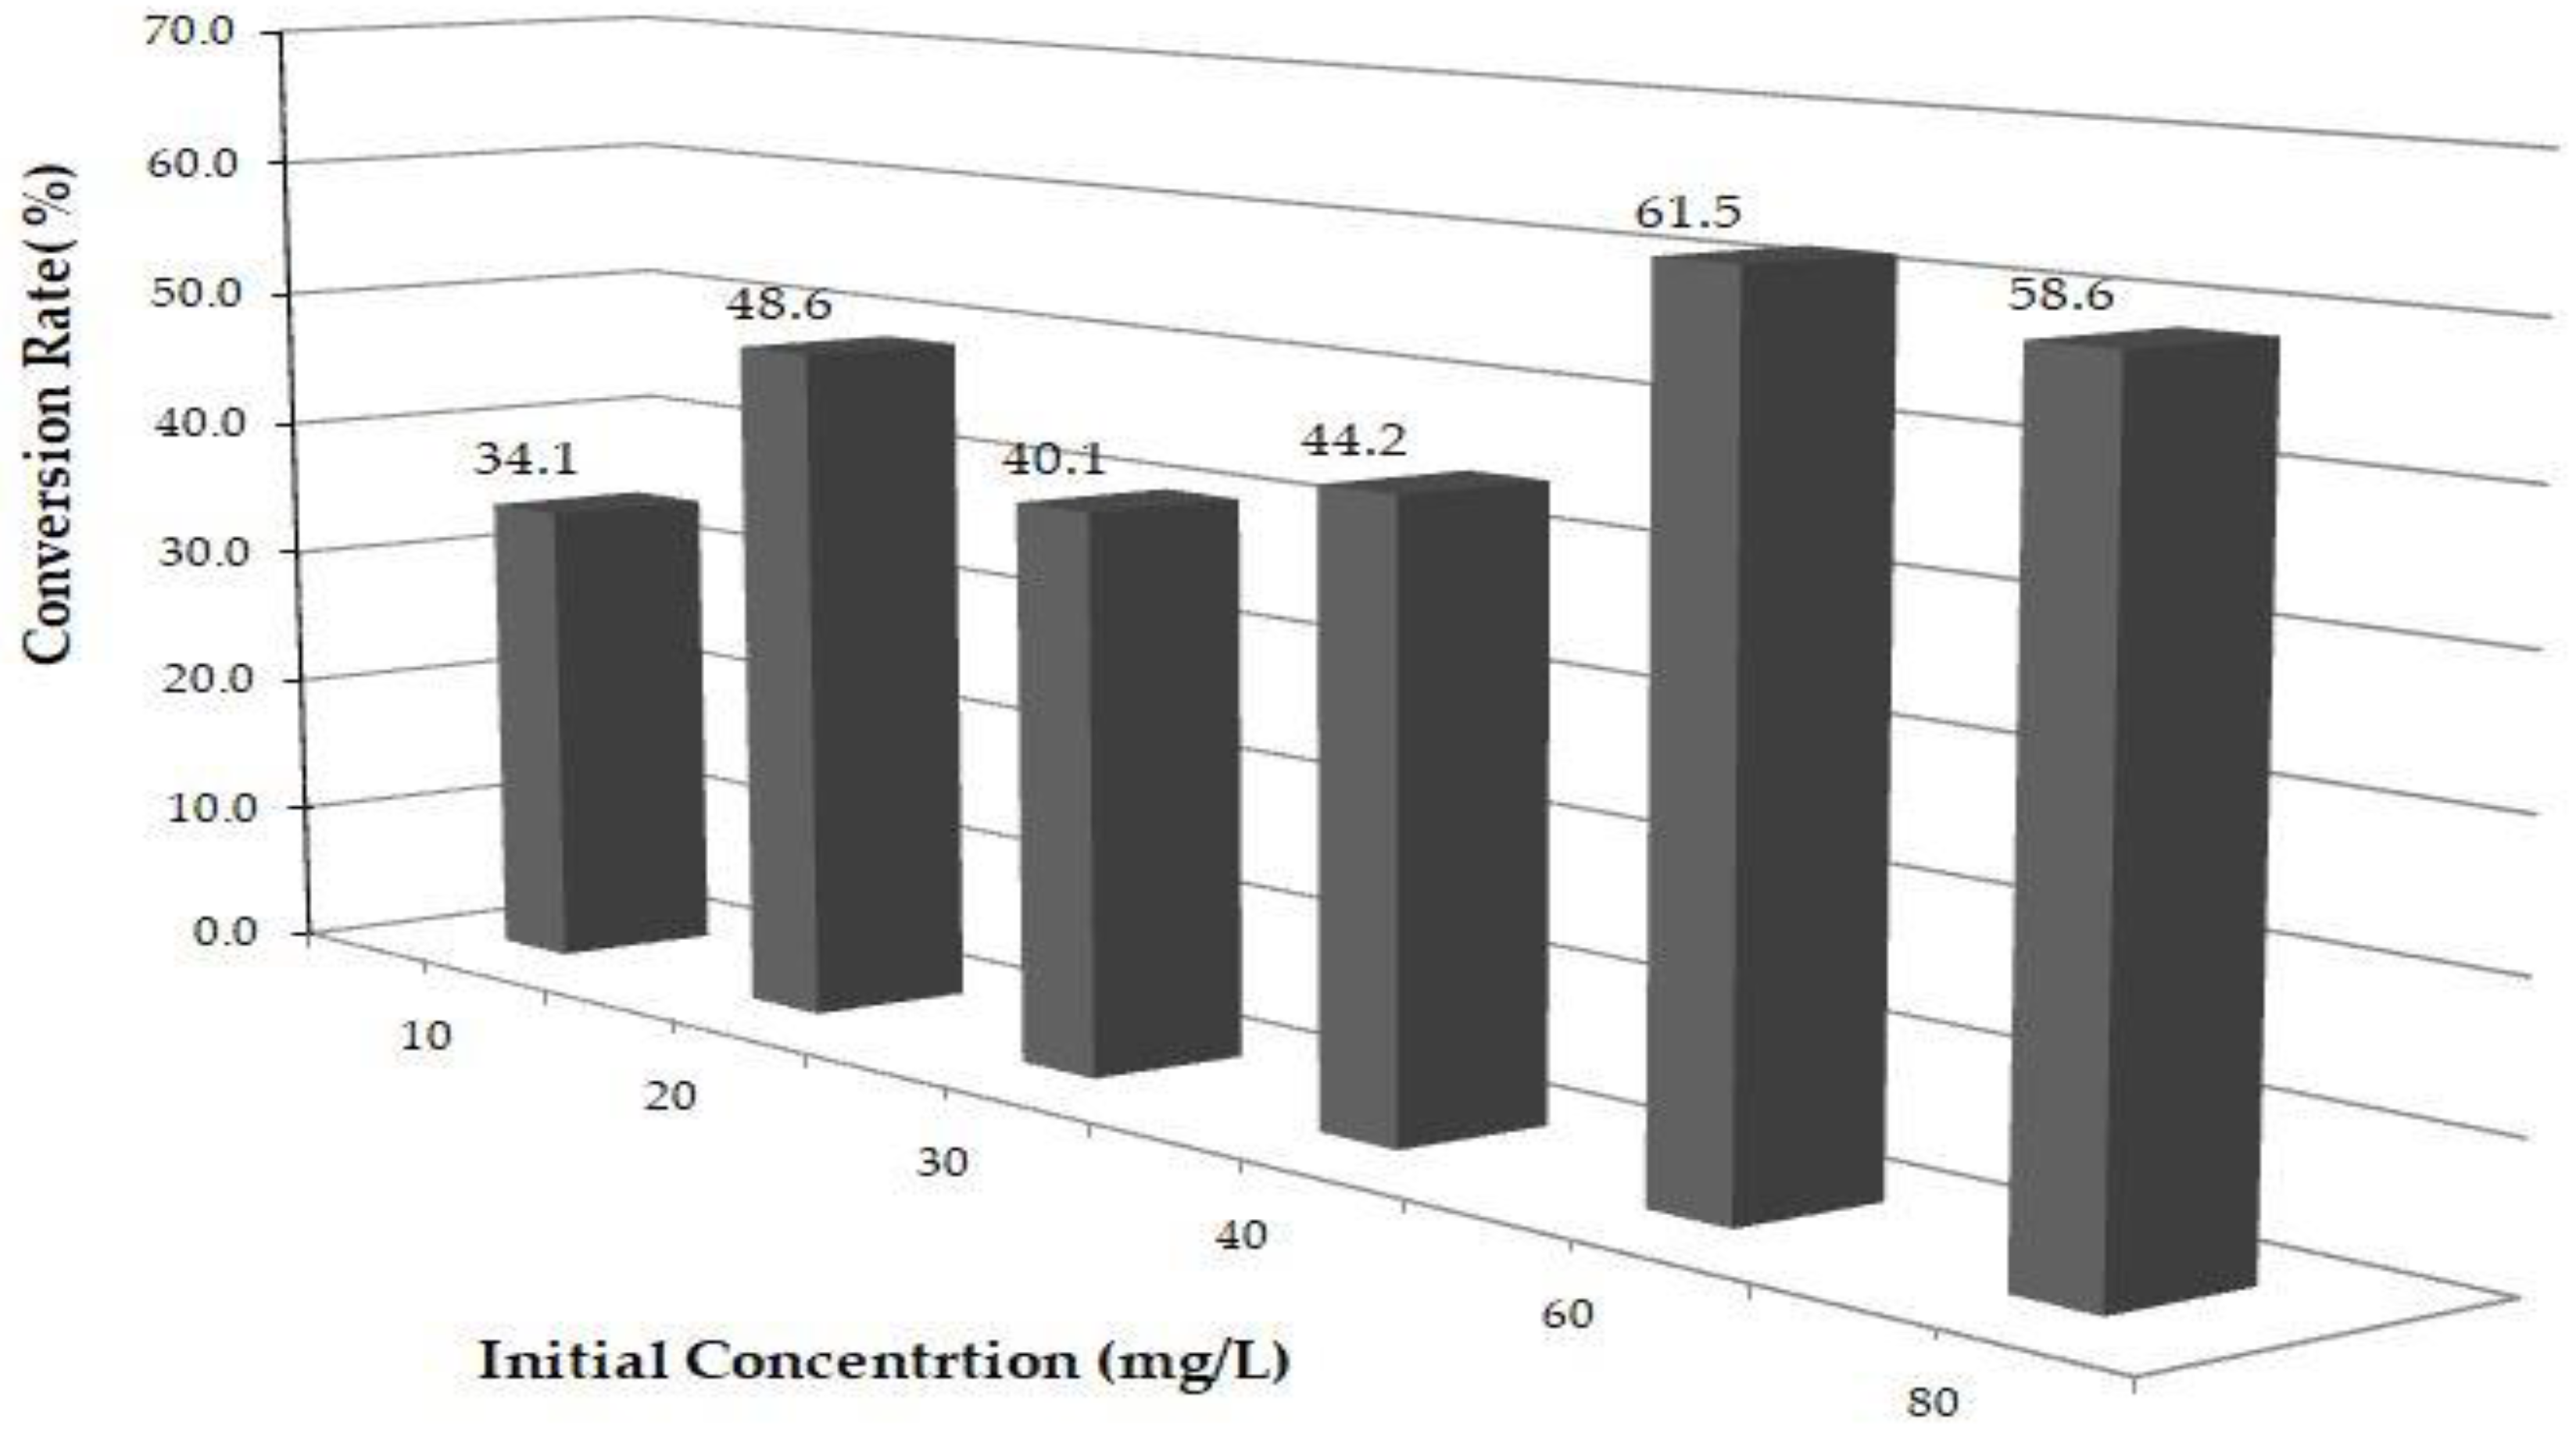
Uv-Vis and HPLC Results
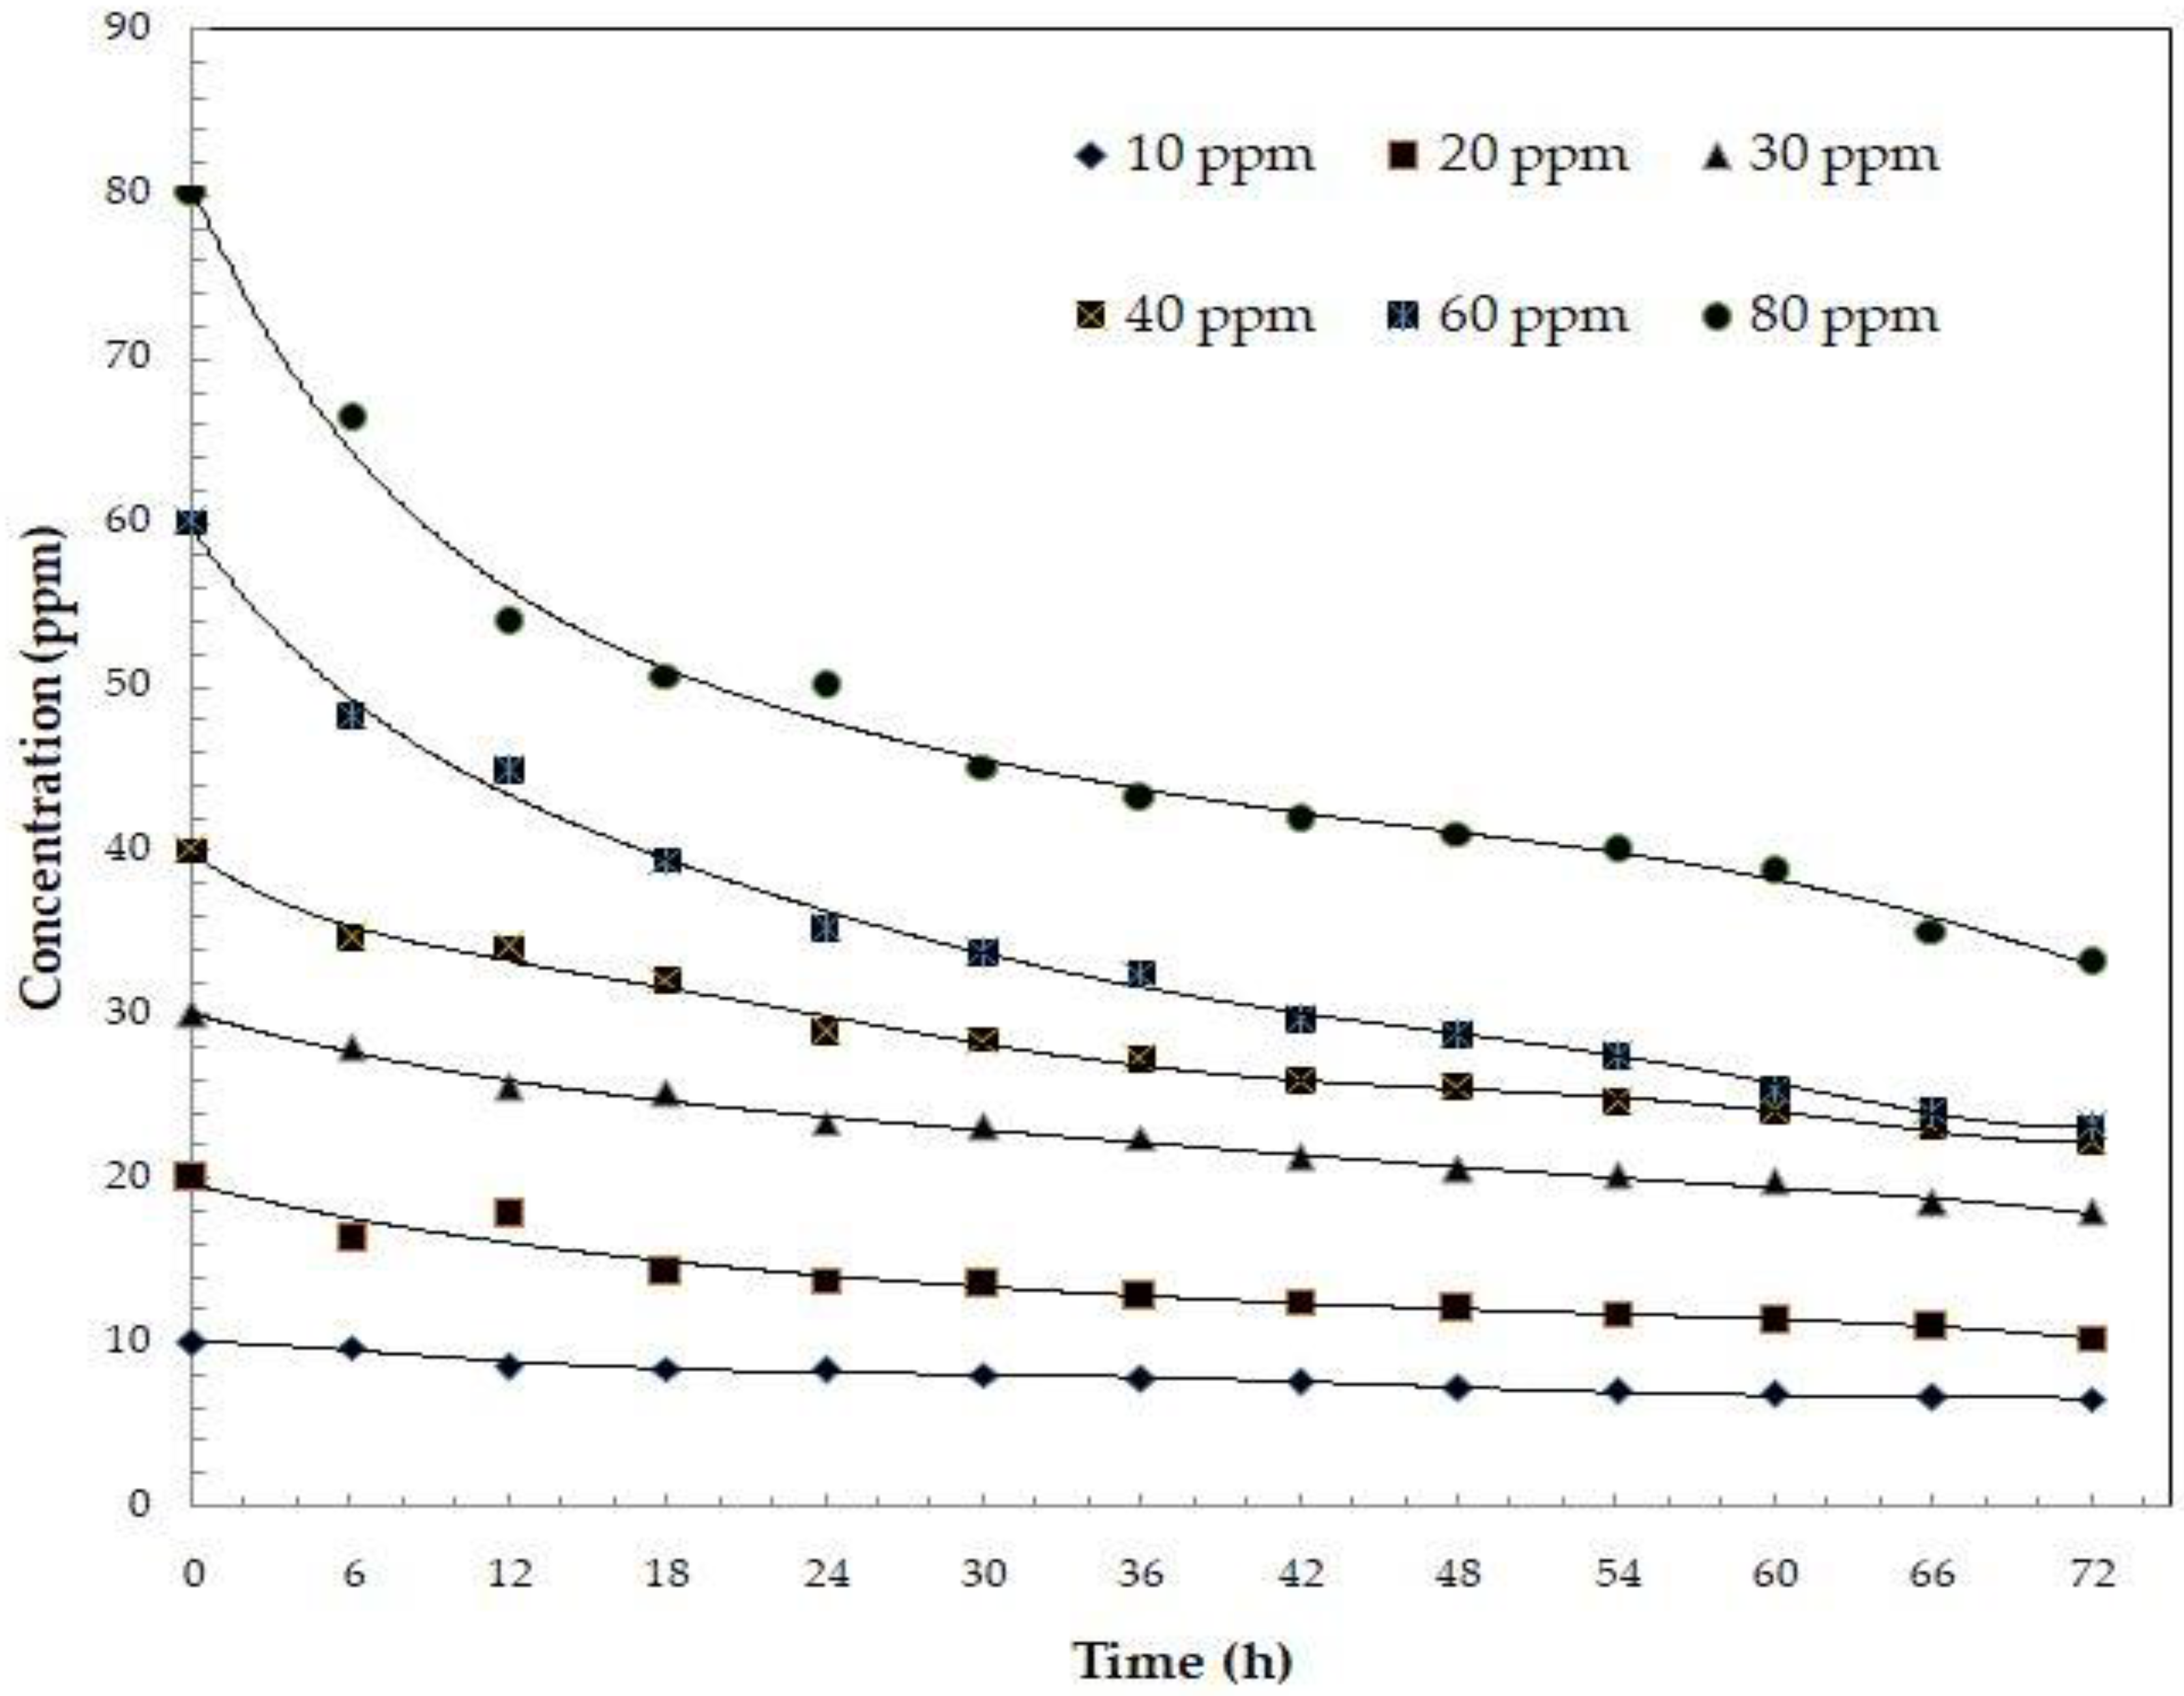
Kinetic Analysis
Proposed Reaction Mechanism
References
- Aguilar, C. A. , Montalvo, C., Ceron, J.G. and Moctezuma, E. (2011). Photocatalytic Degradation of Acetaminophen.Int. J. Environ. Res., 5(4):1071-1078. [CrossRef]
- Aguilar, U. C. , Anguebes F. F., Cerón B. J., Cerón B. R., Córdova Q. A., Montalvo. R. C., Rangel M. M., Zavala L. J. (2012). Tópicos Selectos de Ingeniería Química. ISBN: 978-607-7826-25-5. Primera edición. Cap. 4 (75-89).
- Bello, M. M. , & Raman, A. A. A. (2018). Adsorption and Oxidation Techniques to Remove Organic Pollutants from Water. En: Green Adsorbents for Pollutant Removal (Malaya, Kuala Lumpur, Malaysia), pp. 249-300. https://www.researchgate.net/publication/326012580_Adsorption_and_Oxidation_Techniques_to_Remove_Organic_Pollutants_from_Water.
- Bozena Czech, Katarzyna Rubinowska (2013). TiO2-assisted photocatalytic degradation of diclofenac, metoprolol, estrone and chloramphenicol as endocrine disruptors in water. University of Life Sciences in Lublin, Adsorption 19:619–630. [CrossRef]
- Careghini, A. , Mastorgio, AF, Saponaro, S. & Sezenna, E. (2015). Bisphenol A, nonylphenols, benzophenones, and benzotriazoles in soils, groundwater, surface water, sediments, and food: a review. Environmental Science and Pollution Research. Vol. 22. 5711-5741. https://link.springer.com/article/10.1007%2Fs11356-014-3974-5.
- El Nemr, A. , Helmy, E. T., Gomaa, E. A., Eldafrawy, S., & Mousa, M. (2019). Photocatalytic and Biological Activities of Undoped and Doped TiO2 Prepared by Green Method for Water Treatment. Journal of Environmental Chemical Engineering. Vol. 7(5). 103-385. https://www.sciencedirect.com/science/article/abs/pii/S2213343719305081. [CrossRef]
- Elsayed M., A. (2013). Successive advanced oxidation of pyridine by ultrasonic irradiation:effect of additives and kinetic study. Desalination and Water Treatment,vol 1 pag 1-9. [CrossRef]
- Fogler, H.S. Elements of Chemical Reaction Engineering. Prentice Hall, N.J. 2021. [Google Scholar]
- Frolov, N.A. , Vereshchagin, A. N. (2023). Piperidine Derivatives: Recent Advances in Synthesis and Pharmacological Applications. Int. J. Mol. Sci. 2023, 24, 2937 https:// doiorg/103390/ijms24032937. [Google Scholar]
- Grigor’eva Nellya, G. , Filippova Nadezhda A.,Tselyutina Marina I., Kutepov Boris I. (2015) Synthesis of pyridine and methylpyridines over zeolite catalysts. Appl Petrochem Res., 5: 99–104. [CrossRef]
- 28Gupta, N. , O’Loughlin, E. K. ( 2019). Microbial Degradation of Pyridine and Pyridine Derivatives. Microbial Metabolism of Xenobiotic Compounds, 1–31. [CrossRef]
- He, B. , Zhao, Q., Zeng, Z., Wang, X. & Han, S. (2015). Effect of hydrothermal reaction time and calcination temperature on properties of Au@CeO2 core–shell catalyst for CO oxidation at low temperature. Journal of Materials Science 50(19), 6339–6348. https://link.springer.com/article/10.1007/s10853-015-9181-z. [CrossRef]
- Islam, M. T. , Jing, H., Yang, T., Zubia, E., Goos, A. G., Bernal, R. A., Botez, C. E., Narayan, M., Chan, C. K. & Noveron, J. C. (2018). Fullerene Stabilized Gold Nanoparticle Supported on Titanium Dioxide for Enhanced Photocatalytic Degradation of Methyl Orange and Catalytic Reduction of 4-nitrophenol. Journal of Environmental Chemical Engineering 6(4), 3827-3836. https://www.sciencedirect.com/science/article/abs/pii/S221334371830277X. [CrossRef]
- Kaur, A. , Gupta, G., Ibhadon, A. O., Salunke, D. B., Sinhad, A.S.K. & Kansala, S. K. (2017). A Facile synthesis of silver modified ZnO nanoplates for efficient removal of ofloxacin drug in aqueous phase under solar irradiation. Journal of Environmental Chemical Engineering 6(3), 3621-3630. https://www.sciencedirect.com/science/article/abs/pii/S2213343717302233. [CrossRef]
- Koe, W. S. , Lee, J. W., Chong, W. C., Pang, Y. L. & Sim, L. C. (2020). An overview of photocatalytic degradation: photocatalysts, mechanisms, and development of photocatalytic membrane. Environmental Science and Pollution Research 27, 2522-2565. https://link.springer.com/article/10.1007/s11356-019-07193-5. [CrossRef]
- Matthews, Ralph W and McEvoy Stephen R. (1992) Photocatalytic degradation of phenol in the presence of near-UV illuminated titanium dioxide. Journal of Photochemistry and Photobiology A: Chemistry. Volume 64, Issue 2, 231-246. [CrossRef]
- Marinescu, M; Popa, C. ( 23(10), 5659. [CrossRef]
- Medellin C., N. , Ocampo R., Leyva R. R., Sanchez P. M., Rivera U. J., Méndez D. J. (2013).Removal of diethyl phthalate from water solution by adsorption, photo-oxidation, ozonation and advanced oxidation process (UV/H2O2, O3/H2O2 and O3/activated carbon). Science of The Total Environment. 442., 1: 26-35. [CrossRef]
- Moctezuma, E. , López M., Zermeño B. (2016). Reaction pathways for the photocatalytic degradation of phenol under different experimental conditions. Revista Mexicana de Ingeniería Química. 15: 1, 129-137.
- Mohammed, M. Rahman, SherBahadarKhan, Abdullah M. Asiri, Khalid A. Alamry, AftabAslamParwazKhan, AnishKhan, Malik Abdul Rub, NavedAzum. (2013) Acetone sensor based on solvothermally prepared ZnO doped with Co3O4nanorods. Microchim.ActaVolumen 180, pp 675-685. [CrossRef]
- Montalvo, C. , Aguilar, C., Alcocer, R., Ramirez, M., & Cordova, V. (2018). A Semi-Pilot Photocatalytic Rotating Reactor (RFR) with Supported TiO2/Ag Catalysts for Water Treatment. Molecules 23(1), 224. https://www.ncbi.nlm.nih.gov/pmc/articles/PMC6017124/. [CrossRef]
- Raliya, R. , Avery, C. ( 7, 253–259. [CrossRef]
- Rabiei Marzieh, Palevicius Arvydas, Monshi Ahmad, Nasiri Sohrab, Vilkauskas Andrius and Janusas Giedrius. (2020). 1627. [CrossRef]
- Salah, N. , Hameed, A., Aslam, M., Babkair, S. S., Bahabri, F.S. (2016). Photocatalytic activity of V doped ZnO nanoparticles thin films for the removal of 2- chlorophenol from the aquatic environment under natural sunlight exposure. Journal of Environmental Management, 177, 53-64. [CrossRef]
- Santhi, K. , Manikandan, P. & Rani, C. (2015). Synthesis of nanocrystalline titanium dioxide for photodegradation treatment of remazol brown dye. Appl Nanosci 5, 373-378. https://link.springer.com/article/10.1007/s13204-014-0327-0. [CrossRef]
- Song KeKe, Chen Jian, Song Yun. (2021). The degradation of pyridine wastewater by ozonation catalyzed by calcined zinc-magnesium-aluminum hydrotalcites[J]. Journal of Beijing University of Chemical Technology, 48(2): 8-15. [CrossRef]
- Swarnakar, P. , Kanel S., Nepal D., Jiang Y., Jia H., KerrL., Goltz M., Levy J., Rakovan J. (2013). Silver deposited titanium dioxide thin film for photocatalysis of organic compounds using natural light. Solar Energy 88:242-249. [CrossRef]
- Wang, Z. , Luo, C., Zhang, Y., Gong, Y., Wu, J., Fu, Q. & Pan, C. (2018). Construction of hierarchical TiO2 nanorod array/graphene/ZnO nanocomposites for high-performance photocatalysis. Journal of Materials Science, 53 (22), 15376–15389. [CrossRef]
- Wang, L. , Liu, S., Wang, Z., Zhou, Y., Qin, Y., & Wang, Z. L. (2016). Piezotronic Effect Enhanced Photocatalysis in Strained Anisotropic ZnO/TiO2 Nanoplatelets via Thermal Stress. American Chemical Society Nano, 10, 2636-2643. [CrossRef]
- Zyoud, A. , Zu'bi, A., Helal, M. H. S., Park, D., Campet, G. & Hilal, H. S. (2015). Optimizing photo-mineralization of aqueous methyl orange by nano-ZnO catalyst under simulated natural conditions. Journal of Environmental Health Science and Engineering, 13 (1), 46. [CrossRef]
- Zhang, Y. , Jiang, W., Ren, Y., Wang, B., Liu, Y., Hua, Q. & Tang, J. (2020). Efficient photocatalytic degradation of 2-chloro-4,6-dinitroresorcinol in salty industrial wastewater using glass-supported TiO2. Korean Journal of Chemical Engineering 37(3), 536–545. https://link.springer.com/article/10.1007/s11814-019-0448-y. [CrossRef]
- Zhu, C. , Yue, H., Jia, J., and Rueping, M. (2020).Recent advances in nickel-catalyzed C-heteroatom cross-coupling reactions under mild conditions via facilitated reductive elimination Angew. Chem. Int. Ed. Vol 60(33). 17810-17831.
- Anwer, H. , Mahmood, A., Lee, J., Kim K., Park J., Yip A. (2019). Photocatalysts for degradation of dyes in industrial effluents: Opportunities and challenges. Nano Res. Vol. 12. 955–972. [CrossRef]
- Badvi, K y Javanbakht, V. (2021). Enhanced photocatalytic degradation of dye contaminants with TiO2 immobilized on ZSM-5 zeolite modified with nickel nanoparticles. Journal of Cleaner Production 280(2), 124518. https://www.sciencedirect.com/science/article/abs/pii/S0959652620345625. [CrossRef]
- Ashok, K. , Suraj K., Sabnaz K., Nandan S., Subhasis B. and Sanjay D. (2022). Pyridine: the scaffolds with significant clinical diversity Sourav D., RSC Adv., 12, 15385. [CrossRef]
- Hasan, A. K. M. M. , Dey, S. C., Rahman, M. M., Zakaria, A. M., Sarker, M., Ashaduzzaman, M.D. & Shamsuddin, S. M. D. (2020). A kaolinite/TiO2/ZnO-based novel ternary composite for photocatalytic degradation of anionic azo dyes. Bulletin of Materials Science 43(1), 27. https://link.springer.com/article/10.1007/s12034-019-1964-4. [CrossRef]
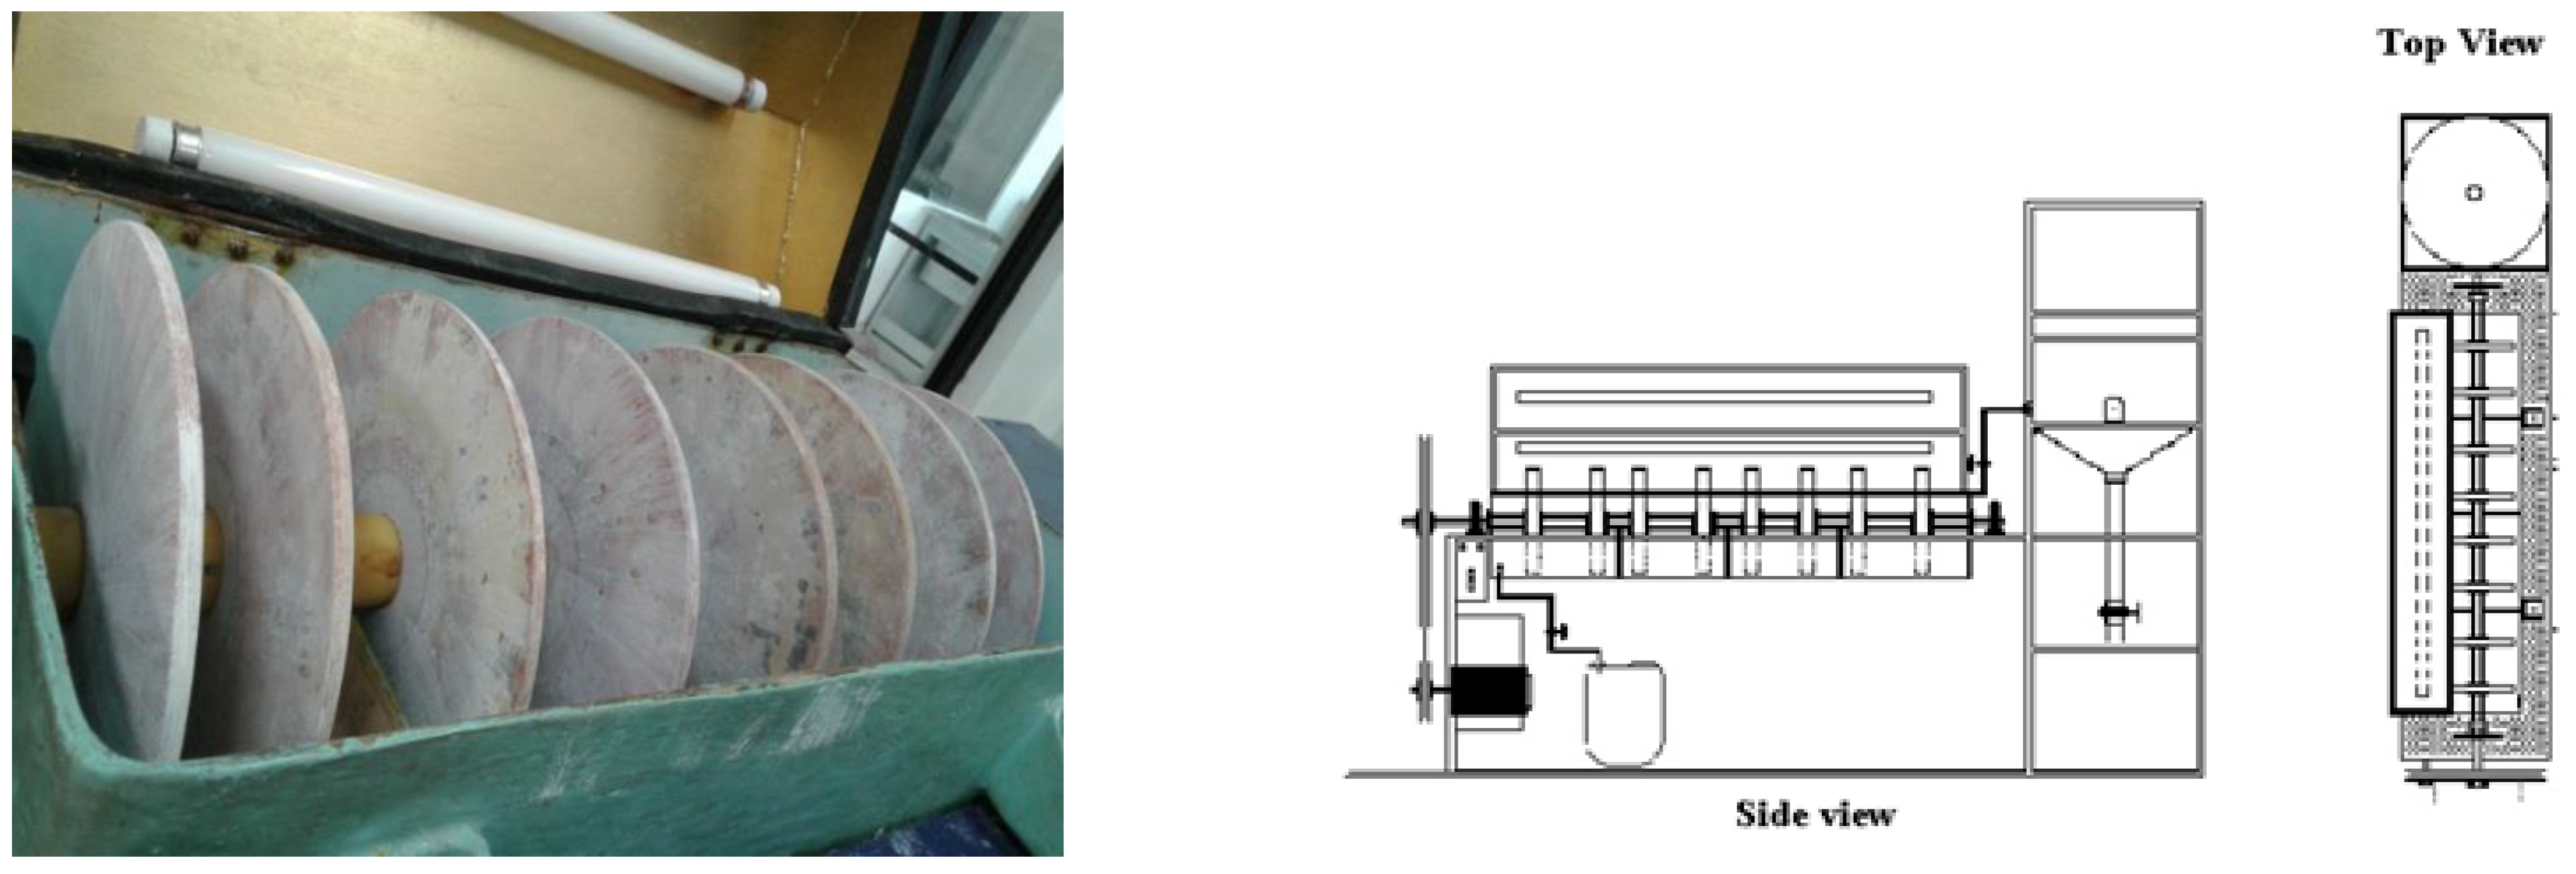
| Number of stages | 4 |
| Number of disks per stage | 2 |
| Disk diameter | 0.23 m |
| Disk thickness | 0.008 m |
| Total area of undoped disks | 0.66476 m2 |
| Total area of doped disks | 329.7209 m2 |
| Area per stage | 41.21512 m2 |
| Total reactor volume | 14.8 L |
Disclaimer/Publisher’s Note: The statements, opinions and data contained in all publications are solely those of the individual author(s) and contributor(s) and not of MDPI and/or the editor(s). MDPI and/or the editor(s) disclaim responsibility for any injury to people or property resulting from any ideas, methods, instructions or products referred to in the content. |
© 2024 by the authors. Licensee MDPI, Basel, Switzerland. This article is an open access article distributed under the terms and conditions of the Creative Commons Attribution (CC BY) license (http://creativecommons.org/licenses/by/4.0/).


