1. Introduction
Most diagnostics are performed by trained personnel using specialized instruments in laboratory setting [
1]. The time required to obtain results can vary depending on several factors, including the type of sample being analyzed, the specific test being conducted, and whether the sample needs to be transported from the collection site to a laboratory facility [
2]
. In recent years, there has been a growing demand for point-of-care testing (POCT) that offers rapid, simple and cost-effective diagnosis. POCT is particularly valuable in developing countries where access to healthcare facilities and advanced laboratory equipment may be limited. These tests allow for quick decision-making and can potentially improve patient outcomes by enabling timely interventions.
The World Health Organization (WHO) and the Food and Drug Administration (FDA) have recognized the importance of POCT and actively support its development. To ensure the quality and effectiveness of these tests, they have established the REASSURED criteria, which define the standards for ideal point-of-care tests. These criteria include Real-time connectivity, Ease of specimen collection and environmental friendliness Affordable, Sensitive, Specific, User-friendly, Rapid and robust, Equipment-Free, Deliverable to end users [
3,
4]
. These criteria aim to ensure that POCTs are not only accurate and reliable but also practical for use in various settings, including resource-limited areas.
In the field of genetic tests the sequencing and polymerase Chain Reaction (PCR) are the best-known. Next-generation sequencing (NGS) has become a cornerstone in modern diagnostics, allowing precise identification of genetic disorders and mutations. However, the high cost of NGS limits its widespread adoption, and interpreting NGS data requires specialized expertise to ensure accurate and meaningful results. PCR, which amplifies DNA using two primers complementary to the target sequence, relies on precise temperature changes controlled by sophisticated instruments for the denaturation, annealing, and extension phases. Both NGS and PCR require significant expertise in instrument operation and protocol optimization to achieve accurate and reproducible results, making them unsuitable for POCT applications.[
5].
To address these limitations, isothermal amplification techniques have gained attention for the development of genetic POCT. These methods operate at a constant temperature, eliminating the need for a thermocycler. There are many isothermal amplification methods which can be classified into three categories [
6]: exponential amplification[
7,
8,
9,
10,
11,
12,
13,
14,
15], linear amplification[
7,
16] and in cascade amplification[
17,
18].
Each method has its unique characteristics; for instance, some are limited to RNA amplification (e.g., NASBA, SMART), while others require multiple enzymes (e.g., NASBA, SDA). The number of primers and operational temperatures also vary depending on the method used, with most techniques operating between 30°C and 65°C.
To meet POCT criteria, various devices have been developed to standardize protocols and reduce turnaround times. Examples include the Genie II [
19], Twista [
20], Nuclisens EasyQ [
21], Samba II [
22,
23]. Field devices have also been created to eliminate the need for complex equipment, using alternatives like heating blocks [
24,
25,
26,
27], hot plate [
28] or heating pad [
29] for the heating step
.
Moreover, certain devices may incorporate a heating process [
30,
31,
32,
33,
34,
35]. Additionally, to reduce overall costs associated with fluorescence detection, which requires a UV light source, colorimetric detection methods are often preferred for POCT applications. The amount of manipulation should be also significantly decreased, lowering the possibility of contamination and "human" error.
It is important to note that the sample preparation stage, often overlooked, can be time-consuming and may require laboratory tools. Some studies use pure DNA samples or do not integrate the preparation stage into the device, which limits their real-life application.
In previous research, we described a device called SPID (Sampling, Processing, Incubation, Detection), which integrates all steps from sample processing to detection without requiring instruments or electrical power. The entire process is completed in a few simple steps. This device has been validated for detecting antibiotic resistance directly from blood cultures, urine, or rectal swabs [
36,
37,
38]. The detection is performed by a lateral flow immunoassay (LFIA) integrated into the device, and the result can be read visually or with a portable reader.
The objective of this study was to develop a POC test for genetic detection that integrates all steps from sample processing to result interpretation without the need for complex equipment. To achieve this, we employed Loop-Mediated Isothermal Amplification (LAMP), a technique first described by Notomi [
14]. Although the high number of primers used in LAMP ensures high specificity, it also introduces a risk of primer dimer formation, making primer design a critical step [
39]. The LAMP technique was adapted to the SPID device to create a simple, rapid process that integrates sample preparation, LAMP reaction, and detection by LFIA. This test is a nucleic acid lateral flow immunoassay (NALFIA) [
40].
For validation of the device, the
E. coli malB gene, which codes for maltose operon protein B (GenBank sequence: GDB J01648), was chosen as the target for LAMP amplification. This gene is conserved across different
E. coli lineages but is not common in other gram-negative bacteria, making it an ideal target for specific identification of
E. coli [
41]. The development of this integrated LAMP-based POCT device represents a significant step forward in bringing genetic testing capabilities to resource-limited settings and enabling rapid, on-site diagnosis of bacterial infections.
2. Materials and Methods
2.1. Reagents
Unless otherwise mentioned all the chemicals were from Sigma (Saint Quentin Fallavier, France). Bovine serum albumin (BSA), casein and streptavidin were from Sigma-Aldrich. Goat Anti-Mouse (GAM) IgG and IgM polyclonal antibodies were from Jackson ImmunoResearch (Baltimore, USA). Monoclonal antibody anti-biotin (Z021) and Betaine anhydrous were from Thermo fisher Scientific (Waltman, USA). Nitrocellulose strips with polystyrene backing (Prima 40), samples (Standard 14) and absorbent (CF5) pads were from Cytiva (Freiburg, Germany). Culture media: Luria Broth (LB) and LB agar are from Sigma-Aldrich. Colloidal gold particles were from NG Biotech Laboratories (Guipry, France). LAMP fluorescent dye, Deoxynucleotide (dNTP) solution mix, magnesium sulfate (MgSO4) solution and Bst 2.0 Warm Start DNA Polymerase were from New England Biolabs France (Evry, France).
2.2. Solutions Composition
2.2.1. Conjugate Buffer
Tris-HCl 0.1M pH8; 0.1% BSA; 0.15M NaCl; 1% CHAPS; 0.5% Tween 20; 0.01%NaN3.
2.2.2. LAMP Reaction Solution
Tris-HCl 30 mM pH 8.8; BIP and FIP 1.6µM; LB and LF 0.4µM; B3 and F3 0.2 µM; 0.1% BSA; 1% CHAPS; 0.1% Triton X100; 0.5% Tween 20; NaCl 3mM; 10 mM KCl; (NH4)2 SO4 10 mM; MgSO4 4mM; dNTP 0.4mM; betaine 250 mM.
2.3. Bacterial Strains
For the validation, 32 bacterial isolates were used to evaluate the All-in-one NALFIA test, including a variety of bacterial species: Escherichia coli, Klebsiella pneumoniae, Enterobacter cloacae, Citrobacter freundii, Citrobacter koseri, Klebsiella oxytoca, Pseudomonas aeruginosa and Proteus mirabilis. This collection represented 12 E. coli strains and 20 non-E. coli strains. For each strain an overnight preculture is realised at 37°C in LB broth. Then a 100 fold dilution is made in LB broth and this solution is incubated at 37°C for 2 hours and using a densitometer a suspension at 108 cfu/ml is prepared.
2.4. Preparation of Colloidal Gold Labelled Monoclonal Antibody and Streptavidin
25 µl of a 1mg/ml solution of monoclonal antibody or streptavidin in 20 mM phosphate buffer (pH 7.4) was added to 2 OD (520 nm) of colloidal gold particles and the solution is completed to 250 µl with 20 mM borate buffer (pH 9). The mixture was incubated for 1h at 20°C, allowing the adsorption of the proteins to the surface of the gold particles. 125 µl of a solution containing 10 mM borate buffer (pH 9) and 0.3% casein was then added, and the solution was centrifuged for 10 min at 10,000 g. The supernatant was discarded, and the pellet was suspended in 1 ml of 10 mM borate buffer (pH 9) and 0.1% casein, sonicated for a few seconds, and centrifuged for 10 min at 10,000 g. The supernatant was discarded, and the pellet was suspended in 250µl of 10 mM borate buffer (pH 9) and 0.1% casein and stored at 4°C in the dark. The solution obtained corresponds to the conjugate used for the strip tests.
2.5. Primers Design
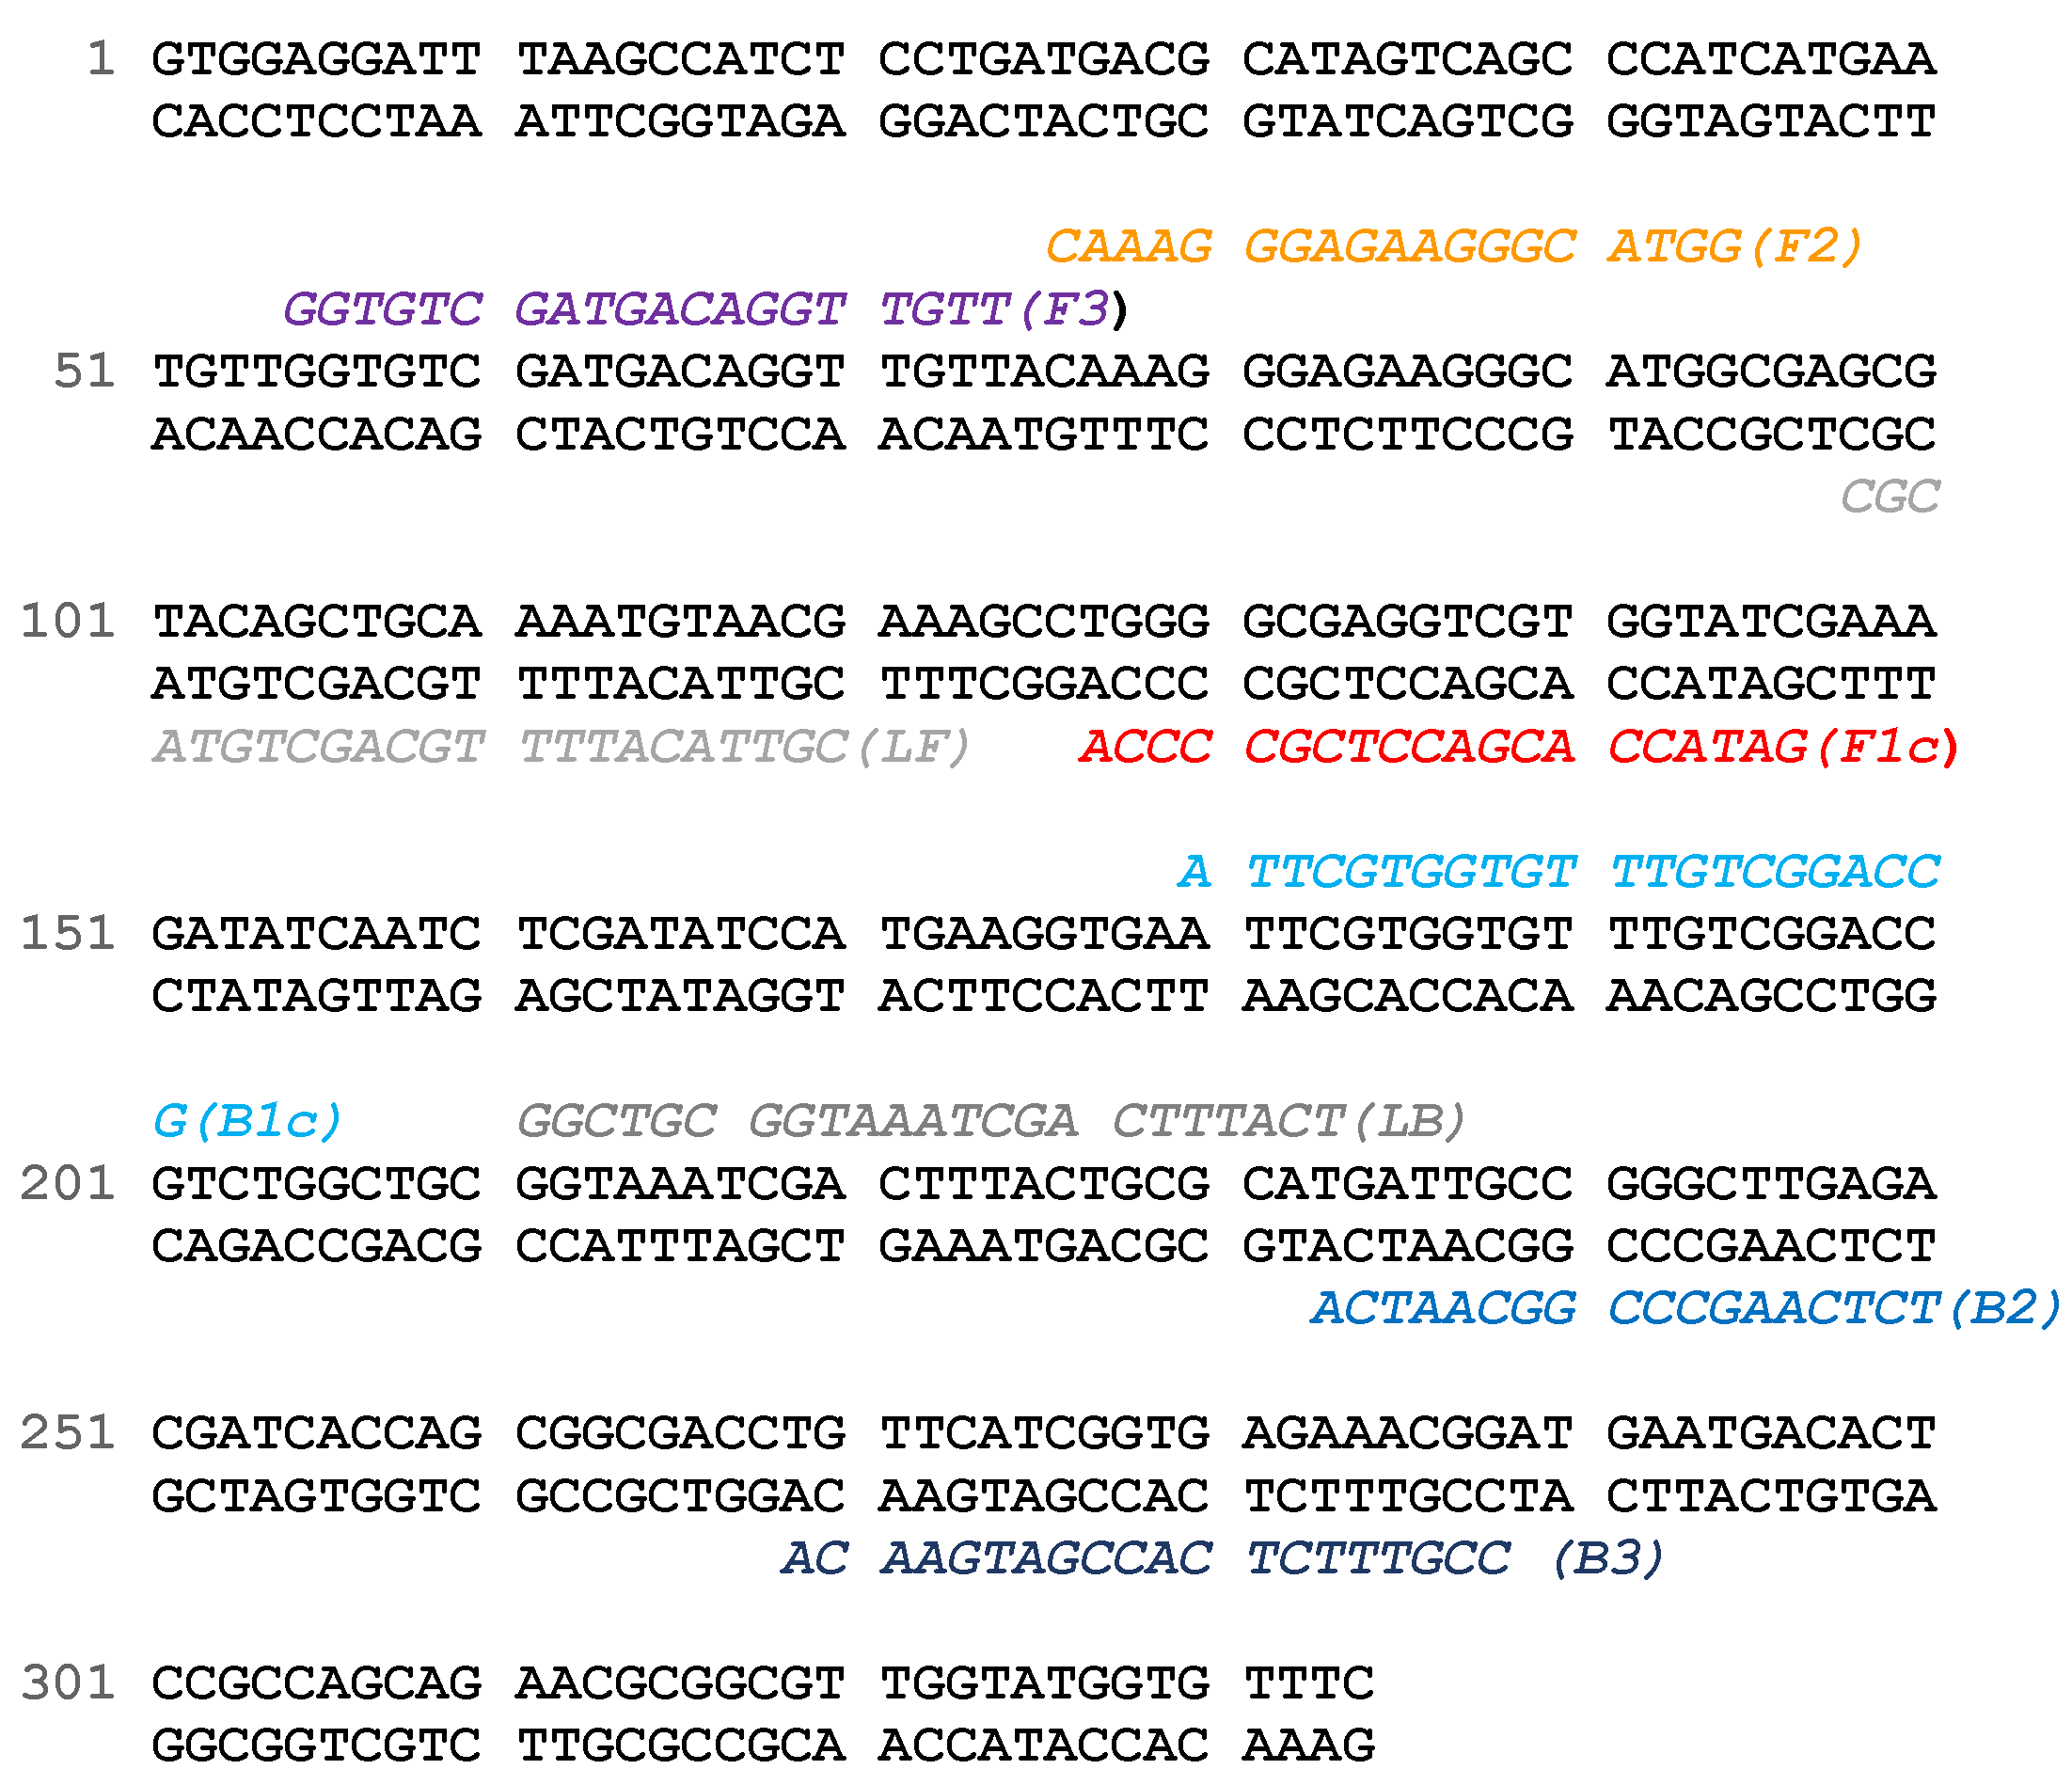
The LAMP primer sets composed of two inner primers (FIP (F1c-F2) and BIP (B1c-B2)), two outer primers (F3 and B3) and two loop primers (LF and LB) for the detection of the malB gene. These primers were designed using the NEB LAMP Primer Design Tool software (NEB, Evry, France) (
Table 1 and
Figure 1). For our test FIP and BIP were labelled with digoxigenin and biotin respectively. Primers were purchased from Eurogentec (Seraing, Belgium).
2.6. Strips Production
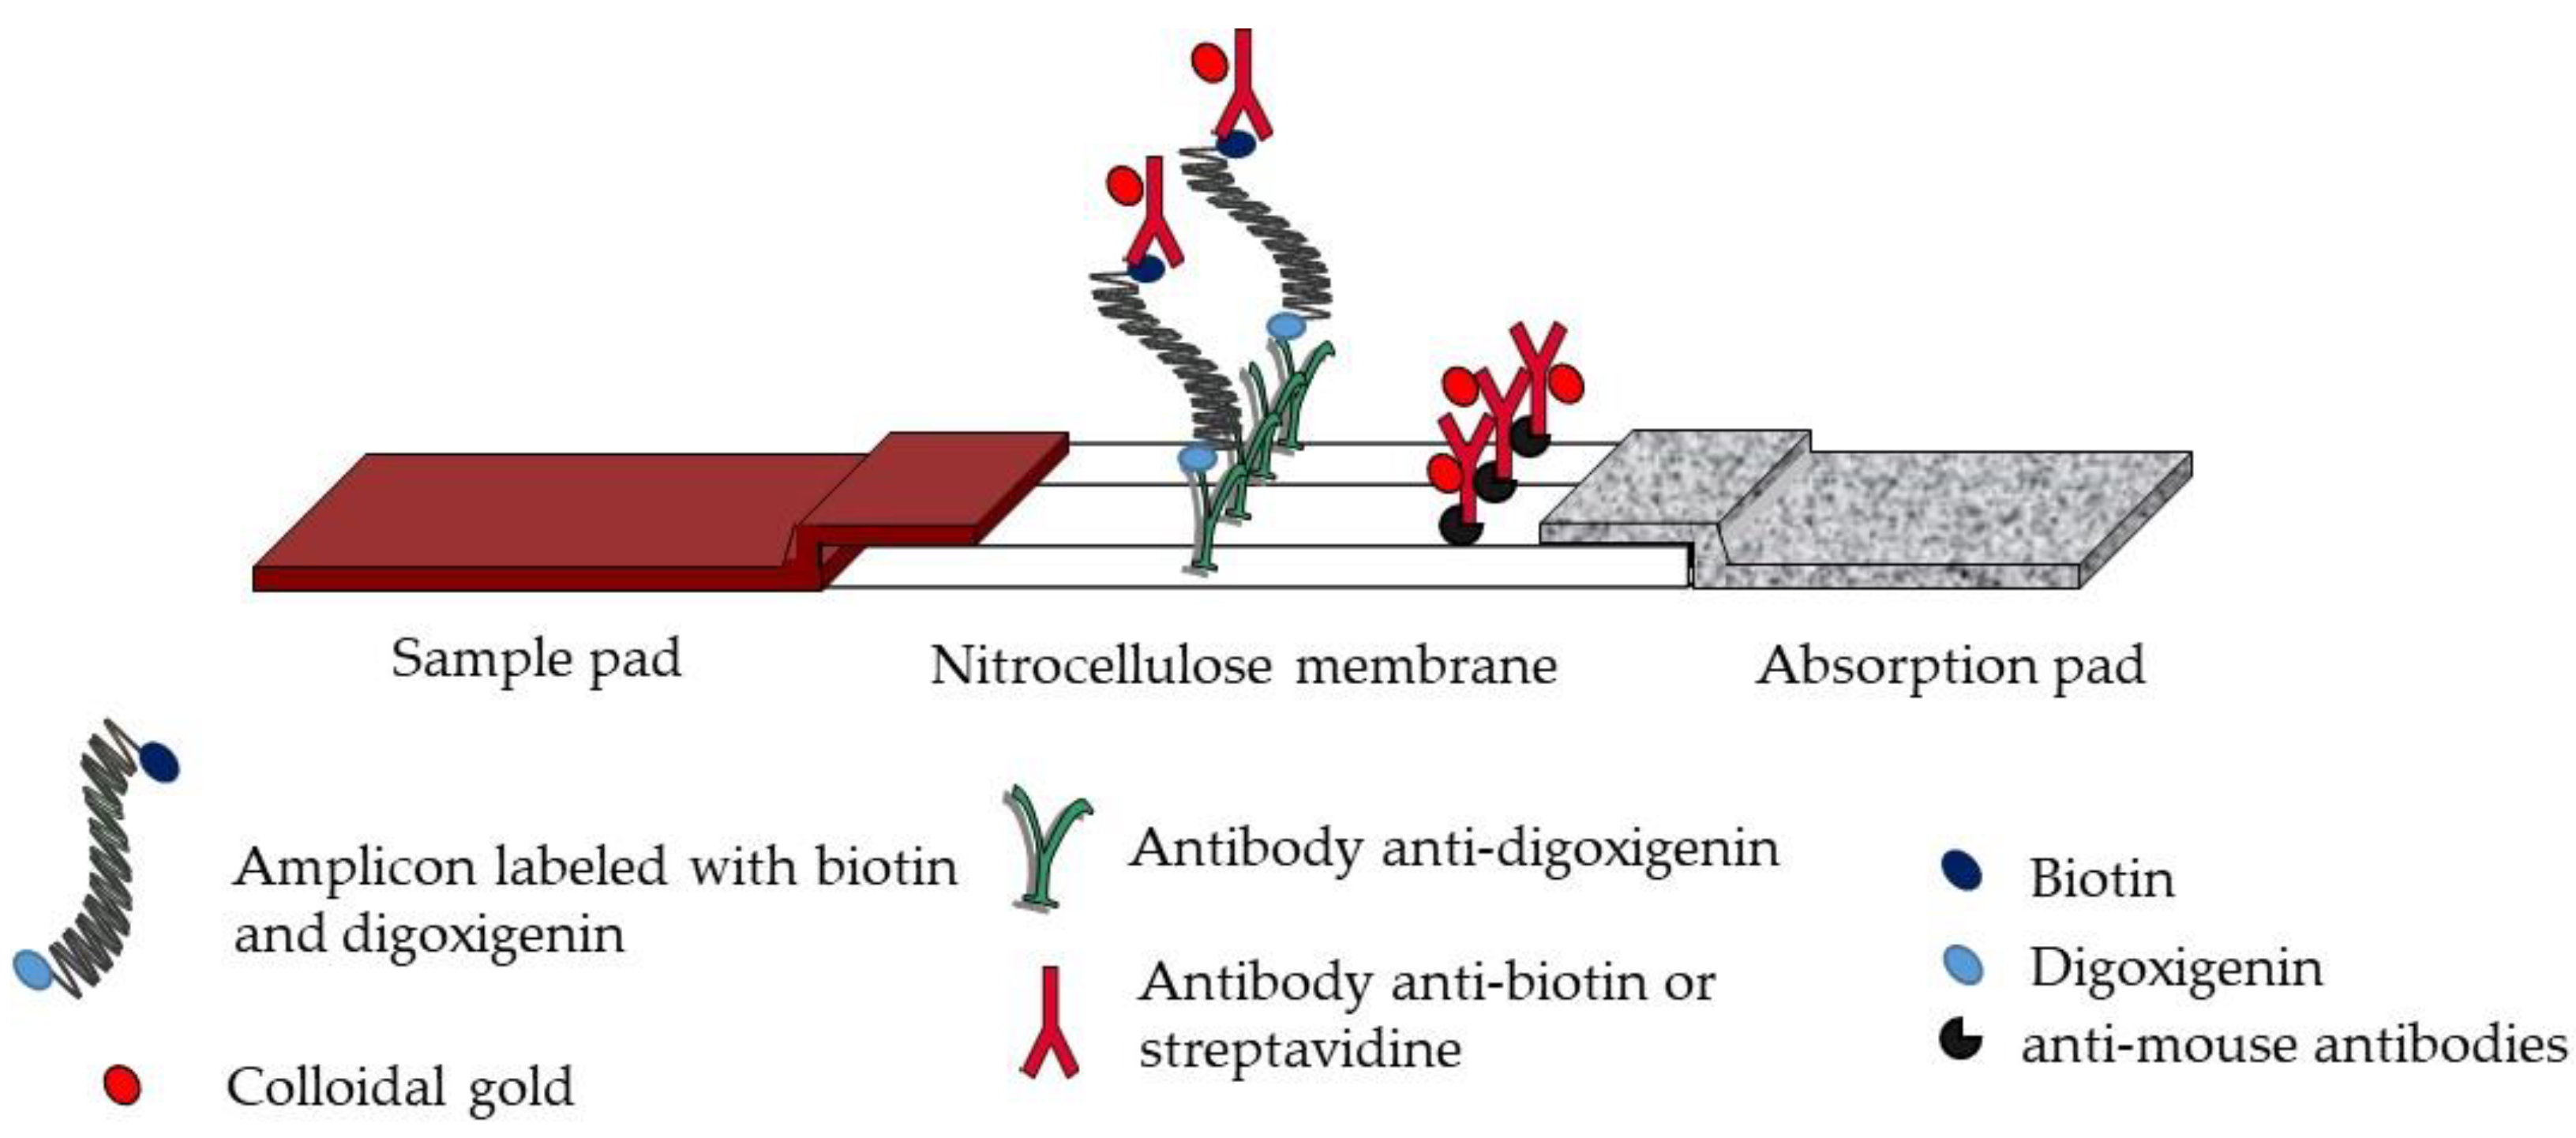
The test strip involves a sample pad, a nitrocellulose membrane, and an absorption pad, all attached to a backing card. The detection zone involves immobilized anti-digoxigenin antibodies, produced by our laboratory, as test line and anti-mouse antibodies (Goat anti-mouse immunoglobulins, Jackson ImmunoResearch, Baltimore, USA) as control line (0.8 and 0.5 mg/ml in 50 mM potassium phosphate buffer pH 7.4, respectively) dispensed at 1 μl/cm using an automatic dispenser (DCI-300; Zeta corporation, Gyeonggi-do, Korea). After drying for 30 min at 37°C in an air oven, the absorption pad and the sample pad were stucked to the top and the bottom edges of the membrane respectively. The membranes were cut into strips of 5 mm width using an automatic programmable cutter (Guillotine Cutting CM4000; BioDot Irvine USA). Then the strips are placed into plastic cassette and stored at room temperature with dessicant. A conjugate pad (standard 14) can be added between the sample pad and the nitrocellulose. In this case 10µl of the conjugate are dryied on this pad. Test strip were inserted into a plastic cassette (
Figure 2).
2.7. SPID Platform
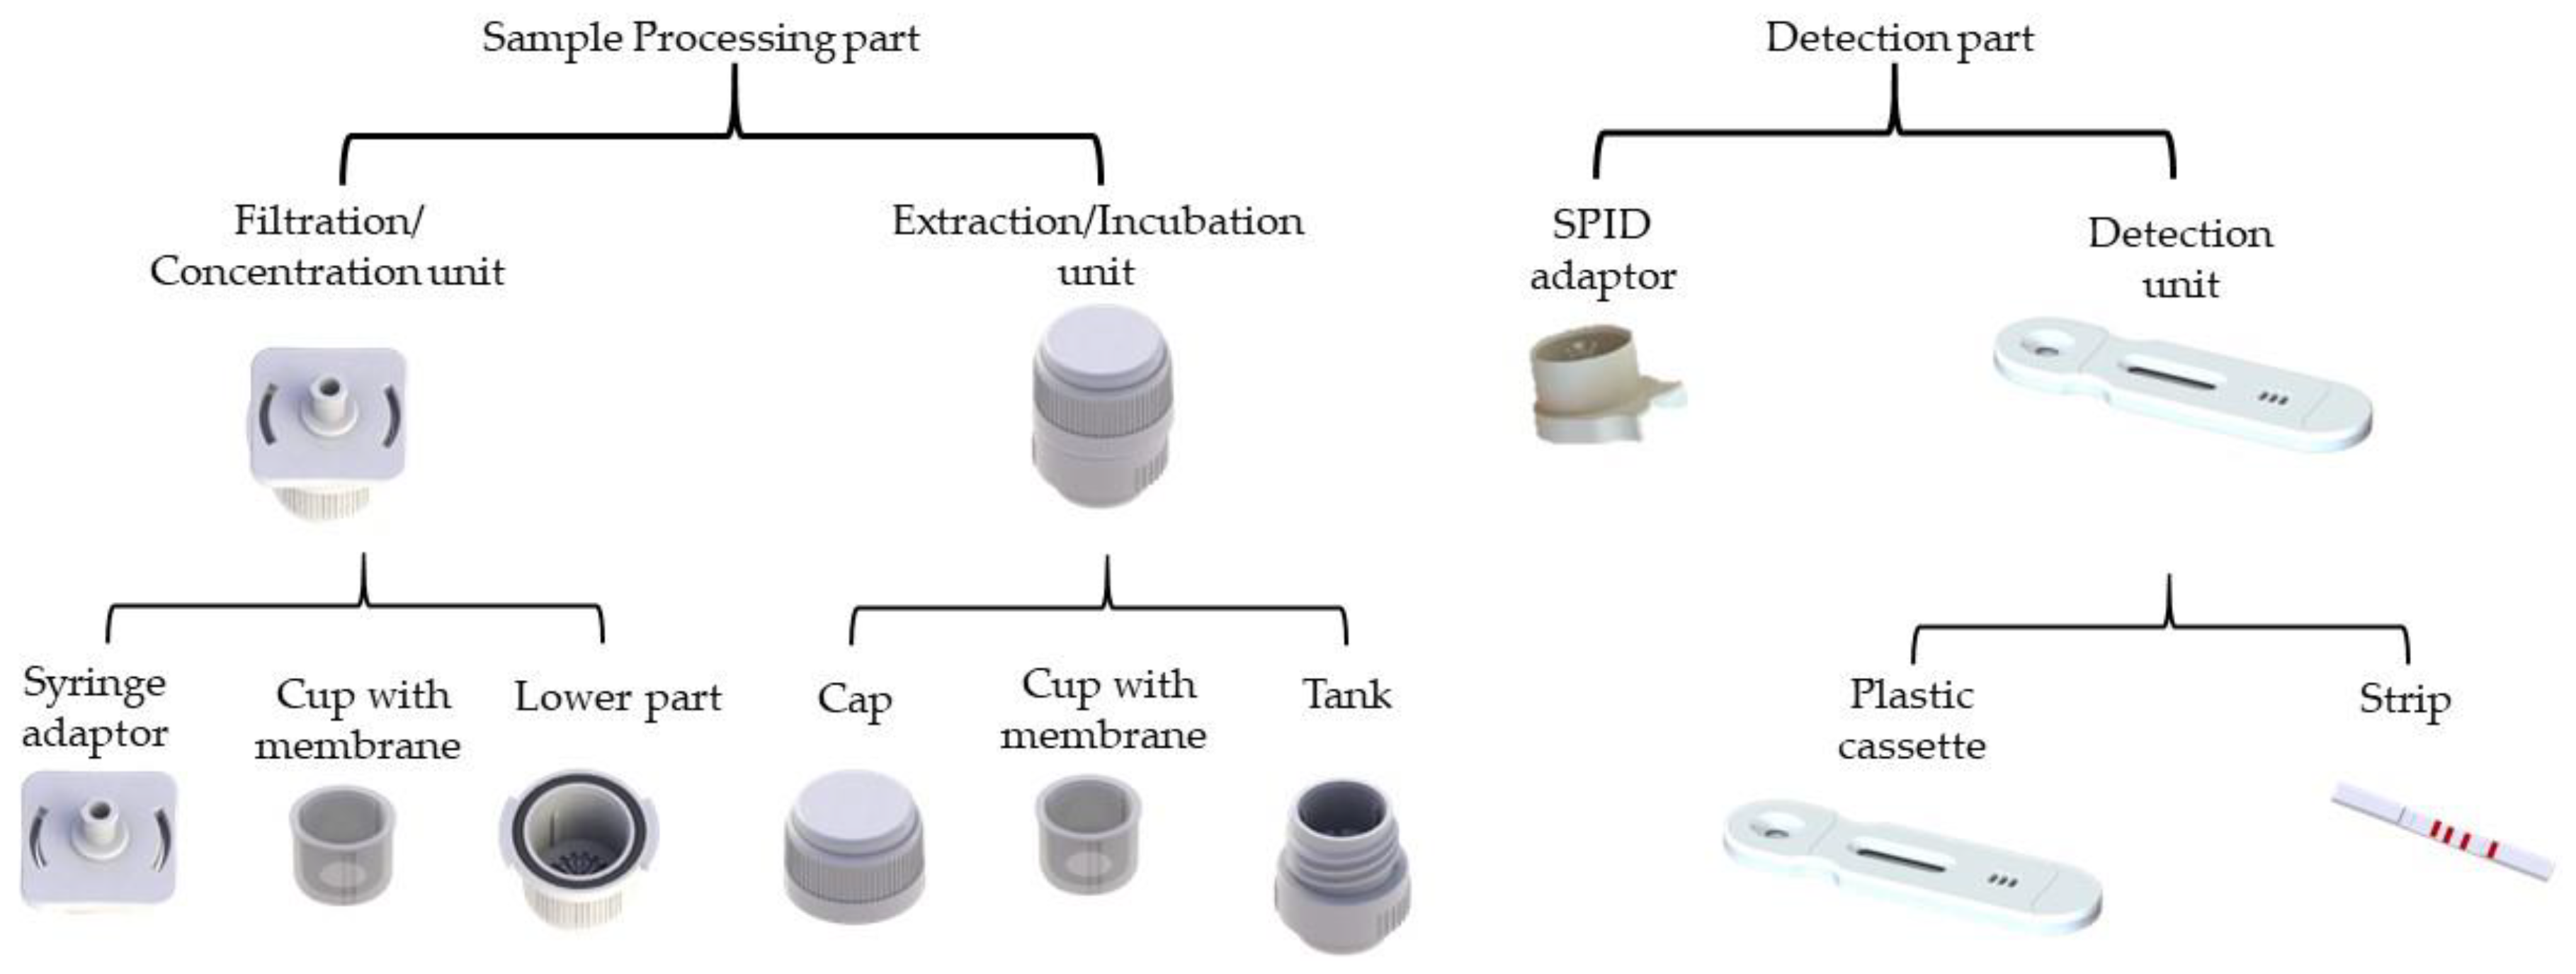
The SPID (Sampling, Processing, Incubation, Detection) platform is a versatile device composed of two parts (
Figure 3): (i) the processing part, which includes a filtration/concentration unit with a syringe adaptor, a cup with a 0.45 μm pore size membrane, and a lower part; and an extraction unit, comprising a cap with a plunger and a tank; and (ii) the detection part, which consists of a SPID adaptor which connect the cassette with the tank and a plastic cassette integrating a lateral flow immunochromatographic strip (
Figure 2). The SPID platform patented by the CEA (EP3528947) is produced by NG Biotech Laboratories.
2.8. Heating Station
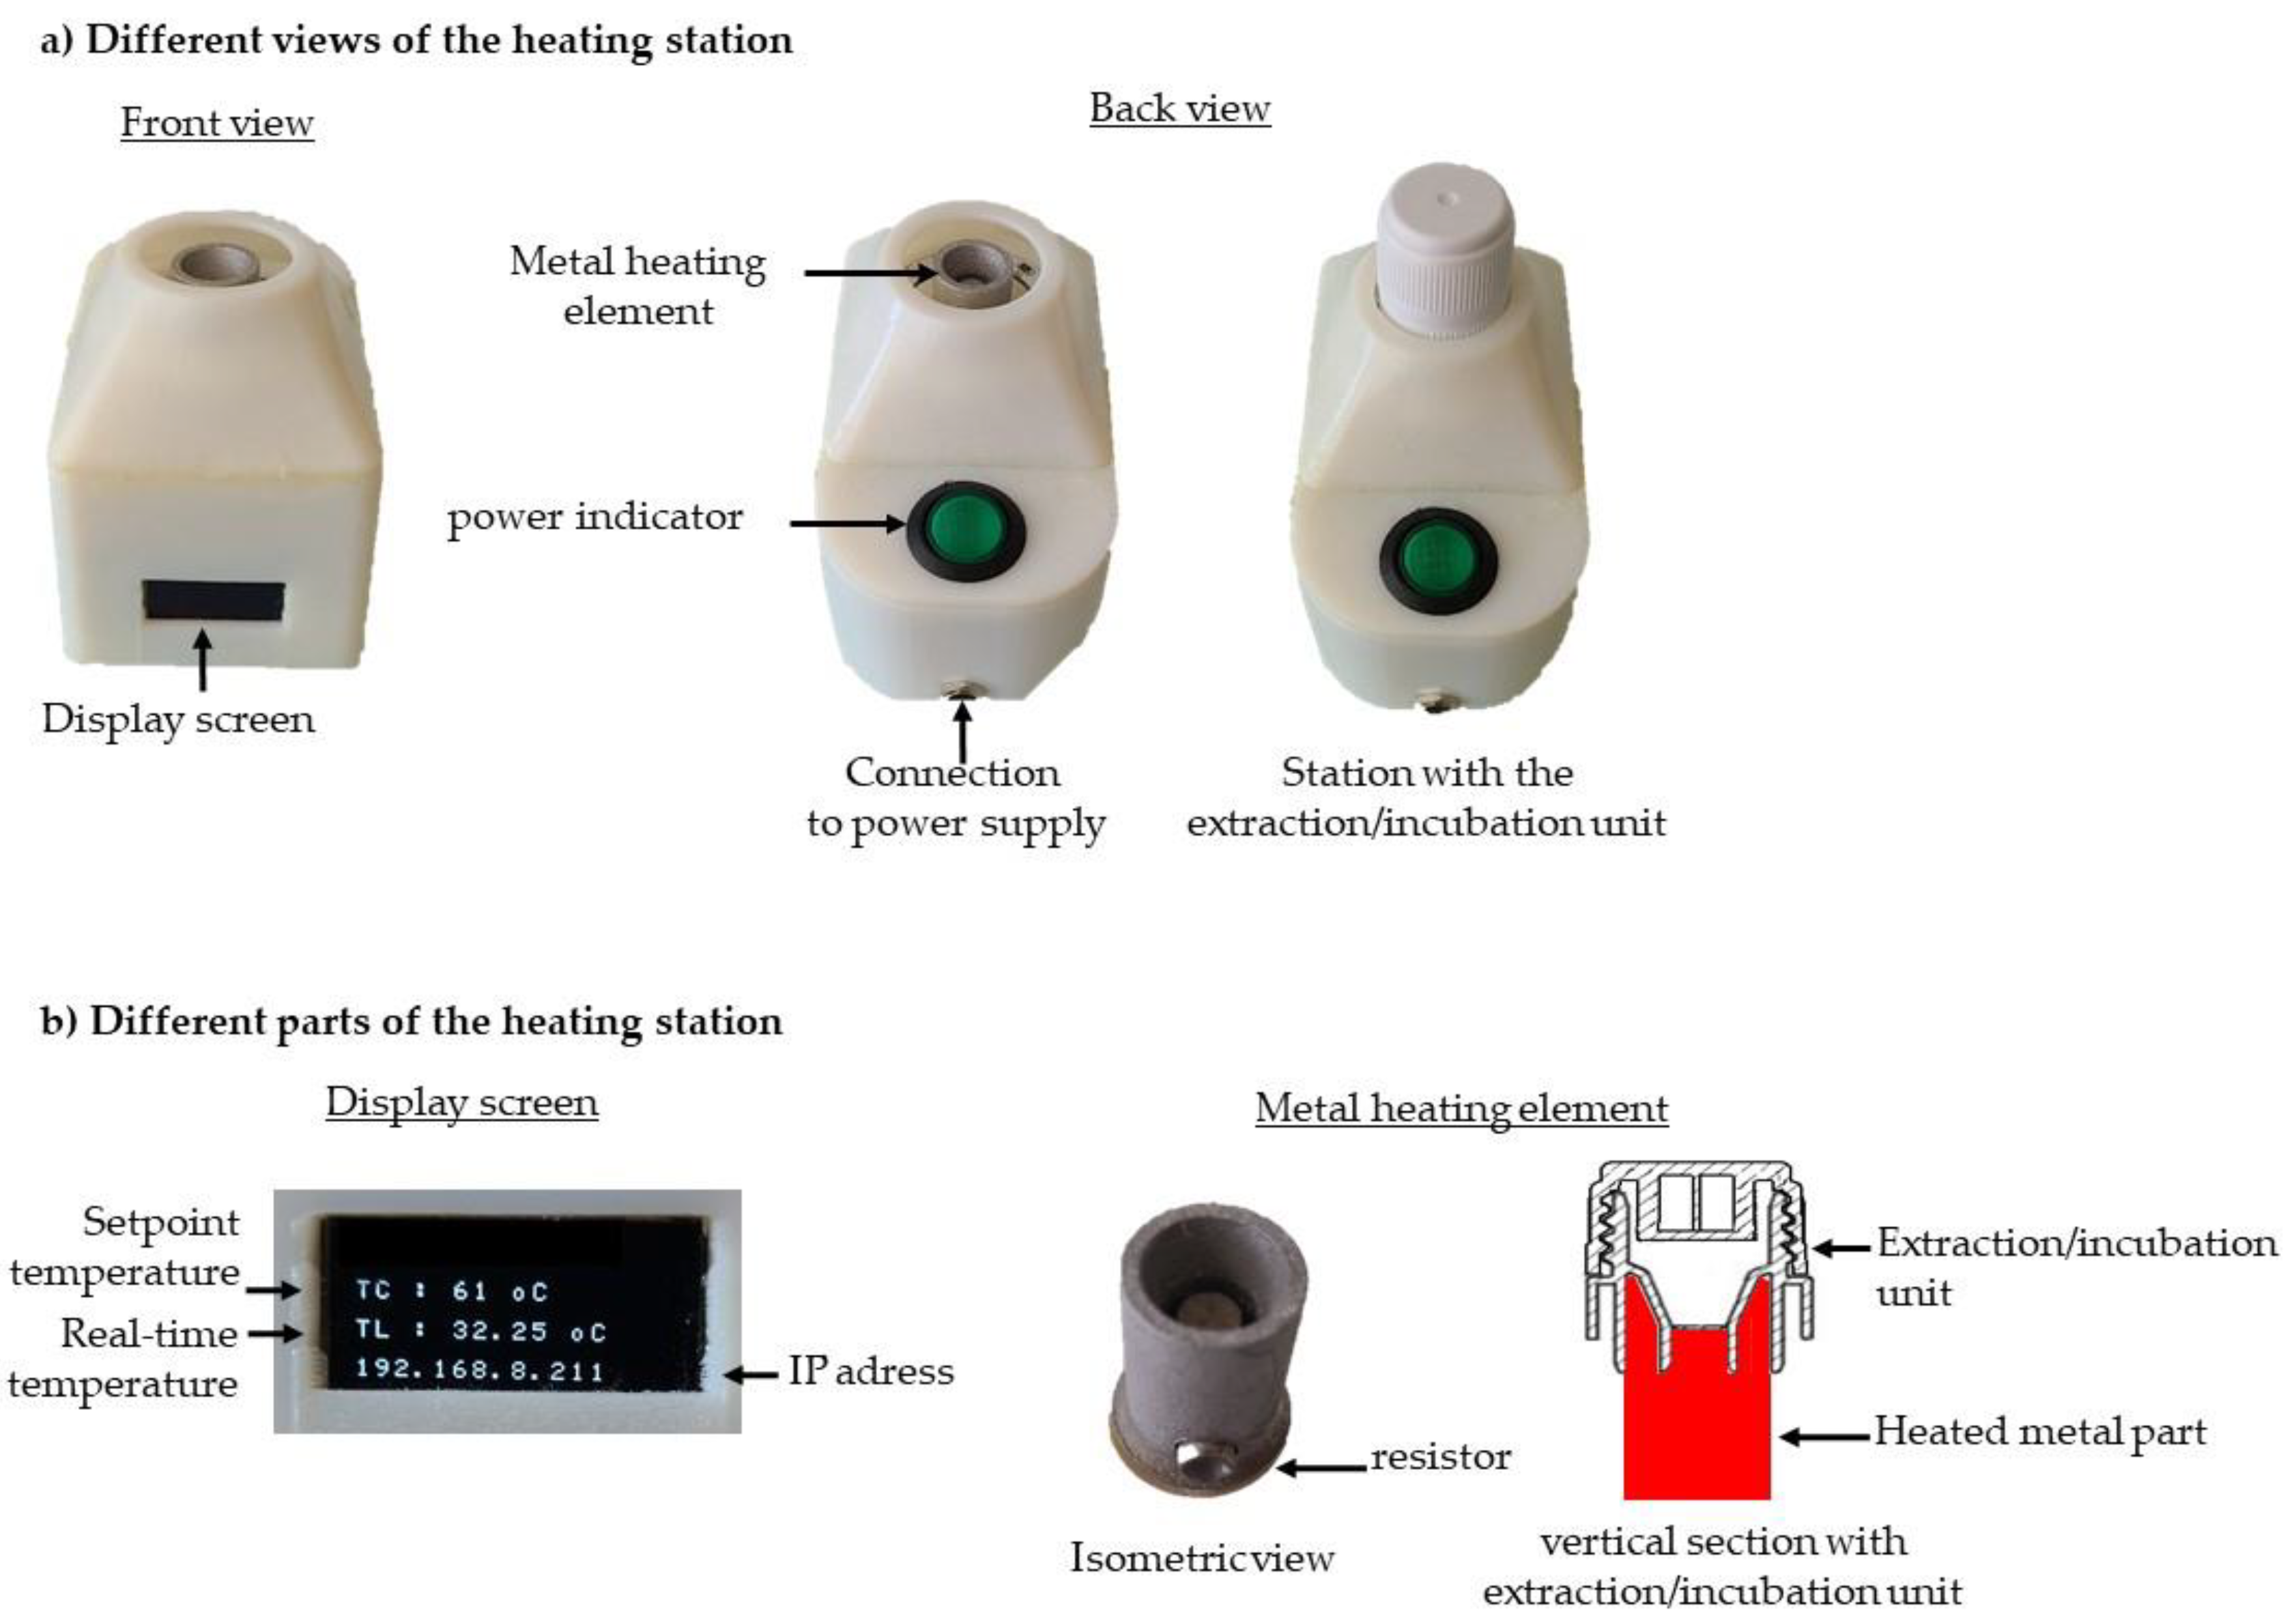
The heating station (
Figure 4) comprises a metal heating element, a display screen, a control card, and a Wi-Fi module. The metal element is heated by an integrated resistor and is specifically designed to fit snugly around the base of the incubation tank (
Figure 4b). All these components are assembled inside a plastic housing. The plastic housing and the metal element were manufactured using 3D printing technology. The display screen (
Figure 4b) provides real-time information, including the set temperature, the temperature measured at the metal element, and the station's IP address. This allows for independent programming and precise temperature control for each heating station.
2.9. LAMP Amplification
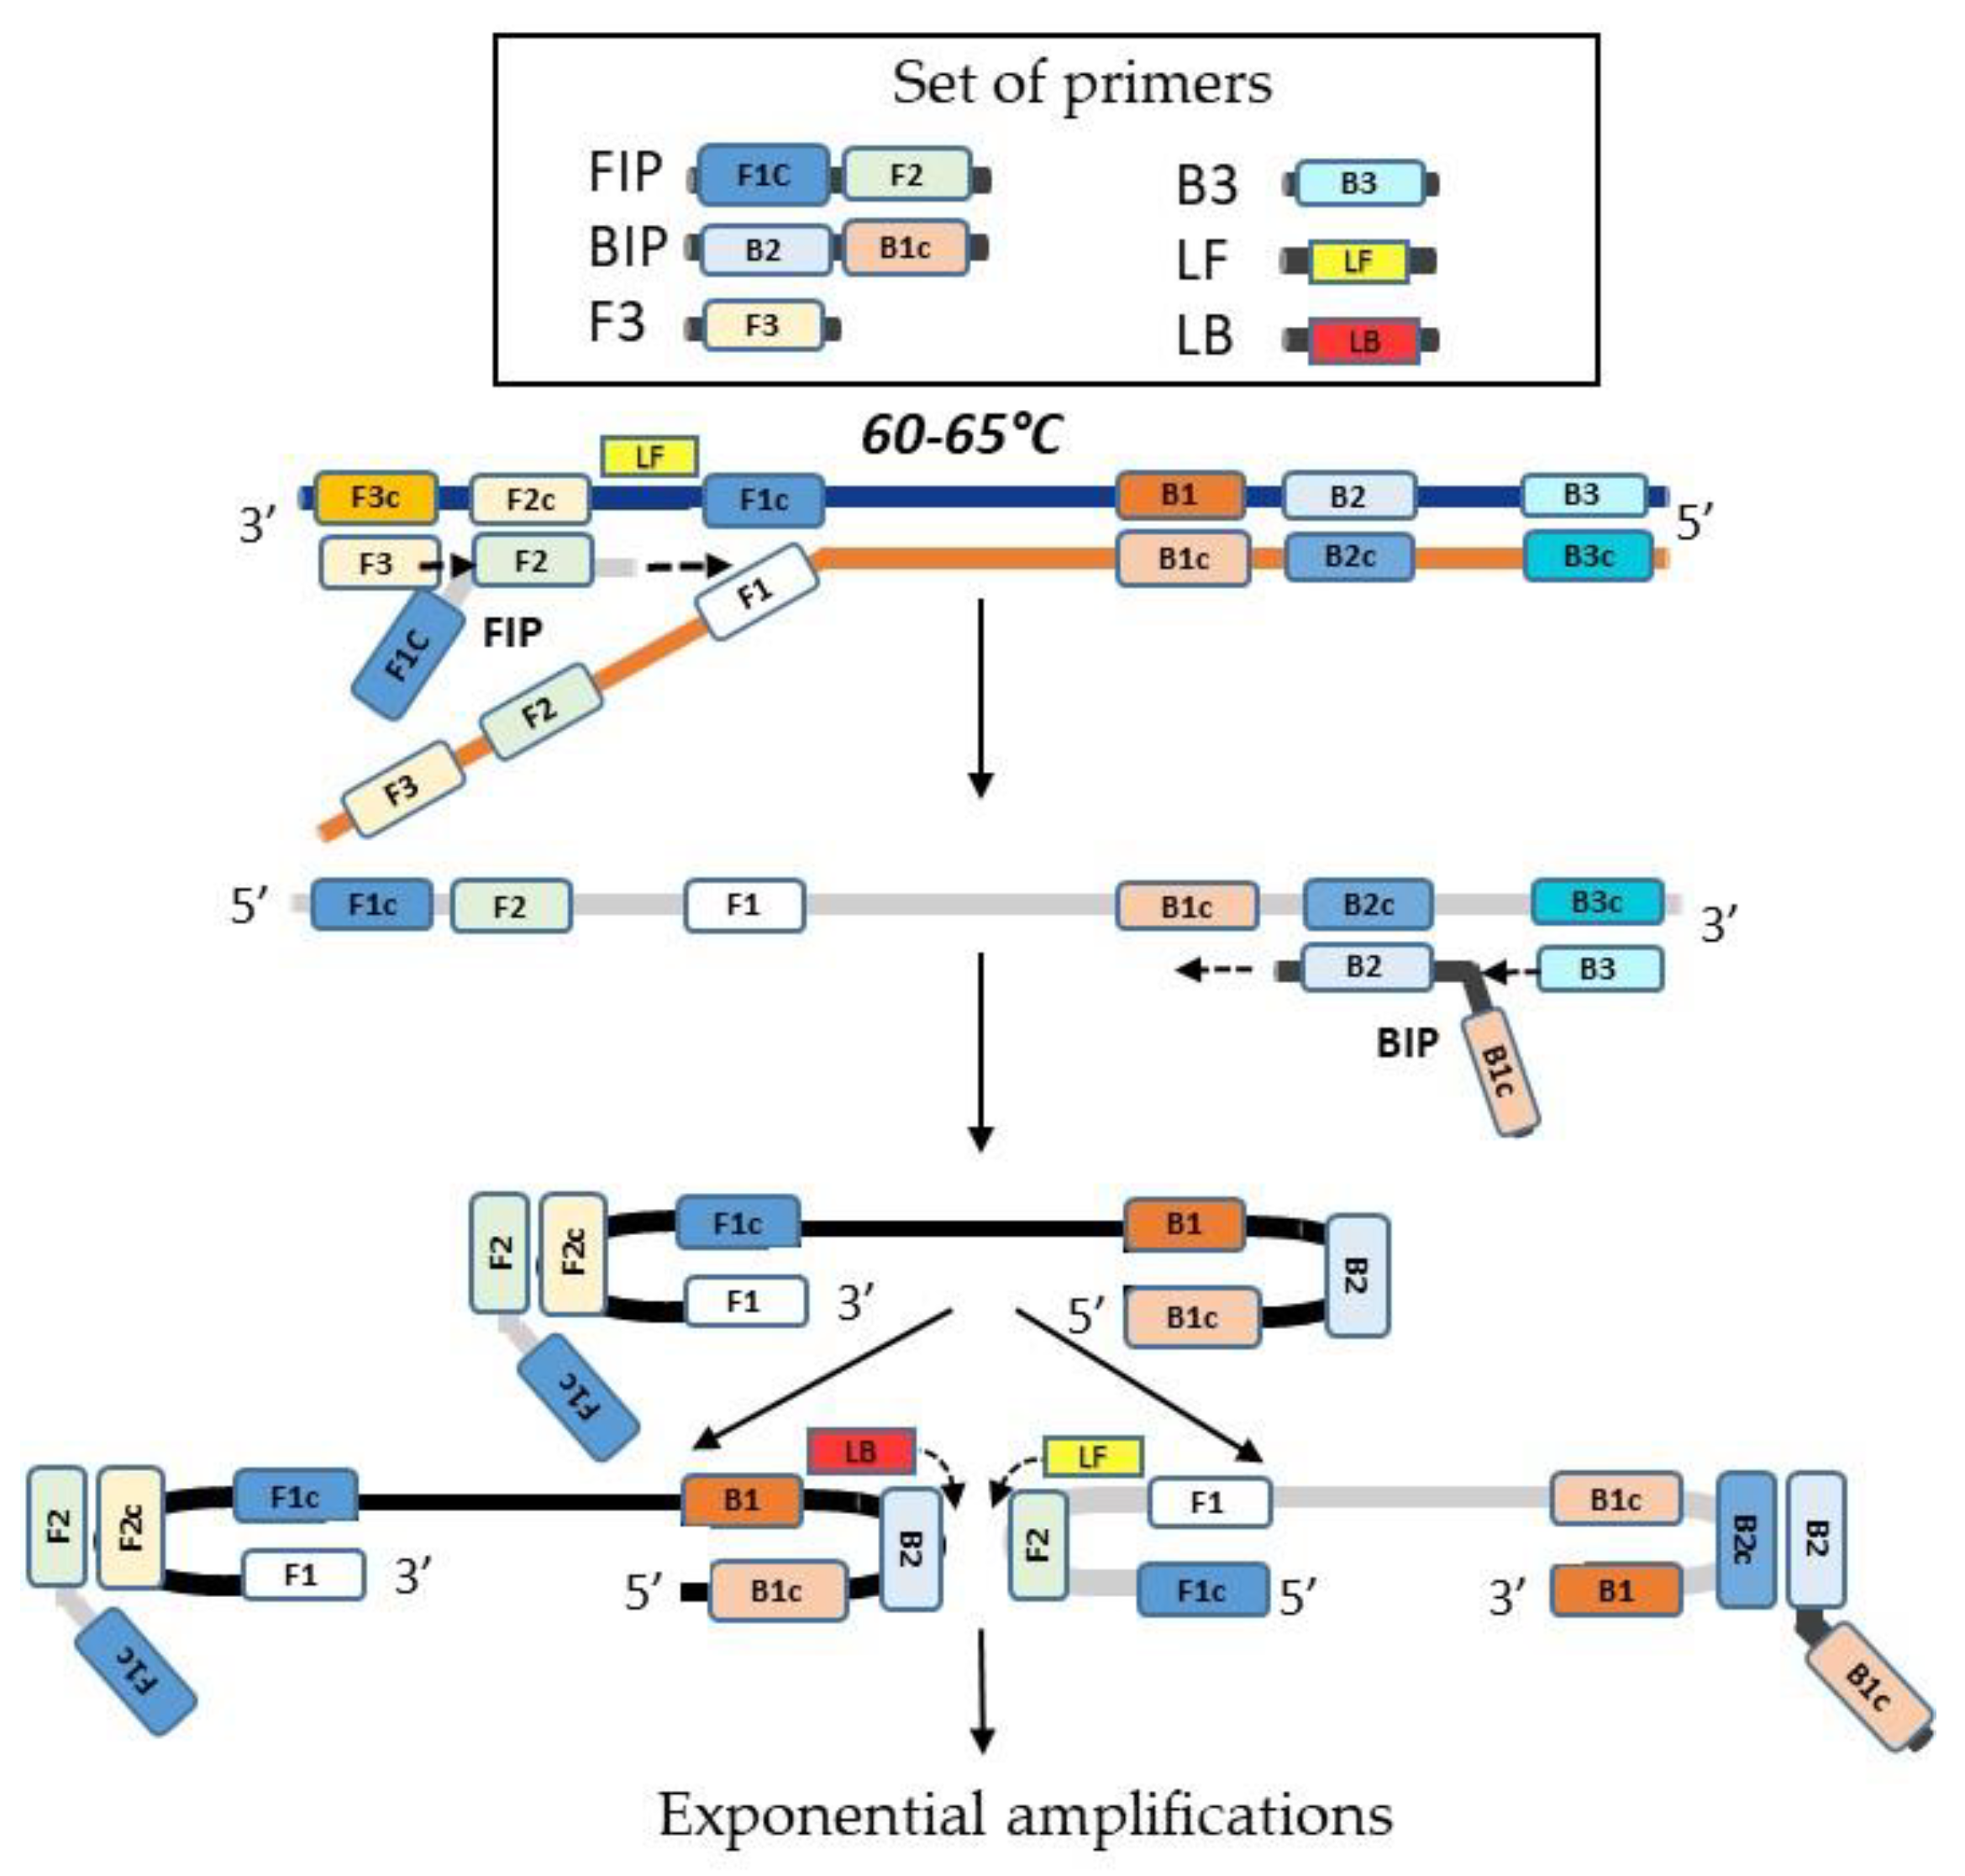
LAMP (Loop-mediated Isothermal Amplification) involves the use of several primers: two internal primers, FIP (Forward Inner Primer) and BIP (Backward Inner Primer); two external primers, F3 and B3; and two loop primers, LF (Loop Forward) and LB (Loop Backward). The enzyme used in this reaction is Bacillus stearothermophilus polymerase I, specifically the large fragment known as Bst polymerase. The amplification process occurs at a constant temperature, typically between 60°C and 65°C.
LAMP amplification can be divided into two main phases. In the first phase, a unique double dumbbell-shaped structure is formed, which facilitates the exponential amplification that occurs in the second phase. The process begins with the FIP primer hybridizing to its complementary sequence, initiating strand synthesis. The F3 primer then displaces this newly synthesized strand, freeing it as a single strand. This single strand then serves as a template for the BIP primer, which synthesizes its complementary strand. The B3 primer displaces this strand in a similar manner as F3. The resulting single-stranded DNA contains sequences at both ends that are complementary to internal sequences, leading to the formation of a double dumbbell-shaped DNA structure [
14]. The LAMP reaction can be accelerated by adding two loop primers, known as the loop forward (LF) and loop backward (LB) primers [
42] (
Figure 5).
2.10. Test Workflow
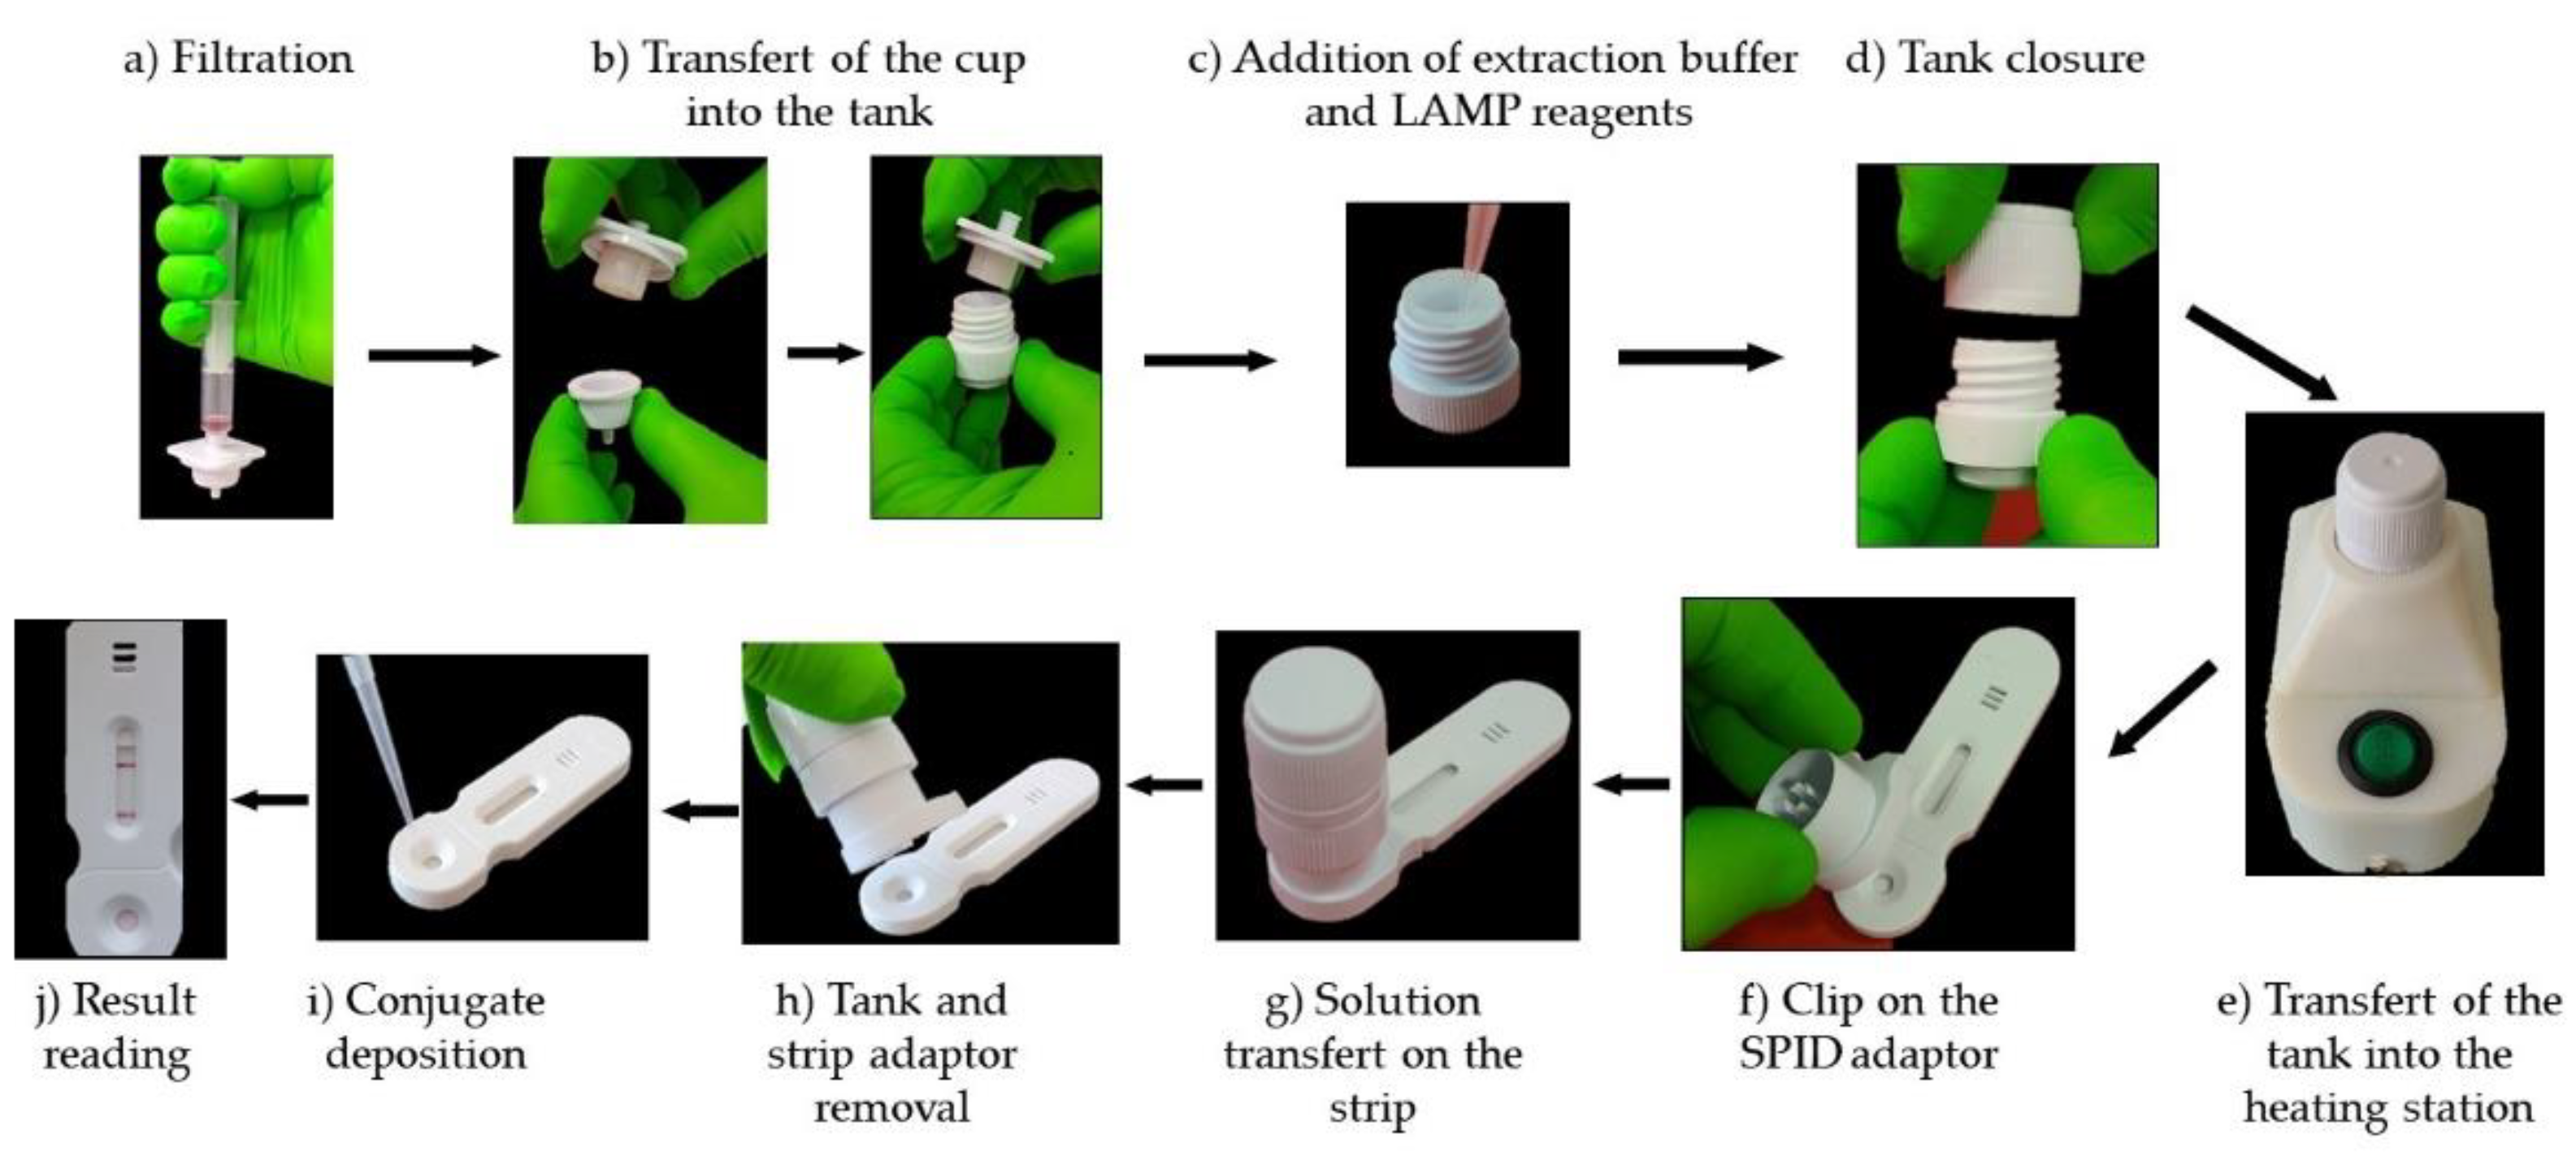
One milliliter of bacterial suspension at 10
8 cfu/ml is collected using a syringe that already contained 2 mL of air. The air ensures that the entire liquid volume can be efficiently pushed through the filter. The syringe is screwed onto the filtration device, and the sample is pushed out of the syringe (
Figure 6a). Then the filtration system is opened by turning it clockwise and the filter cup transferred into the tank by sliding it inside it (
Figure 6b). Next, 180 μL volume of the LAMP reaction solution is added into the filter cup (
Figure 6 c) and the incubator is closed by screwing down the cap, which forces the sample through the membrane into the tank (
Figure 6d). The extraction/incubation unit is positioned on the metal heating element of the station, which heats the solution at 63°C (
Figure 6e). After 30 minutes, the extraction/incubation unit is put on the SPID adaptor, placed on the cassette (
Figure 6f), and by pressing it firmly downwards, the operculum at the bottom of the tank breaks and allows the liquid to flow onto the strip, thus launching the migration (
Figure 6g). After 5 minutes the SPID adaptor and reservoir are removed from the strip (
Figure 6h) and 100 µl of conjugate diluted 1/10 in the conjugate solution is applied to the strip (
Figure 6i). After 30 minutes the results are read visually (
Figure 6j).
3. Results
To achieve the objective of this study, developing a genetic point-of-care test (POCT) that integrated all steps from sample processing to results without the need for complex equipment, several challenges had to be addressed. First, it was necessary to develop a reaction solution capable of both extracting DNA from bacteria and being compatible with LAMP amplification as well as LFIA detection. Second, a heating station tailored to our device had to be designed and produced. Finally, the LFIA format had to be optimized to detect amplicons in large volumes.
3.1. Development of a LAMP Reaction Solution
The development of this solution was based on previous results. Indeed, the reaction solution was a combination of an extraction buffer able to extract protein from bacteria and compatible with LFIA [
43] and the LAMP reaction buffer described in different papers [
14,
44,
45].
To validate this LAMP reaction solution, 1 ml of bacterial suspensions of
E. coli or
C. freundii at 10
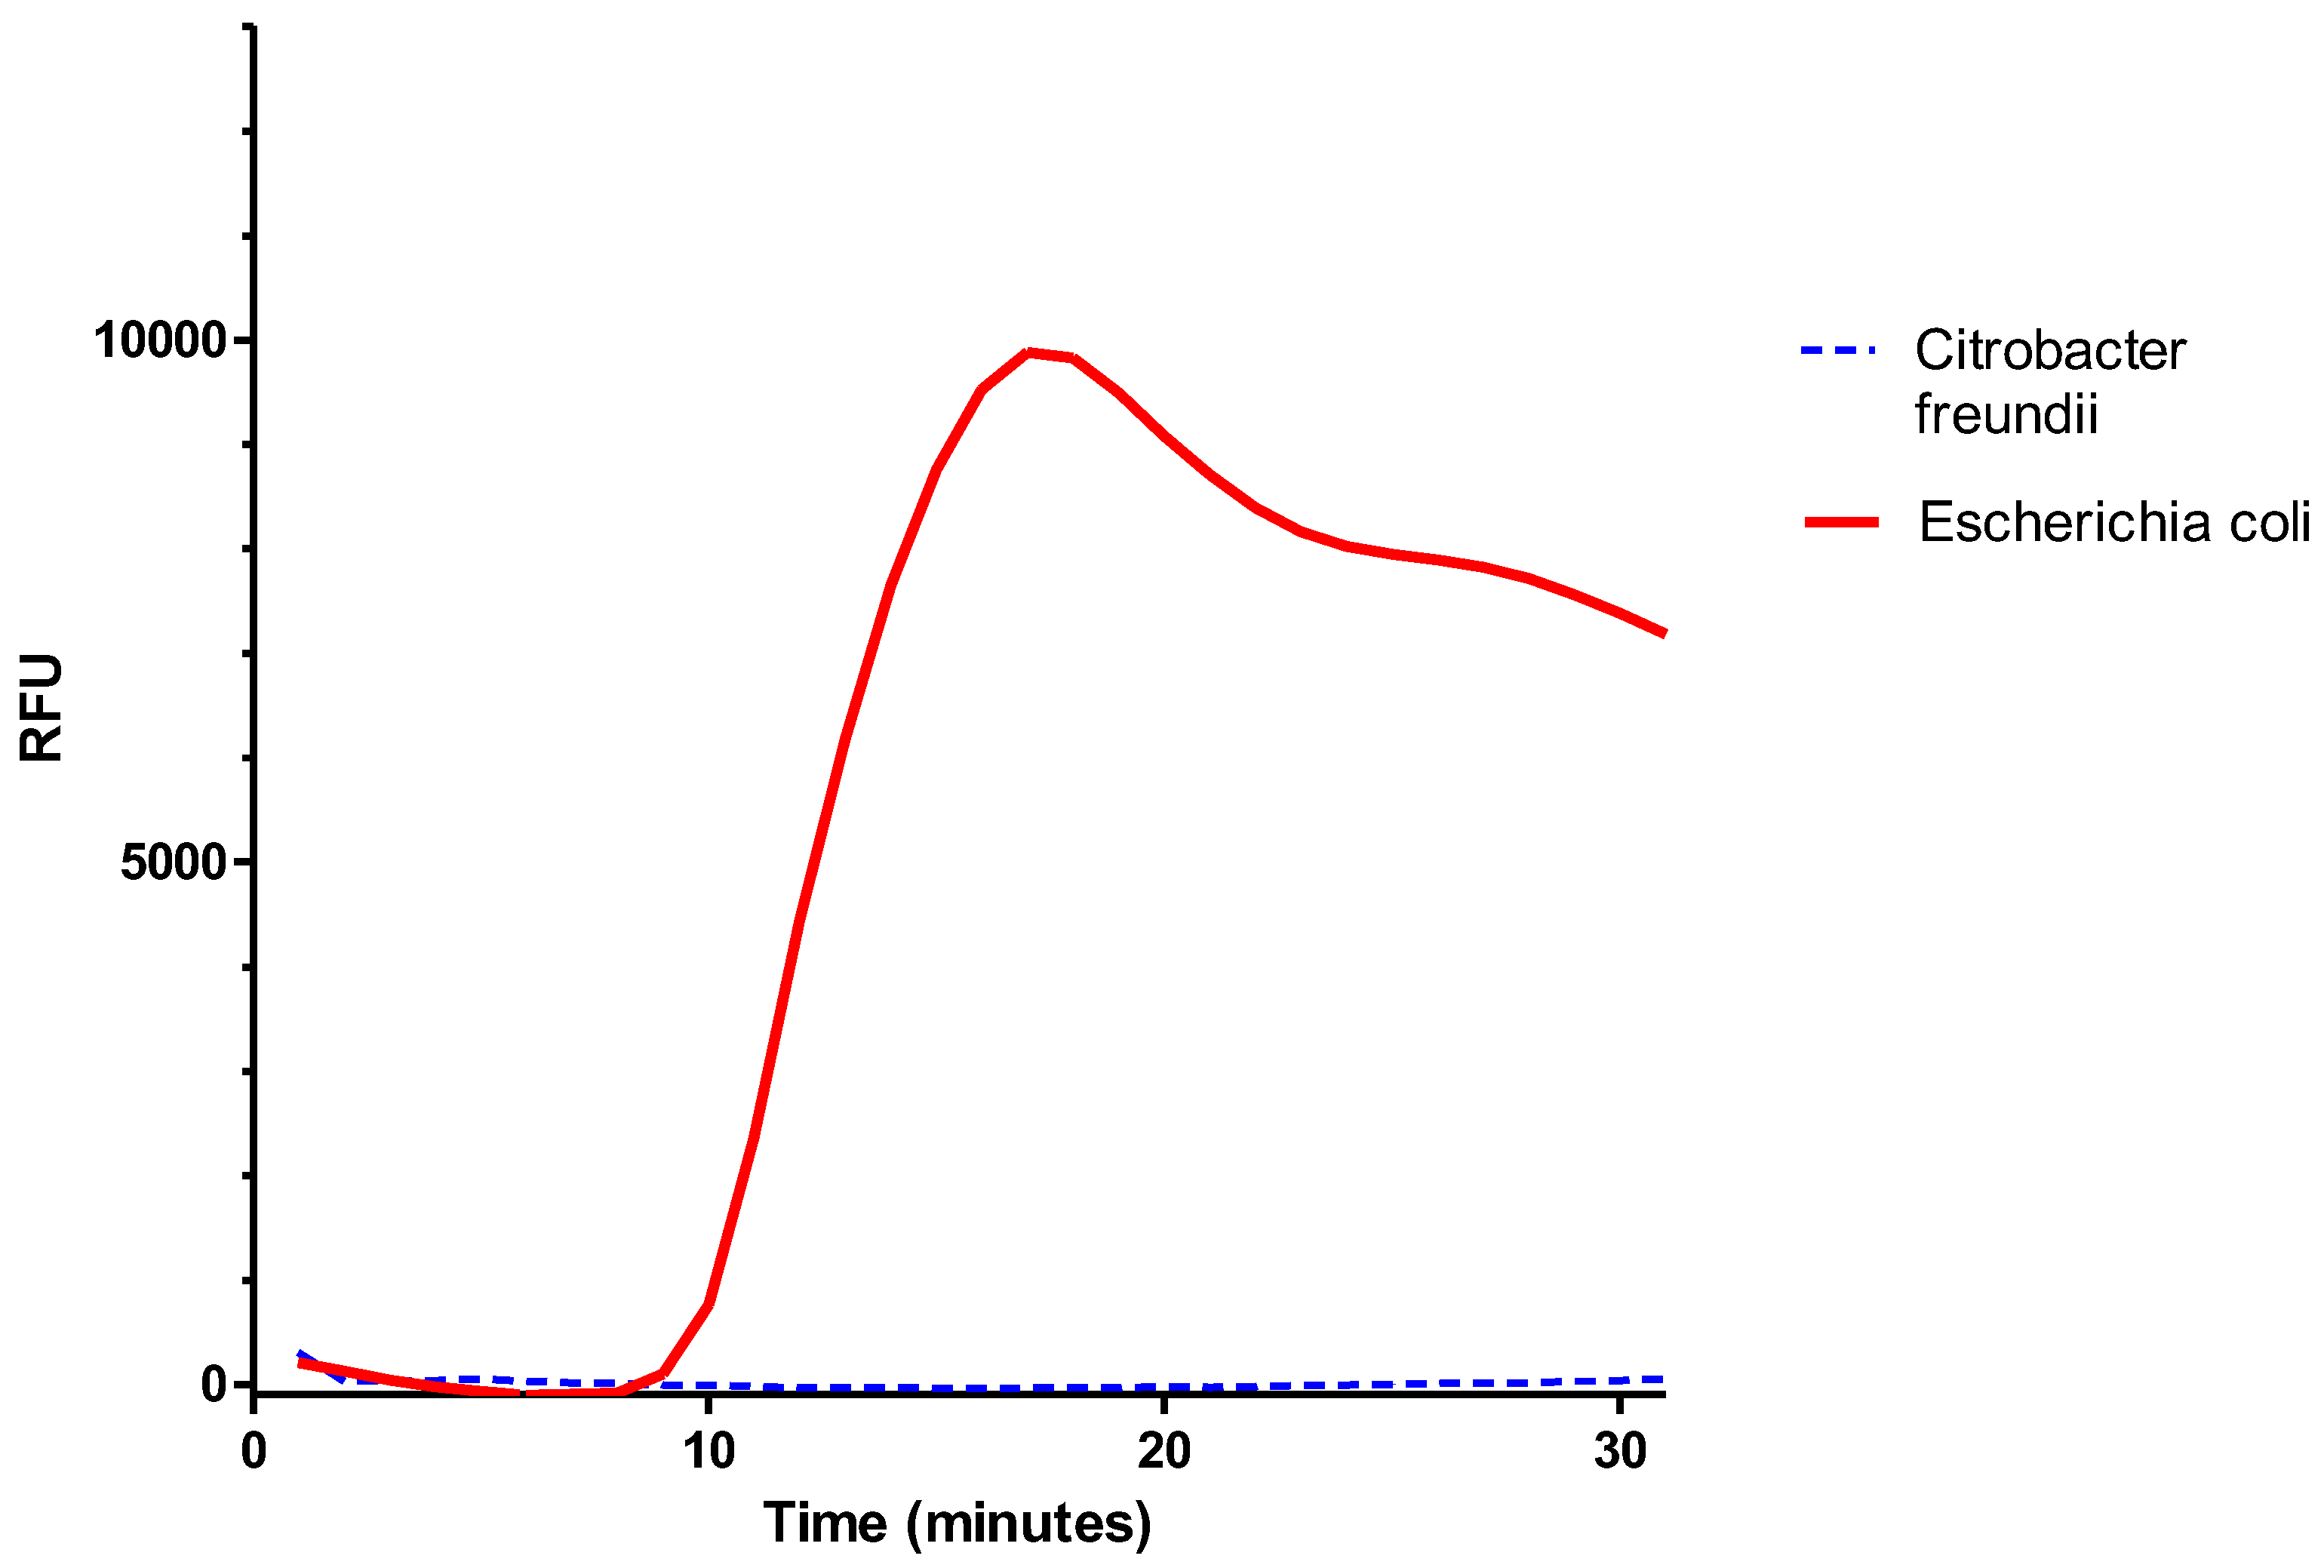
8 cfu/mL were filtered with the filtration/extraction unit of the SPID. The cup was then transferred into the tank, and 180 µL of LAMP reaction solution were added to the cup. The tank was closed, so the liquid filtered down to the bottom of the tank. Amplification was then performed using a thermal cycler (CFX Opus 96, Biorad, Hercules, USA). For this, 24.5 µL of the filtrated solution were deposited in a PCR tube with 0.5 µL of LAMP fluorescent dye. The amplification was monitored for 30 minutes at 63°C. In
Figure 7, we observed, after 10 minutes, an amplification curve for
E. coli, while no curve was visible for the
C. freundii suspension.
These results showed that 1) the set of primers used for the malB gene amplification allowed specific detection of E. coli, and 2) the reaction solution was able to extract DNA from bacteria and allowed LAMP amplification. Thus, none of the components required for extraction appeared to inhibit amplification. These results also demonstrated that SPID could be used to extract DNA from bacteria.
3.2. Detection of Amplicons by LFIA
To detect amplicons generated during the LAMP reaction, we employed a nucleic acid lateral flow immunoassay (NALFIA). This approach required two labeled primers: one for capturing the amplicon on the nitrocellulose membrane and another for signal generation (see Materials and Methods). Agarwal et al. [
46] previously demonstrated that excess labeled primers, whether unreacted or incorporated into amplicons, could negatively impact the signal intensity of both the test and control lines. Therefore, most NALFIA protocols included a dilution step of the amplification products before applying them to the strip to ensure a strong signal. However, since our process needed to be fully integrated into a device, diluting the reaction solution post-amplification was not feasible.
To reduce this effect in our test, we compared various strategies for signal generation and the composition of the primer set for amplicon capture on the test line.
Additionally, the LAMP reaction solution volume had to be sufficient to effectively extract bacteria from the cup membrane and ensure proper migration along the strip. The minimum required volume was determined to be 180 µL (data not shown).
3.2.1. Signal Generation
3.2.1.1. Comparison of Streptavidin and Monoclonal Anti-Biotin as Colloidal Gold Conjugates
In our test, the signal was generated via the interaction between the biotin linked to the BIP and a biotin receptor conjugated to colloidal gold. In this experiment, we compared two biotin receptors: streptavidin and a monoclonal antibody (mAb) against biotin.
1 ml of bacterial suspensions containing either E. coli or C. freundii at 108 cfu/mL were filtered with the filtration/extraction unit of the SPID. The cup was then transferred into the tank, and 180 µL of LAMP reaction solution were added to the cup. The tank was closed, leading the solution to filter down into the tank. The tank was subsequently placed into the heating station and incubated at 63°C for 30 minutes. Following the incubation, the tank was opened, and 10 µL of either streptavidin or mAb anti-biotin conjugates were added. The tank was reclosed and pressed onto the SPID adaptor positioned on the cassette. After 30 minutes, the results were read.
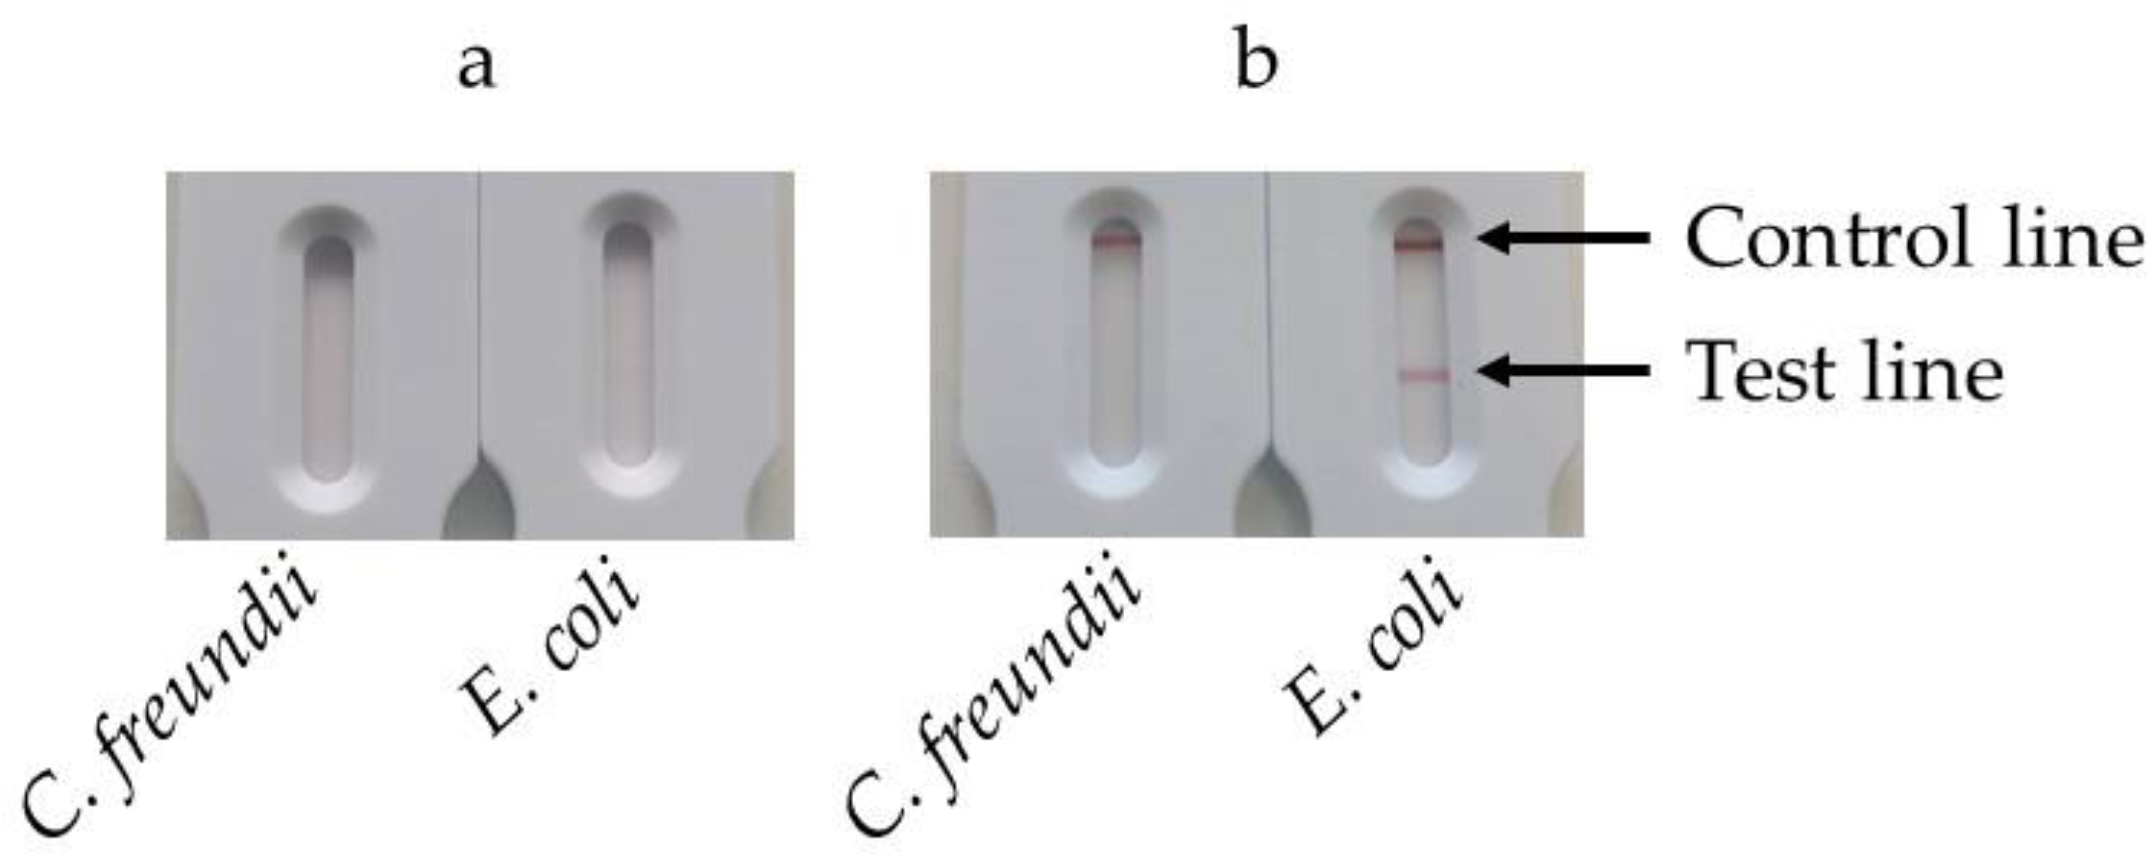
Figure 8a displays the strips obtained using the streptavidin-colloidal gold conjugate. After 30 minutes of migration, the control line was not visible, and a faint test line appeared on the strip corresponding to
E. coli. No test line appeared for
C. freundii.
Figure 8b shows results obtained with mAb anti-biotin-colloidal gold conjugate. In this case, both the control and the test line exhibited a signal for
E. coli, whereas only the control exhibited a signal for
C. freundii.
To ensure comparability, the same strips were used with both conjugates, with a monoclonal anti-digoxigenin on the test line and a goat anti-mouse immunoglobulins on the control line. Since streptavidin is not recognized by goat anti-mouse immunoglobulins, it was expected that no signal would appear on the control line when using the streptavidin-colloidal gold conjugate. Despite the high affinity of streptavidin for biotin, the signal observed on the test line was significantly weaker than the one produced by the mAb anti-biotin colloidal gold conjugate. This weaker signal could have been due to poor labeling of streptavidin with colloidal gold or a reduction in its affinity for biotin resulting from adsorption onto the gold nanoparticles. Given its superior performance in visualizing both the control and test lines, the anti-biotin antibody-colloidal gold conjugate was selected for subsequent experiments.
The positive results obtained with the mAb anti-biotin demonstrated that the heating station was functional and allowed amplification of the malB gene by LAMP in the SPID tank.
3.2.1.2. Comparison of Different Conjugate Deposition Methods
As mentioned above, our aim was to develop a method with a limited number of manipulations. The method used in the previous experiment (one-stage migration), which involved opening the reservoir, depositing the conjugate, and reclosing the reservoir, was not satisfying. In this experiment, we evaluated alternative conjugate deposition methods to simplify the test workflow.
For the first one, named dried conjugate deposition, the conjugate is dried on a Standard 14 membrane which is inserted between the sample pad and the nitrocellulose membrane. At the end of amplification, the tank is pressed onto the SPID adaptor positioned on the cassette. After 30 minutes, the results were read (Dried conjugate deposition).
For the second one, named two stage migration, after amplification the tank is pressed onto the SPID adaptor and after 5 minutes of migration the tank and the SPID adaptor were removed. Next, 100 µl of diluted conjugate (prepared by mixing 10 µl of conjugate with 90 µl of conjugate buffer) was applied to the strip. The results were read after 30 minutes.
For all these methods 1 ml of bacterial suspensions containing either E. coli or C. freundii at 108 cfu/mL were used.
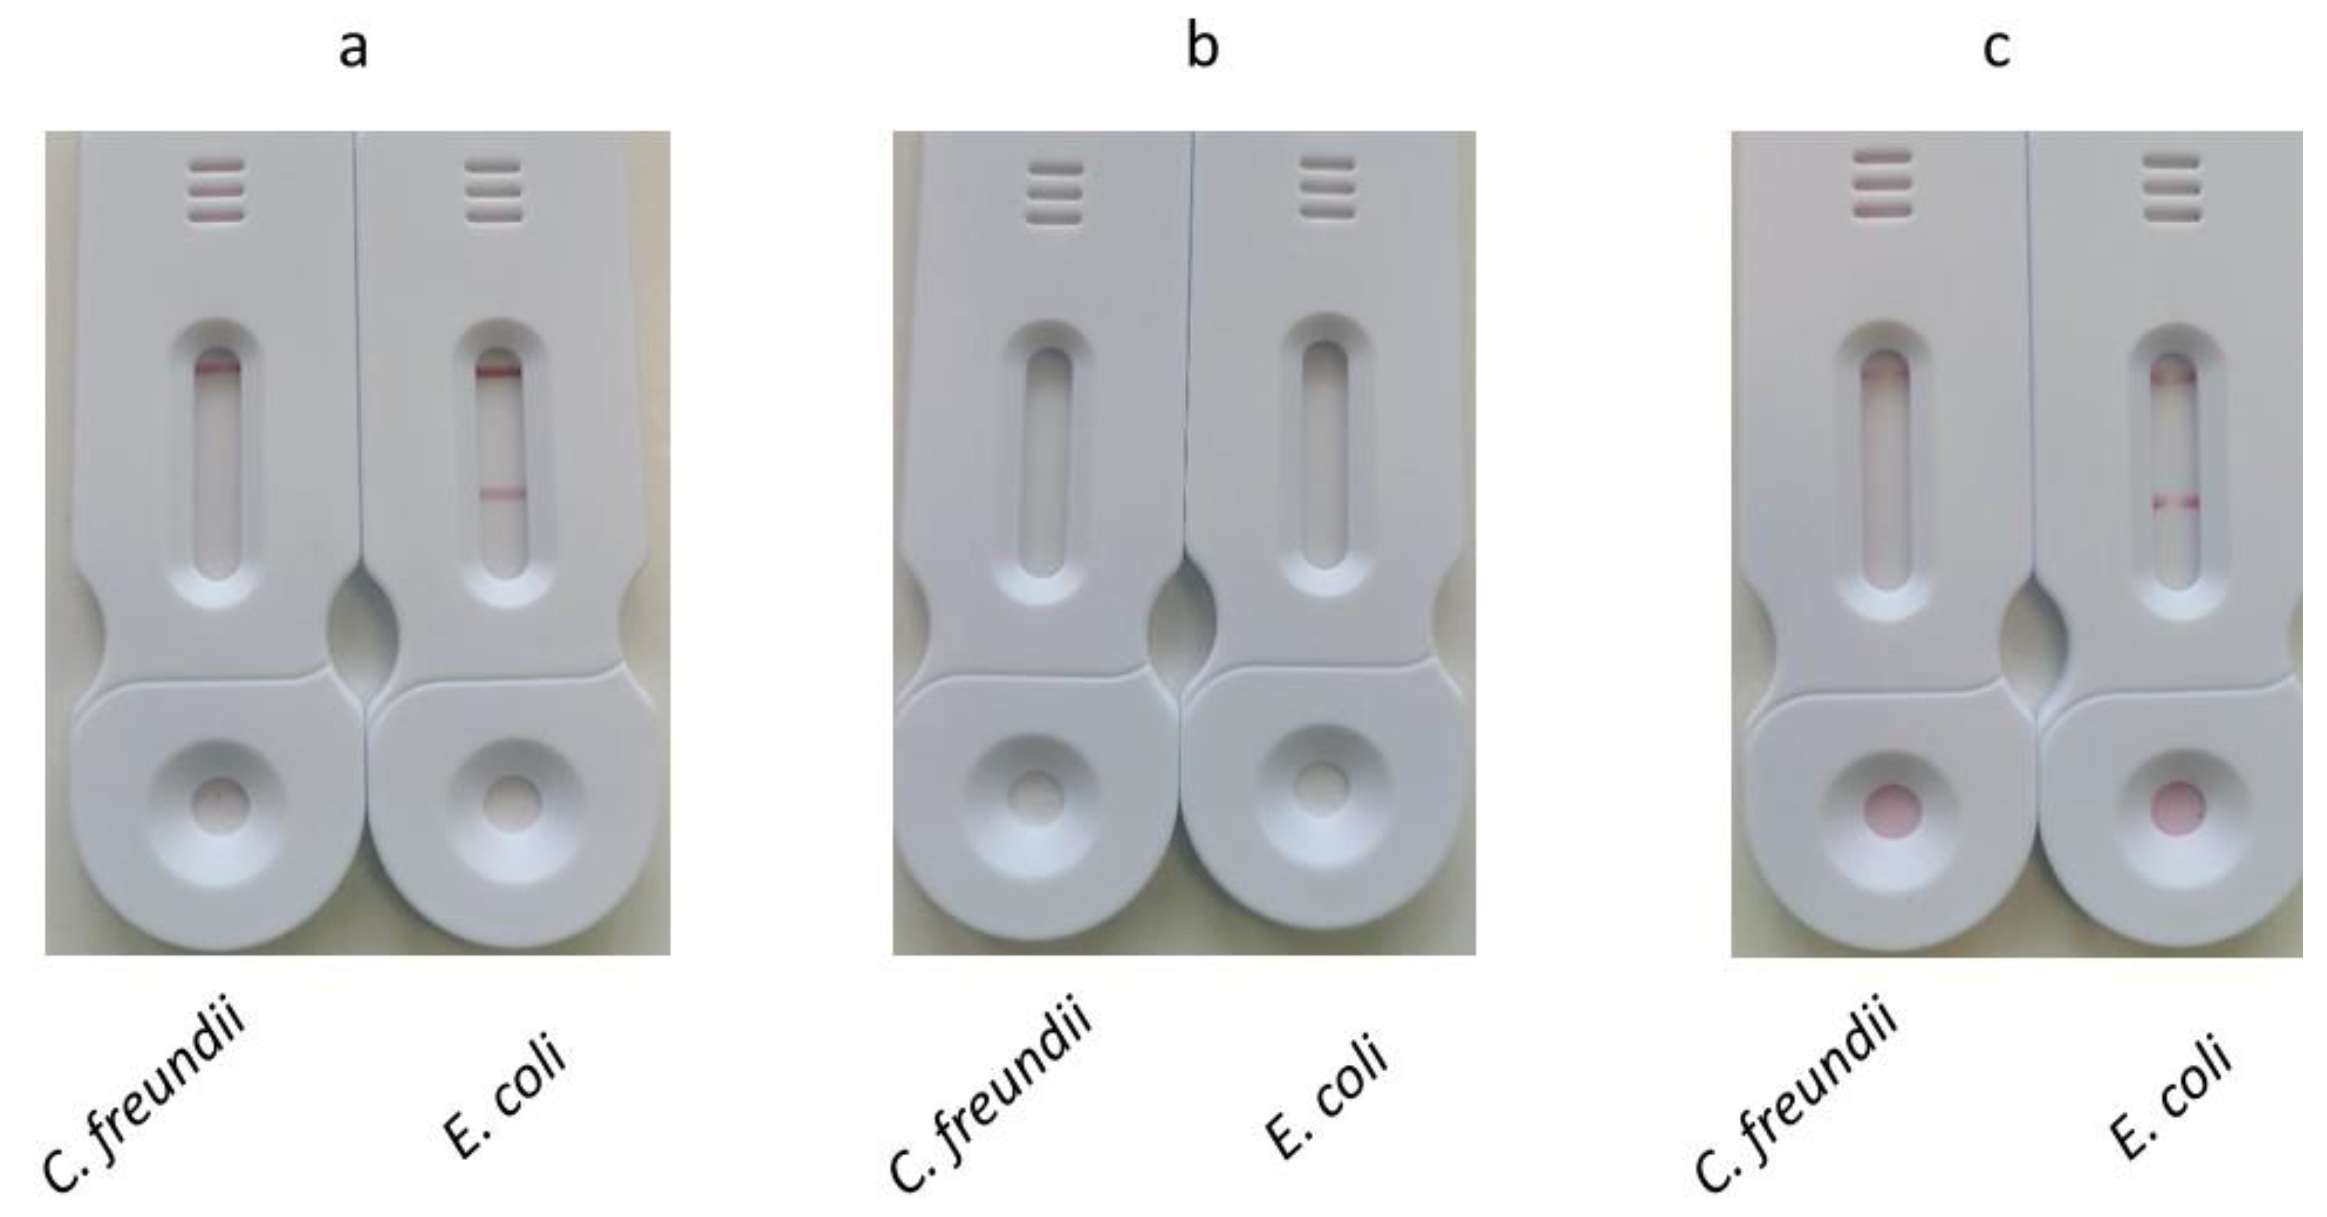
The results (
Figure 9) showed that both one-stage and two-stage depositions allowed visualization of test and control lines, while dried conjugate deposition failed to produce visible test or control lines.
The dried conjugate deposition implies the resolubilization of the dry conjugate by the sample. This probably leads to a non-homogeneous mixing of the sample and conjugate. As a result, the conjugate becomes more concentrated at the top of the migration, while the final microliters of the sample lose access to the conjugate due to its washout from the conjugate pad. In contrast, the one-step method ensures a perfectly homogeneous mixture of the sample and conjugate.
The lack of signal for the dried conjugate deposition may also be explained by the shorter contact time between the conjugate and the sample. In this method, this contact time is limited to the migration period between the conjugate pad and the test line. In contrast, the one-stage deposition method allows the conjugate to interact with the sample before being applied to the strip, providing a longer contact time.
The signal obtained at the test and control lines for the one-stage and two-stage deposition were identical. The second method offers two advantages: 1) it is simpler and requires less handling, and 2) it eliminates excess BIP-biotin primers during the migration of the amplification solution. As a result, the conjugate will specifically react only with the biotin on the amplicons immobilized at the test line.
Based on the results of this experiment, the two-step deposition method was chosen for further studies.
3.2.2. Capture
To evaluate the effect of FIP-digoxigenin primer concentration on the signal intensity at the test line, primers with varying concentrations of FIP-digoxigenin were used during amplification. To ensure efficient amplification, a minimum primer concentration is necessary. Therefore, unlabeled FIP was added to maintain the overall FIP concentration in the different mixes (
Table 2).
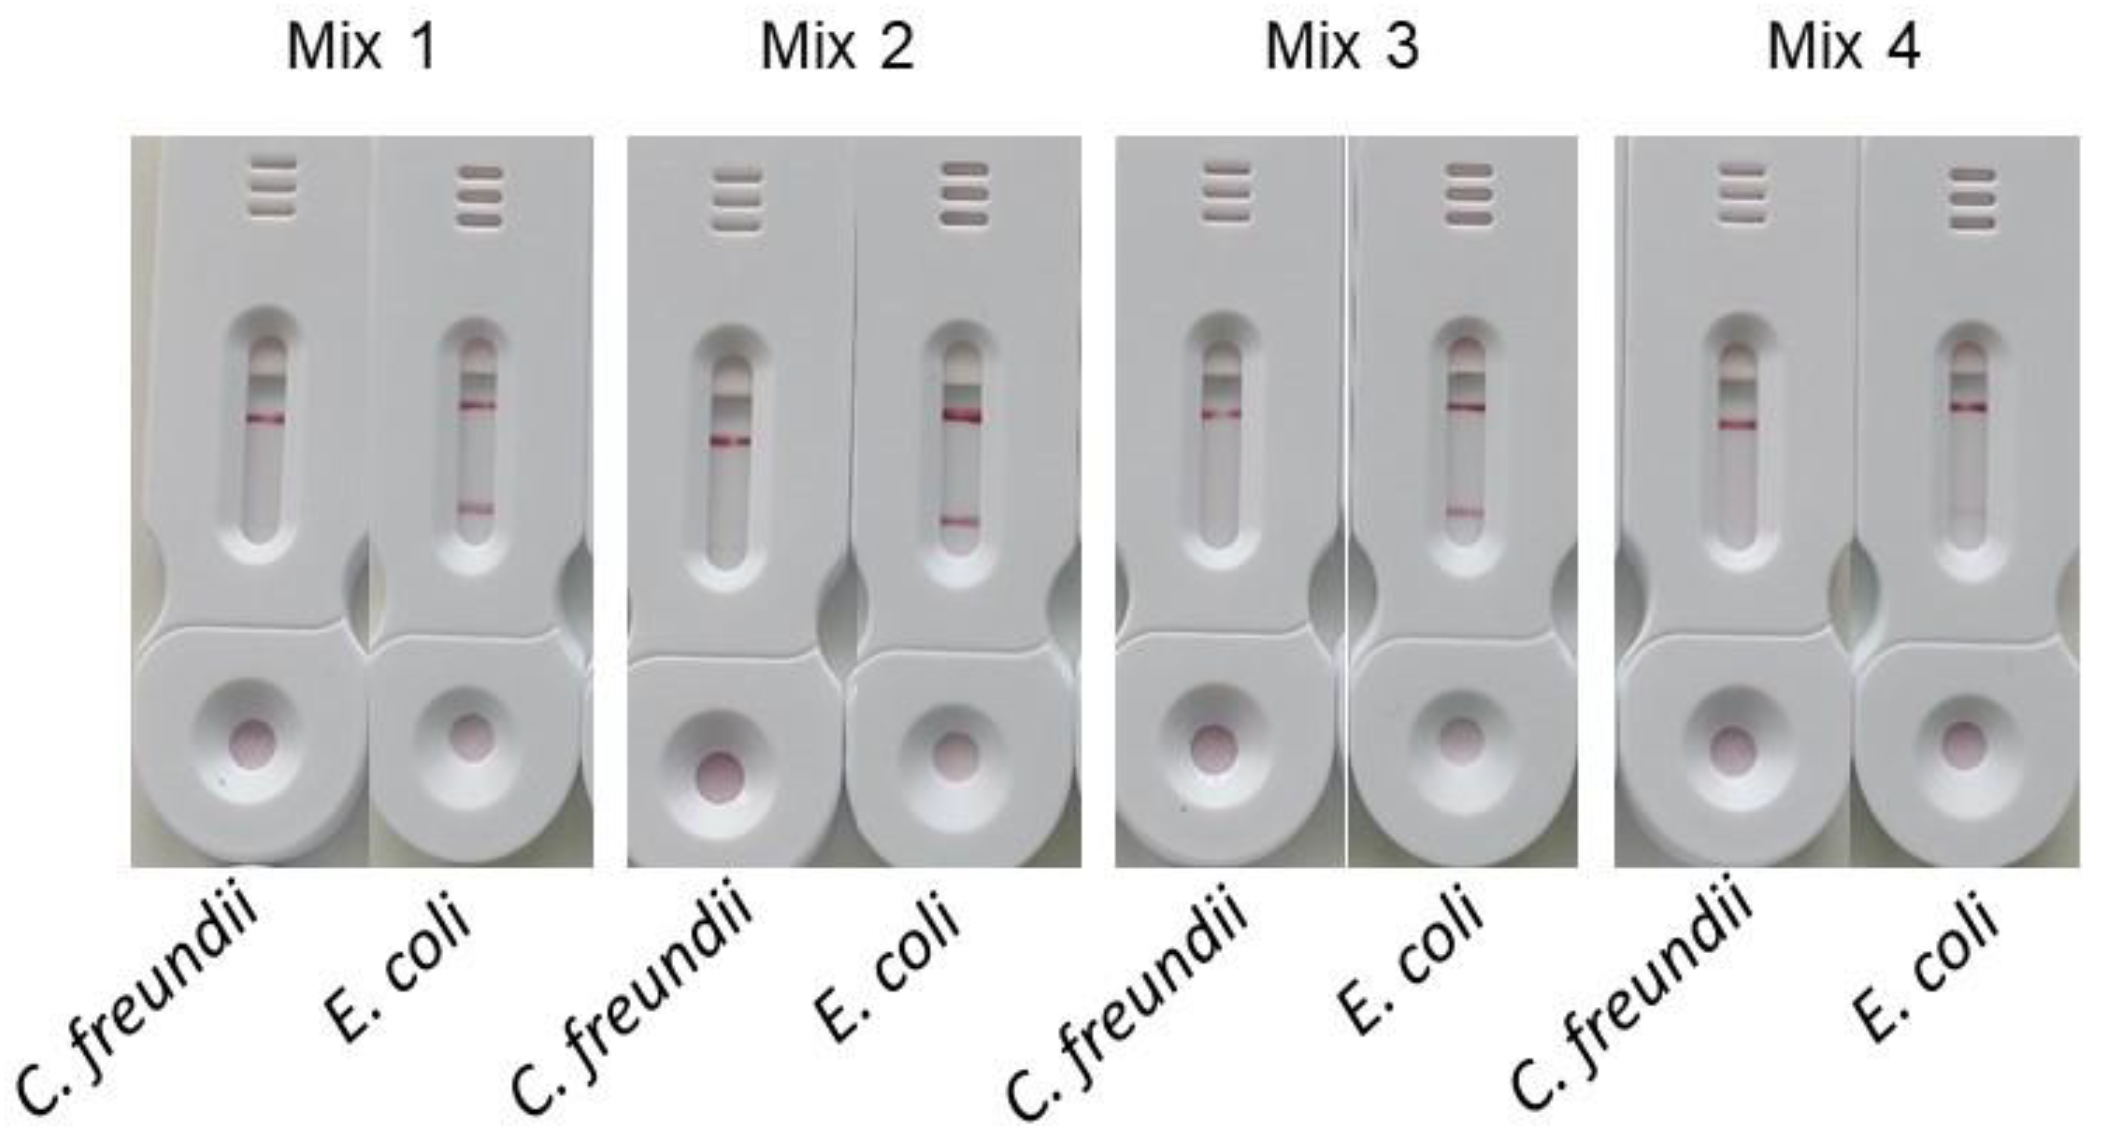
The
Figure 10 shows the results obtained with this different primer mixes using 1 ml of bacterial suspensions containing either
E. coli or
C. freundii at 10
8 cfu/mL. The signals obtained on the test line for mixes 1, 2, and 3 are comparable, while the test line signal for mix 4 is significantly weaker. Contrary to previous reports, our tests showed that the highest concentrations of labeled primers did not result in a decrease in signal intensity at the test line. These results also indicate that achieving an optimal signal requires a sufficient proportion of labeled primer, which in this case is over 25%.
Given the high cost of FIP-digoxigenin primers and our aim to minimize the cost per test, we selected a concentration of 0.4 µM FIP-digoxigenin combined with 1.2 µM FIP (mix 3) for our subsequent experiments.
3.3. Limit of Detection
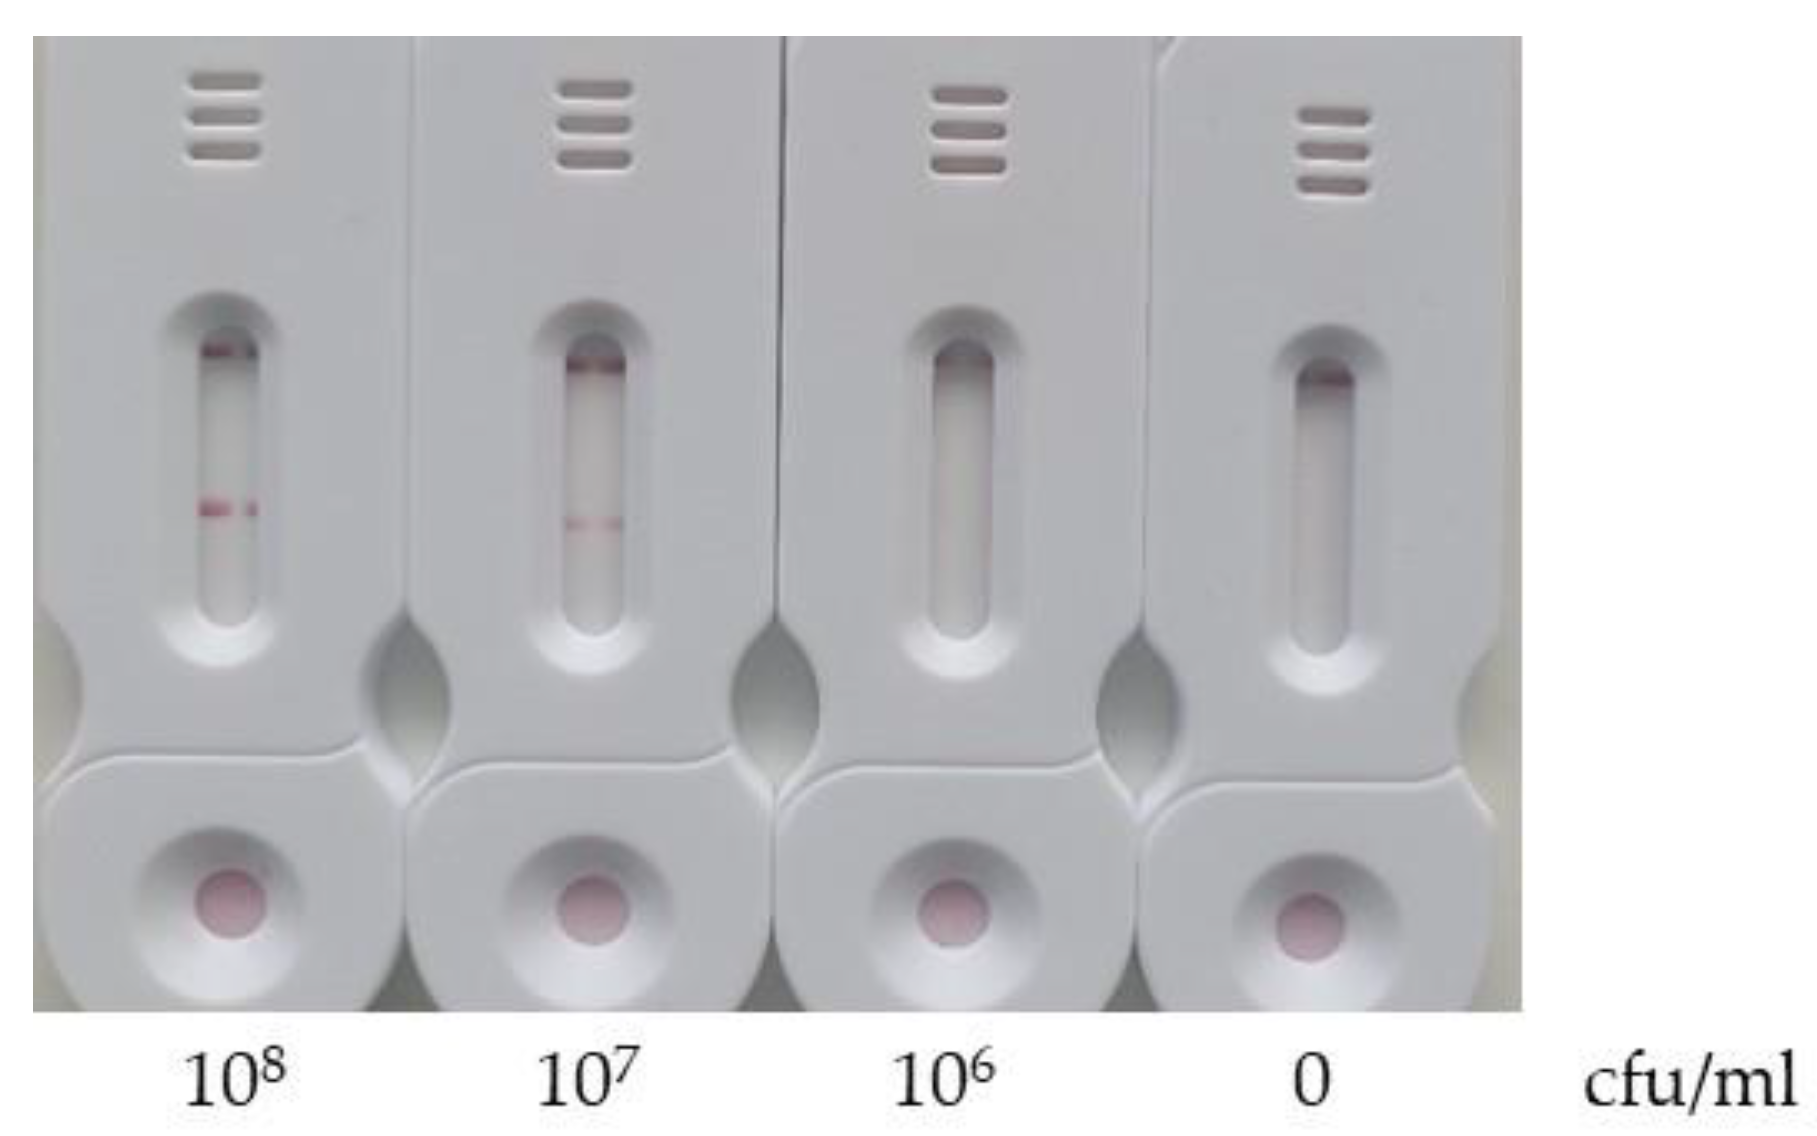
The limit of detection was evaluated by filtering 1 mL of E. coli bacterial suspensions at concentrations of 108, 107, 106 and 0 cfu/mL. The test was conducted under the previously optimized conditions.
As shown in
Figure 11, a signal was detected on the test line for concentrations of 10
8 and 10
7 cfu/ml but not for 10
6 cfu/ml. Therefore, the limit of detection of our test is between 10
7 and 10
6 cfu/ml.
Several factors may contribute to the high detection limit observed: 1) the DNA extraction is not optimal; 2) the LAMP reaction solution, while not completely inhibiting the activity of the Bst2 enzyme, may reduce it; 3) the 30-minutes amplification time, chosen for rapid testing, may be insufficient to achieve optimal sensitivity.
Future research will focus on optimizing each of these parameters to improve performance.
3.4. Validation
Our test, for the
E. coli identification, was validated using 32 bacterial isolates, including 12
E. coli strains and 20
non-E. coli strains. All
E. coli strains were accurately identified. However, among the
non-E. coli strains, three
C. freundii were incorrectly identified as
E. coli, while the remaining strains were correctly classified as
non-E. coli (
Table 3). The absence of the
malB gene in the three
C. freundii strains giving a positive signal was verified by pcr.
This validation enables us to determine that the test's sensitivity is 100% and its specificity is 85%.
4. Discussion
The aim of this project was to develop a field-ready device that integrates all stages of genetic analysis—from sample processing to results—without requiring complex equipment. The rapid, on-site genetic testing tool would be deployed in resource-limited settings or used in time-sensitive applications such as infectious disease outbreaks, environmental monitoring, or point-of-care diagnostics.
Isothermal PCR is particularly well-suited for field applications due to its ability to amplify nucleic acids at a constant temperature, eliminating the need for complex thermal cycling equipment. Among the available isothermal PCR techniques, we focused on Loop-mediated Isothermal Amplification (LAMP) due to its rapid amplification, compatibility with simple visual detection methods, and resistance to inhibitors commonly present in samples. To achieve this, we combined LAMP with the SPID platform. The SPID is already used to filter, concentrate, and extract proteins from bacterial matrices and to detect antibiotic resistance directly in clinical samples using lateral flow immunoassays (LFIA).
Several challenges emerged during development: 1) creating a multifunctional buffer capable of supporting bacterial DNA extraction, LAMP amplification, and detection by LFIA; 2) detecting amplicons with LFIA without requiring sample dilution; and 3) developing a heating station to maintain a constant temperature in the SPID tank during amplification.
Our study yielded promising results, including the development of a novel reaction solution that integrates DNA extraction, LAMP amplification, and LFIA detection. A comparison of two detection systems (streptavidin and a monoclonal antibody against biotin) showed a clear advantage in using the monoclonal antibody system for improved visualization of both test and control lines. This finding is unexpected, as streptavidin is known for its high affinity for biotin. We propose two hypotheses to explain this result: 1) the labeling of streptavidin with colloidal gold nanoparticles may be less efficient than that of antibodies; or 2) the adsorption of streptavidin to colloidal gold may cause conformational changes, reducing its affinity for biotin.
Contrary to earlier reports that labeled primers can inhibit signal in nucleic acid lateral flow immunoassays (NALFIA), our results showed preserved signal even when the entire sample was applied to the strip in a one-step deposition. Despite this, we used two of the strategies evaluated to counteract this inhibition. Indeed the two-step deposition protocol is a good compromise between dried tracer and one stage deposition. The disadvantage of one stage deposition is that the reservoir would have to be opened and reclose after amplification, increasing the risk of contamination and introducing additional handling steps. The dried tracer method, while simplifying the process, failed to produce detectable signals on the test strips.
A comparative study of different FIP-digoxigenin concentrations revealed that using a 4-fold lower concentration had no effect on signal intensity. Given the higher cost of FIP-digoxigenin compared to unmodified FIP primers, we opted for this concentration to keep the cost per test as low as possible.
The optimized protocol was validated on 32 samples for the identification of E. coli. The test demonstrated 100% sensitivity and 85% specificity, confirming that our SPID platform, in combination with the handheld heating station, provides an effective all-in-one genetic test suitable for field applications.
Future steps will be the validation of the all-in-one test with more complex matrices such as urine, blood cultures, environmental, and veterinary samples. Additionally, we plan to refine the reaction solution to improve the test's limit of detection.
We may also explore using the SPID platform and heating station with other isothermal amplification methods. Moreover, the potential to expand the SPID platform for simultaneous detection of both proteins and genes will be evaluated, offering broader diagnostic capabilities in a single test.
Author Contributions
Conceptualization, Lilas Pommiès, Hervé Boutal, David Fras and Hervé Volland; Investigation, Lilas Pommiès, David Fras and Hervé Volland; Supervision, Stéphanie Simon and Hervé Volland; Validation, Lilas Pommiès and Hervé Volland; Writing – original draft, Lilas Pommiès; Writing – review & editing, Hervé Boutal, Karim Boudergui and Stéphanie Simon.
Funding
This research received no external funding.
Acknowledgments
The bacterial strains were kindly provided by Dr Thierry Naas (Université Paris-Saclay, France).
Conflicts of Interest
The SPID is patented. Herve Volland is the inventor of this patent (EP3528947).
References
- Fu, S.; Jiang, Y.; Jiang, X.; Zhao, Y.; Chen, S.; Yang, X.; Man, C. Probe-Free Label System for Rapid Detection of Cronobacter Genus in Powdered Infant Formula. AMB Express 2018, 8, 155. [Google Scholar] [CrossRef] [PubMed]
- Yager, P.; Domingo, G.J.; Gerdes, J. Point-of-Care Diagnostics for Global Health. Annu Rev Biomed Eng 2008, 10, 107–144. [Google Scholar] [CrossRef]
- OMS Point of Care Tests. Available online: https://www.who.int/teams/sexual-and-reproductive-health-and-research- (accessed on day month year).
- Land, K.J.; Boeras, D.I.; Chen, X.-S.; Ramsay, A.R.; Peeling, R.W. REASSURED Diagnostics to Inform Disease Control Strategies, Strengthen Health Systems and Improve Patient Outcomes. Nat Microbiol 2019, 4, 46–54. [Google Scholar] [CrossRef] [PubMed]
- Wang, S.; Xu, F.; Demirci, U. Advances in Developing HIV-1 Viral Load Assays for Resource-Limited Settings. Biotechnology Advances 2010, 28, 770–781. [Google Scholar] [CrossRef]
- Zhao, Y.; Chen, F.; Li, Q.; Wang, L.; Fan, C. Isothermal Amplification of Nucleic Acids. Chem. Rev. 2015, 115, 12491–12545. [Google Scholar] [CrossRef]
- Karami, A.; Gill, P.; Motamedi, M.H.K.; Saghafinia, M. A Review of the Current Isothermal Amplification Techniques: Applications, Advantages and Disadvantages. Journal of Global Infectious Diseases 2011, 3. [Google Scholar]
- Walker, G.T.; Fraiser, M.S.; Schram, J.L.; Little, M.C.; Nadeau, J.G.; Malinowski, D.P. Strand Displacement Amplification—an Isothermal, in Vitro DNA Amplification Technique. Nucl Acids Res 1992, 20, 1691–1696. [Google Scholar] [CrossRef] [PubMed]
- Ali, M.M.; Li, F.; Zhang, Z.; Zhang, K.; Kang, D.-K.; Ankrum, J.A.; Le, X.C.; Zhao, W. Rolling Circle Amplification: A Versatile Tool for Chemical Biology, Materials Science and Medicine. Chem Soc Rev 2014, 43, 3324–3341. [Google Scholar] [CrossRef] [PubMed]
- Lobato, I.M.; O’Sullivan, C.K. Recombinase Polymerase Amplification: Basics, Applications and Recent Advances. Trends Analyt Chem 2018, 98, 19–35. [Google Scholar] [CrossRef]
- Mok, E.; Wee, E.; Wang, Y.; Trau, M. Comprehensive Evaluation of Molecular Enhancers of the Isothermal Exponential Amplification Reaction. Sci Rep 2016, 6, 37837. [Google Scholar] [CrossRef]
- Spits, C.; Le Caignec, C.; De Rycke, M.; Van Haute, L.; Van Steirteghem, A.; Liebaers, I.; Sermon, K. Whole-Genome Multiple Displacement Amplification from Single Cells. Nat Protoc 2006, 1, 1965–1970. [Google Scholar] [CrossRef] [PubMed]
- Li, Y.; Kim, H.-J.; Zheng, C.; Chow, W.H.A.; Lim, J.; Keenan, B.; Pan, X.; Lemieux, B.; Kong, H. Primase-Based Whole Genome Amplification. Nucleic Acids Res 2008, 36, e79. [Google Scholar] [CrossRef] [PubMed]
- Notomi, T. Loop-Mediated Isothermal Amplification of DNA. Nucleic Acids Research 2000, 28, 63e–663. [Google Scholar] [CrossRef]
- Parida, M.; Sannarangaiah, S.; Dash, P.K.; Rao, P.V.L.; Morita, K. Loop Mediated Isothermal Amplification (LAMP): A New Generation of Innovative Gene Amplification Technique; Perspectives in Clinical Diagnosis of Infectious Diseases. Rev Med Virol 2008, 18, 407–421. [Google Scholar] [CrossRef] [PubMed]
- Myrmel, M.; Oma, V.; Khatri, M.; Hansen, H.H.; Stokstad, M.; Berg, M.; Blomström, A.-L. Single Primer Isothermal Amplification (SPIA) Combined with next Generation Sequencing Provides Complete Bovine Coronavirus Genome Coverage and Higher Sequence Depth Compared to Sequence-Independent Single Primer Amplification (SISPA). PLoS One 2017, 12, e0187780. [Google Scholar] [CrossRef]
- Hall, J.G.; Eis, P.S.; Law, S.M.; Reynaldo, L.P.; Prudent, J.R.; Marshall, D.J.; Allawi, H.T.; Mast, A.L.; Dahlberg, J.E.; Kwiatkowski, R.W.; et al. Sensitive Detection of DNA Polymorphisms by the Serial Invasive Signal Amplification Reaction. Proc Natl Acad Sci U S A 2000, 97, 8272–8277. [Google Scholar] [CrossRef]
- Zou, B.; Ma, Y.; Wu, H.; Zhou, G. Ultrasensitive DNA Detection by Cascade Enzymatic Signal Amplification Based on Afu Flap Endonuclease Coupled with Nicking Endonuclease. Angew Chem Int Ed Engl 2011, 50, 7395–7398. [Google Scholar] [CrossRef]
- Genie® II. OptiGene 2024.
- Twista_manual_revb.Pdf.
- NUCLISENS®EASYQ®. Available online: https://www.biomerieux.it/prodotto/nuclisensreasyqr (accessed on 3 June 2024).
- The SAMBA Platform - DRW. Available online: https://www.drw-ltd.com/solutions/platform/ (accessed on 3 June 2024).
- Assennato, S.M.; Ritchie, A.V.; Nadala, C.; Goel, N.; Tie, C.; Nadala, L.M.; Zhang, H.; Datir, R.; Gupta, R.K.; Curran, M.D.; et al. Performance Evaluation of the SAMBA II SARS-CoV-2 Test for Point-of-Care Detection of SARS-CoV-2. Journal of Clinical Microbiology 2020, 59, 10–1128. [Google Scholar] [CrossRef] [PubMed]
- Rohrman, B.A.; Richards-Kortum, R.R. A Paper and Plastic Device for Performing Recombinase Polymerase Amplification of HIV DNA. Lab Chip 2012, 12, 3082–3088. [Google Scholar] [CrossRef]
- Cordray, M.S.; Richards-Kortum, R.R. A Paper and Plastic Device for the Combined Isothermal Amplification and Lateral Flow Detection of Plasmodium DNA. Malaria Journal 2015, 14, 472. [Google Scholar] [CrossRef]
- Ahn, H.; Batule, B.S.; Seok, Y.; Kim, M.-G. Single-Step Recombinase Polymerase Amplification Assay Based on a Paper Chip for Simultaneous Detection of Multiple Foodborne Pathogens. Anal Chem 2018, 90, 10211–10216. [Google Scholar] [CrossRef] [PubMed]
- Shetty, P.; Ghosh, D.; Singh, M.; Tripathi, A.; Paul, D. Rapid Amplification of Mycobacterium Tuberculosis DNA on a Paper Substrate. RSC Adv. 2016, 6, 56205–56212. [Google Scholar] [CrossRef]
- Marcy, Y.; Ishoey, T.; Lasken, R.S.; Stockwell, T.B.; Walenz, B.P.; Halpern, A.L.; Beeson, K.Y.; Goldberg, S.M.D.; Quake, S.R. Nanoliter Reactors Improve Multiple Displacement Amplification of Genomes from Single Cells. PLoS Genet 2007, 3, 1702–1708. [Google Scholar] [CrossRef]
- Linnes, J.C.; Fan, A.; Rodriguez, N.M.; Lemieux, B.; Kong, H.; Klapperich, C.M. Paper-Based Molecular Diagnostic for Chlamydia Trachomatis. RSC Adv. 2014, 4, 42245–42251. [Google Scholar] [CrossRef]
- Magro, L.; Jacquelin, B.; Escadafal, C.; Garneret, P.; Kwasiborski, A.; Manuguerra, J.-C.; Monti, F.; Sakuntabhai, A.; Vanhomwegen, J.; Lafaye, P.; et al. Paper-Based RNA Detection and Multiplexed Analysis for Ebola Virus Diagnostics. Sci Rep 2017, 7, 1347. [Google Scholar] [CrossRef] [PubMed]
- Lafleur, L.K.; Bishop, J.D.; Heiniger, E.K.; Gallagher, R.P.; Wheeler, M.D.; Kauffman, P.; Zhang, X.; Kline, E.C.; Buser, J.R.; Kumar, S.; et al. A Rapid, Instrument-Free, Sample-to-Result Nucleic Acid Amplification Test. Lab Chip 2016, 16, 3777–3787. [Google Scholar] [CrossRef] [PubMed]
- Burns, M.A.; Johnson, B.N.; Brahmasandra, S.N.; Handique, K.; Webster, J.R.; Krishnan, M.; Sammarco, T.S.; Man, P.M.; Jones, D.; Heldsinger, D.; et al. An Integrated Nanoliter DNA Analysis Device. Science 1998, 282, 484–487. [Google Scholar] [CrossRef]
- Yang, J.M.; Bell, J.; Huang, Y.; Tirado, M.; Thomas, D.; Forster, A.H.; Haigis, R.W.; Swanson, P.D.; Wallace, R.B.; Martinsons, B.; et al. An Integrated, Stacked Microlaboratory for Biological Agent Detection with DNA and Immunoassays. Biosens Bioelectron 2002, 17, 605–618. [Google Scholar] [CrossRef]
- Andresen, D.; von Nickisch-Rosenegk, M.; Bier, F.F. Helicase Dependent OnChip-Amplification and Its Use in Multiplex Pathogen Detection. Clin Chim Acta 2009, 403, 244–248. [Google Scholar] [CrossRef]
- Sato, K.; Tachihara, A.; Renberg, B.; Mawatari, K.; Sato, K.; Tanaka, Y.; Jarvius, J.; Nilsson, M.; Kitamori, T. Microbead-Based Rolling Circle Amplification in a Microchip for Sensitive DNA Detection. Lab Chip 2010, 10, 1262–1266. [Google Scholar] [CrossRef]
- Volland, H.; Ballesté-Delpierre, C.; Szabó, D.; Gonzalez, C.; Takissian, J.; Aszalos, A.Z.; Ostorhazi, E.; Farkas, S.; Kamotsay, K.; Rosenmoller, M.; et al. Rapid Detection of CTX-M-Type ESBLs and Carbapenemases Directly from Biological Samples Using the BL-DetecTool. J Antimicrob Chemother 2022, 77, 2867–2875. [Google Scholar] [CrossRef] [PubMed]
- Fernandez-Pittol, M.; Bosch, J.; Ballesté-Delpierre, C.; Gonzalez, C.; Vasilakopoulou, A.; Berbel, D.; Riccobono, E.; Gatermann, S.; Kamotsay, K.; Reissier, S.; et al. Multicenter Study to Assess the Use of BL-DetecTool for the Detection of CTX-M-Type ESBLs and Carbapenemases Directly from Clinical Specimens. Journal of Clinical Microbiology 2024, 0, e01136–23. [Google Scholar] [CrossRef] [PubMed]
- Vasilakopoulou, A.; Naas, T.; Gonzalez, C.; Vila, J.; Szabo, D.; Riccobono, E.; Kamotsay, K.; Reissier, S.; Berbel, D.; Aszalos, A.Z.; et al. A Multicentre Evaluation of the NG-Test DetecTool OXA-23 for the Rapid Detection of OXA-23 Carbapenemase Directly from Blood Cultures. JAC Antimicrob Resist 2024, 6, dlae029. [Google Scholar] [CrossRef] [PubMed]
- Kokkinos, P.A.; Ziros, P.G.; Bellou, M.; Vantarakis, A. Loop-Mediated Isothermal Amplification (LAMP) for the Detection of Salmonella in Food. Food Anal. Methods 2014, 7, 512–526. [Google Scholar] [CrossRef]
- Van Amerongen, A.; Koets, M. Simple and Rapid Bacterial Protein and DNA Diagnostic Methods Based on Signal Generation with Colloidal Carbon Particles. In Plant Cell; 2005; pp. 105–126 ISBN 90-76998-53-1.
- Hill, J.; Beriwal, S.; Chandra, I.; Paul, V.K.; Kapil, A.; Singh, T.; Wadowsky, R.M.; Singh, V.; Goyal, A.; Jahnukainen, T.; et al. Loop-Mediated Isothermal Amplification Assay for Rapid Detection of Common Strains of Escherichia Coli. J Clin Microbiol 2008, 46, 2800–2804. [Google Scholar] [CrossRef]
- Nagamine, K.; Hase, T.; Notomi, T. Accelerated Reaction by Loop-Mediated Isothermal Amplification Using Loop Primers. Molecular and Cellular Probes 2002, 16, 223–229. [Google Scholar] [CrossRef]
- Boutal, H.; Naas, T.; Devilliers, K.; Oueslati, S.; Dortet, L.; Bernabeu, S.; Simon, S.; Volland, H. Development and Validation of a Lateral Flow Immunoassay for Rapid Detection of NDM-Producing Enterobacteriaceae. Journal of Clinical Microbiology 2017, 55, 2018–2029. [Google Scholar] [CrossRef]
- Mori, Y.; Hirano, T.; Notomi, T. Sequence Specific Visual Detection of LAMP Reactions by Addition of Cationic Polymers. BMC Biotechnol 2006, 6, 3. [Google Scholar] [CrossRef]
- Parida, M.M.; Santhosh, S.R.; Dash, P.K.; Tripathi, N.K.; Lakshmi, V.; Mamidi, N.; Shrivastva, A.; Gupta, N.; Saxena, P.; Babu, J.P.; et al. Rapid and Real-Time Detection of Chikungunya Virus by Reverse Transcription Loop-Mediated Isothermal Amplification Assay. J Clin Microbiol 2007, 45, 351–357. [Google Scholar] [CrossRef]
- Agarwal, P.; Toley, B.J. Unreacted Labeled PCR Primers Inhibit the Signal in a Nucleic Acid Lateral Flow Assay as Elucidated by a Transport Reaction Model. ACS Meas. Au 2022, 2, 317–324. [Google Scholar] [CrossRef]
Figure 1.
The sequence of the malB gene with the different primers used.
Figure 1.
The sequence of the malB gene with the different primers used.
Figure 2.
Schematic representation of strips. The test strip involves a sample pad, a nitrocellulose membrane, and an absorption pad. The detection zone involves immobilized anti-digoxigenin antibodies as test line and anti-mouse antibodies or biotinylated-BSA as control line.
Figure 2.
Schematic representation of strips. The test strip involves a sample pad, a nitrocellulose membrane, and an absorption pad. The detection zone involves immobilized anti-digoxigenin antibodies as test line and anti-mouse antibodies or biotinylated-BSA as control line.
Figure 3.
The SPID (Sampling, Processing, Incubation, Detection) platform elements. The SPID is composed of two parts: (i) the sample processing part, which includes a filtration/concentration unit with a syringe adaptor, a cup, and a lower part; and an extraction unit, comprising a cap and a tank; and (ii) the detection part, which consists of a SPID adaptor which connect the cassette with the tank and a plastic cassette integrating a lateral flow immunochromatographic strip (
Figure 2).
Figure 4.
Heating station.
Figure 4.
Heating station.
Figure 5.
Schematic representation of the Loop-mediated Isothermal Amplification (LAMP). Loop-mediated isothermal amplification (LAMP) utilizes 6 primers hybridizing with 8 specific regions of the target DNA. The process begins with a strand-displacing DNA polymerase, which initiates DNA synthesis. Additionally, two of the primers (LF and LB) form loop structures that promote further rounds of amplification.
Figure 6.
Test workflow. A 1 mL bacterial suspension at 10^8 CFU/mL is drawn into a syringe and attached to a filtration device. The sample is then pushed through the filter (a). The filter cup is subsequently placed in a tank (b), and 180 µL of LAMP reaction solution is added (c). After sealing the tank (d), the system is heated to 63°C for 30 minutes (e). Once heated, the unit is placed onto an SPID adaptor (f-g), which punctures the operculum, allowing the liquid to flow onto a strip for migration (g). After 5 minutes, the adapter and reservoir are removed (h), and 100 µL of diluted conjugate is applied to the strip (i). Results are visually interpreted after 30 minutes (j).
Figure 7.
Amplification of the malB gene. 1 mL of bacterial suspensions of E. coli or C. freundii (10^8 cfu/mL) was filtered using the SPID filtration/extraction unit. The cup was transferred to a tank, where 180 µL of LAMP reaction solution was added. After sealing the tank, amplification was carried out using a thermal cycler. To do this, 24.5 µL of the filtered solution and 0.5 µL of LAMP fluorescent dye were placed in a PCR tube, and amplification was monitored for 30 minutes at 63°C.
Figure 8.
Comparison of streptavidine and mAb anti-biotine as conjugate. After the extraction/filtration and amplification steps, 10µl of conjugate are added to the LAMP solution in the tank. Then the tank is reclosed pressed on the SPID adaptator placed on the cassette. After 30 minutes the results are read. (a) results using the streptavidin-colloïdal gold. (b) results using the mAb anti-biotine-colloïdal gold.
Figure 9.
Comparison of different methods for the conjugate deposition. (a) One stage deposition: The tank was opened, and 10 µL of either streptavidin or mAb anti-biotin conjugates were added. The tank was reclosed and pressed onto the SPID adaptor positioned on the cassette. (b) Dried conjugate deposition: The conjugate is dried on a Standard 14 membrane which is inserted between the sample pad and the nitrocellulose membrane. The tank is pressed onto the SPID adaptor positioned on the cassette. (c) Two stage deposition: The tank is pressed onto the SPID adaptor and after 5 minutes of migration the tank and the SPID adaptor were removed. Next, 100 µl of diluted conjugate (prepared by mixing 10 µl of conjugate with 90 µl of conjugate buffer) was applied to the strip. For all these conditions the results were read after 30 minutes.
Figure 10.
Comparison of different concentrations of FIP-digoxigenin. In this experiment all the primer mixes contained 1.6µM of BIP-biotine, 0.2µM of B3 and F3 and 0.4 µM of LB and LF. The mix 1 contained 1.6 µM of FIP-digoxingenin; Mix 2 contained 0.8 µM of FIP-digoxingenin and 0.8 µM of FIP; Mix 3 contained 0.4 µM of FIP-digoxingenin and 1.2 µM of FIP; Mix 4 contained 0.2 µM of FIP-digoxingenin and 1.4 µM of FIP.
Figure 11.
Evaluation of the limit of detection. 1 mL of E. coli bacterial suspension at 108 CFU/mL is filtered through the filtration/extraction unit of the SPID. The cup was then transferred into the tank, and 180 µL of LAMP reaction solution were added to the cup. The tank was closed, leading the solution to filter down into the tank. The tank was subsequently placed into the heating station and incubated at 63°C for 30 minutes. The tank is pressed onto the SPID adaptor and after 5 minutes of migration the tank and the SPID adaptor were removed. Next, 100 µl of diluted conjugate (prepared by mixing 10 µl of conjugate with 90 µl of conjugate buffer) was applied to the strip. The results were read after 30 minutes.
Table 1.
Caracteristics of the primers used for the malB amplification.
Table 1.
Caracteristics of the primers used for the malB amplification.
| Name |
Sequence |
5’pos |
3’pos |
Length |
Tm |
| F3 |
GGTGTCGATGACAGGTTGTT |
55 |
74 |
20 |
59.71 |
| B3 |
CCGTTTCTCACCGATGAACA |
269 |
288 |
20 |
59.71 |
| F2 |
CAAAGGGAGAAGGGCATGG |
76 |
94 |
19 |
59.87 |
| F1c |
GATACCACGACCTCGCCCCA |
127 |
146 |
20 |
65.62 |
| B2 |
TCTCACGCCCGGCAATCA |
233 |
250 |
18 |
60.75 |
| B1c |
ATTCGTGGTGTTTGTCGGACCG |
180 |
201 |
22 |
65.16 |
FIP
(F1c-F2)
|
GATACCACGACCTCGCCCCACAAAGGGAGAAGGGCATGG |
|
|
39 |
|
BIP
(B1c-B2)
|
ATTCGTGGTGTTTGTCGGACCGTCTCACGCCCGGCAATCA |
|
|
40 |
|
| LF |
CGTTACATTTTGCAGCTGTACGC |
98 |
120 |
23 |
64.92 |
| LB |
GGCTGCGGTAAATCGACTTTACT |
205 |
227 |
23 |
64.95 |
Table 2.
Composition of the different primer mixes.
Table 2.
Composition of the different primer mixes.
| Primer |
Mix 1 |
Mix 2 |
Mix 3 |
Mix 4 |
| BIP-biotin |
1.6 µM |
1.6 µM |
1.6 µM |
1.6 µM |
| FIP |
- |
0.8 µM |
1.2 µM |
1.4 µM |
| FIP-digoxigenin |
1.6 µM |
0.8 µM |
0.4 µM |
0.2 µM |
| B3 |
0.2 µM |
0.2 µM |
0.2 µM |
0.2 µM |
| F3 |
0.2 µM |
0.2 µM |
0.2 µM |
0.2 µM |
| LB |
0.4 µM |
0.4 µM |
0.4 µM |
0.4 µM |
| LF |
0.4 µM |
0.4 µM |
0.4 µM |
0.4 µM |
Table 3.
Validation result. The results are presented as a fraction: Number of positive or negative tests/ Total of strains.
Table 3.
Validation result. The results are presented as a fraction: Number of positive or negative tests/ Total of strains.
| Strains |
Positive results |
Negative results |
| E. coli |
12/12 |
0/12 |
| K. pneumoniae |
0/10 |
10/10 |
| E. cloacae |
0/1 |
1/1 |
| C. freundii |
3/4 |
1/4 |
| C. koseri |
0/1 |
1/1 |
| K. oxytoca |
0/1 |
1/1 |
| P. aeruginosa |
0/2 |
2/2 |
| P. mirabilis |
0/1 |
1/1 |
|
Disclaimer/Publisher’s Note: The statements, opinions and data contained in all publications are solely those of the individual author(s) and contributor(s) and not of MDPI and/or the editor(s). MDPI and/or the editor(s) disclaim responsibility for any injury to people or property resulting from any ideas, methods, instructions or products referred to in the content. |
© 2024 by the authors. Licensee MDPI, Basel, Switzerland. This article is an open access article distributed under the terms and conditions of the Creative Commons Attribution (CC BY) license (http://creativecommons.org/licenses/by/4.0/).
