Preprint
Article

Quantifying the Emergence of Basic Research Capabilities in Cluster Enterprises: An Analytical Framework Based on Information Entropy

Altmetrics

Downloads

52

Views

22

Comments

0

A peer-reviewed article of this preprint also exists.

This version is not peer-reviewed

Submitted:

09 October 2024

Posted:

09 October 2024

You are already at the latest version

Alerts
Abstract
This study looks at how basic research capabilities develop within enterprise clusters, focusing on the complex and adaptive nature of these systems. It builds a conceptual model using systems theory and applies information entropy to measure how much these capabilities have emerged. By using information entropy, the study creates a model to gauge how research abilities are forming in enterprise clusters. To dive deeper, the China Pingmei Shenma Group was used as a case study. Data came from interviews, surveys, and text analysis. This case—focused on a state-owned enterprise cluster in China’s coal-based energy and chemical industries—highlights the key factors that influence research capability growth. These factors include support from external systems, how internal resources are used, and their renewal over time. From 2017 to 2022, changes in entropy were tracked, revealing the process of research development driven by both internal and external forces. The study shows that when a system can bring in external resources while reducing internal disorder, its research capability is greatly improved. In real-world terms, the research proves that measuring entropy is a valuable way to evaluate and enhance research abilities within enterprise clusters, offering a clear method to manage innovation systems in tech-driven industries.
Keywords: 
Subject: Business, Economics and Management  -   Business and Management

1. Introduction

Basic research is crucial for businesses, helping drive original innovations and providing a competitive edge. Companies that are part of clusters benefit from shared tech challenges and open innovation environments, which encourage collective research efforts. When trust is high and information flows freely, an open innovation culture thrives within these clusters, boosting both inbound and outbound innovation [1]. By connecting companies within innovation networks, development speeds up, and technological competitiveness improves [2]. Since these firms often face similar technological hurdles and opportunities, they tend to focus on shared goals, using collective behaviors as inspiration. This focus helps drive basic research within the cluster.
In today's complex and uncertain innovation landscape [3], individual companies often don’t have the resources or capabilities needed to innovate on their own. More and more, businesses are collaborating with other companies or academic institutions to do joint R&D [4]. Studying how basic research capabilities emerge within cluster enterprises [5] is important for overcoming shared tech challenges and escaping the trap of being stuck in low-end markets. This is especially relevant for industries like biopharma and IT [6], where groundbreaking innovations rely heavily on basic research and cutting-edge science.
However, most basic research happens in universities and research institutes, so we don’t have enough studies on how enterprise clusters, as complex systems, can develop these capabilities [7,8]. Most current methods for evaluating a company’s basic research focus on simple, static quantitative data, or on linking basic research ability to innovation performance. There hasn’t been much research looking at the dynamic evolution of enterprise clusters as complex, open systems—this study aims to fill that gap.
Instead of using traditional methods, this study builds a conceptual model to explain how basic research capabilities emerge within clusters, viewed from a systems theory perspective [9,10]. It also creates a measurement model and indicator system for this emergence using information entropy [11,12]. To test this, an empirical study was carried out with the China Pingmei Shenma Group’s cluster enterprises as the case study.

2. Research Design

2.1. Conceptual Model of the Emergence of Cluster Enterprises’ Capability for Basic Research

Evaluating a company’s basic research capabilities is gaining more attention, but most studies stick to counting papers and patents as their main metrics [13,14]. This focus on numbers overlooks the true potential of basic research—its role in driving innovation and major breakthroughs. There’s also not much research that looks into how clusters of companies, as systems, build and strengthen their basic research abilities.
According to systems theory, a system is made up of many parts that are connected and influence each other. In the case of companies' basic research capabilities, these parts include R&D models and organizational processes, which interact with each other [2]. The processes within and between lead companies, partner firms, and universities or research institutions work together through various R&D models. Together, they form a larger, higher-level system—this is the basic research capabilities system of a cluster of companies [5].
This system is a complex adaptive one, with many stakeholders involved. When the key players—leading companies, partner firms, and universities—work together in a coordinated and organized way, basic research capabilities emerge within the system. Emergence happens when new characteristics or capabilities show up at the system level as its size and complexity grow [15]. Studies show that interactions within social systems, and between those systems and their environments, lead to phenomena like self-organization and coordination in large groups [16]. This link between self-organization and innovation suggests that these emergent patterns could drive scientific breakthroughs, offering a deeper understanding of how emergence works in basic research.
In an open innovation setting, the basic research capabilities of enterprise clusters [5] are seen in their ability to reorganize and optimize research processes between lead companies, partner firms, and universities. These capabilities come through coordinated management of key areas like strategic goals, knowledge bases, ability to absorb new information, willingness to innovate, and partnerships between industry and academia. When all these factors are aligned, the system works efficiently, boosting overall effectiveness.

2.2. Measurement Model of the Emergence of Cluster Enterprises’ Capability for Basic Research

2.2.1. Measurement and Assessment of Emergence Degree

To better understand and analyze how systems emerge and develop new characteristics, it's important to measure the strength of this emergence. When new features or patterns appear at the system level, it usually signals an increase in order within the system. This change in order can be measured using entropy, which tracks how orderly or chaotic the system becomes. Essentially, the strength of emergence is the difference in entropy from when the system starts to when it finishes its process.
If the system absorbs negative energy from the environment but ends up with a positive energy difference, it shows that an emergence process has occurred. For this study, which looks at how enterprise clusters build their foundational research capabilities, entropy is used as a key metric to evaluate the system’s emergence properties.

2.2.2. Metrics for the Emergence of Cluster Enterprises’ Capability for Basic Research

The idea of entropy was first introduced by Clausius, a key figure in thermodynamics, in 1865. The second law of thermodynamics, or the law of entropy increase, tells us that closed systems tend to become more chaotic and disordered over time as entropy rises. However, in open systems, entropy can be reduced when they interact with their environment. Negative entropy inputs from outside sources help these systems stay organized, coordinated, and adaptable. For example, organizational learning is one way that systems bring in negative entropy from their surroundings [17,18]. In this framework, information entropy, which measures a system's disorder, will increase or decrease depending on how orderly the system becomes over time. By tracking changes in information entropy, we can measure the strength of the emergence of an enterprise's basic research capabilities, which gives insight into how strong those capabilities are.
When companies use research resources, they deplete what's available, which increases entropy and lowers the system’s order. But, since enterprise clusters are open systems, they can share innovation outcomes, knowledge, and information both internally and with the outside world. This exchange, called entropy flow, helps the system become more organized. So, the total change in entropy in an open system is determined by the internal entropy generated and the entropy exchanged with the environment.
Using a method from previous research on entropy changes in insurance systems [19], this study develops a four-part indicator system to measure the entropy of enterprise clusters' basic research capabilities. These indicators are based on the components of entropy change: external system support, external system pressure, resource consumption, and regeneration.
External system support refers to how outside systems help the enterprise cluster, while external system pressure looks at the pressure the cluster puts on those external systems. Together, these form the entropy exchange, which is the net effect of the interactions between the enterprise cluster and external systems.
On the other hand, when enterprise clusters use up internal resources like finances (primary resources), it results in resource depletion, meaning these funds can no longer support the system. However, clusters also have the ability to regenerate—patents, new products, and R&D successes bring in revenue that replenishes the system. This falls under system regeneration, and the combined result of resource depletion and regeneration makes up the system’s entropy generation.
The total change in a system’s entropy comes from the combination of entropy exchange and entropy generation.
Entropy in the system can be broken into two types: positive and negative entropy. Positive entropy comes from internal conflicts in the organizational processes between leading companies, partner firms, and research institutions. If positive entropy keeps rising, the system becomes less coordinated, less effective, and more disordered. This increase in positive entropy reduces the system’s emergence strength, acting as a negative indicator for the system’s overall score.
Conversely, when the system brings in negative entropy from the environment, it offsets the internal positive entropy, helping maintain order, coordination, and efficiency between companies and universities. This creates the system’s overall capabilities, forming its foundational research strength. As negative entropy increases, it boosts the system’s emergence strength, serving as a positive measurement indicator.
This study uses these principles to build an evaluation system for enterprise clusters' research capabilities, as shown in Table 1.

2.2.2. The Entropy Generation and Entropy Flow of the Basic Research Capability System of Cluster Enterprises and the Emergence Measurement Model

  • Calculation Model of Entropy Generation and Entropy Flow in the Basic Research Capability System of Cluster Enterprises
Based on Shannon's information entropy theory, this study uses the random variable X to represent the state characteristics of an uncertain system, which exhibits complex and unstable properties. For the discrete random variable X, its set of values is denoted as X = x 1 , x 2 , , x n n 2 , where each value corresponds to a probability distribution P X i = p 1 , p 2 , , p n ( 0   P i 1 , i = 1,2 , , n , satisfying the condition that the sum of probabilities equals 1, i.e., Σ P i = 1 . Therefore, the information entropy of the system can be expressed by the following formula:
S = i = 1 n P X i ln P X i   i = 1,2 , , n
in formula (1), S represents the information entropy of a certain uncertain system, and P X i represents the probability corresponding to the state random variable of that uncertain system.
For the basic research capability system of cluster enterprises, based on the aforementioned information entropy formula (1), this study can calculate the system's entropy generation and entropy exchange. According to the definitions of entropy generation and entropy flow in the enterprise basic research capability system in section 2.2.2 of this study, we compute the information entropy for n measurement indicators and m years, where ΔS represents the entropy values for the four types of information entropy. The specific calculations are as follows:
Δ S 1 j = 1 ln m i = 1 5 q i j q j l n q i j q j   ( i = 1,2 , , 5 ;   j = 1,2 , , m )
Δ S 2 j = 1 ln m i = 6 8 q i j q j l n q i j q j   ( i = 6,7 , 8 ; j = 1,2 , , m )
Δ S 3 j = 1 ln m i = 9 12 q i j q j l n q i j q j   ( i = 9,11 , , 12 ;   j = 1,2 , , m )
Δ S 4 j = 1 ln m i = 13 18 q i j q j l n q i j q j   ( i = 13,14 , , 18 ;   j = 1,2 , , m )
In formulas (2), (3), (4), and (5), Δ S 1 j represents the system's support entropy for the j-th year, Δ S 2 j represents the system's pressure entropy for the j-th year, Δ S 3 j represents the system's internal consumption entropy for the j-th year, and Δ S 4 j represents the system's internal regeneration entropy for the j-th year. Here, q i j represents the normalized value of the i-th measurement indicator in the j-th year, while q j = i = 1 n q i j ( i = 12 , , 18 ; j = 12 , , m ) represents the total normalized value of the n measurement indicators for the j-th year.
  • Emergence Measurement Model of the Enterprise Basic Research Capability System Based on Information Entropy
Based on formulas (6) and (7), this study calculates the information entropy and entropy weight of each measurement indicator. If calculations are performed for n indicators and m years, let E i represent the information entropy of the i-th measurement indicator, which is specifically calculated as follows:
E i = 1 ln m j = 1 m q i j q j l n q i j q j ( i = 1,2 , , n ; j = 1,2 , , m )
In formula (6), E i represents the information entropy of the i-th measurement indicator, q i j represents the normalized value of the original data for the i-th measurement indicator in the j-th year, and i = 1 n q i j i = 1,2 , , n ; j = 12 , , m represents the sum of the normalized values of the n measurement indicators in the j-th year.
Then, based on the entropy weight method, this study calculates the entropy weight Q i of the i-th measurement indicator, which is specifically calculated as follows:
Q i = 1 E i n i = 1 n E i ( i = 1,2 , , n )
In formula (7), Q i represents the entropy weight of the i-th measurement indicator, E i represents the information entropy of the i-th measurement indicator, and n represents the number of measurement indicators. The condition i = 1 n Q i = 1,0 Q i 1 , n 2 is satisfied.
Finally, based on the entropy weights and the normalized data of the measurement indicators, this study can calculate the total score of the emergence (intensity) of the basic research capability system of cluster enterprises according to formula (8):
G j = i = 1 n Q i X i j *   ( i = 1,2 , , n ; j = 12 , , m )
In formula (8), X i j * represents the normalized data of the i-th measurement indicator in the j-th year, Q i represents the entropy weight of that indicator, and   G j represents the total score of the emergence of the basic research capability system of cluster enterprises for the j-th year.
Based on the value of   G j , this study can determine the emergence characteristics of the basic research capability system of cluster enterprises. When   G j is larger, it indicates that the emergence process in the j-th year exhibits more randomness or irregularity, and the complexity of the emergence process is higher. Conversely, when   G j is smaller, it suggests that the emergence process in the j-th year shows periodicity, and the complexity of the emergence process is lower.
In the positive and negative entropy indicator system of the basic research capability system of cluster enterprises, the measurement indicators that represent organizational process entropy and organizational routine entropy are regarded as positive entropy indicators. An increase in the data of positive entropy indicators will lead to a decrease in the system's emergence measurement total score, referred to as negative measurement indicators. In contrast, the measurement indicators representing direct environmental entropy and indirect environmental entropy are considered negative entropy indicators. An increase in the data of negative entropy indicators will lead to an increase in the system's emergence measurement total score, referred to as positive measurement indicators.
Since the specific numerical ranges and units of the measurement indicators may differ, the original data must be normalized to ensure equal weighting in the calculation. Through normalization, different types of measurement indicators are assigned appropriate weights, allowing for a more accurate reflection of the characteristics of the basic research capability system of cluster enterprises. The normalization methods are as follows:
  • Normalization of positive measurement indicators:
X i j * = X i j M a x X i j ( i = 1,2 , , n ; j = 12 , , m )
  • Normalization of negative measurement indicators:
X i j * = M i n X i j X i j ( i = 1,2 , , n ; j = 1,2 , , m )
In formulas (9) and (10), X i j represents the original data of the i-th measurement indicator in the j-th year, X i j * represents the normalized value, M a x X i j is the maximum value of all original data for the iii-th measurement indicator, and M i n X i j is the minimum value.

3. Case Study

3.1. Case Selection and Research Approach

The China Pingmei Shenma Group, often called Pingmei Shenma Group, is a large state-owned company mainly involved in the energy and chemical sectors. Their strategy focuses on "coal-centered, related diversification," and they operate four publicly traded companies: Pingmei Shares, Shenma Shares, Yicheng New Energy, and Silane Technology. Additionally, the group has six companies listed on the New Third Board, each specializing in different fields. With 34 high-tech enterprises—about 3% of its total subsidiaries—Pingmei Shenma embodies the qualities of a technology enterprise cluster.
As part of its diversification strategy, Pingmei Shenma has built enterprise clusters to address key technical challenges in coal-based energy and chemical industries. These clusters work to integrate innovation across the supply chain, from upstream to downstream, and focus on theoretical research to push forward general technology breakthroughs. This approach has steadily strengthened the basic research capabilities of the companies within the cluster, making this an area worth studying in depth.
Pingmei Shenma puts a strong emphasis on basic research and innovation in R&D, with all of its large industrial enterprises involved in research activities. Over the past three years, the group has received 97 provincial and ministerial Science and Technology Progress Awards and secured more than 1,200 intellectual property rights, including invention patents. To support their research, they have set up several key platforms. In September 2015, the Ministry of Science and Technology approved the group to establish the National Key Laboratory for the Development and Comprehensive Utilization of Coking Coal Resources. This lab, after being reorganized, also launched the Nylon Technology Innovation Center, which fully integrates the value chains of nylon fiber and engineering plastics. The group has also pioneered projects in carbon-based new materials and high-performance nylon fiber, earning recognition from Henan Province.
This study builds an emergence measurement model to assess the basic research capabilities of Pingmei Shenma Group’s cluster enterprises. Based on the company’s unique context, 18 measurement indicators were identified. Data from 2017 to 2022 were collected through interviews, surveys, and text analysis. Empirical analysis was then conducted using Matlab 7.0.

3.2. Data Sources and Processing

In the last section, the study built a general indicator system to measure the emergence of basic research capabilities in enterprise clusters. However, when focusing on specific clusters like the Pingmei Shenma Group, unique characteristics often come into play. For this research, 22 emergence indicators were selected to evaluate Pingmei Shenma’s basic research capabilities from 2017 to 2022.
The data for these indicators came from two main sources. First, structured quantitative data was collected from Pingmei Shenma’s annual financial reports and coal chemical industry reports. Second, semi-structured qualitative data was gathered through expert evaluations and scoring. After organizing these data sets, they provided the raw values for the emergence metric indicators used to assess Pingmei Shenma’s cluster research system.
The study then used Matlab software to process these data, applying formulas (2), (3), (4), (5), (7), (8), (9), and (10). This analysis produced normalized values, information entropy values, entropy weights, and other key metrics necessary to assess the system’s emergence strength.

4. Results

The metric data for this case study were computed, with the specific results presented in Table 2.

4.1. Analysis of Entropy Variation

The calculation results in Table 2 show that from 2017 to 2022, the entropy of the Pingmei Shenma Group’s basic research system has been gradually decreasing. This trend suggests that the system’s orderliness has been improving, and its stability is becoming stronger. There was a slight fluctuation between 2020 and 2021, but overall, the system has developed in a positive and organized direction. Based on these results, a graph illustrating the total entropy change over the years was created, as shown in Figure 1.
As shown in Figure 1, the total entropy of the Pingmei Shenma Group’s basic research system remained in the negative entropy range, meaning the system was continuously drawing resources from the socio-economic environment to support its research efforts. At the same time, it was removing disordered elements, reducing redundancy, and improving the efficiency of its research activities. The system’s entropy progression can be broken into three phases: a reduction in entropy (less disorder) from 2017 to 2020, an increase in entropy (more disorder) from 2020 to 2021, and another phase of entropy reduction from 2021 to 2022.
In 2020, China set its goals for peak carbon emissions and carbon neutrality, which led to widespread carbon reduction policies across the country. As a state-owned enterprise deeply rooted in the traditional energy and chemical industries, Pingmei Shenma’s coal chemical sector was impacted by these policies. The company had to adapt its strategy, undergoing organizational reforms and adjustments, which caused a rise in system entropy from 2020 to 2021 due to both internal and external pressures.
After over a year of strategic adjustments, Pingmei Shenma adopted a technological innovation strategy, shifting its focus from using coal as a fuel to utilizing it as a raw material. This led to the creation of three unique coal-based industrial chains: nylon chemicals, carbon materials, silicon materials, and hydrogen energy. These efforts sped up the group’s transition to low-carbon solutions, resulting in a reduction in entropy between 2021 and 2022. For instance, since 2021, the group has set up four full-process labs dedicated to research in new carbon materials and related areas, and it launched four joint venture incubation enterprises like Silane Technology. The group also brought to market products such as needle coke, flame-retardant fibers, specialty nylon 66 filaments, and catalysts, achieving breakthroughs in critical technologies like adiponitrile and para-aramid production.
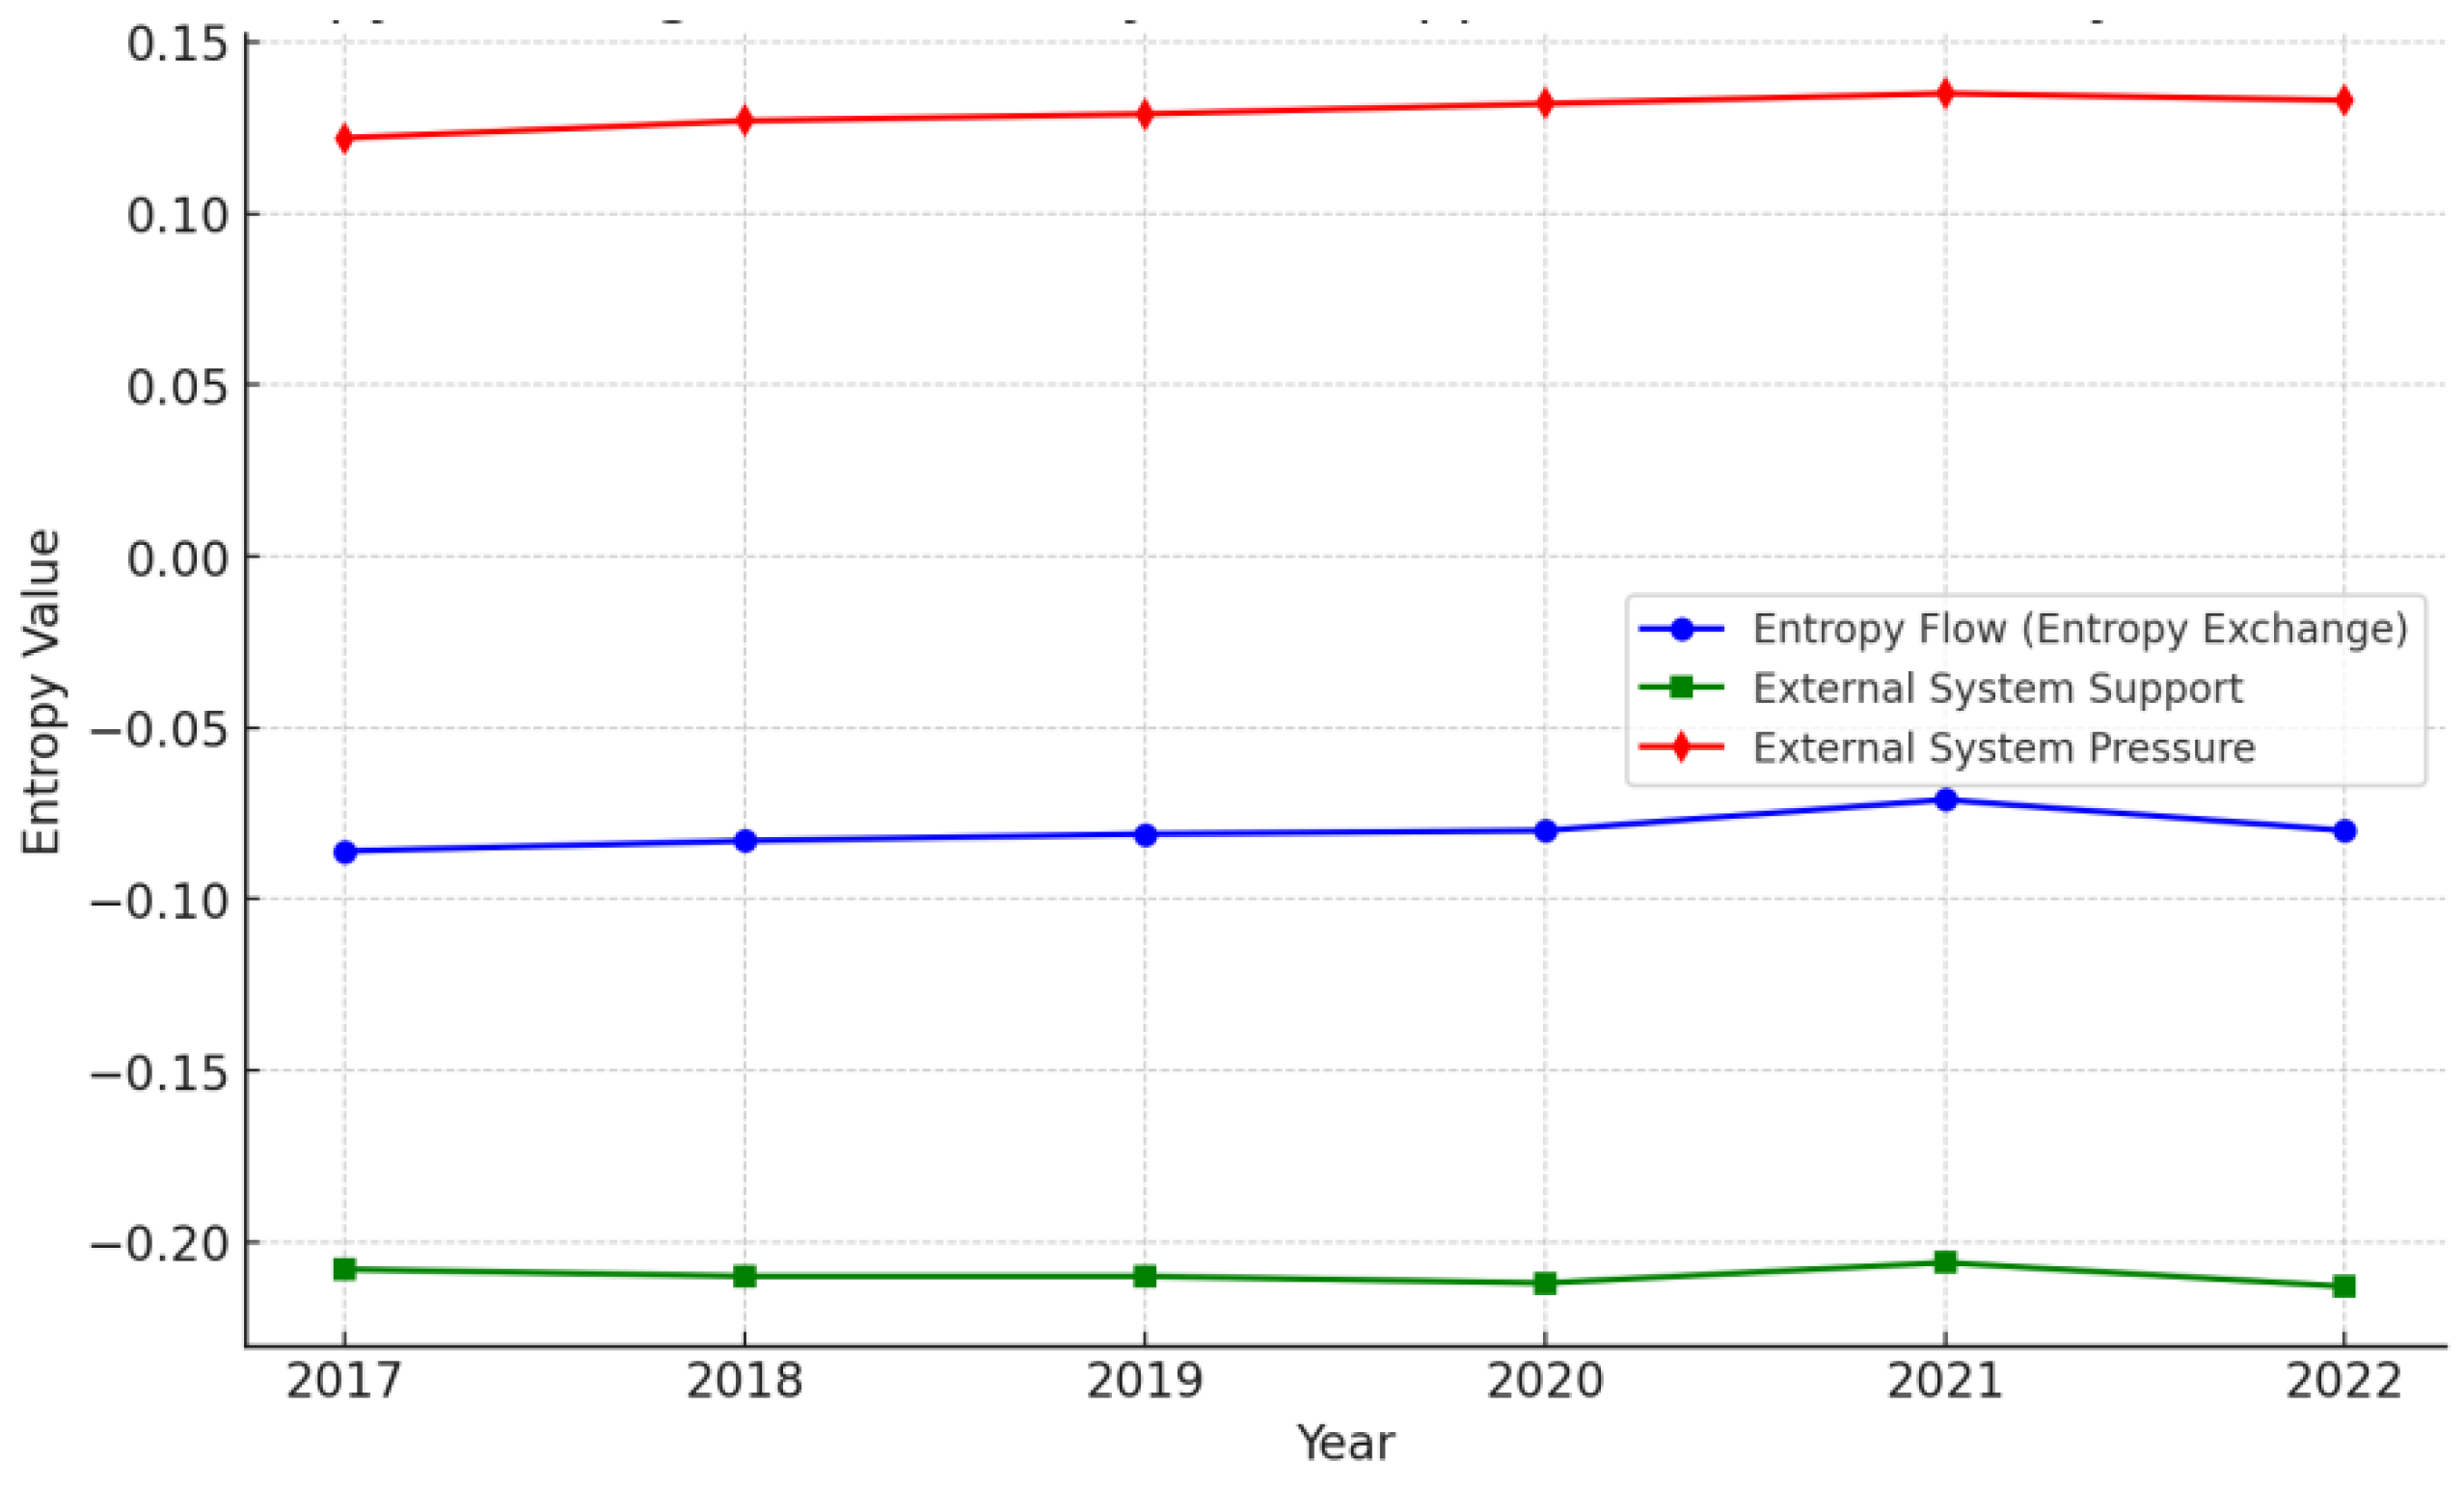
Using the data from Table 2, the entropy exchange between Pingmei Shenma’s cluster enterprises and external systems (the environment) was calculated, reflecting both the support received and the pressure exerted by external systems. These results are illustrated in Figure 2.
As shown in Figure 2, the overall trend of entropy exchange between the Pingmei Shenma Group and its environment shows that the input of negative entropy (order) from external sources consistently exceeds the output of positive entropy (disorder). This means that the enterprise cluster successfully brings in external resources—through interactions with stakeholders like the government, suppliers, and customers—to maintain internal order and stability.
For instance, one of the cluster enterprises, Cord Fabric Development Company, has tapped into external R&D resources to build a full-process key laboratory for nylon fibers. It has leveraged platforms such as the Henan Province Fiber Reinforcement Materials Engineering Technology Research Center and the Henan Province High-Performance Polyamide Fiber Engineering Technology Research Center. Additionally, the lab works with the Enterprise Technology Center and the Joint R&D Center of Beijing University of Chemical Technology. By focusing on green, functional nylon fibers and downstream applications, the company has established a comprehensive technological innovation platform. This platform integrates lab testing, field trials, principal analysis, and engineering applications, providing strong support for ongoing technological R&D.
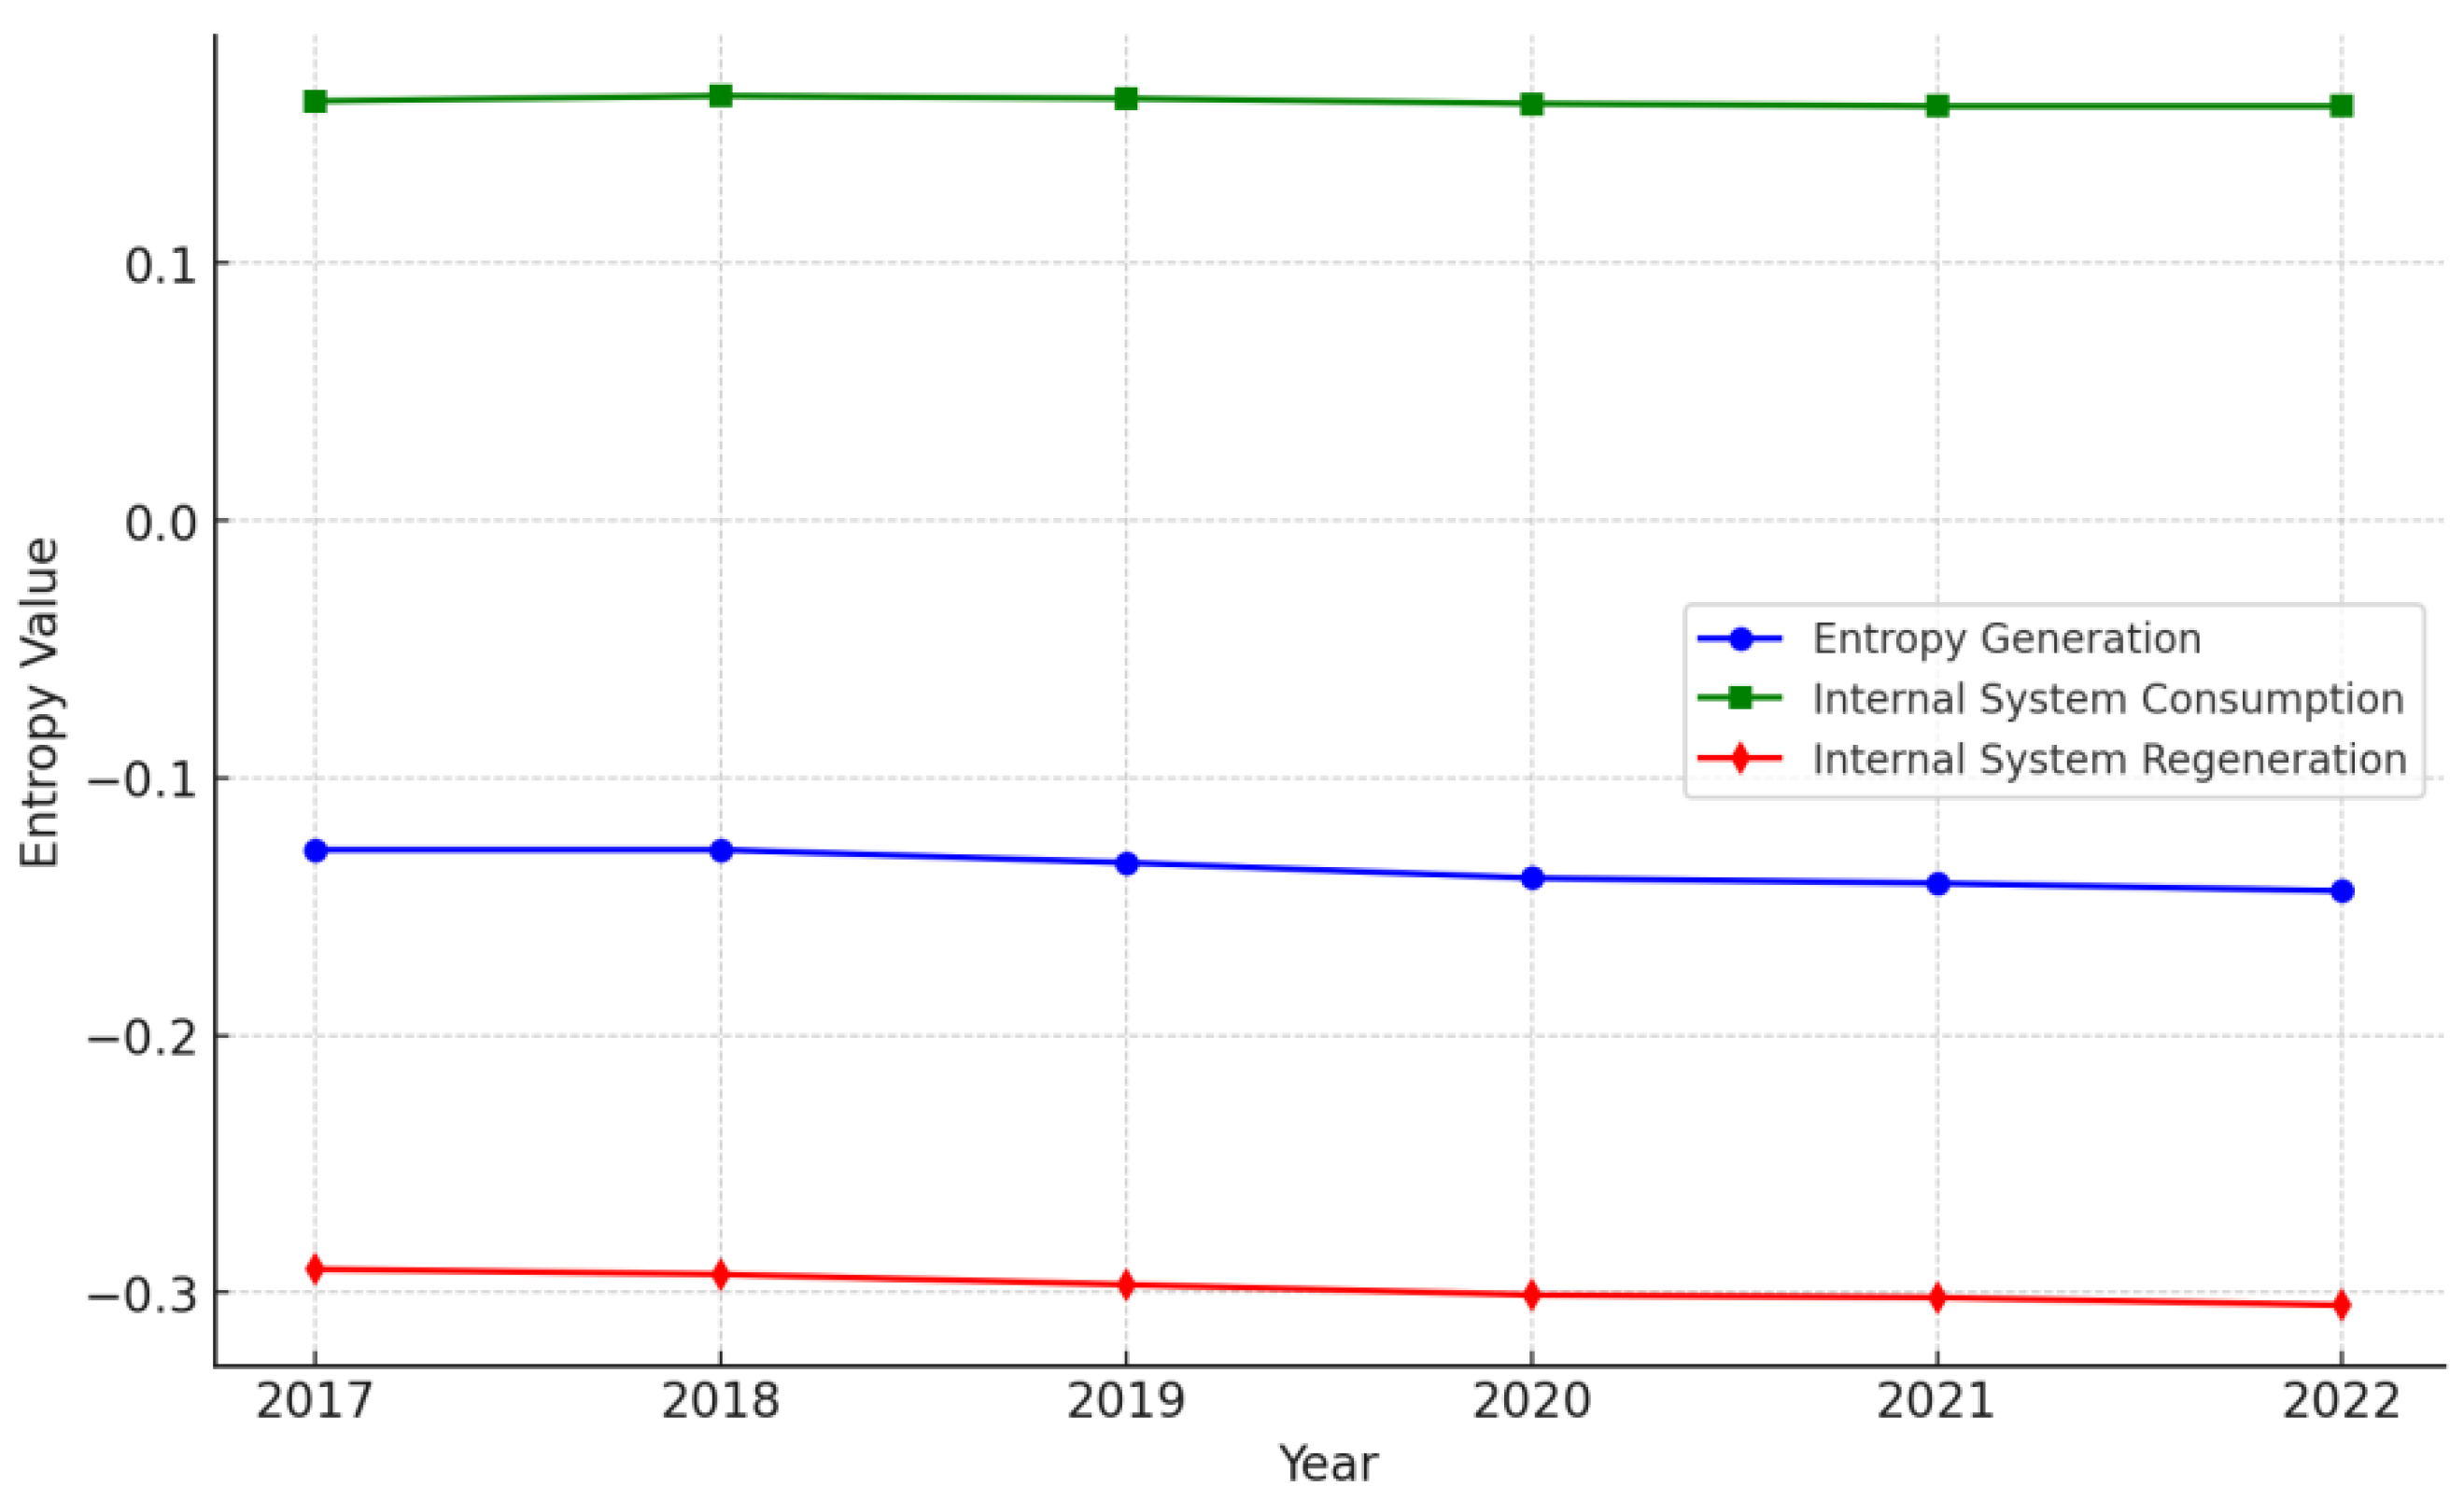
Using the data from Table 2, a plot of entropy generation within the Pingmei Shenma Group’s enterprise system was created. Entropy generation reflects both the consumption of resources and the system’s ability to regenerate, and the results are shown in Figure 3.
Entropy generation is used to measure how well industrial clusters balance using and regenerating resources. As shown in Figure 3, the Pingmei Shenma Group’s system shows that resource regeneration consistently exceeds consumption. This means their fundamental research follows a well-structured "consumption-regeneration" cycle, creating a positive feedback loop. This cycle integrates basic research, applied research, experimental development, pilot studies, industrialization, and feedback, which in turn boosts both the efficiency and quality of their scientific research.
Pingmei Shenma has also implemented a targeted R&D incentive system tailored to the different stages of research. This system includes incentives like large one-time bonuses, profit-sharing based on R&D results, and even equity or stock options. For example, equity incentives have been used for projects tied closely to fundamental research, like graphene thermal films and graphite bipolar plates. On the other hand, profit-sharing—ranging from 5% to 15%—has been applied to new product development projects requiring significant application of basic research, such as aramid products.
Additionally, the group has introduced a set of "Special Regulations on Scientific and Technological Innovation," which provides clear guidelines for streamlining the research process. These include faster procurement of research equipment, flexible allocation of research funds, treating technology investment as profit, and prioritizing the purchase of scientific equipment to support R&D.

4.2. The Emergence of Cluster Enterprises’ Basic Research Capability as a System

By analyzing the entropy values of the Pingmei Shenma Group from 2007 to 2022—taking into account external system support, external system pressure, internal system consumption, and regeneration—we can draw the following conclusion: The negative entropy (a combination of external system support and internal system regeneration) in Pingmei Shenma’s basic research system consistently surpassed the positive entropy (which includes external system pressure and internal resource consumption). This shows that, overall, external environmental factors positively influenced the system, with negative entropy increasing throughout the period.
Even though the "carbon peak and neutrality" policy caused some disruptions, along with temporary setbacks from aggressive carbon reduction efforts, Pingmei Shenma relied on basic research and technological innovation to drive the clean and efficient use of coal and to transform and upgrade the coal chemical industry. By capitalizing on the diversified strengths within its enterprise cluster and collaborating with other companies along the industrial chain, Pingmei Shenma built a comprehensive basic research platform. This placed their basic research system in a state of non-equilibrium, which actually created opportunities for emergence—new capabilities within their basic research system.
Additionally, in response to the national "1+N" carbon neutrality policy framework and the global push for carbon reduction, Pingmei Shenma launched several initiatives. These included advancing R&D processes, building new platforms, and implementing institutional innovations. These actions helped accelerate the emergence of basic research capabilities, as negative entropy from external environmental changes flowed into the system, reducing the effects of internal inefficiencies. As the leading enterprise, Pingmei Shenma spearheaded collaborative innovation with related businesses, universities, and research institutions, creating a synergistic and highly coordinated structure. This strengthened the system’s ability to handle external pressures, making its research efforts more efficient and organized, even in the face of disruptive changes.

4.3. Analysis of the Emergent Properties in the Basic Research Capability of Cluster Enterprises

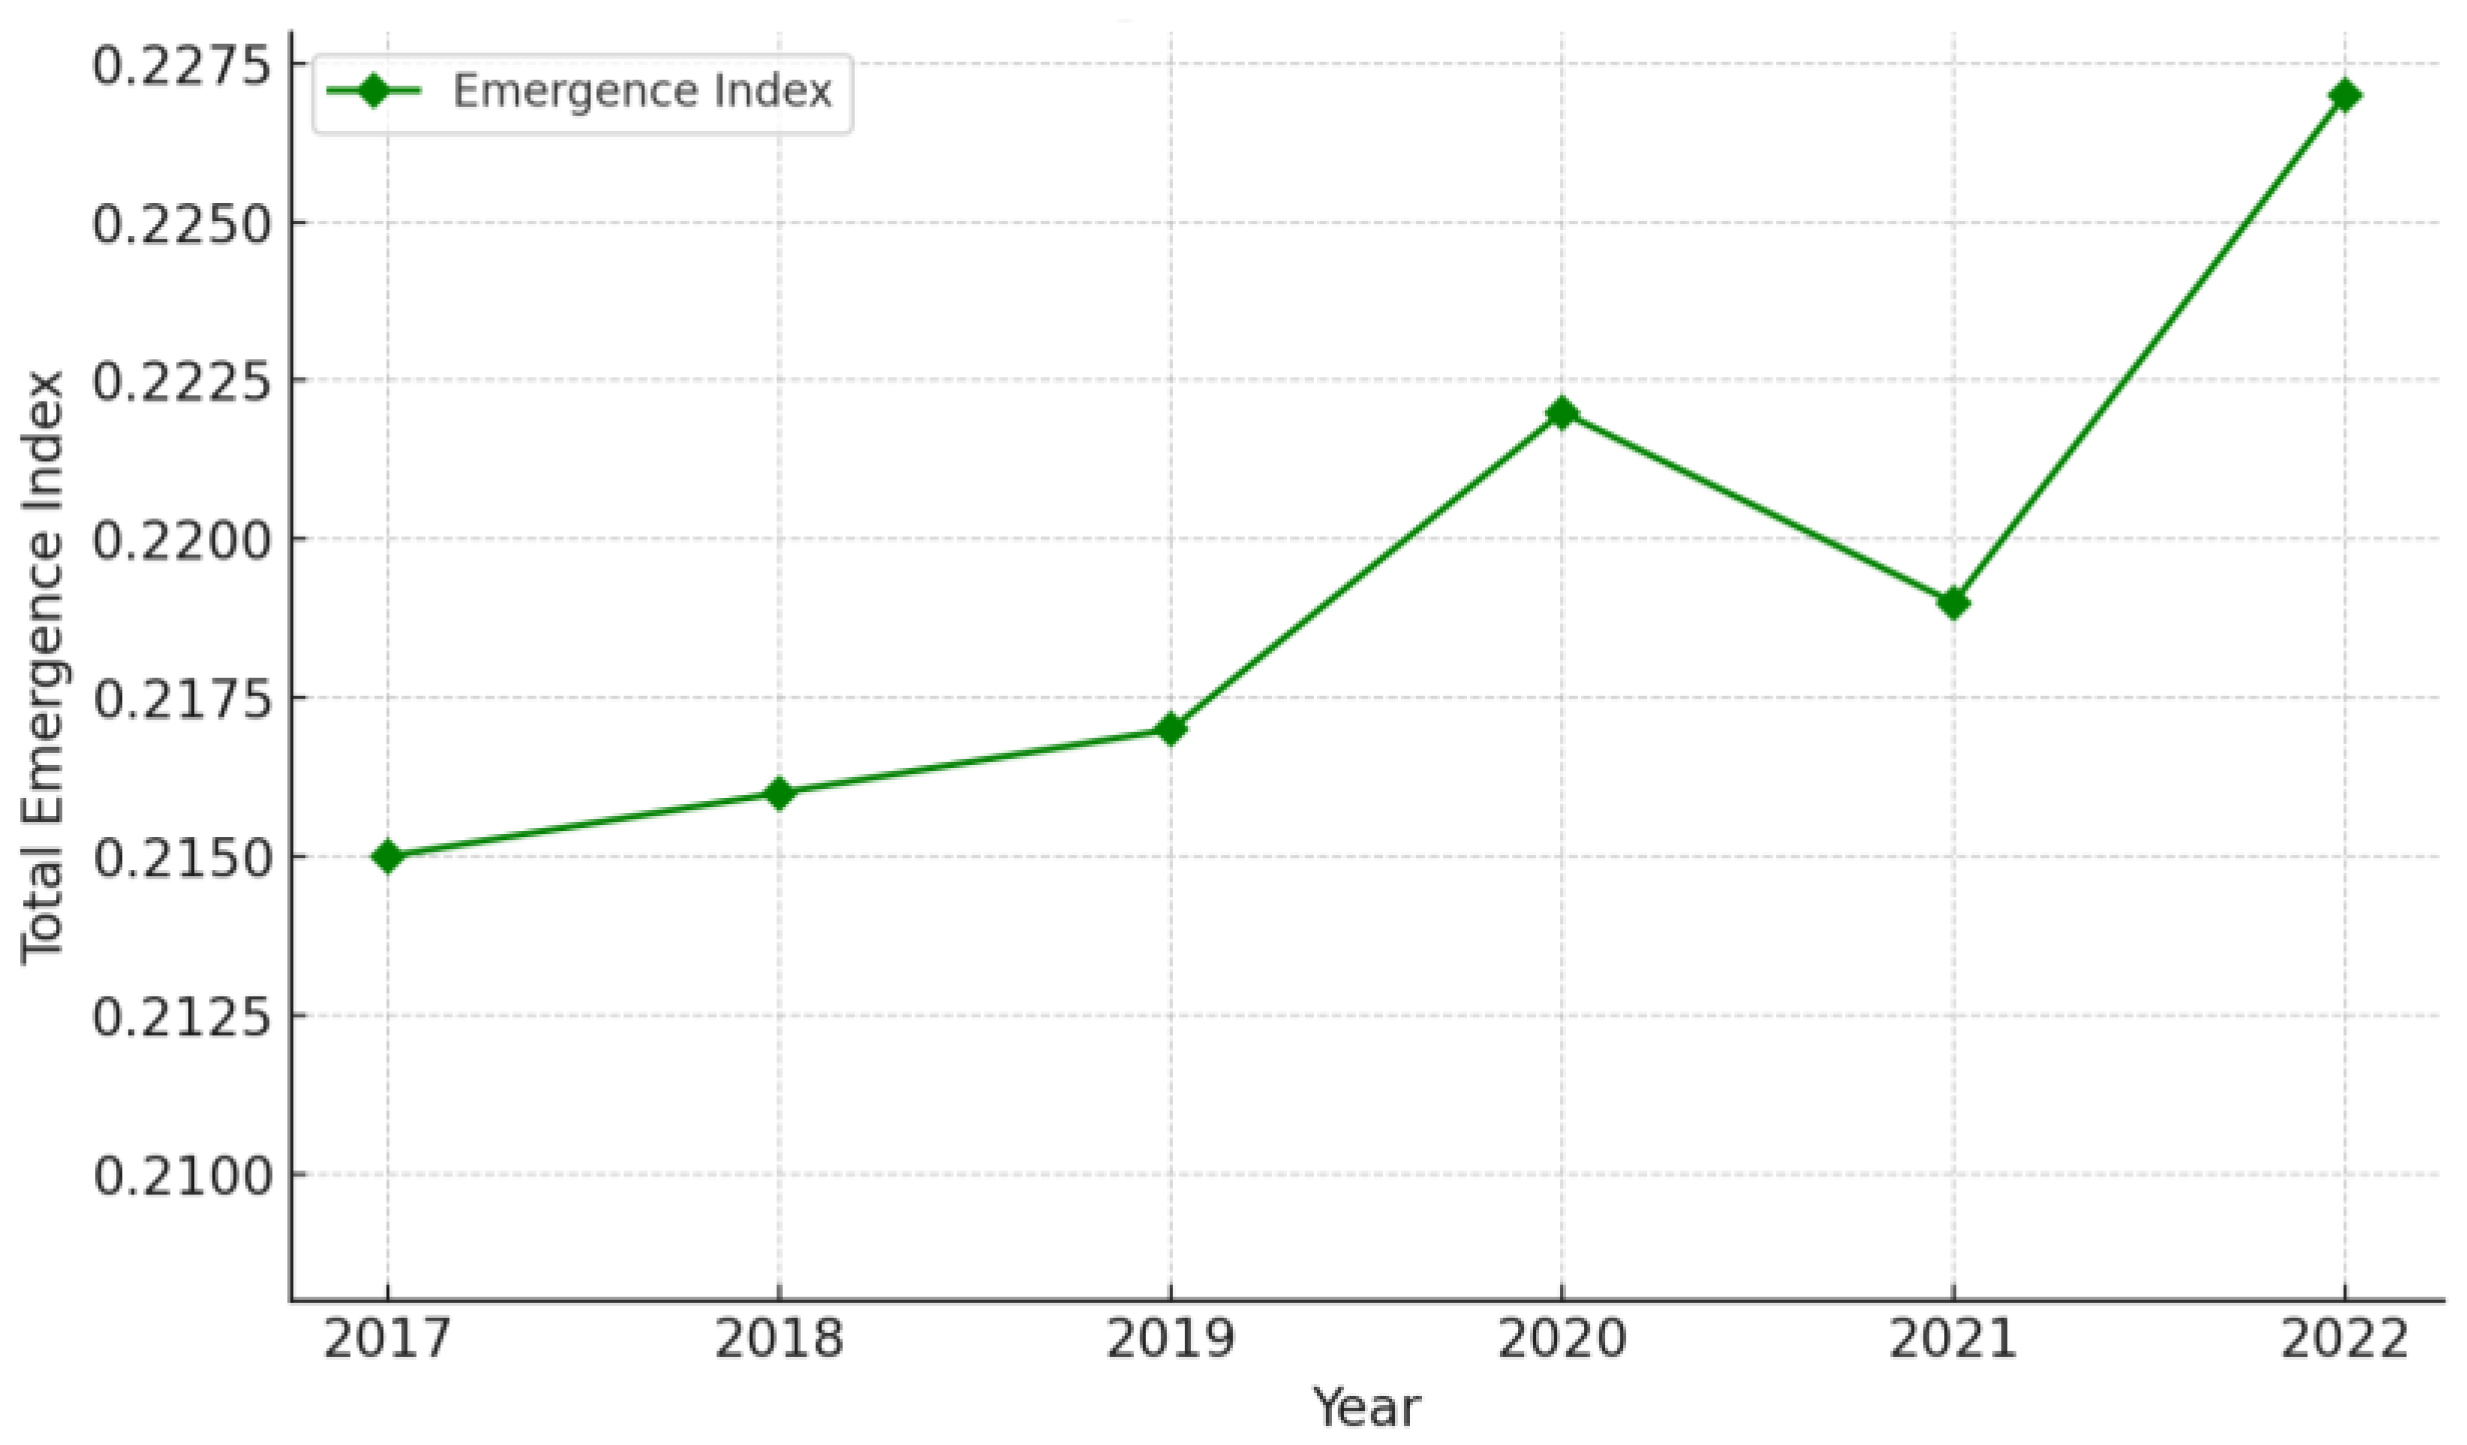
As shown in Figure 4, the total emergence index of basic research capabilities for Pingmei Shenma Group’s cluster enterprises saw a steady upward trend from 2017 to 2022, despite a temporary dip in 2021. The emergence of basic research capabilities in these enterprise clusters happens through dissipative structures, which form in a state of equilibrium. Unlike weak emergence, which can be predicted by examining the local parts of a system, strong emergence can’t be deduced just by looking at the individual components or their rules. Since enterprises—unlike universities or research institutions—don’t primarily focus on basic research, the development of basic research capabilities in these clusters shows signs of strong emergence. This means their ability to innovate and grow in basic research goes beyond what you'd expect from just their usual operations.
The dip in Pingmei Shenma’s total emergence index in 2021 was mainly due to the introduction of China III motor vehicle emission standards. However, the index bounced back in 2022, thanks to a mix of external environmental changes and internal transformations within the enterprise cluster. With the coal industry facing increasing pressure to transform and upgrade, Pingmei Shenma adopted an open innovation model. This involved collaborating with other enterprises, universities, and research institutions, which boosted their basic research capabilities, especially during the incubation and application of research outcomes.
Pingmei Shenma also expanded the boundaries of its basic research system by including private enterprises as key stakeholders through mixed-ownership reforms. At the same time, the group introduced new R&D management processes. By reorganizing and optimizing these processes across a diverse set of innovation stakeholders, the system saw a rise in basic research capabilities, reflected in the improved emergence measurement score for 2022.
As Pingmei Shenma worked toward China's "carbon peak and neutrality" goals and tackled challenges like "resource depletion and company decline," their basic research capabilities evolved. The group focused on upgrading technology for cleaner, more efficient coal use, leading to a significant leap in research capabilities between 2021 and 2022. Facing strategic shifts—such as managing excess capacity, eliminating outdated production, and encouraging advanced capacity—alongside the disruptions of innovation, Pingmei Shenma's top management proposed a diversification strategy. This strategy focuses on high-end industrial chains in areas like nylon chemicals, new energy materials, and semiconductors.
By establishing a foundational research platform that promotes collaboration and coordinated development across its businesses, Pingmei Shenma aims to drive industrial restructuring and extend the coal-based materials value chain. This move also supports value-added transformation of coal resources, placing greater emphasis on the group's research capabilities. It requires tight coordination and the emergence of research strengths from leading companies, partner enterprises, and universities within their innovation ecosystem.

5. Discussion and Conclusion

5.1. Research Conclusions

This study builds a system emergence model to evaluate the basic research capabilities of enterprise clusters, grounded in systems theory and using information entropy as the measurement tool. The model is flexible and can be applied across various contexts. Here's how it works:
First, the study distinguishes between positive and negative entropy in the research system. Positive entropy stems from external pressures and internal resource consumption (things that lead to disorder), while negative entropy comes from external support and internal regeneration (things that bring order). This gives us a way to analyze the emergence of research capacity within clusters.
Second, the model splits the changes in system entropy into two parts: entropy production and entropy exchange. Entropy production measures how well the research processes are organized and how adaptable the research models are. Entropy exchange shows how the system adapts to external environments or other systems. The total entropy change describes the overall emergence of the system’s capabilities.
Third, this research identifies four key entropy indicators to measure the emergence of basic research capabilities in enterprise clusters. Internal consumption tracks the increase in entropy (disorder) within the system due to resource use, while internal regeneration measures the decrease in entropy as the system restores order through regeneration. External support represents the entropy exchange process, where the system acquires information, materials, and energy from its environment, helping maintain or improve order. In contrast, external pressure reflects the release of these resources back into the environment, contributing to disorder. Together, these indicators provide a comprehensive framework to evaluate how well the system adapts, grows, and organizes itself through its internal and external interactions.
Finally, a case study of the China Pingmei Shenma Group and its diversification strategy tested the model. The findings showed that the model accurately reflected the trends in Pingmei Shenma’s basic research capabilities from 2017 to 2022. This confirms that the system has strong emergence properties, with rich dynamics in its R&D process. The study also demonstrates that this model, based on information entropy, is both practical and broadly applicable to measure and evaluate the basic research capacity of enterprise clusters..

5.2. Theoretical Contributions and Practical Implications

5.2.1. Theoretical Contributions

From a systems theory perspective, this study builds on previous research that analyzed the factors influencing enterprises' basic research capacity through a reductionist lens. Earlier studies identified various factors, such as firm size, profit levels, knowledge integration capacity, and labor productivity, that drive differences in how companies prioritize basic research [20,21]. These factors form the foundation for this study's analysis of system entropy, aggregating them to the system level to examine their combined effects on basic research capacity. By adopting a holistic approach, this study extends the research paradigm used to analyze regional innovation systems [22] and applies it to enterprise-level innovation systems, particularly within enterprise clusters. It explores the dynamic interactions and coupling relationships between multiple influencing factors, providing a comprehensive framework to assess the emergence of basic research capacity in these clusters. Additionally, the study refines the application of information entropy theory to measure system capacity [19], improving upon earlier models that simply labeled environmental factors as negative entropy and internal factors as positive entropy. By distinguishing environmental factors into external support (negative entropy) and external pressure (positive entropy), and internal factors into internal regeneration (negative entropy) and internal consumption (positive entropy), this study offers a more precise understanding of minor fluctuations within the system. This nuanced approach helps optimize the structure of basic research capacity in enterprise clusters, creating opportunities for improvement.

5.2.2. Management Implications

First, intense market competition pushes enterprises to quickly meet market needs and apply research outcomes, but the conversion of basic research into market-ready products is often slow and uncertain. While some research suggests the innovation cycle is becoming shorter [23,24], there is still a gap between this trend and the fast-paced demands of market cycles. To address this, enterprises can leverage collaboration within clusters to speed up the emergence of basic research capacity. Those pursuing related diversification strategies can set research agendas around common technical challenges and work with other cluster enterprises to solve them collectively.
Second, although governments often influence industry research topics through major science and technology programs, companies can't rely solely on government planning for their research directions [25]. This study shows that enterprises can balance basic and applied research by developing independent R&D strategies, which helps foster the emergence of basic research capacity. Policymakers can support this by promoting collaboration among technologically related enterprise clusters and encouraging their collective innovation efforts.

Author Contributions

Conceptualization, H.Z.; Data curation, Z.H.; Formal analysis, H.Z. and H.Z.; Funding acquisition, Z.H.; Methodology, H.Z.; Project administration, Z.H.; Software, H.Z.; Supervision, H.Z.; Validation, H.Z. and H.Z.; Visualization, H.Z.; Writing—original draft, H.Z.; Writing—review and editing, H.Z. and H.Z. All authors have read and agreed to the published version of the manuscript.

Funding

The work is supported by the National Social Science Fund of China (No. 20BGL002).

Institutional Review Board Statement

Not applicable.

Data Availability Statement

Data are contained within the article.

Conflicts of Interest

The authors declare no conflicts of interest.

References

  1. Nestle, V.; Täube, F.A.; Heidenreich, S.; Bogers, M. Establishing open innovation culture in cluster initiatives: The role of trust and information asymmetry. Technological Forecasting and Social Change 2019, 146, 563–572. [Google Scholar] [CrossRef]
  2. Xu, Y.; Li, X.; Tao, C.; Zhou, X. Connected knowledge spillovers, technological cluster innovation and efficient industrial structure. Journal of Innovation & Knowledge 2022, 7, 100195. [Google Scholar]
  3. Madanaguli, A.; Dhir, A.; Talwar, S.; Clauss, T.; Kraus, S.; Kaur, P. Diving into the uncertainties of open innovation: A systematic review of risks to uncover pertinent typologies and unexplored horizons. Technovation 2023, 119, 102582. [Google Scholar] [CrossRef]
  4. O’Dwyer, M.; Filieri, R.; O’Malley, L. Establishing successful university–industry collaborations: barriers and enablers deconstructed. The Journal of Technology Transfer 2023, 48, 900–931. [Google Scholar] [CrossRef]
  5. Pan, X.; Song, M.L.; Zhang, J.; Zhou, G. Innovation network, technological learning and innovation performance of high-tech cluster enterprises. Journal of Knowledge Management 2019, 23, 1729–1746. [Google Scholar] [CrossRef]
  6. Gnekpe, C.; Coeurderoy, R.; Mulotte, L. How a firm’s knowledge base influences its external technology sourcing strategy: the case of biopharmaceutical firms. Industry and Innovation 2023, 30, 233–262. [Google Scholar] [CrossRef]
  7. Abootorabi, H.; Wiklund, J.; Johnson, A.R.; Miller, C.D. A holistic approach to the evolution of an entrepreneurial ecosystem: An exploratory study of academic spin-offs. Journal of Business Venturing 2021, 36, 106143. [Google Scholar] [CrossRef]
  8. Nsanzumuhire, S.U.; Groot, W. Context perspective on University-Industry Collaboration processes: A systematic review of literature. Journal of cleaner production 2020, 258, 120861. [Google Scholar] [CrossRef]
  9. Theodoraki, C.; Dana, L.-P.; Caputo, A. Building sustainable entrepreneurial ecosystems: A holistic approach. Journal of Business Research 2022, 140, 346–360. [Google Scholar] [CrossRef]
  10. Daniel, L.J.; de Villiers Scheepers, M.J.; Miles, M.P.; de Klerk, S. Understanding entrepreneurial ecosystems using complex adaptive systems theory: Getting the big picture for economic development, practice, and policy. Entrepreneurship & Regional Development 2022, 34, 911–934. [Google Scholar]
  11. Mnif, M.; Müller-Schloer, C. Quantitative emergence. Organic Computing—A Paradigm Shift for Complex Systems 2011, 39-52.
  12. Yuan, B.; Zhang, J.; Lyu, A.; Wu, J.; Wang, Z.; Yang, M.; Liu, K.; Mou, M.; Cui, P. Emergence and causality in complex systems: A survey of causal emergence and related quantitative studies. Entropy 2024, 26, 108. [Google Scholar] [CrossRef] [PubMed]
  13. Krieger, B.; Pellens, M.; Blind, K.; Gruber, S.; Schubert, T. Are firms withdrawing from basic research? An analysis of firm-level publication behaviour in Germany. Scientometrics 2021, 126, 9677–9698. [Google Scholar] [CrossRef]
  14. Fan, X.; Yang, X.; Yu, Z. Effect of basic research and applied research on the universities’ innovation capabilities: The moderating role of private research funding. Scientometrics 2021, 126, 5387–5411. [Google Scholar] [CrossRef]
  15. Kalantari, S.; Nazemi, E.; Masoumi, B. Emergence phenomena in self-organizing systems: a systematic literature review of concepts, researches, and future prospects. Journal of organizational computing and electronic commerce 2020, 30, 224–265. [Google Scholar] [CrossRef]
  16. Siegenfeld, A.F.; Bar-Yam, Y. An introduction to complex systems science and its applications. Complexity 2020, 2020, 6105872. [Google Scholar] [CrossRef]
  17. Anjaria, K. Negation and entropy: Effectual knowledge management equipment for learning organizations. Expert Systems with Applications 2020, 157, 113497. [Google Scholar] [CrossRef]
  18. Durmaz, A.; Demir, H.; Sezen, B. The role of negative entropy within supply chain sustainability. Sustainable Production and Consumption 2021, 28, 218–230. [Google Scholar] [CrossRef]
  19. Ping, W.; Baozhong ,S.; Xi, C.. Situation Analysis of Basic Endowment Insurance for the Urban Working Group System from the Perspective of Dissipative Structure Theory. China Soft Science 2015, 173–183.
  20. Choi, J.-U.; Lee, C.-Y. The differential effects of basic research on firm R&D productivity: The conditioning role of technological diversification. Technovation 2022, 118, 102559. [Google Scholar]
  21. Sheer, L. Sitting on the fence: Integrating the two worlds of scientific discovery and invention within the firm. Research Policy 2022, 51, 104550. [Google Scholar] [CrossRef]
  22. Yan, Z.; Chen, W. Evaluation of the performance of regional innovation systems based on the dissipative structure. Science Research Management 2018, 39, 37–43. [Google Scholar] [CrossRef]
  23. Ahmad, M.; Zheng, J. The cyclical and nonlinear impact of R&D and innovation activities on economic growth in OECD economies: A new perspective. Journal of the Knowledge Economy 2023, 14, 544–593. [Google Scholar]
  24. Blomsma, F.; Bauwens, T.; Weissbrod, I.; Kirchherr, J. The ‘need for speed’: Towards circular disruption—What it is, how to make it happen and how to know it's happening. Business Strategy and the Environment 2023, 32, 1010–1031. [Google Scholar]
  25. Shaw, J. There and back again: Revisiting Vannevar Bush, the linear model, and the freedom of science. Research Policy 2022, 51, 104610. [Google Scholar]
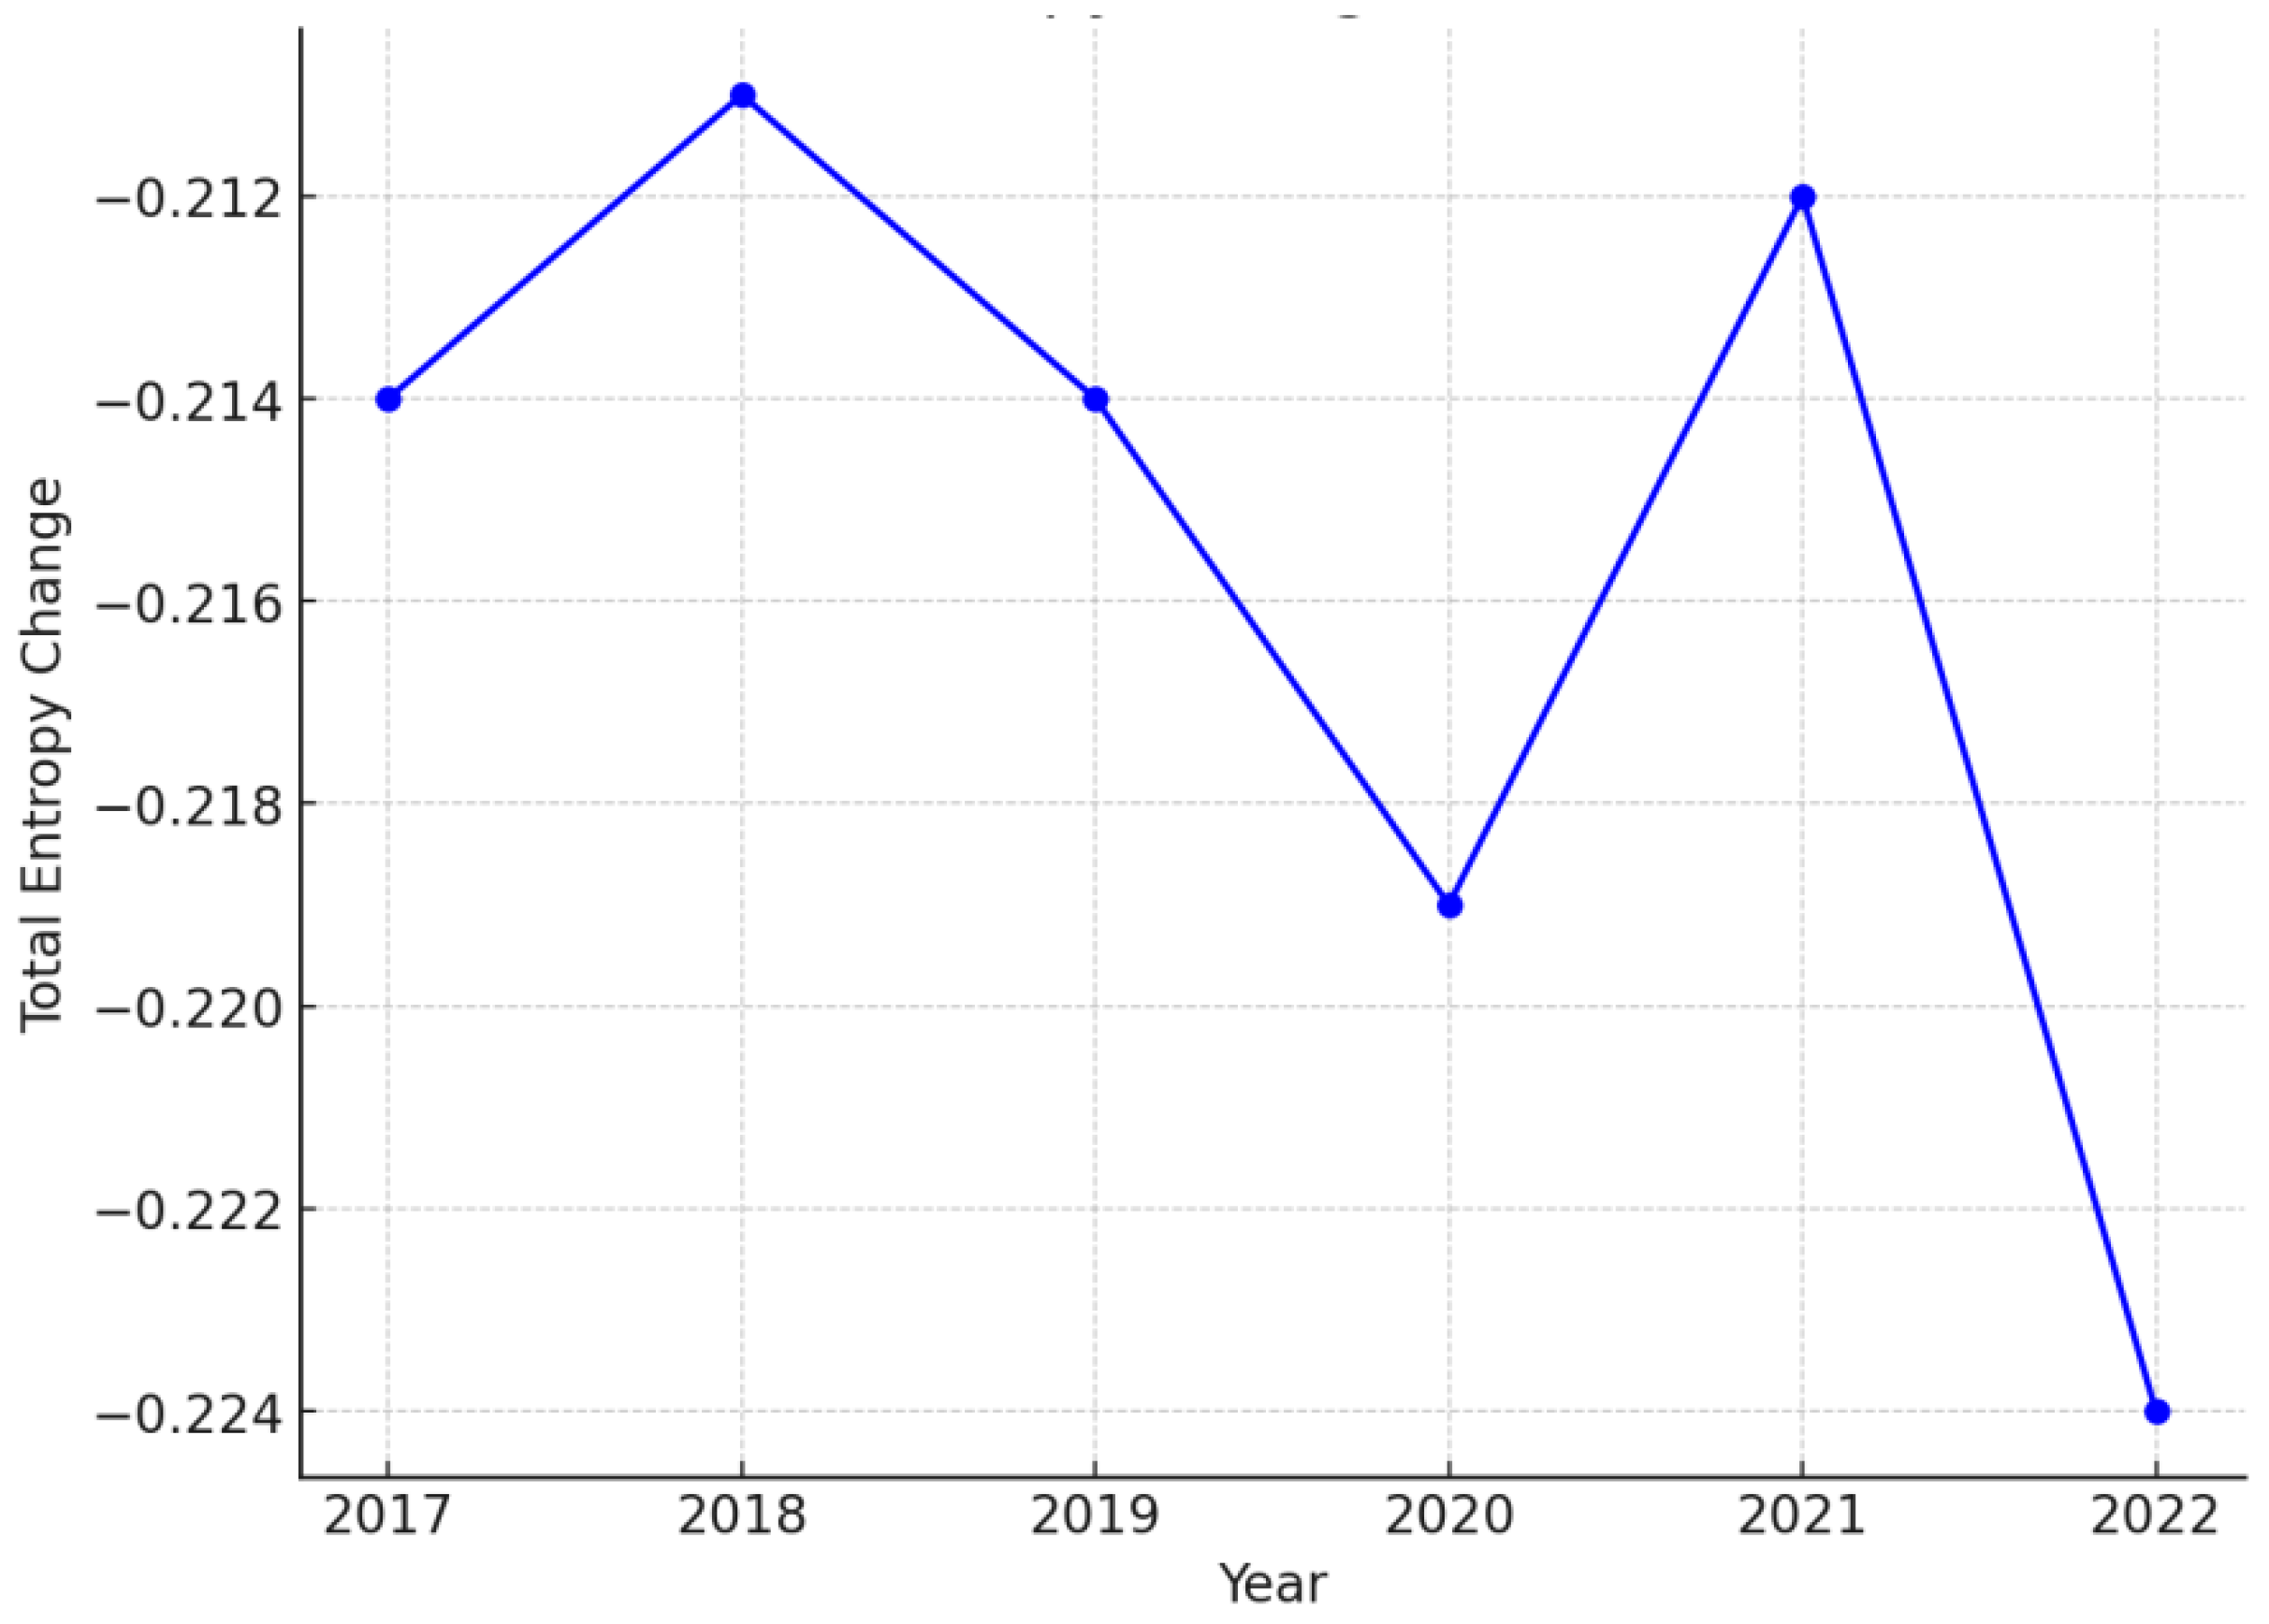
Figure 1. The Total Entropy Change from 2017 to 2022.
Preprints 120702 g001
Figure 2. Entropy Exchange between the case of Cluster Enterprises and the Environment from 2017 to 2022.
Preprints 120702 g002
Figure 3. Entropy Generation in the case of the Cluster Enterprises (2017–2022).
Preprints 120702 g003
Figure 4. Total Emergence Index of Basic Research Capabilities of Cluster Enterprises.
Preprints 120702 g004
Table 1. System Entropy Flow and Entropy Generation Index System for the Basic Research Capability of Cluster Enterprises.
Indicator Type Metric Indicator Definition Attribute
Entropy Flow
(Entropy Exchange)
Support from Other Systems R&D Subsidies Proportion of government innovation subsidies received by the enterprise to its total assets Negative
Tax Incentives Actual tax incentives enjoyed by the enterprise Negative
Foreign Investment Total amount of foreign enterprise investment in the region Negative
Regional R&D Intensity Regional R&D expenditure / GRDP Negative
Market Environment Depicts changes in the market environment based on the "China Marketization Index" by Fan Gang et al. Negative
Pressure from Other Systems Market Competition Degree Herfindahl index, sum of squares of the percentage of industry revenue generated by other companies except the company itself Positive
Corporate Debt Level Estimated corporate debt-to-asset ratio, total debt / total assets Positive
Number of Jobs Created Natural logarithm of the number of employees Positive
Entropy Generation Internal System Consumption Internal R&D Investment Proportion of R&D investment to total revenue Positive
Corporate Scale Maintenance Natural logarithm of total assets Positive
Specific Investment (Fixed assets + intangible assets) / total assets Positive
Technology Introduction Investment Proportion of expenditures on technology introduction, absorption, and digestion to sales revenue Positive
Internal System Regeneration Corporate Growth Rate (Current period revenue - previous period revenue) / previous period revenue Negative
Corporate Profitability Corporate profit margin Negative
Corporate Age Observation period year - year of establishment + 1 Negative
Knowledge Integration Ability Number of patents applied for by the enterprise in different domestic and international patent classifications (logarithm) Negative
Breakthrough Innovation Number of times domestic and international patents of the enterprise have been cited (logarithm adjusted to overcome right-skew problem) Negative
Labor Productivity Ratio of profit to total number of employees Negative
Table 2. Entropy Variation of Cluster Enterprises from 2017 to 2022.
Entropy Type 2017 2018 2019 2020 2021 2022
External System Support -0.208 -0.21 -0.21 -0.212 -0.206 -0.213
External System Pressure 0.122 0.127 0.129 0.132 0.135 0.133
Internal System Consumption 0.163 0.165 0.164 0.162 0.161 0.161
Internal System Regeneration -0.291 -0.293 -0.297 -0.301 -0.302 -0.305
Total Entropy Change -0.214 -0.211 -0.214 -0.219 -0.212 -0.224
Disclaimer/Publisher’s Note: The statements, opinions and data contained in all publications are solely those of the individual author(s) and contributor(s) and not of MDPI and/or the editor(s). MDPI and/or the editor(s) disclaim responsibility for any injury to people or property resulting from any ideas, methods, instructions or products referred to in the content.
Copyright: This open access article is published under a Creative Commons CC BY 4.0 license, which permit the free download, distribution, and reuse, provided that the author and preprint are cited in any reuse.
Prerpints.org logo

Preprints.org is a free preprint server supported by MDPI in Basel, Switzerland.

Subscribe

© 2024 MDPI (Basel, Switzerland) unless otherwise stated