1. Introduction
In neighborhoods of a city where drinking water is scarce during the dry season or due to the effect of the law of gravity in hills or high areas., It is necessary to know the water level in a cistern or in a tank to see the water level in the cistern in real time and thus optimize water consumption in the home. A problem lies in the need to open the cistern lid, visually check the water level in the tank, and corroborate the water pressure brought by the municipal water in charge of supplying and refilling the cistern. For this purpose, clearing the garage, opening and lifting the cistern lid, observing the water level, and replacing the cistern lid is necessary. When there is a shortage of drinking water, this task would have to be done daily to get out of the uncertainty of the water level at a specific time. As mentioned, this task should be carried out sometimes every three or four days; otherwise, if the water level needs to be checked, there is a risk of running out of water because of ignorance of this information. Several households that do not know the status of their cistern and do not make good use of this resource are left without drinking water.
Given the problems described above and using the typical water tanks and cisterns used in our city and country, we propose knowing the water level in a tank in real time without looking at it. This monitoring can be observed through an Internet interface (Node-RED dashboard). It also intends to know the water pressure to calculate the tank’s time to refill. The quality of the drinking water, e.g., whether it is too cloudy or contains mud, rust, or other residues, can be monitored.
To achieve the above, we propose publishing four measurements on the Internet to be sensed from a drinking water cistern, thereby avoiding visually checking these variables. As we mentioned, we propose to measure the following: 1. Water level in the cistern, 2. Water level in the water tank, 3. Water flow or tap water pressure in the area, and 4. Water Quality comes from the public drinking water pipeline. A water tank will be filled when the water level is below 50% of its capacity. A submersible pump with a hose will bring water from the cistern to the tank.
This paper is structured as follows:
Section 2 reviews many solutions for automatic water level monitoring systems and similar projects.
Section 3 describes our real-time Monitoring of Water Architecture, describes a water tank and cistern system, and includes the cistern and tank electronic circuit diagrams.
Section 4 describes specific details of experimental results. Finally,
Section 5 mentions the conclusions of this study.
2. Related Work
Internet of Things (IoT) technologies have enabled significant advancements in water monitoring and control systems, addressing critical issues such as water scarcity, waste, and contamination. Below is a brief and short review highlighting different approaches and technologies used in this field.
Automatic Water Level Monitoring Systems
Several studies have proposed systems to automatically monitor and control tank water levels using ultrasonic sensors and microcontrollers. For example, Jan et al. developed an IoT-based system to monitor water levels, detect leaks, and control motors in smart tanks, improving water use efficiency and reducing waste [
1]. Malche and Maheshwary presented a water level monitoring system for smart villages in India, utilizing an IoT-based architecture that includes sensors connected to a network for real-time monitoring [
2]. Another approach is presented by Durga et al., who propose an autonomous water tank filling system using embedded sensors and GSM modules to improve water distribution efficiency [
3]. Ali and Choi reviewed the existing methods for monitoring leakage in underground pipelines, the sinkholes caused by these leakages, and the viability of wireless sensor networking for monitoring leakages and sinkholes [
4]. Kurniawan et al [
5] proposed a system for knowing the water level in real-time using an ultrasonic sensor to transmit data to a microcontroller (Wemos) in the form of height data, the Wemos converts water level data into the volume of water in the tank. Jayalakshmi in his work proposes a monitoring and control system for water utilities to address the current water wastage problem, he utilizes IoT and Android applications. This system aims to enhance real-time data collection, analysis, and remote management, empowering water utilities to optimize resource usage and mitigate environmental impact [
6]. Singh et al. designed a water level monitoring system using an HC-SR04 Ultrasonic Sensor, which enables the water level in the water tank to be monitored and controlled. The system is designed to help residents monitor the tank’s water level and turbidity to reduce water wastage [
7]. Zhukovskyy et al. designed a system that is expanding the capabilities of the existing water-monitoring business with an improved web-based information system. IoT devices may send the data through several possible channels: satellite, cellular, or internet networks [
8].
Energy Consumption Optimization in Water Systems
Energy efficiency is another key research area in developing IoT-based water systems. Cheng et al. introduced an IoT-enabled water dispenser system that optimizes energy consumption by adjusting configurable parameters such as sterilization time and sleep mode duration, achieving significant energy savings during low-use periods [
9]. Additionally, Gunde et al. proposed a Raspberry Pi-based system that controls water flow to minimize energy consumption and waste on university campuses [
10]. Monsef et al. proposed an optimization code to estimate the instantaneous water demand based on the reported network pressures. According to the estimated instantaneous water demand, another optimization code is presented based on the DE algorithm to control the installed pressure-reducing valve and the variable speed pump [
11].
Water Quality Monitoring
Water quality is a critical concern in many regions around the world. Yauri et al. implemented an IoT-based water quality monitoring system in the Peruvian Amazon, using sensor nodes to monitor parameters such as pH, conductivity, and temperature, helping to prevent contamination issues and improve the health of aquatic ecosystems [
12]. Cheng et al. also highlight IoT modules in water dispensers to monitor water quality and adjust system parameters to optimize water and energy consumption [
9]. Jan et al. presented a survey summarizing the current state of the art regarding IoT-based smart water quality monitoring systems (IoT-WQMS) specially dedicated to domestic applications. They probed into common water-quality monitoring parameters, their safe limits for drinking water, related smart sensors, critical review, and ratification of contemporary IoT-WQMS via a proposed empirical metric [
13].
Wireless Sensor Networks for Water Monitoring
Wireless Sensor Networks (WSNs) have been extensively investigated for water monitoring applications. Pujar et al. reviewed different WSN-based water monitoring systems, addressing specific water threats such as physical, biological, and chemical pollution. The study identifies research gaps, such as improving energy efficiency and underwater communication, that need to be addressed to enhance these monitoring systems [
14]. Lambrou et al. present a low-cost and holistic approach to the water quality monitoring problem for drinking water distribution systems and consumer sites. The sensor node comprises several in-pipe electrochemical and optical sensors, emphasizing low cost, lightweight implementation, and reliable long-time operation [
15].
IoT Solutions for Rural and Urban Environments
In addition to industrial and rural applications, some studies have focused on urban applications. Cheng et al. present a solution that employs commercial water dispenser modules and clamp meters to collect consumption data and automatically adjust system parameters in urban environments such as universities [
9]. Irianto et al. propose a water consumption monitoring system for residential tanks using IoT technology, which measures household water consumption and sends the data to a cloud server for real-time analysis [
16]. Zhukovskyy et al. proposed a solution for a remote water management device for agriculture. A Tank Toad automates the task of data collection and remote control, reducing workload and drive time. Livestock producers must check water storage levels and operate pumps to effectively care for livestock [
17].
As we have seen in this brief literature review, there are many solutions for water management, with or without IoT. Works include automatic water level monitoring systems, energy consumption optimization in water systems, water quality monitoring, wireless sensor networks for water monitoring, and IoT solutions for rural and urban environments.
3. Real-Time Monitoring of Water Architecture
3.1. Brief System Description
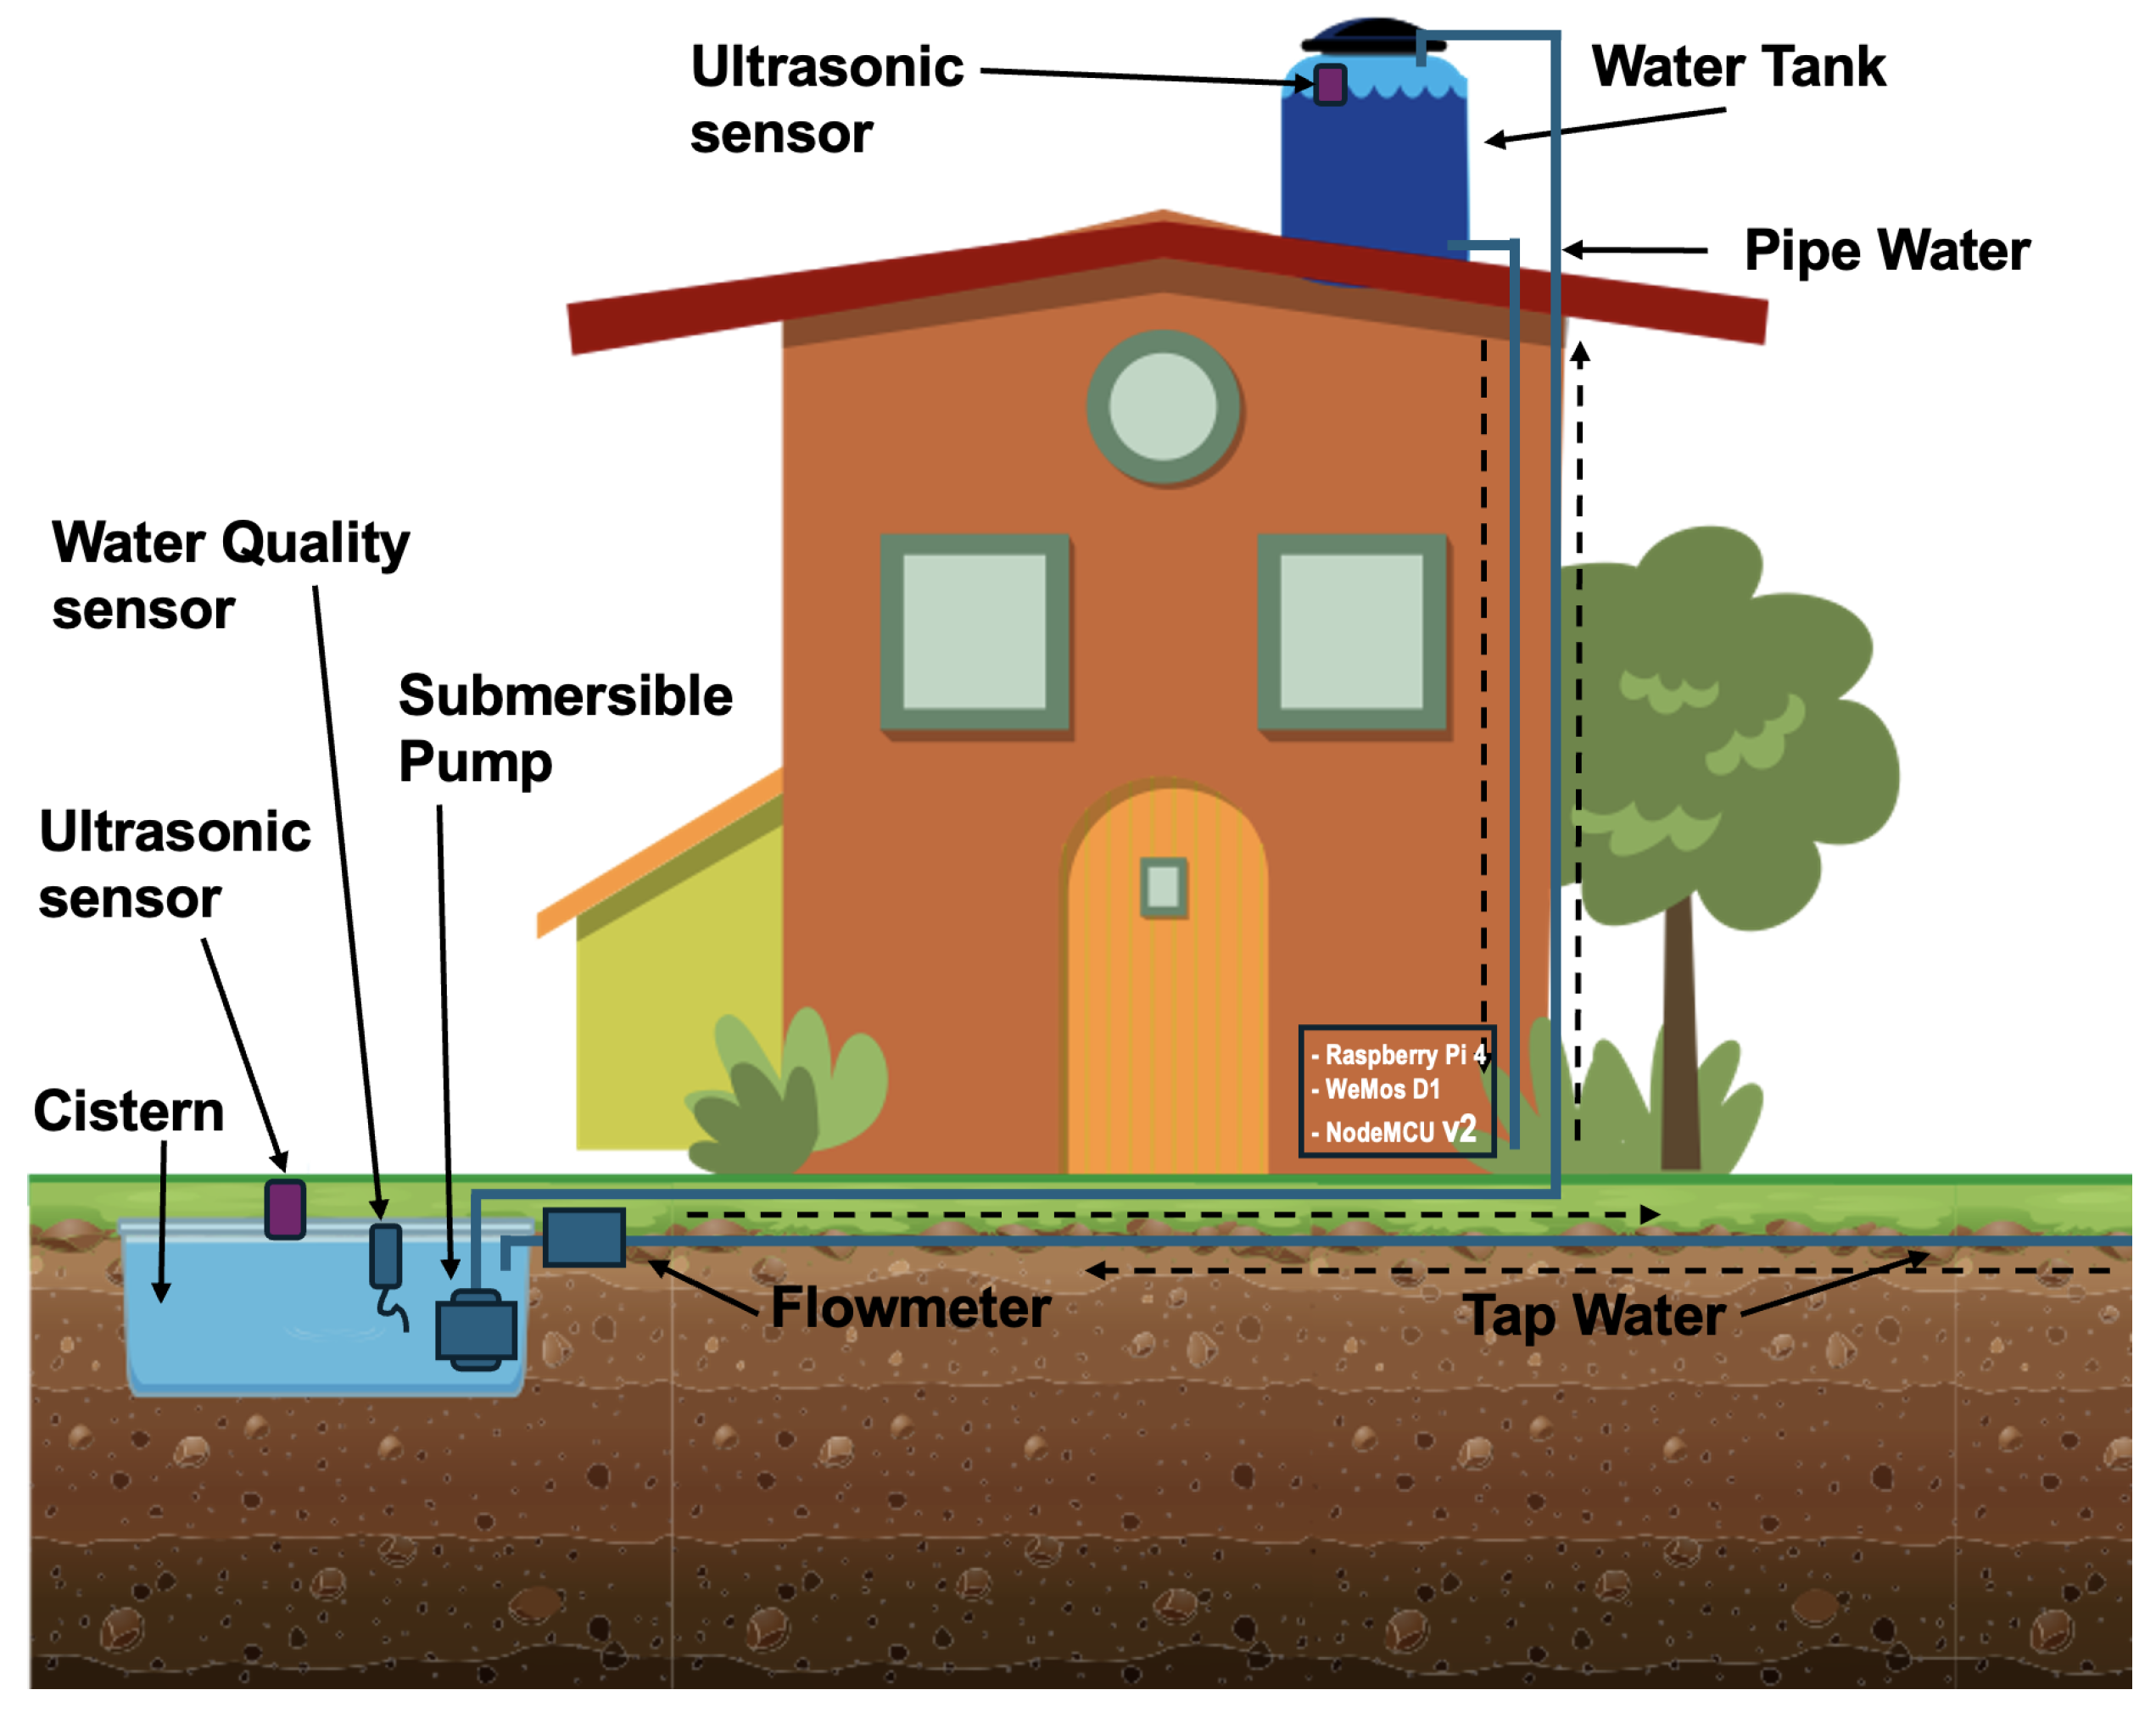
Traditionally, house water is stored aboveground (in water tanks) or underground (in cisterns). A house has a water tank on the roof, which stores water that flows down by gravity when a faucet is opened in the kitchen, bathrooms, toilet, shower, garden, etc. A cistern is usually located underground at the front of the house. The cistern is supplied with drinking water by pipes installed throughout the city. The water stored in the cistern is pumped to the water tank by a water pump. The water pump operates automatically by floating inside the tank. When the float drops, a switch is turned on that activates the water pump. The pump begins to raise water into the water tank and stops when the float rises to its maximum level.
Usually, there can be several states concerning the water level in a water tank and a cistern. We illustrate in
Figure 1 three possible scenarios: (a) Half-full cistern level and half-full water tank level, (b) Half-full cistern level and almost empty water tank level, and (c) Full cistern level and whole water tank level. In the same way, the water pipe that arrives at the cistern, the tap water pipe (municipal) that comes out of the cistern and goes up to the water tank, and the water line that comes down from the water tank and enters the house for domestic consumption can be seen.
After describing the traditional usage of water tanks, cisterns, and water pumps, we propose to monitor the drinking water level of a cistern in real time and publish its status on the Internet. Also, measure and publish on the Internet the cistern’s water level to decide on time how to save water to the maximum; measure and publish on the Internet the water pressure of the pipe that supplies liquid to the cistern; measure and publish the water quality provided by the municipal drinking water on the Internet; measure the water quality to determine whether the tap water brings in a lot of waste or other materials; provide information to make appropriate decisions regarding the sensed variables (water level, water flow, and water quality); and, save drinking water as much as possible.
In
Figure 2 are placed all the sensors, actuators, micro-controllers, etc., used in the real-time monitoring of water level in cistern and tank systems.
3.2. Devices
The devices described in
Table 1 were used to carry out the proposal; we used open-source tools. All of them were required for this project. Also, some programming code was used to connect all the devices.
3.3. Components
Below are photographs of some of the main devices used in the proposed system.
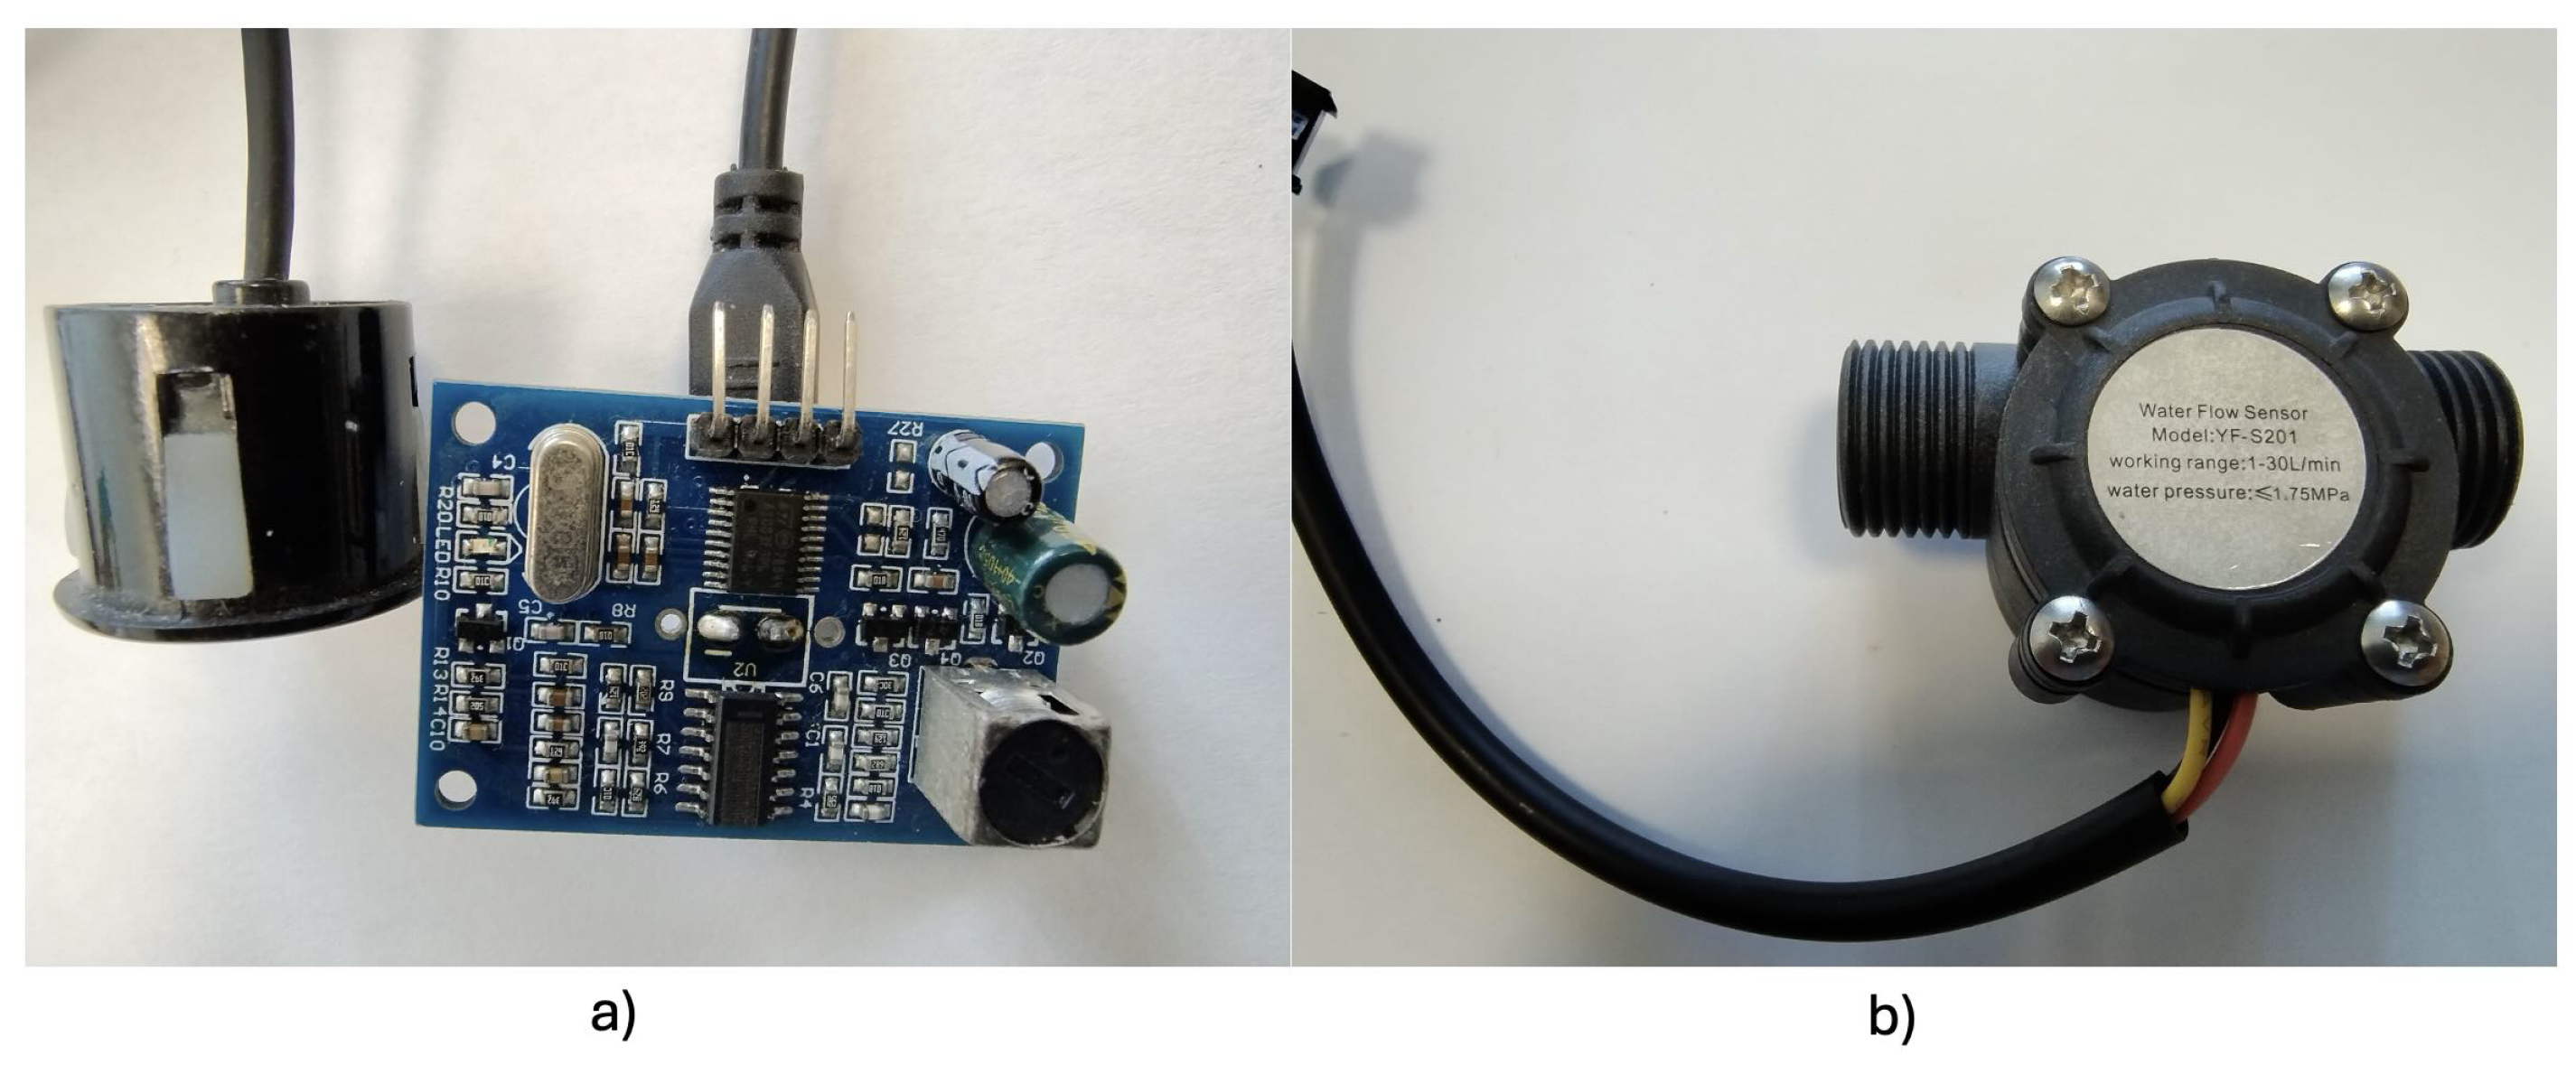
Ultrasonic sensor: This sensor emits ultrasonic waves and changes state for the reception of these in the time it takes between going and returning these waves is obtained from a distance between the sensor and some object, in our case, the water surface. We use two sensors to measure the water level in both the cistern and the tank. See
Figure 3 a). Flow meter: The sensor measures the water flow from the tap water into the cistern. See
Figure 3 b).
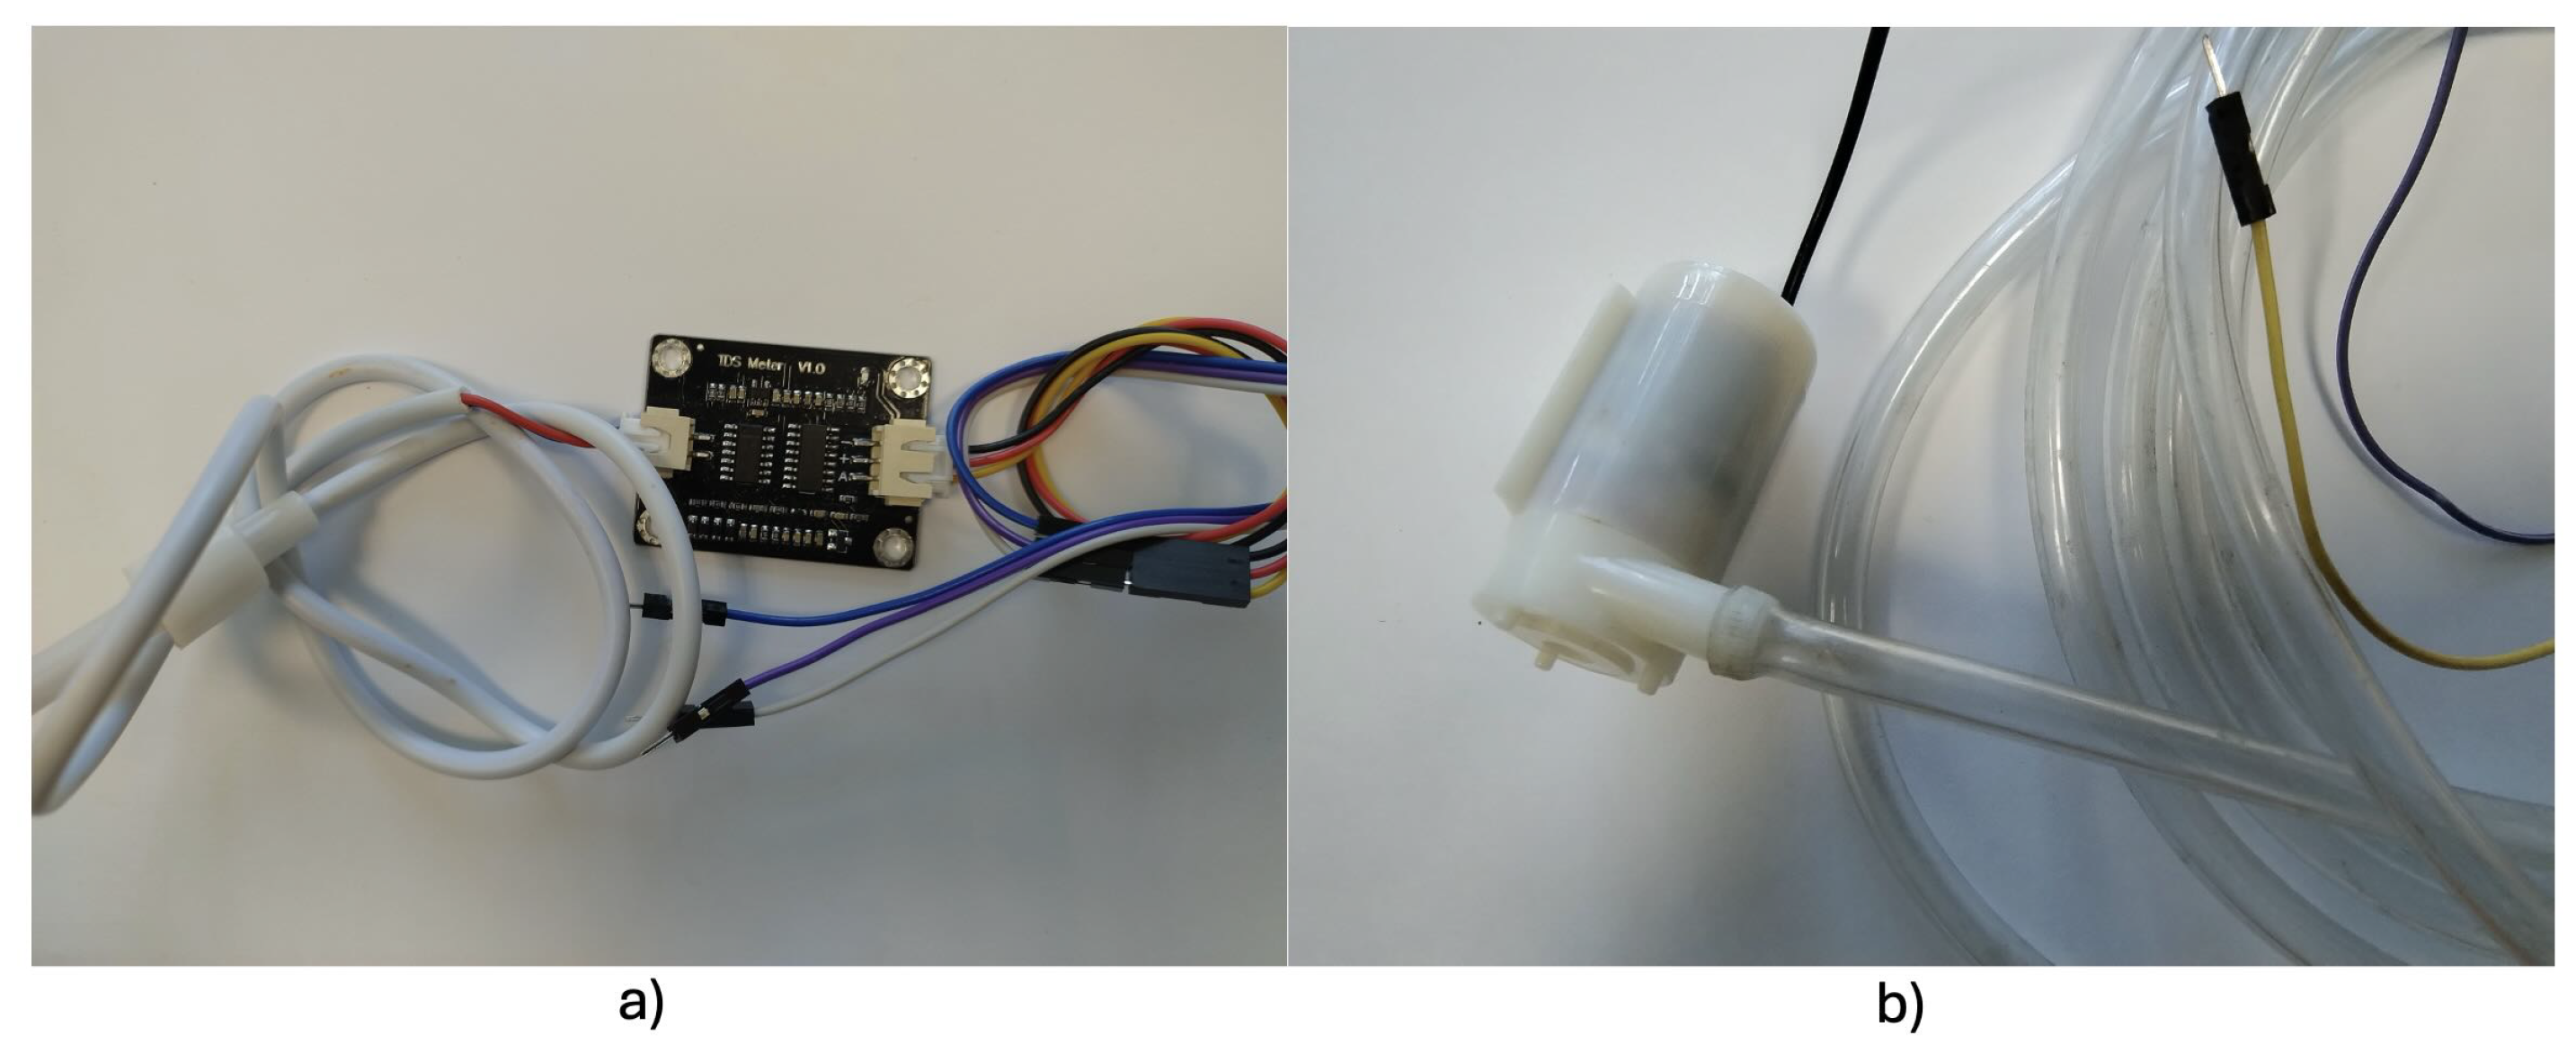
Water Quality Sensor: It is used to determine how many particles of solids per million (ppm); it can detect the amount of particles dispersed in the water. See
Figure 4 a). Submersible pump: It is used to raise water to the tank when the tank reaches 50% or less of its level, then the pump is activated and begins to suck water from the cistern; the pump stops when the tank is full (100%). See
Figure 4 b).
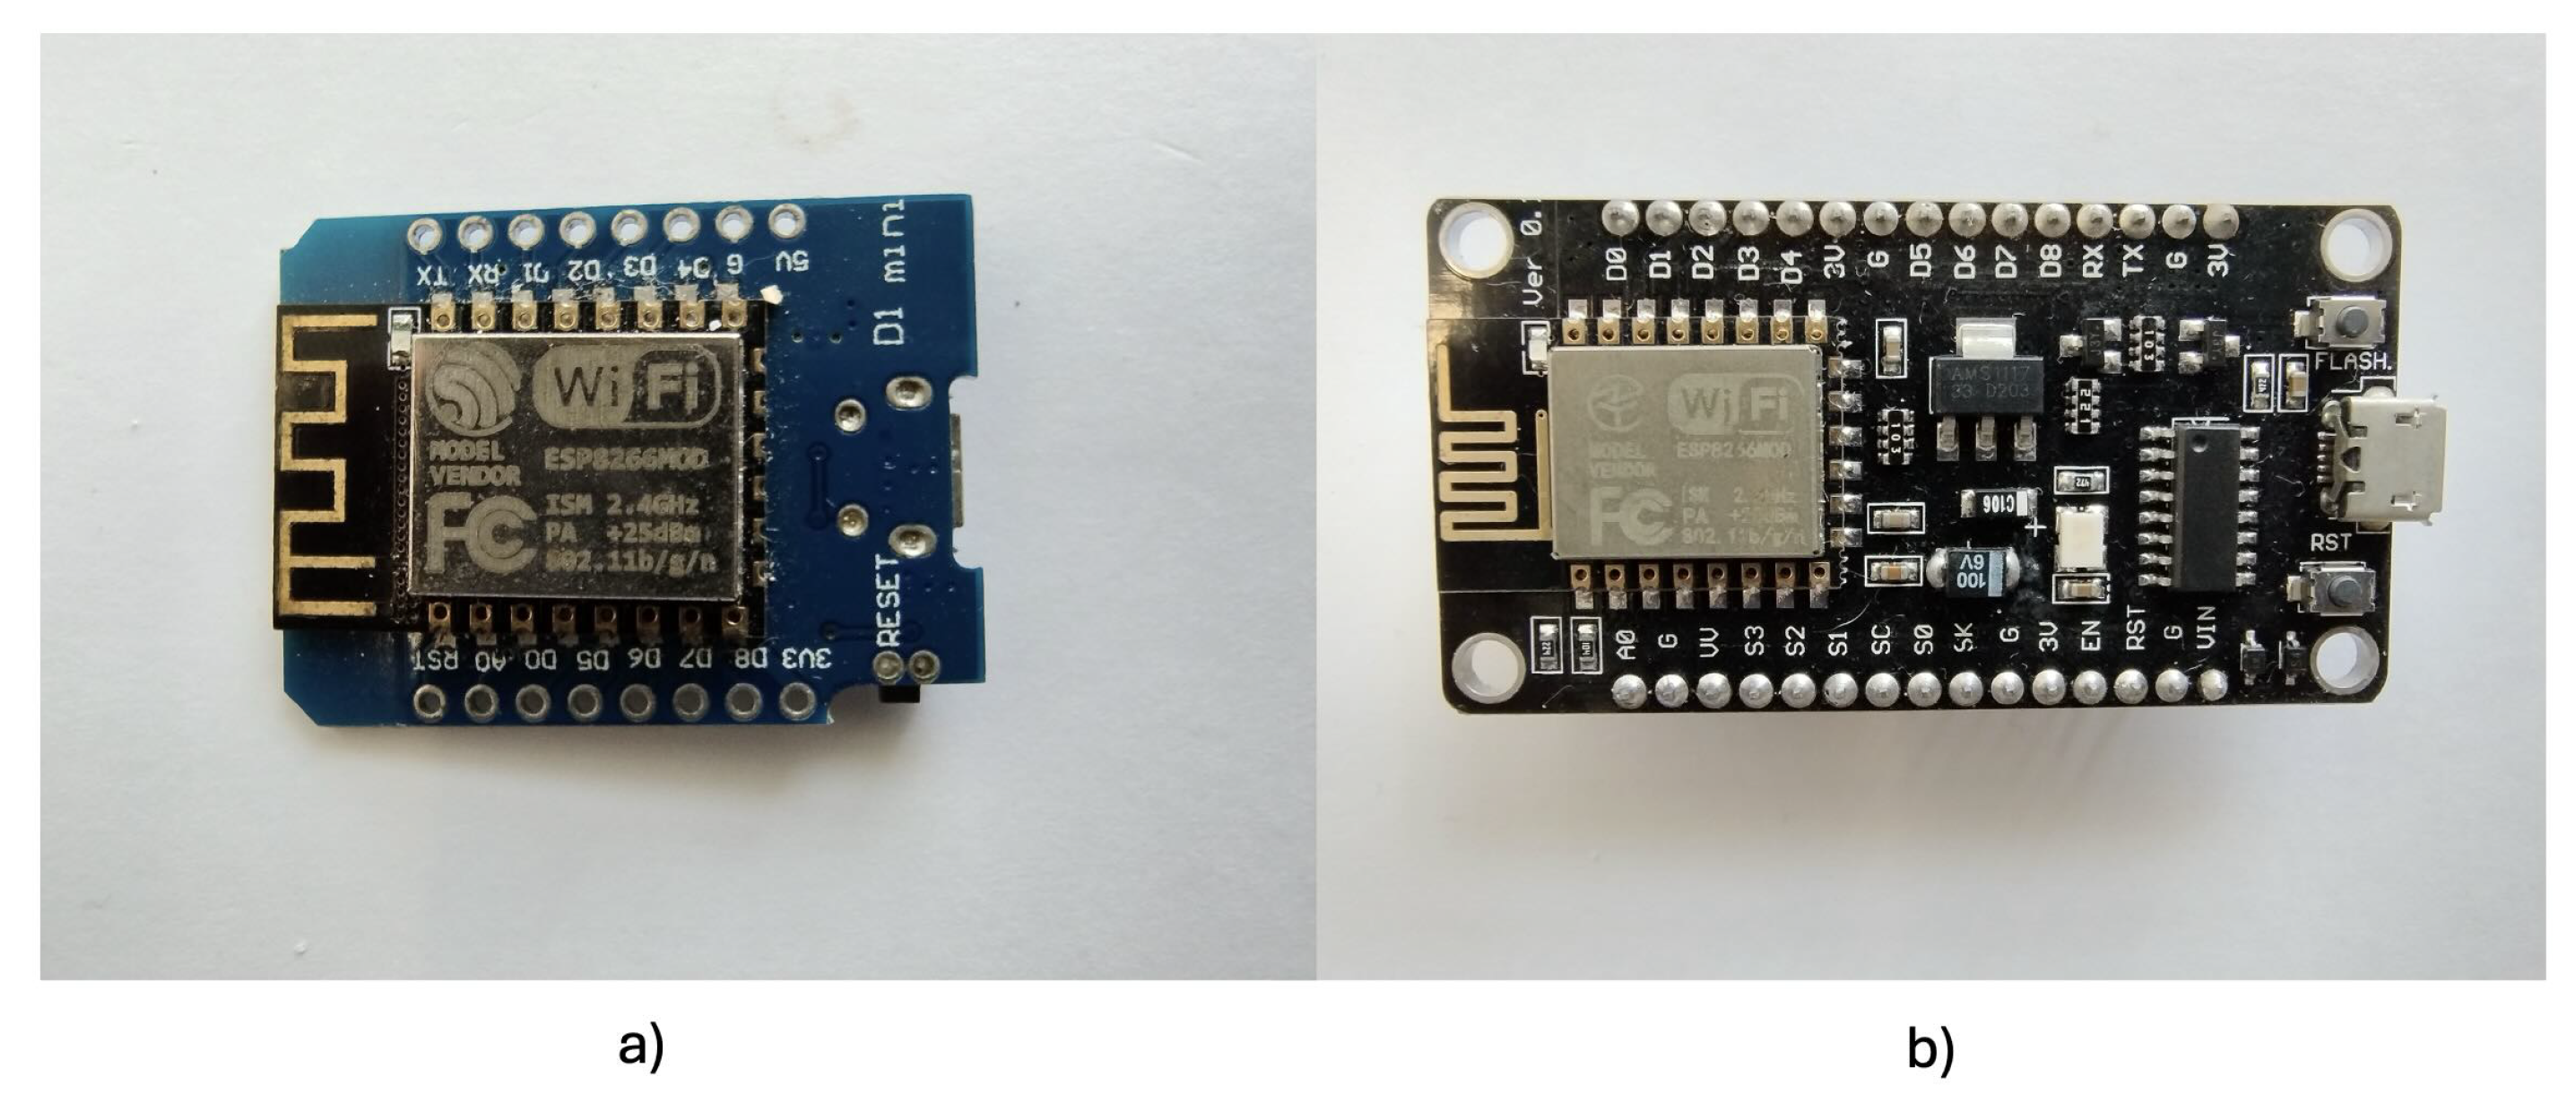
WeMos D1 mini ESP8266 WiFi is a microcontroller configuring the sensor node with the ultrasonic waterproof sensor using the Arduino programming environment. See
Figure 5 a). NodeMCU v2 ESP8266 WiFi is an open-source software and hardware development environment built around an inexpensive system-on-a-chip (SoC) called ESP8266. See
Figure 5 b).
Raspberry Pi 4: The single board computer is used to configure it as an MQTT
1 broker for the database and display the dashboard showing the data obtained from the sensors. See
Figure 6 a). Relay Module: An actuator switches on/off the submersible water pump. See
Figure 6 b).
3.4. Water Tank and Cistern System Description
We cannot control the water that enters a cistern. However, we can monitor and control the water that leaves the cistern and rises to the tank.
For this reason, we propose designing an experimental system or physical scale model to reproduce two water tanks (cistern and water tank) and an Internet interface that publishes the states or levels measured by these sensors placed inside each water tank.
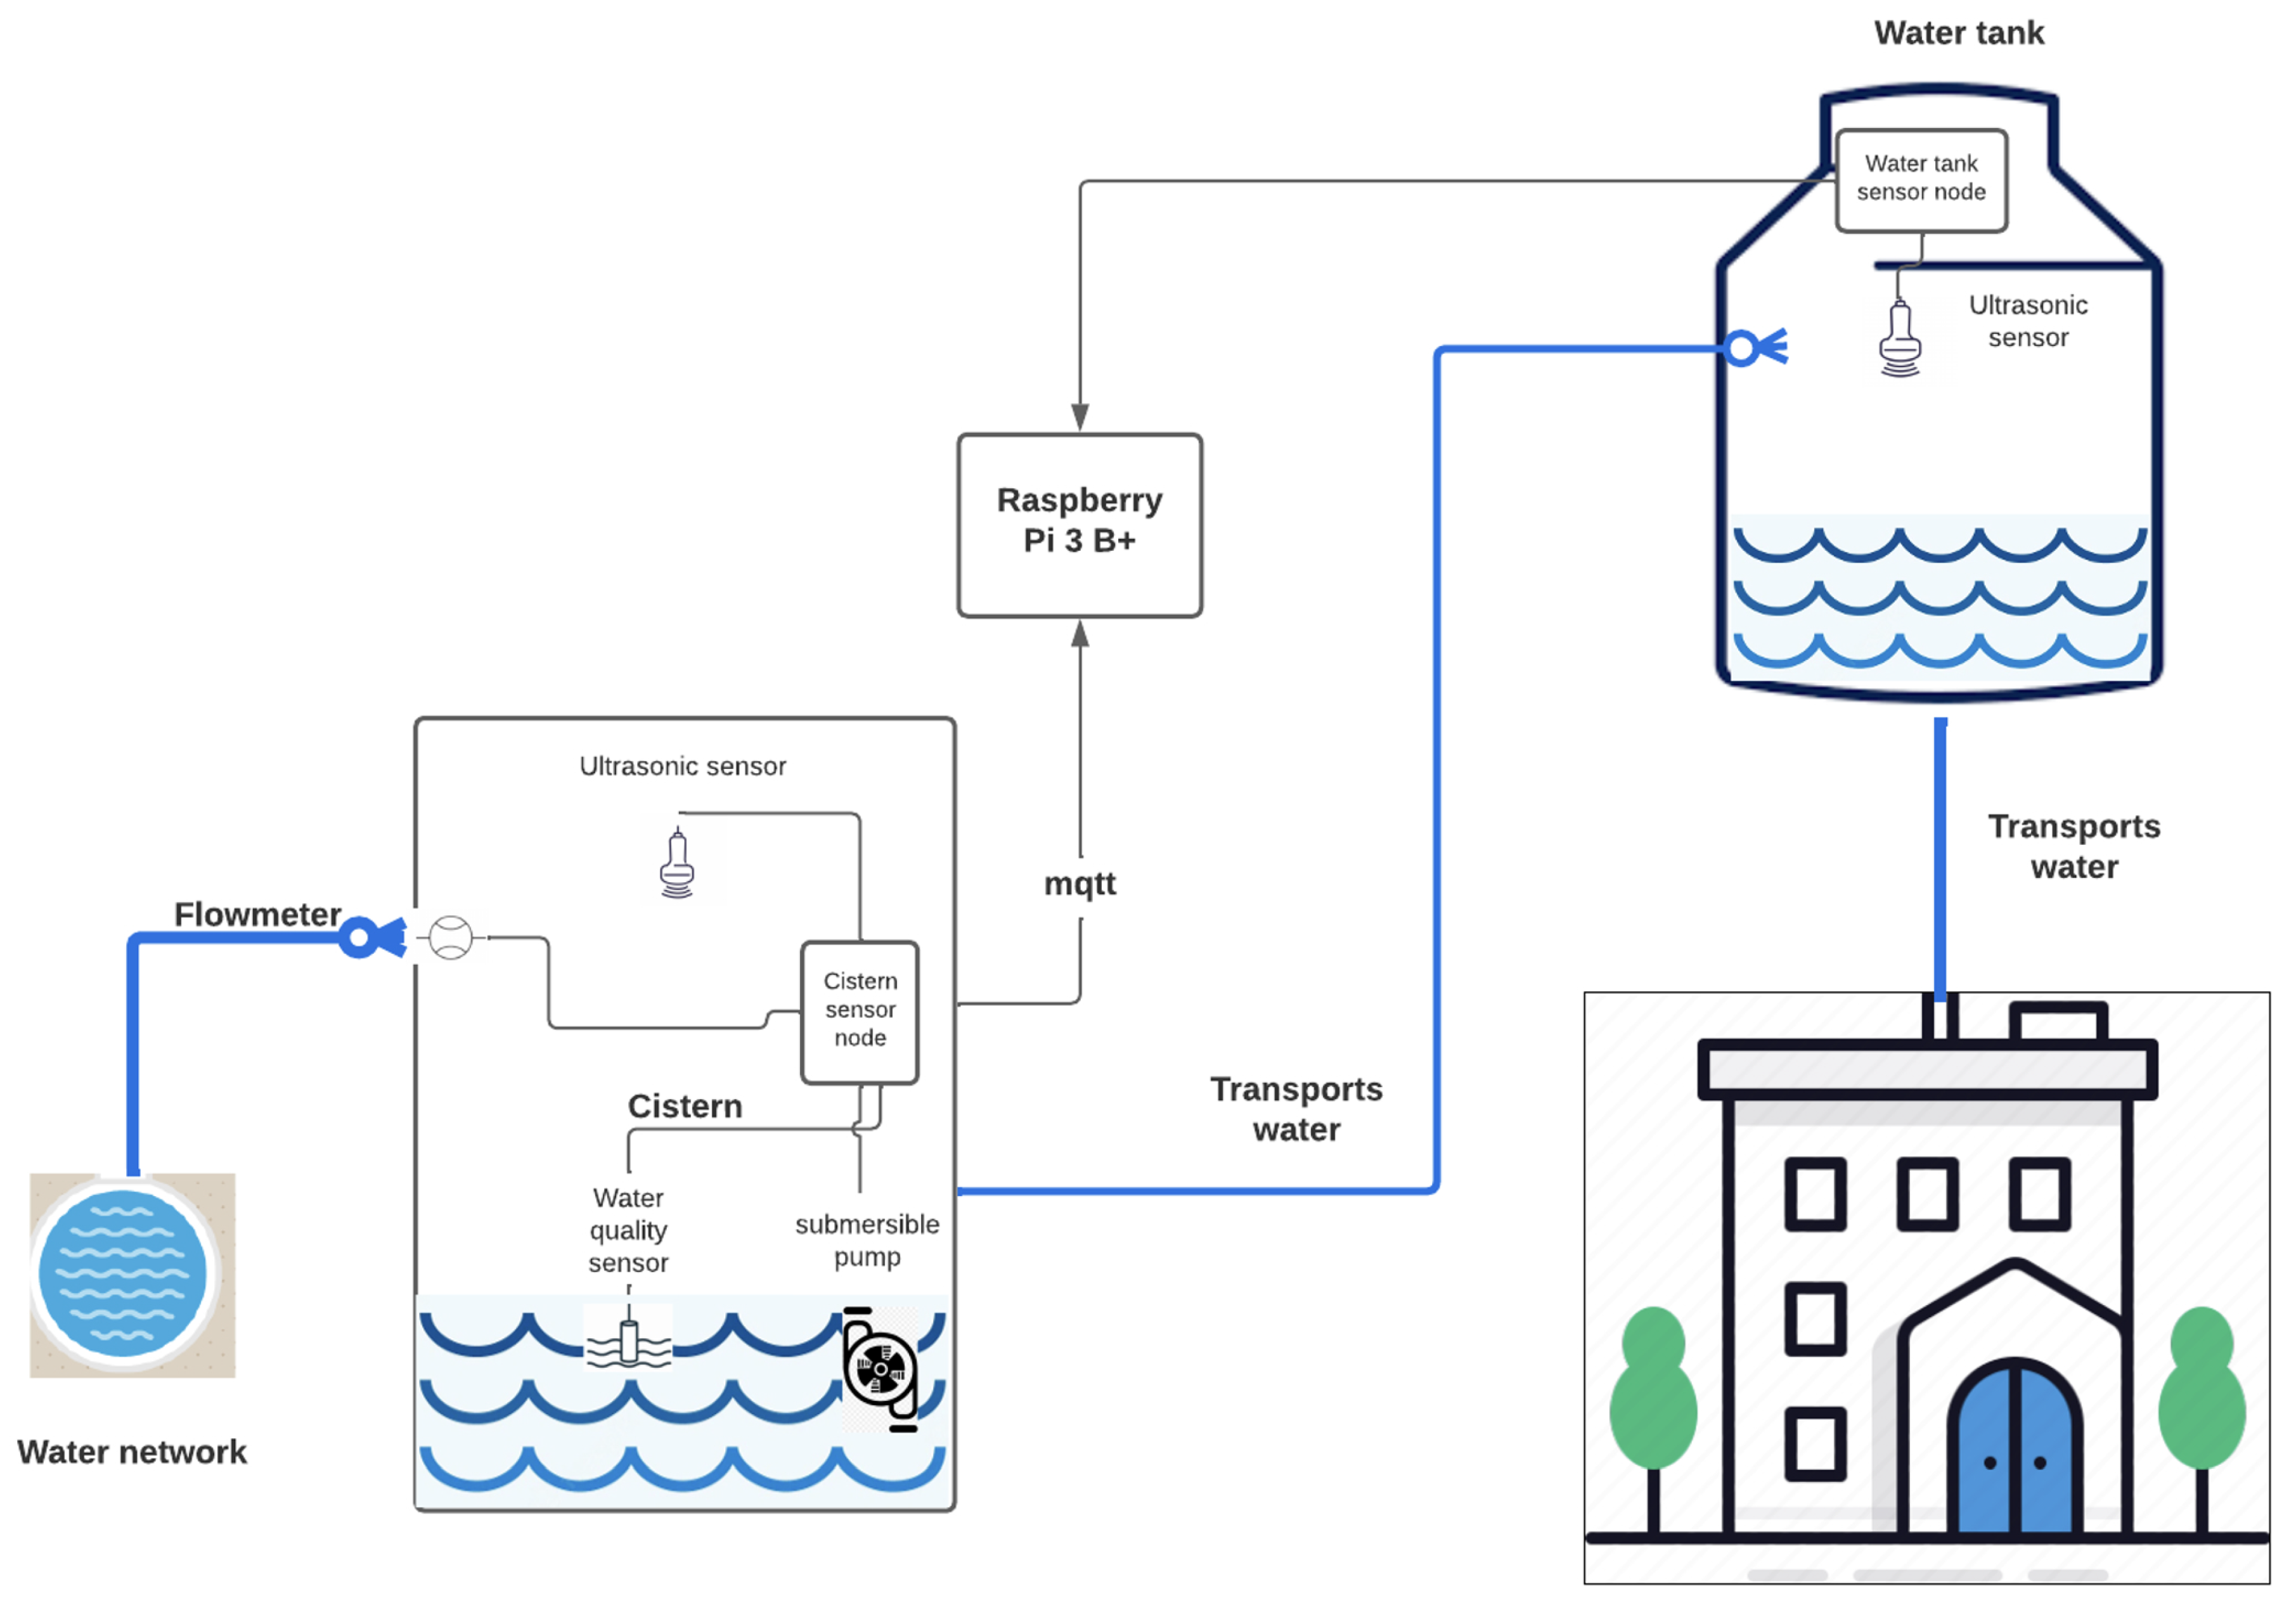
Figure 7 includes the complete elements that integrate the proposal, including cistern, water tank, flow meter, water quality sensor, and others.
We are looking at the project from three points:
Measure and publish the cistern and water tank’s water level on the Internet in real-time; with this data, we can promptly know if we should save water to the maximum and use the washing machine and other services.
Measure and publish the flow or pressure of the pipe that fills the cistern on the Internet and calculate the cistern’s filling time.
Measure and publish the water quality supplied by the piped water on the Internet. With this data, chlorination of the water is possible.
The ultrasonic sensor on top of the cistern measures the height between the sensor and the water. The water level is calculated from this; the smaller the distance between the sensor and the water, the greater the quantity or volume of water contained in the cistern.
Inside the cistern is a sensor that measures the water quality and a submersible water pump, which raises the tank’s water level when the water level sensor sends the message that the water level is below 50%.
At the inlet of the cistern, there is a sensor that measures the water pressure (flow meter). This sensor indicates to the system the force with which the water arrives at the cistern from the running water. This data is essential since it means the water flow rate. The greater the jet, the greater the hope of filling the tank in less time.
In the same way as the cistern, an ultrasonic sensor is used for the water tank. This sensor is placed above the tank. It measures the distance between the sensor and the water and is used to calculate the volume of water, so the smaller the distance between the sensor and the water, the greater the amount or volume of water in the tank.
3.5. Design of Sensors Monitoring Cistern and Water Tank - Electronic Circuit Diagrams
This section describes the electronic circuit diagram proposed, which consists of two sensor nodes:
Cistern Sensor Node
Tank Sensor Node
These nodes communicate with a single-board computer (Raspberry Pi 4) through the MQTT protocol and the home internet network configuration.
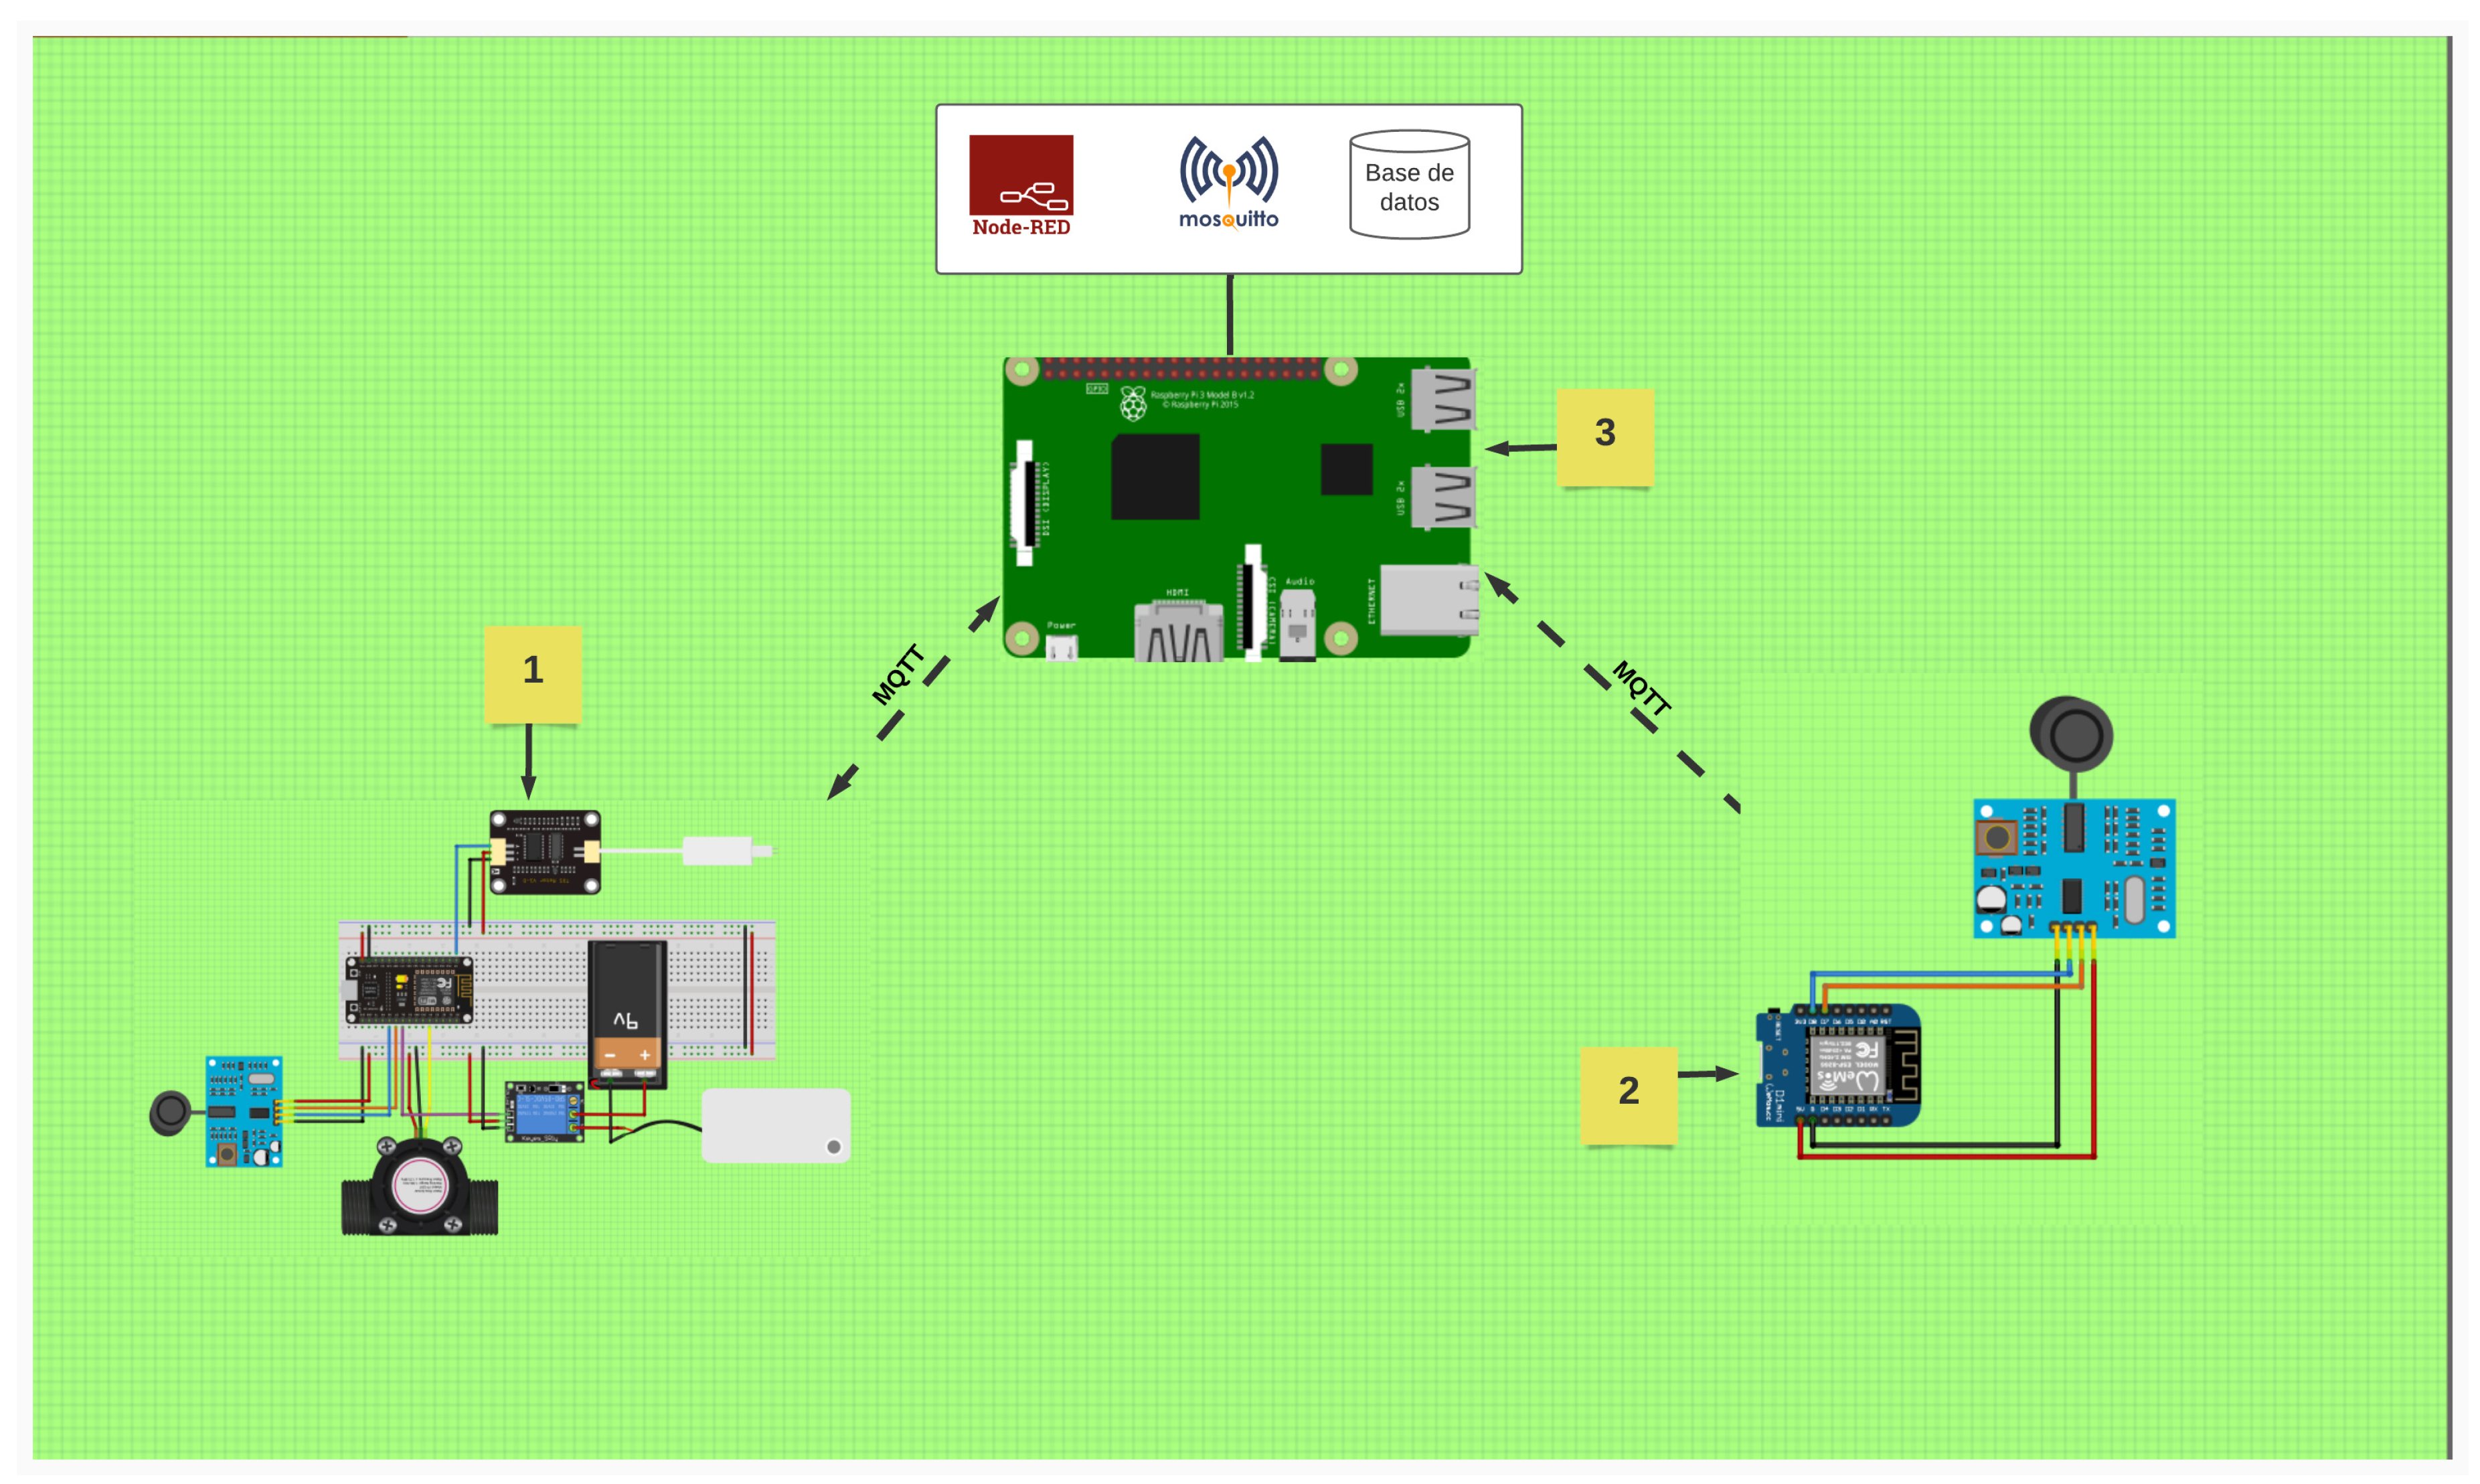
Figure 8 describes the complete architecture of the project: Real-time Monitoring of Water Tank and Cistern using IoT. In
Figure 8, numerical labels were placed to identify each sub-circuit and are described as follows:
Cistern Sensor Node: this diagram shows that communication via MQTT is bidirectional since this node publishes and subscribes to the corresponding topics.
Tank Sensor Node: this diagram shows that the communication through MQTT is unidirectional because this node publishes in the corresponding topic.
Raspberry Pi 4: this single board computer was configured to implement it as an MQTT broker using mosquitto; it was also programmed using Node-RED, where the topics were configured to receive and send data through MQTT, a dashboard was configured to display the data, Similarly, using Node-RED, a dashboard was programmed to display the time of use of the raspberry pi 4, the amount of available memory, and finally a database was configured to show the data transmitted in real-time with the option to download the data in a tabular file format to be viewed in a spreadsheet.
3.5.1. Cistern Sensor Node Electronic Circuit Diagram
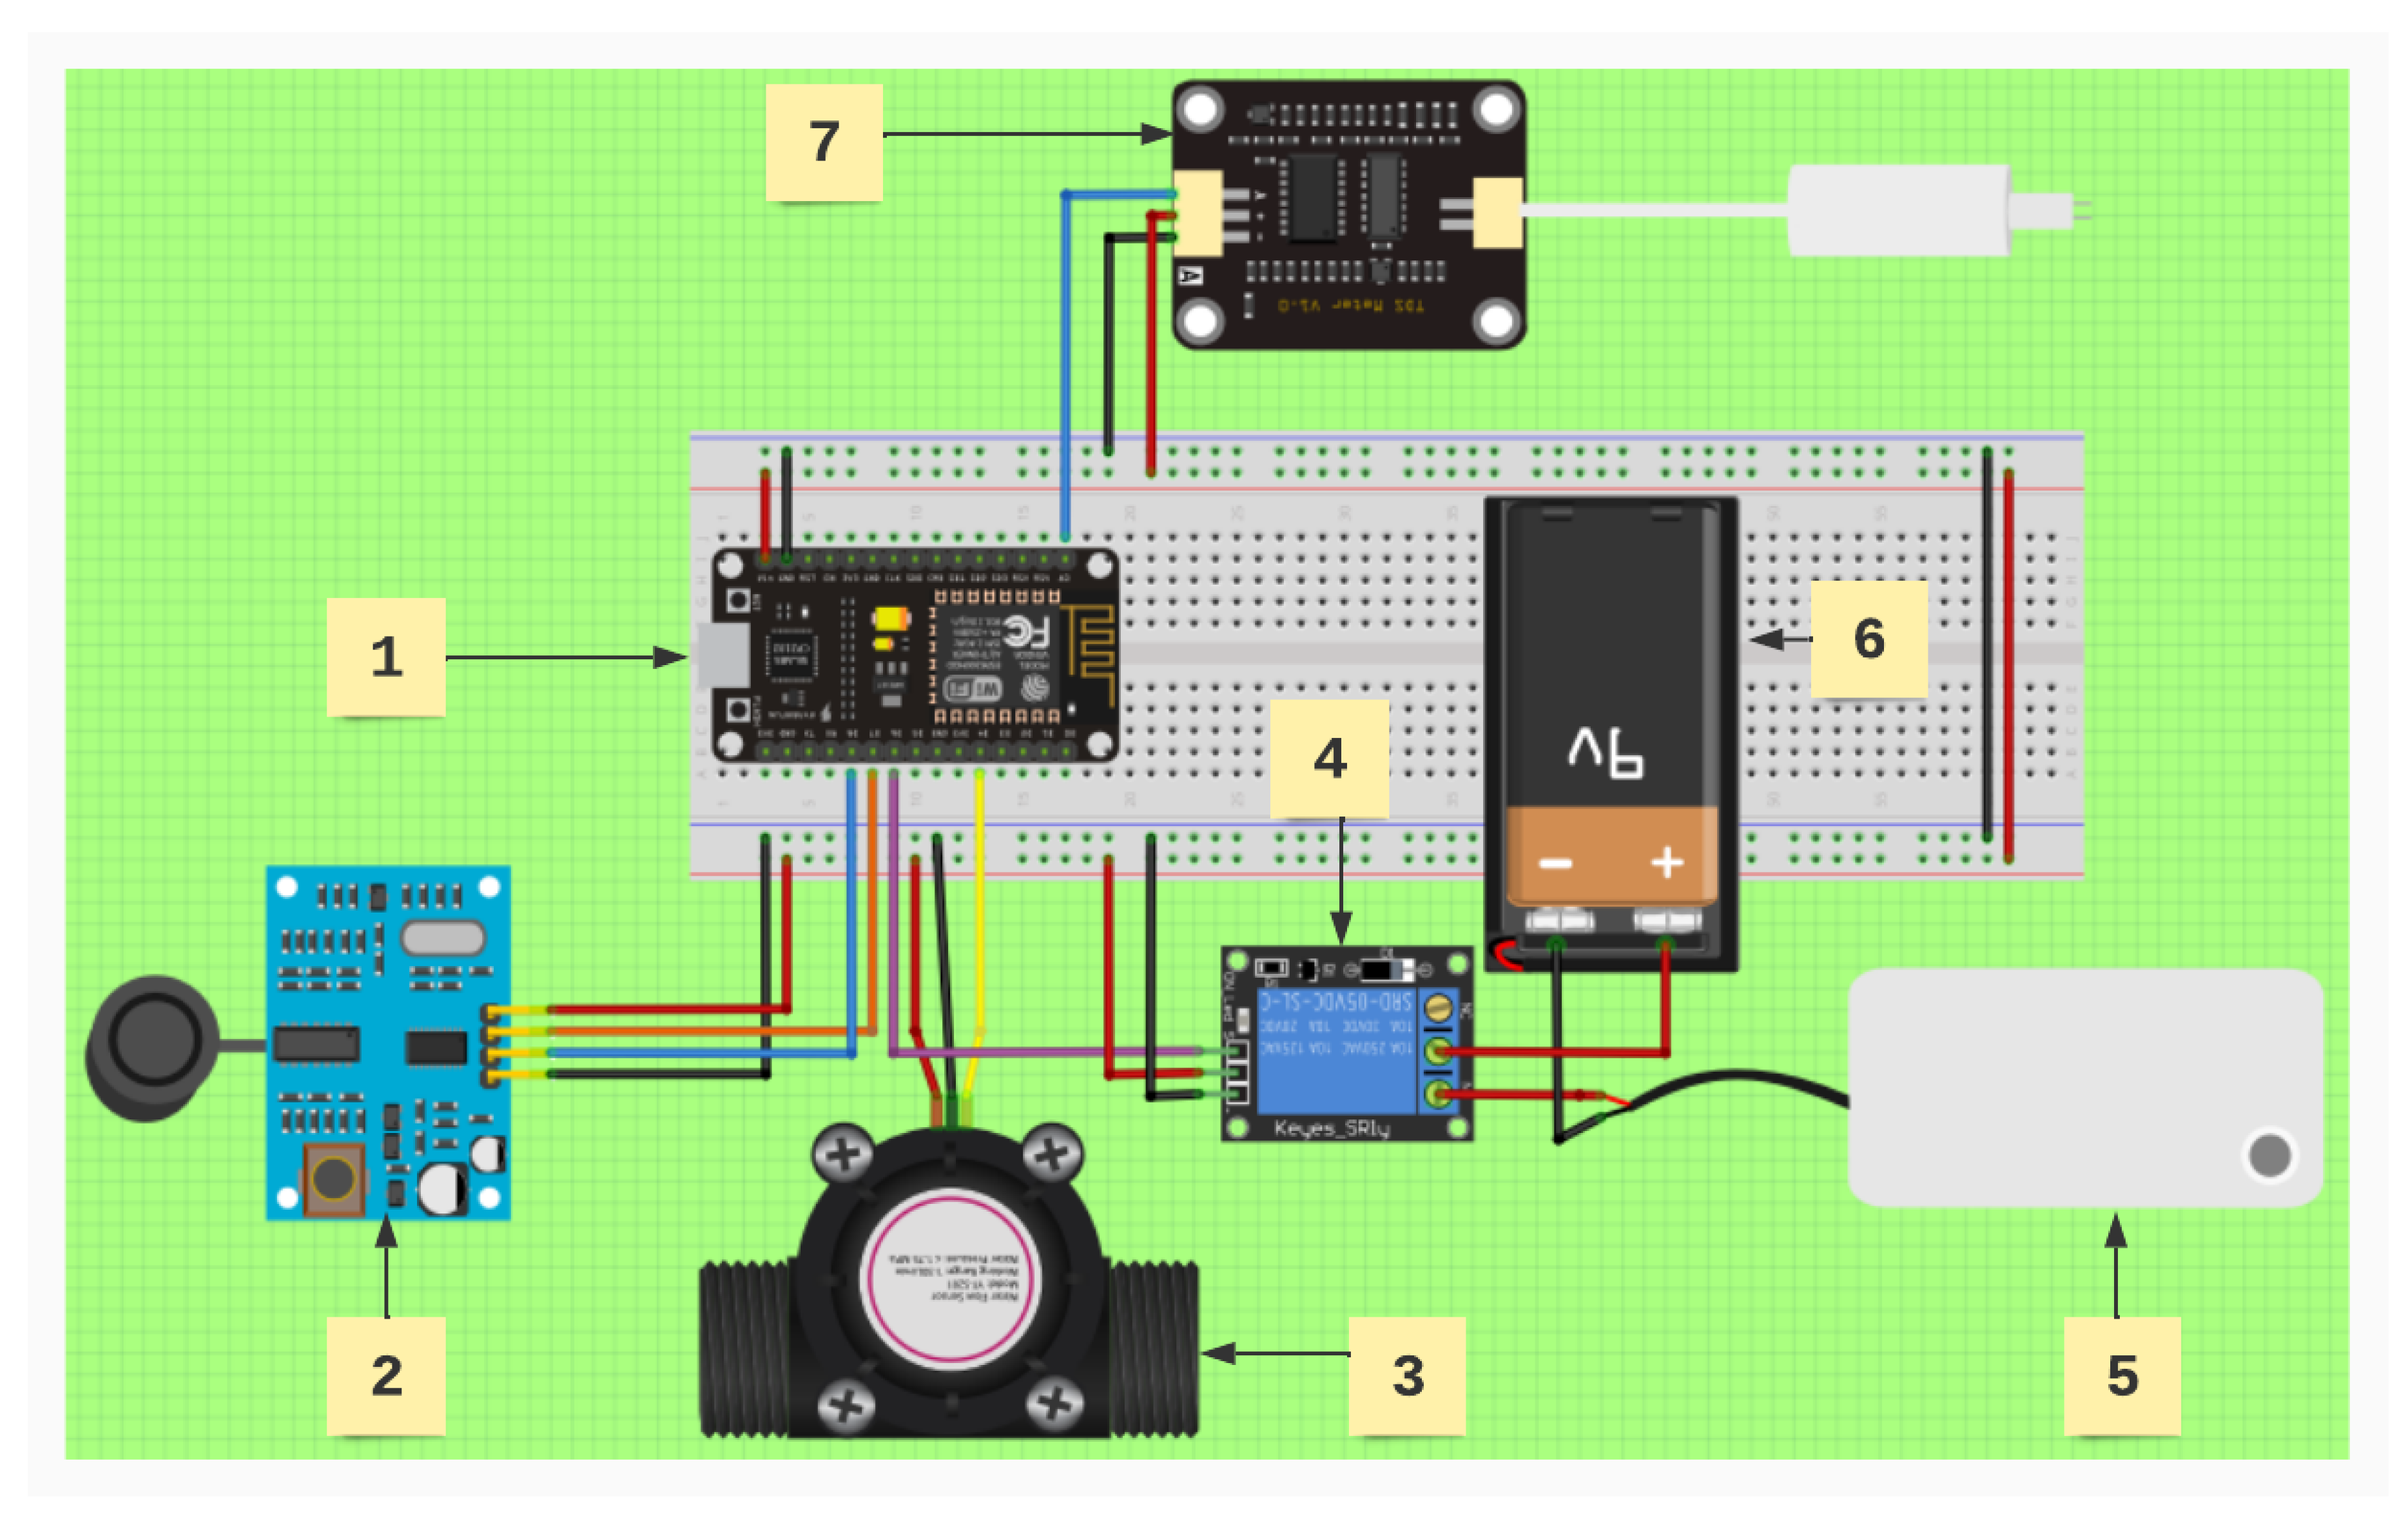
The following diagram (
Figure 9) shows graphically the connections to operate the cistern sensor node. In this diagram, each component is indicated by a numerical label as an identifier.
Micro-controller
2 NodeMCU V1.0: It is responsible for controlling each of the components of the architecture of the cistern sensor node; this control is done through the input and output pins; these pins were configured in the programming that was implemented in the Arduino IDE in programming each pin was established depending on the component to configure, the communication protocols and the network was established by which the data is transmitted through MQTT.
-
Ultrasonic Waterproof Sensor (JSN-SR04T-2.0): this sensor is responsible for sensing the water level in the tank; this consists of 4 pins that were configured in the programming.
Pin 5v of the sensor to 5 volts of the micro (red wire)
Pin gnd of the sensor to the gnd of the micro (black wire)
Pin Trig from the sensor to pin D7 of the micro (orange wire)
Pin echo of the sensor to pin D8 of the micro (blue wire)
-
Water Flow Sensor (YF-S201)
3: This sensor is responsible for measuring the water pressure falling from the water intake to the cistern; it consists of 3 pins configured in the micro-controller programming.
Pin 5v from the sensor to 5 volts from micro (red wire)
Sensor gnd pin to micro-controller gnd (black wire)
Sensor signal pin to micro-controller pin D4 (yellow wire)
-
Relay Module is responsible for activating or deactivating the submersible water pump, labeled with the number (5) in the diagram. This pump changes from active to deactivated depending on the water level values delivered from the cistern and the water tank.
Pin 5v from the sensor to 5 volts from micro (red wire)
Sensor gnd pin to microphone gnd (black wire)
Signal pin of the module to the D6 pin of the micro (purple wire).
-
The Submersible water pump is the actuator of the whole architecture since it supplies water to the tank in case it is needed, or if not, it does not pump water in its cistern does not have water. These conditions were established in the node-network programming in the single-board computer (Raspberry Pi).
Red wire to the NO connector of the Relay module
Black wire to the negative pole of the battery (6), and the positive pole of the battery is connected to connector C of the relay module to close the circuit.
Battery (9v). This battery helps us close the circuit of the submersible water pump since it changes state from on to off and vice versa. A commercial battery was used, and a battery clip was adapted.
-
Sensor TDS meter v1,0. This gives us an estimate of how dirty the water is; we mention a forecast because it is needed to complement a thermometer that does not deliver the water temperature to provide a more accurate value.
Pin 5v of the sensor to 5 volts of the micro (red wire).
Pin gnd of the sensor to gnd of the micro (black wire)
Pin A of the sensor to pin A0 of the microphone (blue wire).
MQTT sends the sensed data from this cistern tank node to the Raspberry Pi 4, where some processing is done to determine whether or not to activate the submersible pump. If it is required to activate, MQTT sends a message for activation. If it is not necessary to turn on the pump, a message will be sent stating not to activate it. The message depends on the programming set. We use the programming tool Node-RED.
3.5.2. Tank Sensor Node Electronic Circuit Diagram
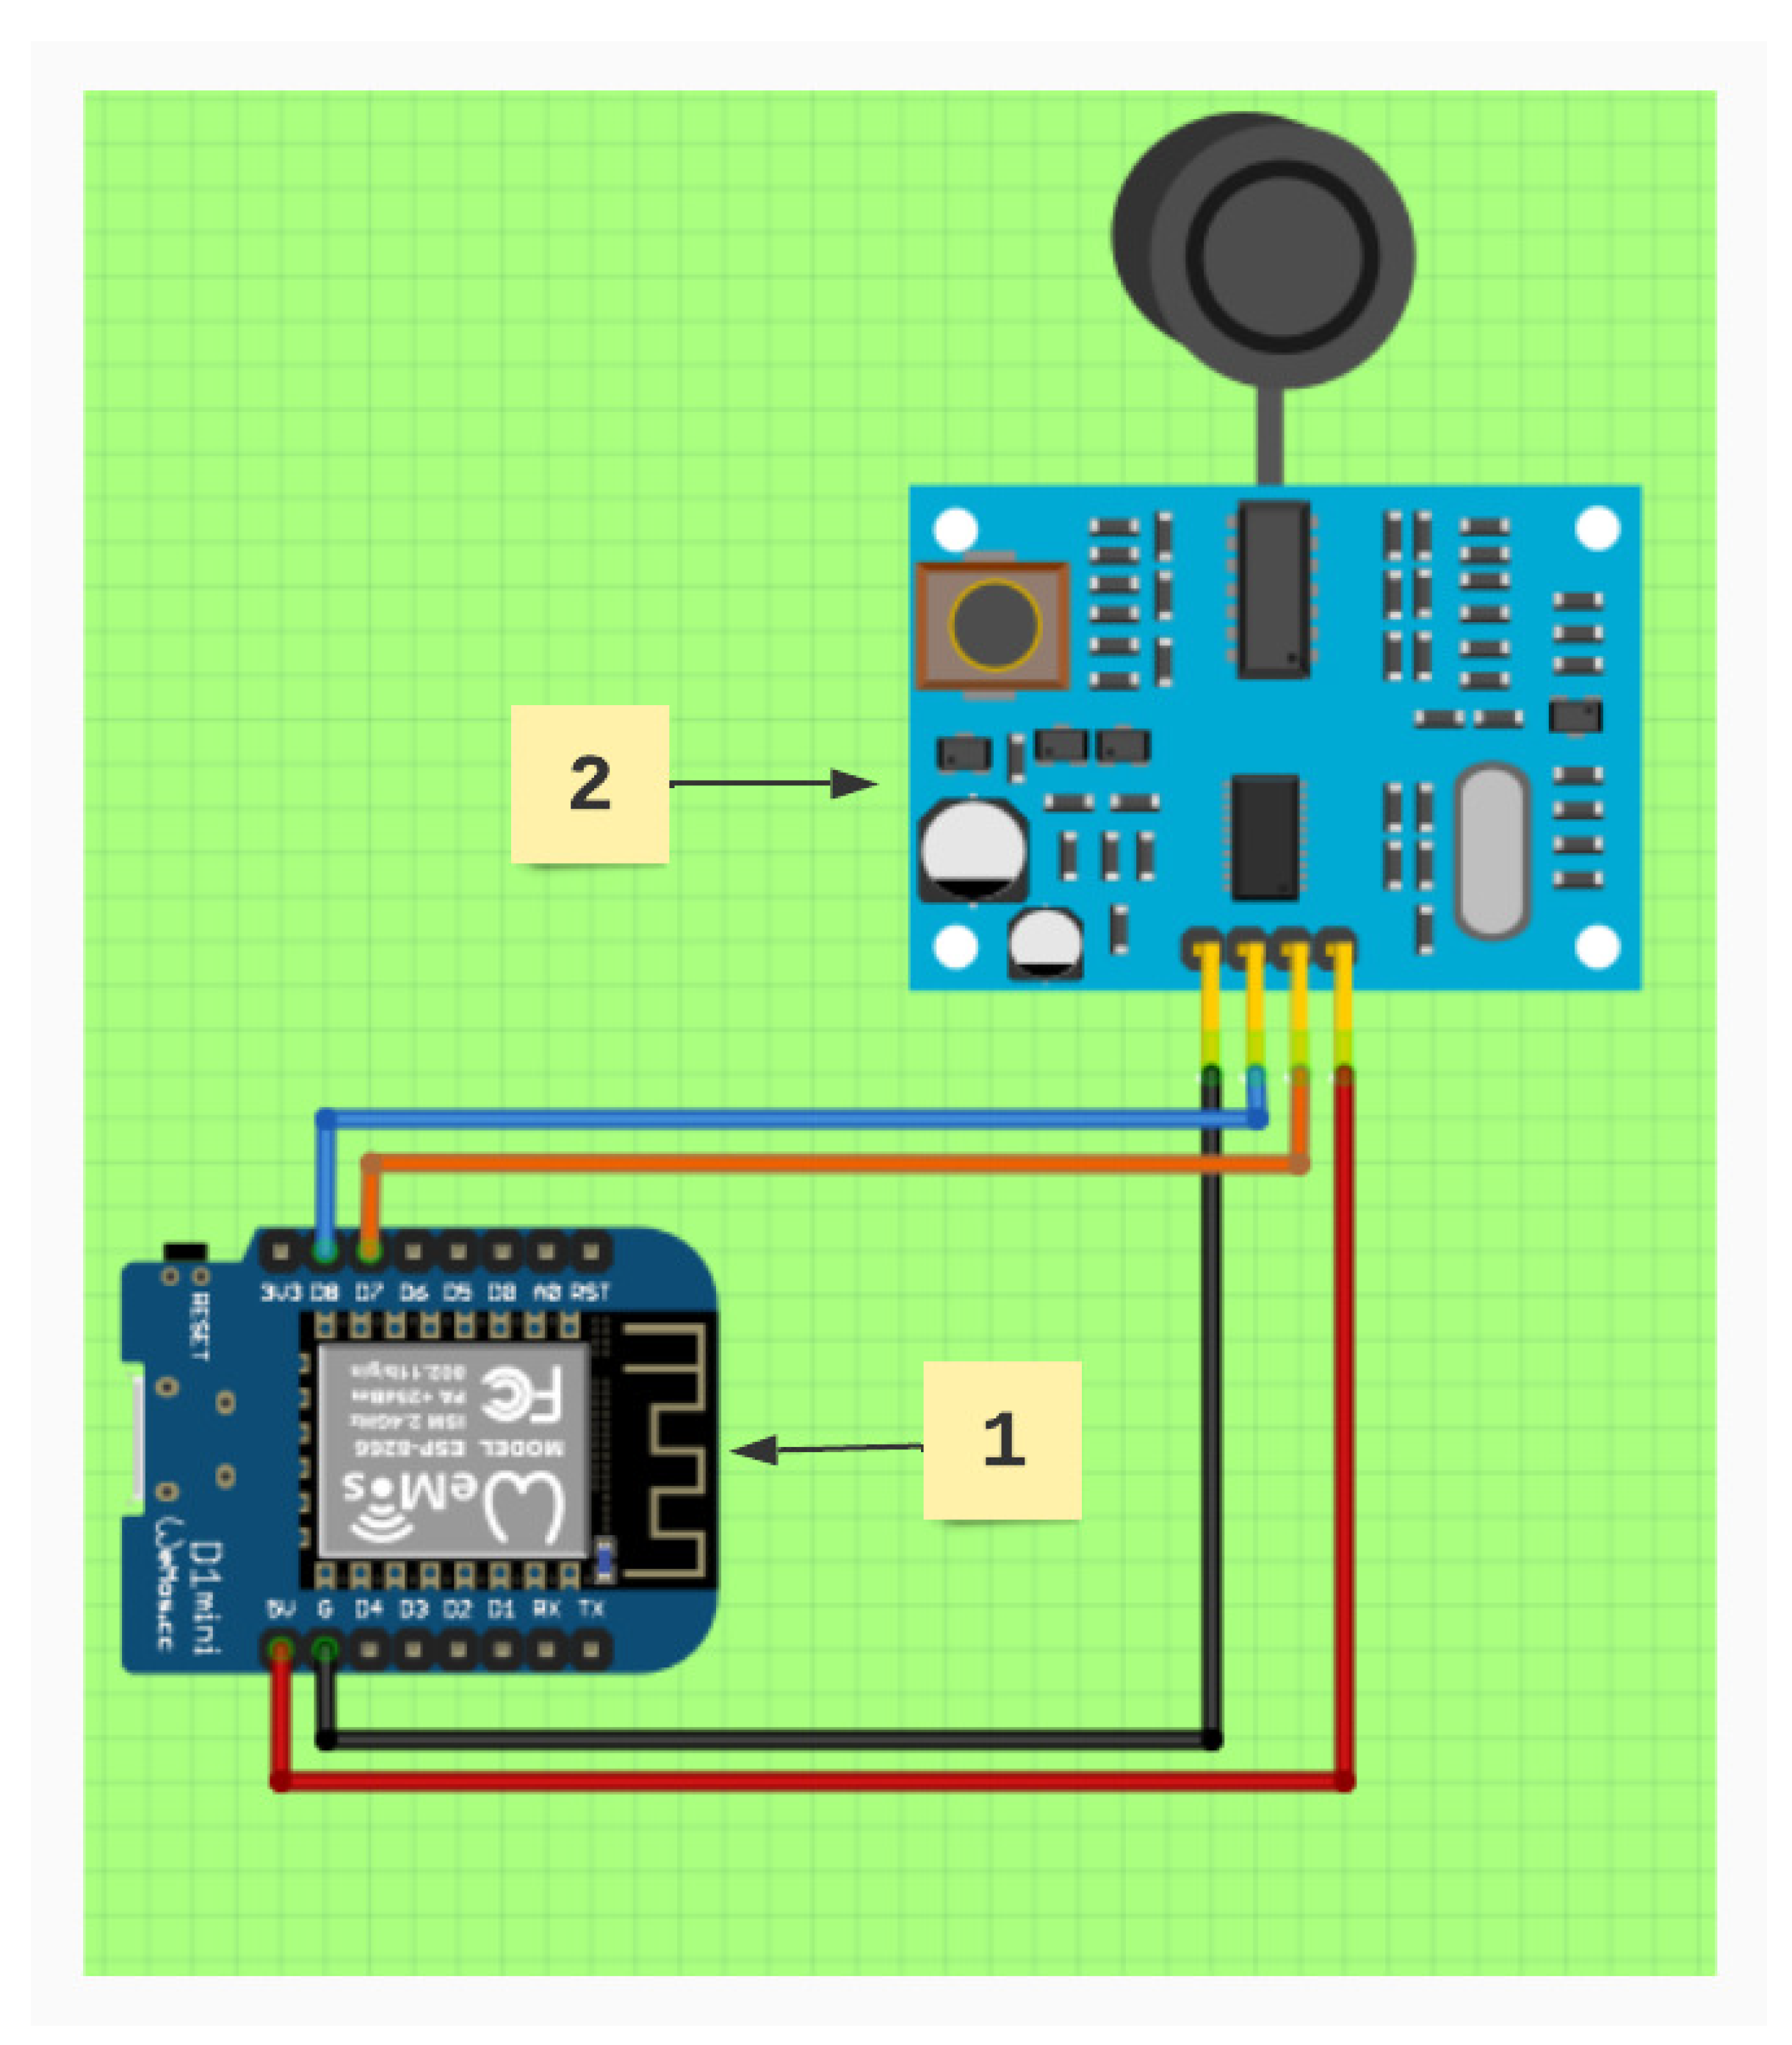
The following diagram (
Figure 10.) shows the connections of the tank sensor node.
Wemos D1 mini: Device that is responsible for controlling each of the components of the architecture of the tank sensor node; this control is done through the input and output pins; these pins were configured in the programming that was implemented in the Arduino IDE. In the programming, each pin was set depending on the component to be configured, the communication protocols, and the network through which the data is transmitted via MQTT was established.
-
Ultrasonic waterproof sensor (JSN-SR04T-2.0): This sensor is responsible for sensing the water level in the tank. It consists of four pins that were configured in the programming.
Pin 5v of the sensor to 5 volts of the micro (red cable).
Pin gnd of the sensor to the gnd of the micro (black wire).
Pin Trig from the sensor to pin D7 of the micro (orange wire).
Pin echo from the sensor to pin D8 of the mic (blue wire).
3.5.3. Flows and Dashboard in Node-RED
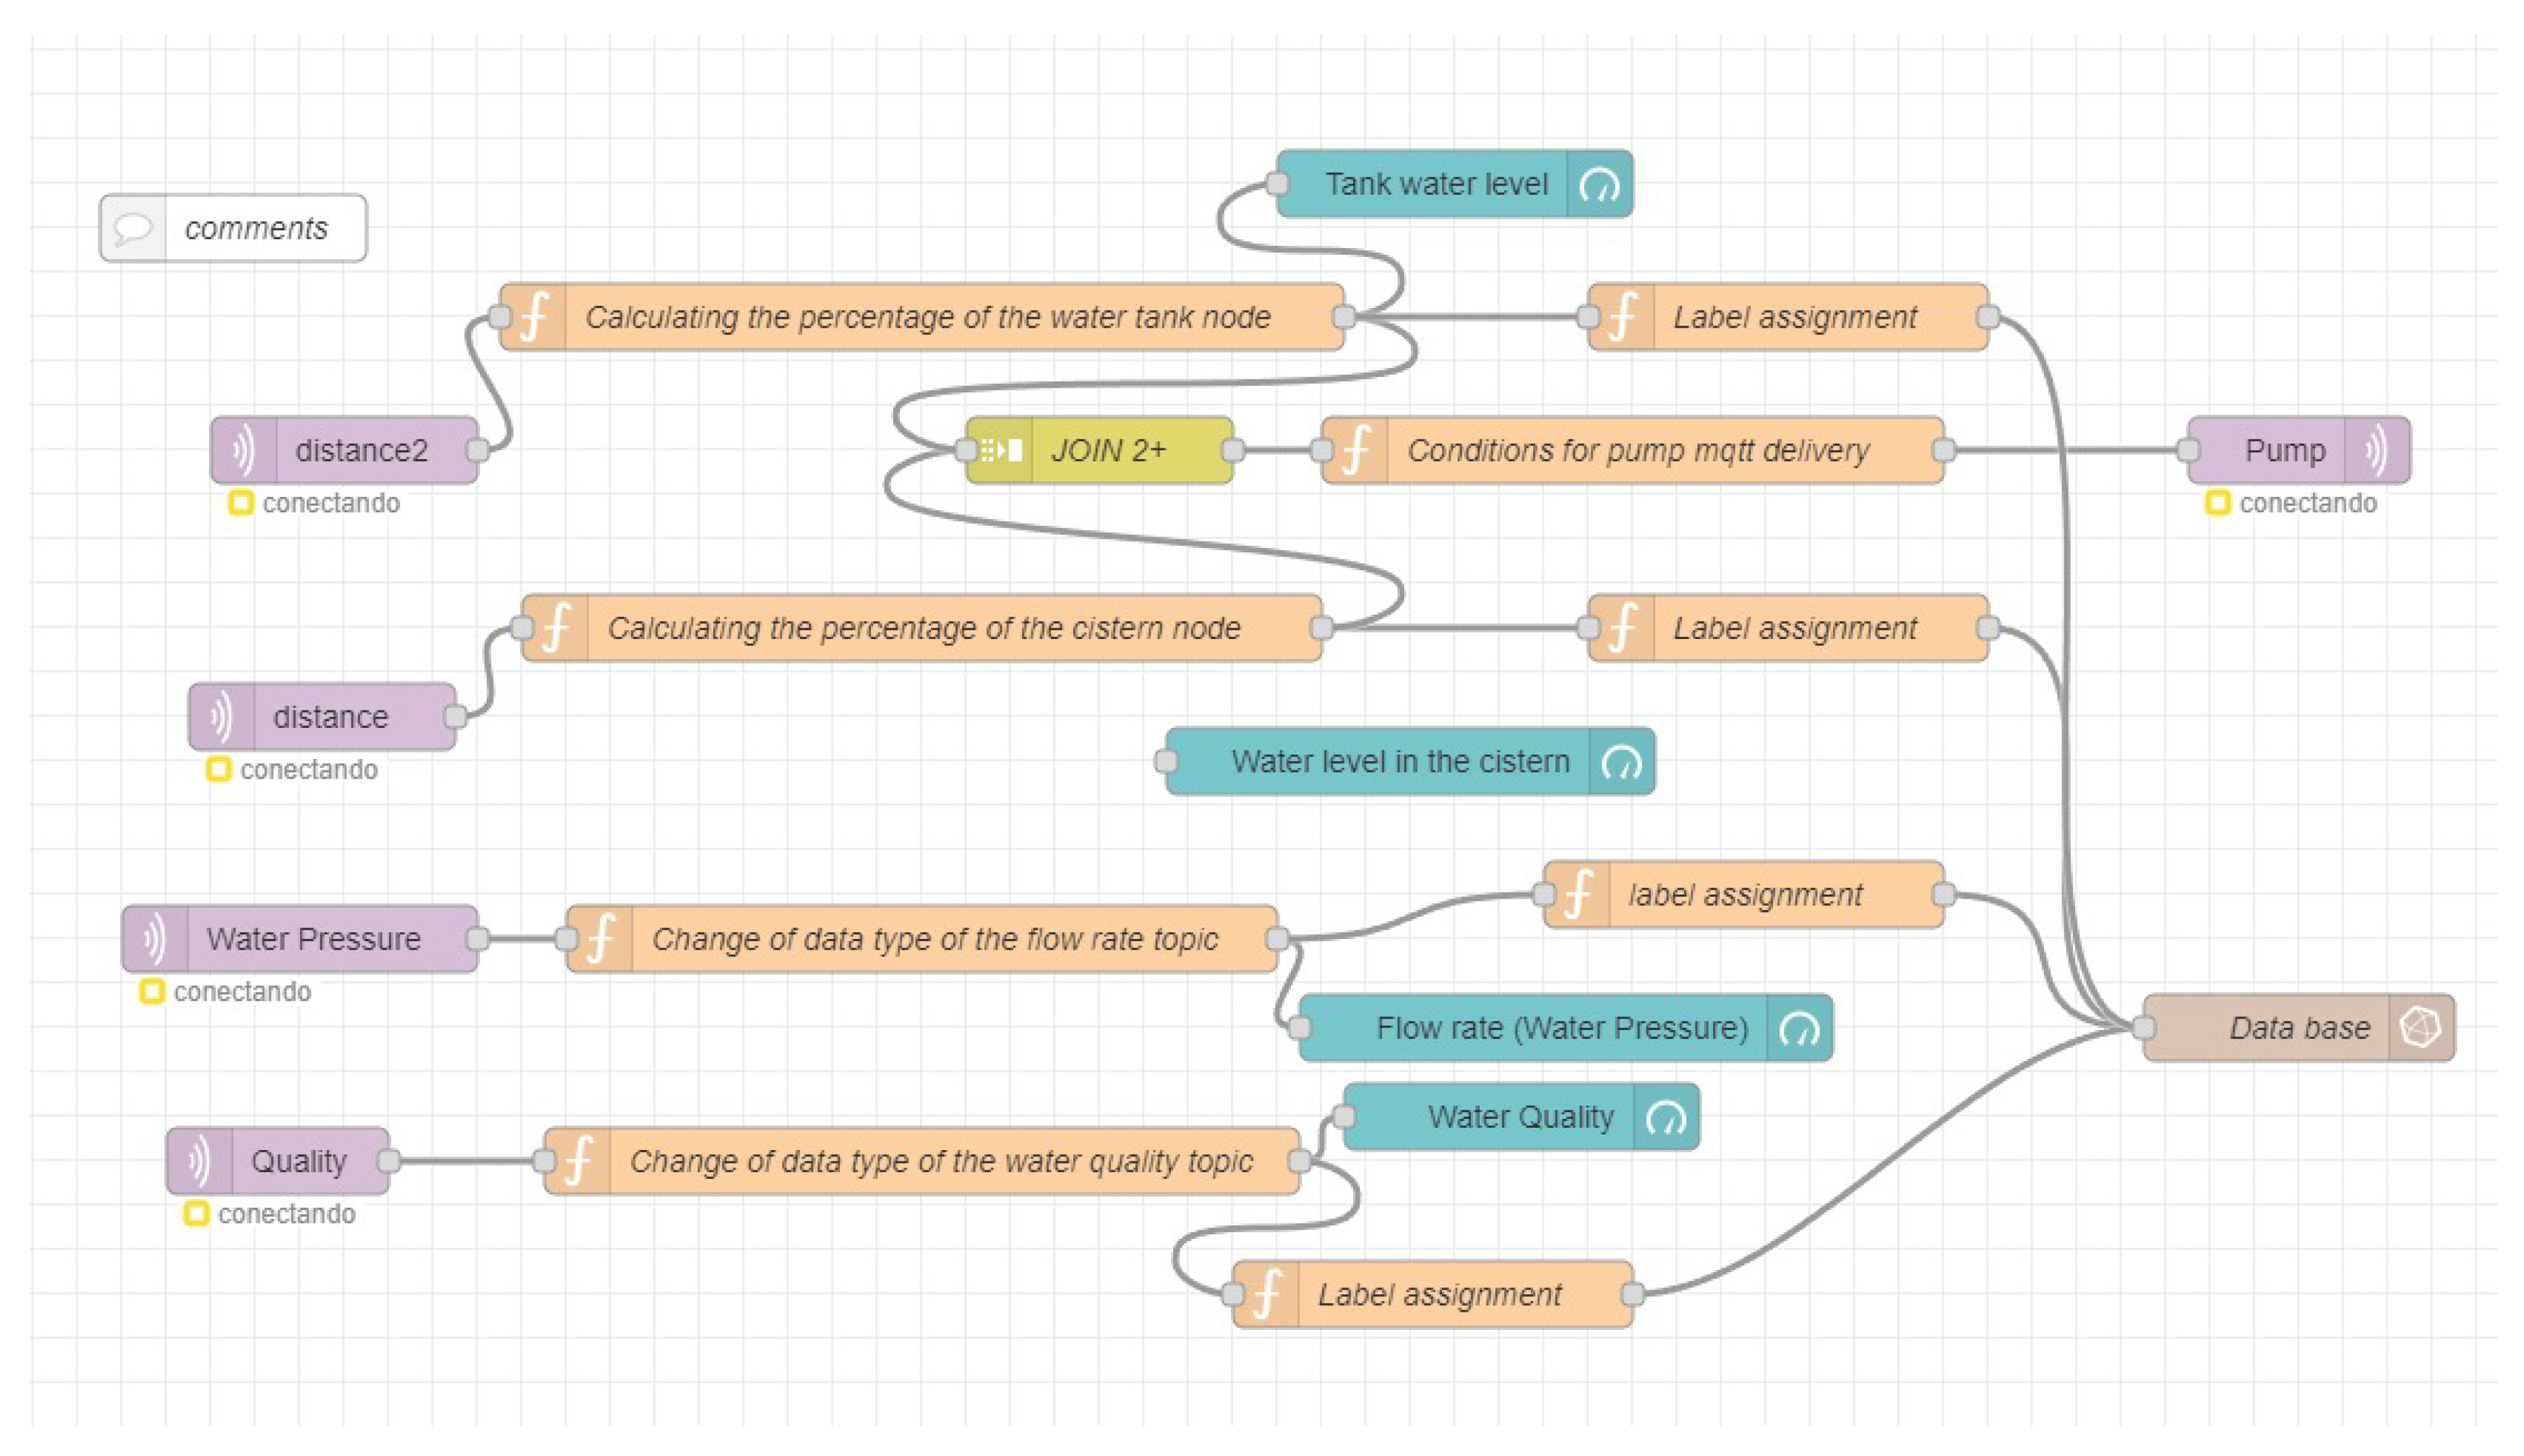
Figure 11 shows the Node-RED programming code used for the Dashboard. In this program, all elements are integrated.
Distance or water level in the water tank.
Distance or water level in the cistern.
Flow rate or water pressure coming from the tap water.
Water quality.
Submersible water pump.
4. Experimental Results
4.1. Physical Scale Model
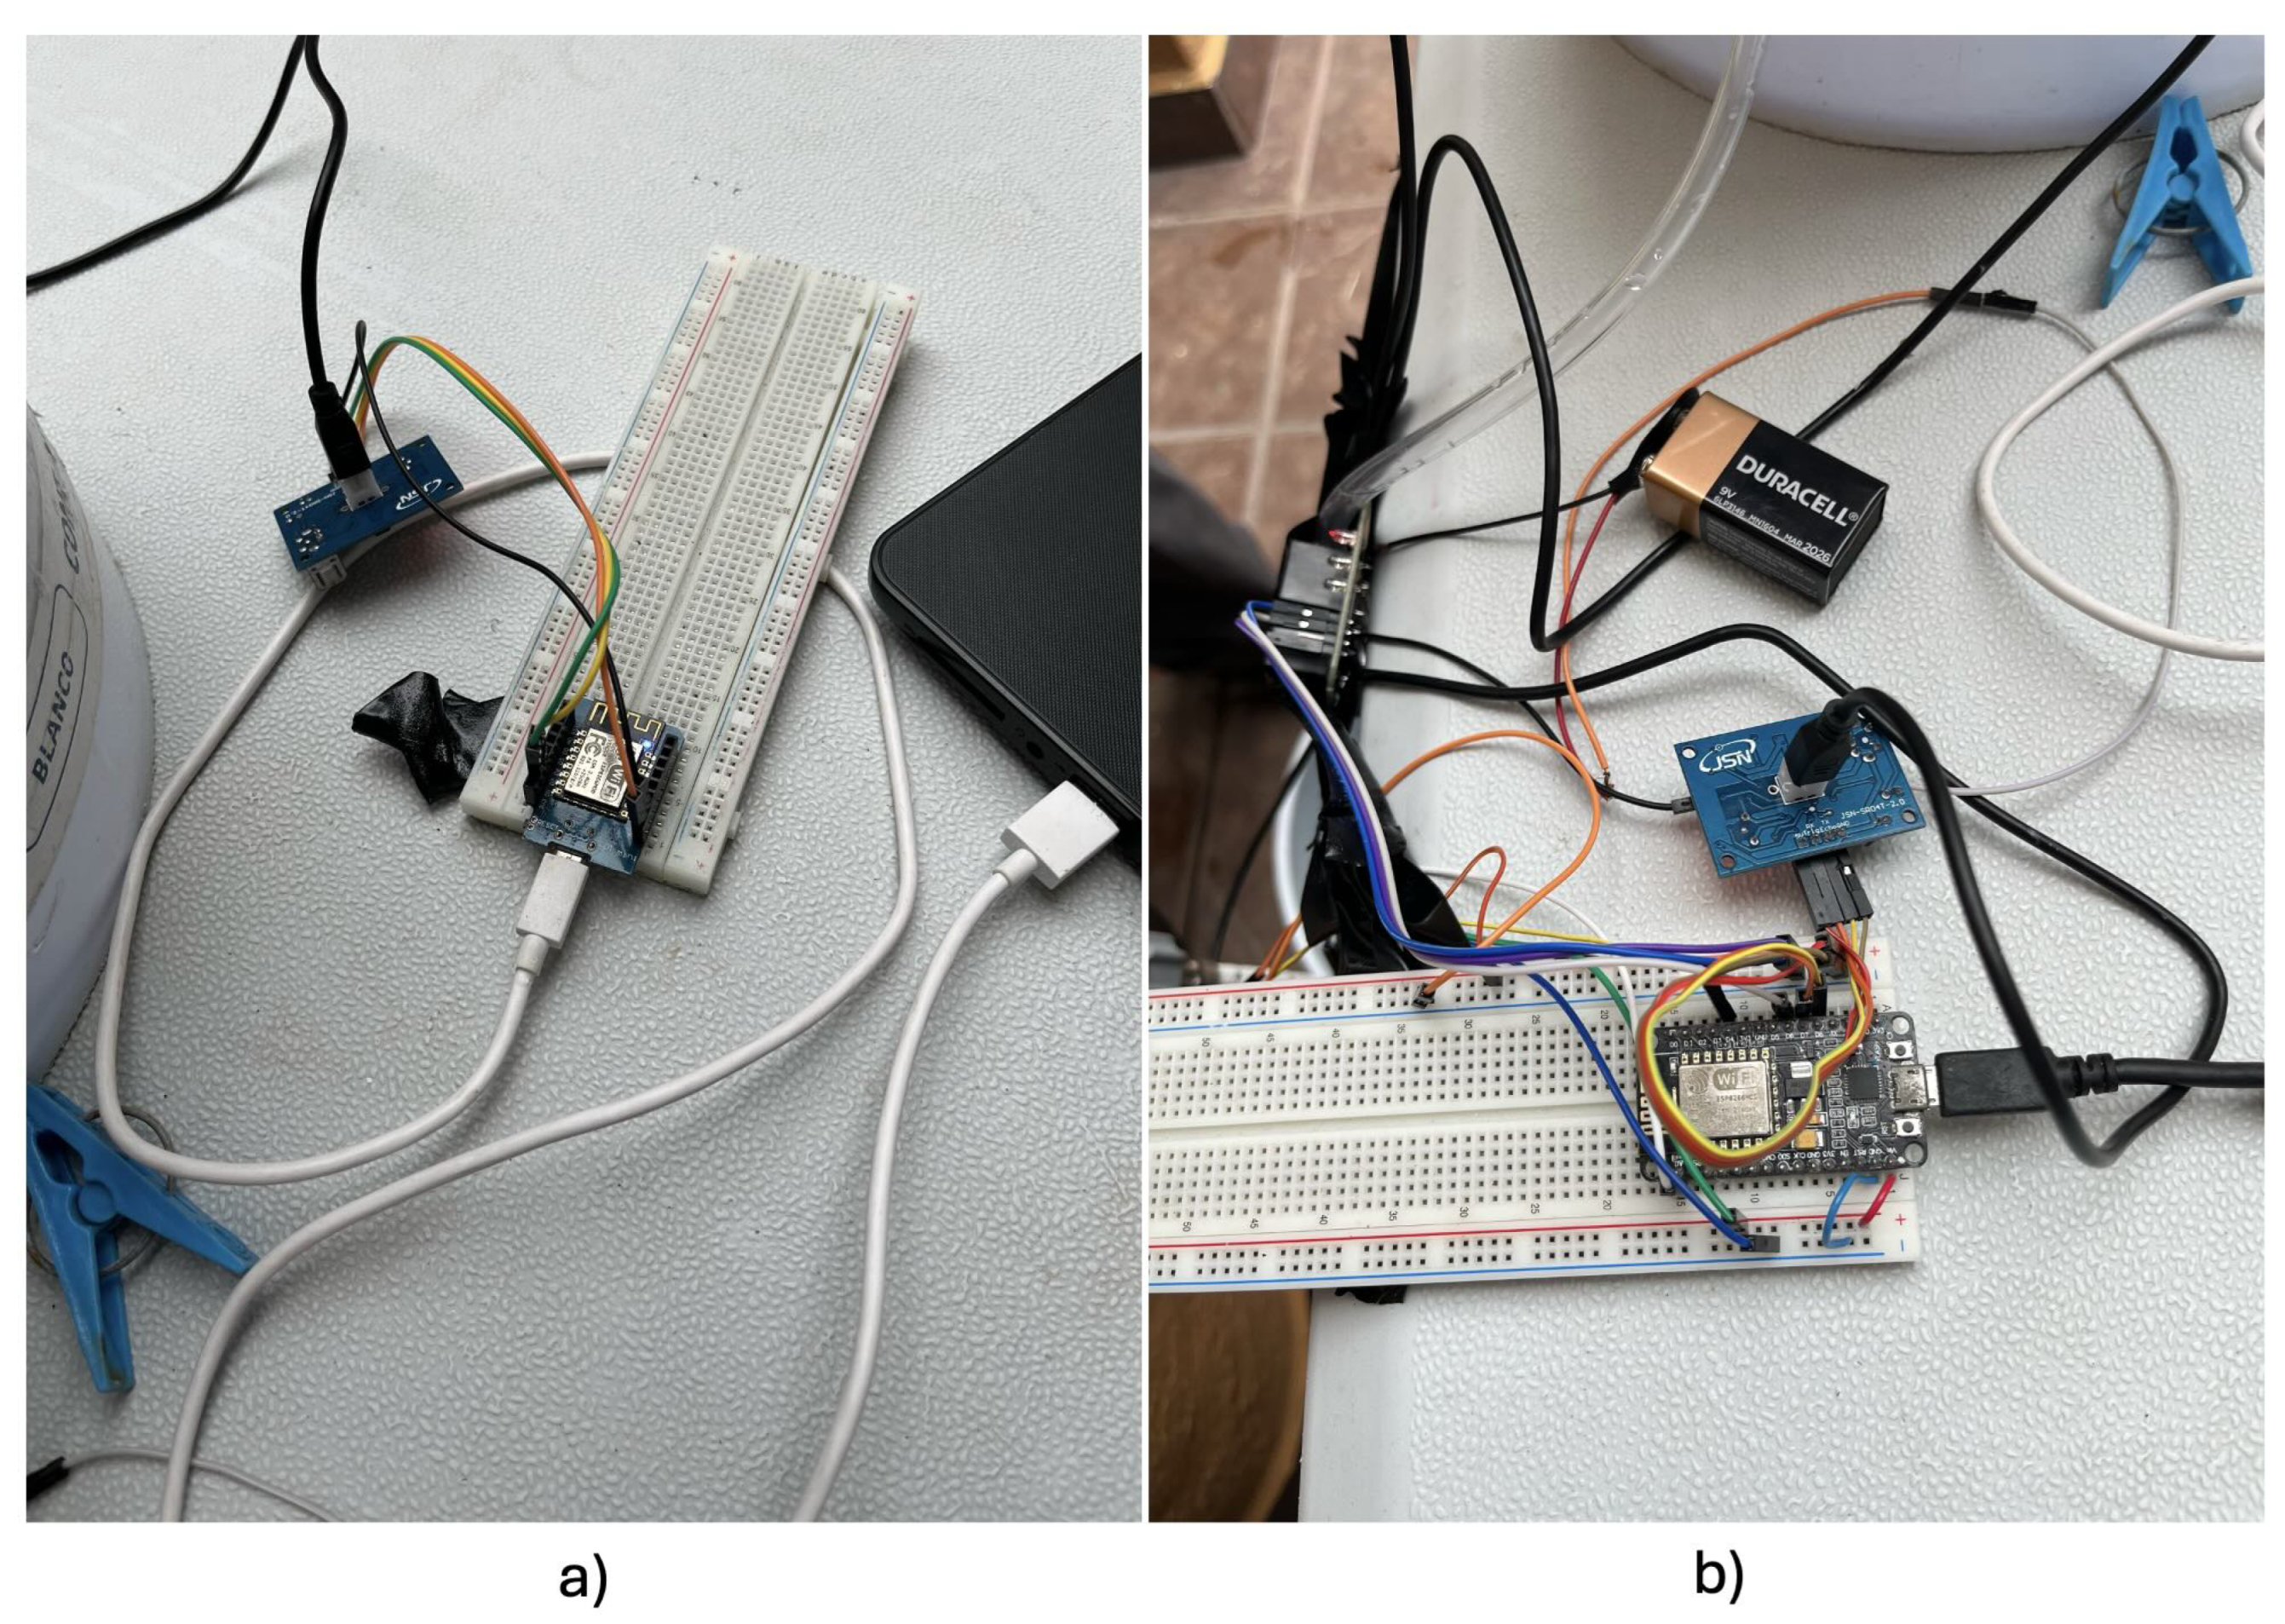
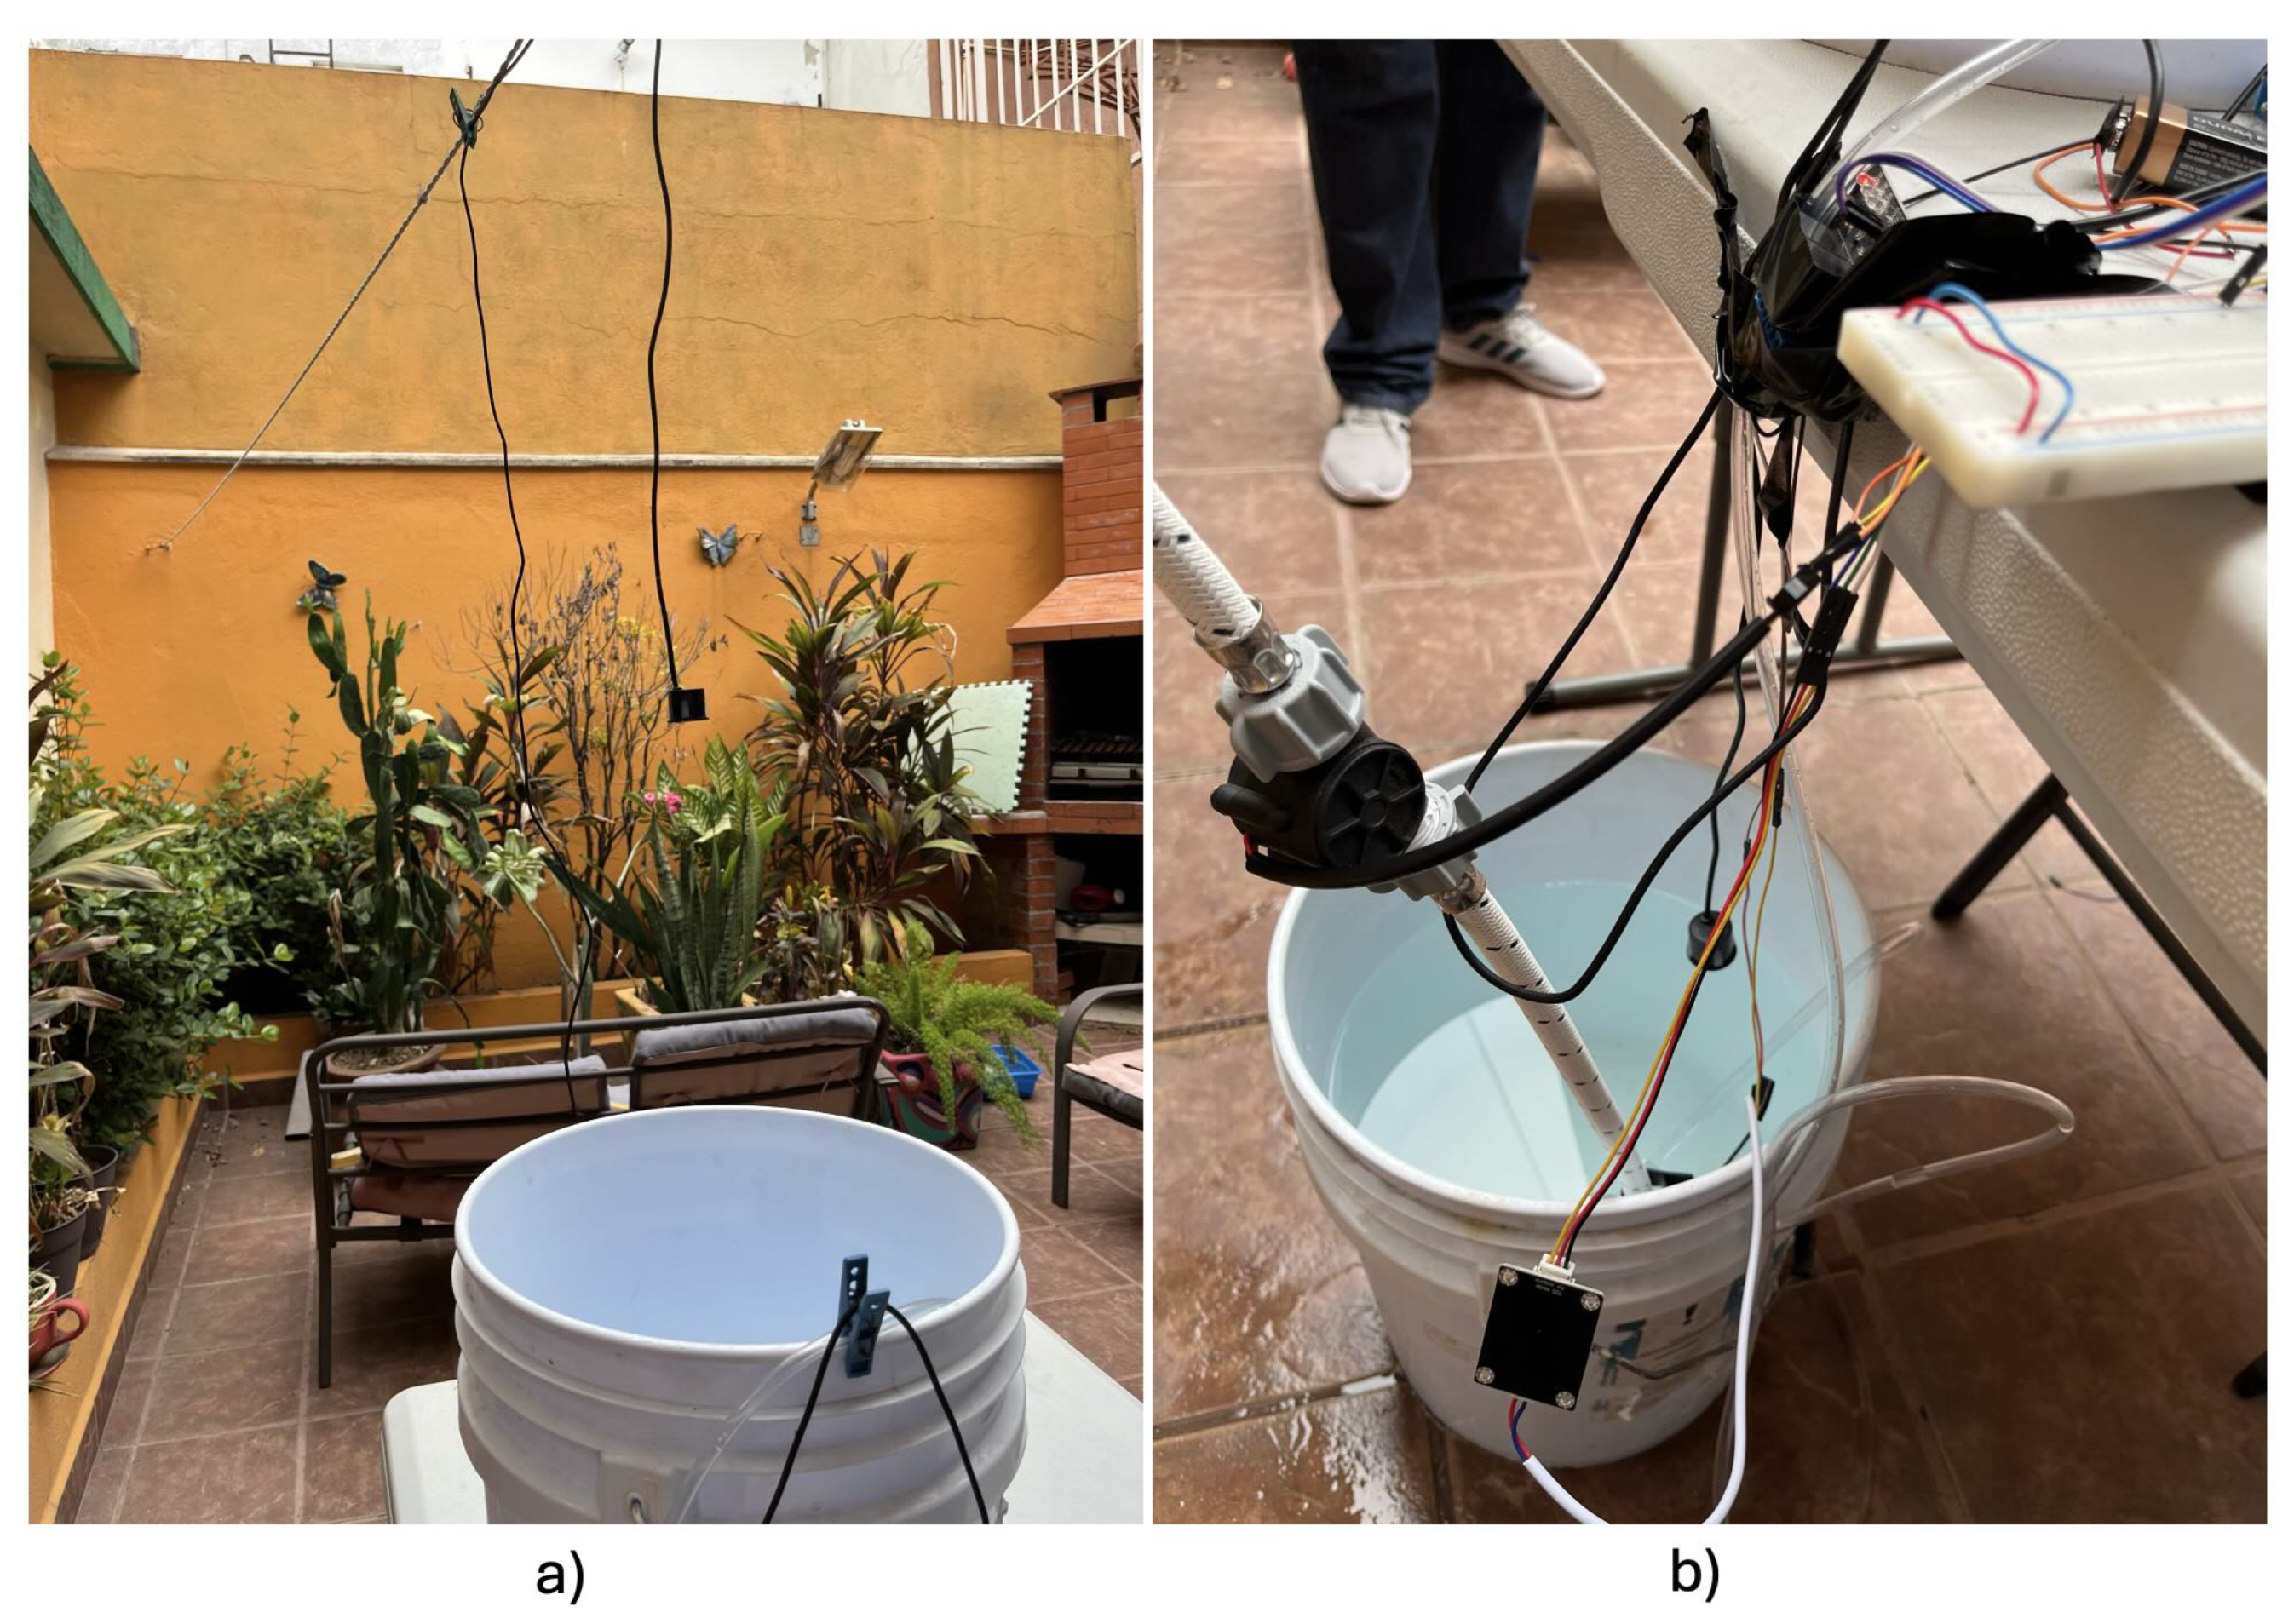
To demonstrate the feasibility of monitoring water tanks and cisterns using IoT, we will describe with pictures the installation of the water level monitoring system for a cistern, water tank, water flow, water quality, and water pump. We have used a physical scale model to prove the proposed system’s operation.
In
Figure 12 a), we see a circuit connected to a water level sensor (Ultrasonic Sensor JSN-SR04T-2.0), which is responsible for measuring the water level in the tank. A WeMos D1 mini ESP8266 WiFi controls this sensor.
Figure 12 b) shows a second circuit; we see another water level sensor (Ultrasonic Sensor JSN-SR04T-2.0), which measures the water level in the tank. The ultrasonic sensor uses a NodeMCU v2 ESP8266 WiFi to be controlled.
We have placed a bucket on top of the table to emulate the Water Tank because this tank should go on top. Above it hangs the ultrasonic sensor measuring the water level in the tank. See
Figure 13 a). Similarly to the water tank, we have placed a bucket below the ground level since this water container must go down. Above it hangs the ultrasonic sensor for measuring the cistern’s water level. Also, inside that bucket is the hose that supplies tap water with the flow sensor, the pump to bring water up to the tank is also submerged in the water, and the sensor that measures the water quality has been placed right there. See
Figure 13 b).
4.2. Dashboard and Meters/Gauges
Starting from the circuit diagrams, the software was installed and tested on the microcontrollers, i.e., everything installed, sensors, microcontrollers, actuators, wires, water pump, etc., was physically connected. We proceeded to open the water faucet to start circulating water through the system. To obtain water quality measurements, we added a little soil to the water to demonstrate that it was dirty, which can give us ppm values.
From the test results, it is time to visualize our system’s behavior on the Internet. We programmed in the programming tool Node-RED (Flows and Java Script) and C for the WeMos D1, the NodeMCU v2 ESP8266, and the Raspberry Pi 4.
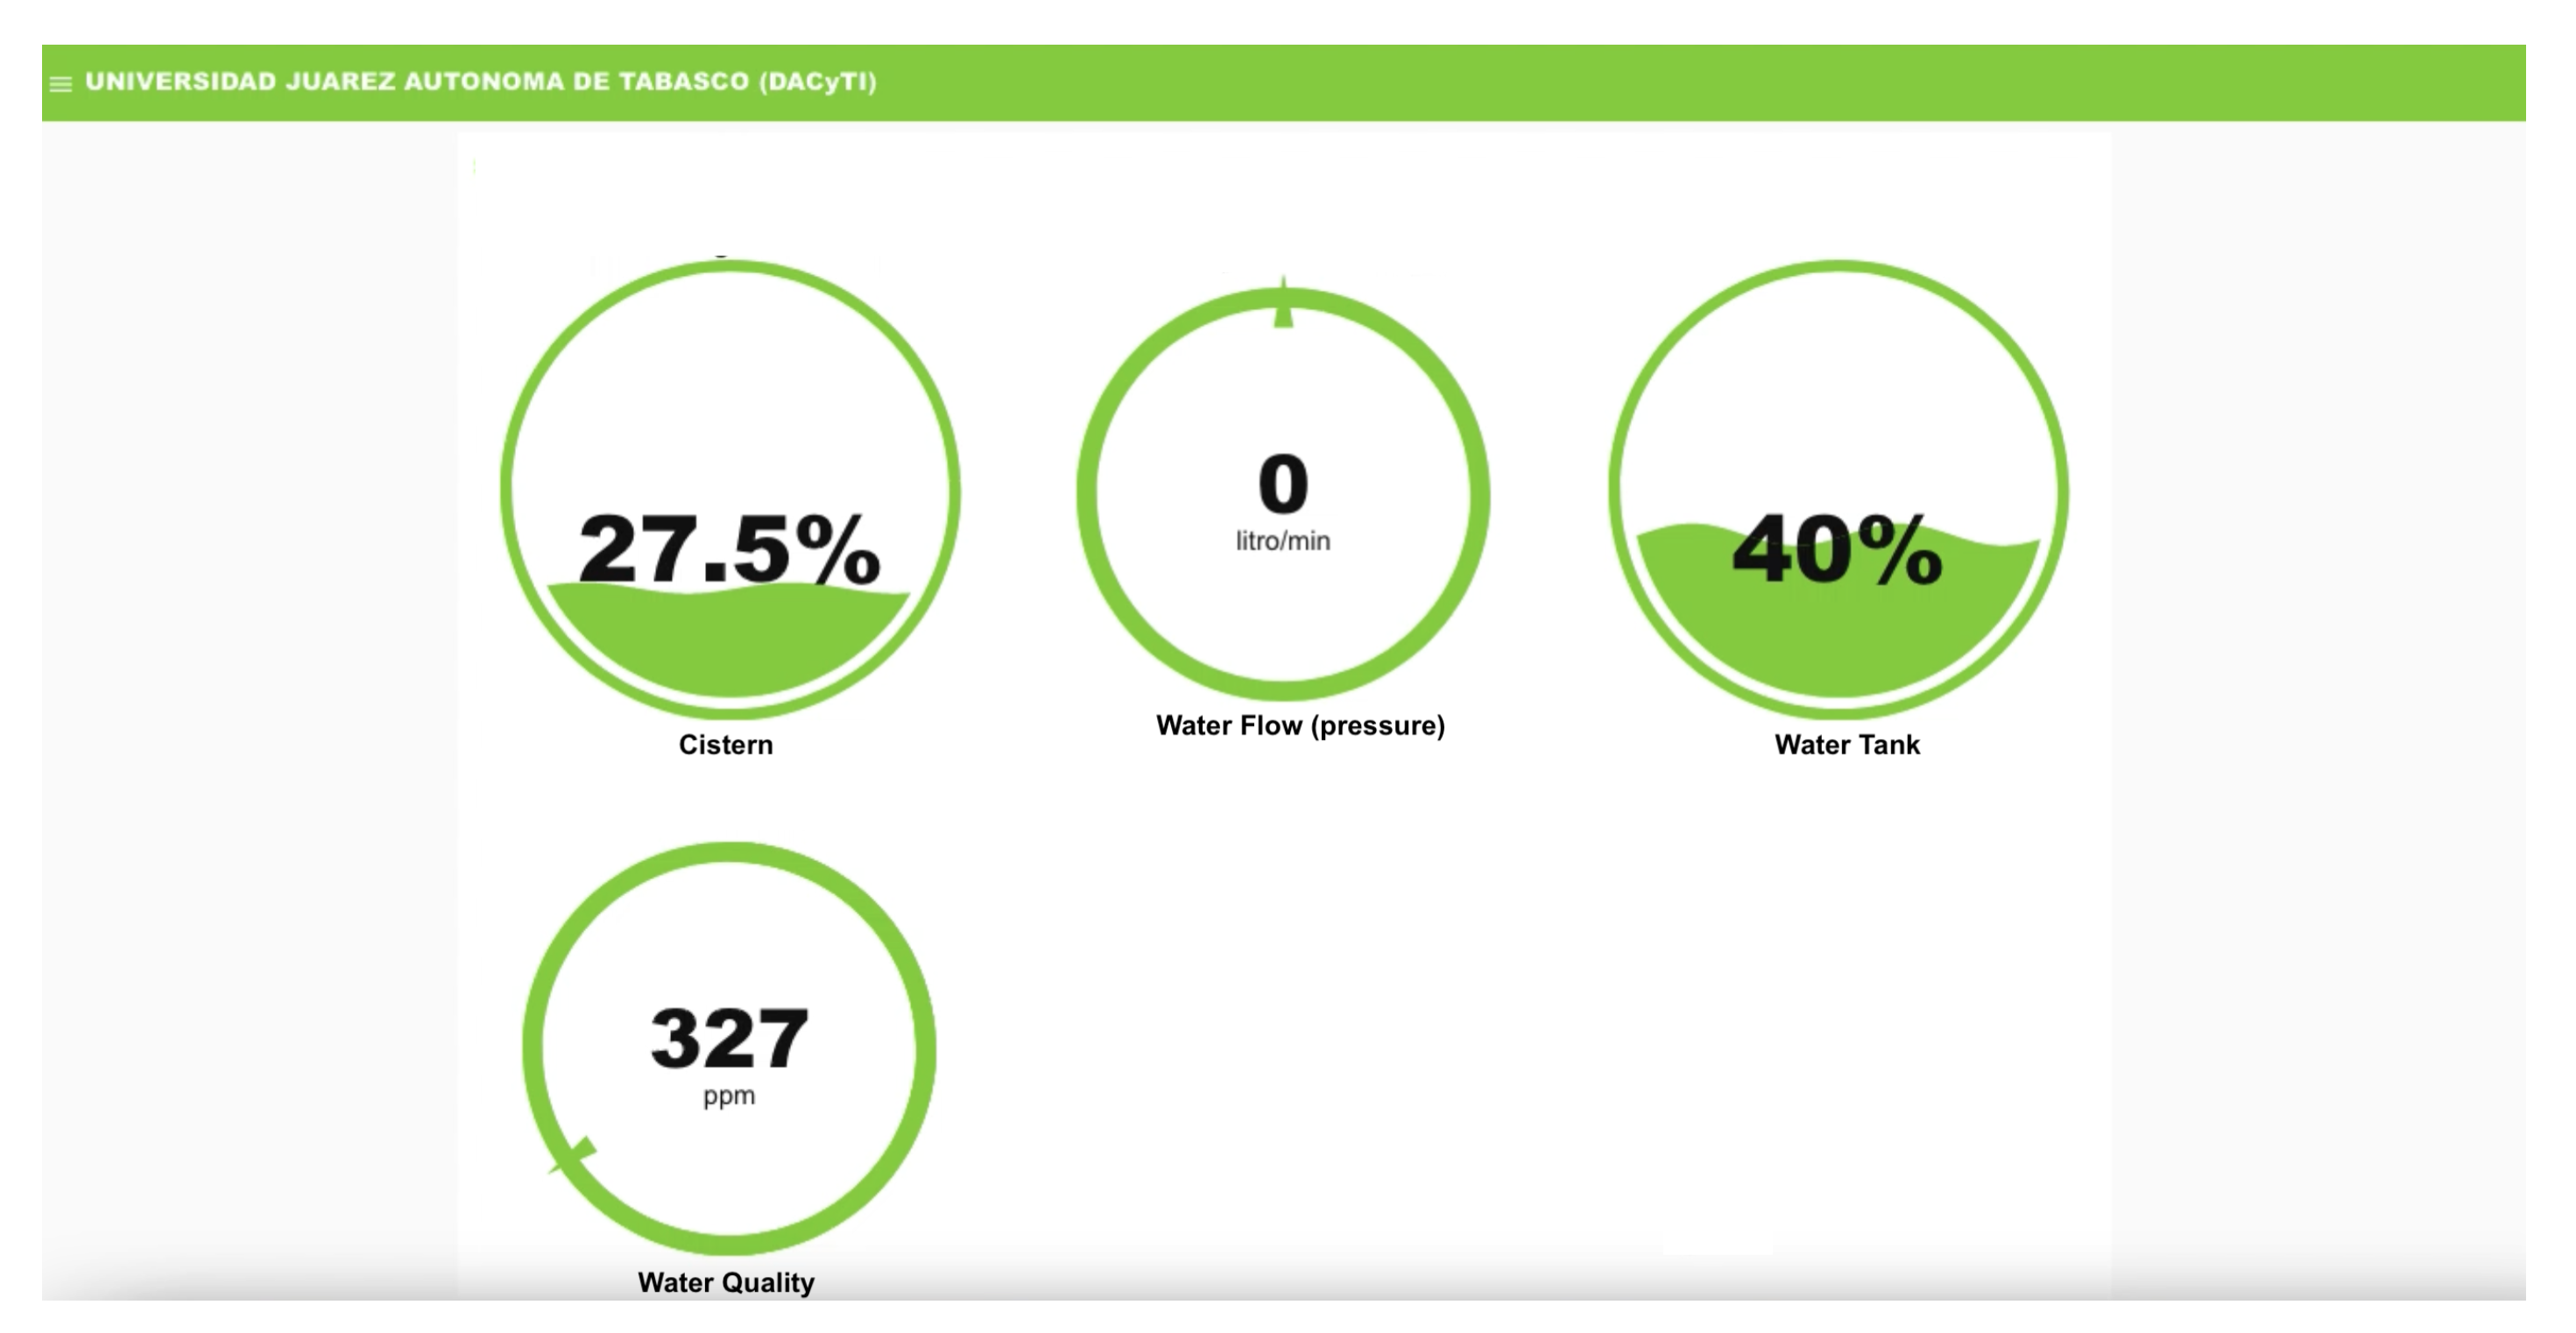
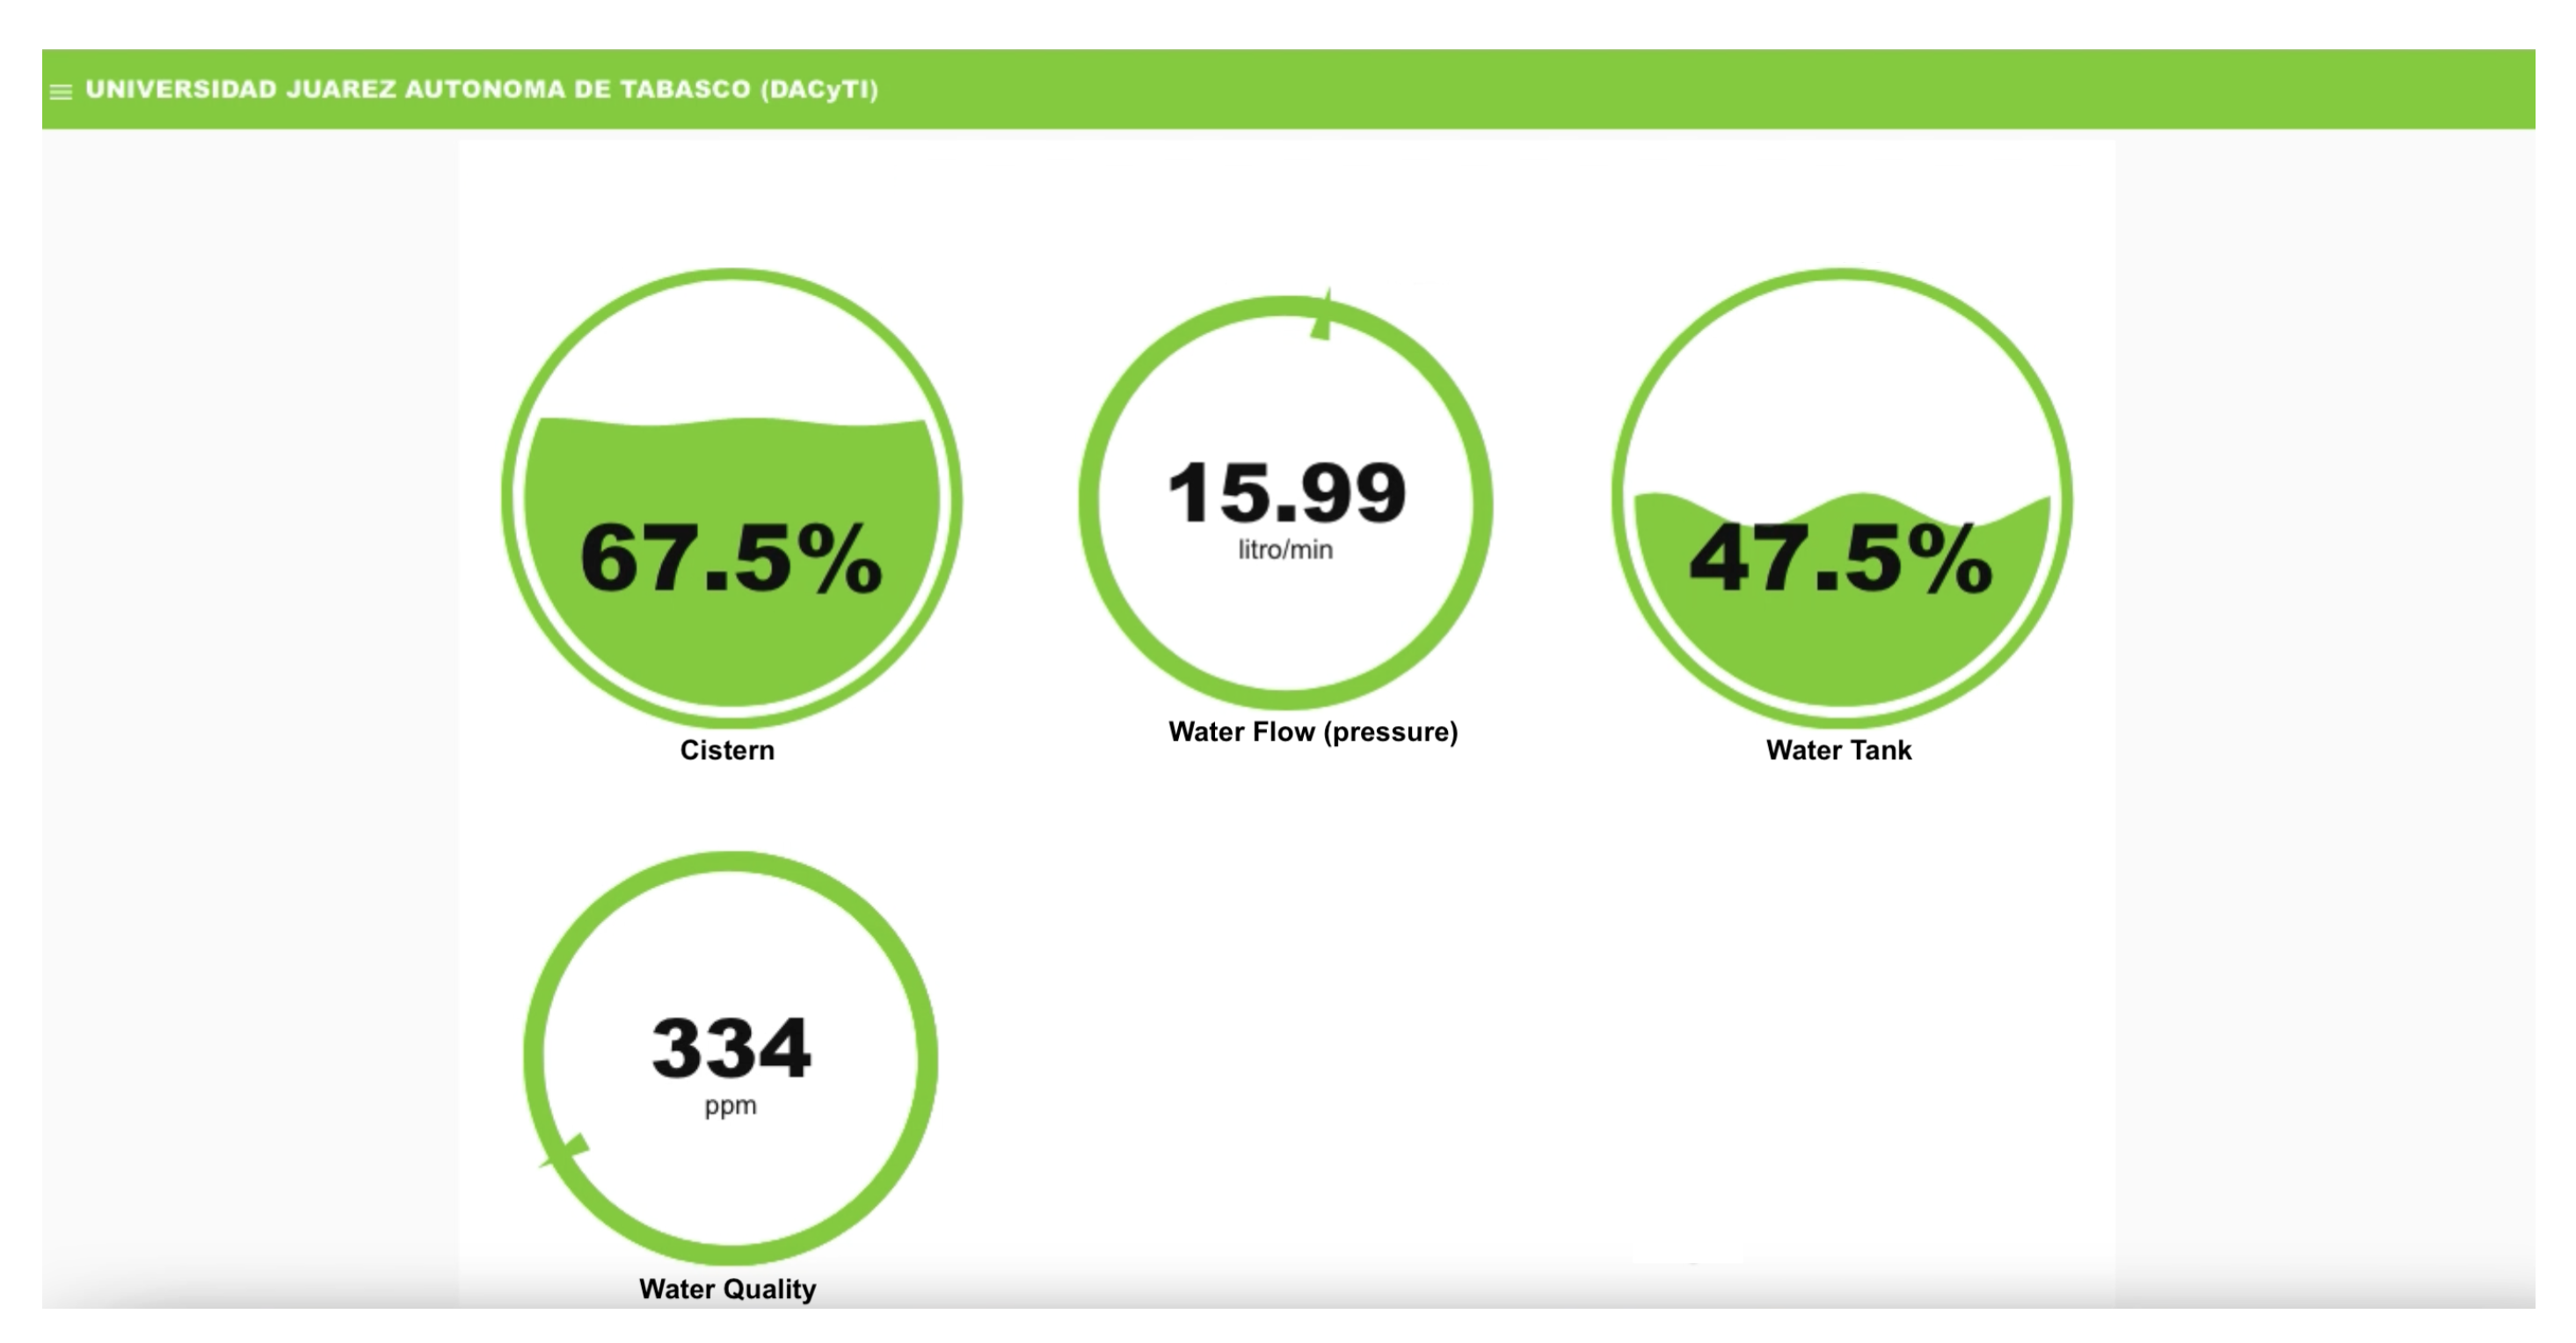
As mentioned earlier, to visualize such behavior on the Internet, the monitoring or result can be displayed on a Node-RED output screen; we used a dashboard during the prototype test. This dashboard displays four gauges: the first one shows the water level in the cistern, the second one shows the flow rate or water flow that reaches the water hose, the third one displays the water level in the tank, and finally, the last gauge indicates the water quality.
Figure 14 shows a dashboard with four gauges when the water pressure is zero L/min, i.e., low pressure or no municipal water supply. While the cistern is at 27.5% capacity, the water tank is at 40% full, and the water quality is 327 ppm. This measurement is made with the Water Flow Sensor (YF-S201); this value varies over time as the municipal water flow has high, medium, low, or no pressure. When the user realizes the gauge is zero, they can decide to save water consumption. Although there may be water in the cistern and the water tank, the user can choose to measure their water use.
Continuing with the scale model test, we open the water faucet a quarter turn, a half turn, a complete turn, two turns, or close completely, thus obtaining water flow or pressure values. The following figures show changes that will occur, and we will describe them briefly because they are situations that hypothetically will happen in reality.
As shown in
Figure 15, a dashboard with four gauges describes when the water flow is at 15.99 liters/min, the cistern is at 67.5% capacity, the water tank is at 47.5% full, and the water quality is 334 ppm.
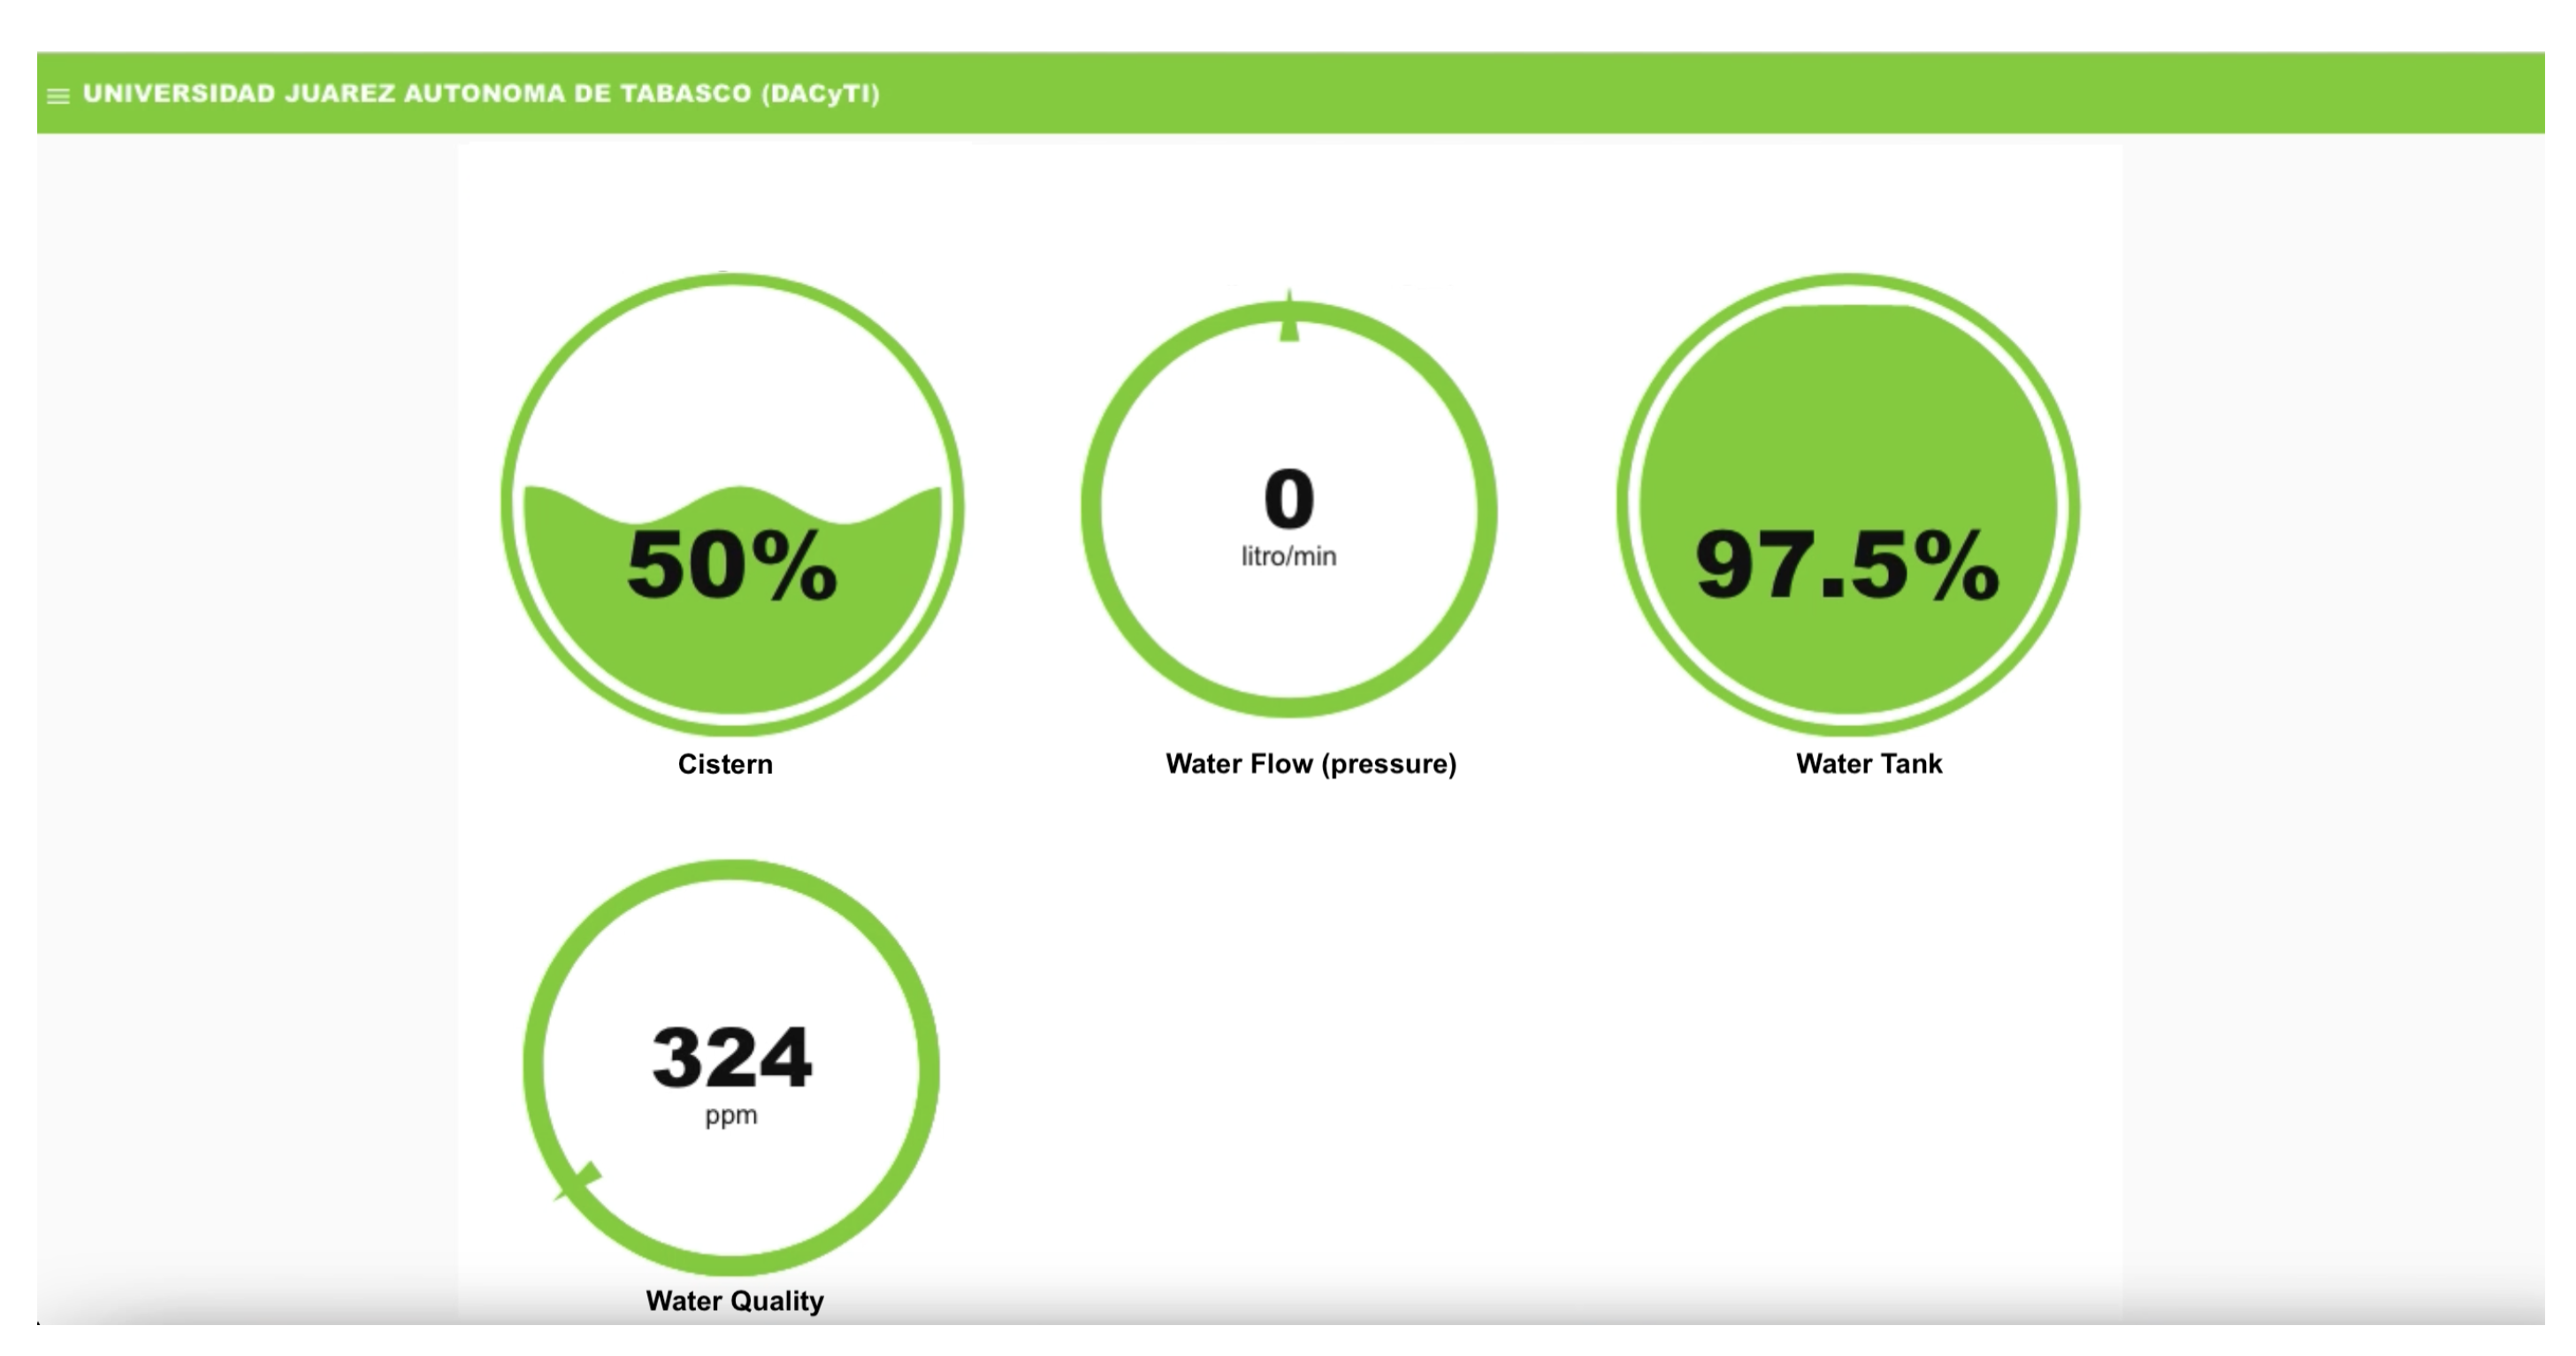
Figure 16 shows the dashboard at another point in the tests; the water flow is at 0 liters/min, the cistern is at 50% percent capacity, the water tank is at 97.5 percent, and the water quality is 324 ppm. In this case, the faucet was closed completely. Therefore, the water flow is at 0 liters/min.
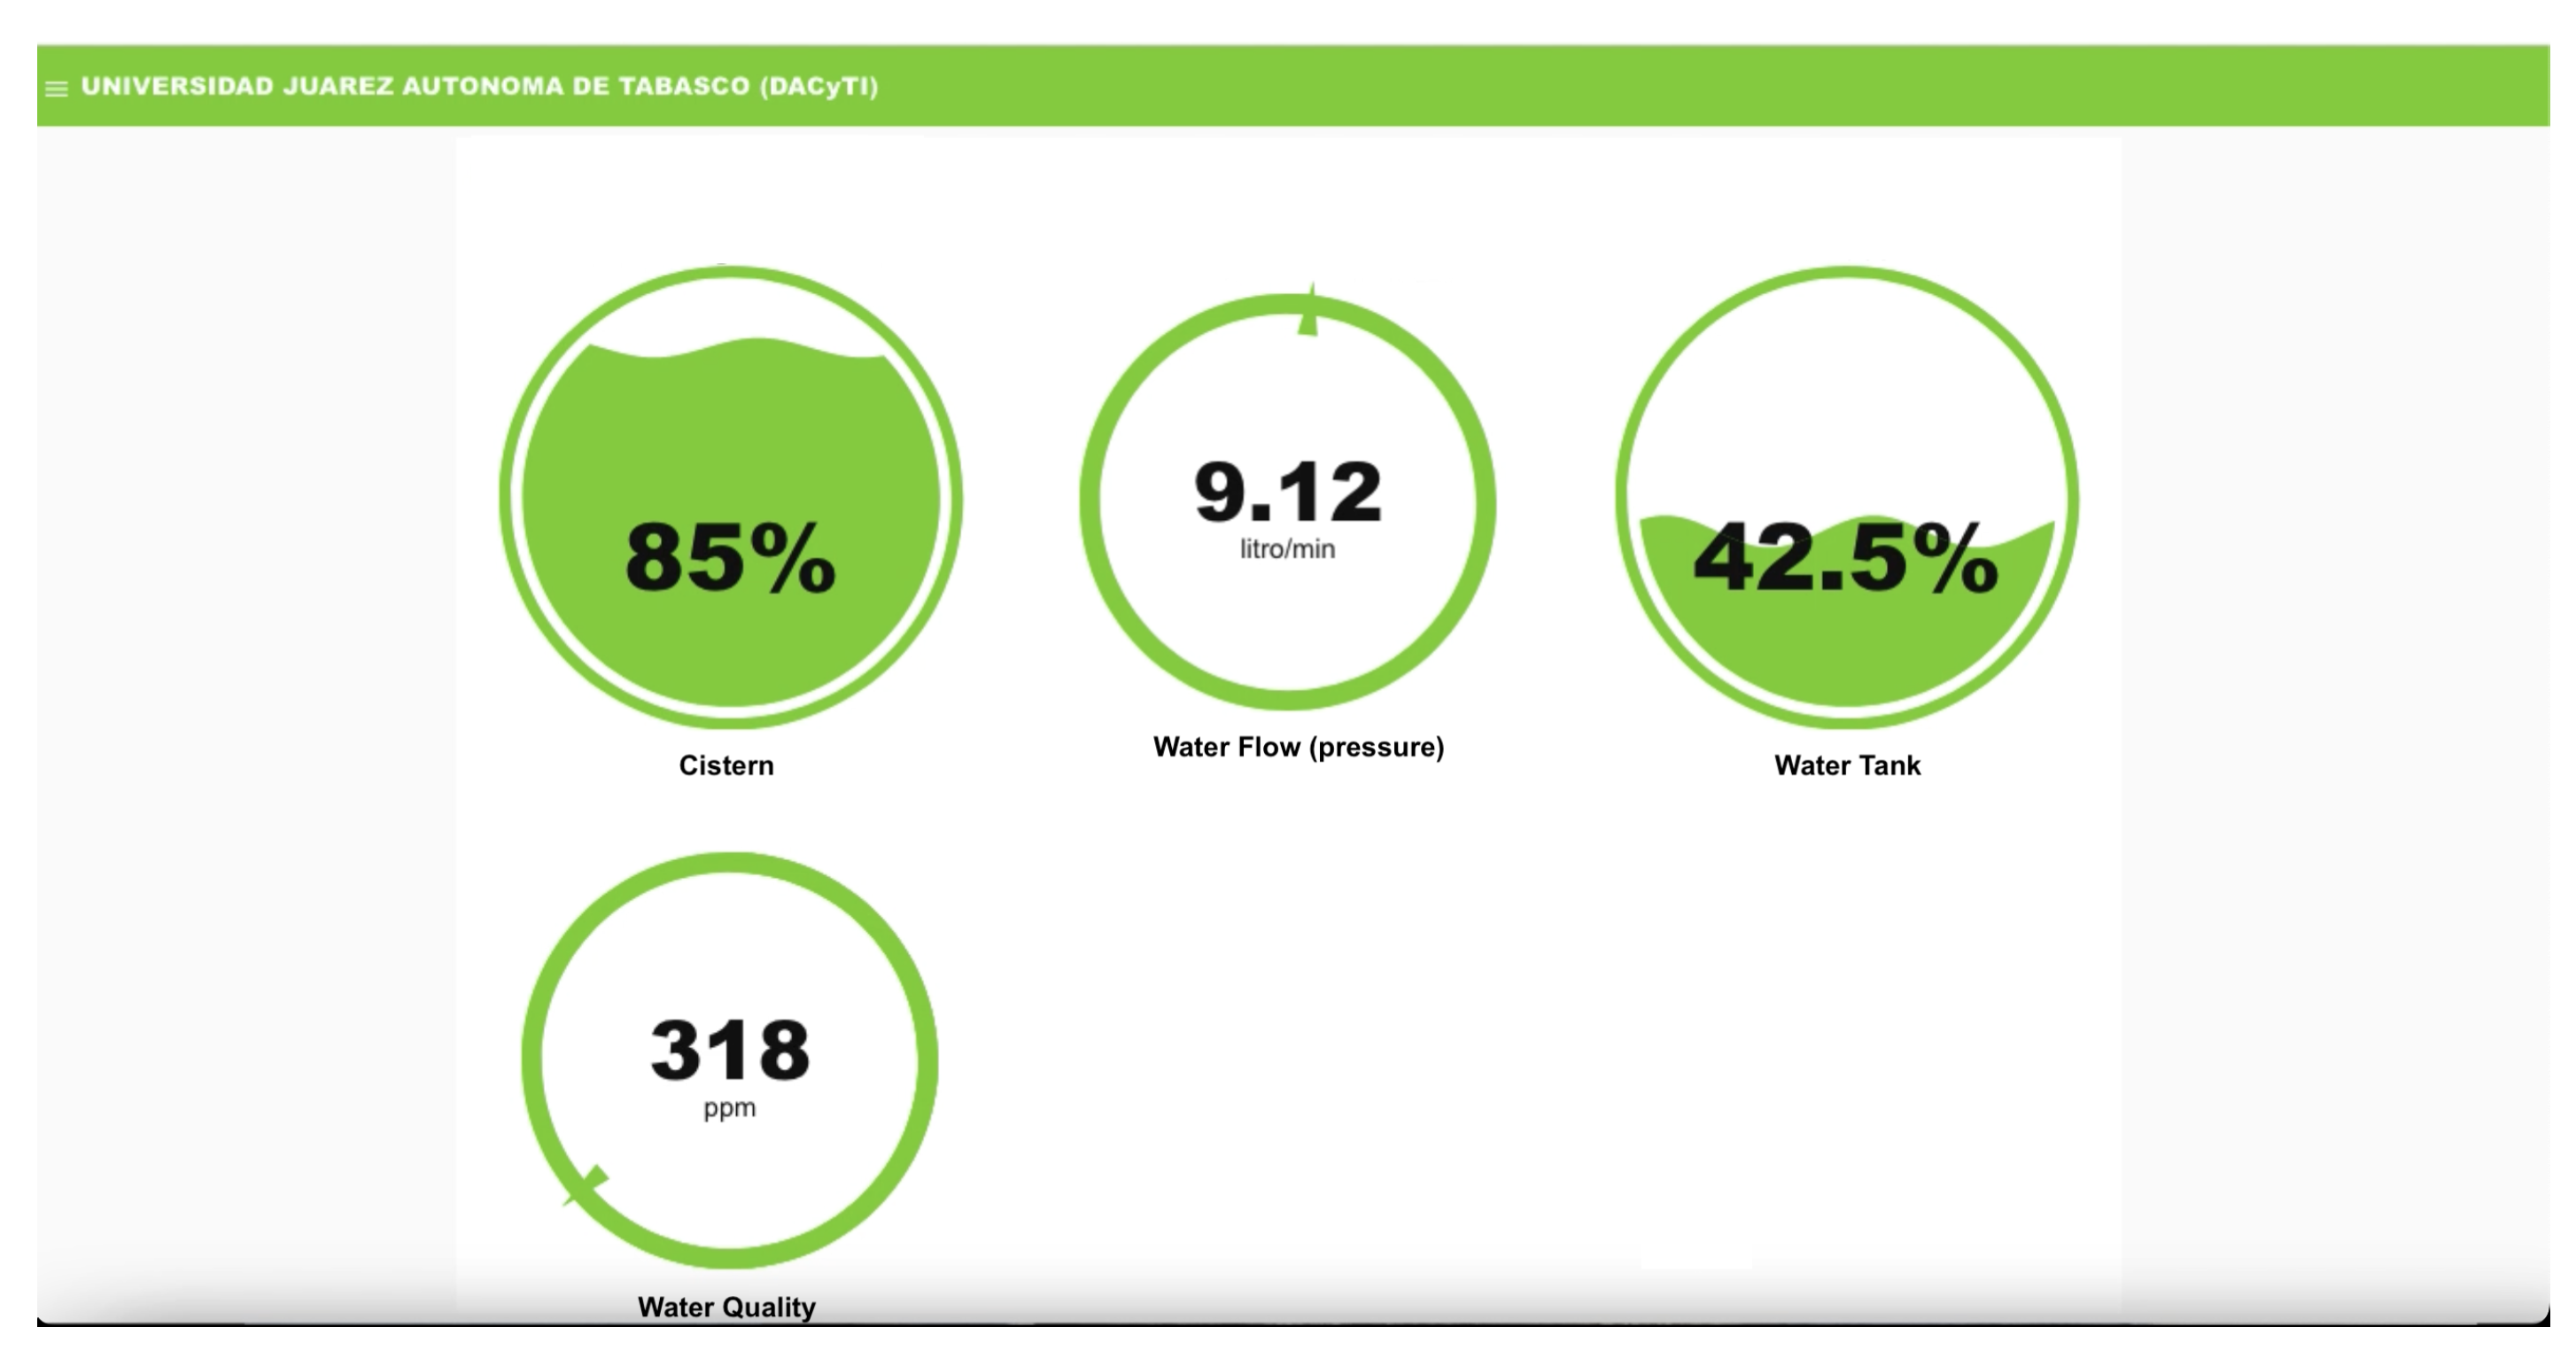
Figure 17 presents the dashboard with four gauges describing the water flow as at 9.12 liters/min, the cistern is at 85% capacity, the water tank is at 42.5% full, and the water quality is 318 ppm.
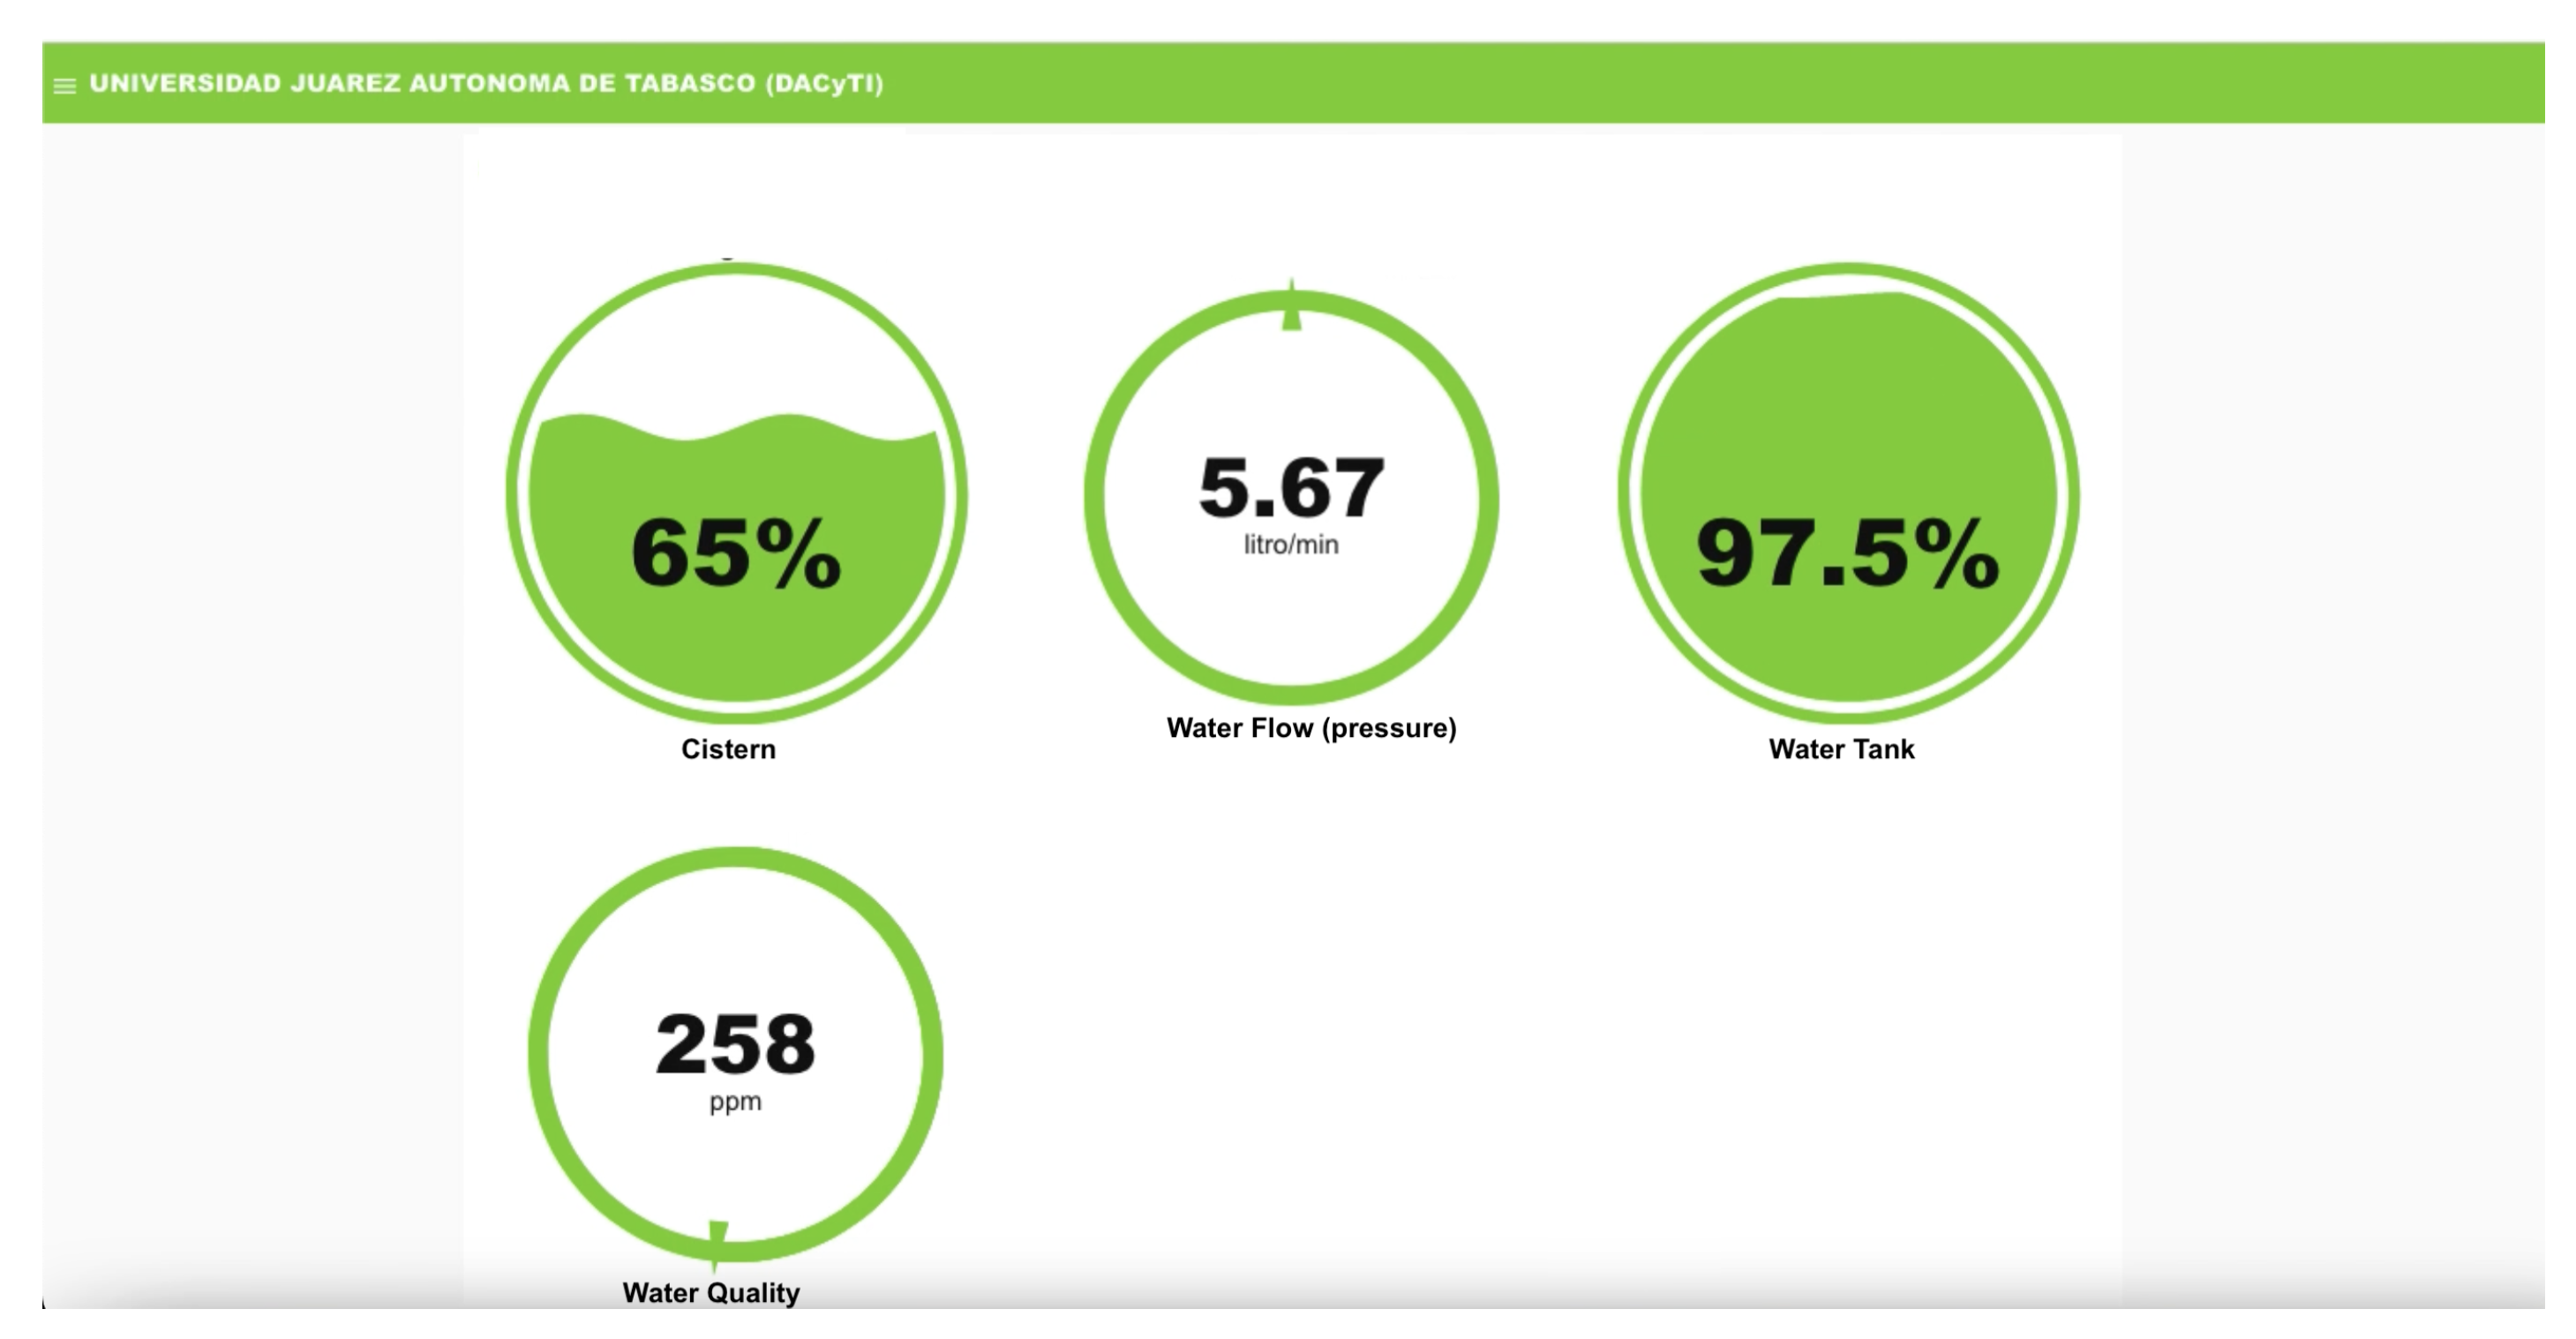
Another dashboard is shown in
Figure 18, where the water pressure is zero L/min. While the cistern is at 65% capacity, the water tank is at 42.5% full, and the water quality is 258 ppm.
The last dashboard in
Figure 19 depicts a gauge when the water pressure is zero L/min, the cistern is at 62.5% capacity, the water tank is at 47.5% full, and the water quality is 334 ppm.
4.3. Database and Graphs
While the water level in the cistern and tank is measured and monitored on the Internet, water flow is sensed, water quality is measured, and water is delivered by the submersible pump from the cistern to the tank. Everything that happens is also recorded in a database.
The output produced while monitoring water levels, water flow, water quality, and tank filling from the cistern is displayed on the dashboard and gauges, stored in a database, and plotted on graphs.
We used the InfluxDB database
4 to record data, which stores the data generated by sensors, storage, and retrieval of time series data in fields such as Internet of Things sensor data, application metrics, operations monitoring, and so on. This database stores open-source time series. Here are some graphical output views of the database generated during testing.
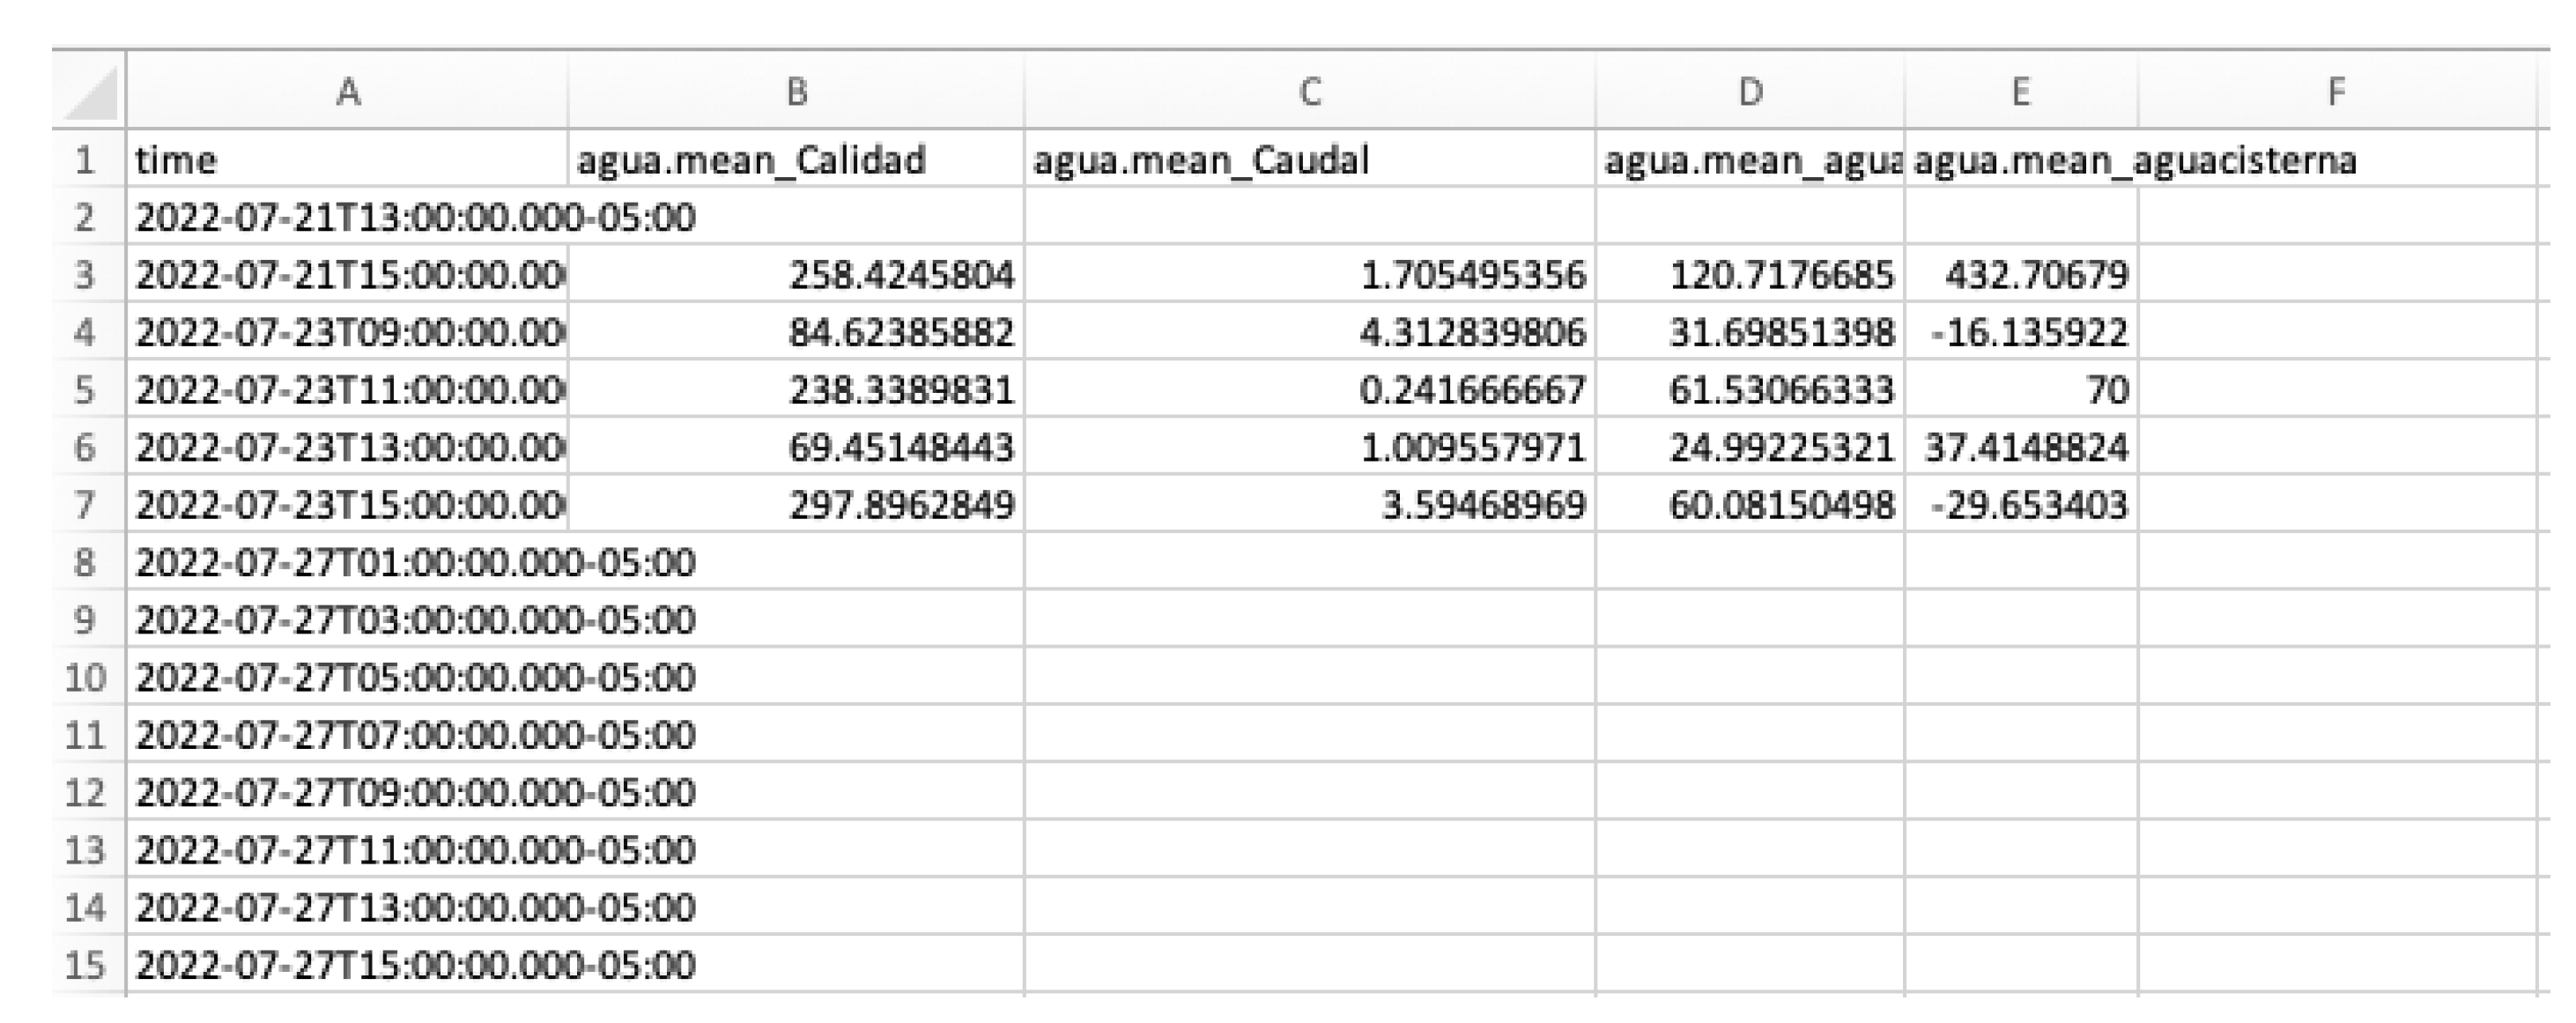
We have a database table that includes the four data variables recorded in the database generated during the run.
Below, we include an example of a table in which the four variables we recorded are stored in the database: Water quality, flow rate, water level in the tank, and water level in the cistern (see example in
Figure 20).
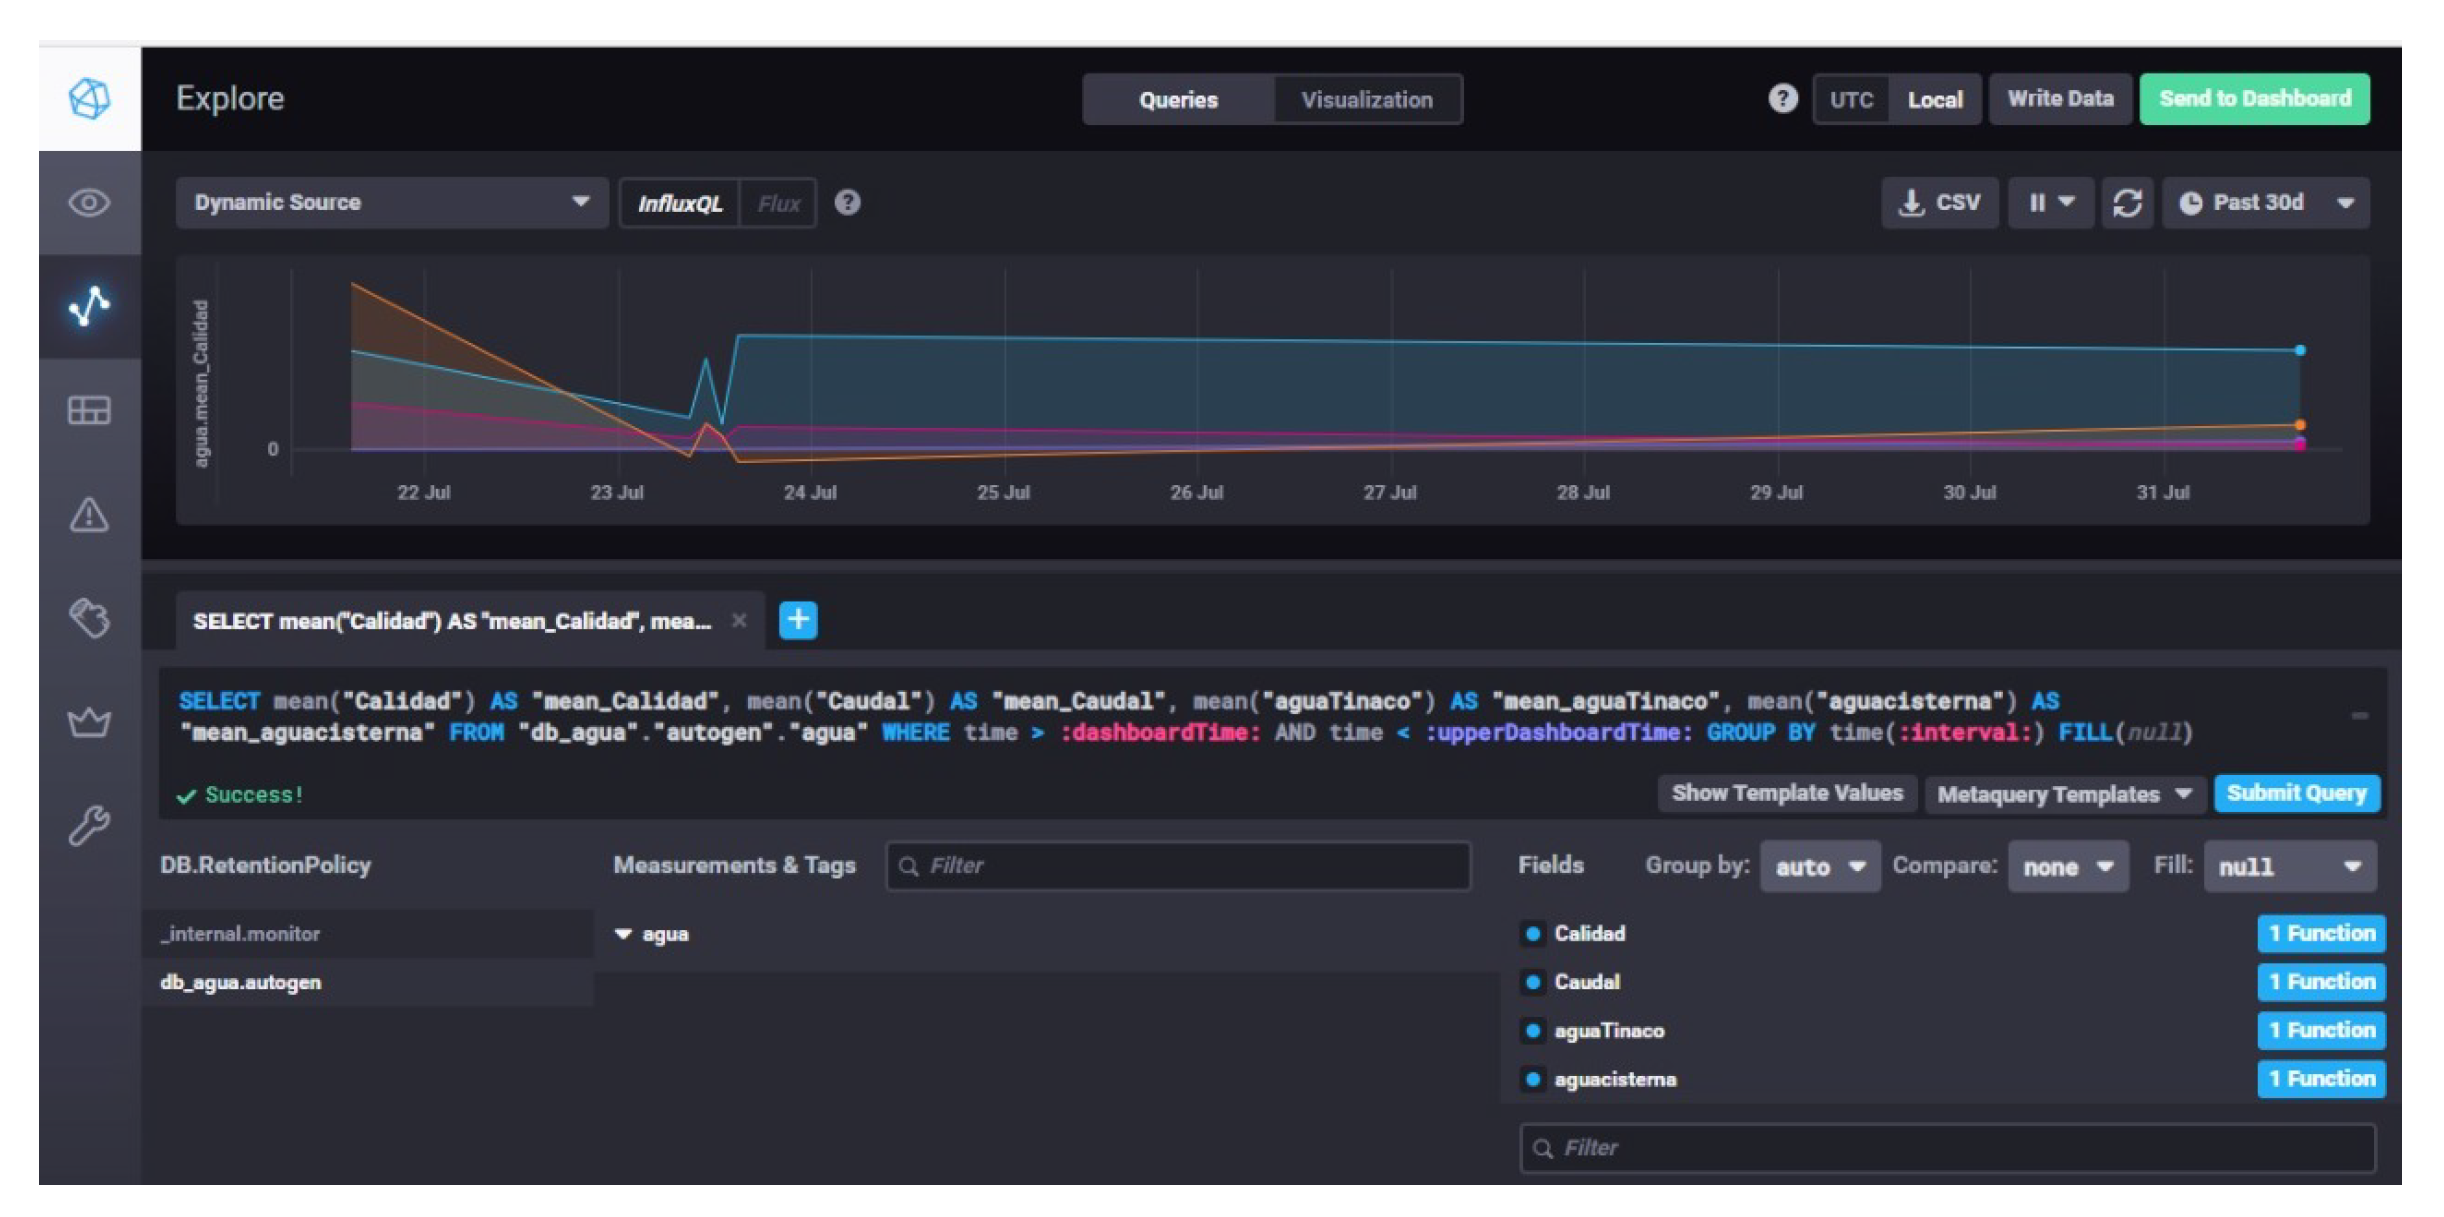
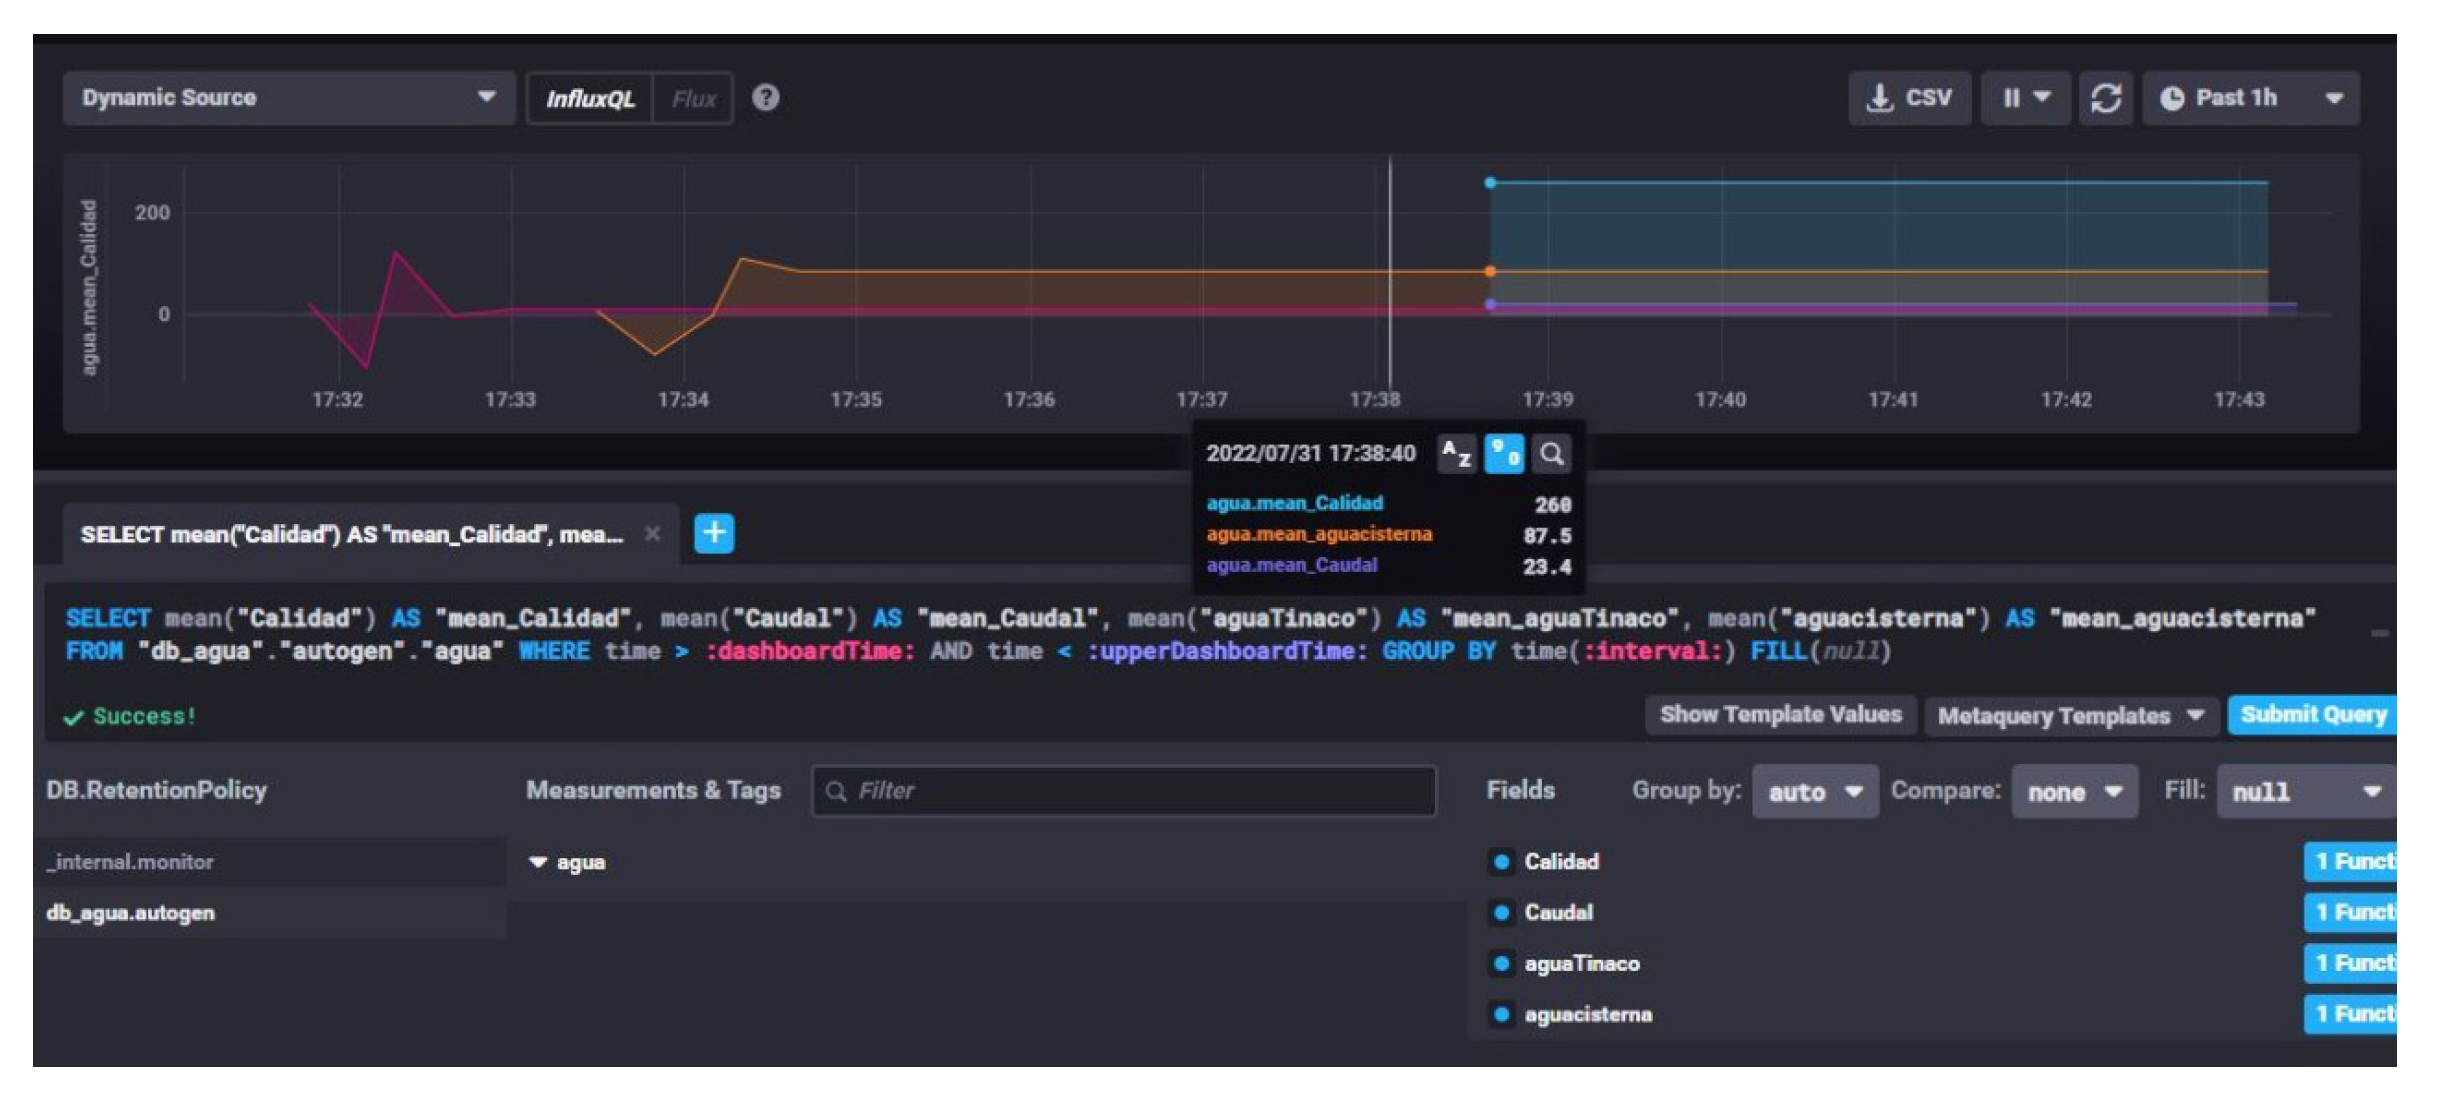
In the same way, we placed graphs of four variables: water quality, flow rate, tank water level, and cistern water level.
We plotted the data from the database and included the plot of some of the data recorded in the database, see
Figure 21,
Figure 22 and
Figure 23).
While outside the scope of this work, the usage of data processing for using machine learning tools, with more extensive and more extended data collection, it is possible to perform data analysis to identify trends and patterns that reveal essential clues and increase water use efficiency at the household level, which can be scaled up to a neighborhood or city.
5. Conclusions
The proposal describes using IoT devices as a possible method of creating a sensor network to monitor the flow of drinking water that reaches a house’s cistern, the water that rises to a tank by a submersible pump, and the water quality. This uses ultrasonic sensors to measure the water levels in the cistern and the tank.
As mentioned, we used a physical scale model to probe the concept and open-source tools using buckets to emulate the cistern and tank. We connected parts, microcontrollers, sensors, actuators, devices, programs, and computers. We ran the system to start the water’s leave flow while the monitoring was shown on the Internet. Also, everything was recorded in a database about what was happening with the water´s behavior. This proposed system can be considered an innovative, helpful, and efficient way of water use in households and to know the amount of water in the house on time to avoid unnecessary water waste.
Based on the results and test results, the system can work well for monitoring water levels in the cistern and tank, measuring water quality, sensing water flow, and rising water from the cistern to the tank.
We suggest introducing machine learning techniques to predict the house’s water consumption for future research and directions. Eventually, we could know if the house would run out of water due to lack of efficient use.
Author Contributions
Conceptualization: M.W., E.L., and A.A.; methodology: M.W., E.L., and A.A.; hardware and programming: M.W., and E.L.; writing—original draft preparation: M.W., and A.A.; writing—review and editing, M.W., E.L., A.A., P.P., and J.H. visualization, P.P., and J.H.; supervision, P.P., and J.H. All authors have read and agreed to the published version of the manuscript.
Funding
This research received no external funding.
Institutional Review Board Statement
Not applicable.
Informed Consent Statement
Not applicable.
Data Availability Statement
Not applicable.
Acknowledgments
Not applicable.
Conflicts of Interest
The author declares no conflict of interest.
Abbreviations
The following abbreviations are used in this manuscript:
| IoT |
Internet of Things |
| MQTT |
Message Queuing Telemetry Transport |
| ppm |
Parts per million |
| TDS |
Total Dissolved Solids |
Appendix A
Appendix A.1
The codes developed in this work can be found at the following addresses (accessed on September 18, 2024)
Source code for the ultrasonic sensor in the tank
Program for the configuration of the ultrasonic sensor used to measure the distance of the water surface in the tank concerning the sensor, the flow meter (water pressure) used to determine the flow of water entering the tank, the TDS sensor used to obtain values of the quality of the water stored in the tank, also the configuration of a submersible water pump together with the WIFI network and MQTT communication protocol configurations.
(watertankcode.ino)
Cistern sensor source code
In this code, the configuration of the ultrasonic sensor used to measure the distance of the water surface in the tank concerning the sensor is programmed, as well as the network configurations and the MQTT protocol.
(watercisterncode.ino)
Notes
| 1 |
MQTT stands for Message Queuing Telemetry Transport. It is a lightweight messaging protocol for use in cases where clients need a small code footprint, are connected to unreliable networks, or have limited bandwidth resources. |
| 2 |
For writing purposes, the micro-controller will be called micro. |
| 3 |
This sensor requires a PULL-UP resistor to be set since it generates interruptions. |
| 4 |
InfluxDB is an open-source time series database developed by the company InfluxData. InfluxDB manages all types of time series data in a single, purpose-built database ( https://www.influxdata.com/). |
References
- Jan, F.; Min-Allah, N.; Saeed, S.; Iqbal, S.Z.; Ahmed, R. IoT-based solutions to monitor water level, leakage, and motor control for smart water tanks. Water 2022, 14, 309. [Google Scholar] [CrossRef]
- Malche, T.; Maheshwary, P. Internet of things (IoT) based water level monitoring system for smart village. Proceedings of International Conference on Communication and Networks: ComNet 2016. Springer, 2017, pp. 305–312.
- Durga, S.N.; Ramakrishna, M.; Dayanandam, G. Autonomous water tank filling system using IoT. Int. J. Comput. Sci. Eng 2018, 6, 123–141. [Google Scholar] [CrossRef]
- Ali, H.; Choi, J.h. A Review of Underground Pipeline Leakage and Sinkhole Monitoring Methods Based on Wireless Sensor Networking. Sustainability 2019, 11. [Google Scholar] [CrossRef]
- Kurniawan, E.; Sularno, H.; SW, A.A.I.; others. Monitoring Water Levels in Fresh Water Tank Using The Concept of IoT (Internet of Think). PROSIDING POLITEKNIK ILMU PELAYARAN MAKASSAR 2020, 1, 120–126. [Google Scholar] [CrossRef]
- Jayalakshmi, S. IoT-enabled smart water tank monitoring system with android application control. i-manager’s Journal on Instrumentation and Control Engineering 2023, 11, 37. [Google Scholar] [CrossRef]
- Singh, H.K.H.; Kamaludin, H.; Hamid, I.R.A.; Safar, N.Z.M.; Abdullah, N. IoT-Based water tank level monitoring system using ultrasonic sensor. AIP Conference Proceedings 2023, 2608, 020009. [Google Scholar] [CrossRef]
- Zhukovskyy, V.; Printz, D.; Zhukovska, N.; Hubach, M.; Rajab, H. IoT based Intelligent Information-Analytical System Architecture for Water Tank Monitoring. 2021 International Conference on Information Technology (ICIT), 2021, pp. 924–928. [CrossRef]
- Cheng, W.Z.; Cheng, R.G.; Chou, S.Y. Power-saving for IoT-enabled water dispenser system. 2019 42nd International Conference on Telecommunications and Signal Processing (TSP). IEEE, 2019, pp. 736–739.
- Gunde, S.; Chikaraddi, A.; Baligar, V. IoT based flow control system using Raspberry PI. 2017 International Conference on Energy, Communication, Data Analytics and Soft Computing (ICECDS). IEEE, 2017, pp. 1386–1390.
- Monsef, H.; Naghashzadegan, M.; Farmani, R.; Jamali, A. Pressure management in water distribution systems in order to reduce energy consumption and background leakage. Journal of Water Supply: Research and Technology—AQUA 2018, 67, 397–403. [Google Scholar] [CrossRef]
- Yauri, R.; Rios, M.; Lezama, J. Water quality monitoring of Peruvian Amazon based in the Internet of Things. 2017 IEEE XXIV International Conference on Electronics, Electrical Engineering and Computing (INTERCON). IEEE, 2017, pp. 1–4.
- Jan, F.; Min-Allah, N.; Düştegör, D. Iot based smart water quality monitoring: Recent techniques, trends and challenges for domestic applications. Water 2021, 13, 1729. [Google Scholar] [CrossRef]
- Pujar, P.M.; Kenchannavar, H.H.; Kulkarni, U. Wireless sensor network based water monitoring systems: A survey. 2016 2nd International Conference on Applied and Theoretical Computing and Communication Technology (iCATccT). IEEE, 2016, pp. 155–159.
- Lambrou, T.P.; Anastasiou, C.C.; Panayiotou, C.G.; Polycarpou, M.M. A Low-Cost Sensor Network for Real-Time Monitoring and Contamination Detection in Drinking Water Distribution Systems. IEEE Sensors Journal 2014, 14, 2765–2772. [Google Scholar] [CrossRef]
- Irianto, K.D. Residential Water Tanks with IoT: A Solution for Household Water Consumption Monitoring. Asian Journal of Research in Computer Science 2022, 14, 238–247. [Google Scholar] [CrossRef]
- Zhukovskyy, V.; Printz, D.; Zhukovska, N. Human-Computer Interaction in IoT System for Water Tank Monitoring and Controlling. 2023 IEEE 18th International Conference on Computer Science and Information Technologies (CSIT), 2023, pp. 1–5. [CrossRef]
Figure 1.
Real-time Monitoring of Water Architecture. (a) Half-full cistern level and half-full water tank level, (b) Half-full cistern level and almost empty water tank level, and (c) Full cistern level and full water tank level.
Figure 1.
Real-time Monitoring of Water Architecture. (a) Half-full cistern level and half-full water tank level, (b) Half-full cistern level and almost empty water tank level, and (c) Full cistern level and full water tank level.
Figure 2.
General Scheme of the Water Monitoring System.
Figure 2.
General Scheme of the Water Monitoring System.
Figure 3.
a) Water level sensors (Ultrasonic Sensor JSN-SR04T-2.0). b) Water Flow Sensor (Flow meter YF-SF01 3/4" Hall Effect).
Figure 3.
a) Water level sensors (Ultrasonic Sensor JSN-SR04T-2.0). b) Water Flow Sensor (Flow meter YF-SF01 3/4" Hall Effect).
Figure 4.
a) Water Quality Sensor (TDS Meter V1.0). b) Submersible Water Pump 70-120L/H
Figure 4.
a) Water Quality Sensor (TDS Meter V1.0). b) Submersible Water Pump 70-120L/H
Figure 5.
a) WeMos D1 mini ESP8266 WiFi. b) NodeMCU v2 ESP8266 WiFi.
Figure 5.
a) WeMos D1 mini ESP8266 WiFi. b) NodeMCU v2 ESP8266 WiFi.
Figure 6.
a) Raspberry Pi 4 Model-B 8GB RAM. b) Relay module. 5V DC SRD-5VDC-SL-C.
Figure 6.
a) Raspberry Pi 4 Model-B 8GB RAM. b) Relay module. 5V DC SRD-5VDC-SL-C.
Figure 7.
Descriptive Scheme of the proposal.
Figure 7.
Descriptive Scheme of the proposal.
Figure 8.
General architecture..
Figure 8.
General architecture..
Figure 9.
Node-RED programming code for the Dashboard, where all sensors and actuators are connected for visualizing on the Internet.
Figure 9.
Node-RED programming code for the Dashboard, where all sensors and actuators are connected for visualizing on the Internet.
Figure 10.
Tank sensor node electronic circuit diagram.
Figure 10.
Tank sensor node electronic circuit diagram.
Figure 11.
Node-RED programming code for the Dashboard, where all sensors and actuators are connected for visualizing on the Internet.
Figure 11.
Node-RED programming code for the Dashboard, where all sensors and actuators are connected for visualizing on the Internet.
Figure 12.
a) Water tank level sensor circuit. b) Cistern level sensor, water quality, and submersible pump circuit.
Figure 12.
a) Water tank level sensor circuit. b) Cistern level sensor, water quality, and submersible pump circuit.
Figure 13.
a) Scale model water tank. b) Scale model cistern.
Figure 13.
a) Scale model water tank. b) Scale model cistern.
Figure 14.
Dashboard shows when the water pressure is zero L/min.
Figure 14.
Dashboard shows when the water pressure is zero L/min.
Figure 15.
System indicating when the water pressure is 15.99 L/min.
Figure 15.
System indicating when the water pressure is 15.99 L/min.
Figure 16.
System indicates when the tank is 97% full.
Figure 16.
System indicates when the tank is 97% full.
Figure 17.
System indicates the cistern is 85% full.
Figure 17.
System indicates the cistern is 85% full.
Figure 18.
System indicates when the water quality is 258 ppm.
Figure 18.
System indicates when the water quality is 258 ppm.
Figure 19.
System indicates when the water quality is 334 ppm.
Figure 19.
System indicates when the water quality is 334 ppm.
Figure 20.
Database output. Values about water quality, flow rate, and water level in the tank and cistern.
Figure 20.
Database output. Values about water quality, flow rate, and water level in the tank and cistern.
Figure 21.
Graphing the database. Here, values about water quality, flow rate, water level in the tank, and the cistern are deployed.
Figure 21.
Graphing the database. Here, values about water quality, flow rate, water level in the tank, and the cistern are deployed.
Figure 22.
Graphing the database. This table deploys values about water quality, flow rate, the water level in the tank, and the cistern.
Figure 22.
Graphing the database. This table deploys values about water quality, flow rate, the water level in the tank, and the cistern.
Figure 23.
Graphing the database. As in previous tables, shows values about water quality, flow rate, water level in the water tank, and the cistern.
Figure 23.
Graphing the database. As in previous tables, shows values about water quality, flow rate, water level in the water tank, and the cistern.
Table 1.
Materials and equipment used in the proposal. Some elements are software, and others are hardware.
Table 1.
Materials and equipment used in the proposal. Some elements are software, and others are hardware.
| Items and brief details |
|---|
| 2 Water Level Sensors (Ultrasonic Sensor JSN-SR04T-2.0) |
| 1 Water Flow Sensor (Flow meter YF-SF01 3/4" Hall Effect) |
| 1 Water Quality Sensor (TDS Meter V1.0) |
| 1 Submersible Water Pump 70-120L/H |
| 1 Raspberry Pi 4 Model-B 8GB RAM Raspbian bulleye version |
| 1 WeMos D1 mini ESP8266 WiFi |
| 1 Relay 5V DC SRD-5VDC-SL-C |
| 1 NodeMCU v2 ESP8266 WiFi |
| 1 Case with fan for Raspberry Pi 4 |
| 2 Protoboards |
| 1 MicroSD XDHC 32GB class 10 |
| 1 MicroSD USB adapter |
| 1 9v battery |
| 1 WiFi Access Point |
| 1 Laptop |
| MM and MF jumpers |
| Modem Software |
| Node-RED |
| Arduino IDE |
| Node JS |
| Mosquitto MQTT |
| Database: Influxdb |
|
Disclaimer/Publisher’s Note: The statements, opinions and data contained in all publications are solely those of the individual author(s) and contributor(s) and not of MDPI and/or the editor(s). MDPI and/or the editor(s) disclaim responsibility for any injury to people or property resulting from any ideas, methods, instructions or products referred to in the content. |
© 2024 by the authors. Licensee MDPI, Basel, Switzerland. This article is an open access article distributed under the terms and conditions of the Creative Commons Attribution (CC BY) license (http://creativecommons.org/licenses/by/4.0/).

