Introduction: Setting and Question
Computer-Based Test (CBT) is widely used across the globe today for various forms of assessments due to its advantages over the traditional Paper-Based Test (PBT). Among the identified benefits in literature are ease of administration, prompt scoring, reduced costs of test production and reduction of exam malpractices (Bodman & Robinson, 2004; Cantillon, Irish & Sales 2004; Ogunmakin & Osakuade; 2014). Its tendency to offer high reliability, easy and quick marking, coupled with ease of adaptation to meet a wide range of learning outcomes, is seen as a great importance (CAAC, Leceister; n.d).
There is growing empirical evidence that computer self-efficacy can influence students’ performance in a Computer-Based Test. Arenyeka (2012) opined that the low computer proficiency of Nigerian students is responsible for the apprehensions and anxieties over CBT introduction in assessment at various levels. Nigerian students’ low computer literacy level has also been identified as a factor that would deny them the ability to function effectively in CBT (Dangut & Sakiyo, n.d.).
Terzis et.al (2011) proposed a new model called the Computer Based Assessment Acceptance Model (CBAAM) which identified some of the possible variables that could influence a user’s intention to use CBT in the future. These include Perceived Ease of Use, Perceived Usefulness, Computer Self-Efficacy, Social Influence, Facilitating Conditions, Goal Expectancy, Content, and Perceived Playfulness. The increased demand for CBT especially during the pandemic coupled with the possible impacts of gender, Computer Self-Efficacy and Ease of Use on CBT usage has inspired us to pursue this mini research. Our research will answer three research questions:
Is the intention to use CBT in the future associated with its ease of use?
What is the association when controlling for gender, computer self-efficacy, and experience?
How does that differ between new and old users?
These questions will enable us to determine the relationship between the variables among the various categories of students. They are interesting to us because CBT is becoming inevitable for Nigerian students even though many students in primary and secondary schools do not have access to computer systems and therefore have low levels of computer literacy and self-efficacy. It would be interesting to see the impacts of computer self-efficacy, ease of use, gender and use experience on the future intention to use CBT in this population.
Our Data
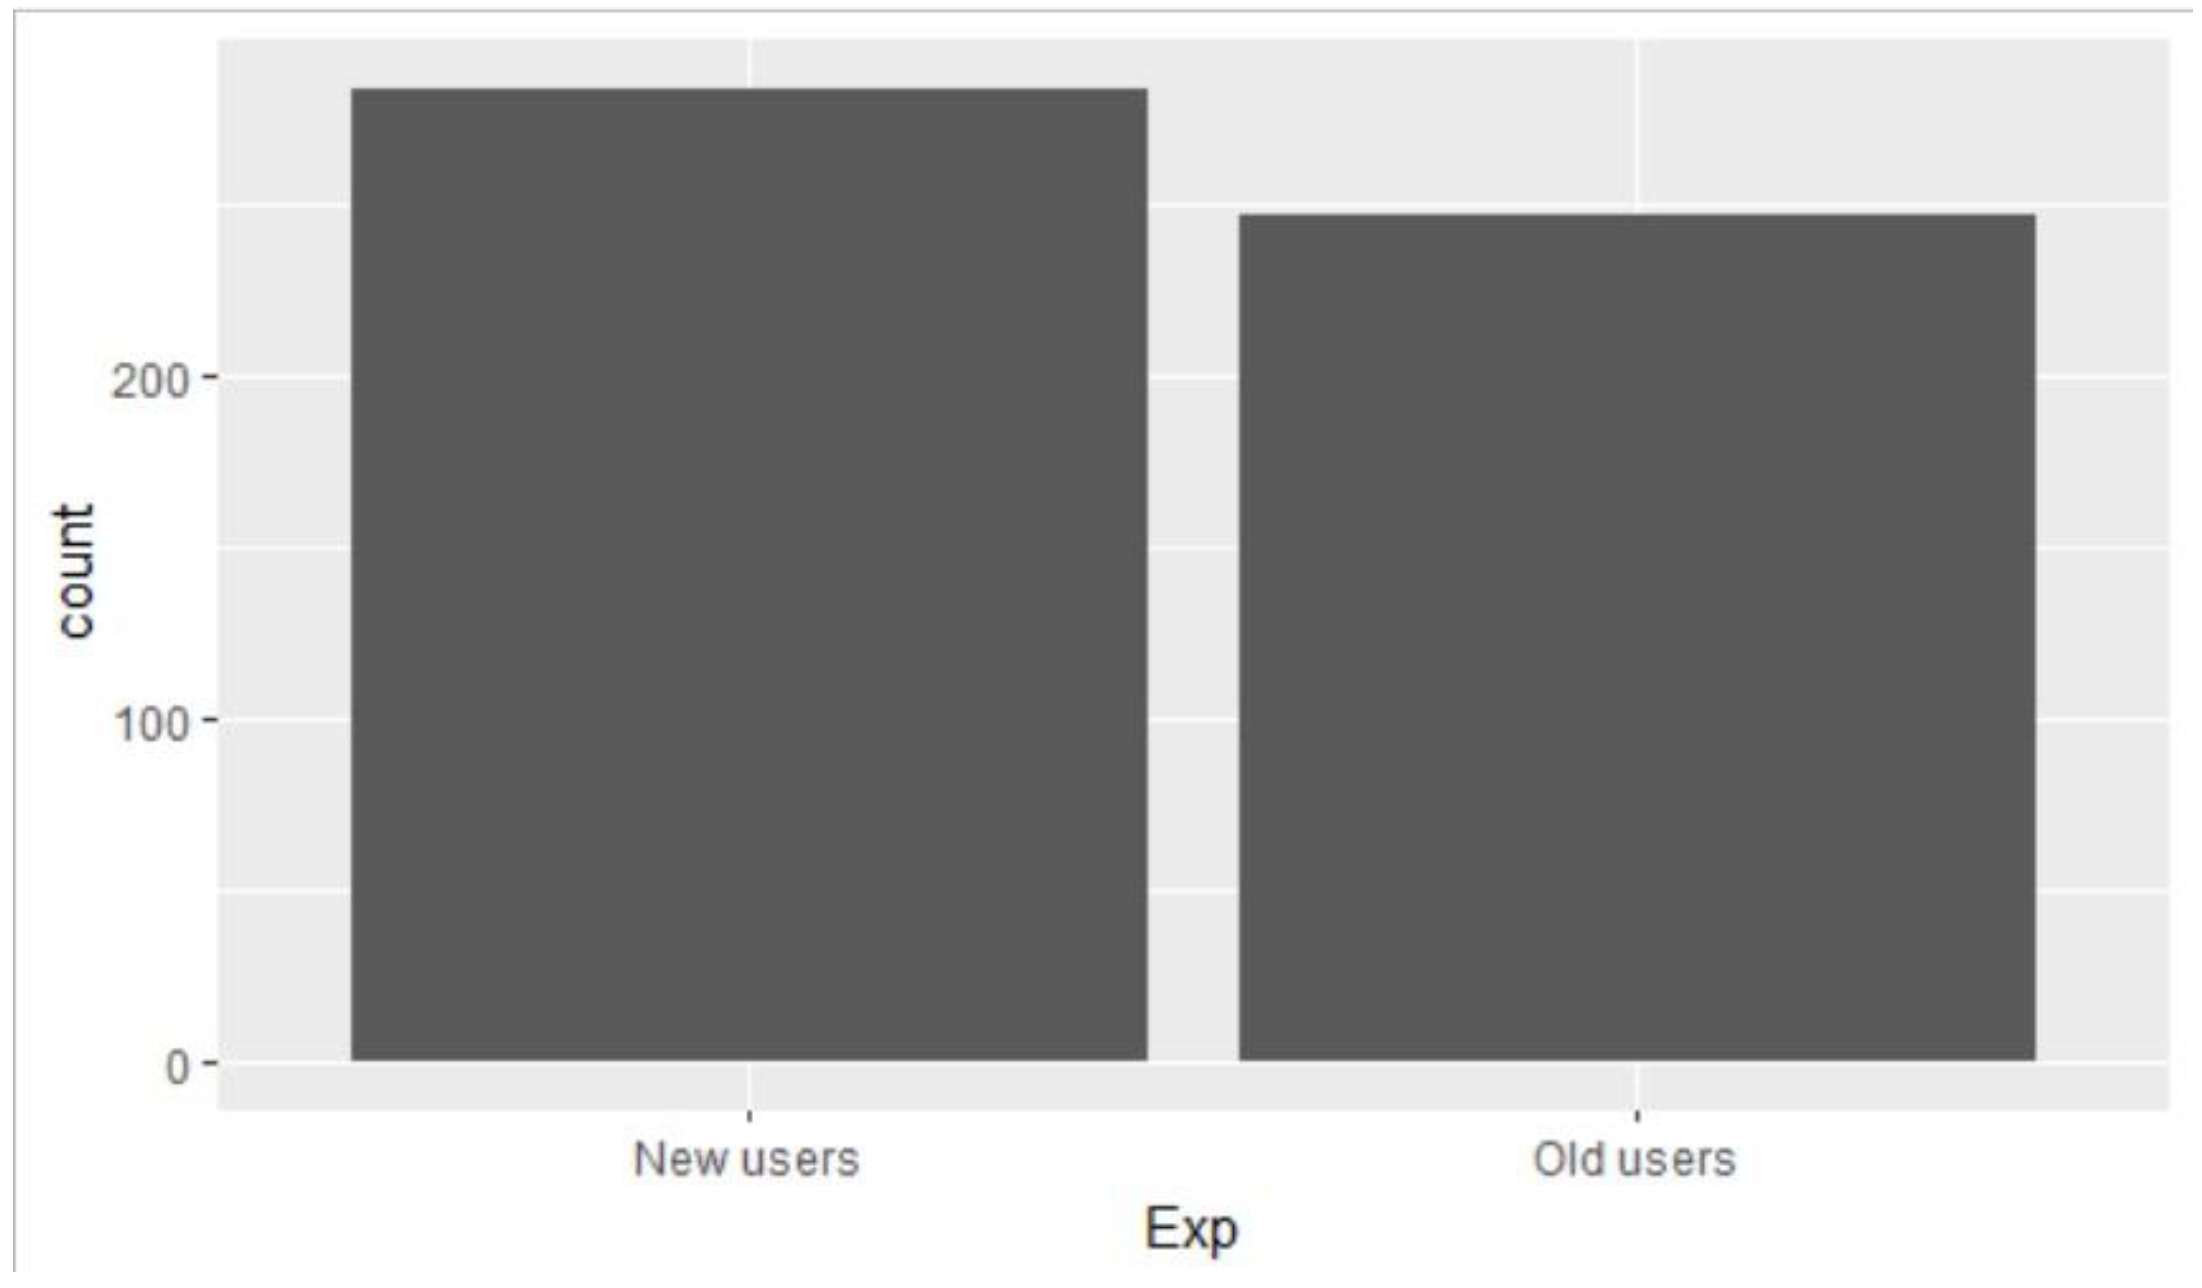
Our sample consists of students of Ferscoat Comprehensive Academy who were purposively selected because the school is the only school in Lagos, known to the researcher, to have consistently deployed CBT for entrance tests and some in-school assessments as at the time of this research. A total of 531 students, 259 males, and 272 females, took part in the study from which our dataset was obtained. Some of these participants are new users of CBT who are using it for the first time while others are returning users and have used it more than once. They responded to a questionnaire using a Four-Likert scale (Strongly Disagree - SD, Disagree - D, Agree - A & Strongly Agree -SA).
| Ease |
Proportion |
Gender |
Proportion |
Use Experience |
Proportion |
| Relatively Easy |
475
(89.5%) |
Male |
259
(48.8%)
|
New Users |
284
(53.5%) |
| Relatively Hard |
56
(10.5%) |
Female |
272
(51.2%) |
Old Users |
247
(46.5%) |
| Total |
531 (100%) |
Total |
531 (100%) |
Total |
531(100%) |
Our variables of interest are:
Future intention to use (FI_pct) - outcome variable (Continuous).
CBT ease of use (Ease) - main predictor (Categorical).
Computer Self-efficacy (CSE_pct) - control variable (Continuous).
Gender (GENDER), Male & Female - control variable (Categorical).
User experience (Exp), new & old users - control variable (Categorical).
We included these controls to improve the precision of our results and ensure that our findings were not due to these other factors which may also influence future intention to use CBT. The interaction between ease of use and computer self-efficacy were also included in our third model to see if their interaction has a significant effect on future intention to use CBT. Also, we dichotomized the CBT ease-of-use to relatively hard (SD & D) and relatively easy (SA & A). Also, the future intention to use and Computer Self-efficacy variables were changed to numeric and re-scaled (FI_pct and CSE_pct). Our population model is:
We created three models:
Linear Regression of Future Intention to use (Future Intention_pct) on Ease of use.
Multiple Regression of Future Intention to use (Future Intention_pct) on Ease of use while controlling for Computer Self-efficacy, gender, and user experience.
Multiple Regression of Future Intention to use (Future Intention_pct) on the interaction of Ease of use and Computer Self-efficacy while controlling for gender and user experience (old & new users).
Results
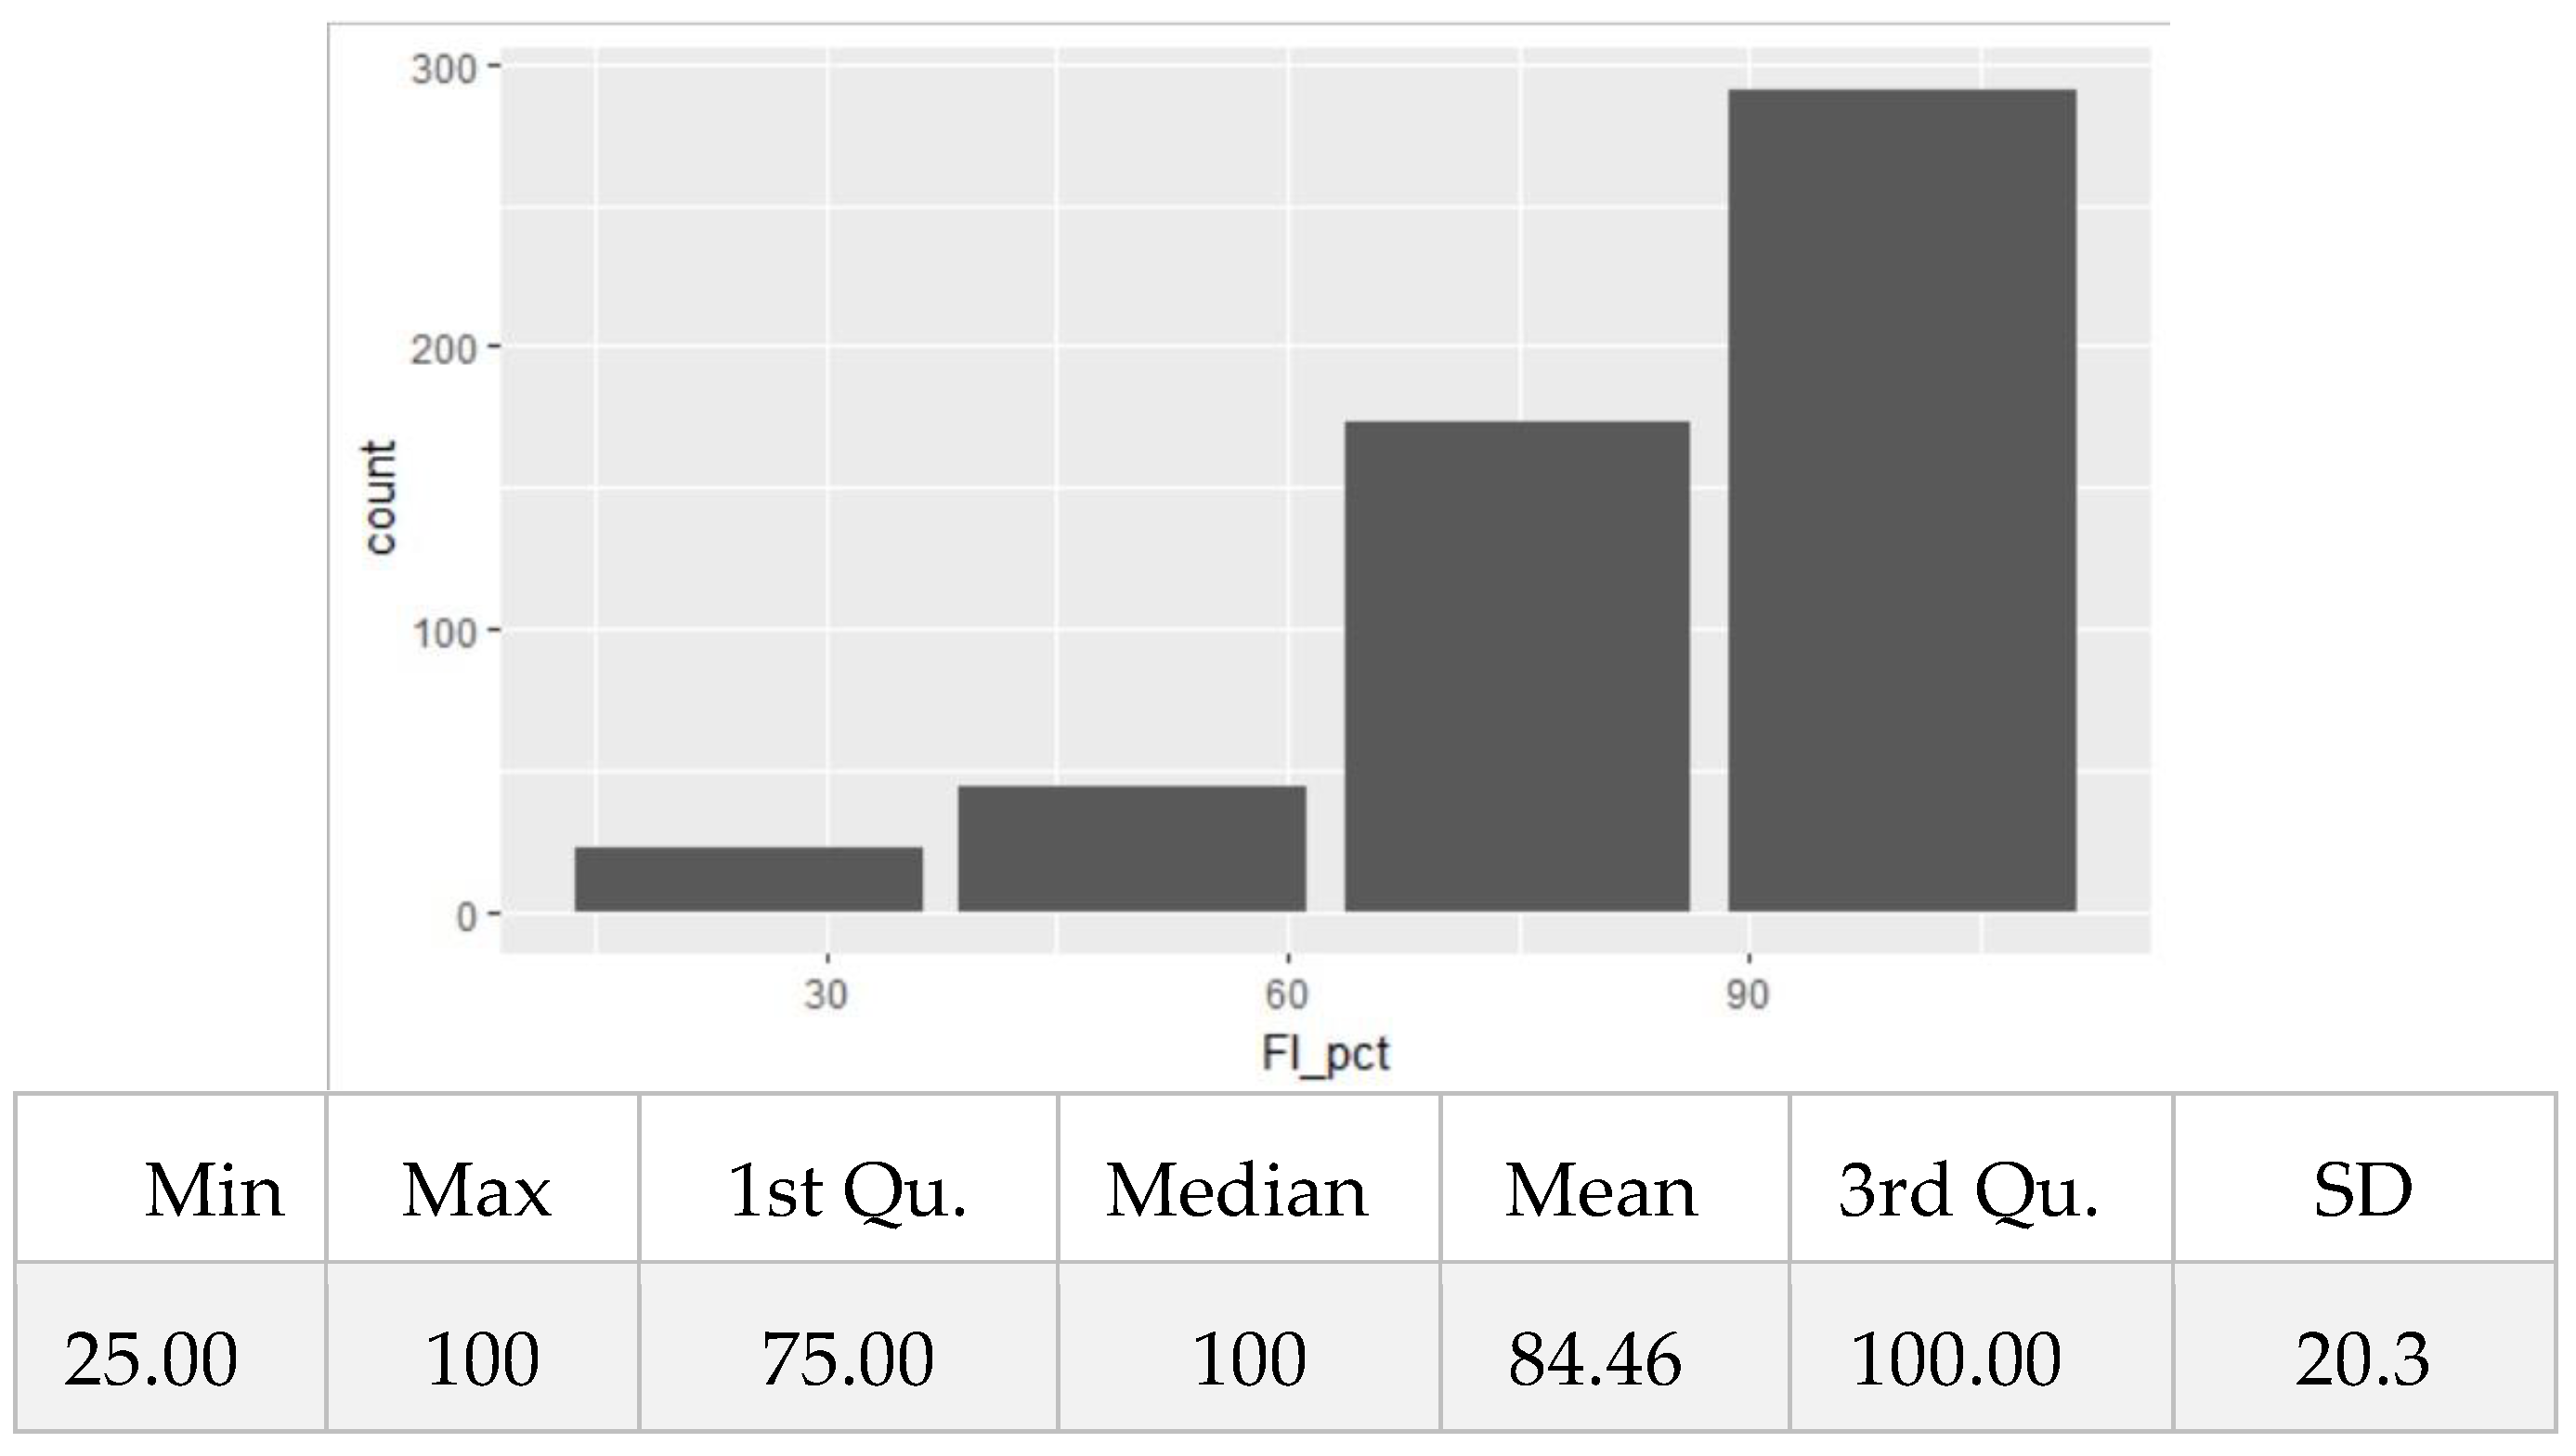
Univariate distribution: The average value of the future intention to use CBT for the students of Ferscoat Schools, Lagos, is 84.46 with a standard deviation of 20.3. As the skewness is -1.27, the distribution is left-skewed (see
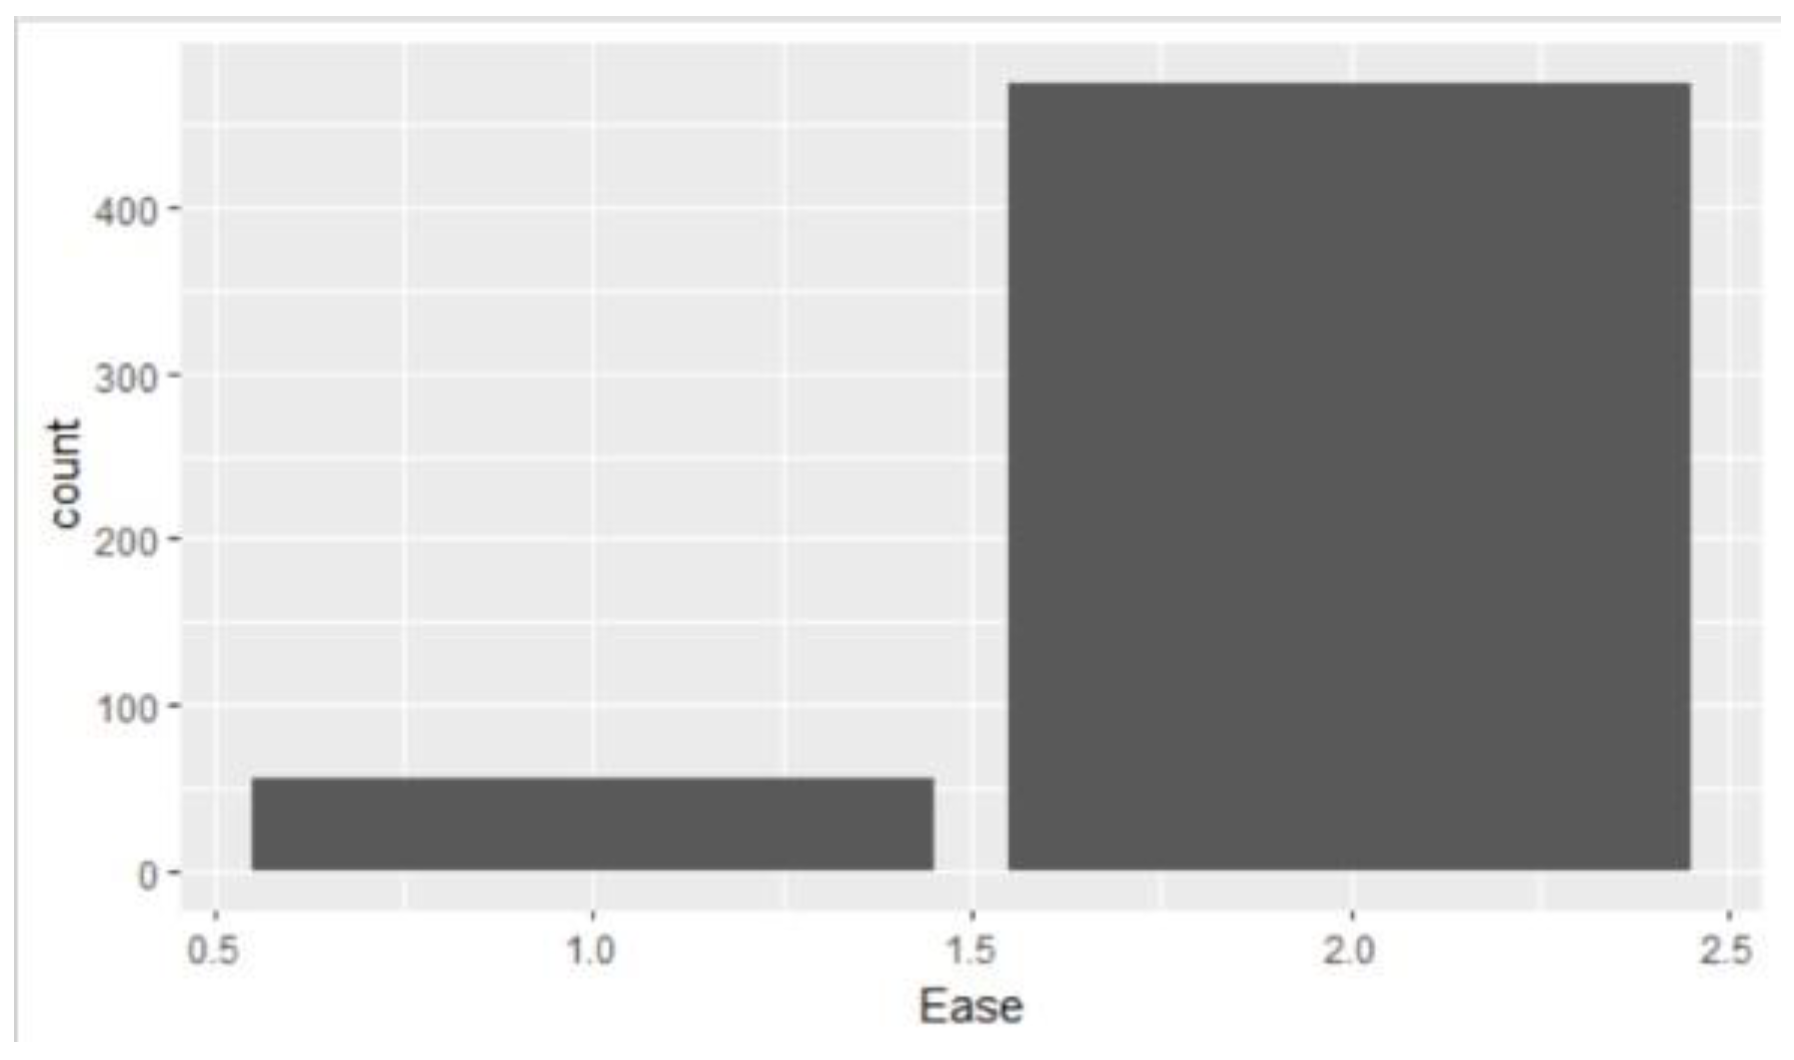
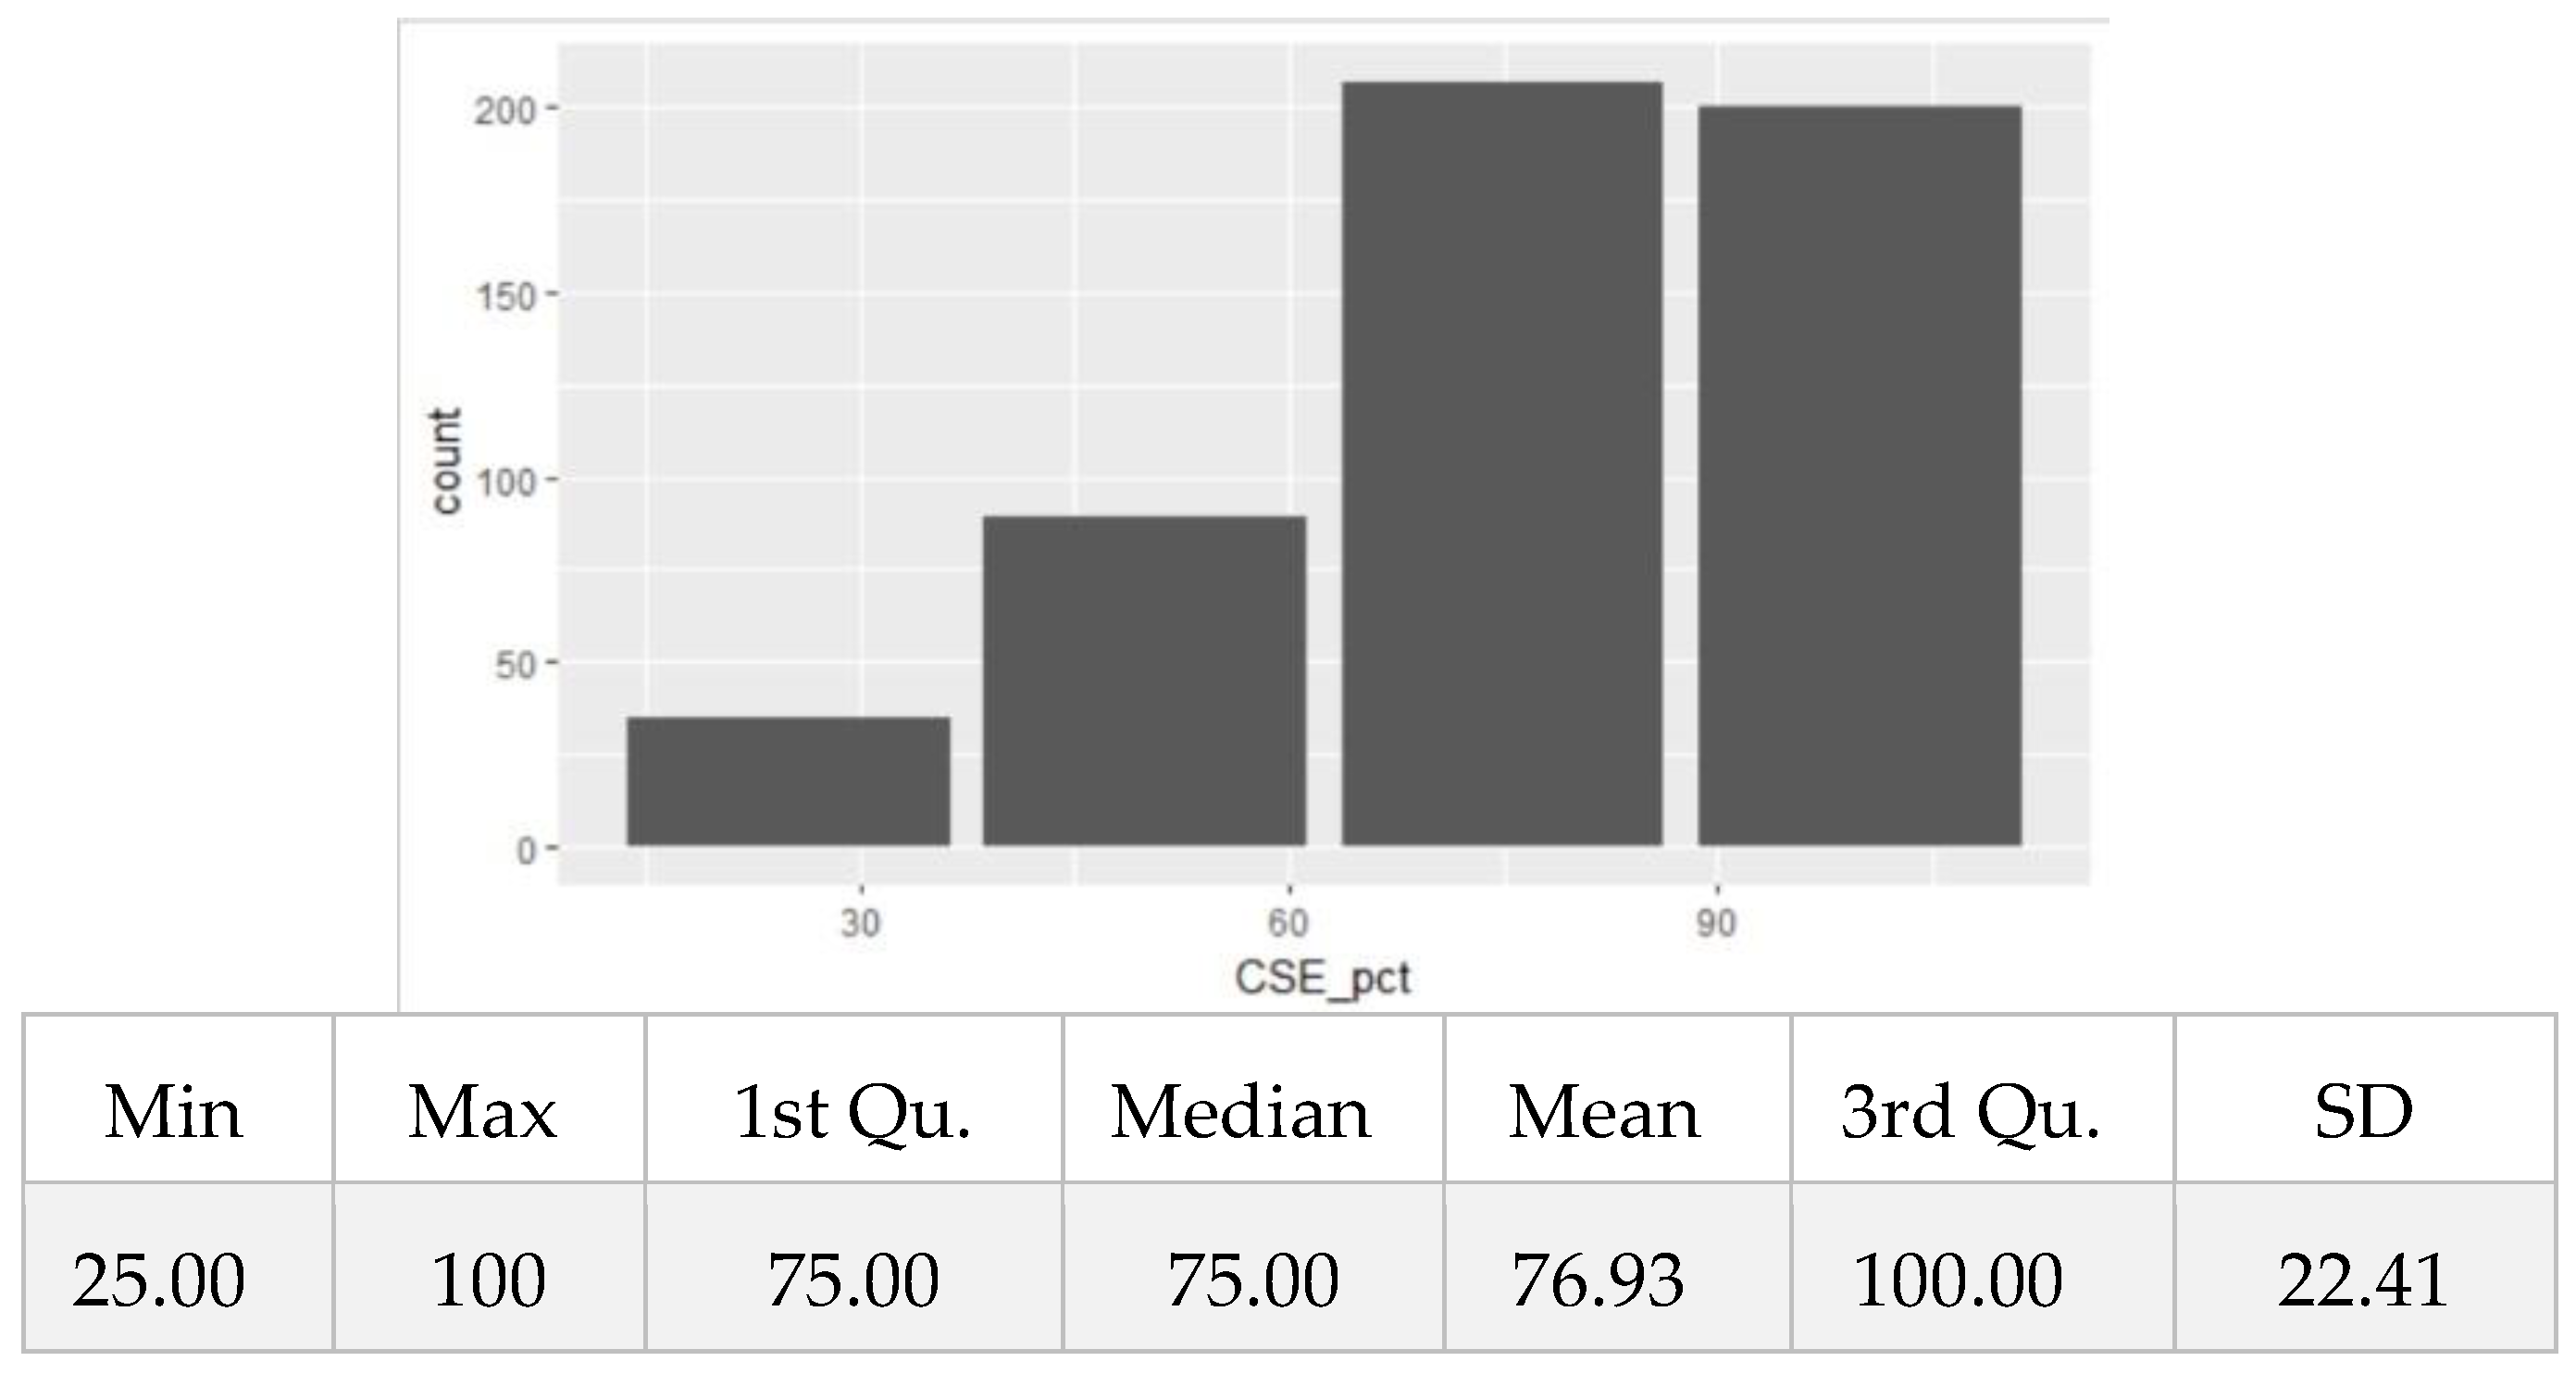
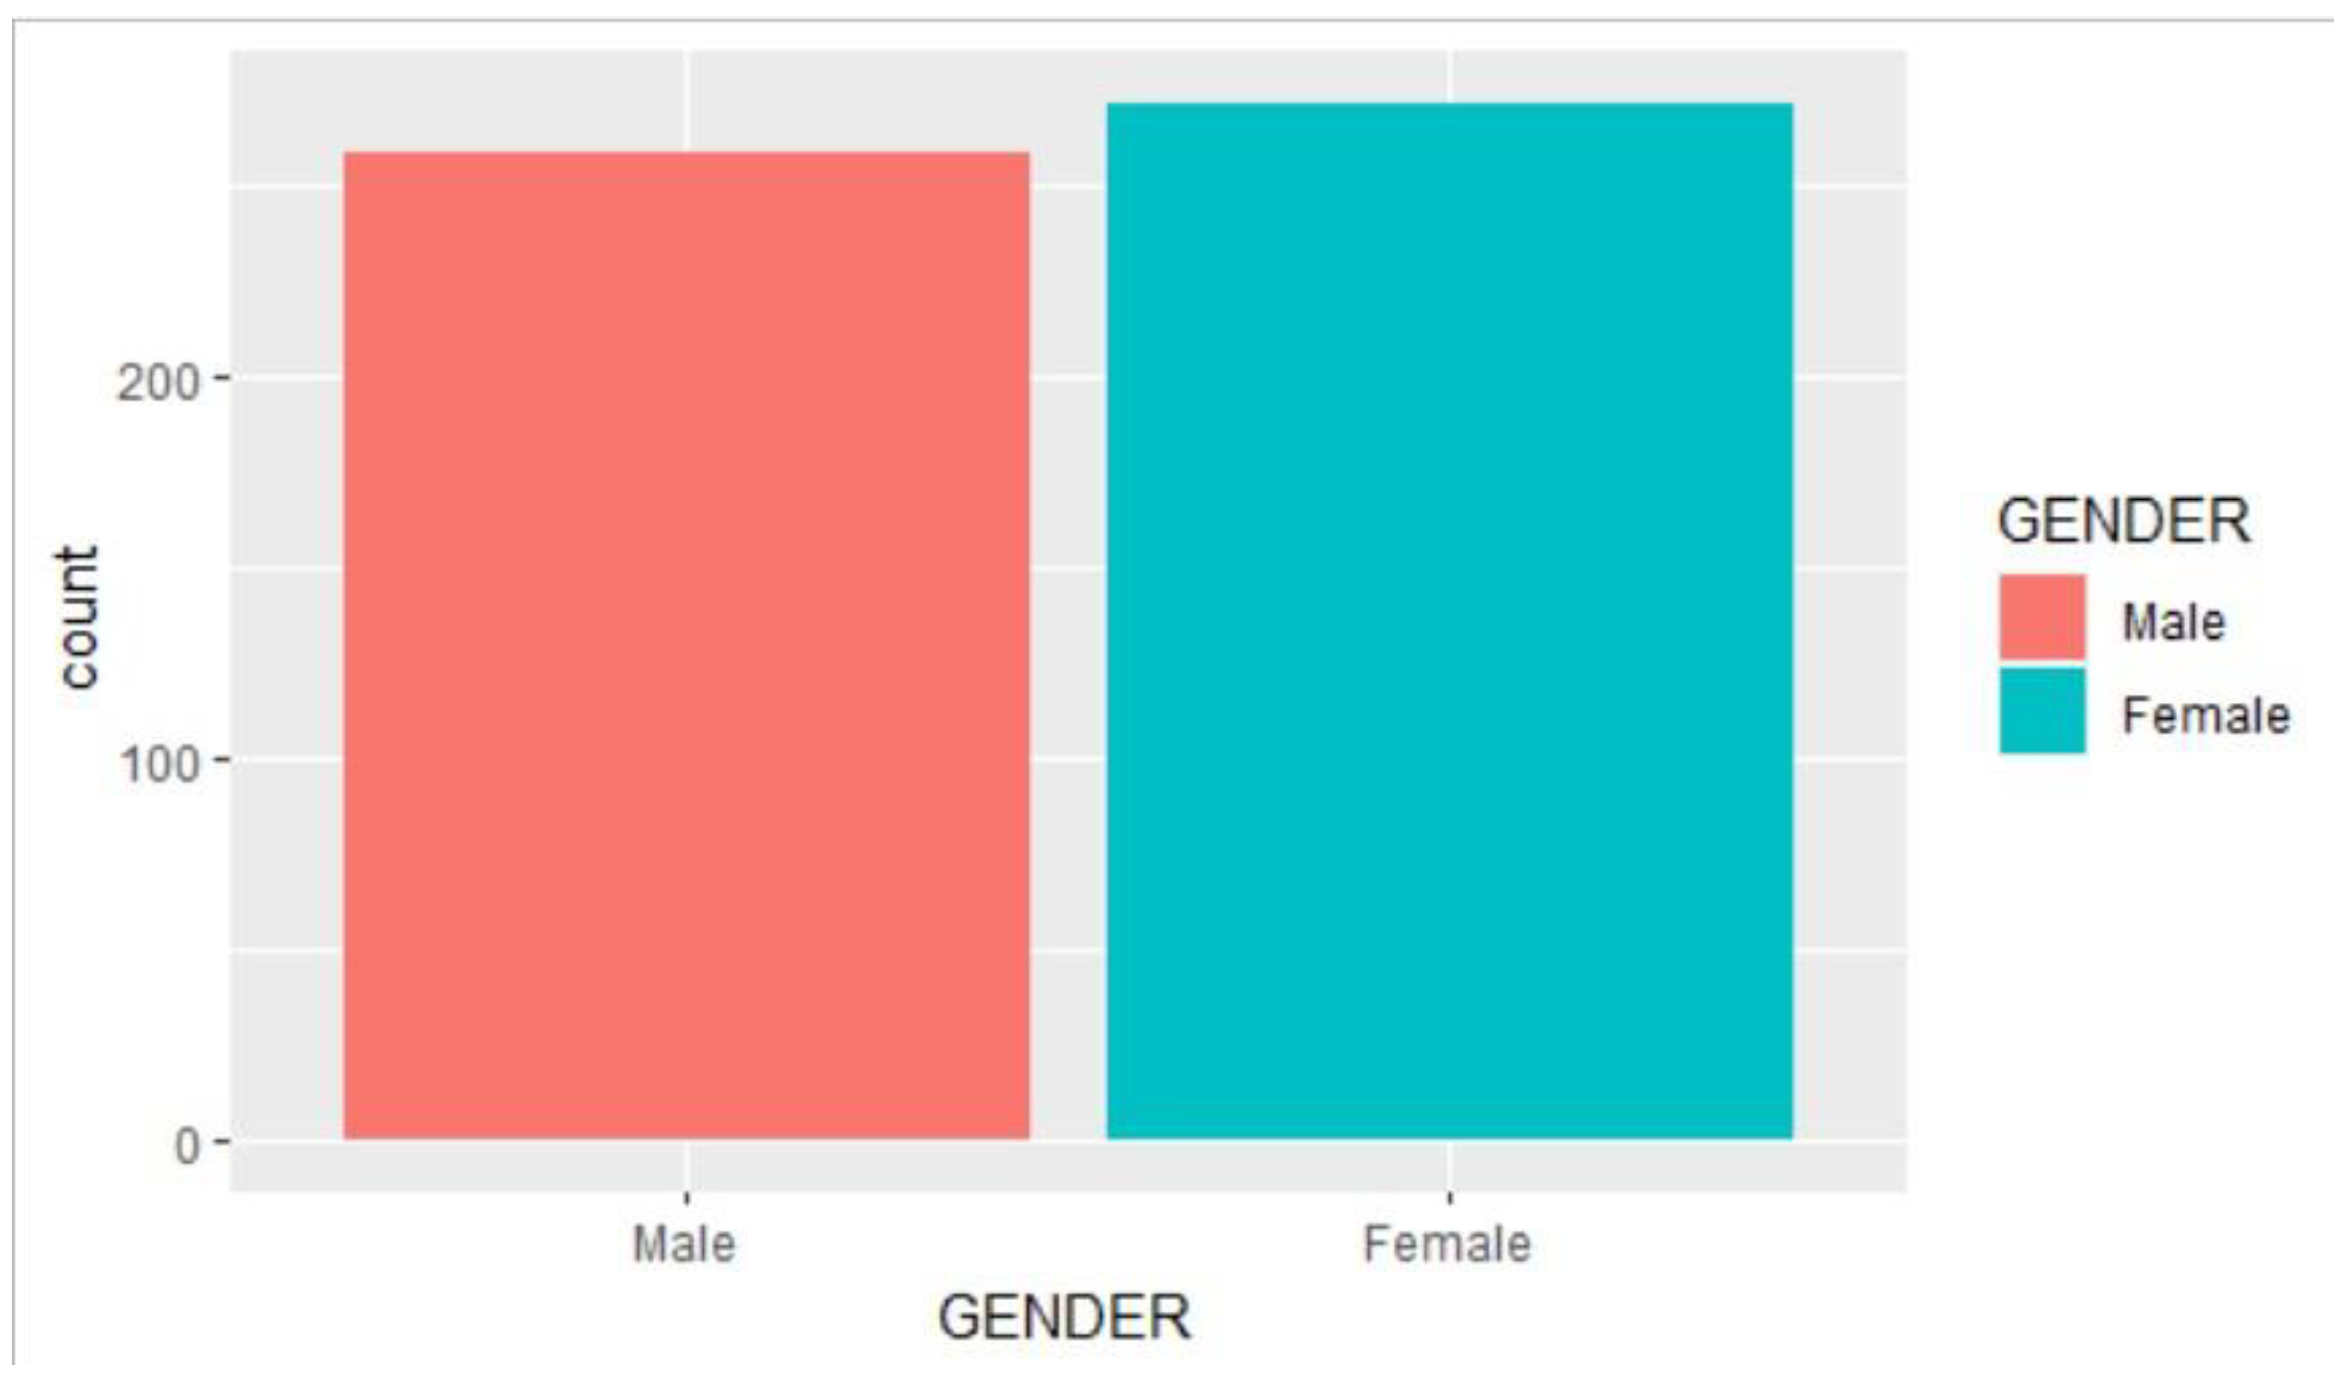
Figure 1). This indicates that more values are concentrated on the right side (tail) of the distribution. For the other continuous variable, Computer Self-Efficacy, the average value is 76.93 with standard deviation of 22.41 and skewness of -0.70 (left or negatively skewed). 89.5% of our respondents self-reported to having found CBT relatively easy to use while 10.5% think otherwise. There is roughly equal representation, as 48.8% of the respondents are male and 51.2% are female respectively. New users also make up 53.5% while 46.5% were old users.
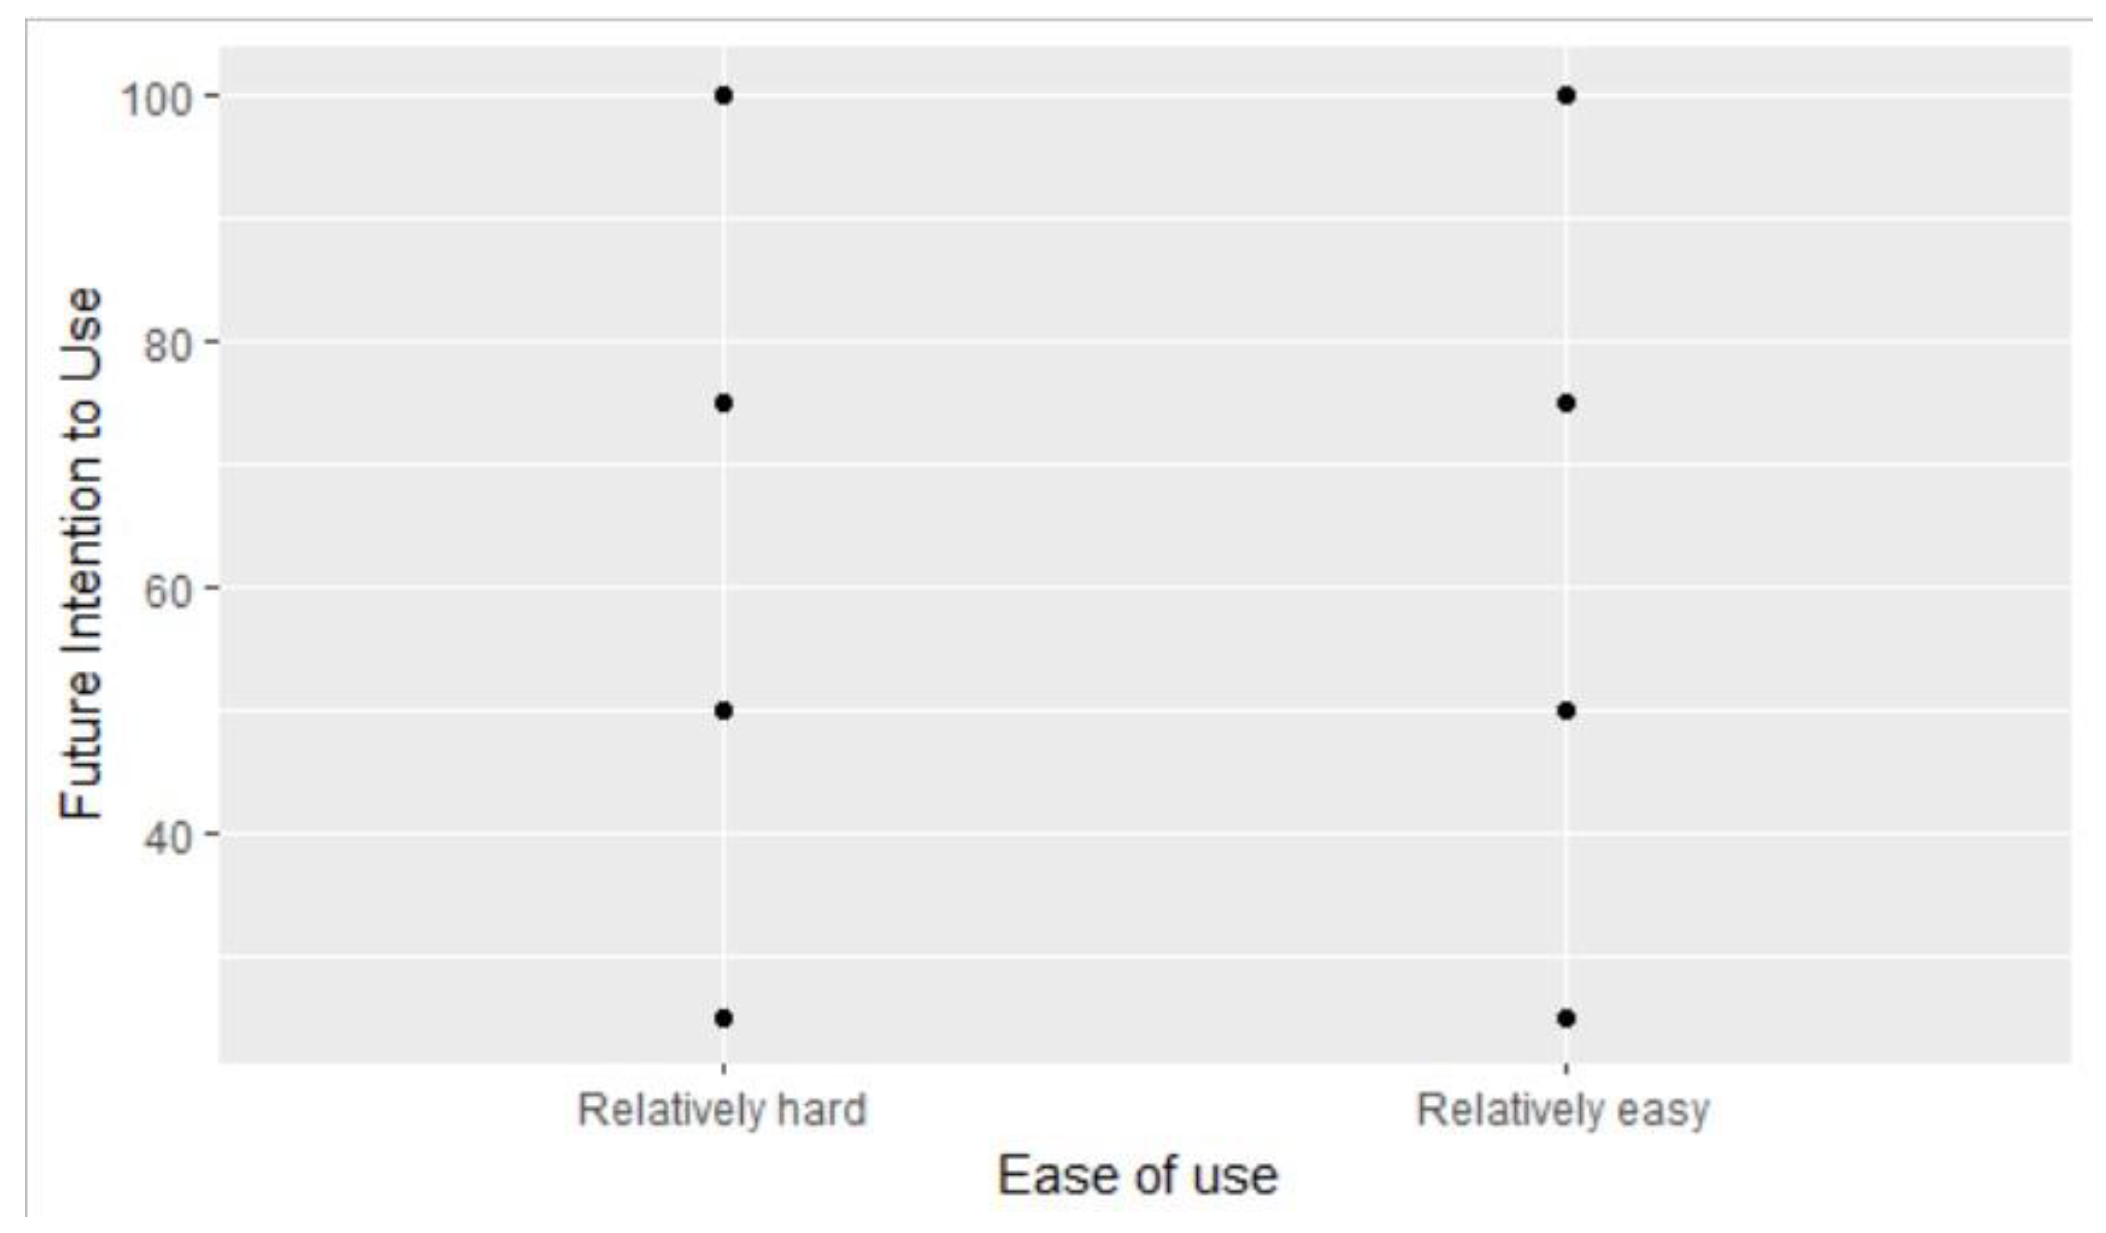
Bivariate distribution: Before fitting the models, we examined the association between the outcome (Future Intention to use CBT – FI_pct) and the key predictor (ease of use-Ease) using a scatterplot. The distribution was hard to read as the distribution was clustered around the four possible values of the outcome variable, future intention to use (25, 50, 75, and 100). 4.33% of the respondents have future intention to use CBT value of 25 while 8.29% have FI_pct value of 50, 14.12% have 75 and 54.8% have 100. A total of 68.92% have future intention to use CBT value which is 75 and above; this is shared between students who find CBT relatively hard and easy.
Figure 6 shows this association. Our attempt to get a line of best fit or Lowess curve on the scatterplot wasn’t successful due to the weak correlation between the two variables. A correlation test shows a very weak positive but significant (
t =3.55 (
df =529),
p<.001) linear association between future intention to use CBT and ease of use (r=0.15).
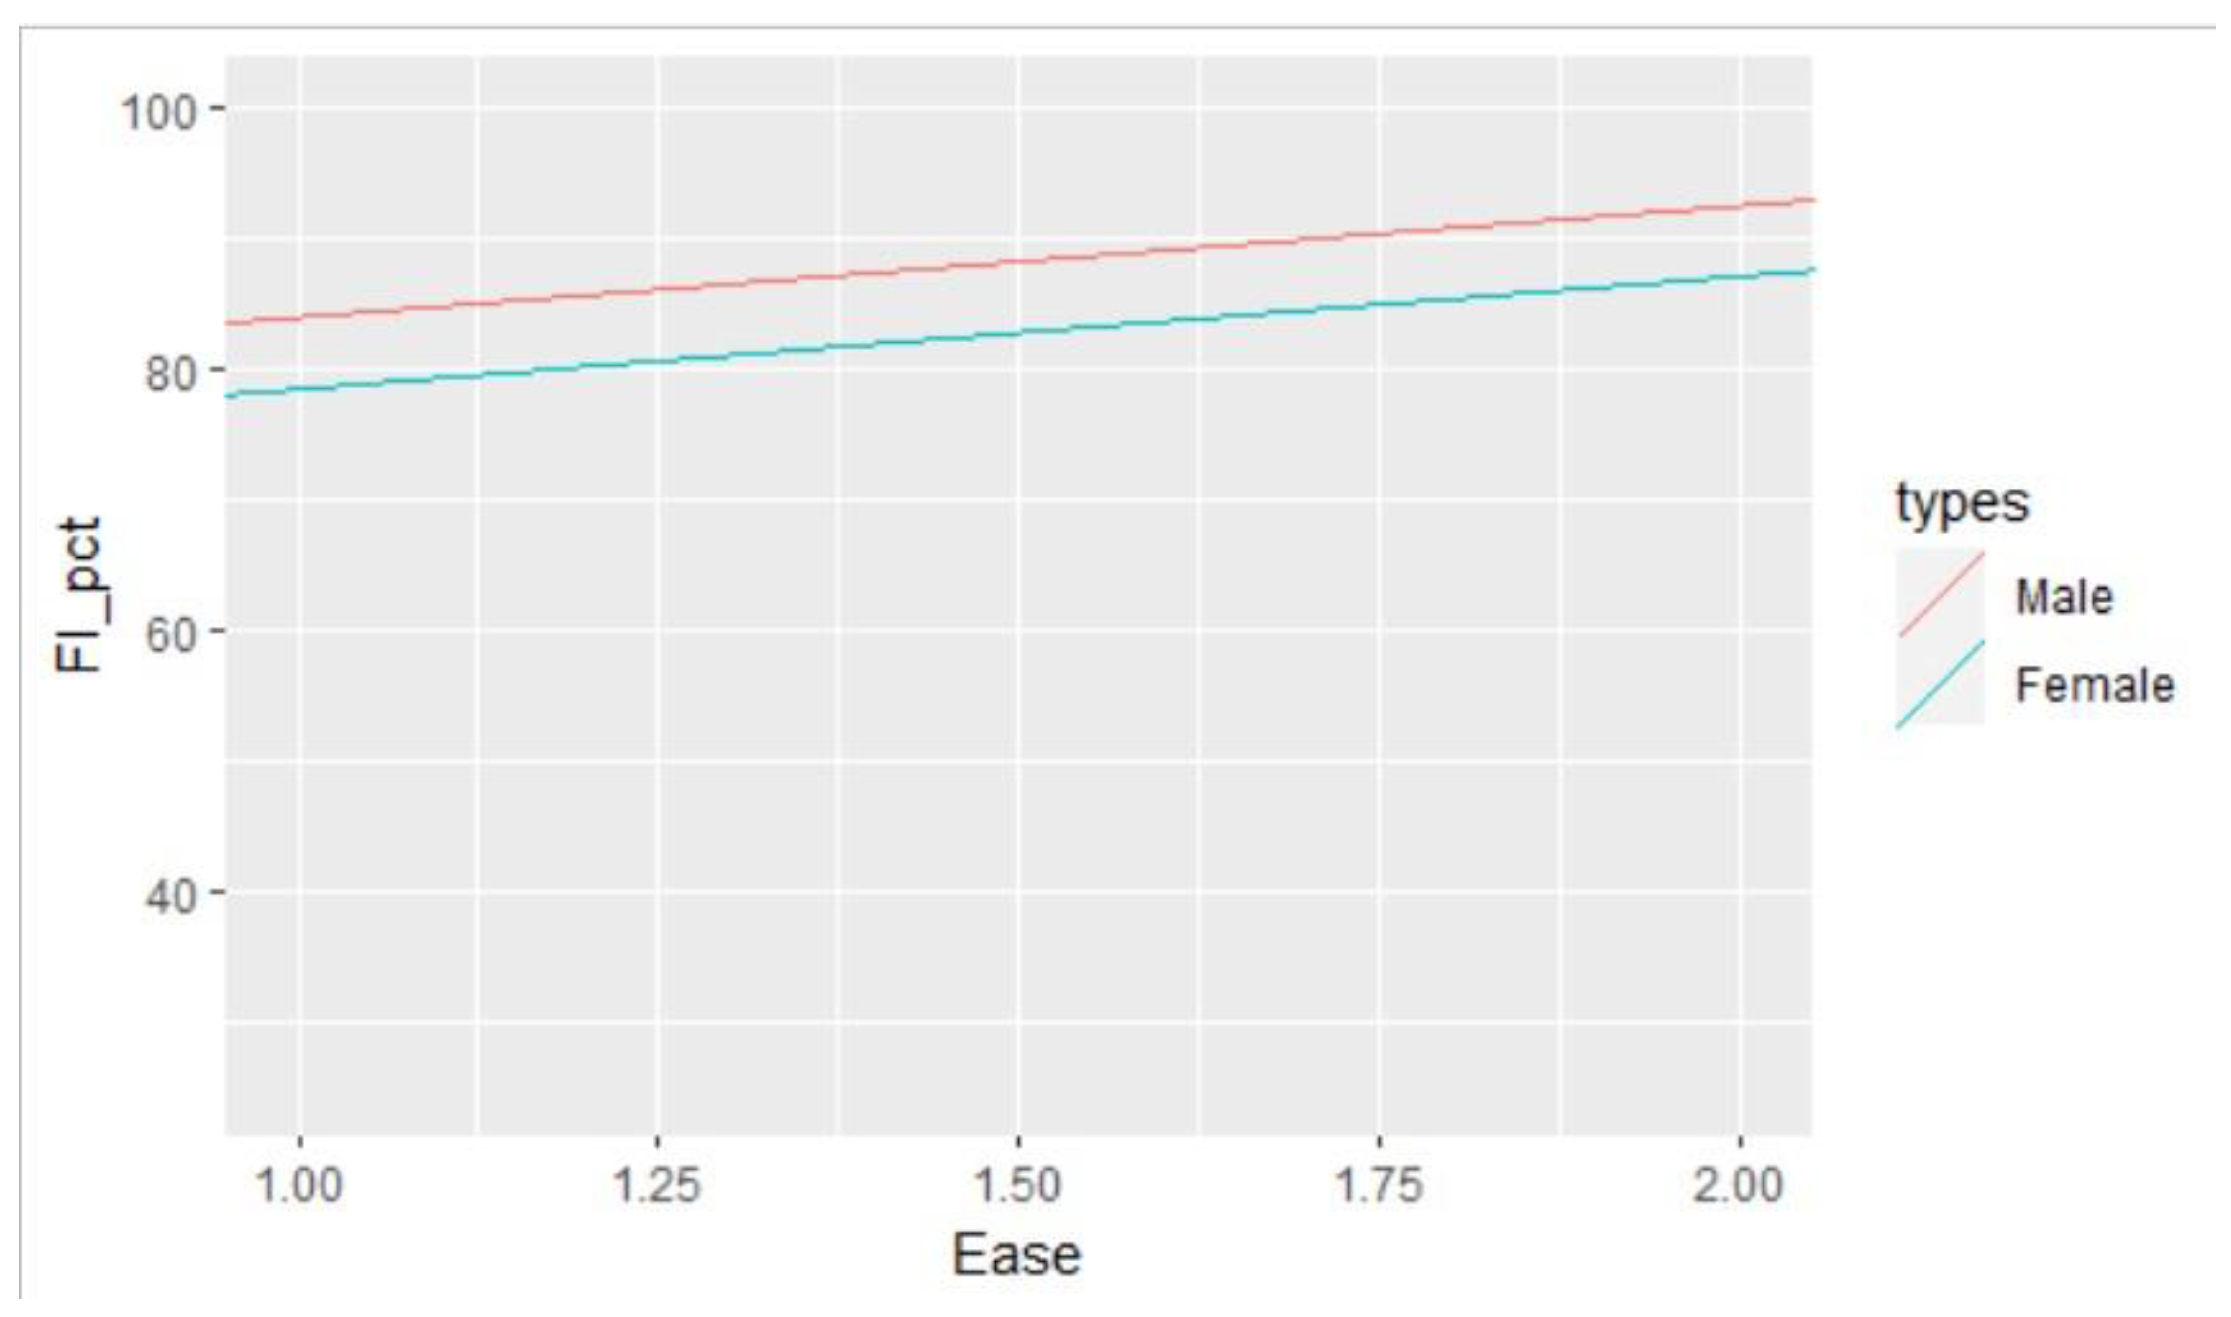
Figure 7 shows this relationship, as the ease-of-use increases, the future intention to use CBT increases among male and female.
Figure 1.
Univariate distribution for the Outcome Variable – Future Intention to Use.
Figure 1.
Univariate distribution for the Outcome Variable – Future Intention to Use.
Figure 2.
Univariate distribution for the main Predictor Variable – Ease of use.
Figure 2.
Univariate distribution for the main Predictor Variable – Ease of use.
Figure 3.
Univariate distribution for a control variable – Computer Self-Efficacy.
Figure 3.
Univariate distribution for a control variable – Computer Self-Efficacy.
Figure 4.
Univariate distribution for a control variable – Gender.
Figure 4.
Univariate distribution for a control variable – Gender.
Figure 5.
Univariate distribution for a control variable – Experience of the User.
Figure 5.
Univariate distribution for a control variable – Experience of the User.
Figure 6.
Bivariate distribution.
Figure 6.
Bivariate distribution.
Figure 7.
Prototypical plot.
Figure 7.
Prototypical plot.
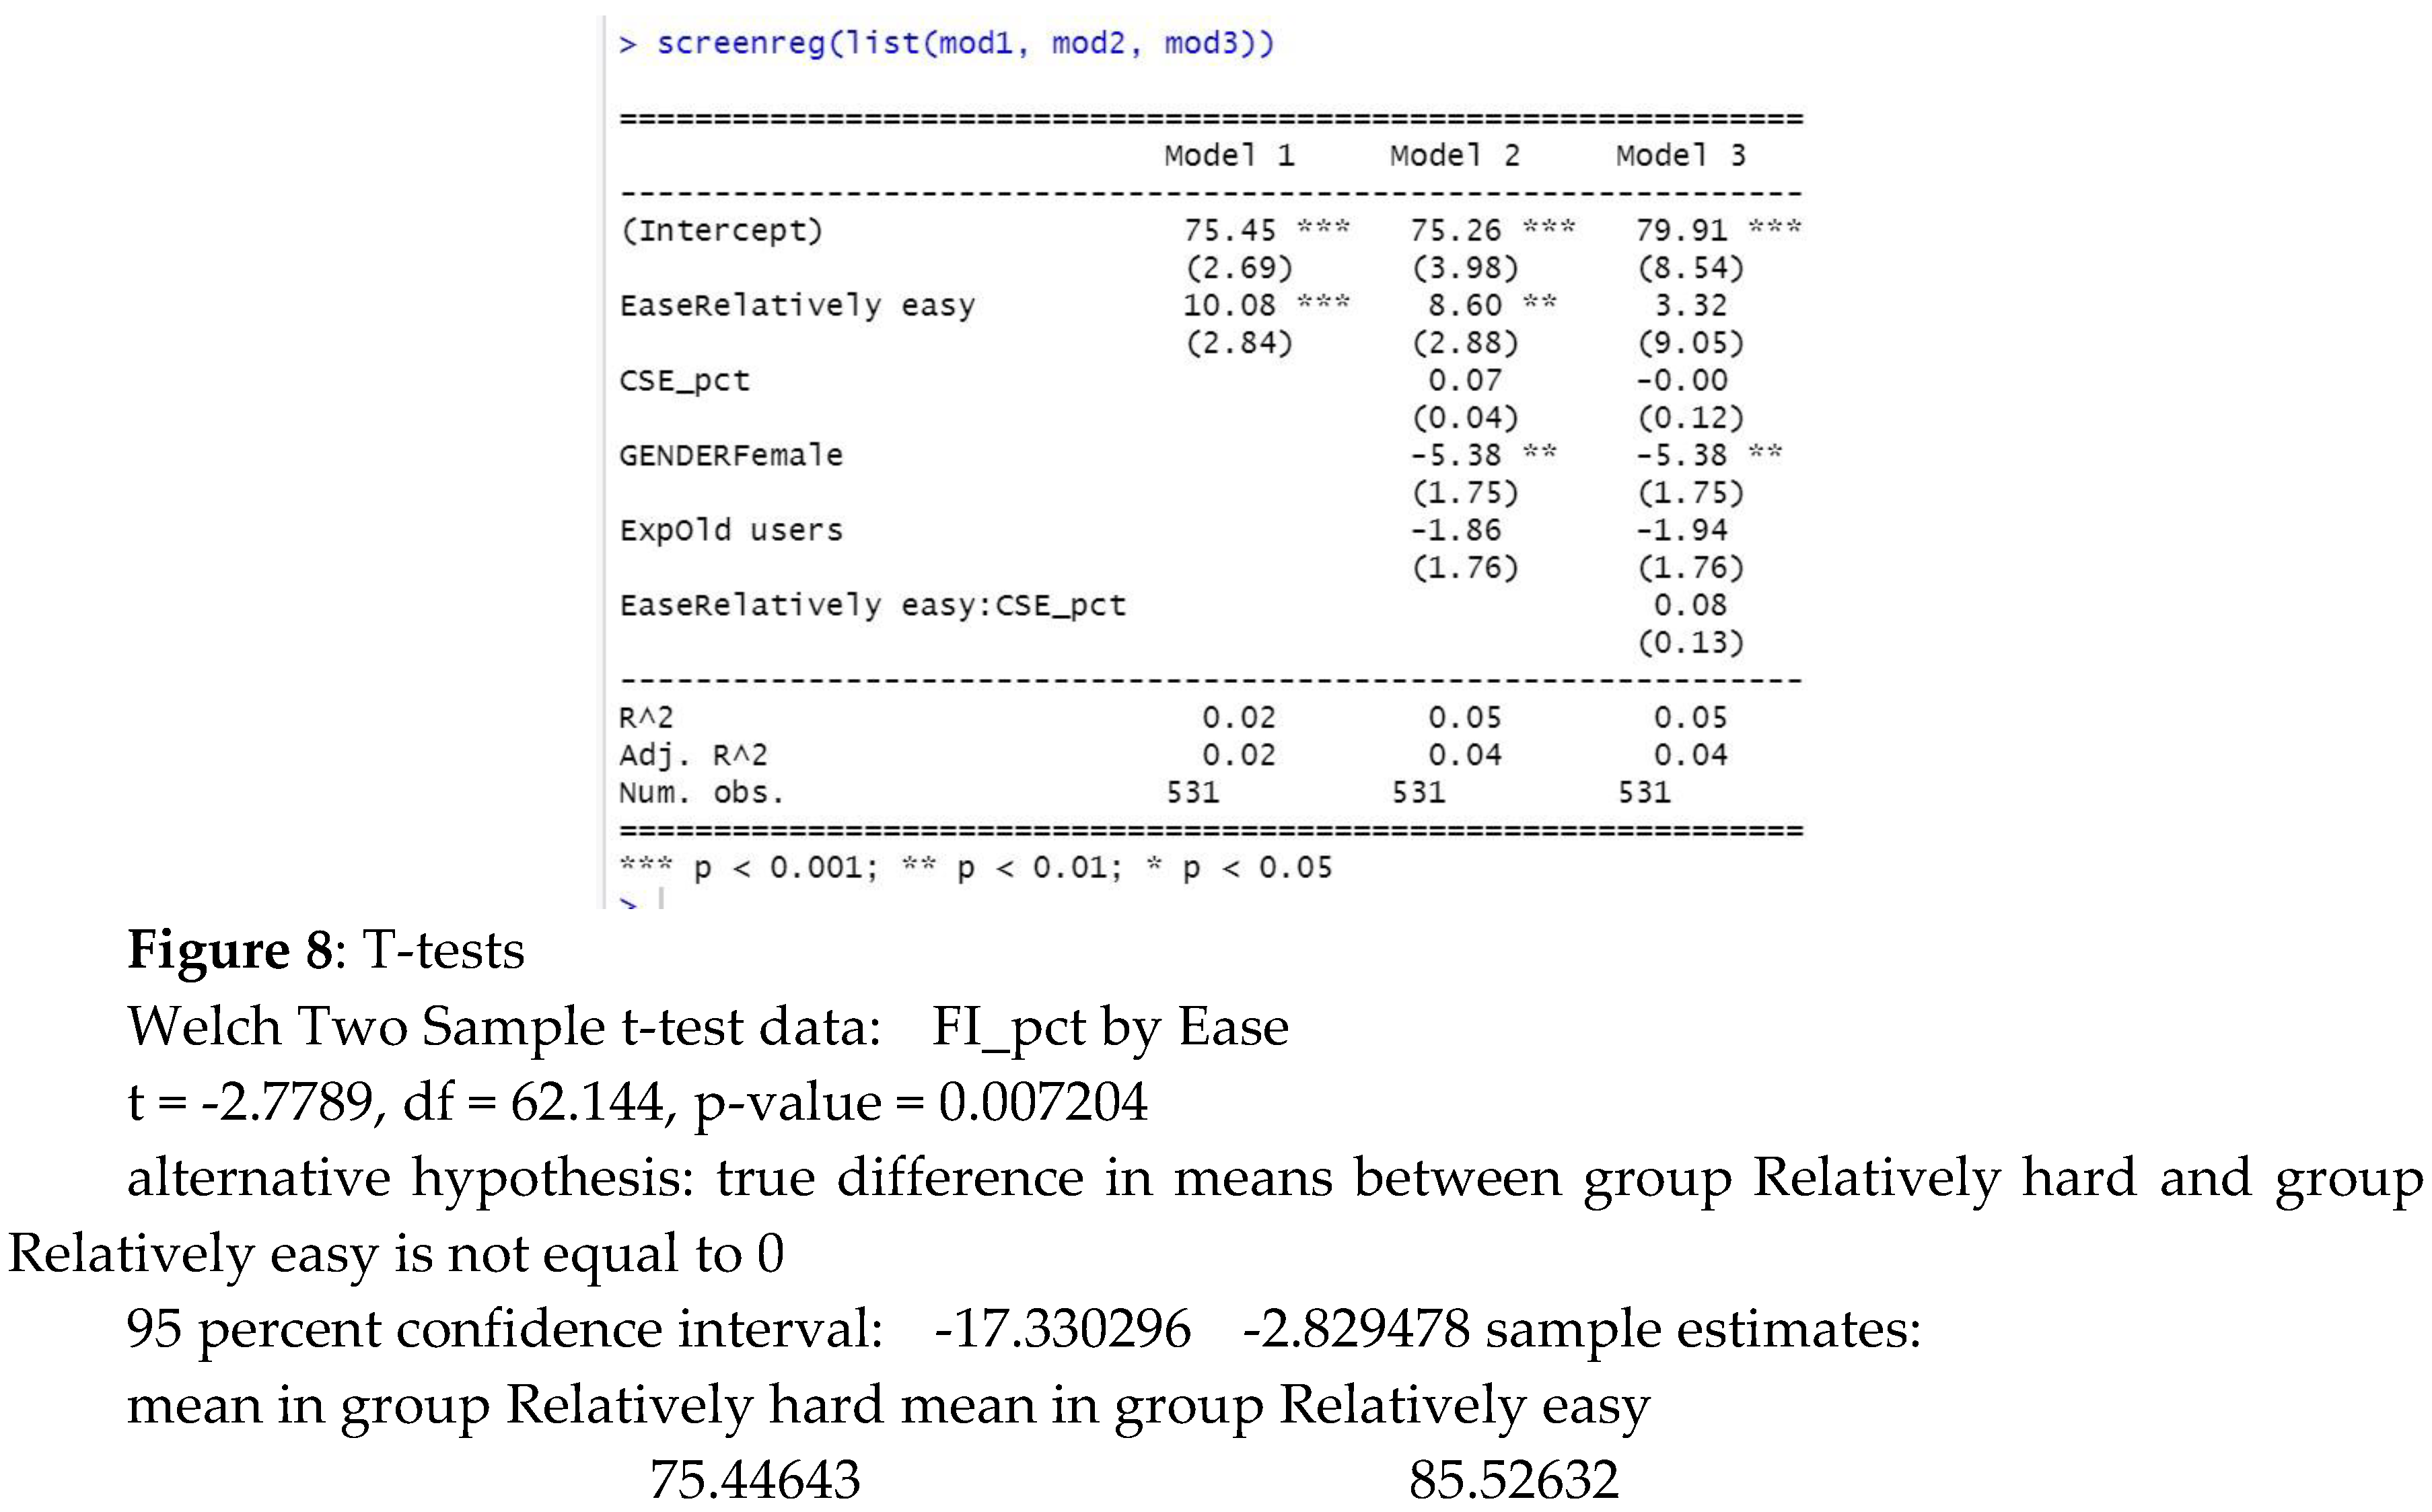
Figure 8.
Statistical Models.
Figure 8.
Statistical Models.
Simple Regression
The intercept (̂β0) of value 75.5 is the mean future intention to use Computer-based Test when the ease of use is 0.
The coefficient (β̂1) of value 10.1 shows that students who find CBT relatively easy to use have mean future intention to use CBT which is 10.1 points higher than those who find CBT relatively hard to use. This value was also found to be statistically significant.
Conducting a t-test to test the null hypothesis (H0): There is no significant difference in mean Future Intention to Use CBT between students who find CBT relatively ease and those who find it relatively hard.
Decision: Due to the p-value, which is less than 0.05, we rejected the null-hypothesis (t (df =62.144) = -2.78, p < .01)) and conclude that there is a significant difference in mean future intention to use CBT between students who find CBT relatively easy and those who find it relatively hard. The coefficient (β̂1) of value 10.1 shows that students who find CBT relatively easy to use have mean future intention to use CBT which is 10.1 points higher than those who find CBT relatively hard to use. The difference in group mean also supports this conclusion. Students who find it relatively easy have a higher group mean (85.5) than those who find it relatively hard. This answers the research question: Is the intention to use CBT in the future associated with its ease of use?
Multiple Regression
We also carried out a Multiple Regression of Future Intention to use (Future Intention_pct) on Ease of use while controlling for Computer Self-efficacy, gender, and user experience.
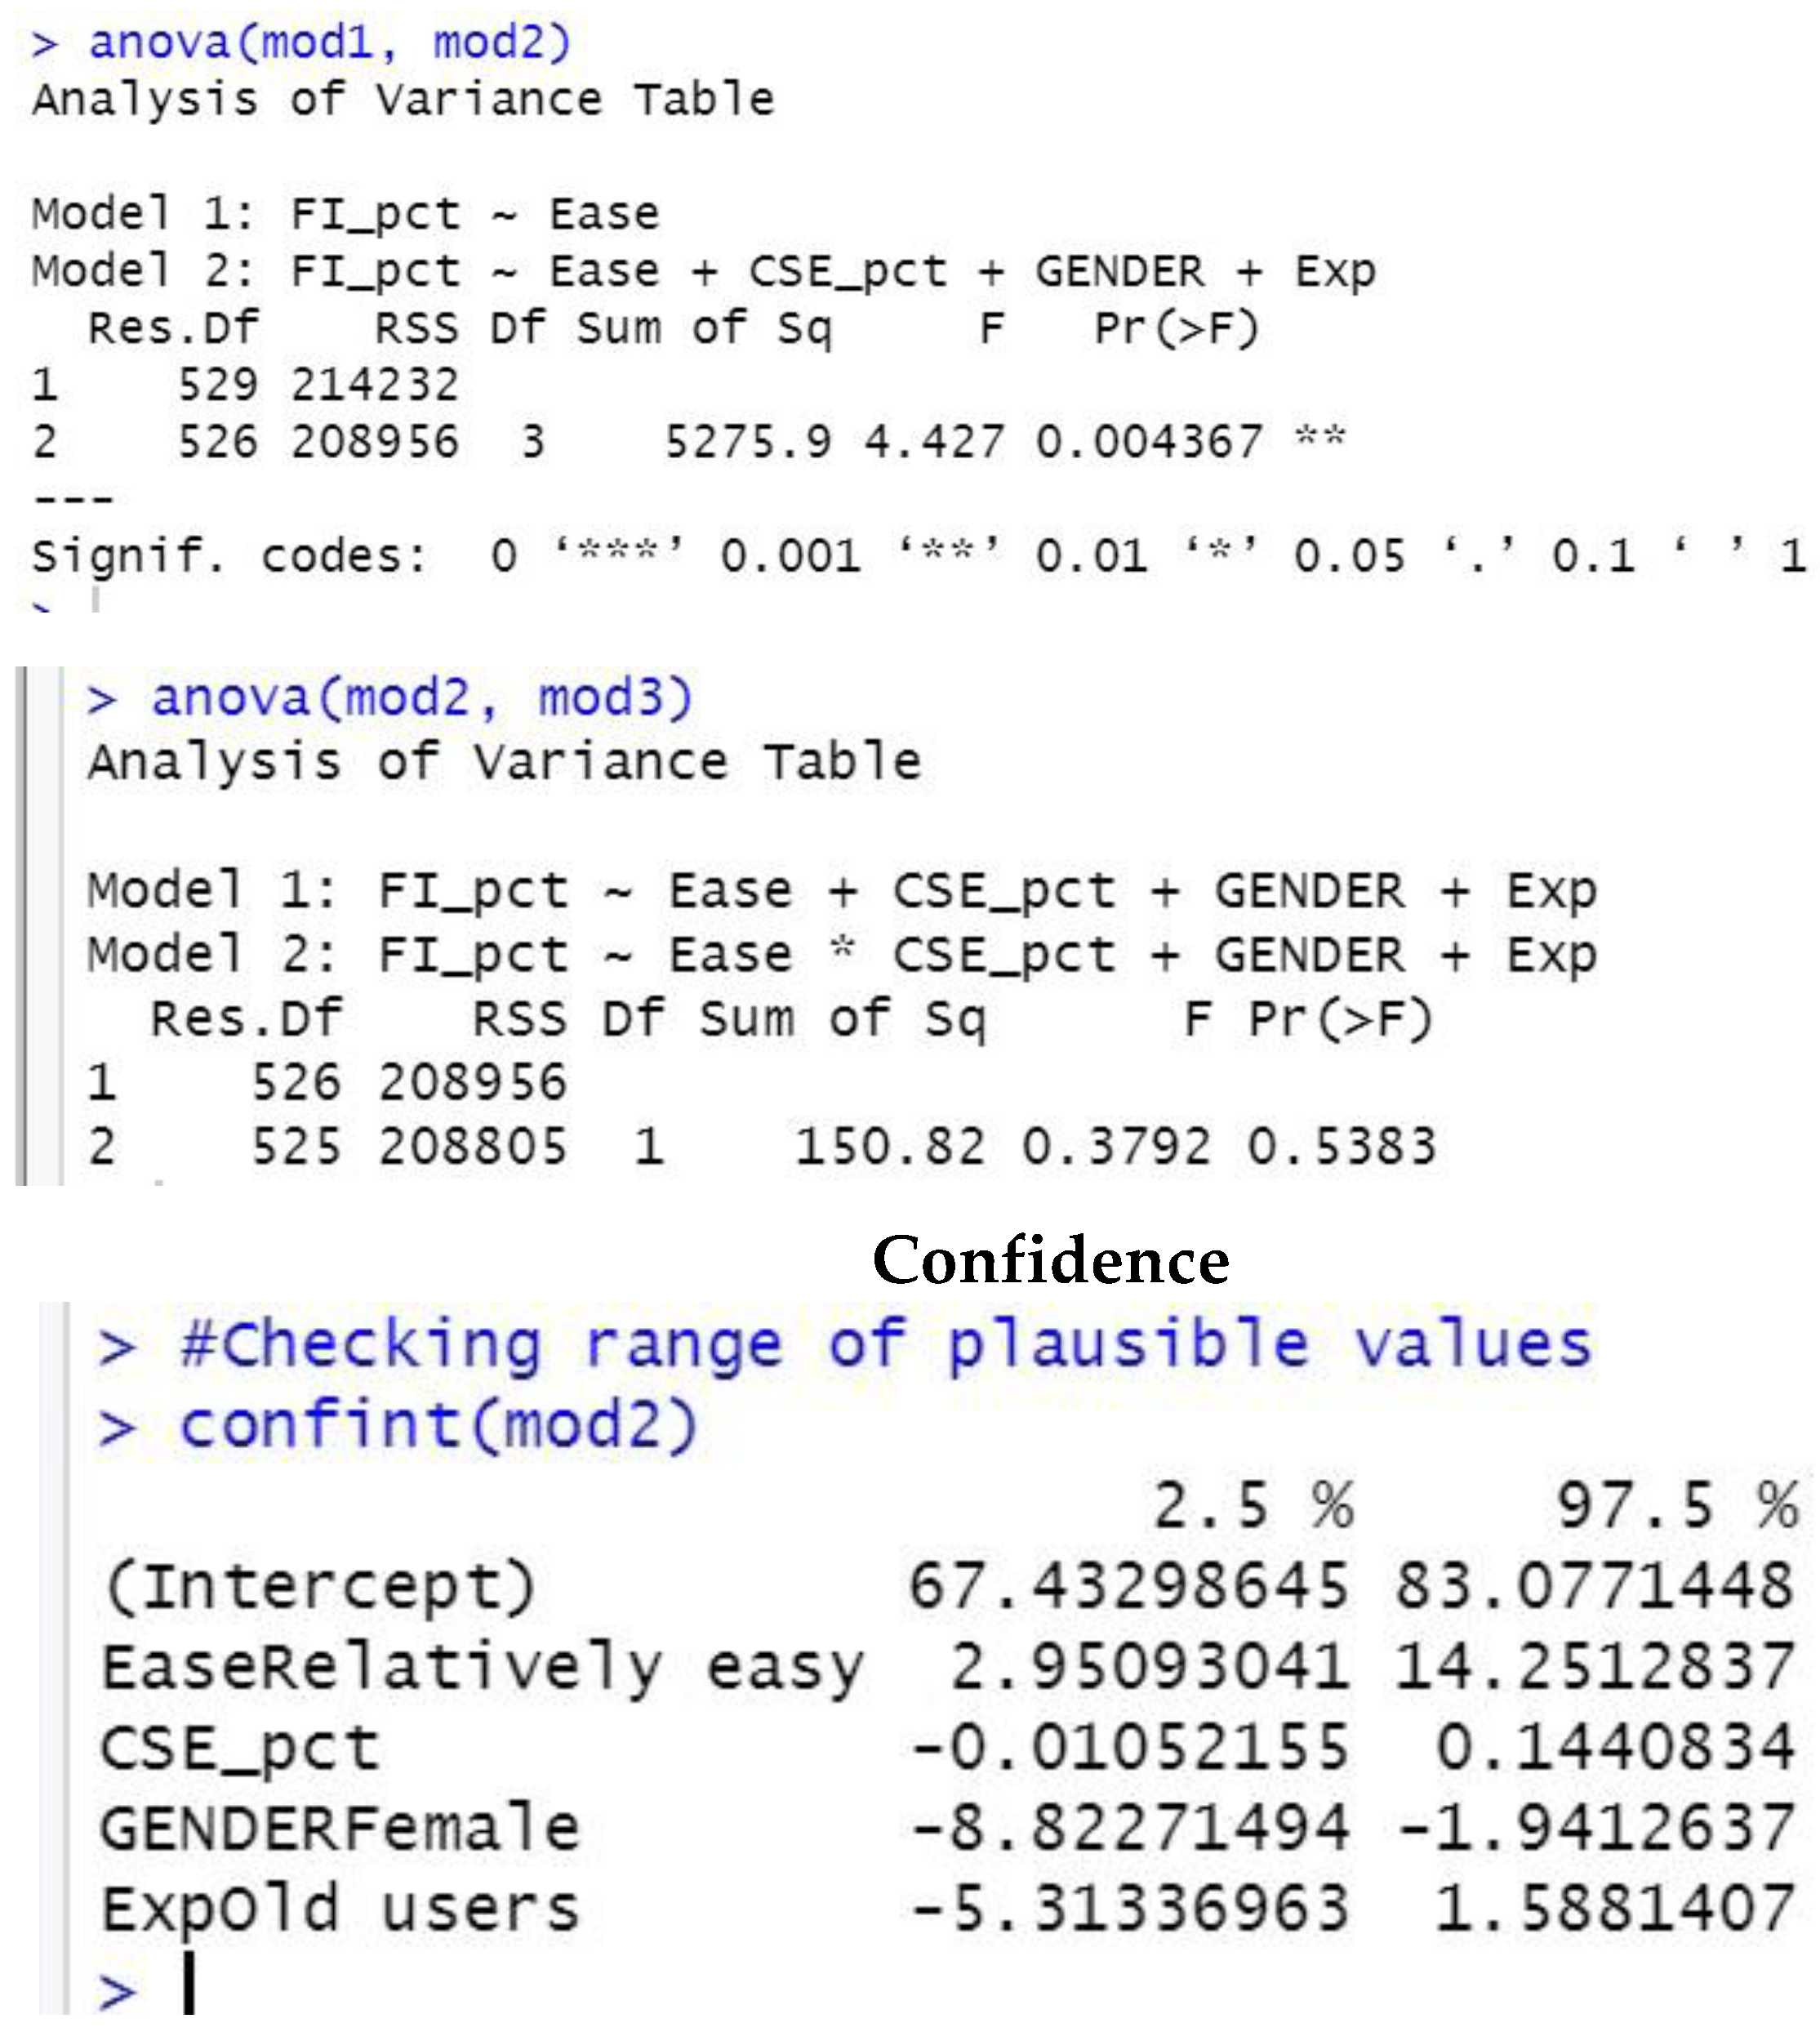
In model 2, we added Computer Self-Efficacy, Gender, and User Experience as controls to the main predictor ease of use, the coefficient of Ease reduced to a statistically significant value of 8.6. This indicates that when controlling for Computer Self-Efficacy, Gender and User Experience, students who find the computer-based Test relatively easy to use have a mean future intention to use CBT value which is 8.6 points higher than those who find CBT relatively hard to use. This is slightly lower than the other model where there was no control. Females were also found to have future intention to use CBT which is 5.38 lower than that of their male counterparts when accounting for controls. This model has a higher variability than model 1; however, it only explains 5% of the variability of Future Intention to use CBT within the population. We’re 95% confident that the true slope is somewhere between 2.95 and 14.25.
What is the association when controlling for gender, computer self-efficacy, and experience?
To answer the above research question, we tested the null hypothesis (H0): There is no association between Future Intention to Use CBT between students who find CBT relatively ease and those who find it relatively hard when controlling for gender, computer self-efficacy, and experience.
Decision: Due to the p-value, which is less than 0.05, we rejected the null-hypothesis (t (df =526) = 2.99, p < .01)) and concluded that there is an association between future intention to use CBT and ease of use for students in this population.
How does that differ between new and old users?
When we control gender, computer self-efficacy, and experience, the mean future intention to use CBT is 1.86 points higher for the new users. And after adding a control for the interaction between Ease and Computer Self Efficacy, the mean future intention to use CBT for the new users was 1.94 points higher than that of the old users. However, these values are not significant.
Interactions
To check for the interaction between ease of use and computer self-efficacy, we did a Multiple Regression of Future Intention to use (Future Intention_pct) on the interaction of Ease of use and Computer Self-efficacy while controlling for gender and user experience (old & new users).
In this model, we checked the interaction effect of Ease of Use and Computer Self-Efficacy, while still controlling for Computer Self-Efficacy, Gender, and User Experience we observed that the coefficient of Ease of use reduced further to 3.32 but was not significant. Females were also found to have future intention to use CBT which is which is 5.38 points lower than that of their male counterparts; like in model 2 while the mean future intention to use CBT for the new users was 1.94 higher than that of the old users; this is an increase from 1.86 points difference in model 2 without the interaction.
Our judgement of the best model: We chose model two as the better model between model 2 and 3, as the coefficients of Ease (the main predictor) and gender were significant. Model three, on the other hand, has the same gender coefficient and the coefficient for Ease is not significant and the R2 value explains 5% of the variability of Future Intention to use CBT as in model 2.
F-test
We tested a null hypothesis of no mean differences in the Future Intention to Use CBT based on student’s Ease of Use even when controlling for Computer Self Efficacy, Gender, and Experience of Use. We rejected the null hypothesis (F(df1 = 3, df2 = 526) = 4.43, p < .001) and concluded that there is a difference in future intention to use CBT between students who find CBT relatively easy and those who find it relatively hard even after controlling for their Computer Self-Efficacy, gender, and Experience of use.
To see the effect of the interaction on future intention, tested a null hypothesis of no mean differences in the Future Intention to Use CBT based on student’s Ease of Use even when controlling for Computer Self Efficacy, Gender, and Experience of Use. We fail to reject this hypothesis (F(df1=1, df2=525)=0.38, p>.05) due to the p-value that is greater than 0.05 and conclude that there is no significant effect of the interaction between ease of use and computer self-efficacy on students’ future intention to use CBT.
Assumption Checking
Since our bivariate distribution scatterplot only shows data clustered together on few points due to the four possible positions for the students and without a line of best fit, we resulted to the use of mean residual values and standardized residual values. To test the assumption of linearity we used the mean residual values. Since the values of the dichotomized Ease variable are both almost 0, or close to 0 (0.0003 & 0.00009), we assumed there is linearity. Homoscedasticity is violated as we could identify it as a Heteroskedastic distribution is present because the sd(res) value are both not close to one (1.35 and 0.95). Due to this, the p value could be untrustworthy due to the difference in sd(res). There is also no normal distribution across the values of x as only 2 values are possible against the 4-possible values of y. As such, the 531 values are clustered on 8 points on the plane.
Summary of Findings and Discussion
Below is the summary of our findings which helped us answer the three research questions:
Students who find CBT relatively easy to use have a mean future intention to use CBT which is
10.1 points higher than those who find CBT relatively hard to use.
When we controlled Computer Self-Efficacy, Gender and User Experience, students who find the computer-based Test relatively easy to use have a mean future intention to use CBT value which is 8.6 points higher than those who find CBT relatively hard to use.
There is an association between the future intention to use CBT and ease of use for students in this population.
This differs among new and old users of CBT as the mean future intention to use CBT is 1.86 points higher for the new users.
It is not surprising to find that students who find CBT relatively easy to use also want to use it more in the future as our finding is theoretically expected and supported by literature; as it is similar to findings of Jimoh et al. (2013); Terzis et al. (2011); Ricketts and Wilks (2001), Moon & Kim, 2001; Wang et al., 2009; Agarwal & Prasad, 1999; & Venkatesh, 1999). A system that is easy to use is more likely to be re-used. The new users demonstrating higher mean future intention to use CBT may be due to novelty of the technology to them. We therefore recommend that Computer-Based Test designers and developers should endeavor to follow the recommended standards for test design and administration to ensure that CBTs are easy to use for everyone regardless of their computer self-efficacy level and gender.
Limitations of the Study
There are several limitations imposed by the data we are using in this study. Our data in its raw form was nominal in nature- a 4-likert scale format (SD, D, A, SA). While it simplifies the response options, it lacks the details needed for a more extensive and detailed data collection and analysis. Dichotomizing and changing them to continuous form imposed some restrictions on the accuracy of our analysis. For instance, students, who chose Strongly Disagree (SD) and Disagree (D) in response to how easy they found CBT were both categorized as relatively hard while Agree (A) and Strongly Agree (SA) are also grouped as relatively ease. The four possible options for the outcome variable (future intention to use CBT) also made the distribution cluster on few points. A better rating or scale should be used in future instruments to collect this type of data. To have a better understanding of what influences the future intention to use CBT, future study should explore the CBAAM and use the Structural Equation Modelling method to see how all the contracts directly or indirectly impact future intention to use.
Also, as these are self-reported data, it may involve respondents not answering completely honestly due to a multitude of factors, including perceived interviewer bias, privacy, etc. In our case, it is quite plausible that a respondent might feel hesitant in revealing that they do not find computer-based tests to be easy. Such a possibility may very well impair the data’s internal validity. In that vein, research surveys invariably simplify complex worldviews into agreement or disagreement categories which may lead to missing out on the intricacies of how people feel or think about this option. In conclusion, the analytical power and scope for generalizability of self-reported data is constrained by the fact that we as researchers cannot be sure whether responses accurately reflect the worldviews and behaviors of people in real life.
References
- Agarwal, R., & Prasad, J. (1999). Are individual differences germane to the acceptance of new information technologies? Decision Sciences, 30(2), 361–391. [CrossRef]
- Arenyeka, L. (2012, July 5th). Slow to boot: Nigerian students lag behind in computer education. In .
-
Vanguard Newspaper July 05, 2012 edition, retrieved 15th Nov, 2017, from https://www.vanguardngr.com/2012/07/slow-to-boot-nigerian-studentslagbehind-in-computer-education/.
- Bodmann, S. M. & Robinson, D. H. (2004). Speed and performance differences among computerbased and paper-pencil tests. Journal of Educational Computing Research, 31(1), 51 – 60. [CrossRef]
- Cantillon, P., Irish, B., & Sales, D. (2004). Using computers for assessment in medicine. British Medical Journal, 329,606-609. [CrossRef]
- Dangut, A. J, & Sakiyo, J. (n.d). Assessment of computer literacy skills and computer-based testing anxiety of secondary school students in Adamawa and Taraba states, Nigeria. Retrieved 8th Jan., 2017, from www.iaea.info/documents/paper_371f29d98.pdf · PDF file.
- Jimoh, R. G., Yussuff, M. A., Akanmu, M. A., Enikuomehin, A. O. & Salman, I. R. (2013). Acceptability Of Computer Based Testing (CBT) Mode For Undergraduate Courses in Computer Science. Journal of Science, Technology, Mathematics and Education (JOSTMED), Volume 9(2).
- Ogunmakin, A. O., & Osakuade, J. O. (2014). Computer anxiety and computer knowledge as determinants of candidates’ performance in computer- based test in Nigeria. British Journal of Education, Society & Behavioral Science, 4(4),495-507.
- Terzis, V., & Economides, A. A. (2011). The acceptance and use of computer-based assessment. Computers & Education, 56(4), 1032–1044. [CrossRef]
- University of Leceister Computer Assisted Assessment Centre (n.d). What is Computer Assisted Assessment? Retrieved 12th December 2017, from https://www2.le.ac.uk/Members/rjm1/talent/book/c3p2.html.
- Moon, J. and Kim, Y. (2001). Extending the TAM for a world wide web context. Journal of Information & Management Science, 27(1) 15-22. [CrossRef]
- Ricketts, C. & Wilks, S. (2001). Is computer-based assessment good for students? In Myles, D. (Eds.), CAA 2002 International Conference, University of Loughborough, Retrieved 30th June, 2019, from.
- http://caaconference.com.
- Venkatesh, V. (1999). Creation of favourable user perceptions: Exploring the role of intrinsic motivation. MIS .
-
Quarterly, 23, 239–260. Radiol Technol. 2012 May-Jun; 83(5):437-46.
- Wang, Y., & Wang, Y. (2008). Gender differences in the perception and acceptance of online games. British Journal of Educational Technology, 39(5), 787–806. [CrossRef]
- Wang, Y.., Wu, C., & Wang,H.. (2009). Investigating the determinants and age and gender differences in the acceptance of mobile learning. British Journal of Educational Technology, 40(1), 92–118. [CrossRef]
|
Disclaimer/Publisher’s Note: The statements, opinions and data contained in all publications are solely those of the individual author(s) and contributor(s) and not of MDPI and/or the editor(s). MDPI and/or the editor(s) disclaim responsibility for any injury to people or property resulting from any ideas, methods, instructions or products referred to in the content. |
© 2024 by the authors. Licensee MDPI, Basel, Switzerland. This article is an open access article distributed under the terms and conditions of the Creative Commons Attribution (CC BY) license (http://creativecommons.org/licenses/by/4.0/).
