1. Introduction
Rift Valley Fever Virus (RVFV) is the cause of Rift Valley Fever in farmed animals in all Sub-Saharan African countries and the Arabian Peninsula, [
4]. RVF virus belongs to the genus Phlebovirus in the order Bunyavirales, [
7]. The virus was first identified in 1931 during an investigation into an endemic among sheep on a farm in the Rift valley province of Kenya, [
3]. The livestock disease outbreaks remains a public health concern with the biggest burden of the diseases going to the pastoral communities, [
3]. Once an animal or human being has been exposed to the RVF virus, it takes between 2-6 days for the symptoms to appear, [
9]. For human beings, the symptoms are mild and mostly go unnoticed, however, a small percentage (usually lee than 10 percent) of persons infected with the virus experience serious symptoms, such as ocular illness, encephalitis and hemorrhagic fever, [
10]. The virus is very severe in animals especially the young animals. It is characterized by fever, abortions and weaknesses with abortions occurring to nearly 100 percent of all the pregnancies, [
3]. For adult animals, severity is much lower. Artificial intelligence and machine learning are growing in popularity very quickly these days, [
3]. They are extensively employed in many fields, such as stock market trading, fraud detection, medical diagnosis, and speech, picture, and pattern recognition. They have not been used widely in the field of public health, particularly in disease modeling and integrating local climate and ecological data. Numerous studies have been conducted to show how livestock diseases reduce livestock productivity, restrict access to domestic and foreign markets, and jeopardize human health through the spread of zoonotic diseases; however, none of these studies have used machine learning techniques to predict or categorize these outbreaks. Because of its strong performance in managing complicated datasets, feature interactions, and non-linear relationships, XGBoost (Extreme Gradient Boosting) has become more and more popular in the field of disease modeling. Research has shown that in disease prediction tasks, XGBoost consistently performs better than statistical models and conventional machine learning algorithms. For instance, XGBoost outperformed logistic regression and random forest algorithms in a study by [
10] when it came to predicting diseases like diabetes and cardiovascular disorders. Because of its capacity to manage large-scale, highly dimensional datasets, XGBoost is an excellent choice for disease modeling tasks involving a multitude of predictors and intricate relationships between variables. To sum up, XGBoost presents a robust framework for disease modeling that offers high accuracy, insights into the importance of features, and versatility in managing a variety of datasets.
2. Materials and Methods
This study encompasses several essential steps including data pre processing, the attributes selection part, K-fold cross validation, and assessment of the available important attributes. The subsequent sections provide a comprehensive overview of the entire process undertaken in predicting the RVF cases in Kenya. This includes a detailed presentation and explanation of the data using the Machine Learning (ML) methodologies employed, the evaluation metrics utilized, and a breakdown of the workflow followed throughout the study.
2.1. Study Area
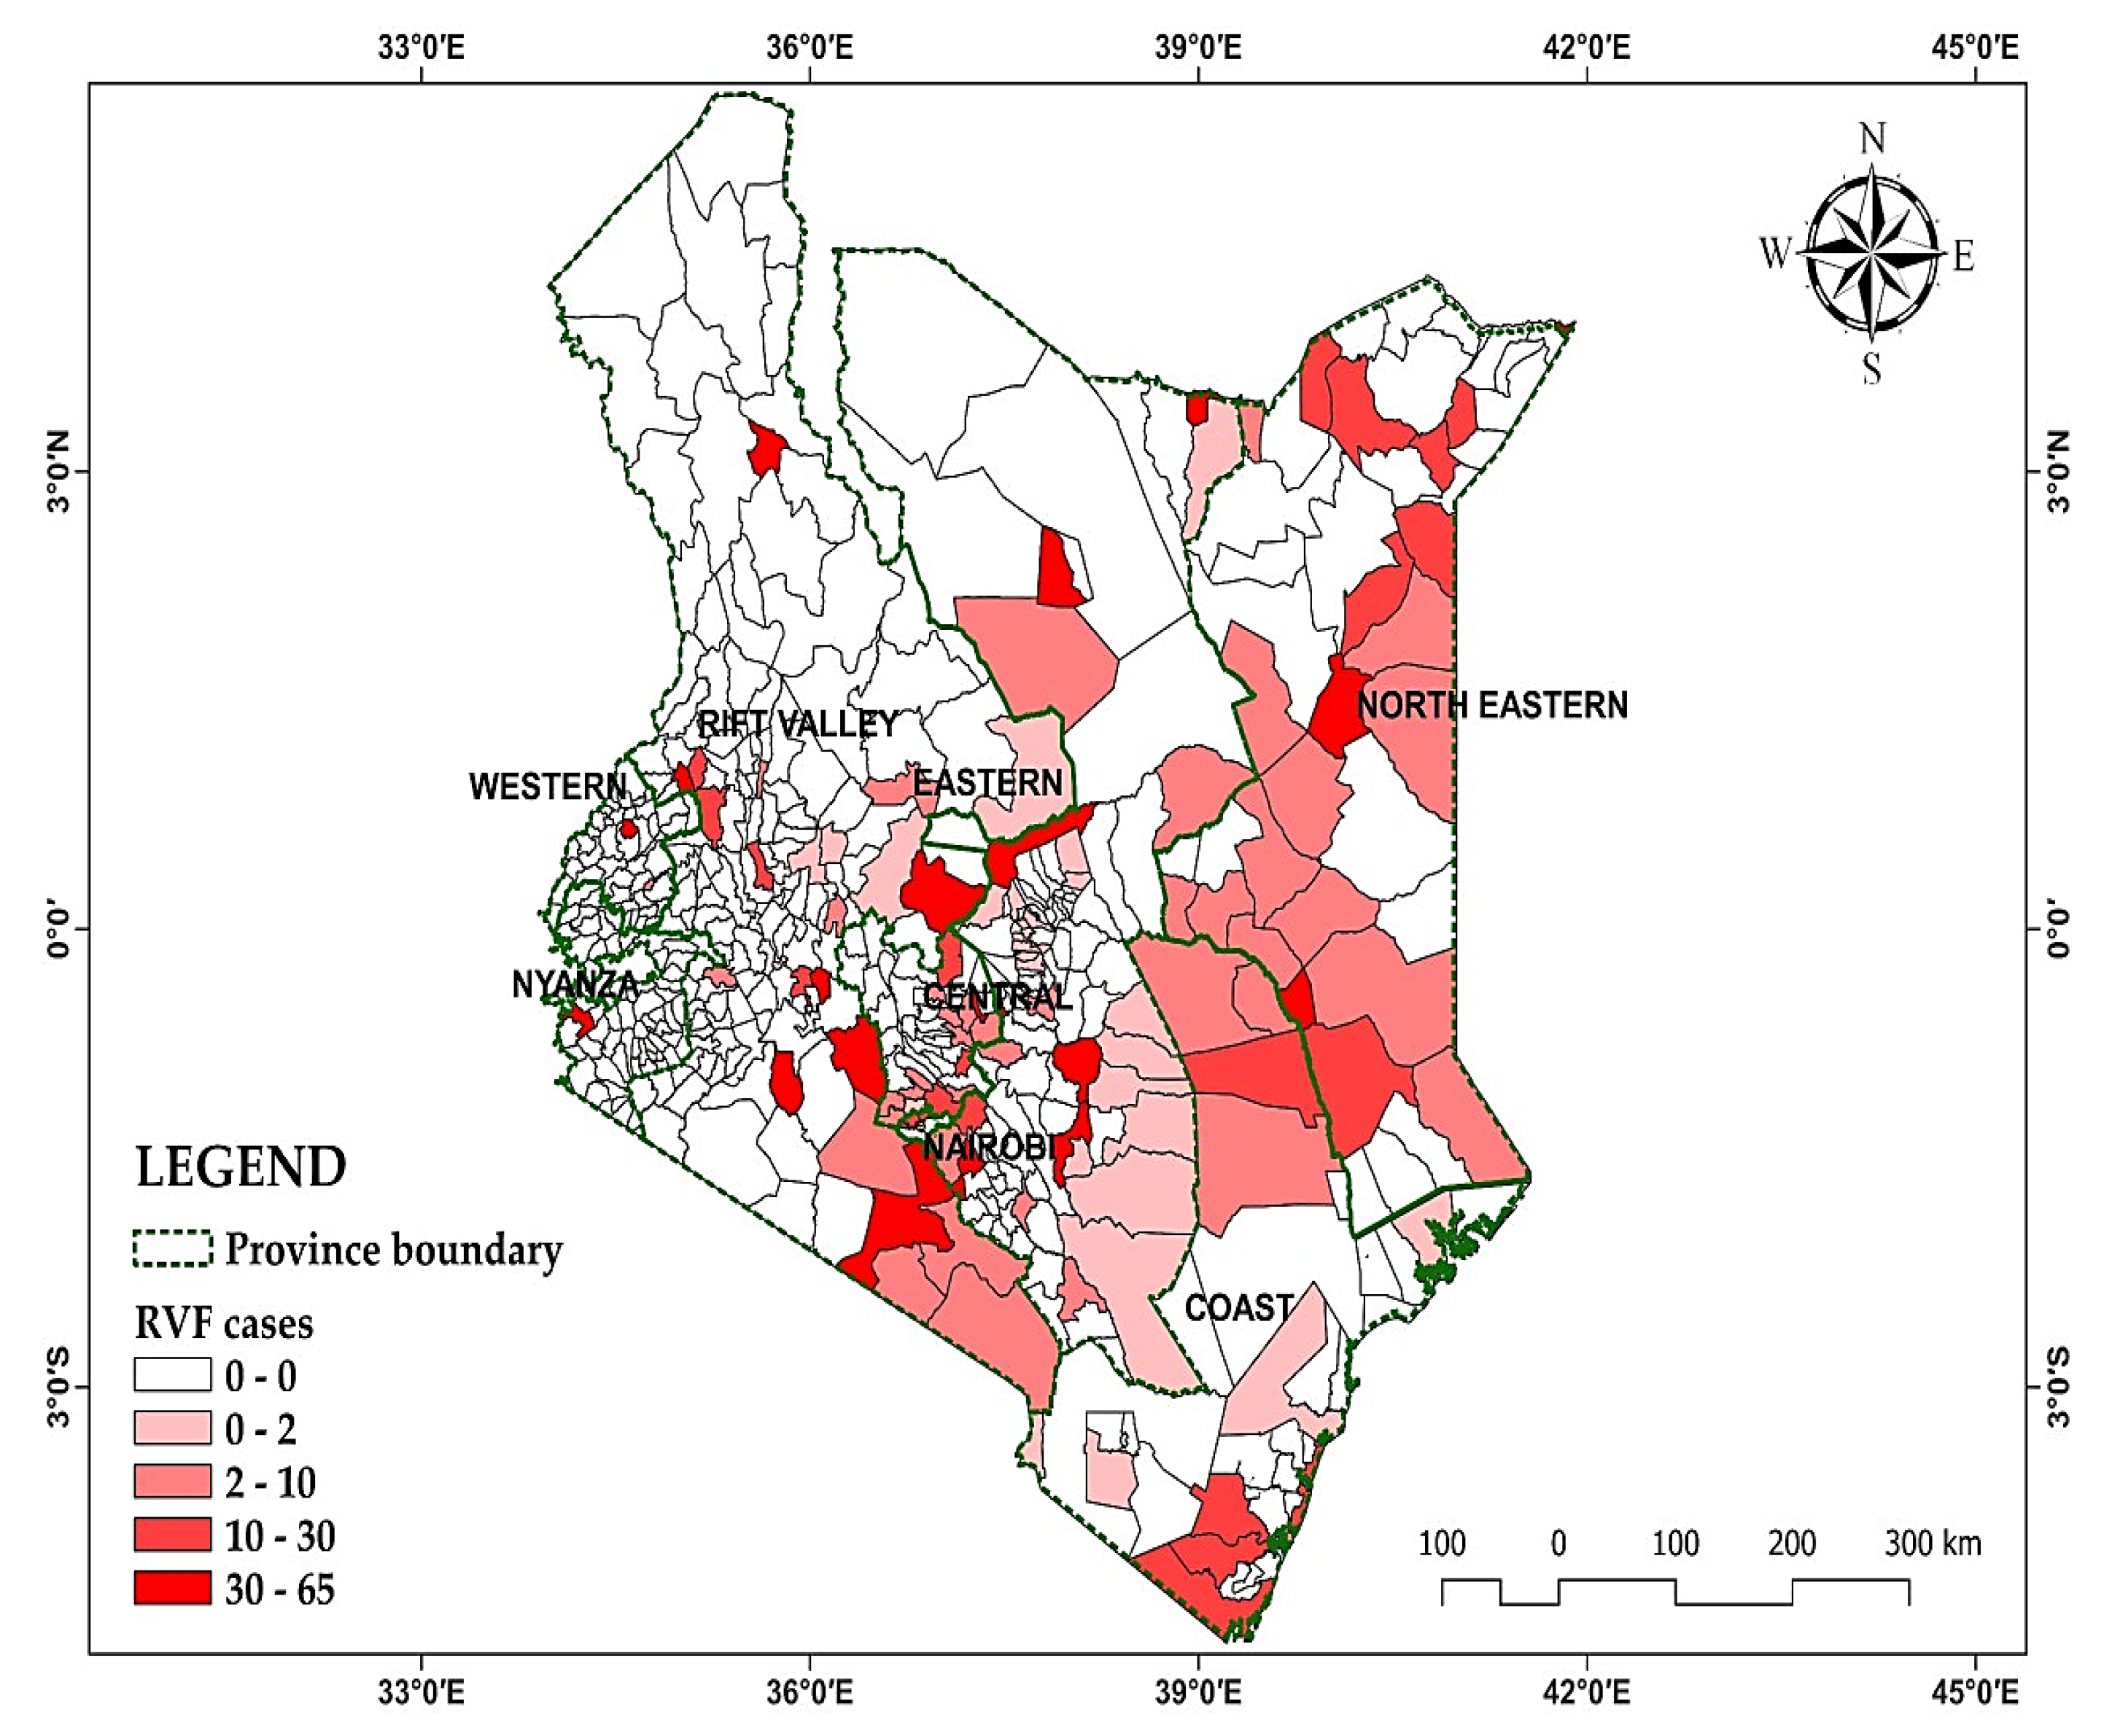
The data encompasses 30 years of monthly Rift Valley Fever (RVF) outbreaks in Kenya from 1981 to 2010 the distribution pattern is mapped in
Figure 1
2.2. Data Description and Attribute Selection
Alongside RVF cases in years, comprehensive topographic details were collected, including climate metrics like rainfall (mm), humidity, and slope, sourced from the meteorological department. These variables are continuous, while the target variable, the occurrence of RVF outbreaks, is binary ( "1 = RVF outbreak, 0 = No outbreak"), denoting its presence or absence within a specific location over a defined period exceeding typical expectations. Additional data categories such as clay patterns were also included following the contribution to a detailed taxonomy of Kenya’s meteorological landscape. The description of variables considered in this study are as outlined in
Table 1. This dataset serves as a rich resource for analysing the interplay between environmental factors and the prevalence of RVF, facilitating informed research and mitigation strategies.
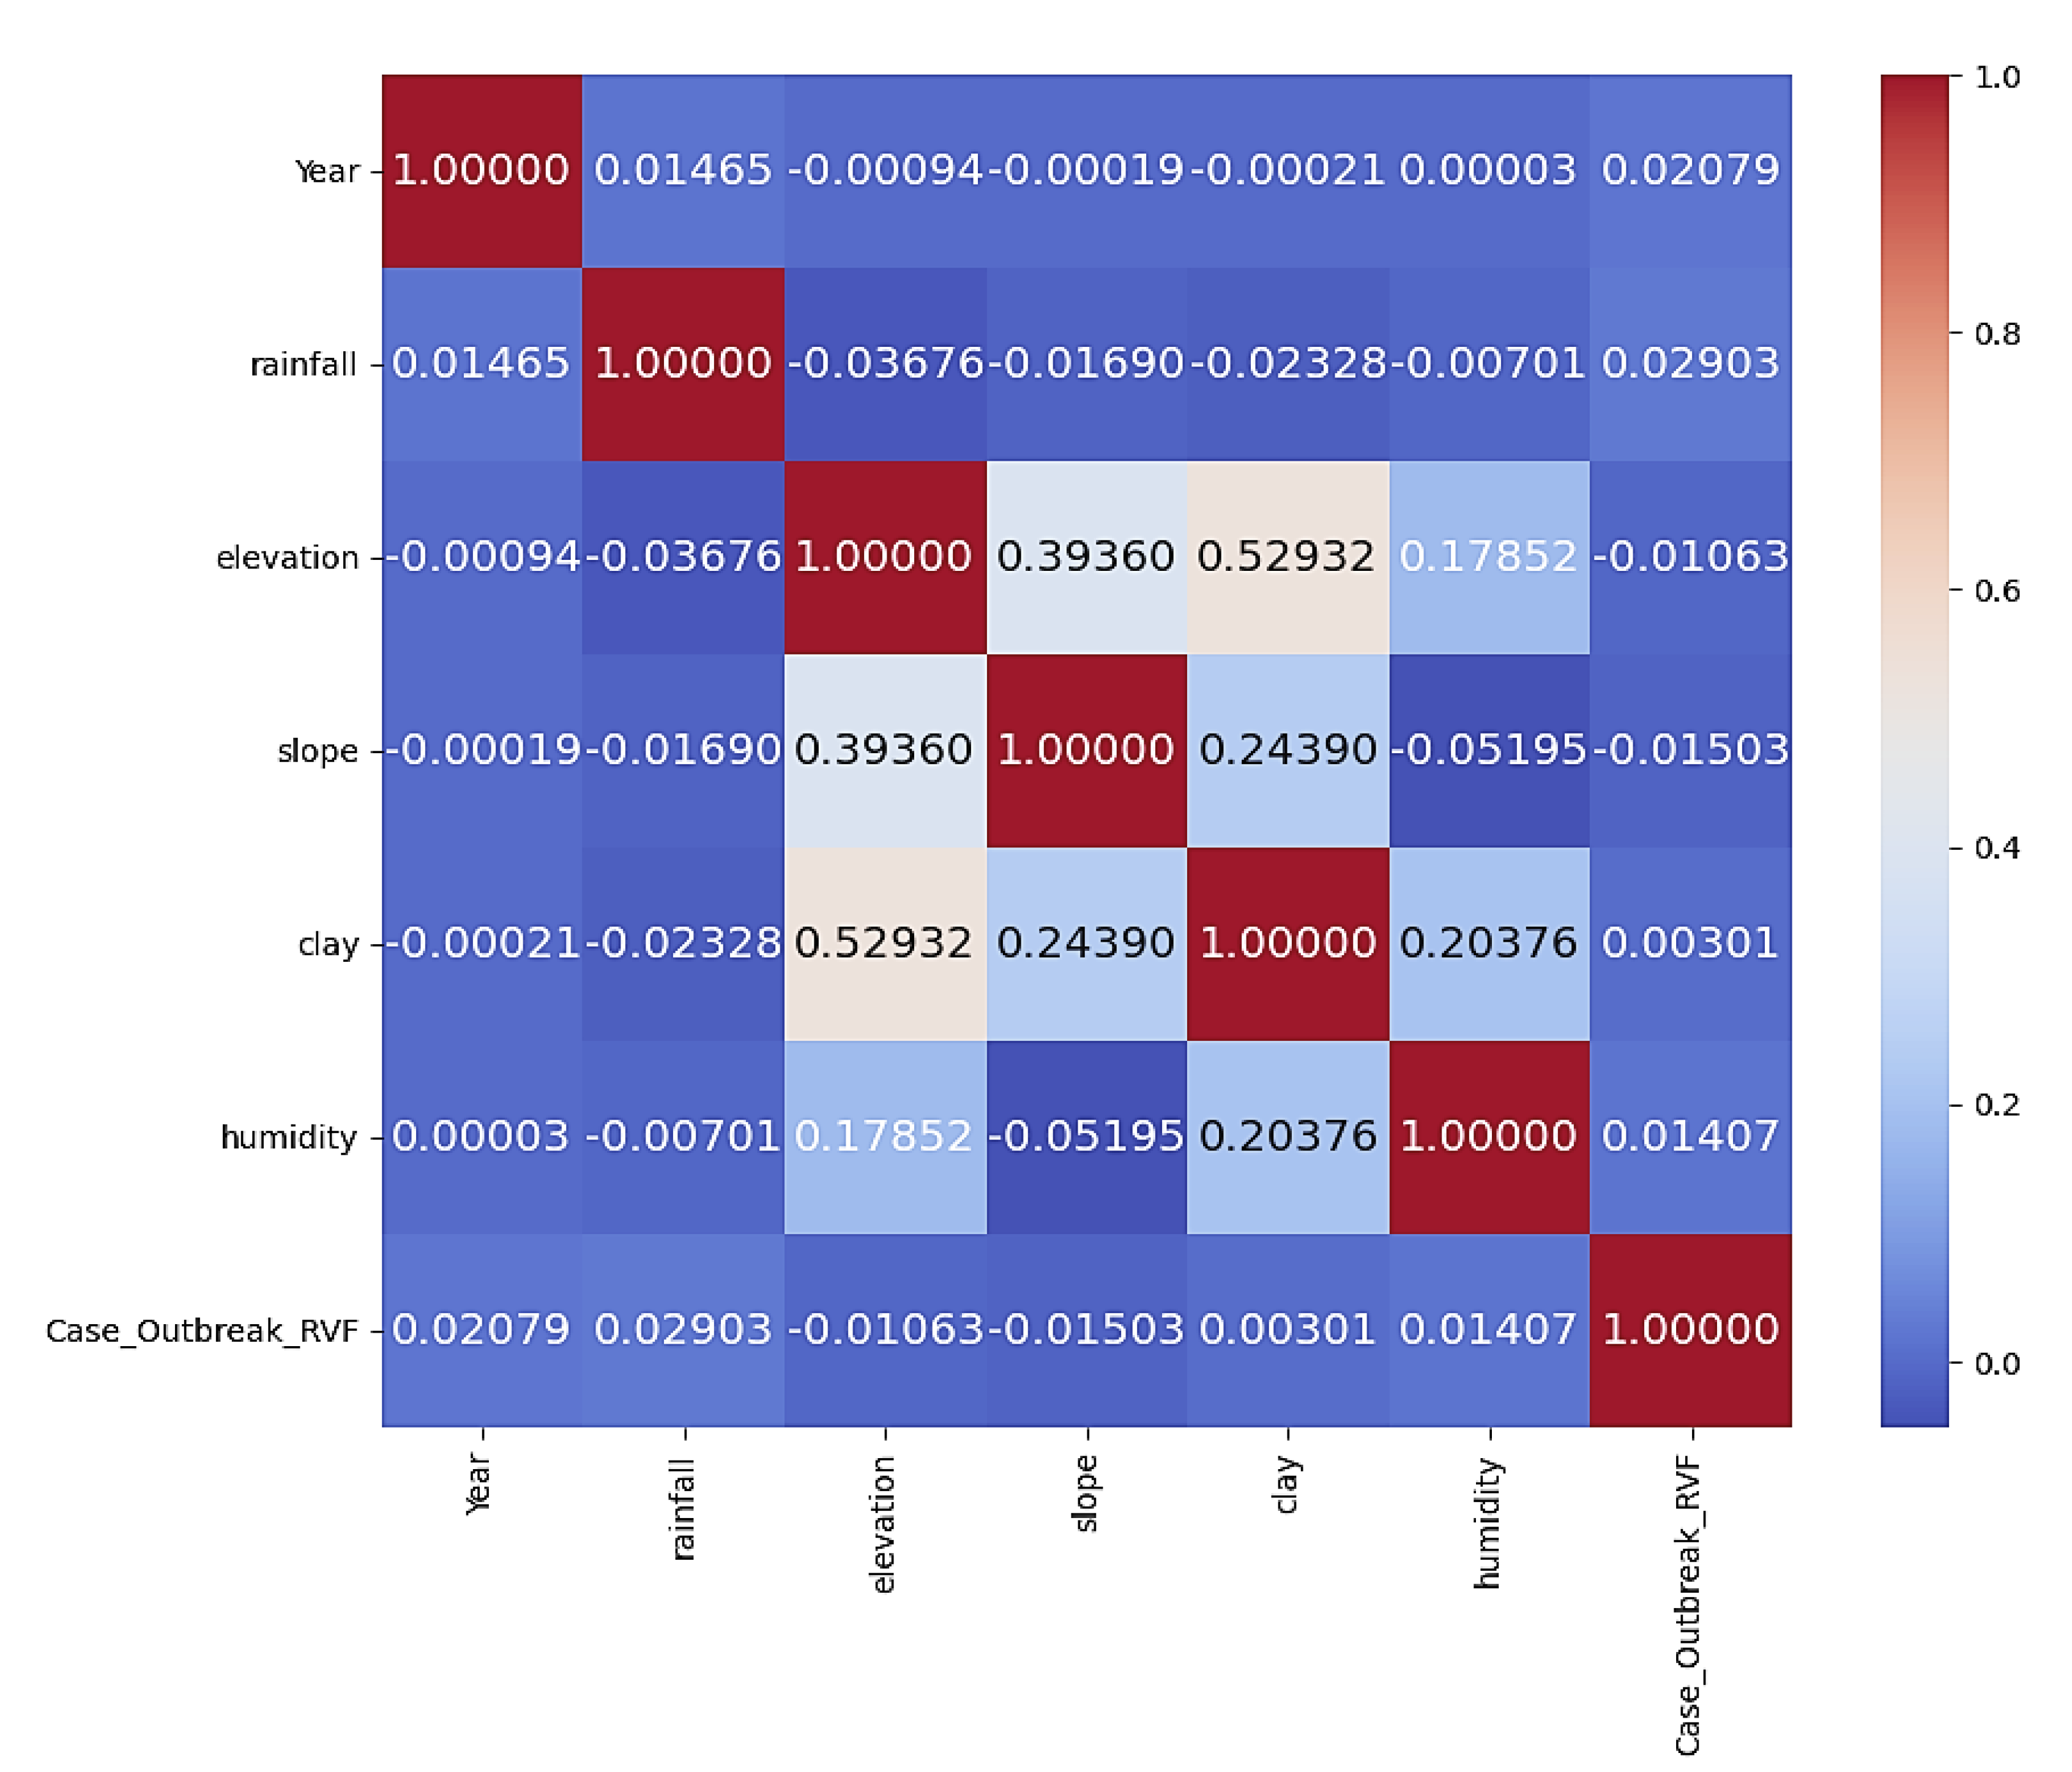
Using Pearson correlation coefficients, we measured the strength and direction of linear relationships between continuous variables, such as rainfall, humidity, and slope, within our datasets. A correlation coefficient close to +1 meaning a strong positive relationship, while any value near -1 meaning a strong negative relationship. Values close to 0 means a weak or it means no linear relationship and been shown on the correlation matrix.
2.3. Machine Learning Methodology
2.3.1. Data Pre - Processing
In this study, our initial dataset contained 181,801 records, which were reduced to 180,289 after removing outliers. Specifically, 1,512 records were identified as outliers and eliminated. Following outlier removal, data splitting was conducted with test size of 0.2 (meaning 80% for train data and 20% for test data) and the random state used was 42 indicating that the randomly train and test sets was obtained across different 42 executions. The training and testing sets split in an 80:20 ratio makes the splitting in the ratio 1:3:3:5, resulting in training, testing, and validation sets that adequately represent the dataset’s variability having 144230 and 36058 split of raw data.
2.4. Models in Machine Learning
In this study we applied various Machine Learning (ML) methods to address classification tasks within our dataset. These methods included Linear Discriminant Analysis (LDA), Logistic Regression (LR), Gaussian Naive Bayes (NB), K-Nearest Neighbours (KNN) ), Support Vector Machines (SVM), Decision Tree Classifier (CART), Random Forest (RF), and XGBoost (Extreme Gradient Boosting). Each of these ML models offers distinct advantages and is suited for different types of data and tasks. Logistic Regression is effective for binary classification tasks and provides interpretable results. Linear Discriminant Analysis works well with multiclass classification and assumes normality in data distribution. K-Nearest Neighbours is a non-parametric method suitable for small datasets and simple decision boundaries.
Decision Tree Classifier is intuitive, simple to interpret, and can handle both categorical data and numerical data. Gaussian Naive Bayes is efficient with large datasets and works well with categorical data. Support Vector Machines are powerful for complex classification tasks and can handle high-dimensional data effectively. Random Forest is an ensemble method that reduces over fitting and improves accuracy by aggregating predictions from multiple decision trees. XGBoost is known for its speed and performance, particularly in large datasets, and is widely used in competitions and real-world applications.
Using a variety of ML models allows us to compare their performance, identify the most suitable model for our dataset, and improve the robustness and reliability of our classification results. Each model brings unique strengths and capabilities, and by leveraging multiple models, we can enhance our understanding of the data and make more accurate predictions or classifications.
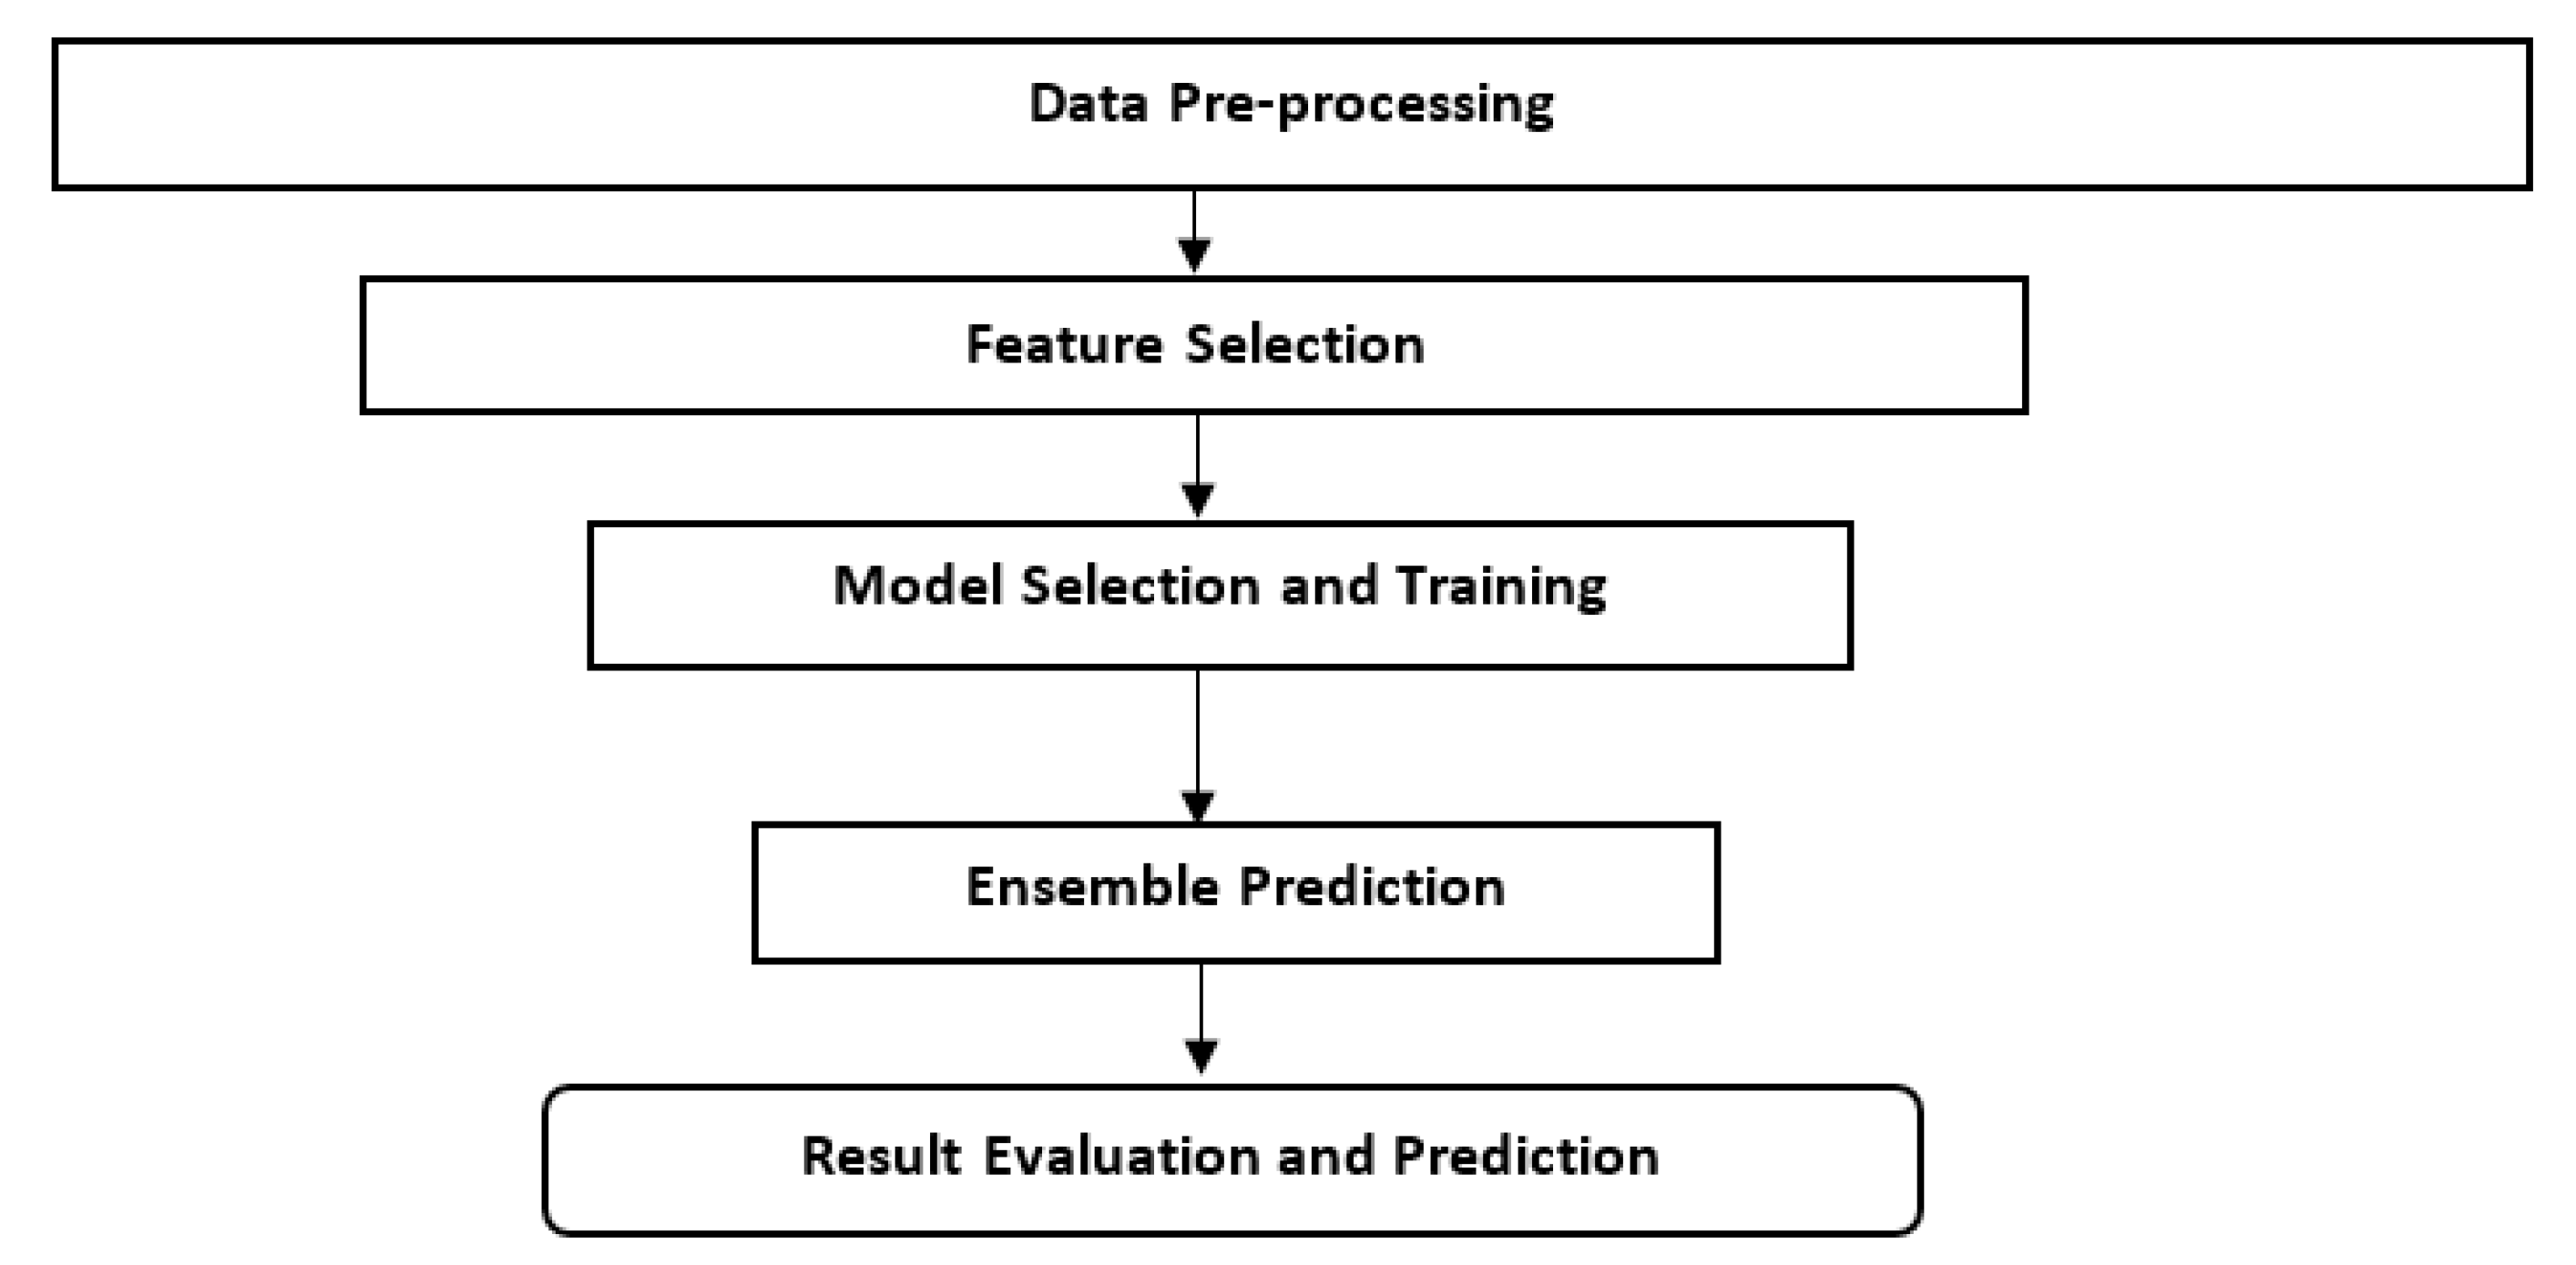
2.5. Analytical Flow Chart Approach
The overall flowchart of our study’s Machine Learning (ML) approach for predicting Rift Valley Fever (RVF) outbreaks in Kenya begins with data collection and preprocessing, followed by data cleaning and outlier removal using Isolation Forest.
2.6. Evaluation Metrics in Machine Learning
In predicting RVF cases in Kenya, the evaluation of our Machine Learning (ML) models is crucial for assessing their effectiveness and reliability. We utilized a range of evaluation metrics tailored to the nature of our classification task and the specific challenges posed by RVF outbreak prediction which is as shown in
Table 2.
3. Results
3.1. Descriptive Statistics of Data Used
Table 3 presents the prevalence of Rift Valley Fever (RVF) cases in Kenya from 1981 up to the year 2010, categorized by province. The table shows the number of RVF cases reported in each province, along with the corresponding percentage of RVF cases relative to the total cases reported across all provinces. The provinces are listed with their respective RVF case counts, ranging from 0 cases in Nyanza and Western provinces to the highest number of cases in Rift Valley province with 116 cases in Rift Valley province.
The percentages highlight the distribution of RVF cases across different regions of Kenya, indicating that Rift Valley province had the highest proportion of RVF cases at 26.8%, followed by Eastern province at 20.6%, Northeastern province at 18.9%, and Central province at 14.5%. Coast province had 10.6% of RVF cases, while Nairobi had 8.5%. Notably, Nyanza and Western provinces did not report any RVF cases during this period. This data provides valuable insights into the geographic distribution and prevalence of RVF cases within Kenya, aiding in understanding disease patterns and informing public health strategies and interventions, [
7].
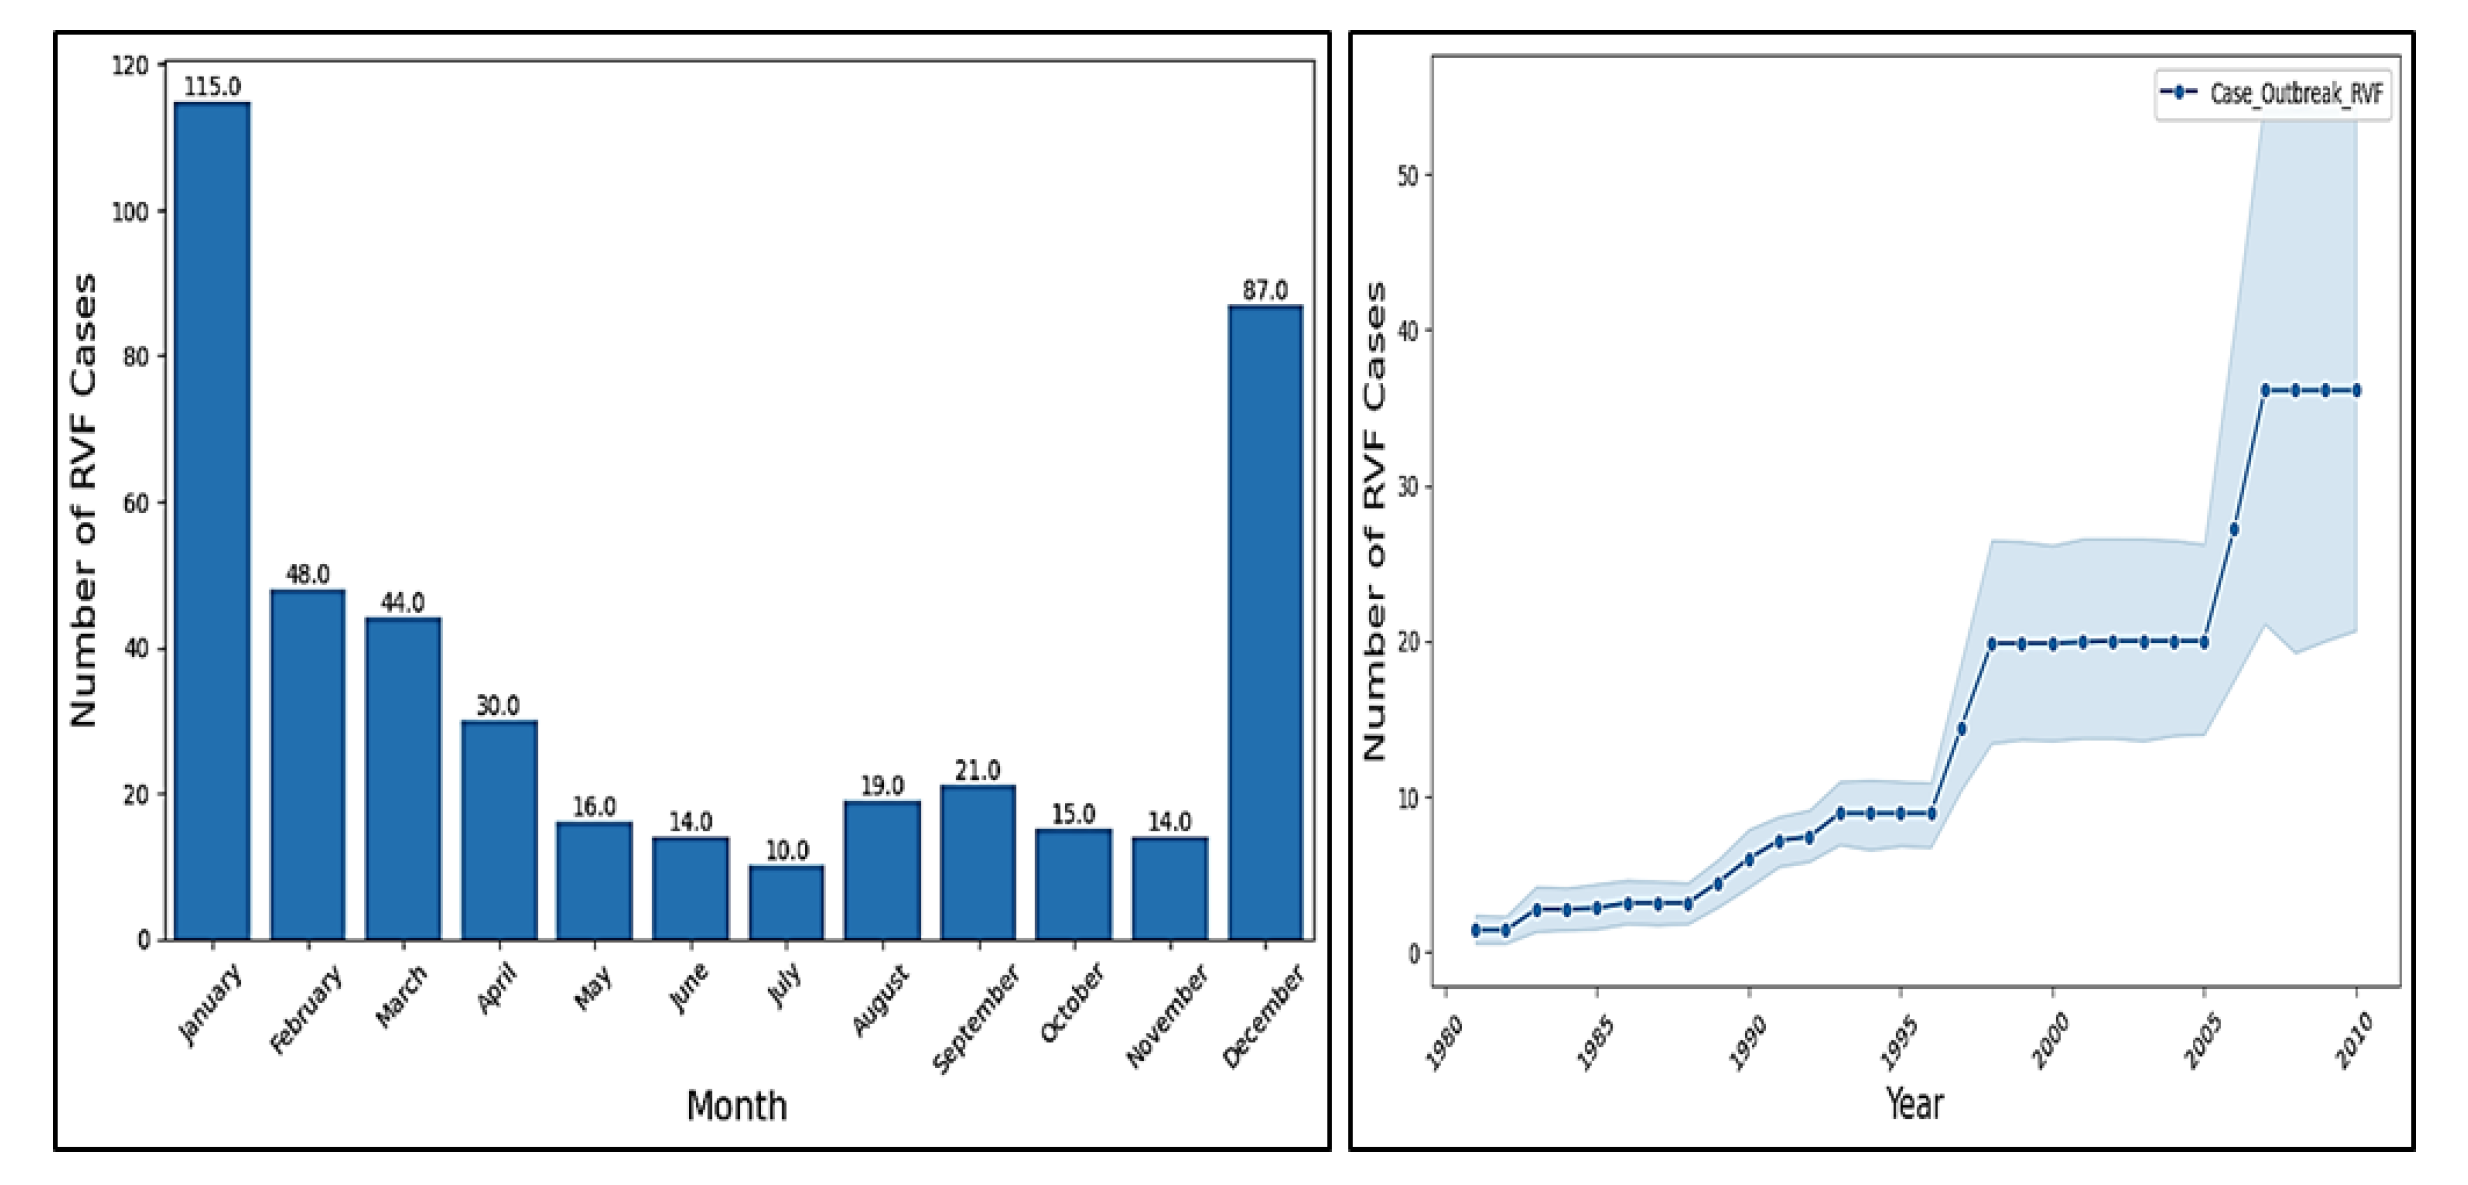
The provided context contains a dataset of Rift Valley Fever (RVF) cases per month, with a range from January to December. The data indicates that RVF cases are not uniformly distributed throughout the year, with some months experiencing significantly higher numbers of cases (up to 115) compared to others (as low as 10). This variation suggests a potential seasonal pattern, with RVF cases being more frequent during certain months including December up to April, possibly due to factors such as climate, vector activity, or human behaviour. Further ,
Figure 3 shows that the number of RVF (Rift Valley Fever) cases has been steadily increasing over time, with a significant jump between 1996 to 2007. The trend continues to rise, with a consistent upward slope from 1996 to 2010. This suggests that the disease is becoming more prevalent, and it’s essential to take measures to control its spread and mitigate its impact on public health.
3.1.1. Correlation across Variables
The correlation matrix in
Figure 4 provides insights into the relationships between various variables and their impact on the outbreak of Rift Valley Fever (RVF). Among the variables positively impacting RVF outbreak cases, rainfall shows a slight positive correlation (0.02903), indicating that higher rainfall levels may contribute slightly to increased RVF cases. Similarly, the positive correlation with humidity (0.01407) suggests that higher humidity levels might contribute slightly to increased RVF cases. Additionally, Year also exhibits a positive correlation (0.02079) with RVF outbreak cases. Conversely, variables such as elevation (-0.01063) and slope (-0.01503) show negligible correlations with RVF outbreak cases, suggesting that these factors may not significantly influence the occurrence of RVF outbreaks. The positive correlation with clay patterns (0.00301) implies that specific soil characteristics, possibly related to clay content, may have a minor impact on the occurrence of RVF outbreaks.
3.2. Model Selection and Evaluation
In this section, we delve into the critical process of selecting appropriate Machine Learning (ML) models for predicting Rift Valley Fever (RVF) outbreaks in Kenya. This section outlines the rationale behind choosing specific ML algorithms and details the evaluation metrics used to assess the performance of these models. By thoroughly examining the model selection criteria and evaluation methods, we aim to ensure the reliability, accuracy, and robustness of our prediction tool, ultimately contributing to effective public health management strategies for RVF control.
3.3. ML Models Evaluation Metrics and Ensemble Predictions
Among the Machine Learning (ML) models evaluated in Table 4 for predicting Rift Valley Fever (RVF) outbreaks in Kenya, Logistic Regression (LR), Linear Discriminant Analysis (LDA), Support Vector Machines (SVM), Random Forest (RF) and XGBoost demonstrate somehow good performance across various metrics in the context of balanced data. LR and LDA exhibit the highest accuracy scores of 0.997310 and 0.997227, respectively, showcasing their reliability in overall predictions. LR , SVM and RF achieve near-perfect specificity scores of 1.000000 followed by LDA and Xgboost, indicating their proficiency in correctly identifying non-outbreak periods.
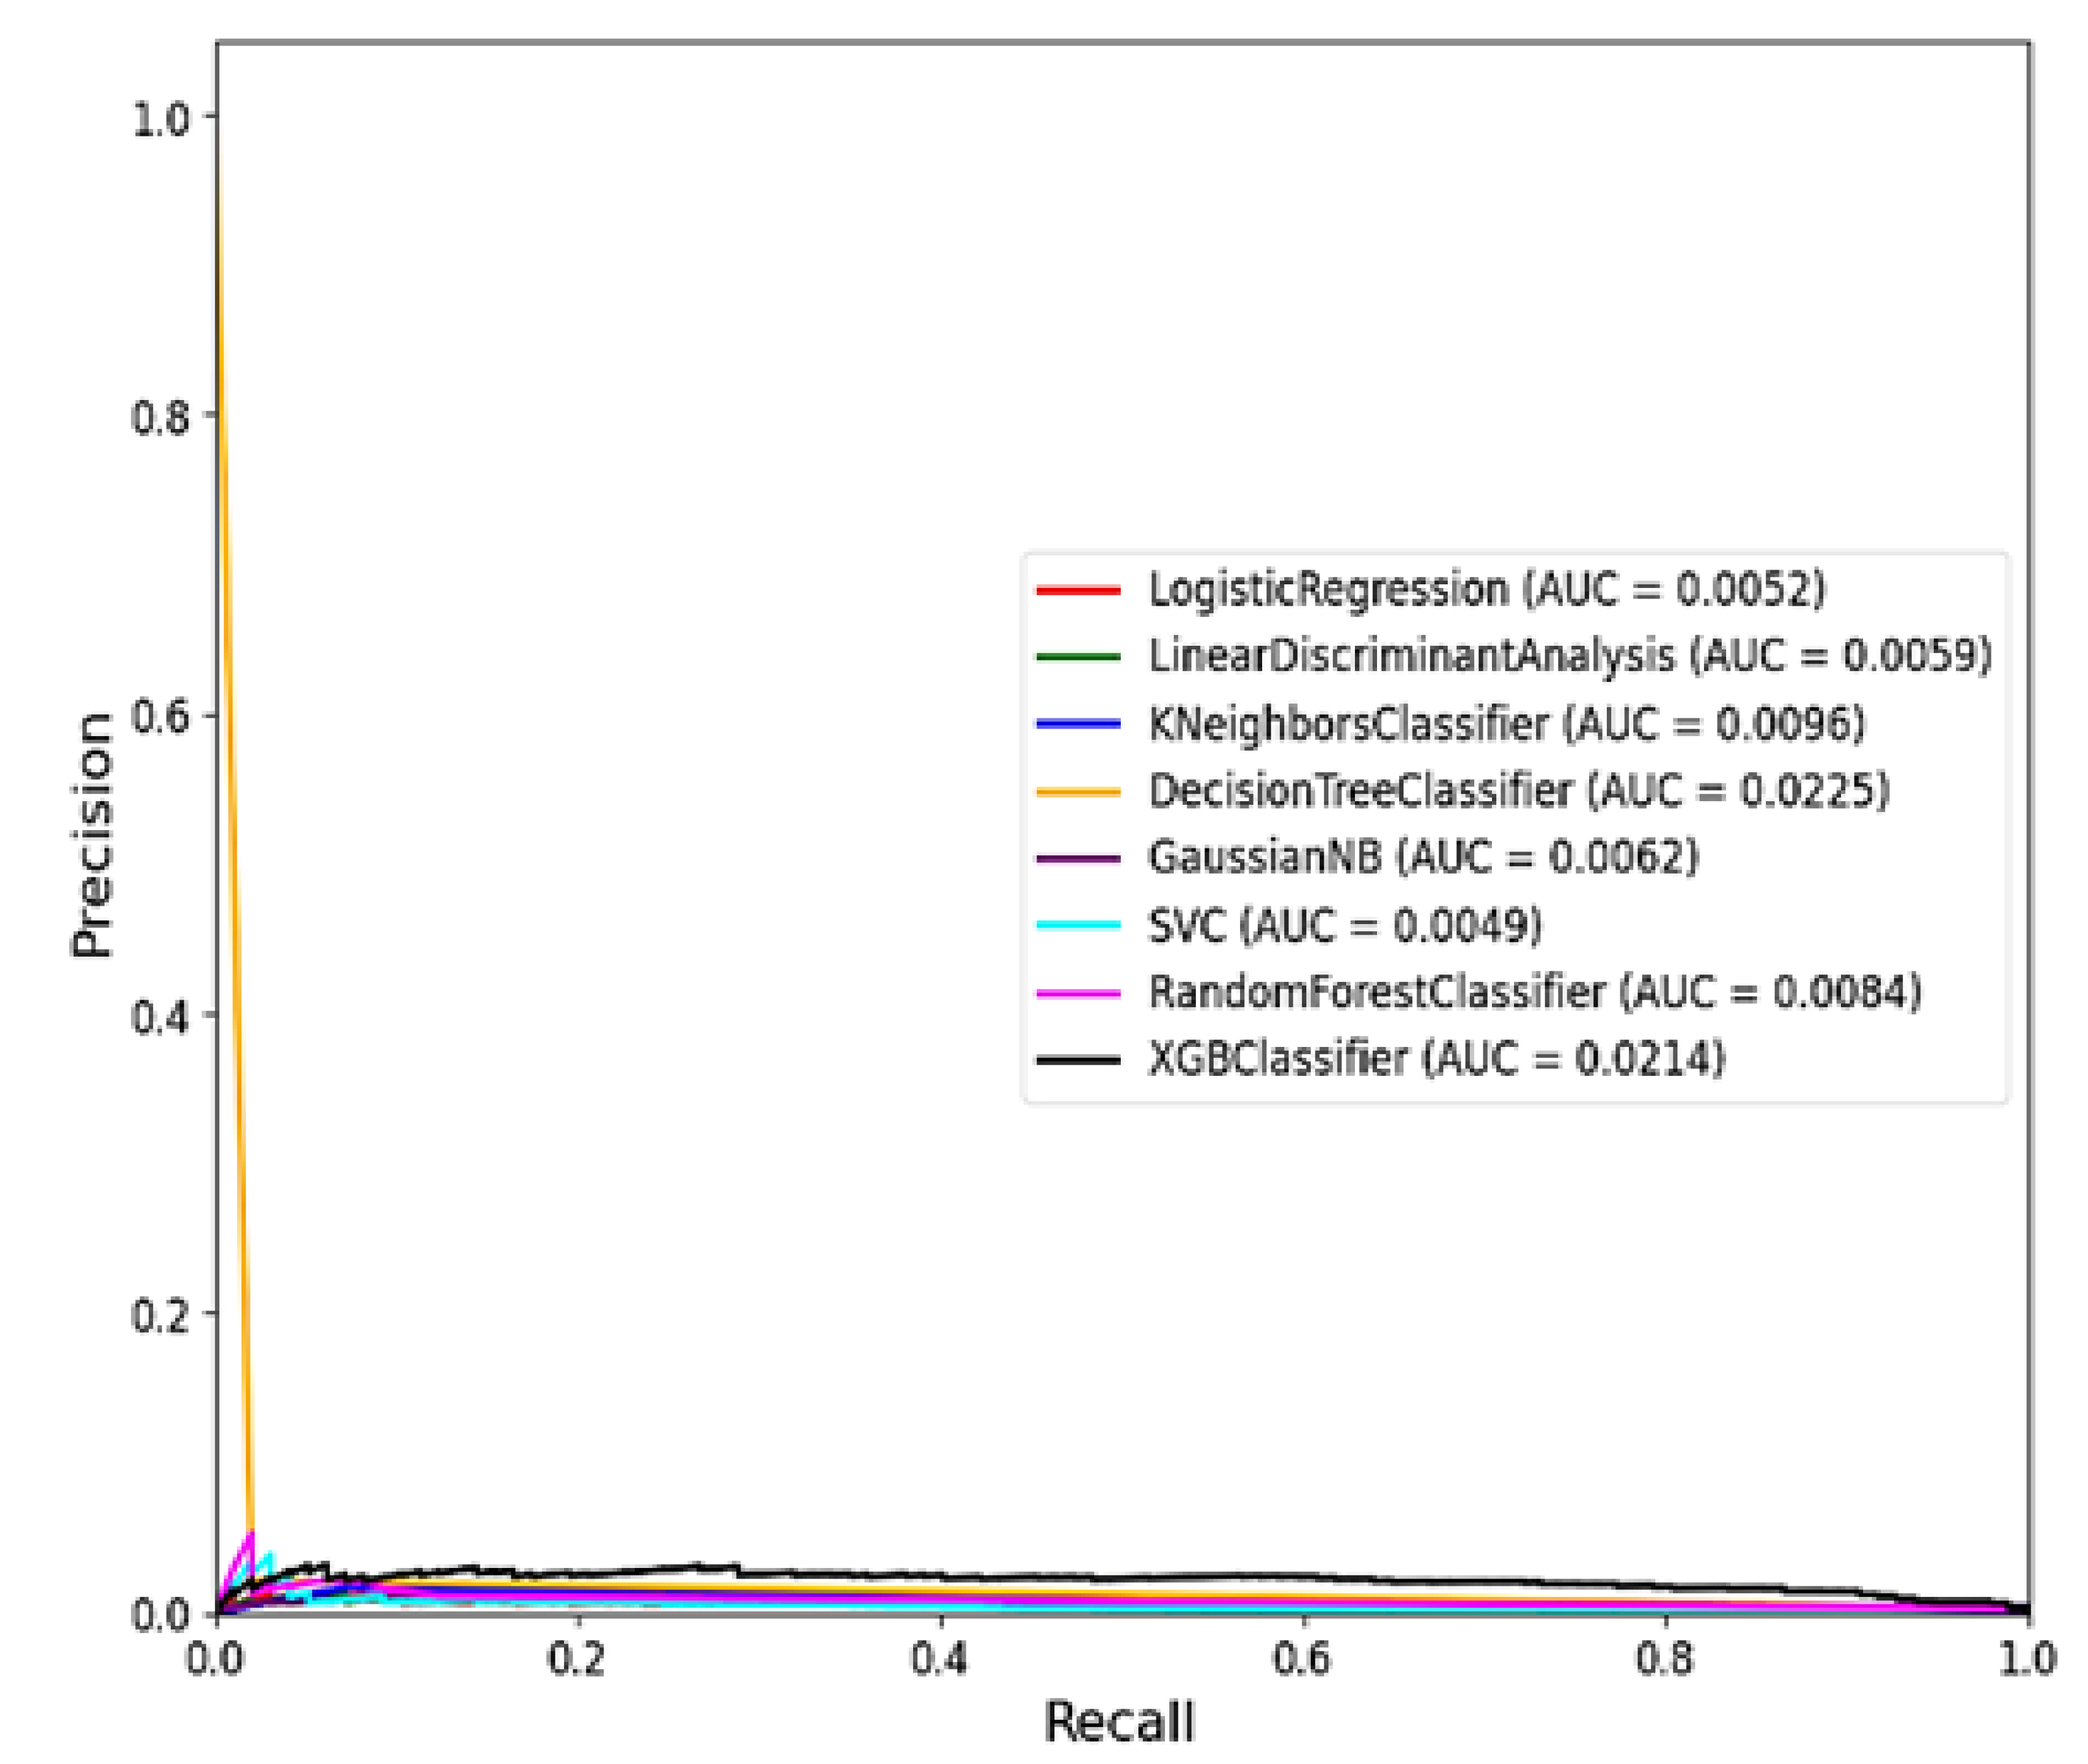
However, none of the models perform well in terms of sensitivity, precision, recall, or F1 score for identifying RVF outbreak cases, as evidenced by low or zero values across these metrics. This discrepancy guided into further model refinement on feature engineering to improve the models’ ability to detect actual RVF outbreaks accurately where by the AUC ROC and PR AUC was used for further comparison and dealing with Imbalanced data.
3.4. Comparison between Machine Learning Models Based on Accuracy
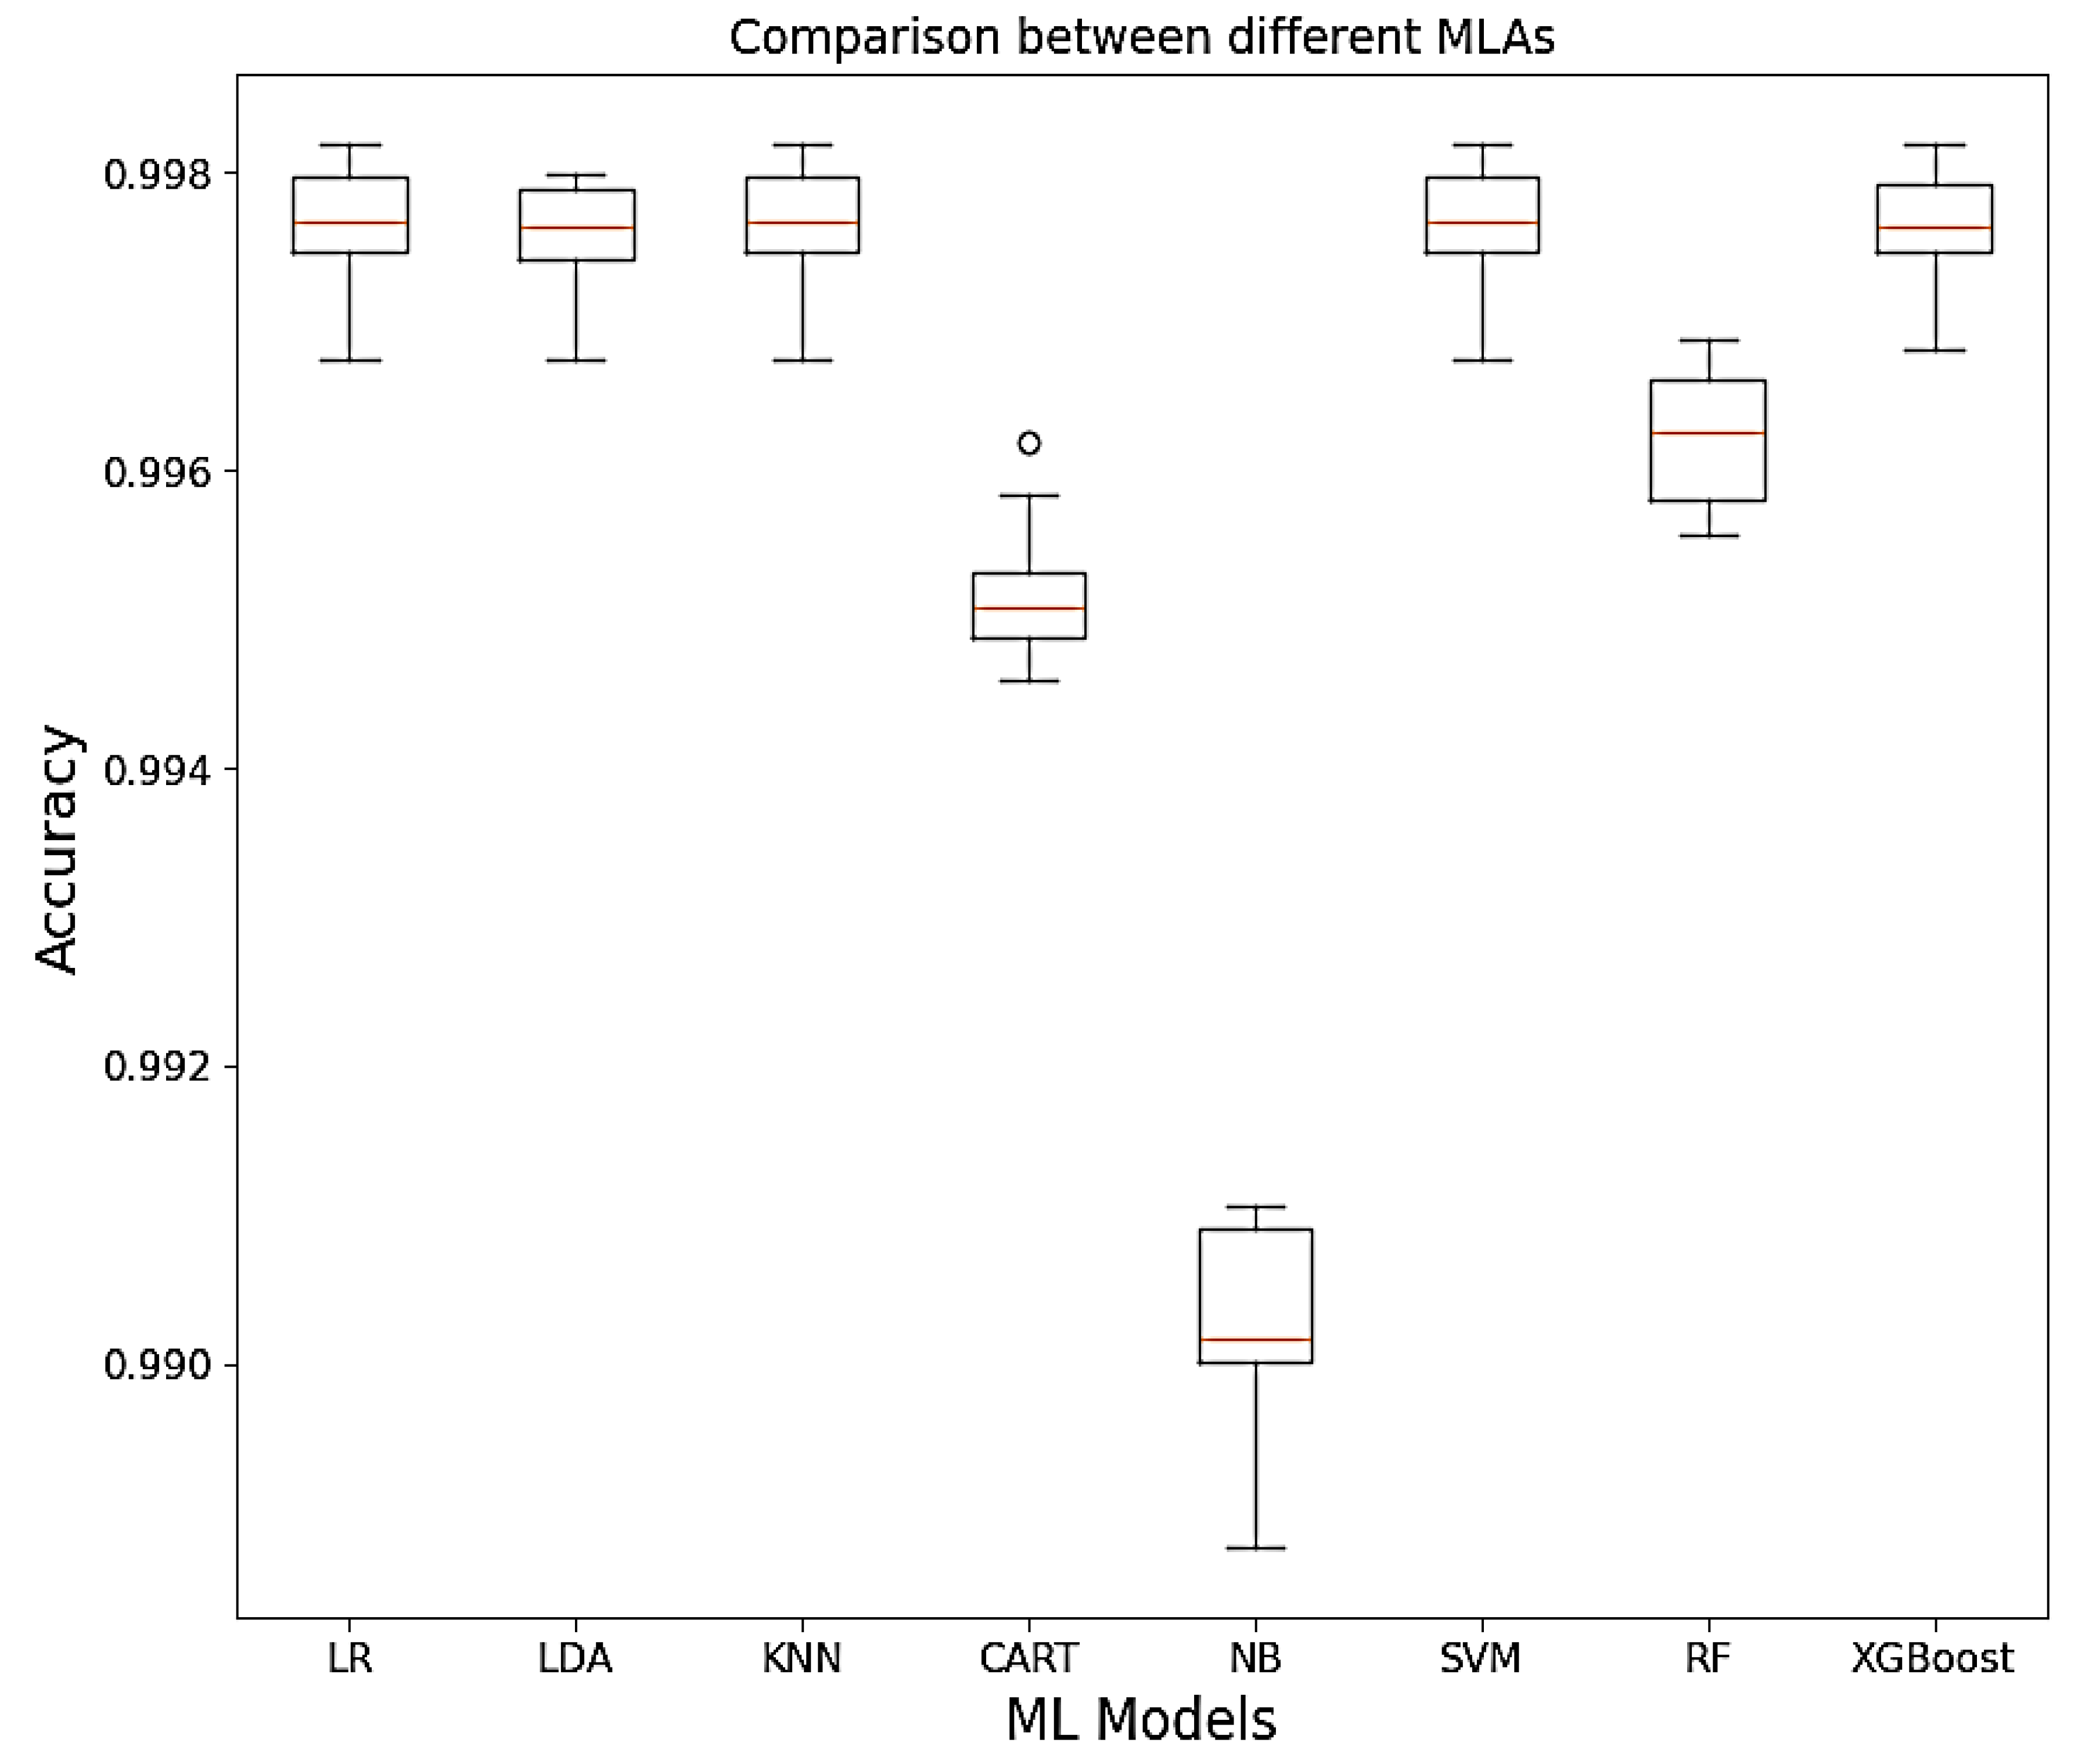
Relying on accuracy of the models,
Figure 5 gives some insight on the model performances by showing that Logistic Regression (LR), Linear Discriminant Analysis (LDA), Support Vector Machines (SVM), Random Forest (RF) and XGBoost has good model accuracy.
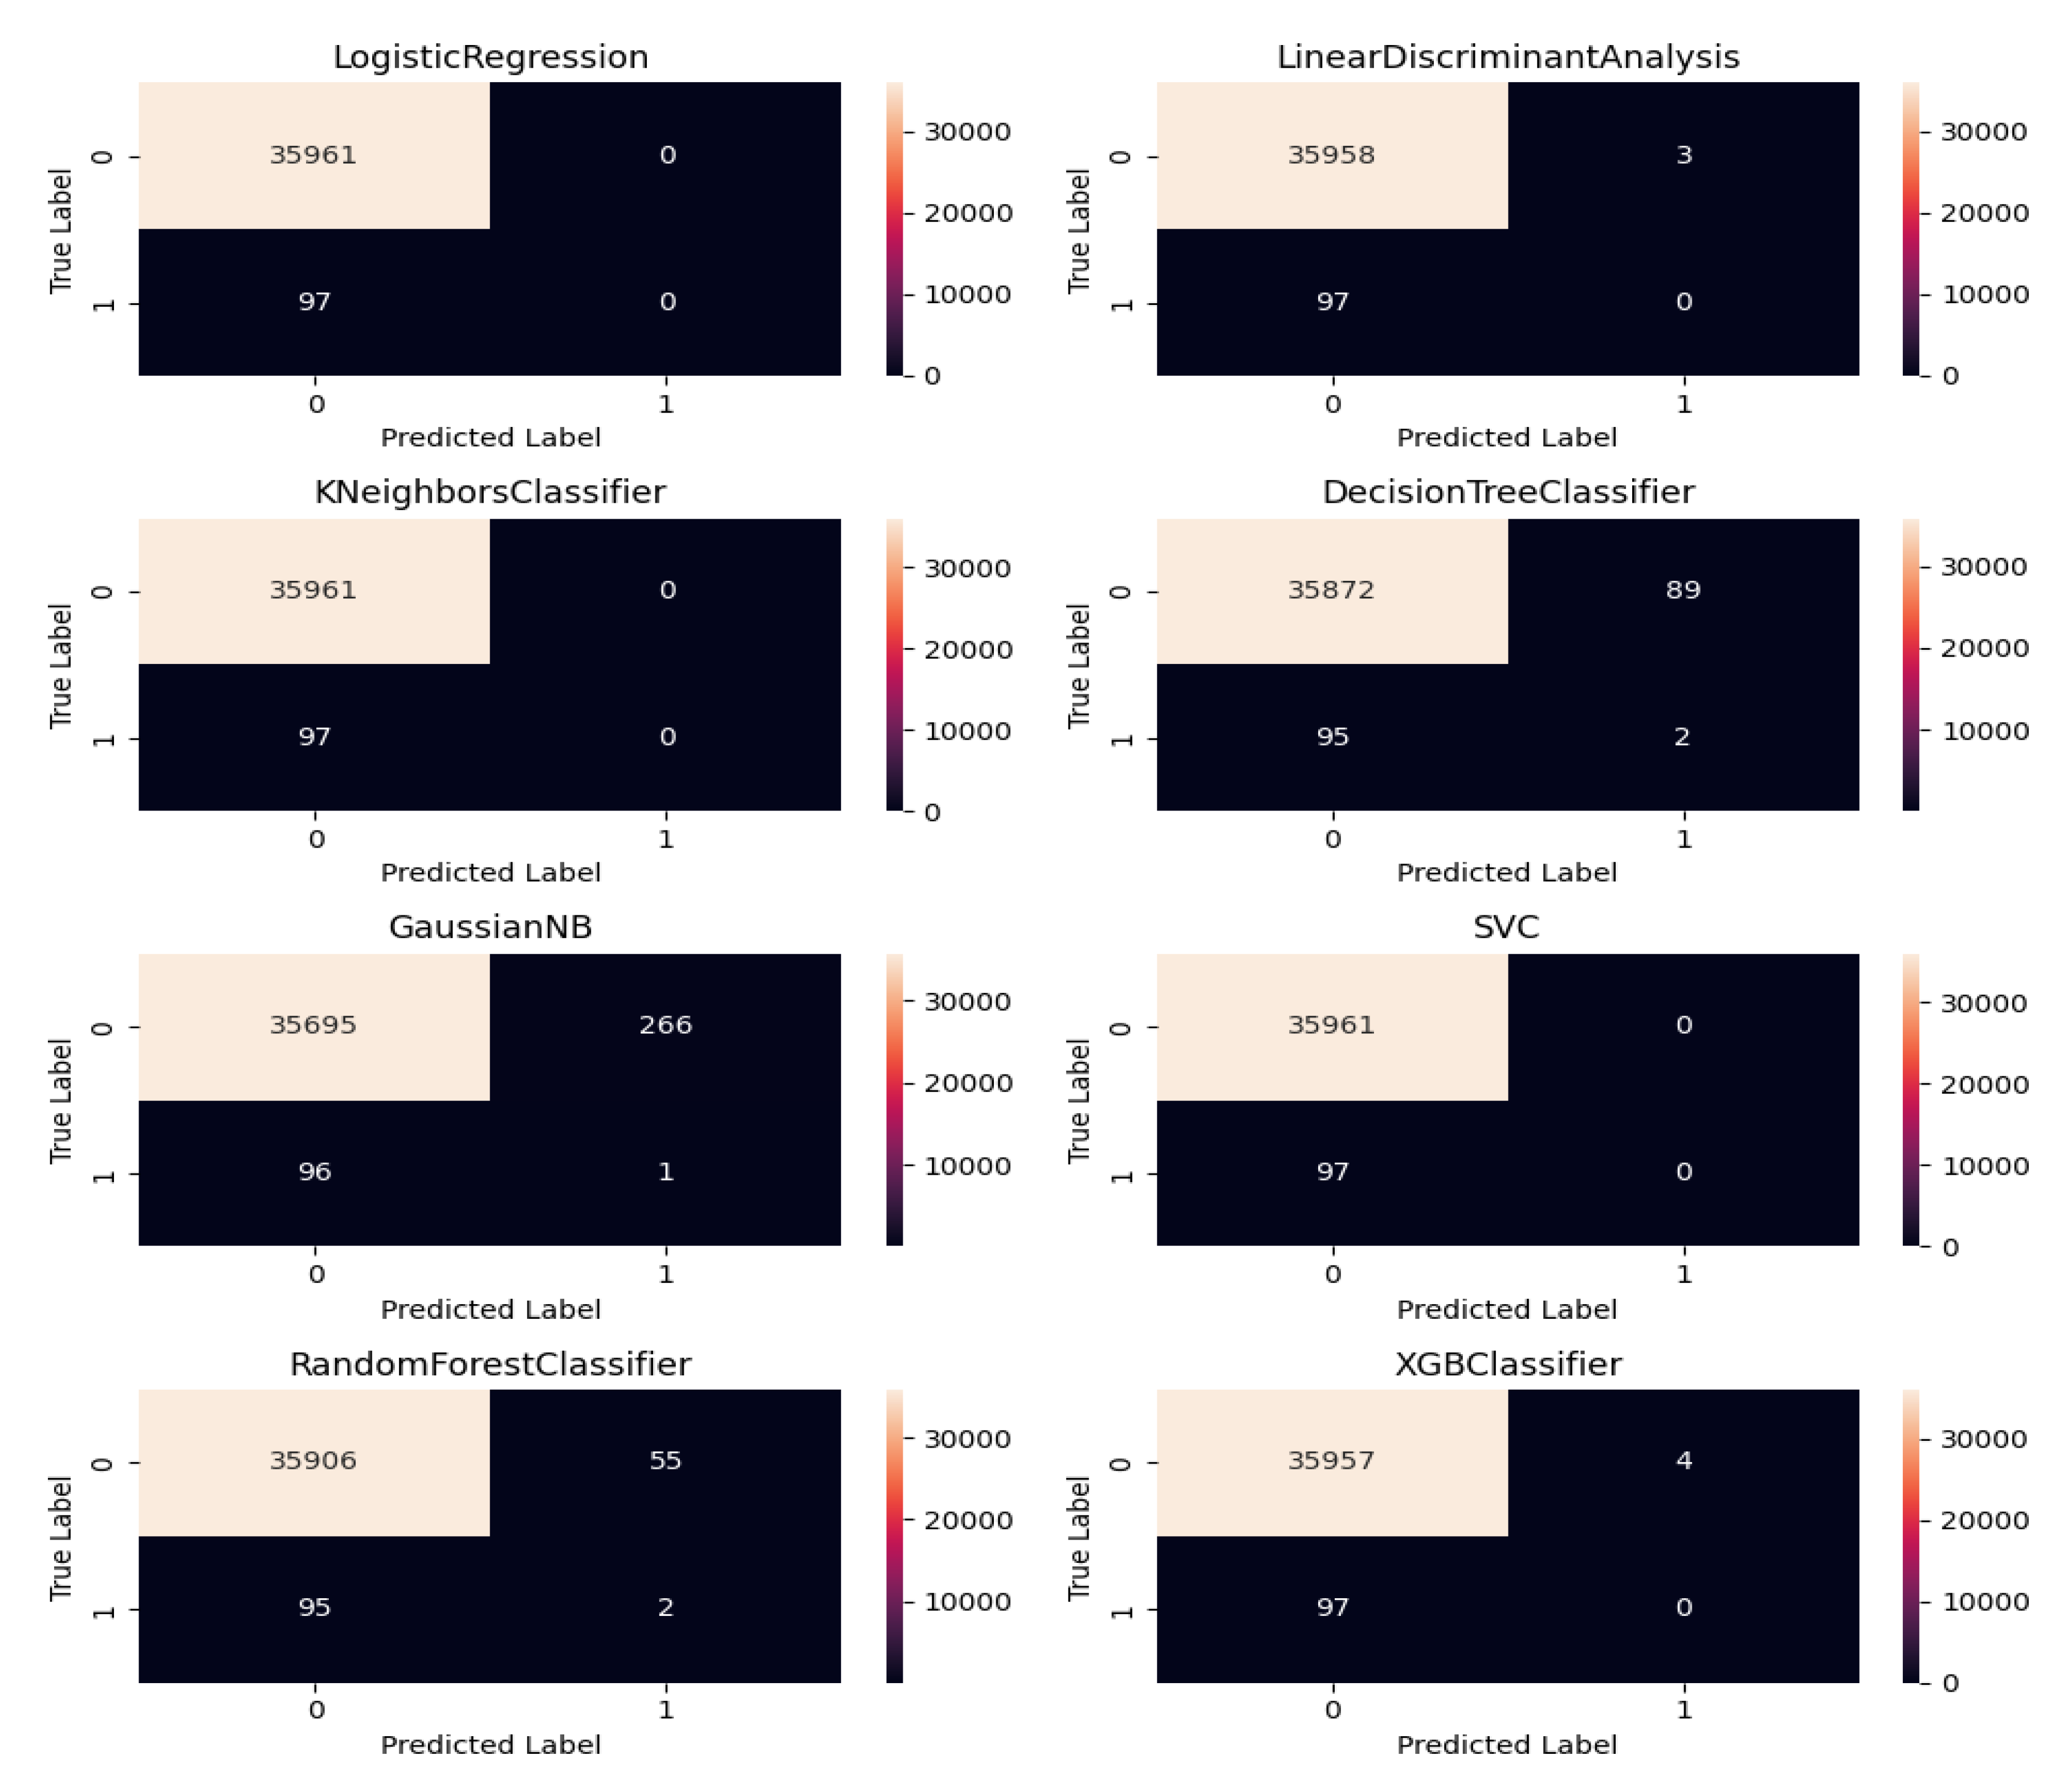
Figure 6 shows the confusion matrix of the ensemble predictions which reflect the performance ML models when predicting RVF cases.
3.5. Advanced Machine Learning Models Evaluation Metrics
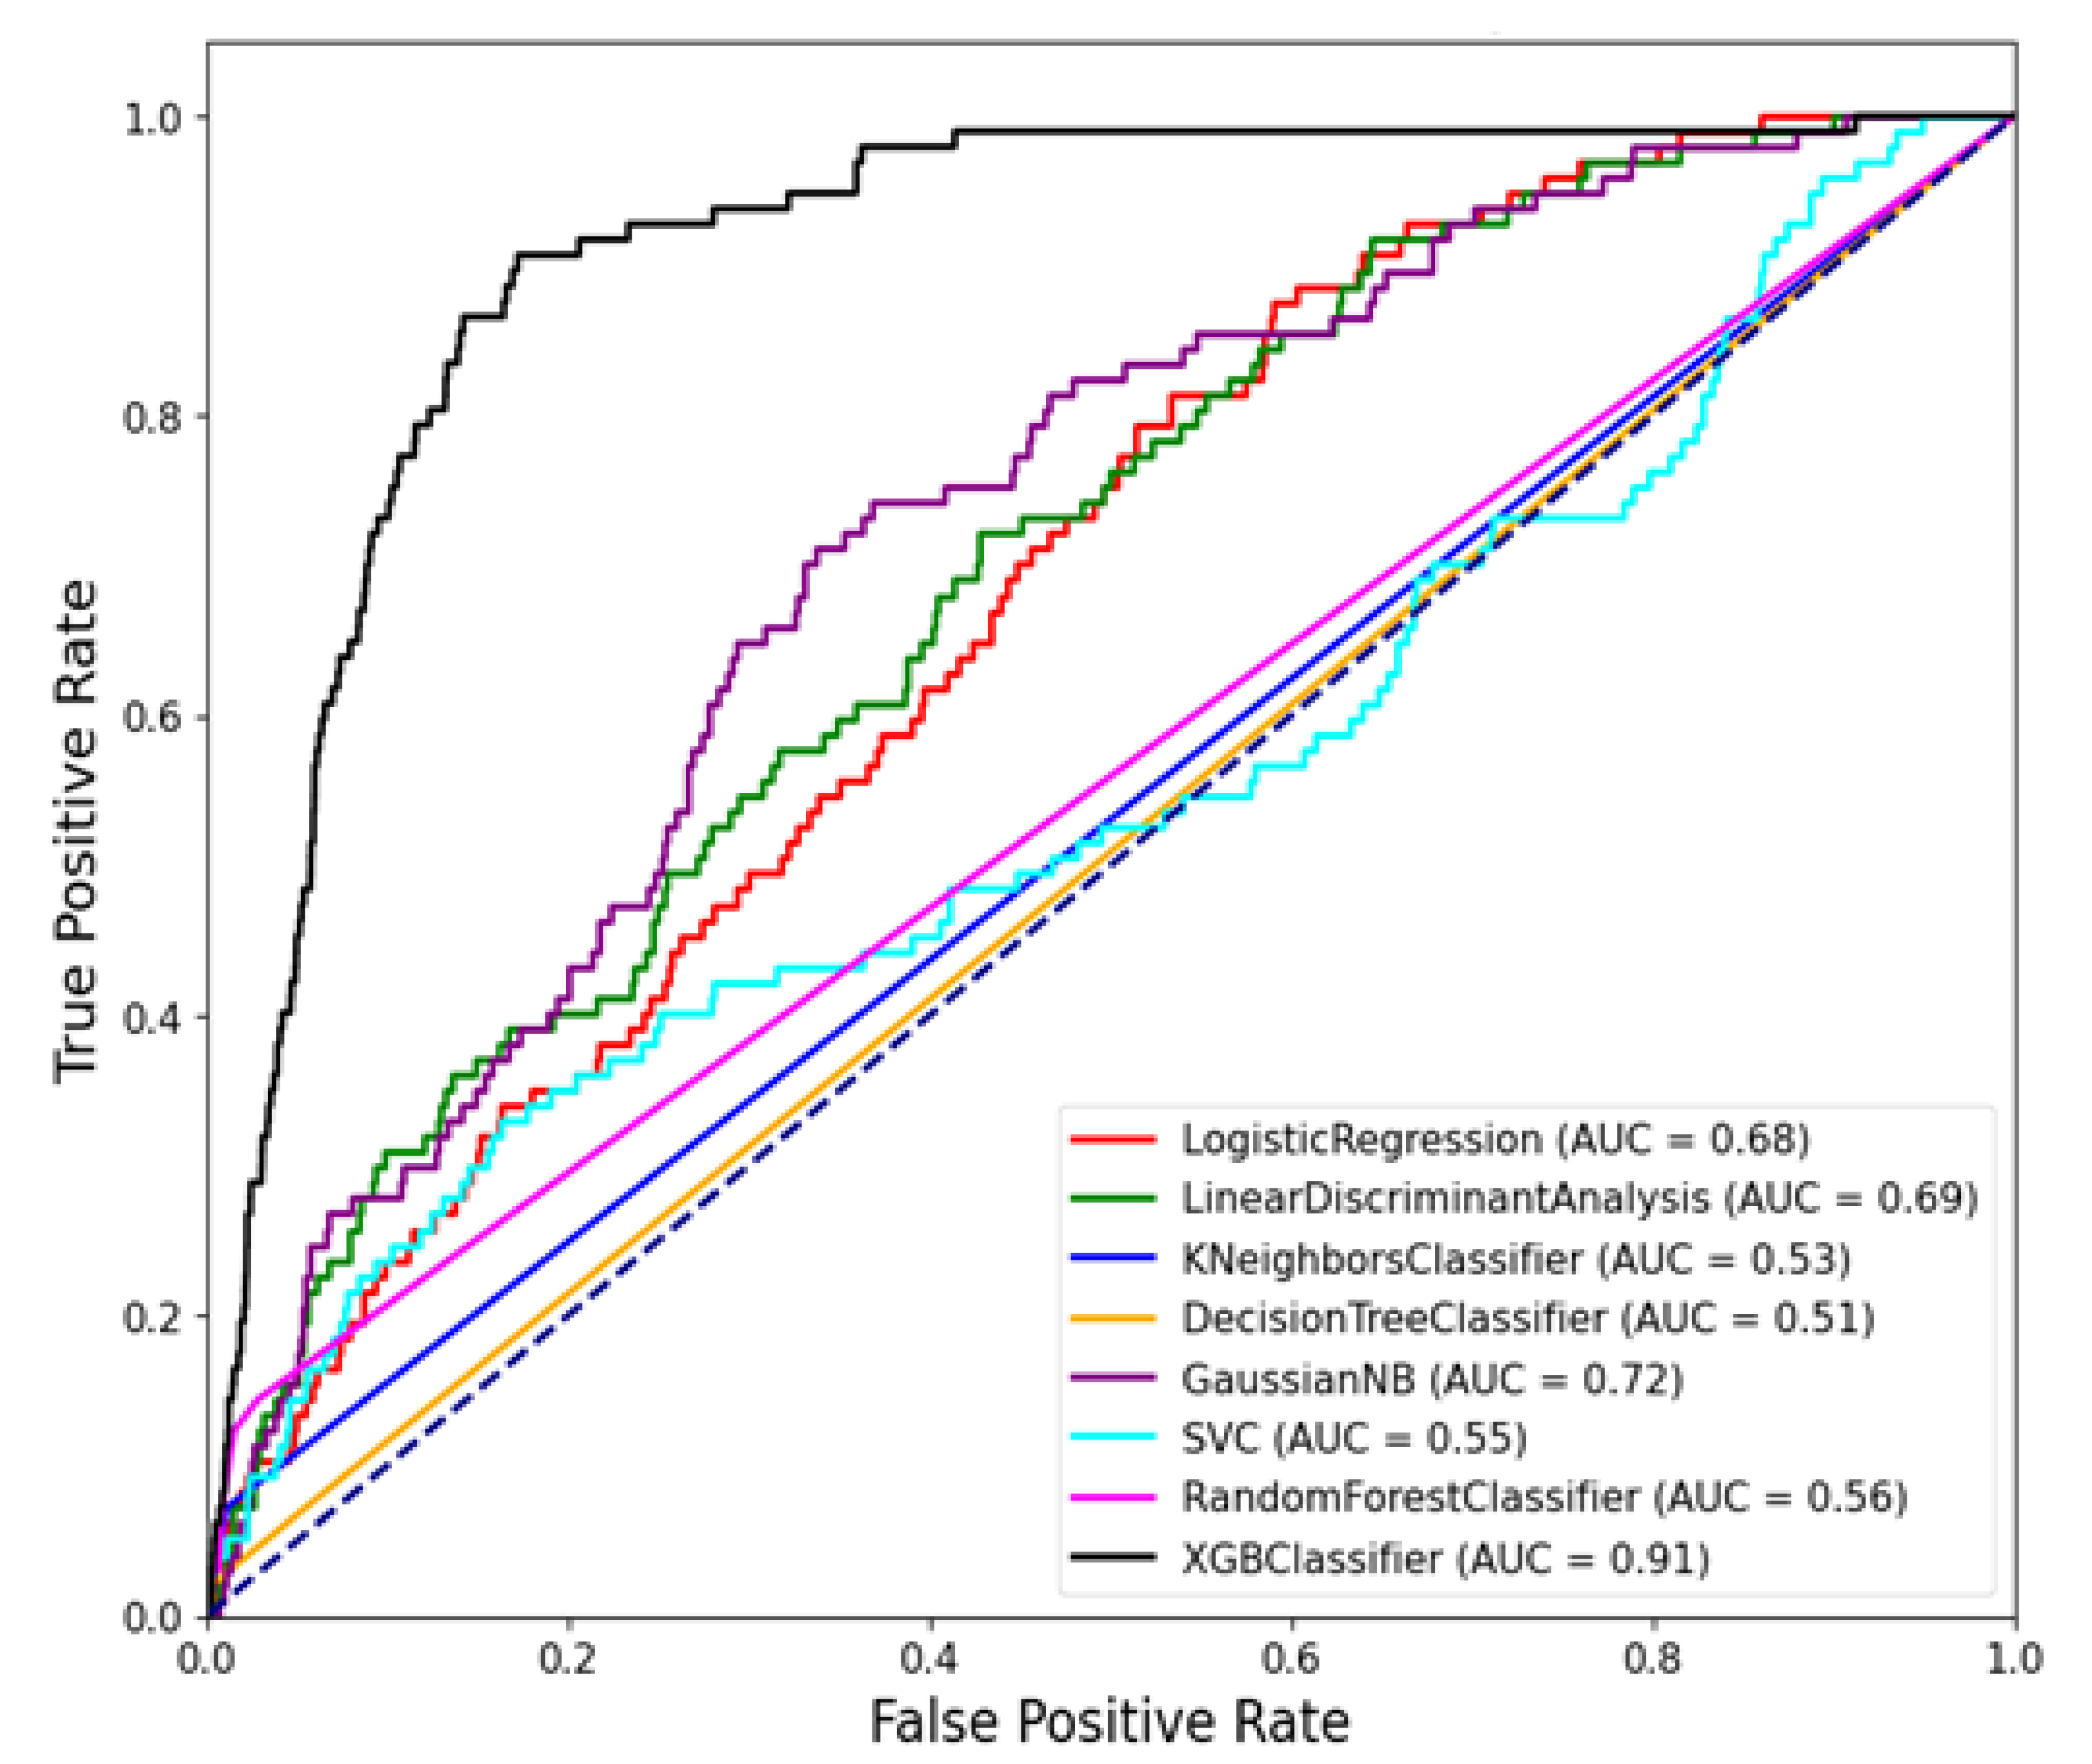
Previously we explored the performance of various Machine Learning (ML) models using standard evaluation metrics such as accuracy, sensitivity, specificity, precision, recall, and F1 score. However here we delve into more nuanced evaluation metrics specifically focused on predictive performance, namely Precision-Recall Area Under the Curve (PR AUC) and Receiver Operating Characteristic Area Under the Curve (ROC AUC). According to [
3], these metrics provide deeper insights into how well ML models distinguish between positive and negative cases, emphasizing the importance of model discrimination and reliability in complex prediction tasks such as Rift Valley Fever (RVF) outbreak detection and justify the model even regardless of the imbalanced effect arising in it.
Figure 8.
Average Precision Recall curve for Machine Learning models using unbalanced tests
Figure 8.
Average Precision Recall curve for Machine Learning models using unbalanced tests
The comparison in
Table 5 highlights the performance of various Machine Learning (ML) models based on two key metrics that is PR AUC and ROC AUC. Based on results in Table
Figure 5, the XGB Classifier emerges as the top-performing model, achieving the highest PR AUC of 0.9110 and a strong ROC AUC of 0.0223. This indicates that the XGB Classifier is particularly effective in distinguishing RVF outbreak cases from non-outbreak periods, with high precision and recall rates[14].Following closely behind, the Gaussian NB model demonstrates a respectable PR AUC of 0.7192 and a ROC AUC of 0.0214, suggesting decent performance in classifying RVF cases.
Similarly, the Linear Discriminant Analysis (LDA) and Logistic Regression models show moderate PR AUC and ROC AUC scores, indicating acceptable discriminatory power but with room for improvement. On the other hand, the Random Forest Classifier, often considered a robust ML model, ranks lower in this comparison with a PR AUC of 0.5736 and a ROC AUC of 0.0089, underscoring the importance of considering multiple metrics for model evaluation.
3.6. Xgboost Tree Classification Adopted in RVF Prediction
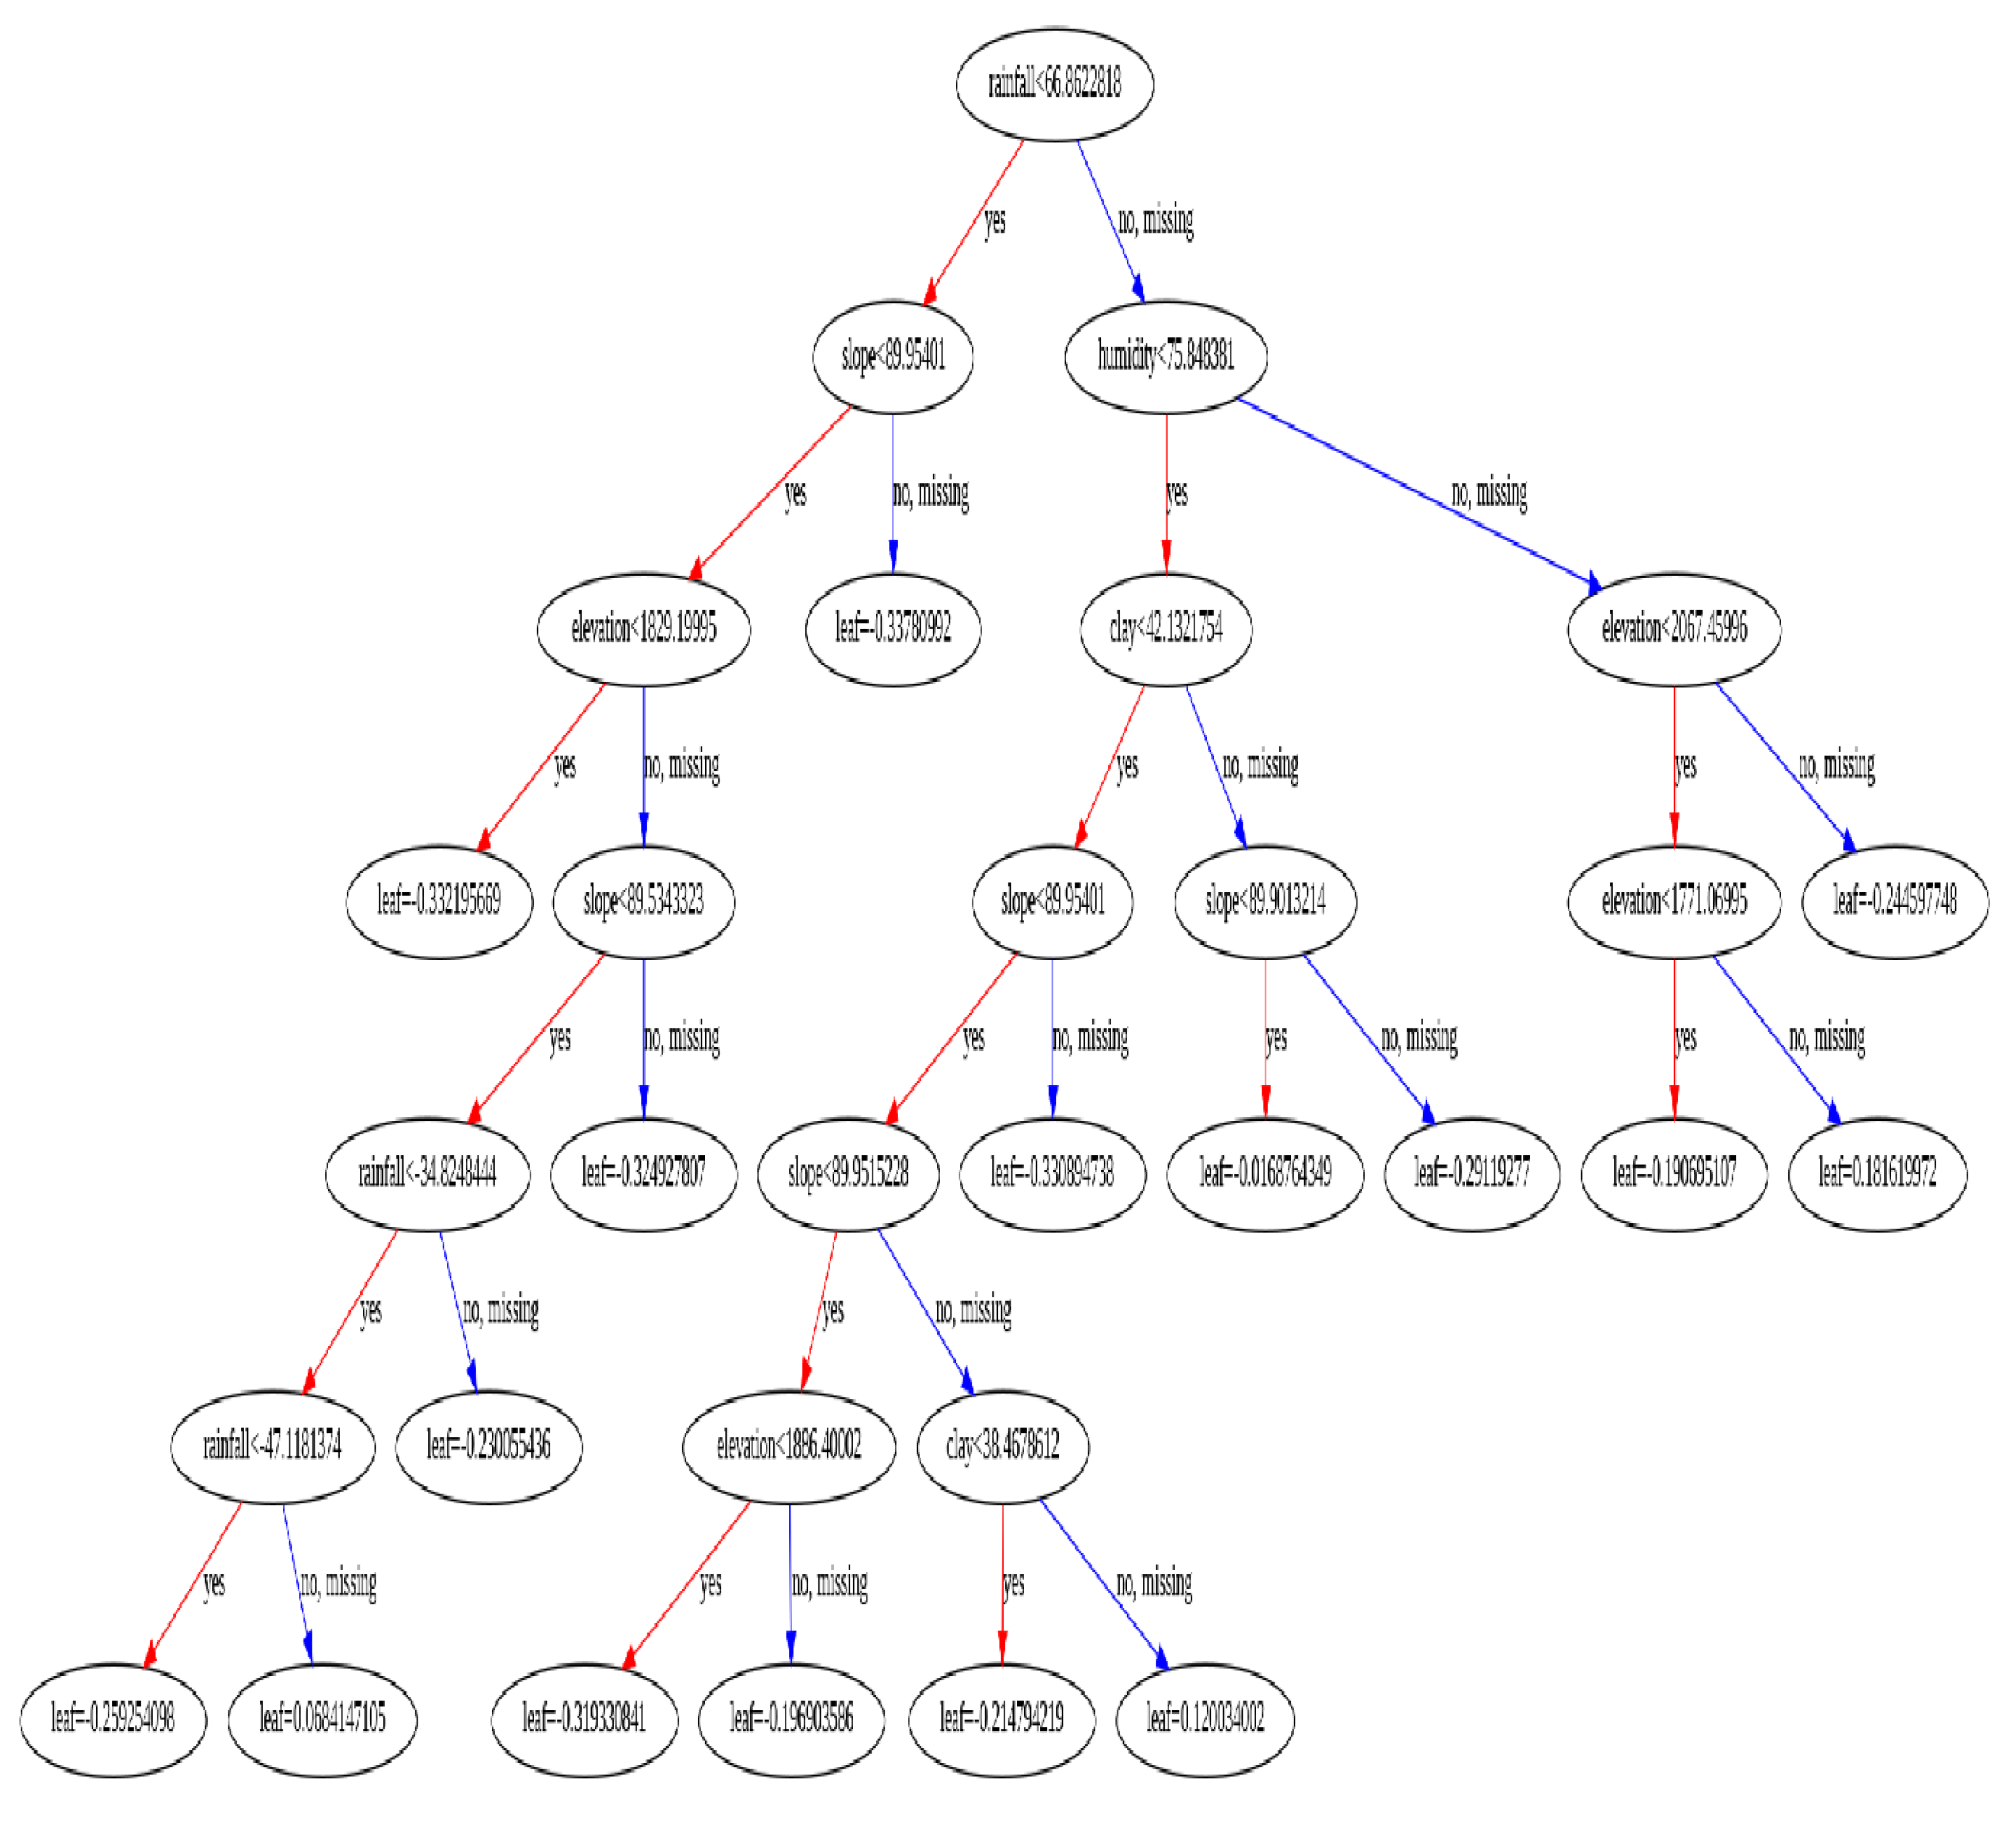
The tree based XGBoost classification tree plot in
Figure 9 , utilized in this study exhibited remarkable performance and were categorized based on their classification metric outcomes and statistical evaluations. This finding holds significance due to the inherent interpretability of tree-based models, a quality that can profoundly impact the decision-making process within healthcare settings, [
7]. The interpretability of such models empowers healthcare professionals to comprehend and interpret the outputs of classification models effectively, thus enhancing their acceptance and utilization in clinical practice. This aligns with existing literature emphasizing the importance of interpretable machine learning systems in facilitating informed decision-making and fostering trust among healthcare practitioners.
4. Discussion
The discussion delves into the nuanced aspects and implications of predicting Rift Valley Fever (RVF) outbreaks in Kenya using Machine Learning (ML) models, [
3]. These models serve as powerful tools in disease surveillance and management, offering insights that can significantly impact public health strategies. The study evaluated several ML models, with the XGB Classifier emerging as the most accurate in predicting RVF outbreaks based on PR AUC and ROC AUC metrics. This aligns with previous studies highlighting the effectiveness of ensemble methods like XGBoost in disease prediction tasks, [
15]. The strong performance of the XGB Classifier underscores its potential as a valuable tool for early detection and intervention in RVF outbreaks.
Further, while the XGB Classifier demonstrated high accuracy, other models also contributed valuable insights. For instance, Random Forest and Logistic Regression models, though ranking lower, provided additional perspectives on RVF outbreak dynamics. This underscores the importance of considering a range of ML models to gain a comprehensive understanding of disease patterns, [
3]. The positive correlations observed between rainfall, humidity, clay patterns, and RVF outbreak cases highlight the complex interplay between environmental factors and disease transmission, [
10]. These findings are consistent with existing literature indicating that climatic conditions play a crucial role in vector abundance and disease spread. Future research could dig deeper into understanding the mechanisms linking environmental variables and RVF outbreaks, potentially enhancing early warning systems and preventive measures, [
3]. By understanding these correlations, public health authorities can tailor surveillance and control measures to specific environmental conditions, enhancing the effectiveness of interventions. The study’s results have significant implications for public health management strategies in RVF-endemic regions like Kenya. The accurate prediction of RVF outbreaks using ML models like the XGB Classifier can facilitate timely interventions, resource allocation, and targeted surveillance efforts. These insights underscore the importance of integrating advanced technologies into public health decision-making processes. The accurate identification of RVF outbreak cases using ML models can facilitate timely interventions, resource allocation, and targeted surveillance efforts [
3]. This can significantly impact disease control and prevention, particularly in RVF-endemic regions like Kenya. Additionally, the discussion highlights the potential scalability of ML-based approaches to decision support systems, paving the way for innovative solutions in disease management. In light of the study’s findings, several future research directions can be explored. Firstly, enhancing the predictive capabilities of ML models by incorporating additional data sources, such as satellite imagery or genetic sequencing data, could improve the accuracy of RVF outbreak predictions, [
10]. Secondly, conducting longitudinal studies to track environmental changes and their impact on RVF transmission dynamics over time could provide valuable insights for predictive modeling. Furthermore, exploring the use of advanced ML techniques, such as deep learning algorithms, may uncover hidden patterns and enhance the understanding of RVF epidemiology. Lastly, interdisciplinary collaborations between epidemiologists, veterinarians, climatologists, and data scientists could foster innovative approaches to disease surveillance and management, [
7] ultimately benefiting public health on a broader scale.
5. Conclusion
In conclusion, the study’s findings shed light on the effectiveness of ML models, particularly the XGB Classifier, in predicting RVF outbreaks. The positive correlations between environmental variables and RVF cases emphasize the need for holistic approaches to disease surveillance and control. By leveraging advanced analytics and interdisciplinary collaborations, future research can further enhance our understanding of RVF dynamics and contribute to more effective public health interventions. These insights are crucial for mitigating the impact of RVF and other zoonotic diseases on human and animal populations, ultimately promoting global health security and resilience. The findings underscore the effectiveness of ensemble methods like the XGB Classifier in accurately identifying RVF outbreak cases, highlighting their role in early detection and intervention. Moreover, the positive correlations observed between environmental variables such as rainfall, humidity, and clay patterns with RVF cases emphasize the complex interplay of climatic factors in disease transmission dynamics. These insights are invaluable for public health authorities in devising targeted surveillance and control measures, particularly in RVF-endemic regions. In light of these findings, future research directions could focus on enhancing the predictive capabilities of ML models by integrating additional data sources, conducting longitudinal studies to track environmental changes, and exploring interdisciplinary collaborations for innovative disease surveillance and management approaches. The development of a clinical decision support system based on the study’s approach, along with usability tests and scalability considerations, presents exciting opportunities for translating research outcomes into practical solutions for RVF control and public health management on a broader scale.
Author Contributions
Conceptualization, D.M., B.K. and B.B. Methodology, D.M.; software, D.M.; validation, D.M., B.B. and B.K.; formal analysis, D.M.; investigation, D.M.; resources, B.B.; data curation, D.M.; writing—original draft preparation, D.M.; writing—review and editing D.M., B.B. and B.K.; visualization, D.M.; supervi-sion, B.B.. and B.K. All authors have read and agreed to the published version of the manuscript.
Funding
This research was funded by the Partnership in Applied Sciences, Engineering and Technology, PASET and received additional support from USAID; Operational re-search to improve policies and practices on the use of Rift Valley fever vaccines in East Africa, Contract Number 720FDA19IO00102
Data Availability Statement
Acknowledgments
The authors extend their appreciation to their universities for supporting their research work
Conflicts of Interest
The authors declare no conflicts of interest. The funders had no role in the design of the study; in the collection, analyses, or interpretation of data; in the writing of the manuscript; or in the decision to publish the results
References
- Dod, J.: Effective substances. In: The Dictionary of Substances and Their Effects. Royal Society of Chemistry (1999) Available via DIALOG.http://www.rsc.org/dose/title of subordinate document. Cited 15 Jan 1999.
- Geddes, K.O., Czapor, S.R., Labahn, G.: Algorithms for Computer Algebra. Kluwer, Boston (1992).
- Muga, Geoffrey Otieno and Onyango-Ouma, Washington and Sang, Rosemary and Affognon, Hippolyte: Indigenous knowledge of Rift Valley Fever among Somali nomadic pastoralists and its implications on public health delivery approaches in Ijara sub-County, North Eastern Kenya, e0009166 (2021).
- Gaudreault, N. N., Indran, S. V., Balaraman, V., Wilson, W. C., Richt, J. A. (2019). Molecular aspects of rift valley fever virus and the emergence of reassortants. J Film Virus genes, 55(1), 1–11.
- Wright, D., Kortekaas, J., Bowden, T. A., Warimwe, G. M. (2019). Rift valley fever: biology and epidemiology. Journal of General Virology 100(8), 1187–1199.
- Endale, A., Michlmayr, D., Abegaz, W. E., Geda, B., Asebe, G., Medhin, G., ... Legesse, M. (2021). Sero-prevalence of west nile virus and rift valley fever virus infections among cattle under extensive production system in south omo area, southern ethiopia. Tropical Animal Health and Production. [CrossRef]
- Faburay, B., LaBeaud, A. D., McVey, D. S., Wilson, W. C., Richt, J. A. (2017). Current status of rift valley fever vaccine development. Vaccines, 5(3), 29.
- Alimadadi, Ahmad and Aryal, Sachin and Manandhar, Ishan and Munroe, Patricia B and Joe, Bina and Cheng, Xi (2020). Artificial intelligence and machine learning to fight COVID-19, American Physiological Society Bethesda, MD, 200–202.
- Chevalier, V., P´epin, M., Plee, L., Lancelot, R. (2010) Rift valley fever-a threat for europe? Eurosurveillance, 15(10), 19506.
- Fever, W. C. C. H. (1998) Fact sheet no 208. December.
- Chen, T., Guestrin, C. (2016, August). Xgboost: A scalable tree boosting system. In Proceedings of the 22nd acm sigkdd international conference on knowledge discovery and data mining (pp. 785-794).
- Nanyingi, M. O. (2018). Spatial epidemiology and predictive modelling of Rift valley fever in Garissa county, Kenya (Doctoral dissertation, University of Nairobi).
- Giglioni, V., García-Macías, E., Venanzi, I., Ierimonti, L., Ubertini, F. (2021). The use of receiver operating characteristic curves and precision-versus-recall curves as performance metrics in unsupervised structural damage classification under changing environment. Engineering Structures, 246, 113029.
- Murthy, R. K. (2023). Early Detection and Prediction of Zoonotic Disease Events Using Event-Based Surveillance and Machine Learning. Washington State University.
- Asif, S., Wenhui, Y., Tao, Y., Jinhai, S., Jin, H. (2021, May). An ensemble machine learning method for the prediction of heart disease. In 2021 4th International Conference on Artificial Intelligence and Big Data (ICAIBD) (pp. 98-103). IEEE.
- Sayed, M. A., Cao, D. M., Islam, M. T., Tayaba, M., Pavel, M. E. U. I., Mia, M. T., ... Sarkar, M. (2023). Parkinson’s Disease Detection through Vocal Biomarkers and Advanced Machine Learning Algorithms. Journal of Computer Science and Technology Studies, 5(4), 142-149.
- Situma, S. N., Nyakarahuka, L., Omondi, E., Mureithi, M., Mweu, M., Muturi, M., ... Singh, D. (2024). Widening geographic range of Rift Valley fever disease clusters associated with climate change in East Africa. medRxiv, 2024-05.
- Situma, S. N., Nyakarahuka, L., Omondi, E., Mureithi, M., Mweu, M., Muturi, M., ... Singh, D. (2024). Widening geographic range of Rift Valley fever disease clusters associated with climate change in East Africa. medRxiv, 2024-05.
- da Silva Neto, S. R., Tabosa Oliveira, T., Teixeira, I. V., Aguiar de Oliveira, S. B., Souza Sampaio, V., Lynn, T., and Endo, P. T. (2022). Machine learning and deep learning techniques to support clinical diagnosis of arboviral diseases: A systematic review. PLoS neglected tropical diseases, 16(1), e0010061.
- Panel, O. H. H. L. E., Hayman, D. T., Adisasmito, W. B., Almuhairi, S., Behravesh, C. B., Bilivogui, P., ... and Koopmans, M. (2023). Developing One Health surveillance systems. One Health, 100617.
|
Disclaimer/Publisher’s Note: The statements, opinions and data contained in all publications are solely those of the individual author(s) and contributor(s) and not of MDPI and/or the editor(s). MDPI and/or the editor(s) disclaim responsibility for any injury to people or property resulting from any ideas, methods, instructions or products referred to in the content. |
© 2024 by the authors. Licensee MDPI, Basel, Switzerland. This article is an open access article distributed under the terms and conditions of the Creative Commons Attribution (CC BY) license (http://creativecommons.org/licenses/by/4.0/).
