Submitted:
09 October 2024
Posted:
10 October 2024
You are already at the latest version
Abstract
Keywords:
1. Introduction
2. Materials and Methods
Background
Economic Assessment
Data
Modelling
Cost-Effectiveness and Cost-Impact Analysis
Input Data
Output Data
The Success Index
3. Results
ICER Results
The Success Index and the Scenario Analyses
4. Discussion
Author Contributions
Funding
Data Availability Statement
Acknowledgments
Conflicts of Interest
References
- Halloran, M.E., I. M. Longini, and C.J. Struchiner, Design and analysis of vaccine studies. Statistics for Biology and Health, ed. M. Gail, et al. 2010, New York Dordrecht Heidelberg London: Springer. 387.
- Halloran, M.E. M. Longini, Jr., and C.J. Struchiner, Design and interpretation of vaccine field studies. Epidemiol Rev 1999, 21, 73–88. [Google Scholar] [CrossRef] [PubMed]
- Halloran, M.E. M. Longini, Jr., and C.J. Struchiner, Estimability and interpretation of vaccine efficacy using frailty mixing models. Am J Epidemiol 1996, 144, 83–97. [Google Scholar] [CrossRef]
- Ray, G.T. , et al., Intraseason Waning of Influenza Vaccine Effectiveness. Clin Infect Dis 2019, 68, 1623–1630. [Google Scholar] [CrossRef] [PubMed]
- Tokars, J.I. , et al., Waning of Measured Influenza Vaccine Effectiveness Over Time: The Potential Contribution of Leaky Vaccine Effect. Clin Infect Dis 2020, 71, e633–e641. [Google Scholar] [CrossRef] [PubMed]
- Lipsitch, M. , Challenges of Vaccine Effectiveness and Waning Studies. Clin Infect Dis 2019, 68, 1631–1633. [Google Scholar] [CrossRef]
- Standaert, B. and B. Benninghoff, Defining the Recipe for an Optimal Rotavirus Vaccine Introduction in a High-Income Country in Europe. Viruses 2022, 14. [Google Scholar] [CrossRef]
- Hanquet, G. , et al., Vaccine effects and impact of vaccination programmes in post-licensure studies. Vaccine 2013, 31, 5634–5642. [Google Scholar] [CrossRef]
- Standaert, B. , The economic value of rotavirus vaccination when optimally implemented in a high-income country. Vaccines (Basel) 2023, 11, 917. [Google Scholar] [CrossRef]
- Standaert, B., T. Dort, and M. Toumi, Vaccine Efficacy, Effectiveness, Or Impact: Which One To Choose In Economic Evaluations Of Vaccines? Value Health 2017, 20, PA754. [Google Scholar] [CrossRef]
- Standaert, B. , et al., Lessons Learned from Long-Term Assessment of Rotavirus Vaccination in a High-Income Country: The Case of the Rotavirus Vaccine Belgium Impact Study (RotaBIS). Infect Dis Ther 2020, 9, 967–980. [Google Scholar] [CrossRef]
- Standaert, B. , et al., Explaining the formation of a plateau in rotavirus vaccine impact on rotavirus hospitalisations in Belgium. Vaccine 2022, 40, 1948–1957. [Google Scholar] [CrossRef] [PubMed]
- Carrico, J. , et al., Public health impact and return on investment of Belgium's pediatric immunization program. Front Public Health 2023, 11, 1032385. [Google Scholar] [CrossRef] [PubMed]
- Standaert, B. Harlin, and U. Desselberger, The financial burden of rotavirus disease in four countries of the European Union. The Peditaric Infectious Disease Journal 2008, 27, S20–S27. [Google Scholar] [CrossRef]
- Velazquez, F.R. , et al., Rotavirus infection in infants as protection against subsequent infections. N Engl J Med 1996, 335, 1022–1028. [Google Scholar] [CrossRef]
- Crawford, S.E. , et al., Rotavirus infection. Nat Rev Dis Primers 2017, 3, 17083. [Google Scholar] [CrossRef]
- van Gaalen, R.D. , et al., Determinants of Rotavirus Transmission: A Lag Nonlinear Time Series Analysis. Epidemiology 2017, 28, 503–513. [Google Scholar] [CrossRef] [PubMed]
- Poelaert, D. , et al., A review of recommendations for rotavirus vaccination in Europe: Arguments for change. Vaccine 2018, 36, 2243–2253. [Google Scholar] [CrossRef]
- Bencina, G. , et al., Real-world impact of rotavirus vaccination in European healthcare settings: a systematic literature review. Expert Review of Vaccines 2022, 21, 1121–1136. [Google Scholar] [CrossRef]
- Pereira, P. , et al., Fifteen years of experience with the oral live-attenuated human rotavirus vaccine: reflections on lessons learned. Expert Rev Vaccines 2020, 19, 755–769. [Google Scholar] [CrossRef]
- Vesikari, T. , et al., Safety and efficacy of a pentavalent human-bovine (WC3) reassortant rotavirus vaccine. N Engl J Med 2006, 354, 23–33. [Google Scholar] [CrossRef]
- Vesikari, T. , et al., Efficacy of human rotavirus vaccine against rotavirus gastroenteritis during the first 2 years of life in European infants: randomised, double-blind controlled study. Lancet 2007, 370, 1757–1763. [Google Scholar] [CrossRef] [PubMed]
- Koch, J. , et al., Risk of Intussusception After Rotavirus Vaccination. Dtsch Arztebl Int 2017, 114, 255–262. [Google Scholar]
- Ledent, E. , et al., Benefit Versus Risk Assessment of Rotavirus Vaccination in France: A Simulation and Modeling Analysis. BioDrugs 2018, 32, 139–152. [Google Scholar] [CrossRef] [PubMed]
- Jit, M. , et al., The cost-effectiveness of rotavirus vaccination: Comparative analyses for five European countries and transferability in Europe. Vaccine 2009, 27, 6121–6128. [Google Scholar] [CrossRef]
- Standaert, B. , et al., Medium- to Long-Term Impact of Rotavirus Vaccination on Hospital Care in Belgium: A 7-Year Follow-Up of the Rotavirus Belgium Impact Study (RotaBIS). Infect Dis Ther 2016, 5, 31–44. [Google Scholar] [CrossRef]
- Standaert, B. , et al., The Sustained Rotavirus Vaccination Impact on Nosocomial Infection, Duration of Hospital Stay, and Age: The RotaBIS Study (2005-2012). Infect Dis Ther 2016, 5, 509–524. [Google Scholar] [CrossRef]
- Standaert, B. et al., Lessons Learned from Long-Term Assessment of Rotavirus Vaccination in a High-Income Country: The Case of the Rotavirus Vaccine Belgium Impact Study (RotaBIS). Infect Dis Ther 2020, 2020. [Google Scholar]
- Raes, M. , et al., Reduction in pediatric rotavirus-related hospitalizations after universal rotavirus vaccination in Belgium. Pediatr Infect Dis J 2011, 30, e120–e125. [Google Scholar] [CrossRef]
- Vynnycky, E. and R. White, An introduction to infectious disease modelling. 2010, Oxford: Oxford University Press.
- Chua, H. , et al., The Use of Test-negative Controls to Monitor Vaccine Effectiveness: A Systematic Review of Methodology. Epidemiology 2020, 31, 43–64. [Google Scholar] [CrossRef]
- Bilcke, J. , et al., Kosten-effectiviteitsanalyse van rotavirus vaccinatie van zuigelingen in België., in Health Technology Assessment (HTA). 2007, Federaal Kenniscentrum voor de Gezondheidszorg (KCE).
- Martin, A. Cottrell, and B. Standaert, Estimating utility scores in young children with acute rotavirus gastroenteritis in the UK. J Med Econ 2008, 11, 471–484. [Google Scholar] [CrossRef]
- Cleemput, I. , et al., Belgian guidelines for economic evaluations and budget impact analyses: second edition., in Health Technology Assessment (HTA). 2012, Health Care Knowledge Centre (KCE).
- Atkins, K.E. , et al., Impact of rotavirus vaccination on epidemiological dynamics in England and Wales. Vaccine 2012, 30, 552–564. [Google Scholar] [CrossRef] [PubMed]
- Atchison, C. Lopman, and W.J. Edmunds, Modelling the seasonality of rotavirus disease and the impact of vaccination in England and Wales. Vaccine 2010, 28, 3118–3126. [Google Scholar] [CrossRef] [PubMed]
- Gower, C.M. , et al., Sustained Declines in Age Group-Specific Rotavirus Infection and Acute Gastroenteritis in Vaccinated and Unvaccinated Individuals During the 5 Years Since Rotavirus Vaccine Introduction in England. Clin Infect Dis 2022, 74, 437–445. [Google Scholar] [CrossRef] [PubMed]
- Leino, T. , et al., Impact of five years of rotavirus vaccination in Finland - And the associated cost savings in secondary healthcare. Vaccine 2017, 35, 5611–5617. [Google Scholar] [CrossRef]
- Ruiz-Contreras, J. , et al., Rotavirus gastroenteritis hospitalizations in provinces with different vaccination coverage rates in Spain, 2013-2018. BMC Infect Dis 2021, 21, 1138. [Google Scholar] [CrossRef]
- Centre, H.P.S. Annual reports on rotavirus. 2018 [cited 2021 20/5/2021]; Available from: https://www.hse.ie/eng/health/immunisation/hcpinfo/othervaccines/rotavirus/#How%20many%20cases%20of%20rotavirus%20occur%20in%20Ireland?
- Hanquet, G. , et al., Impact of rotavirus vaccination on laboratory confirmed cases in Belgium. Vaccine 2011, 29, 4698–703. [Google Scholar] [CrossRef]
- Standaert, B. , How to design an optimal vaccine launch. Research Features., 2023(148).


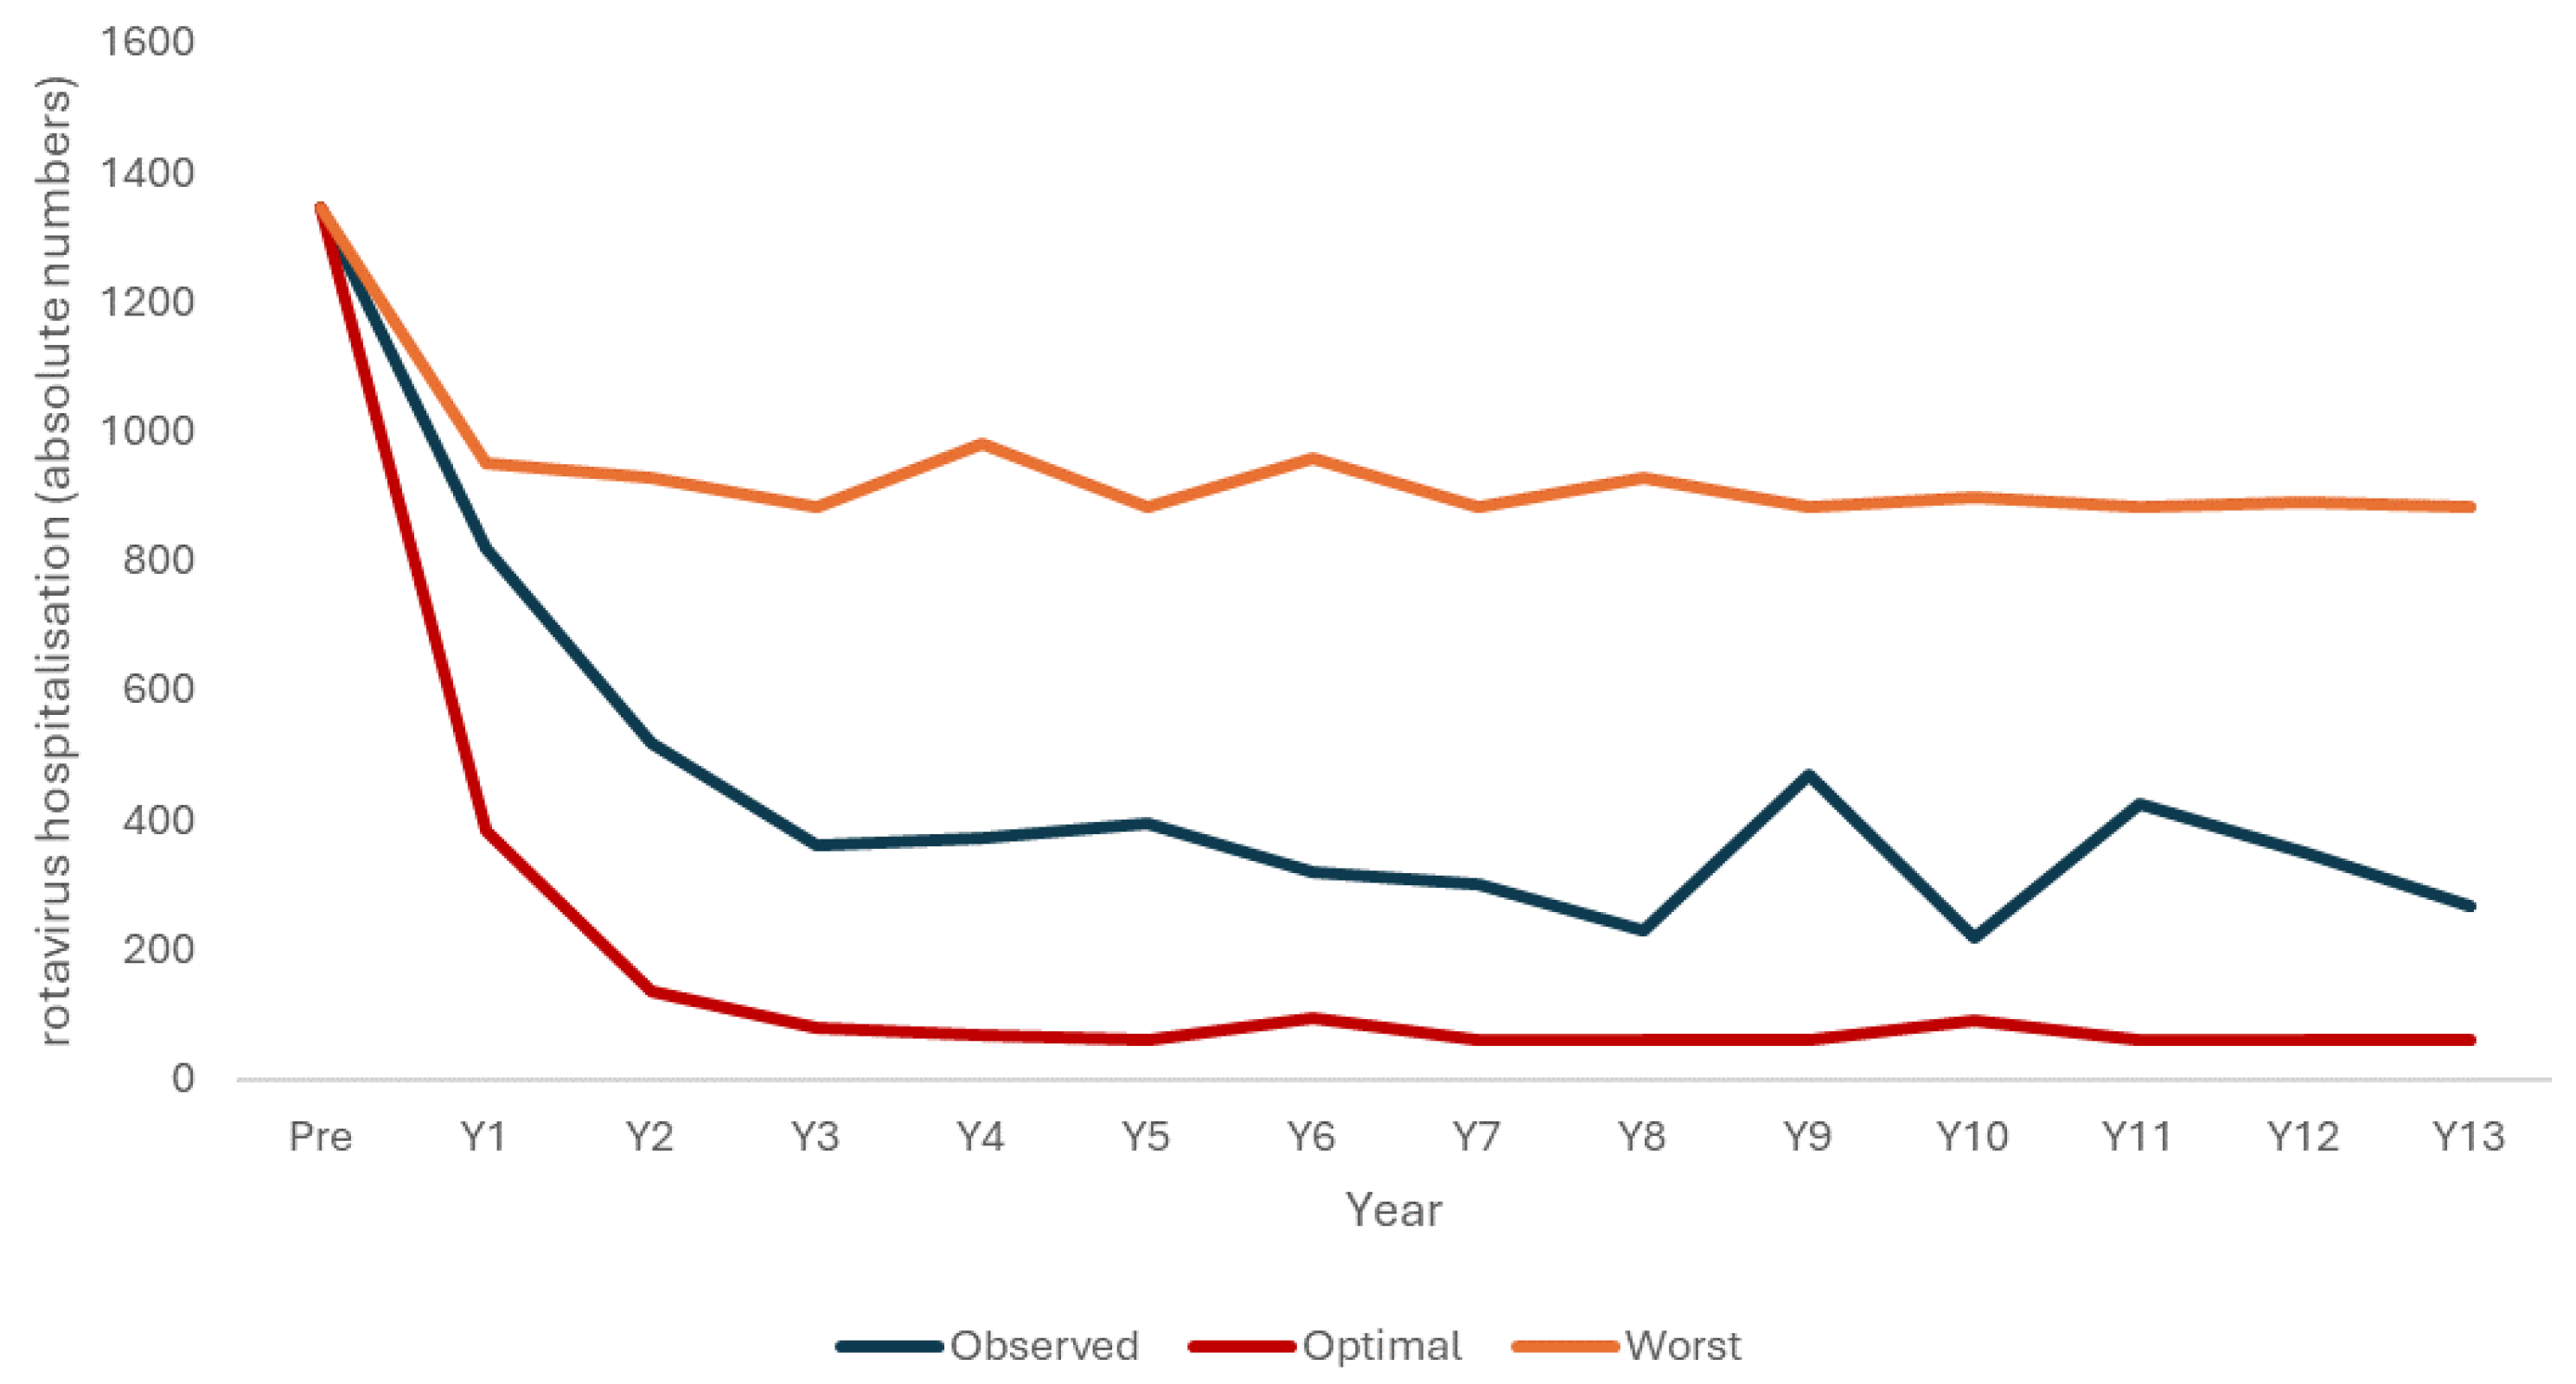
| Age/Yn | 2005–2006 | 2007 | 2008 | 2009 | 2010 | 2011 | 2012 | 2013 | 2014 | 2015 | 2016 | 2017 | 2018 | 2019 |
|---|---|---|---|---|---|---|---|---|---|---|---|---|---|---|
| 0–2 m | 113 | 94 | 62 | 56 | 44 | 65 | 54 | 44 | 48 | 56 | 28 | 55 | 52 | 27 |
| 3–12 m | 678 | 340 | 152 | 129 | 127 | 133 | 103 | 97 | 70 | 137 | 75 | 123 | 125 | 95 |
| 13–24 m | 413 | 311 | 208 | 100 | 139 | 134 | 114 | 107 | 74 | 186 | 85 | 180 | 119 | 96 |
| 25–36 m | 102 | 56 | 67 | 49 | 33 | 44 | 33 | 33 | 31 | 67 | 17 | 42 | 37 | 35 |
| 37–48 m | 27 | 16 | 18 | 19 | 19 | 12 | 9 | 15 | 4 | 13 | 8 | 18 | 9 | 9 |
| 49–60 m | 12 | 2 | 12 | 8 | 10 | 7 | 7 | 4 | 1 | 10 | 4 | 6 | 8 | 6 |
| Total | 1345 | 819 | 519 | 361 | 372 | 395 | 320 | 300 | 228 | 469 | 217 | 424 | 350 | 268 |
| Variable (Name) | Unit Value | Number | Total | Reference |
|---|---|---|---|---|
| Hospitalization Pre-vaccination cost | € 1467 | 7 days | € 10,269 | [14] |
| Hospitalization Post-vaccination cost | € 1467 | 5 days | € 7335 | [27] |
| Vaccine cost (Rotarix) | € 70/dose | 2 | € 140/vaccination | [32] |
| QALY-loss Pre | −0.47/hospital day | 7 days | −0.009 | [33] |
| QALY-loss Post | −0.47/hospital day | 5 days | −0.006 | [27] |
| Target population to vaccinate pre-vaccination | 5% | 791 | 15,820 | [28] |
| Uptake period | Variable name | Post-uptake period | |
|---|---|---|---|
| Vaccine efficacy | 0.95 | Average existing susceptible/wk | 120 |
| Vaccine coverage focused | 0.66 | Existing infectious/diseased/wk | 1 |
| Vaccine coverage routine | 0.86 | Birth rate increase/wk | 20 |
| Herd effect non-indicated | 0.41 | Force of Infection | 0.00833 |
| Secondary infection source herd | 0.10 | Time unit (days) | 3.5 |
| Start month vaccination | Nov |
| Item | Age Group | No Vaccination | Vaccinated |
|---|---|---|---|
| Hospital days | 0–2 m | 904 | 467 |
| 3–12 m | 5424 | 1151 | |
| 13–24 m | 3304 | 1187 | |
| 25–36 m | 816 | 346 | |
| 37–48 m | 216 | 112 | |
| 49–60 m | 96 | 51 | |
| Total | 10,760 | 3314 | |
| Cost | Hospital cost | € 15,784,920 | € 3,472,599 |
| Vaccine cost | € 14,219,016 | ||
| QALY | QALY-loss | −96.99 | −21.34 |
| CEA | € 25,204 |
| Item | Age Group | No Vaccination | Vaccinated |
|---|---|---|---|
| Hospital days | 0–2 m | 1469 | 685 |
| 3–12 m | 8814 | 1706 | |
| 13–24 m | 5369 | 1853 | |
| 25–36 m | 1326 | 544 | |
| 37–48 m | 351 | 169 | |
| 49–60 m | 156 | 85 | |
| Total | 17,485 | 5042 | |
| Cost | Hospital cost | € 25,650,495 | € 5,283,296 |
| Vaccine cost | € 25,403,756 | ||
| QALY | QALY-loss | -157.60 | -32.46 |
| CIA | € 40,247 |
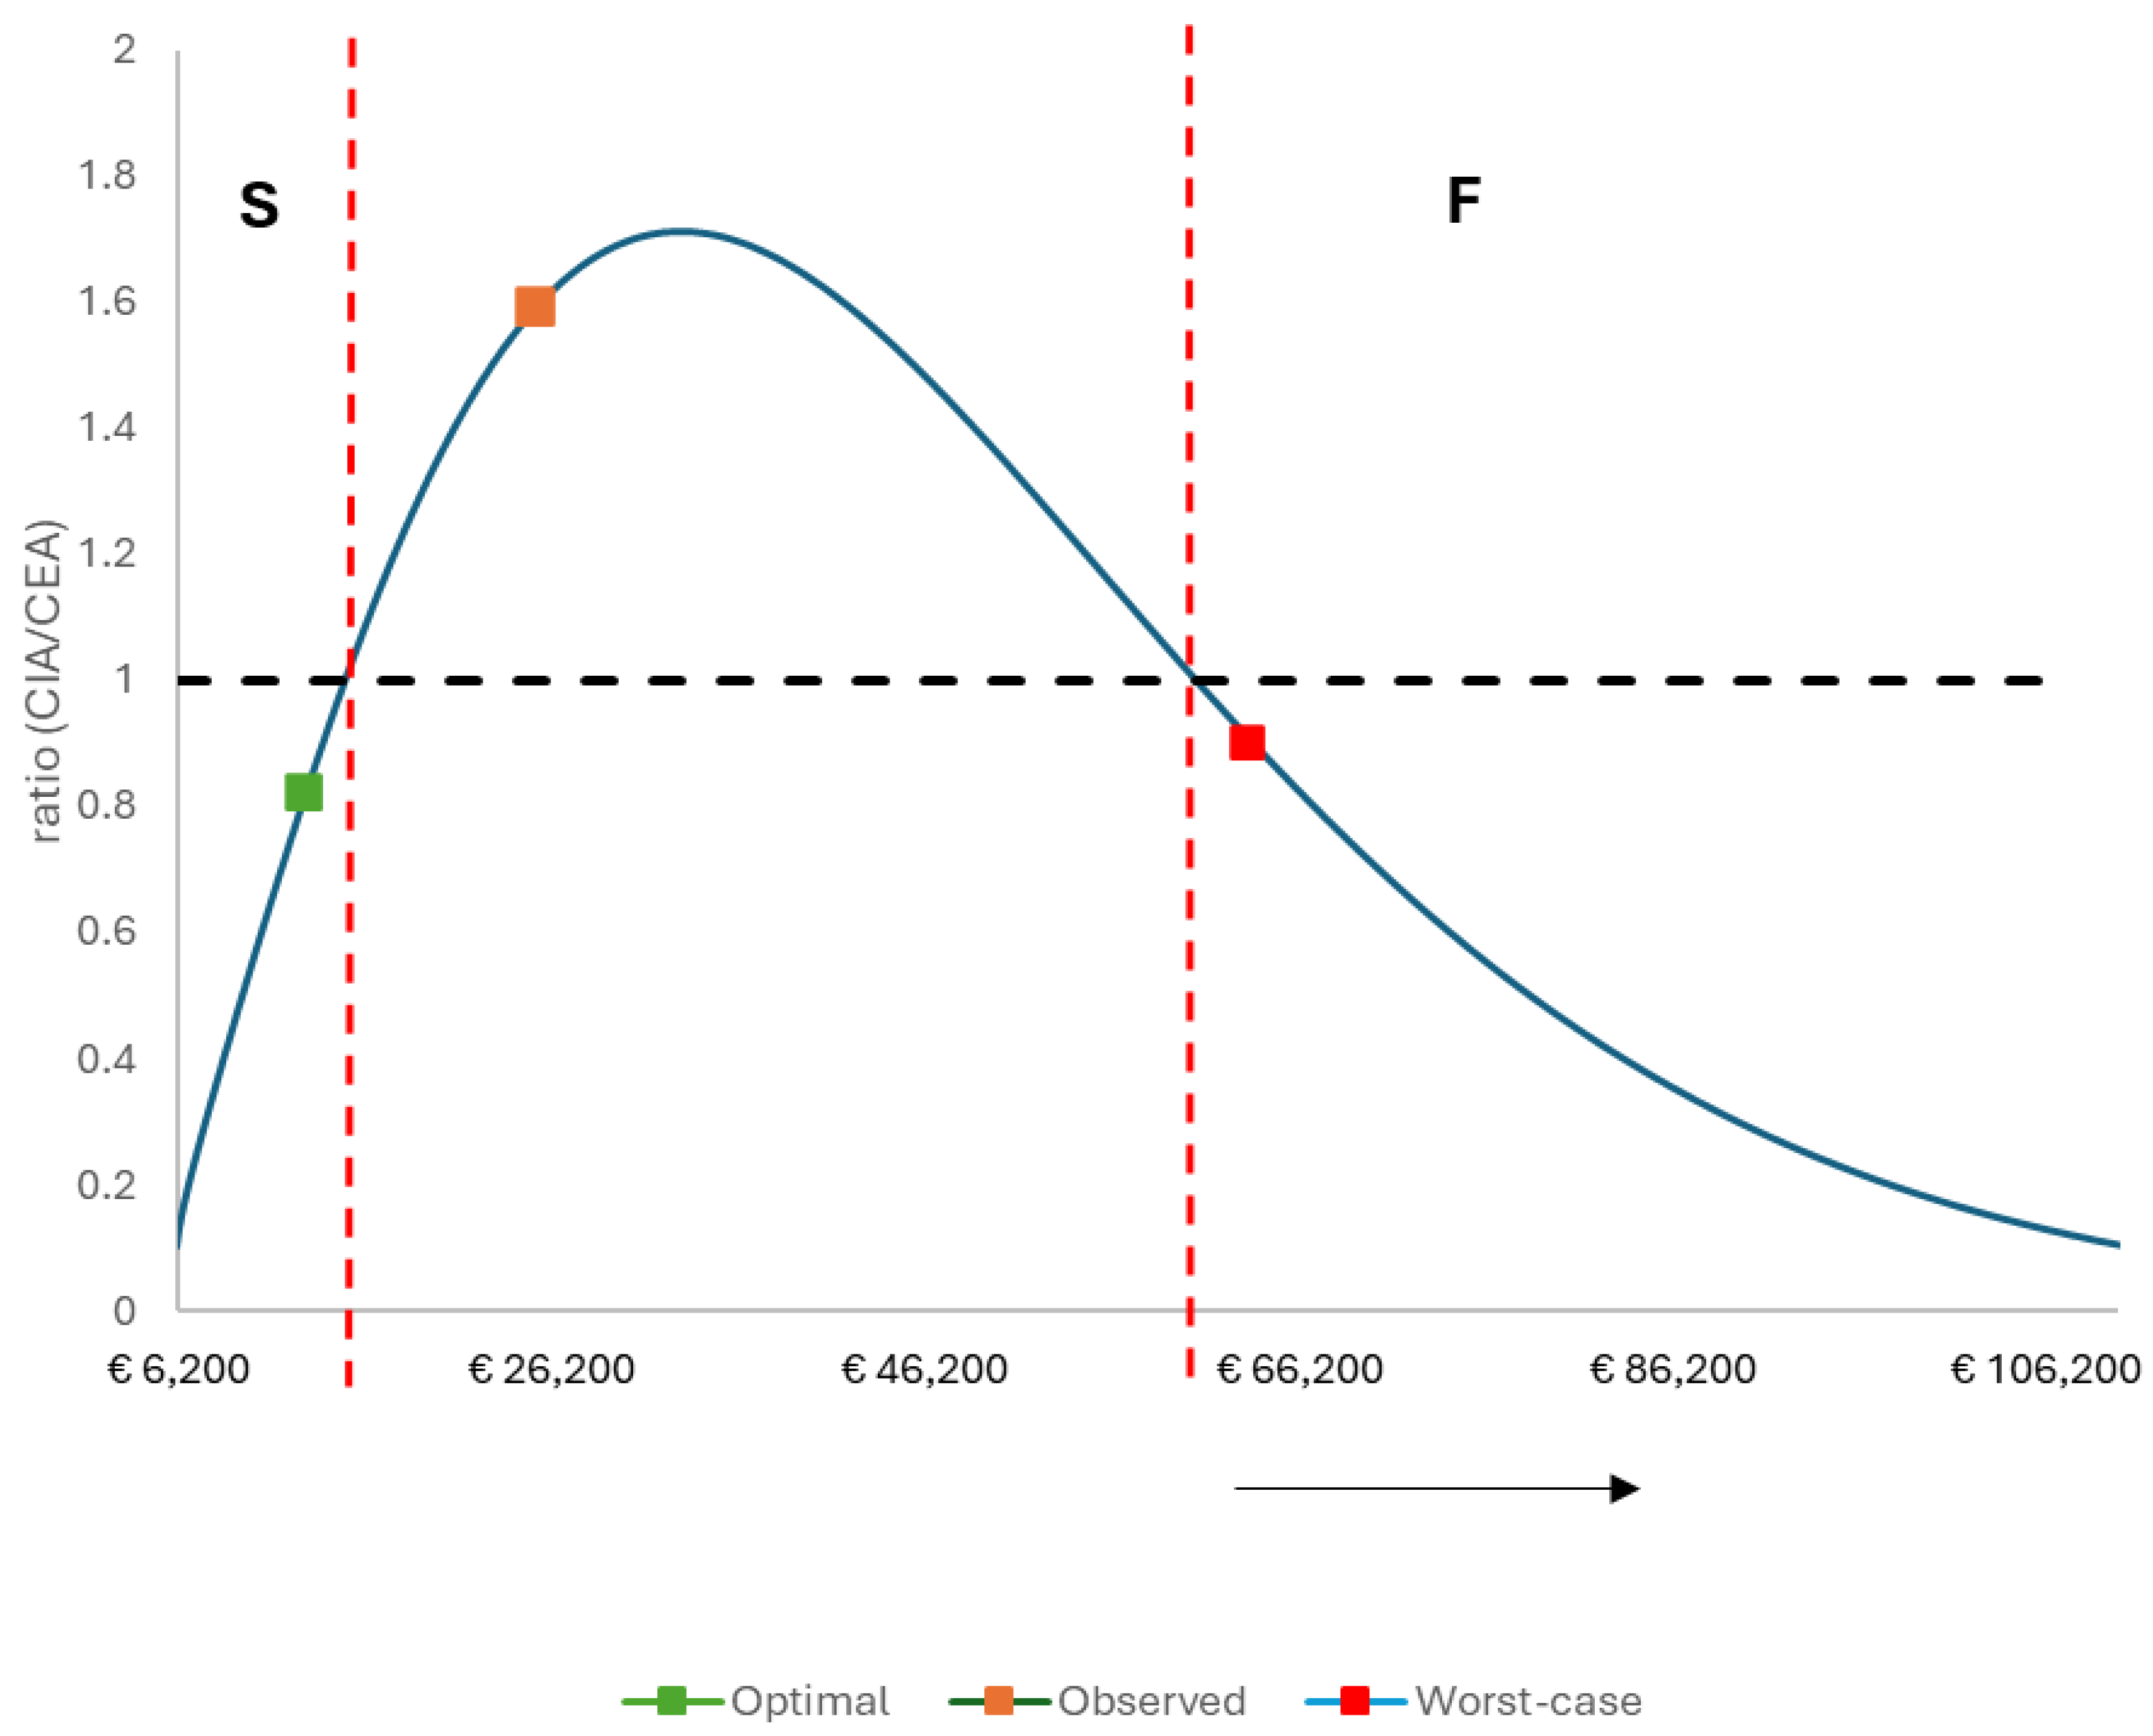
| Difference in QALY- loss | Difference in Cost | ICER | Ratio (CIA/CEA) | |
|---|---|---|---|---|
| Observed | ||||
| Cost-effectiveness (CEA) | 75.65 | € 1,906,695 | € 25,204 | |
| Cost-impact (CIA) | 125.14 | € 5,036,557 | € 40,247 | 1.59 |
| Simulation Optimal launch scenario | ||||
| Cost-effectiveness (CEA) | 55.94 | € 732,801 | € 12,939 | |
| Cost-impact (CIA) | 149.39 | € 1,599,297 | € 10,705 | 0.82 |
| Simulation Worst-case launch scenario | ||||
| Cost-effectiveness (CEA) | 26.58 | € 1,874,495 | € 70,507 | |
| Cost-impact (CIA) | 50.95 | € 3,224,655 | € 63,290 | 0.90 |
Disclaimer/Publisher’s Note: The statements, opinions and data contained in all publications are solely those of the individual author(s) and contributor(s) and not of MDPI and/or the editor(s). MDPI and/or the editor(s) disclaim responsibility for any injury to people or property resulting from any ideas, methods, instructions or products referred to in the content. |
© 2024 by the authors. Licensee MDPI, Basel, Switzerland. This article is an open access article distributed under the terms and conditions of the Creative Commons Attribution (CC BY) license (http://creativecommons.org/licenses/by/4.0/).


