
Submitted:
10 October 2024
Posted:
10 October 2024
You are already at the latest version
Abstract
In the era of industrial evolution satellites are being viewed as swarm intelligence that do not relies on single system but multiple constellations collaborate autonomously. This has enhanced the potential of the GNSS system to contribute in the improved position, navigation and timing (PNT) services. However, Multipath (MP) and Non-line-of-sight (NLOS) receptions remain the prominent vulnerability for GNSS in harsh environments. The aim of this research is to investigate its impact of MP and NLOS on GNSS performance and then proposed a Received Signal Quality Monitoring (RSQM) algorithm. RSQM works twofold: Initially it performs a signal quality test based on fuzzy inference system. The input parameters are Carrier-to-Noise ratio (CNR), Range Residuals (RR) and Code-Carrier Divergence (CCD) and it computes the membership functions based on mamdani method and classify the signal quality as LOS, NLOS, weak NLOS, and strong NLOS. Secondly, it performs an adaptive navigation strategy to exclude/mask the affected range measurements, while considering the satellite geometry constraints (i.e., DOP≤2).. For this purpose, comprehensive research to quantify the multi-constellation GNSS receiver with four constellation configuration (GPS,BeiDou, GLONASS and Galileo) has been carried out in various operating environments. This RSQM based GNSS receiver has capability to identify signal quality and perform adaptive navigation accordingly to improve the navigation performance. The results suggest that GNSS performance in terms of position error is improved from 5.4m to 2.3m averagely in the complex urban environment. Accumulating RSQM with GNSS has great potential for future industrial revolution (Industry 5.0) making things automatic and sustainable like autonomous vehicle operation.
Keywords:
Multi-agent communication
; swarm intelligence
; NLOS
; RSQM
; Adaptive Navigation
1. Introduction
In the era of industry revolution that transform remarkably from traditional machine to synergy between human and advanced technology. The advent of Industry 5.0 that integrates the human intervention with advanced Artificial Intelligence based technology to produced more resilient and sustainable systems. Global Navigation Satellite Systems (GNSS) being the bedrock and the most promising technology for various modern industries [1,2,3,4,5,6]. With the advent of Industry 5.0 GNSS systems are regarded as swarm intelligence where atleast 4 satellite from single constellation or 7 satellites from multiple constellations collaborative with each other to deliver the position and navigation services all-time, all-weather at full coverage worldwide. It is significantly used in several applications that ranging from safety-critical applications, autonomous vehicle system to portable commercial devices and energy systems[7,8,9,10,11].
It is obvious that GNSS provide seamless and resilient positioning information in clear open sky regions. The navigation performance is infrequently getting worse due to the disruptions cause MP/NLOS in urban environment. GNSS signals being impaired by large sized buildings, closed loop bridges, and tress that leads to increase positional uncertainties. In simple terminology, the more severity the urban area is, the more challenges on the positioning is. Hence, precise navigation is the most severe challenge of the GNSS for autonomy that requires the highly accurate and precise positioning and navigation solution [12,13,14].
Global Navigation Satellite Systems (GNSS) have undergone a rapid growth in recent years. The constellation landscape has evolved from a single system (US GPS) to encompass quad constellations (Russian GLONASS, European Galileo, Chinese BeiDou) along with regional systems (Japanese QZSS, Indian IRNSS) and Satellite-Based Augmentation Systems (SBAS). This diversification has significantly improved satellite availability. Notably, the transition from a mid-2000s GPS-only system with roughly 24 satellites to a multi-constellation approach has increased the number of usable satellites to over 100. Furthermore, GNSS modernization has facilitated multi-frequency signal transmission, enhancing capabilities in signal acquisition, atmospheric corrections, multipath mitigation, interference resistance, and ultimately, precise positioning.
Despite of significant advancements and improvements in satellite availability, GNSS often fails to maintain the consistency in achieving the required performance level in urban environments. In such operating environments, the quality of GNSS signals deteriorates due to multipath (MP) effects and NLOS reception, resulting in inaccurate positioning and navigation parameters estimation [15]. The standard characteristics of the received signal quality can consequently deviate in such changing environments, and all of these instabilities can be indicated in the signal strength, pseudo-range measurements, and lock-time, which disturb the received signal and increase the uncertainties in range errors. Position error quantified by satellite availability, geometric distribution of satellites, and quality of the received signal. Signal quality considered as the major constraints in multi-GNSS [16,17]. There are several methods proposed in the literature for assessing the GNSS signal quality and mitigating the inaccuracies in the position measurements [18,19,20,21,22,23,24]. Those methods with their limitations are summarized in the Table 1.
This paper proposed a Received Signal Quality Monitoring (RSQM) algorithm. RSQM works twofold: Initially it performs a signal quality test based on fuzzy inference system. The input parameters are Carrier-to-Noise ratio (CNR), Range Residuals (RR) and Code-Carrier Divergence (CCD) and it computes the membership functions based on mamdani method and classify the signal quality as LOS, NLOS, weak NLOS, and strong NLOS. Secondly, it performs an adaptive navigation strategy to exclude/mask the affected range measurements, while considering the satellite geometry constraints (i.e., ).
The main contribution of the paper is as under:
- To quantify and analyze the possible vulnerabilities caused by MP/NLOS.
- Based on detailed analysis, a signal quality based detection Received Signal Quality Monitoring (RSQM) method is proposed to detect the Line-of-sight (LOS) and Non-line-of-sight (NLOS) signals.
- Once quality is identified adaptive mitigation strategy is integrated in RSQM to overcome the MP/NLOS effects that can enhance the navigation performance.
The whole paper is organized as follows and given in Figure 1. It starts with abstract, and brief background of the study is given in Section 1, Section 2 discussed the signal model and potential error sources, Section 3 detailed about the methodology and field experimentation. Results are explained in the Section 4 and proposed algorithm Received Signal Quality Monitoring (RSQM) and its implementation in real-time is given in the Section 5. At the end, paper is concluded in the Section 6 with future recommendations.
2. Signal Model and Potential Error Sources
As signal performance obstructed in the challenged environment and results in limited satellite availability, continuity and poor signal quality. This section discussed the potential error sources and signal model under challenged environment.
2.1. Signal Model
It is important to deeply understand the signal model to assess the performance of GNSS in complex environment. In these type of environment received GNSS signal is affected by multipath that is the composition of direct and reflected signals [25,26] and can be given as
where
- represents the magnitude of direct signals (LOS).
- denotes the magnitude of indirect signals (MP, NLOS).
The phase change and magnitude of signals that are affected by multipath can be expressed as
In multipath case, the estimated is is equivalent to the magnitude of the composite signal.
2.2. Carrier-to-Noise Ratio (CNR)
CNR is one of the key performance indicator of GNSS signal quality measurements. It denotes the relationship between signal strength with noise at particular frequency. It is noted that CNR is highly influenced by MP / NLOS in challenged environment and fluctuates inconsistently from its standard values due to combination of direct and indirect (MP) signals. CNR is the function of elevation angle.
where
- f is the function of third-order polynomial.
- indicates the elevation angle between receiver u at the ground and satellite m in the space.
According to 3, the relationship is expressed as
In severe MP environment, there is significant deviations in CNR and it variate from its nominal value in increasing and decreasing trend [29,30] due to the constructive or destructive multipaths. This trend is depends on the surroundings and can leads to worsen the signal measurements and breaks the locking of satellites with ground receiver (loss of lock).
2.3. Normalized Range Residuals (RR)
The geometrical distance between satellite in the sky and receiver at ground including travel time of signal is referred as pseudorange. It is estimated by the least square method that is traditional technique to compute the position solution. This pseudorange measurement can be affected by MP/NLOS reception in urban environment and that error is quantified by range residuals. Range residuals is beneficial measurement for GNSS signal performance. In severe MP case, the computed position always encloses a large errors so the range residual could not differentiate the LOS and NLOS accurately. Therefore, the range residuals at each observations are normalized and NRR is given as:
where
- is the Range residuals of satellite s.
- and denotes the minimum and maximum of range residuals at each observations respectively.
For accurate navigation and position solution, the normalized range residuals of direct LOS signal is near to zero whereas in complex environment case (MP) NRR increases due to additional propagation errors i.e., reflections, blockage.
2.4. Code-Carrier Divergence (CCD)
The code carrier divergence (CCD) anomaly is mainly concerned to differential errors. The differential errors are the ranging errors occurs when smoothing filters initiated at different times. Furthermore, the CCD is useful to monitor and identify the different anomalies like MP, NLOS, and reflections. It is estimated by second-order filter design at any time k given as
where
- is the code-minus carrier measurement.
- denotes the filter time constant.
- indicates the sample time.
2.5. Potential Error Sources
There are various potential error sources that degrade the navigation performance and categorized as multi-path and non-line-of-sight (NLOS) reception, ionospheric irregularities, tropospheric delay, clock biases and receiver noise. GNSS signals are low-powered, and therefore, they are vulnerbale to various noises and errors as depicted in Figure 2. Among all errors sources multipath and NLOS being the most prominent source of error in GNSS, contributes in reduced navigation performance.
In ideal conditions, signals acquired by GNSS receiver are line-of-sight (LOS). However, in challenged environment due to the buildings, surroundings structures, narrow streets, and trees, received signal can be reflected, diffracted, or completely blocked before reaching at ground receiver. The signals that received through various paths is multipath (MP) signal and Non-line-of-sight (NLOS) reception arise when signal is acquire via reflections as shown in Figure 3. MP/NLOS is one of the major contributor of GNSS positioning errors in urban environment as it enhanced the uncertainties and inaccuracies in the positioning and navigation performance. Hence, received signal quality drastically varied in such environment and results in inaccurate positioning accuracy. In severe urban environment, GNSS fundamental parameters significantly variate from its standard values. The presence of NLOS/MP may lead to limited satellite availability, continuity and disrupted signal quality may result in degraded or interrupted navigation performance. Advanced and modern GNSS receivers have greatly enhanced the GNSS availability in highly urbanized areas. However, positioning accuracy stills remains a problematic due to the blockage, reflected and interrupted signals. MP/NLOS receptions are the most challenging and crucial task in GNSS positioning if no countermeasures were taken.(effect on GNSS parameter)
3. Methodology
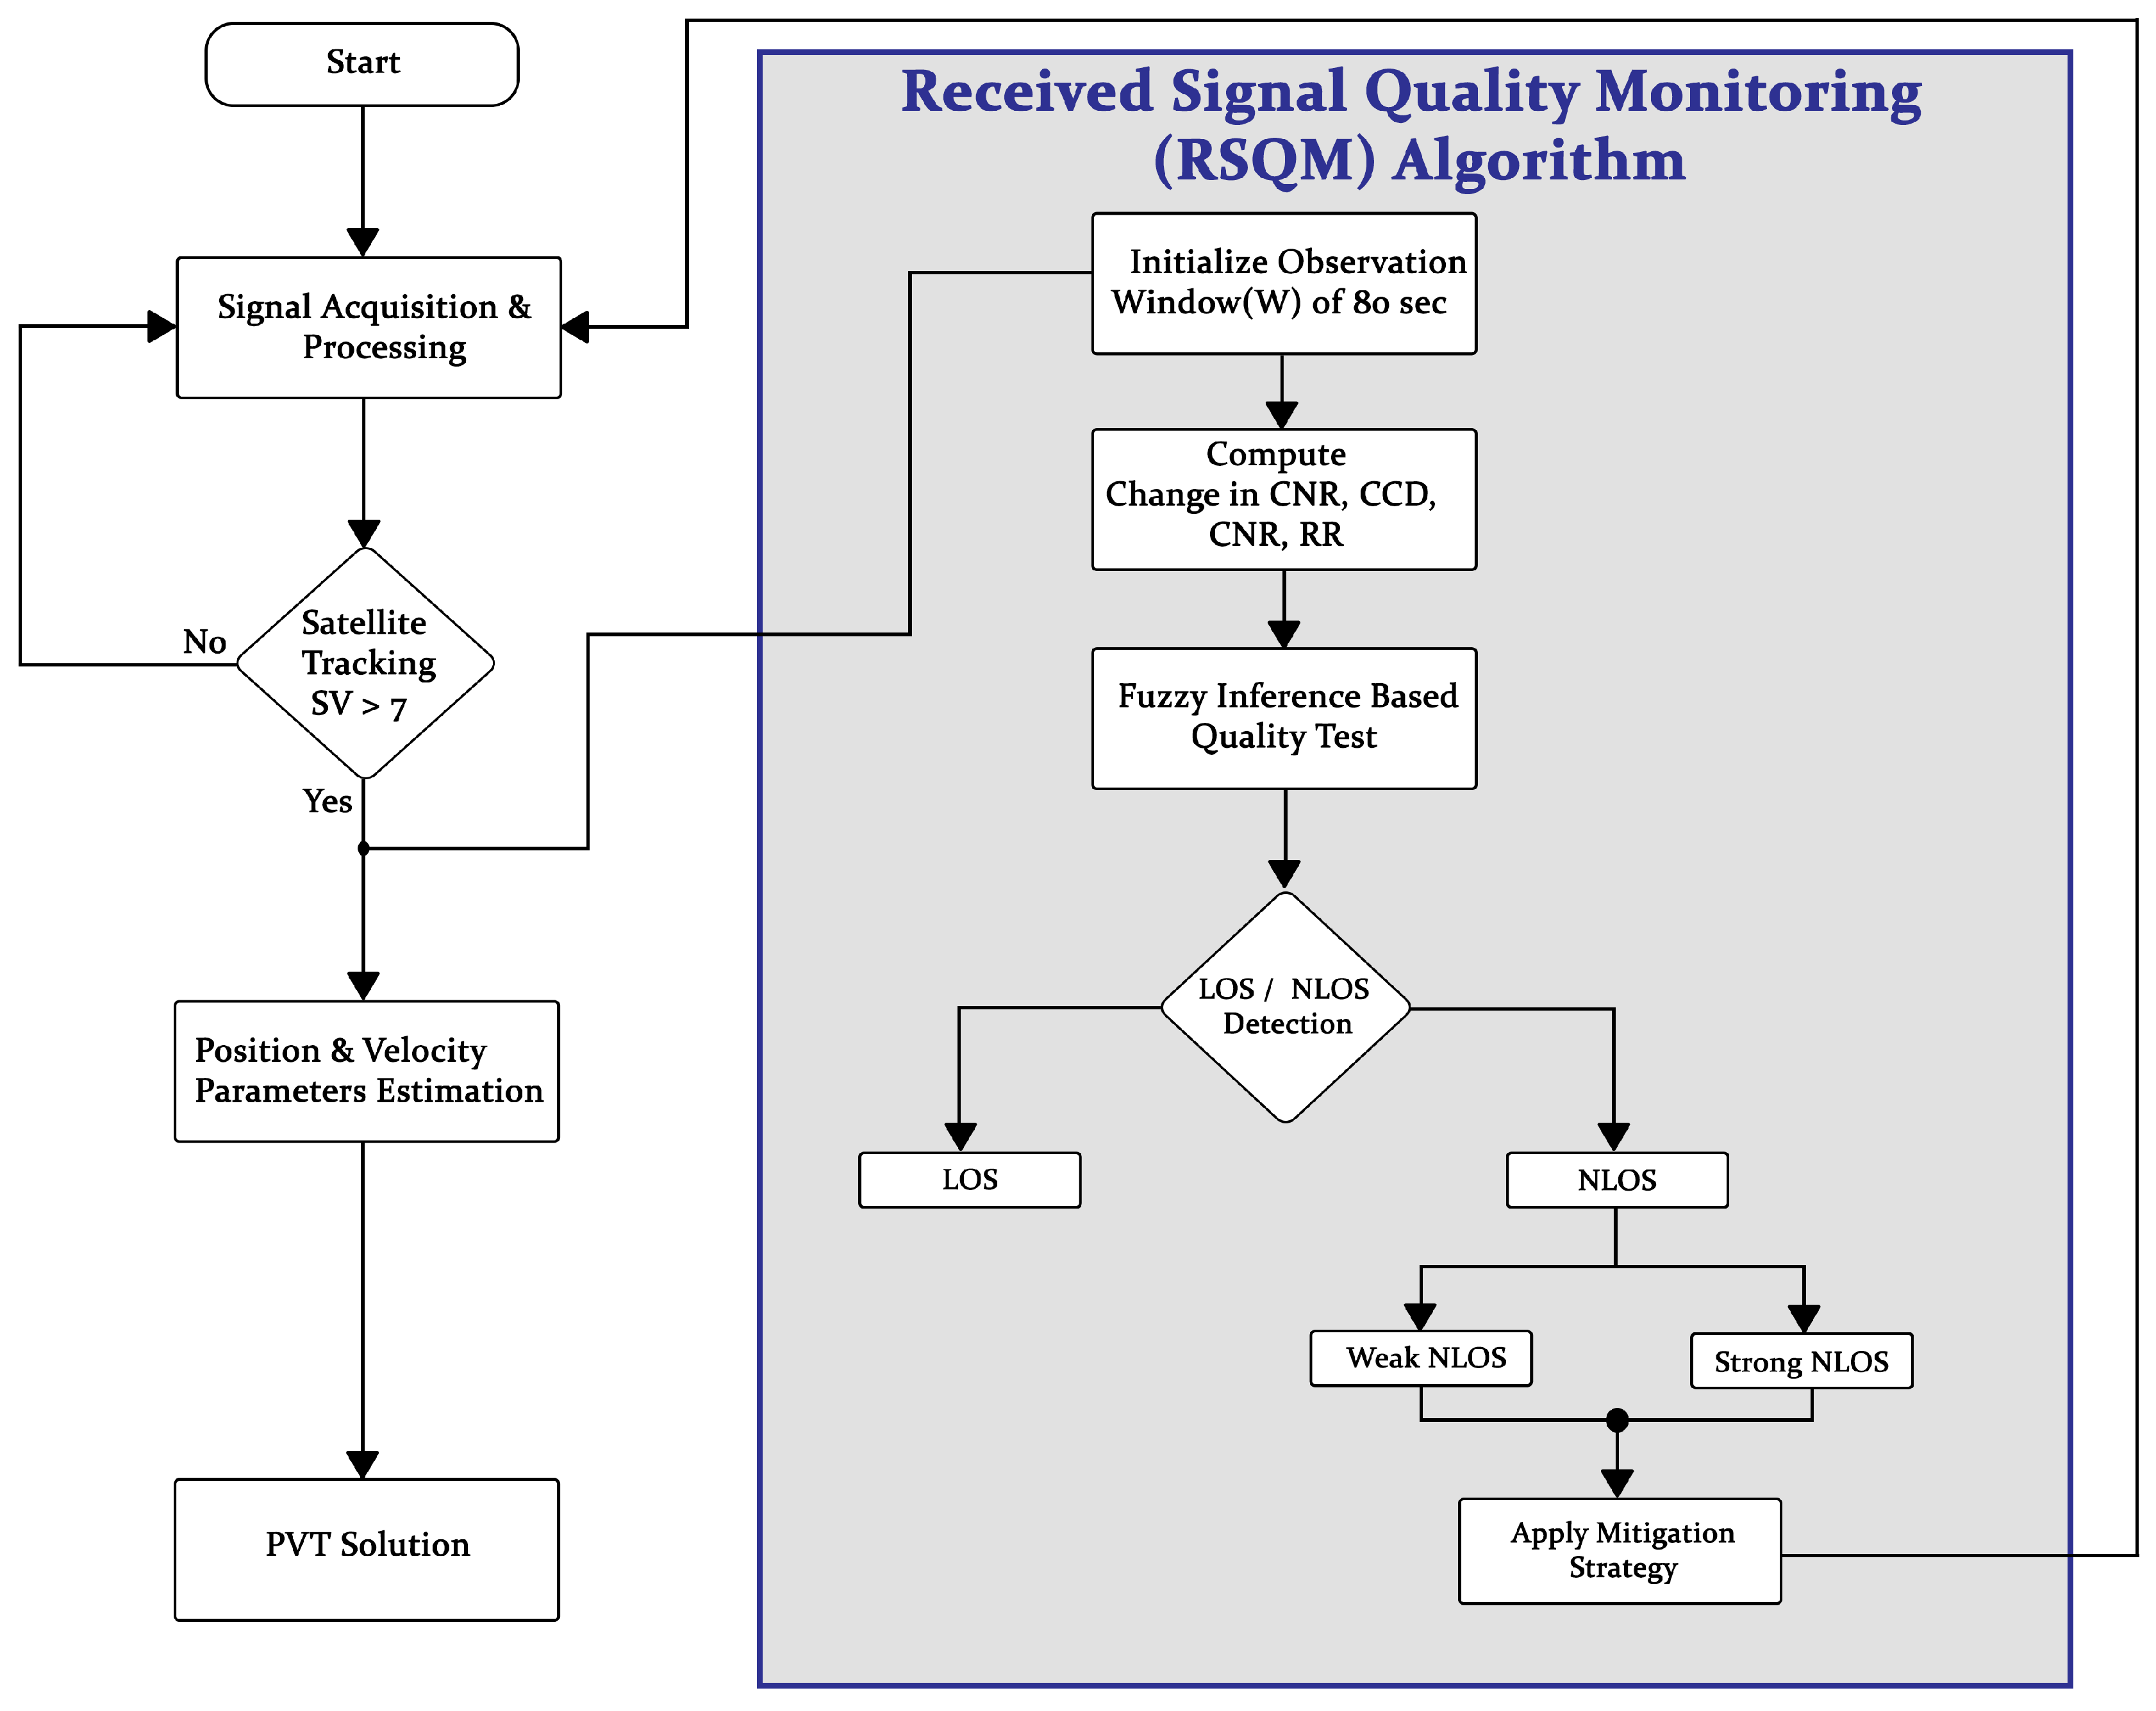
The complete methodology is given in Figure 4. The process initiates with signal acquisition and processing and then tracked the satellites to estimate the PVT solution. At the stage of satellite tracking some specified parameters are obtained that will feed to Received Signal Quality Monitoring (RSQM) for signal quality monitoring. Each stage is discussed in detail in following sections.
3.1. Field Experimentation and Candidate Sites
To analyze and quantify the advancement and its impact on navigation performance we have conducted four experiments on carefully planned and chosen pre-surveyed candidate sites. The three candidate sites are static performed at Department of Electrical Engineering, Sukkur IBA University and one experiment is carried out at Sukkur that one of the highly dense urban cities in Sindh Pakistan for moving mode. Figure 5 (a) the first candidate site in which antenna is placed at the rooftop of Electrical Department building having clear open sky view and it is the best-case environment due to no obstructions or disturbing surrounding. Figure 5 (b) the second site is chosen to have disrupted environments surrounded by buildings and trees. There are frequent possibilities to have multipath and NLOS receptions. Figure 5 (c) It is prominent to have large amount of MP and NLOS in third site because antenna is placed in indoor environments enclosed by side walls. The observation period for all three static scenarios are six hours to have comprehensive analysis. For moving mode, we have selected one of the dense cities of Sindh Pakistan that is Sukkur as target place for analyzing navigation performance shown in Figure 6. This city covers most of the typical scenarios i.e sub-urban, urban and clear sky. The route was chosen of around 20kms that involves all the typical environments within the city. The complete route for moving case can be seen in Figure 6 (a). The clear open sky environment is shown in Figure 6 (b) where we have little chances of degradation. Figure 6 (c) shows the sub-urban scenario where one side is blocked and Figure 6 (d) the severe urban environment contains the high walls buildings, trees and traffic disturbances. It can be established that these typical environments have frequent variations. The list and details of all experiments are given in Table 2.
In all the experiments Data is logged by Septentrio Polarx5S receiver connected PolaNt Choke Ring B3/E6 Antenna and then post processing is done in MATLAB.
4. Results and Discussion
In order to precisely estimate the degradation in navigation performance, analyze the variations in GNSS measurement parameters in various environments, and establishing the cause-effect relationships, rigorous field experimentation is carried out in dynamic (moving) and static modes having a wide range of operating environments.
Figure 7 (a) shows the satellite availability that is the visible satellites tracked by the GNSS receiver, Figure 7 (b) presents the PDOP values and the position error is plotted in Figure 7 (c). As it is mentioned above that the experimental route contains the typical environments i.e., urban, sub-urban having high roof buildings, bridges, traffic, and clear open sky with minimal degradation. It is observed that in a dynamic mode due to a rapidly changing environment fundamental GNSS measurement parameters change frequently. In the P1 observation period of 10 minutes on average 37 satellites were tracked by GNSS receiver having negligible degradation due to clear route. The clear environment results in good satellite geometry and higher PDOP values. PDOP deviates from 0.75 up to a maximum of 1.17. Best Satellite availability and good satellite geometry are the major requirements of heavily accurate and precise positioning estimation. Hence, it is noted from P1 observation window mean position error is 1.3 m due to the best satellite geometry. As the route drives through a complex bridge sub-urban environment with high-rise walls GNSS measurements vary greatly. During the observation time, P2 of 14-22 minutes visible satellites were dropped to 27 which disturbs the satellite geometry due to MP/NLOS receptions.It can be noted from the figure that PDOP rises to 2.21 and variates from 1 to 2 during the complete observation period. These values are not too high but it has significant effects on positioning estimation and it is observed from the position error. On mean position was found to be 4.14 and it reaches up to a maximum of 7.8 with some peaks at different times. We can say that there are frequent disruptions due to MP/NLOS in the P2 window. The advancements in the GNSS have enhanced the visible satellites but still, MP is the prominent error source for GNSS positioning as shown in Figure 7.
In the observation window of P3, we observed the significant disturbances due to complicated building structures in highly urbanized environments. Due to the complex surroundings environment, we observed an excessive amount of uncertainties and inaccuracies in GNSS measurement parameters. Though on mean visible satellites were 27 but we observed the consequences during the observation window from 37 to 62 minutes. The MP and NLOS receptions resulting in larger PDOP values and unfavorable satellite geometry. We have seen some higher peaks in PDOP go above 3 at a certain time in the P3 route. During the complete P3 route there is drastic variations in the PDOP and leading to a sharp increase in position error. It is noted that position error rises to 14.3 and the estimated error mean is 5.3 in the P3 window. Overall we have seen the worst performance of GNSS in the highly urbanized environment and we can say that MP/NLOS are the major error contributor in this severe environment. In the last observation window P4, we have seen a similar performance of GNSS parameters (Visible Satellites, PDOP and Position Error) as in P1. As both scenarios represent the clear open sky environment.
The abrupt deviated environment during the dynamic mode makes the GNSS more difficult to realize. As it is noted from the Figure 7 that recent advancements have enhanced the satellite availability of the GNSS in terms of number of satellites. However, in complex (severe urban) environment we have achieved the maximum number of satellites but there is significant deterioration in the PDOP and position error due to MP/NLOS reception that disrupts the navigation signals. We can say that major limiting factor to precise and accurate navigation is the degraded signal quality not the number of satellites.
In order to deeply understand the anomalies in the performance of GNSS, experiments have carried out in static mode in three different sites i.e., clear open sky, partially degraded and severe degraded. The observation window for all three candidate sites is 06:00 to 12:00 hours. Figure . Figure 8 (a) shows the satellite availability that is quantified by visible satellites, satellite continuity comprised of tracking and outages. In clear open sky site we observed that number of satellites variate from 32 to 43. The mean visible satellites was 38 and satellite continuity is estimated to be in tracking providing no any outages during the complete time. In second environment moderately degraded on average 24 satellites were tracked and satellite continuity is 100%, there is full tracking in the entire time period. Even in severe degraded environment we noted the maximum achievable satellites for positioning estimation. There is minimal outages all the time there was continuous tracking of satellites resulting in no blockage. Hence, we can say that in all three scenarios due to the current developments and technological advancements in the emerging navigation systems has greatly tackled the confined satellite availability in the MP/NLOS conditions that can seen in Figure .Figure 8 (a). To quantify the error PDOP is plotted in Figure .Figure 8 (b) for all three sites. PDOP values deviates below 1 during the complete observation window of six hours in clear open sky site. However,in moderately degraded case PDOP rises above 2 and fluctuates between 1-2 during the entire observation time. In case of severe degraded there is significant deviations and shows some higher peaks in PDOP. On average PDOP is 7.66 that is much higher value. We can say that PDOP is greatly disturbed in degraded and severe degraded case due to the MP/NLOS. As in degraded and severe degraded sites adequate number of satellites are being tracked but still large amount of PDOP is seen that is due to the reduced signal quality, signals are highly obstructed in these environment because of complicated surrounding building structure contributing limited navigation performance.Figure .Figure 8 (c) shows the statistical accuracy for all three candidate sites. The results show that accuracy is highly influenced by MP effects in severe degraded environment, the more the signal obstructed the worse the accuracy achieved. The clear open sky proves to be best case scenario as CEP and DRMS was found to be 0.8 and 0.96 due to no obstructions. In moderately degrade case the radius of accuracy measures CEP and DRMS was estimated as 3.2 and 4.4. In the case of severe degraded site CEP and DRMS is increased to 13.1 and 15.7 respectively.
It can be observed that positioning uncertainty increased by 2 times due to MP/NLOS reception. Hence, it is established that MP/NLOS being the major error sources for navigation performance as it increases the error that leads to inaccurate and reduced positional accuracy.
The performance evaluation of the positioning and navigation under multi-constellation GNSS mode signifies that in highly urbanized environment navigation performance is greatly challenged and vulnerable to multi-paths and NLOS, it is essential to take countermeasures to reduce the positioning error. The quality of signals is highly influenced by these rapidly changing environments and GNSS signal characteristics remarkably deviates from its standard values resulting in unreliable and inaccurate PNT solution. These GNSS signal characteristics are quantified by Carrier-to-noise ratio (CNR), Code carrier divergence (CCD) and Range residuals (RR). Figure 9 shows the detailed analysis of Satellite signal characteristics in three different scenarios/environment. Figure 9 (a) represents the Carrier-to-noise ratio (CNR) (dB-Hz), (b) is the code-carrier divergence (CCD) (m) and (c) shows the normalized range residuals (RR) (m) for three satellites chosen in each environment. It is observed that in clear open sky environment all three satellites follows similar pattern and minimal variations were found in CNR, CCD and RR. Most of the time CNR fluctuates above 35 dB-Hz , CCD variate between 0 to 1 that results in reduced RR to -1. When the environment changes from clear open sky to moderately degraded environment, it is clearly observed that there is increase in the CNR variations. PRN:R02 fluctuates below 40dB and drops to less than 30dB at some intervals. PRN:E24 also deviates below 40dB during the complete lock time. The similar performance can be seen in CCD that is increased upto 6m and RR deviates between -10m to 20m. It is established that in moderately degraded environment some of the measurements are affected by surroundings complex building structure and MP remains the prominent source of positioning uncertainties in these cases.

Table 3.
Multi-constellation GNSS Data Statistics in each candidate sites.
| Observation | Constellation | Satellite Availability | PDOP | Position Error | Accuracy |
|---|---|---|---|---|---|
| Condition | max / avg / min | max / avg / min | max / avg / min | CEP (m) | |
| Stationary | GNSS | 43 / 39 / 32 | 0.92 / 0.79 / 0.71 | 1.35 / 0.96 / 0.71 | 0.8042 |
| (Open Sky) | |||||
| GPS | 11 / 09 / 08 | 2.25 / 1.68 / 1.39 | 1.49 / 1.33 / 1.13 | 1.0877 | |
| (Open Sky) | |||||
| GNSS | 30 / 24 / 20 | 2.24 / 1.77 / 1.23 | 6.40 / 3.46 / 1.34 | 3.2044 | |
| (MP) | |||||
| Moving | GNSS | 35 / 27 / 15 | 2.00 / 1.21 / 0.80 | 6.84 / 2.57 / 0.96 | 2.2589 |
| GPS | 10 / 08 / 04 | 9.65 / 2.58 / 1.78 | 14.9 / 4.41 / 5.95 | 4.5877 |
The severely degraded being the worst case scenario having strong multi-paths and NLOS effects. It is depicted from the figure that there are significant deviations in GNSS signal parameters (CNR, CCD and RR). CNR drops to 35dB and all three satellites exhibit variation in an irregular manner. CCD increased to 4m and some peaks was found at 6m. It is observed that RR rises to 20m and contingent deviation found in RR during the complete lock time of satellites.
In order to further quantify the GNSS signal parameters the histogram of Carrier-to-noise ratio (CNR), Code-carrier divergence (CCD) and Range Residuals (RR) is plotted as in Figure 10, Figure 11, and Figure 12. It shows the distributions of measurements and follows the different patterns due to environmental changes. As expected, most of the CNR values is above 35(dB-Hz) in clear open sky having most of the LOS components. Figure 10 (a) shows the total number of occurrences were 200 out of which 140 values lies between 35 and 50(dB-Hz). Due to the environmental changes the received signal comprises of multi-path, LOS and NLOS that results in reduced CNR and it is depicted in Figure 10 (b) and Figure 10 (c).
The major portion of the CNR achieved in the range of 20 to 30(dB-Hz) in the degraded environment. CNR getting worst in highly degraded environment most of the CNR values lies below 30(dB-Hz) indicating the more number of NLOS and multi-path components in received signal. The histogram of CCD is given in Figure 11 (a), (b) and (c) under different environment. It is noted from the figure that there is significant increased in CCD in highly degraded environment. CCD values come below 2m in clear open sky-view, it increased to 6m in degraded environment and rises to 10m in highly degraded environment. The same pattern followed in Range Residuals (RR) as shown in Figure 12 (a), (b) and (c). Most of the RR points lies from -1m to 1m in clear open sky-views. It is noted that there is substantial increased in the RR at degraded site to 5m and in highly degraded environment RR rises to 10m. The results shows that high CNR, reduced CCD and RR are the indications of clear open sky having negligible obstructions. But in congested environment receiver faces severe interruptions produced due to multipaths, and NLOS that results in reduced navigation accuracy.
Although GNSS receiver can achieve the required navigation performance level under the clear environments, its signal quality is greatly influenced by the surroundings in the obstructed environments such as urbanized areas.
5. Received Signal Quality Monitoring (RSQM)
The increased availability of satellites alone cannot provide more precise positioning in highly degraded or obstructed environment due to serious impact of MP and/or NLOS reception. The possible effects of MP on actual GNSS signal has been demonstrated in Section 2.5. In severe multipath environment, significant deviations in characteristics of satellite signals can occur resulting in positioning error of tens of meters. However, all of the visible satellites are not equally affected by MP/NLOS, it depends upon the satellite position, elevation angle, surroundings around the antenna. With increased satellite availability, probability of MP effects on all satellites is further reduced. The proliferation of GNSS satellites have improved the positional accuracy in various scenarios, still it does not guarantee the accuracy and precision in severe multipath environments. Section 2.5 details the detrimental effects of MP on GNSS signal characteristics. In severe MP environments, these effects can induce positioning errors exceeding tens of meters. However, the susceptibility of individual satellites to MP/NLOS varies depending on factors like satellite position, elevation angle, and antenna surroundings. Fortunately, the increased availability of satellites through multi-constellation systems reduces the likelihood that all visible satellites will be equally affected by MP.
A variety of scientists are focusing their efforts on discovering techniques that decrease the negative impact of multipath (MP) effects on signals. MP is the scenario in which a signal hits any object before it arrives at the destination, which can make the signal weak and could lead to problem for instance with positioning system. The Techniques can also be applied during the signal processing stage to improve the accuracy of the signal, especially in situations where the signal or environment is constantly changing (dynamic applications). One approach involves using weighting models, which take into account factors like the signal-to-noise ratio (C/N0) or the elevation of the satellite to improve positioning accuracy. These weighting models are relatively easy to implement. Other signal processing techniques focus on the actual signal itself [31]. Doppler and pseudorange estimators, feed-forward estimators, and multi-frequency C/N0 techniques can be particularly useful in these situations. Researchers are also exploring other approaches to address MP. These techniques can involve consistency checks, where the system looks for inconsistencies in the received signal to identify potential MP issues. Statistical approaches, like Kalman filters, maximum likelihood estimation, and particle filtering, can also be used to analyze the signal and reduce the impact of MP [32,33,34,35,36]. Additionally, some techniques focus on mitigating MP in the carrier signal itself (carrier smoothing) or in the Doppler domain (Doppler domain MP mitigation). Machine learning-based methods, such as neural networks (NN), support vector machines (SVM), and pattern recognition, have also been explored for MP mitigation. These methods can learn to identify and classify multipath scenarios, enabling more effective mitigation strategies. The effective mitigation of MP and NLOS errors in GNSS systems requires a combination of receiver configuration, signal processing techniques, and adaptive strategies [21,22,24,37,38,39,40]. By carefully considering these factors and leveraging advanced techniques, it is possible to enhance the positioning and navigation performance of GNSS positioning in challenging environments.
Figure 13.
Flow chart of the RSQM
Overall, there’s no single solution to address MP, and the best approach will depend on the specific situation and application. Researchers are actively participating and investigating the wide range of techniques to reduce the negative effects of MP and ensure the accuracy and reliability of signals. Within the realm of multipath mitigation techniques, signal quality monitoring approaches at the measurement or position level hold promise due to their minimal, if any, hardware modifications. Previously discussed techniques often necessitate specialized and costly hardware, posing accessibility limitations.
Through extensive positioning and accuracy analysis, coupled with field experiments, we propose an adaptive receiver signal quality monitoring (RSQM) algorithm specifically designed for autonomous navigation in urban canyons. In clear open sky case, having minimal obstructions hence there is good possibility of majority of the LOS components.However, in the obstructed urban environment signal is obscured by complex surrounding structures leads to limited LOS components and there is chances of NLOS reception and multipaths. This can impact the range mesurements causing disruptions in the positioning solution. As there is no clear boundary between LOS and NLOS, it is important for the GNSS system to produce/compute the measurement of the signal quality continuously. The quality factor (QF) is introduced to continuously measure the signal quality based on input features . The qualitative relationship between input parameters and QI can be expressed by fuzzy inference system. Most of the classification models utilized the boolean expression, that means fixed classification either sample data belongs to the particular class or not. However, in the context of GNSS to identify the LOS and NLOS there is not clearly boundary defined that limits the classification hard. For this purpose, fuzzy inference system is used in the proposed algorithm that defines the possibility of belongings of sample data to a class. The system based on the fuzzy logic rules and membership functions. The membership functions explains the mapping of input and output variables with the degree of membership to a particular class while fuzzy logic rules are set of if-then statements that helps in making a decision from the inputs in the fuzzy inference system. These rules assist in computation of output membership function based on the input variables.
5.1. RSQM Model Design and Implementation
The GNSS receiver initiates the process by acquiring and processing the satellite signal. This involves filtering out interference and amplifying the weak satellite signal. If enough satellites are being tracked (SV > 7), the process proceeds to the next step. If not, it likely indicates limited satellite visibility due to factors like obstructions or challenging environments (urban areas) and it attempt to reacquire the signals.
Once a signal is acquired and tracked, a fuzzy inference system is employed to assess the overall quality of the GNSS signal based on the extracted parameters ( CCD, CNR, and RR). Fuzzy logic can handle uncertainties and incorporate human-like reasoning, making it suitable for tasks where precise signal quality thresholds might be difficult to define.
The fuzzy inference system likely requires initialization, which involve the quality testing based on the processed GNSS signal and the established criteria..Based on the fuzzy inference system’s output, the signal quality is categorized as either LOS (Line-of-Sight) or NLOS (Non-Line-of-Sight). An LOS signal suggests a direct path between the GNSS receiver and the satellite.If the signal is classified as LOS, the process proceeds to calculate the position and velocity of the GNSS receiver using standard GNSS positioning techniques. While NLOS indicates the signal has bounced off obstacles before reaching the receiver, potentially affecting accuracy. The classification process of fuzzy inference system is illustrated in Fig. Figure 14. Fig. Figure 14 depicts a fuzzy inference system (FIS) designed to evaluate the quality of Global Navigation Satellite System (GNSS) signals. Fuzzy logic offers a framework for evaluating GNSS signal quality, which can be inherently imprecise due to factors like signal strength variations and environmental conditions. The input variables are then converted from a numerical value into a fuzzy degree of membership in various fuzzy sets. These fuzzy sets represent linguistic terms like "Low," "Medium," or "High" for CNR or RR, and "Fast," "Medium," or "Slow" for CCD. The membership functions define the degree of membership for each input value within these fuzzy sets. After that membership functions are determined through trapezoidal and triangular functions based on mamdani method and feed to knowledge base that consists of a set of fuzzy IF-THEN rules that relate the input fuzzy sets to an output fuzzy set representing the GNSS signal quality. For instance, a rule might be: "IF CCD is Low AND CNR is High AND RR is low, THEN Signal Quality is High." The specific rules and their weightage determine how the system interprets the combination of input signals.All the fuzzy rules are aggregated to determine the overall fuzzy output representing the GNSS signal quality. The aggregated fuzzy output as quality factor is converted back into a numerical value (e.g., a quality factor between 0 and 1) that represents the inferred GNSS signal quality. This value can be used for classification of LOS/NLOS (Line-of-Sight/Non-Line-of-Sight). Overall, the fuzzy inference system provides a flexible and robust approach to GNSS signal quality assessment. It can handle uncertainties in the input measurements and incorporate expert knowledge through the fuzzy rules, ultimately contributing to improved positioning accuracy in dynamic environments.
Figure 15a–c shows the membership functions for the input variables that represent GNSS signal quality metrics. These functions determine the degree to which an input value belongs to fuzzy sets like "low," "medium," or "high." Figure 15s depicts the membership functions for the output variable, quality factor (QF). The five triangles are employed for quality factor (QF), with overlapping regions between adjacent triangles. This overlap is a key characteristic of fuzzy logic, allowing for smooth transitions between fuzzy sets. The integration of input and output membership functions enables the fuzzy inference system to handle various signal quality conditions ranges from good to worse. When a specific set of input values ( CNR, RR, and CCD) is received, their corresponding membership degrees in each fuzzy set (low, medium, high) are determined using the input membership functions. These degrees are then used by the fuzzy rules to compute an overall fuzzy output representing the GNSS signal quality. The output membership functions with overlapping regions allow for gradual transitions in the output quality assessment, reflecting the inherent uncertainties in real-world GNSS signal reception.
The membership functions act as a key parameter for classification. They convert raw GNSS signal measurements into fuzzy categories. This fuzzy logic approach allows for a more refined assessment of signal quality by acknowledging the inherent variability of real-world GNSS reception. By incorporating these fuzzy categories into the RSQM algorithm, the system has the potential to achieve improved positioning accuracy across various environments."
5.2. Rules for Fuzzy Inference System
- If CNR is high , NRR is increase, and CCD is high then QF is low
- If CNR is medium , NRR is increase, and CCD is high then QF is low
- If CNR is low , NRR is increase, and CCD is high then QF is low
- If CNR is high , NRR is decrease, and CCD is high then QF is medium
- If CNR is medium , NRR is decrease, and CCD is high then QF is low
- If CNR is low , NRR is decrease, and CCD is high then QF is medium
- If CNR is high , NRR is steady, and CCD is low then QF is high
- If CNR is medium , NRR is steady, and CCD is low then QF is high
- If CNR is low , NRR is steady, and CCD is low then QF is high
- If CNR is high , NRR is steady, and CCD is medium then QF is high
- If CNR is medium , NRR is steady, and CCD is medium then QF is high
- If CNR is low , NRR is steady, and CCD is medium then QF is low
5.3. Adaptive Navigation (Mitigation using RSQM)
Based on the detailed analysis, it is concluded that signals quality is highly influenced by degradation in the environment like MP/NLOS receptions. To mitigate the effects of MP/NLOS receptions an adaptive mitigation technique must be adopted to improve the navigation performance. This adaptive positioning and navigation technique exploits the redundancy of range measurements (i.e., increased satellite availability) and select the optimal signal quality/range measurements position and navigation solution and excludes/masks affected range measurements while considering the satellite geometry constraints. The reported average position error in urban canyon was 2.7m, this can be further reduced if the affected measurements are discarded and not used in position estimation. As GNSS is advanced with increased satellite availability having more number of satellites, RSQM algorithm choose those subset of satellites that are less affected by obstructions and select the best quality signals in position measurements to improve the navigation performance. There are several studies that have adopted the masking and exclusion algorithms of faulty measurements for improved positioning performance. Those studies rely on the parameters like CNR, range residuals and elevation angle to exclude the faulty/NLOS measurements using single constellation. However, in case of multi-constellation monitoring each parameter can increase the processing load of the GNSS receiver. As higher CNR values and elevation angles are indicators of best quality signals and they are least influenced by obstructions. Considering this into context, RSQM algorithm adopted the adaptive approach to mask the CNR and Elevation angle. Table 4 shows the receiver settings according to the detected signal quality in different environments.
Figure 16 shows the performance of GNSS in different regions after applying mitigation strategy. Open sky regions, represented by observation periods P1 and P4, provided the most favorable conditions. On average, GNSS receivers tracked a high number of satellites (around 37). This abundance of satellites translated into a good satellite geometry, reflected in low PDOP (Position Dilution of Precision) values (around 1). PDOP is a metric that indicates the geometric distribution of visible satellites and its impact on positioning accuracy. Lower PDOP values signify a more favorable satellite constellation and consequently, higher positioning accuracy. In these clear sky scenarios, the resulting position errors were minimal, averaging around 1.3 meters. The sub-urban environment (P2) presented a more challenging scenario. While a decent number of satellites remained visible (averaging around 27), the presence of buildings and other structures caused disruptions to the GNSS signals. These disruptions, known as multipath (MP) and non-line-of-sight (NLOS) reception, occur when the GNSS signal bounces off obstacles before reaching the receiver, leading to inaccurate positioning data. As a consequence, PDOP values rose in the sub-urban environment (up to 2.21), indicating a less favorable satellite geometry. This degraded geometry, combined with the MP and NLOS effects, resulted in a noticeable increase in position errors, with an average of 4.14 meters. Urban areas (P3) posed the most significant challenges for GNSS reception. The complex building structures significantly limited the number of visible satellites, with an average of only 27 satellites tracked throughout the observation window (P3, 37 to 62 minutes). This limited satellite availability, coupled with the prevalence of MP and NLOS reception due to the dense urban environment, resulted in the highest PDOP values observed during the experiment (above 3). These high PDOP values signify a very unfavorable satellite geometry, severely impacting positioning accuracy. Consequently, position errors in the urban environment were substantial, with a mean of 5.3 meters and occasional peaks reaching up to 14.3 meters. The comparative analysis shows that performance is improved due to the adaptive mitigation through masking and exclusion of faulty measurements.
6. Conclusions
GNSS signal characteristics has significant benefits in advancing the modern industries. The integration of swarm intelligence and Industry 5.0 with GNSS makes the system more sustainable and resilient system to provide seamless and precise positioning and navigation solution. In this paper the comprehensive assessment and quantification of GNSS signals under various environments due to the multipaths and NLOS is presented. For this purpose, field experimentation has been carried out at different candidate sites under static and dynamic configuration. There are total four experiments performed. The three candidate sites are static performed at Department of Electrical Engineering, Sukkur IBA University and one experiment is carried out at Sukkur that one of the highly dense urban cities in Sindh Pakistan for dynamic mode. These sites are pre-surveyed and carefully chosen to quantify the effects of MP/NLOS. The GNSS performance has significant impact due to the environmental change as when there are clear open sky views there are minimal chances of degradations. As environment becomes congested/complex the degradations increased and deteriorate the GNSS positioning and navigation performance. Based on detailed evaluation, the thesis proposed a Received Signal Quality Monitoring (RSQM) algorithm to initially classify the signal quality into LOS and NLOS, and then apply adaptive mitigation accordingly. The RSQM algorithm dynamically adjusts receiver settings based on the detected signal quality to achieve optimal navigation performance. The authenticity of the RSQM algorithm was verified through field experiment on the same route and similar environmental conditions as used without RSQM algorithm. The mitigation results shows the improved navigation performance in terms of position error that is reduced from 14.4m to 4m. In the future work, the research can be extended to include the challenges of autonomous vehicle. Seamless, accurate and precise positioning and navigation solution is needed for autonomy and accuracy level will be within centimeters. Future research will be focused to meet the requirements of autonomous vehicles by adaptive navigation through machine learning and deep learning algorithms.
Author Contributions
Conceptualization, H.M. and M.A.A.; Data creation, A.H. and H.M.; Formal Analysis, A.H. and H.M.; Funding Acquisition, G.E.M.A., S.A.M., and W.G.K.; Investigation, A.A.; Methodology, H.M., and A.A.; Project Administration, M.A.A.,G.E.M.A. and S.A.M. ; Resources, A.A., S.A.M. and A.H.; Software, H.M., S.A.M.; Supervision, M.A.A., A.A.; Validation, A.A., W.G.K.; Visualization, A.H.; Writing—original draft, H.M., G.E.M.A.; Writing—review and editing, A.A.,A.H.; All authors have read and agreed to the revised version of the manuscript.
Funding
This work was supported by the National Research Foundation of Korea (NRF) funded by Korean Government Ministry of Science and ICT (MSIT) under Grant RS-2022-00166977.
Acknowledgments
This research commenced at the GNSS and Space Weather Laboratory, Department of Electrical Engineering, Sukkur IBA University, Pakistan, and subsequently received support from the Interdisciplinary Research Centre for Aviation and Space Exploration (IRCASE) at King Fahd University of Petroleum and Minerals (KFUPM), Saudi Arabia. The authors express gratitude for the support provided by IRCASE-KFUPM, Saudi Arabia and collaborated with National Research Foundation of Korea (NRF) funded by Korean Government Ministry of Science.
Conflicts of Interest
The authors declare no conflict of interest.
References
- Ghobakhloo, M.; Fathi, M.; Iranmanesh, M.; Vilkas, M.; Grybauskas, A.; Amran, A. Generative artificial intelligence in manufacturing: opportunities for actualizing Industry 5.0 sustainability goals. Journal of Manufacturing Technology Management 2024, 35, 94–121. [Google Scholar] [CrossRef]
- Tan, Y.; Zheng, Z.y. Research advance in swarm robotics. Defence Technology 2013, 9, 18–39. [Google Scholar] [CrossRef]
- Joseph, A.A.; Nambiar, G.S.; Jayapandian, N. Swarm Intelligence Decentralized Decision Making In Multi-Agent System. 2023 8th International Conference on Communication and Electronics Systems (ICCES), 2023, pp. 1425–1430. [CrossRef]
- EUSpace. EUSPA EO and GNSS. https://www.euspa.europa.eu/sites/default/files/euspa_market_report_2024.pdf, 2024. [Accessed 30-08-2024].
- Rashid, H.; Hua, L.M.; Guanghua, L.; Hasan, R.; AlKaseem, A.; Ali, A.; Shah, S.H.H.; Shaikh, S.; Soomar, A.M.; Musznicki, P. A comprehensive review on economic, environmental impacts and future challenges for photovoltaic-based electric vehicle charging infrastructures. Frontiers in Energy Research 2024, 12, 1411440. [Google Scholar] [CrossRef]
- Shaikh, S.; Soomar, A.M.; Ullah, K.; Ismail, E.A.; Awwad, F.A.; Kamran, M.; Musznicki, P.; Shah, S.H.H. Modified sliding mode control for seamless integration of PV energy in AC grid. Energy Reports 2024, 12, 673–686. [Google Scholar] [CrossRef]
- Lee, W.; Cho, H.; Hyeong, S.; Chung, W. Practical Modeling of GNSS for Autonomous Vehicles in Urban Environments. Sensors 2019, 19, 4236. [Google Scholar] [CrossRef]
- Bayar, G.; Bergerman, M.; Koku, A.B.; Ilhan Konukseven, E. Localization and control of an autonomous orchard vehicle. Computers and Electronics in Agriculture 2015, 115, 118–128. [Google Scholar] [CrossRef]
- Hussain, A.; Magsi, H.; Arslan, A.; Hussain, H.; Khand, Z.H.; Akhtar, F. The effects of using variable lengths for degraded signal acquisition in GPS receivers. International Journal of Electrical and Computer Engineering 2021, 11, 3201. [Google Scholar] [CrossRef]
- Hussain, A.; Ahmed, A.; Magsi, H.; Soomro, J.B.; Bukhari, S.S.H.; Ro, J.S. Adaptive data length method for GPS signal acquisition in weak to strong fading conditions. Electronics 2021, 10, 1735. [Google Scholar] [CrossRef]
- Guanghua, L.; Shaikh, S.; Hussain Shah, S.H.; AlKassem, A.; Soomar, A.M.; Khan, S. A Review of Economic and Environmental Impacts of Potential Renewable Energy Resources in Certain Climate Regions. Available at SSRN 4855059 2024. [Google Scholar]
- Xu, H.; Hsu, L.T.; Lu, D.; Cai, B. Sky visibility estimation based on GNSS satellite visibility: an approach of GNSS-based context awareness. GPS Solutions 2020, 24, 1–15. [Google Scholar] [CrossRef]
- Suzuki, T. Mobile robot localization with GNSS multipath detection using pseudorange residuals. Advanced Robotics 2019, 33, 602–613. [Google Scholar] [CrossRef]
- Magsi, H.; Shah, M.A.; Shah, S.H.H.; Hussain, A.; Soomar, A.M.; Chachar, F.A. ; others. Performance Analysis and Quantification of BeiDou Navigation Satellite System (BDS-3). 2023 4th International Conference on Computing, Mathematics and Engineering Technologies (iCoMET). IEEE, 2023, pp. 1–6. [CrossRef]
- Joubert, N.; Reid, T.G.; Noble, F. Developments in Modern GNSS and Its Impact on Autonomous Vehicle Architectures. arXiv preprint arXiv:2002.00339, arXiv:2002.00339 2020.
- Guo, J.; Li, X.; Li, Z.; Hu, L.; Yang, G.; Zhao, C.; Fairbairn, D.; Watson, D.; Ge, M. Multi-GNSS precise point positioning for precision agriculture. Precision agriculture 2018, 19, 895–911. [Google Scholar] [CrossRef]
- Hussain, A.; Ahmed, A.; Magsi, H.; Tiwari, R. Adaptive GNSS receiver design for highly dynamic multipath environments. IEEE Access 2020, 8, 172481–172497. [Google Scholar] [CrossRef]
- Lee, Y.; Hwang, Y.; Ahn, J.Y.; Seo, J.; Park, B. Seamless accurate positioning in deep urban area based on mode switching between DGNSS and multipath mitigation positioning. IEEE Transactions on Intelligent Transportation Systems 2023, 24, 5856–5870. [Google Scholar] [CrossRef]
- Pirsiavash, A.; Broumandan, A.; Lachapelle, G.; O’keefe, K. GNSS code multipath mitigation by cascading measurement monitoring techniques. Sensors 2018, 18, 1967. [Google Scholar] [CrossRef] [PubMed]
- Lee, Y.; Park, B.; Hwang, Y.; Lee, B.S.; Ahn, J. Direct estimation of multipath in a deep urban area using multi-GNSS carrier phase variation and previous position. Proceedings of the ION 2019 Pacific PNT Meeting, 2019, pp. 728–736. [CrossRef]
- Li, L.; Xu, Z.; Jia, Z.; Lai, L.; Shen, Y. An efficient GNSS NLOS signal identification and processing method using random forest and factor analysis with visual labels. GPS Solutions 2024, 28, 77. [Google Scholar] [CrossRef]
- Qi, X.; Xu, B. Machine learning assisted multipath signal parameter estimation and its evaluation under weak signal environment. 2023 IEEE/ION Position, Location and Navigation Symposium (PLANS). IEEE, 2023, pp. 1019–1026. [CrossRef]
- Min, D.; Kim, M.; Lee, J.; Circiu, M.S.; Meurer, M.; Lee, J. DNN-based approach to mitigate multipath errors of differential GNSS reference stations. IEEE Transactions on Intelligent Transportation Systems 2022, 23, 25047–25053. [Google Scholar] [CrossRef]
- Lee, Y.; Park, B. Nonlinear regression-based GNSS multipath modelling in deep urban area. Mathematics 2022, 10, 412. [Google Scholar] [CrossRef]
- Dong, D.; Wang, M.; Chen, W.; Zeng, Z.; Song, L.; Zhang, Q.; Cai, M.; Cheng, Y.; Lv, J. Mitigation of multipath effect in GNSS short baseline positioning by the multipath hemispherical map. Journal of Geodesy 2016, 90, 255–262. [Google Scholar] [CrossRef]
- Braasch, M.S. Multipath. In Springer Handbook of Global Navigation Satellite Systems; Springer, 2017; pp. 443–468. [CrossRef]
- Bilich, A.; Larson, K.M. Correction published 29 March 2008: Mapping the GPS multipath environment using the signal-to-noise ratio (SNR). Radio Science 2007, 42, 1–16. [Google Scholar]
- Bilich, A.; Larson, K.M.; Axelrad, P. Modeling GPS phase multipath with SNR: Case study from the Salar de Uyuni, Boliva. Journal of Geophysical Research: Solid Earth 2008, 113. [Google Scholar] [CrossRef]
- Lau, L.; Cross, P. Investigations into phase multipath mitigation techniques for high precision positioning in difficult environments. The Journal of Navigation 2007, 60, 457–482. [Google Scholar] [CrossRef]
- Zhang, Z.; Li, B.; Gao, Y.; Shen, Y. Real-time carrier phase multipath detection based on dual-frequency C/N0 data. GPS Solutions 2019, 23, 7. [Google Scholar] [CrossRef]
- Pirsiavash, A.; Broumandan, A.; Lachapelle, G.; O’Keefe, K. Detection and de-weighting of multipath-affected measurements in a GPS/Galileo combined solution. 2019 European Navigation Conference (ENC). IEEE, 2019, pp. 1–11. [CrossRef]
- Xue, Z.; Lu, Z.; Xiao, Z.; Song, J.; Ni, S. Overview of multipath mitigation technology in global navigation satellite system. Frontiers in Physics 2022, 10, 1071539. [Google Scholar] [CrossRef]
- Jiang, Z.; Groves, P.D. NLOS GPS signal detection using a dual-polarisation antenna. GPS solutions 2014, 18, 15–26. [Google Scholar] [CrossRef]
- Egea-Roca, D.; Tripiana-Caballero, A.; López-Salcedo, J.A.; Seco-Granados, G.; De Wilde, W.; Bougard, B.; Sleewaegen, J.M.; Popugaev, A. GNSS measurement exclusion and weighting with a dual polarized antenna: The FANTASTIC project. 2018 8th International Conference on Localization and GNSS (ICL-GNSS). IEEE, 2018, pp. 1–6. [CrossRef]
- Xie, L.; Cui, X.; Zhao, S.; Lu, M. Mitigating multipath bias using a dual-polarization antenna: Theoretical performance, algorithm design, and simulation. Sensors 2017, 17, 359. [Google Scholar] [CrossRef]
- Fan, W.; Hentilä, L.; Zhang, F.; Kyösti, P.; Pedersen, G.F. Virtual drive testing of adaptive antenna systems in dynamic propagation scenarios for vehicle communications. IEEE Access 2018, 6, 7829–7838. [Google Scholar] [CrossRef]
- Hsu, L.T.; Jan, S.S.; Groves, P.D.; Kubo, N. Multipath mitigation and NLOS detection using vector tracking in urban environments. Gps Solutions 2015, 19, 249–262. [Google Scholar] [CrossRef]
- Li, D.; Wang, X.; Zhao, J.; Cheng, J. Channel compensation multipath mitigation technique for Kalman-Based Least Mean Square based on Kalman estimation. Concurrency and Computation: Practice and Experience 2021, 33, e6133. [Google Scholar] [CrossRef]
- Elango, G.A.; others. A new multipath channel estimation and mitigation using annihilation filter combined tracking loop implementation in software GPS receivers. Measurement Science and Technology 2022, 33, 045105. [Google Scholar] [CrossRef]
- Li, H.; Borhani-Darian, P.; Wu, P.; Closas, P. Deep neural network correlators for GNSS multipath mitigation. IEEE Transactions on Aerospace and Electronic Systems 2022, 59, 1249–1259. [Google Scholar] [CrossRef]
Figure 1.
Complete organization of the paper.
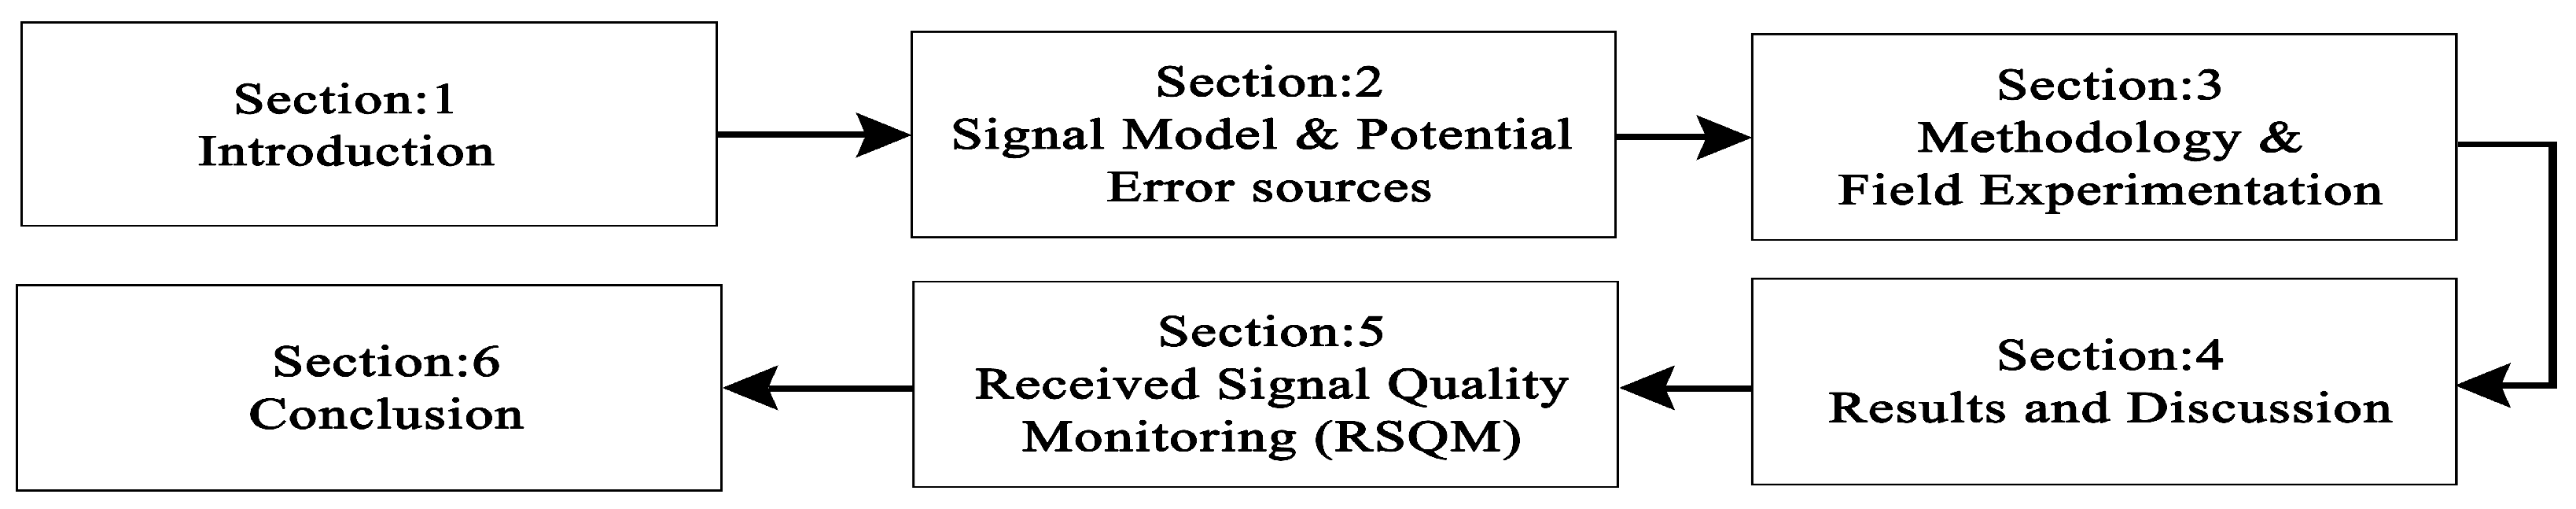
Figure 2.
Error sources of GNSS signal reception in urban environment.
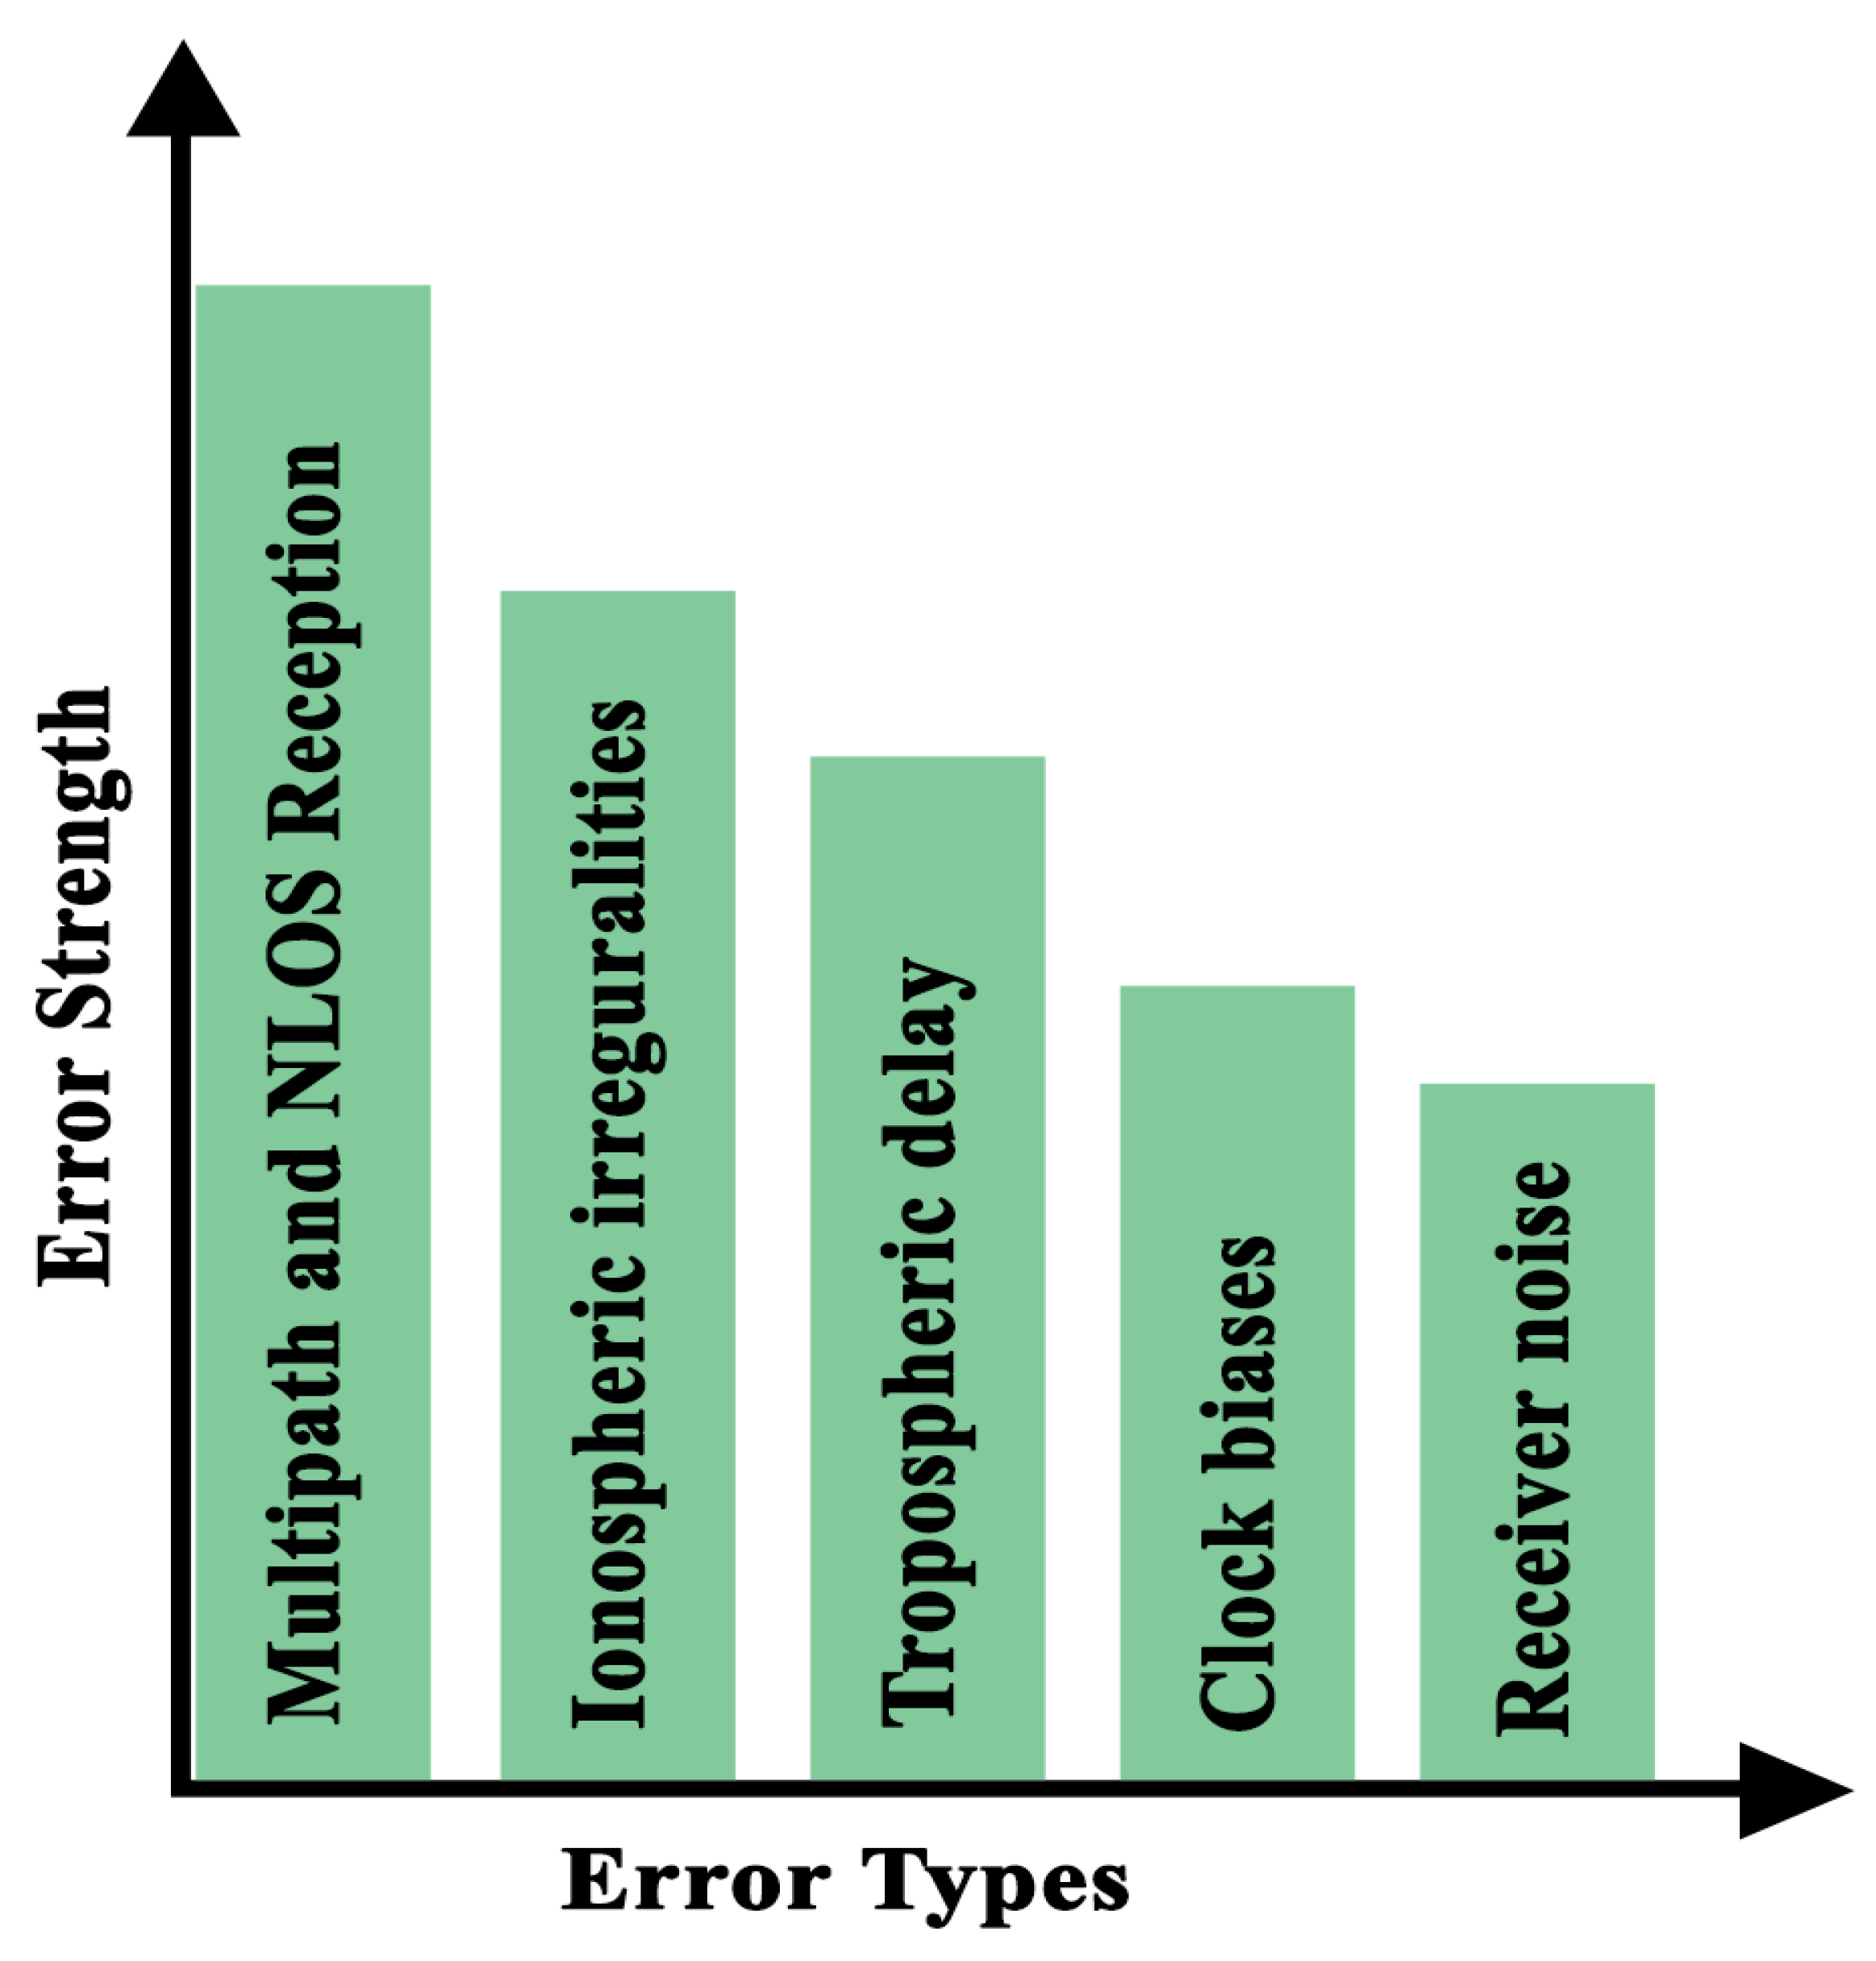
Figure 3.
Potential Vulnerabilities of satellite signal reception in urban environment.
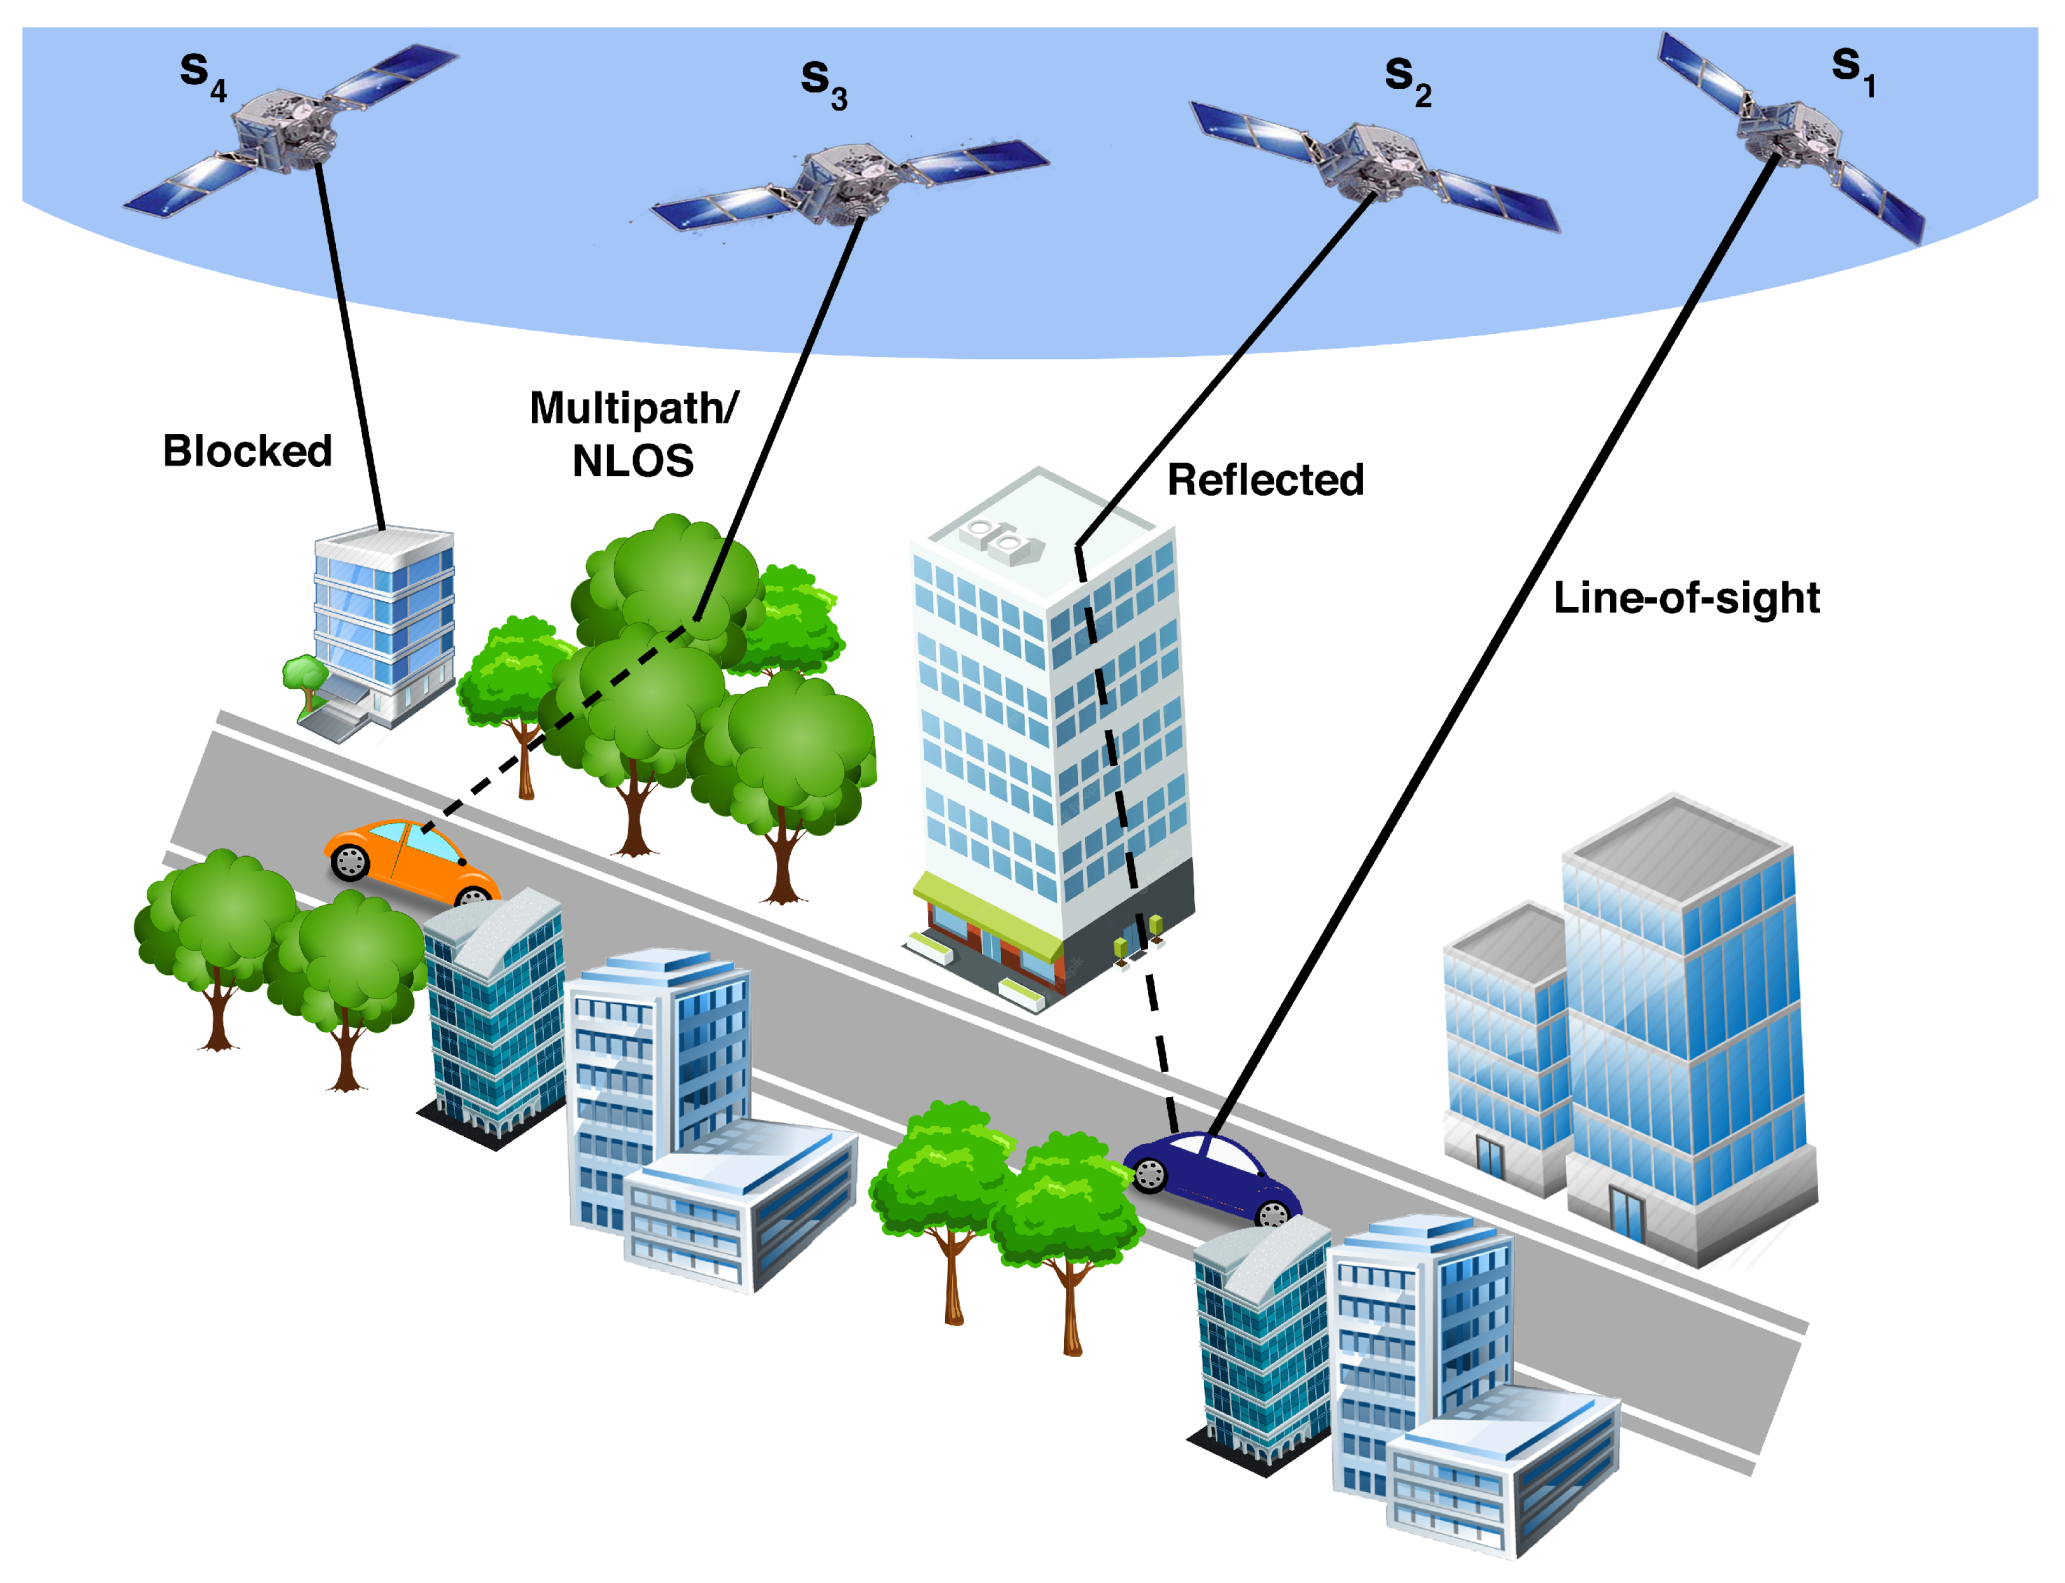
Figure 4.
Workflow of the paper.
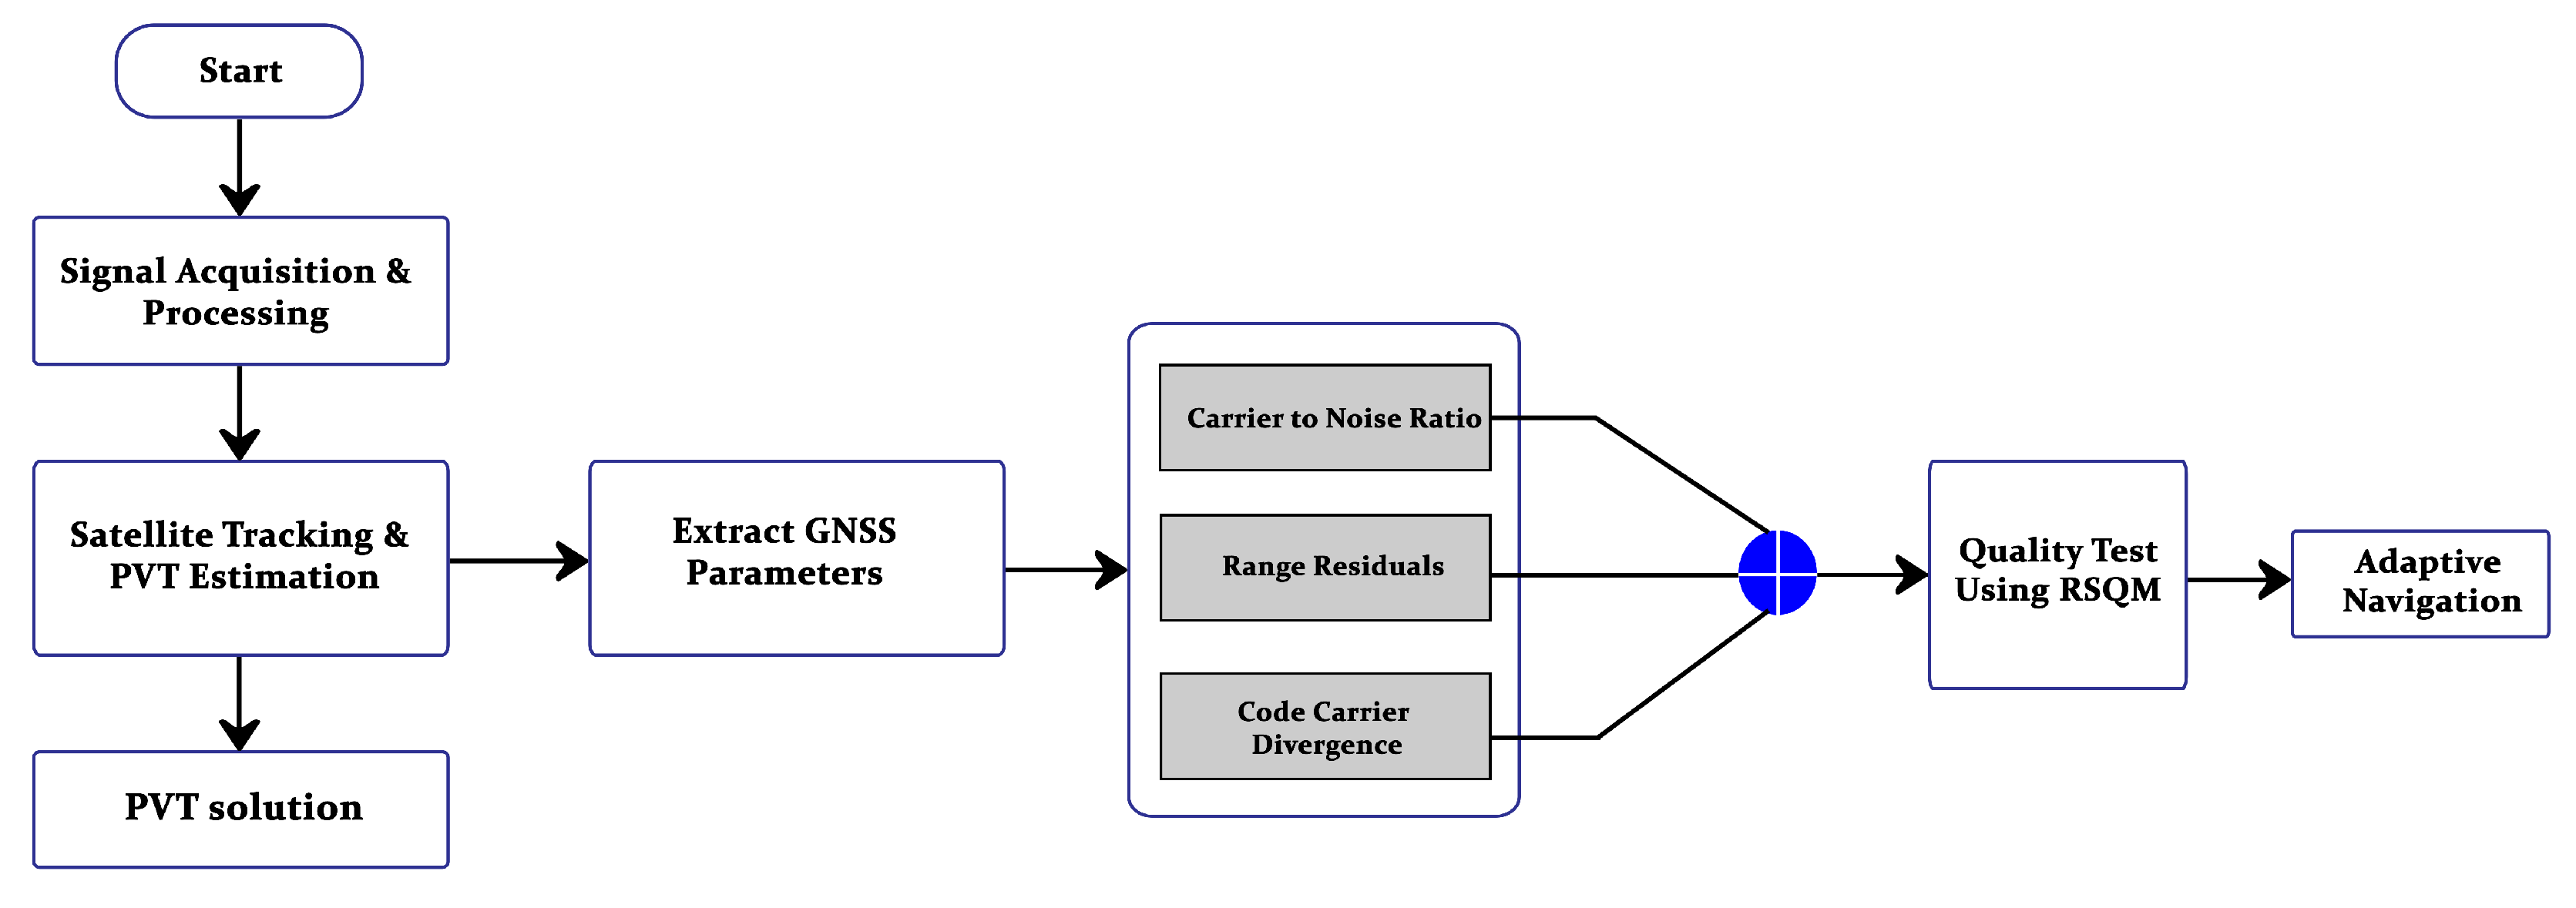
Figure 5.
Candidate sites for Static experiments; (a) Best case environment, (b) Mediocre Multipath, (c) Worst Multipath.
Figure 5.
Candidate sites for Static experiments; (a) Best case environment, (b) Mediocre Multipath, (c) Worst Multipath.
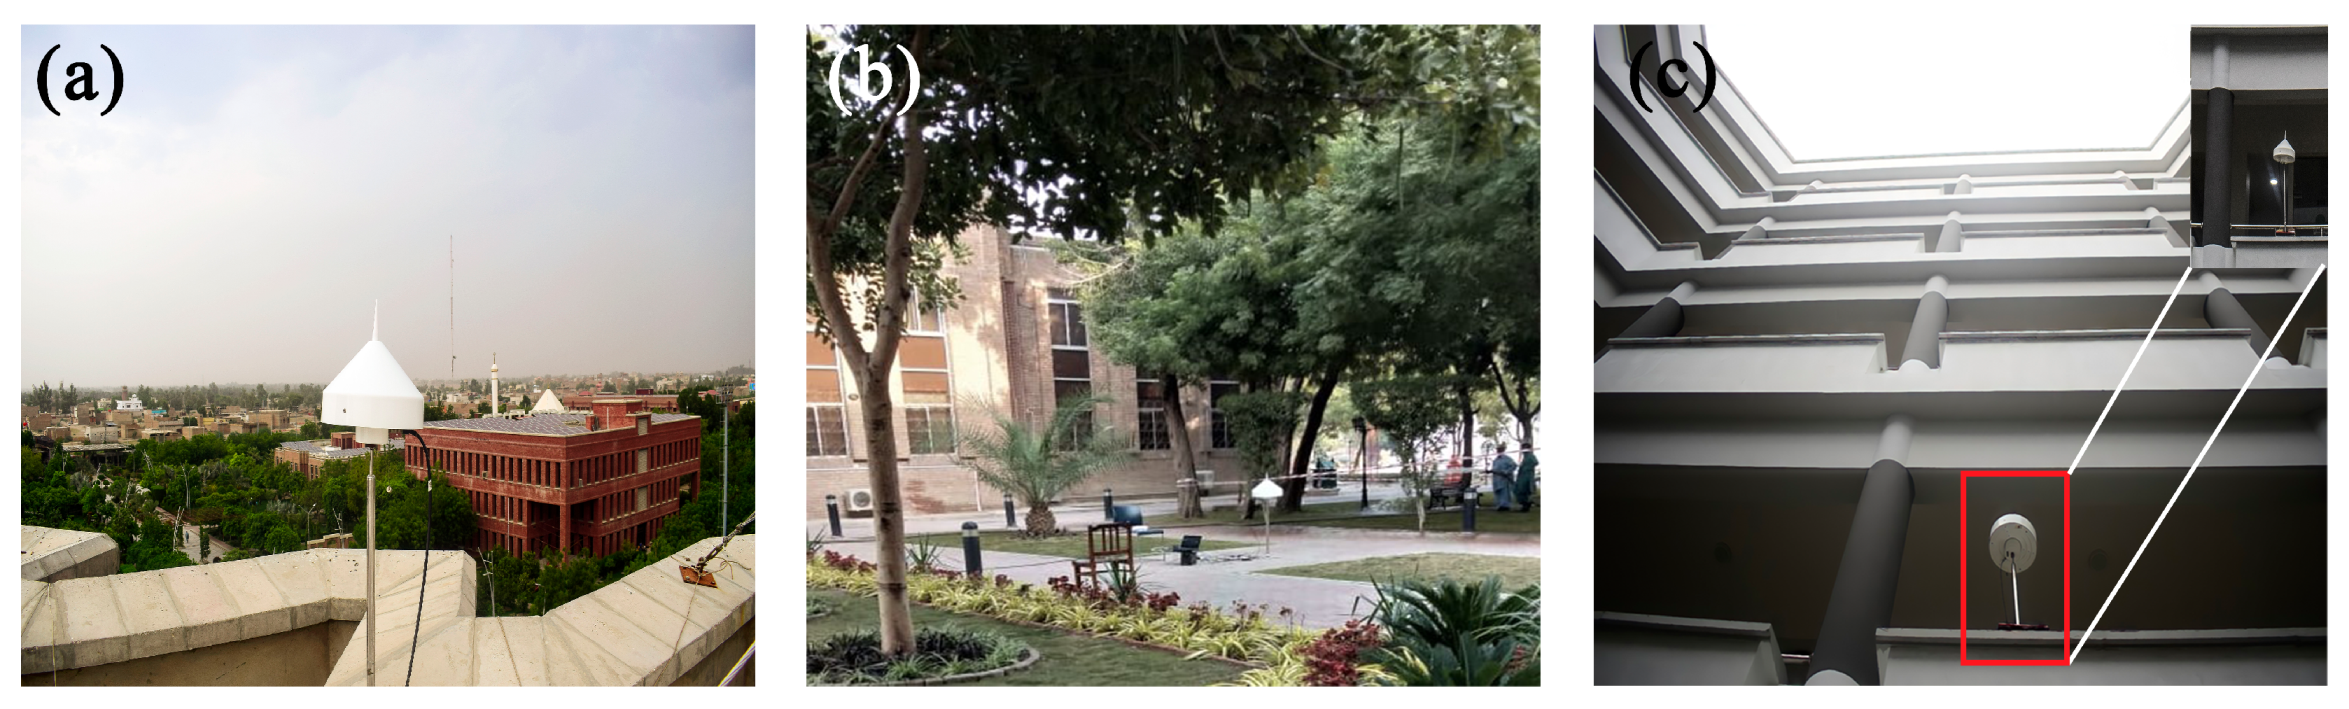
Figure 6.
Live images of moving candidate sites; (a) Complete route of moving experiment, (b) clear site , (c) sub-urban, (d) highly urban environment.
Figure 6.
Live images of moving candidate sites; (a) Complete route of moving experiment, (b) clear site , (c) sub-urban, (d) highly urban environment.
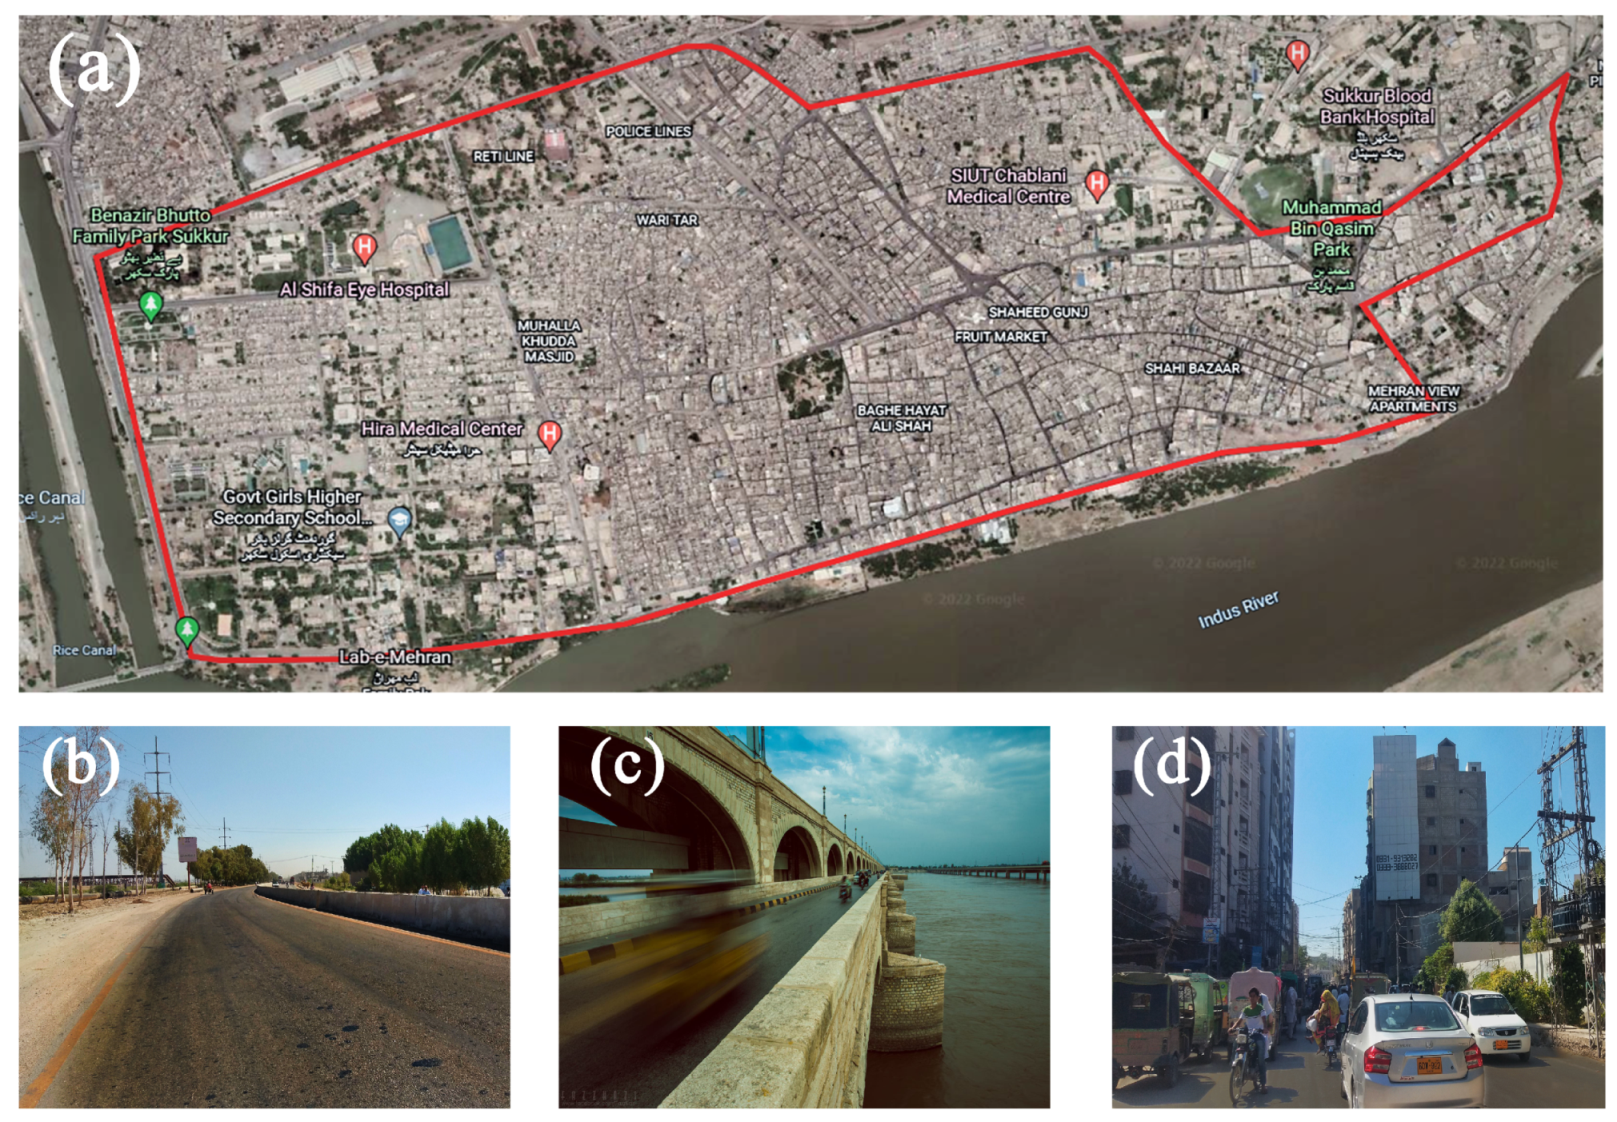
Figure 7.
Positioning performance comparison of multi-constellation GNSS in dynamic (moving) mode
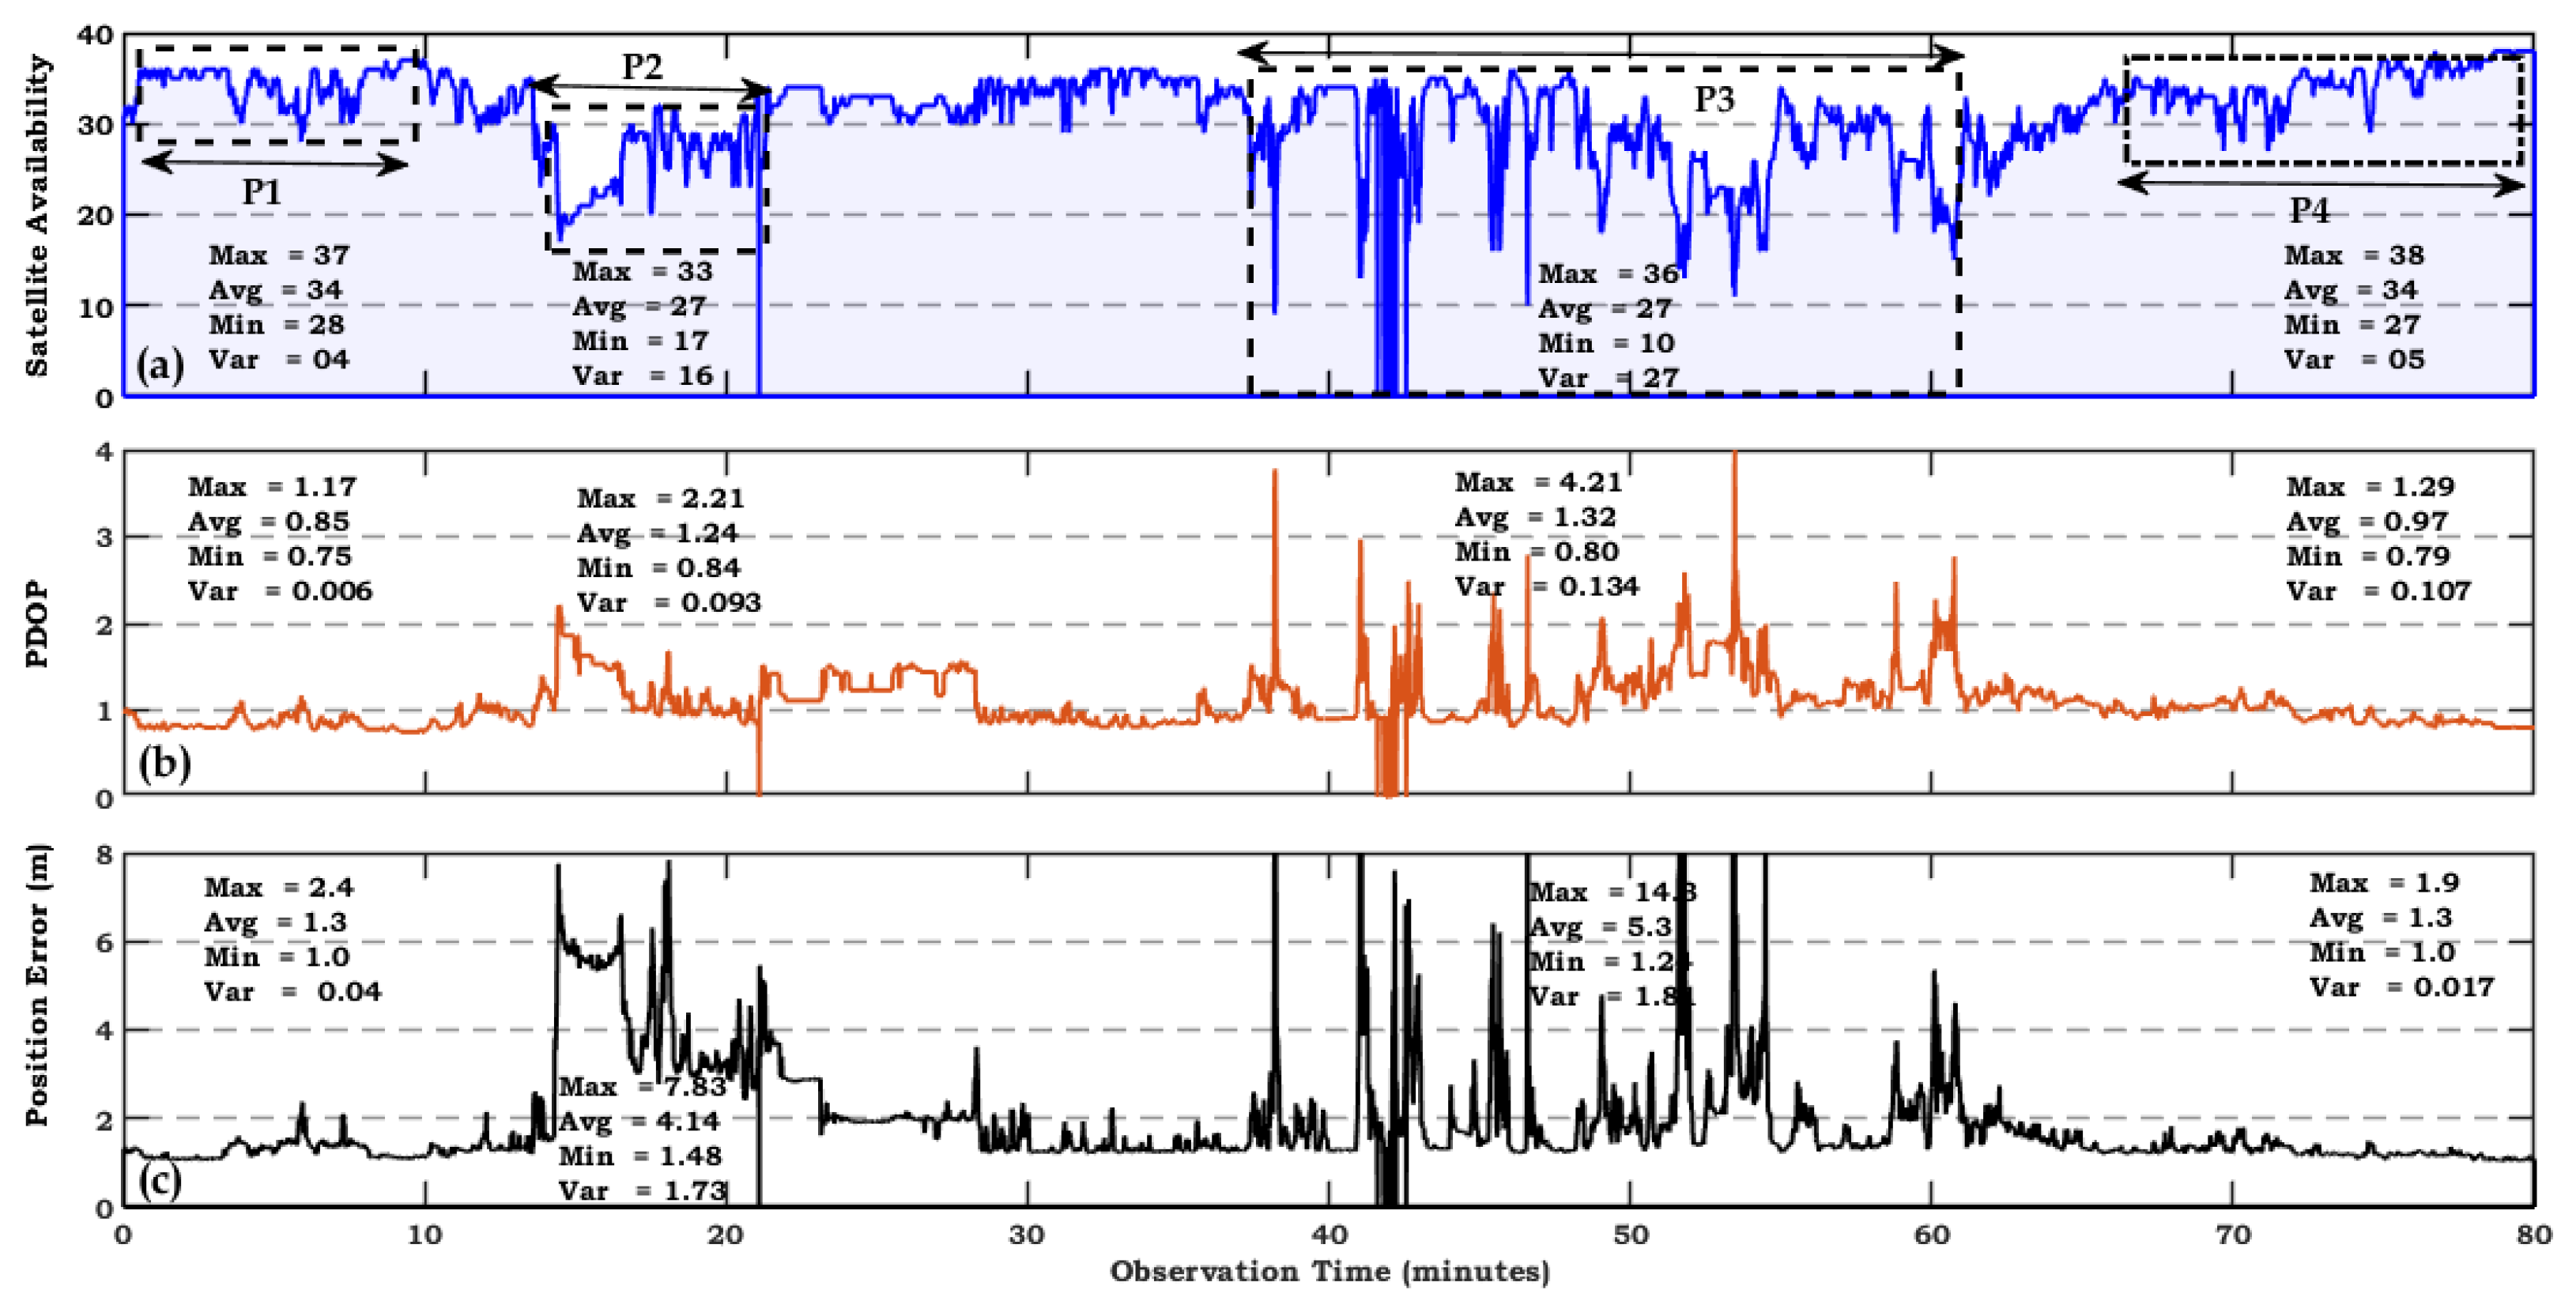
Figure 8.
Positioning performance comparison of multi-constellation GNSS
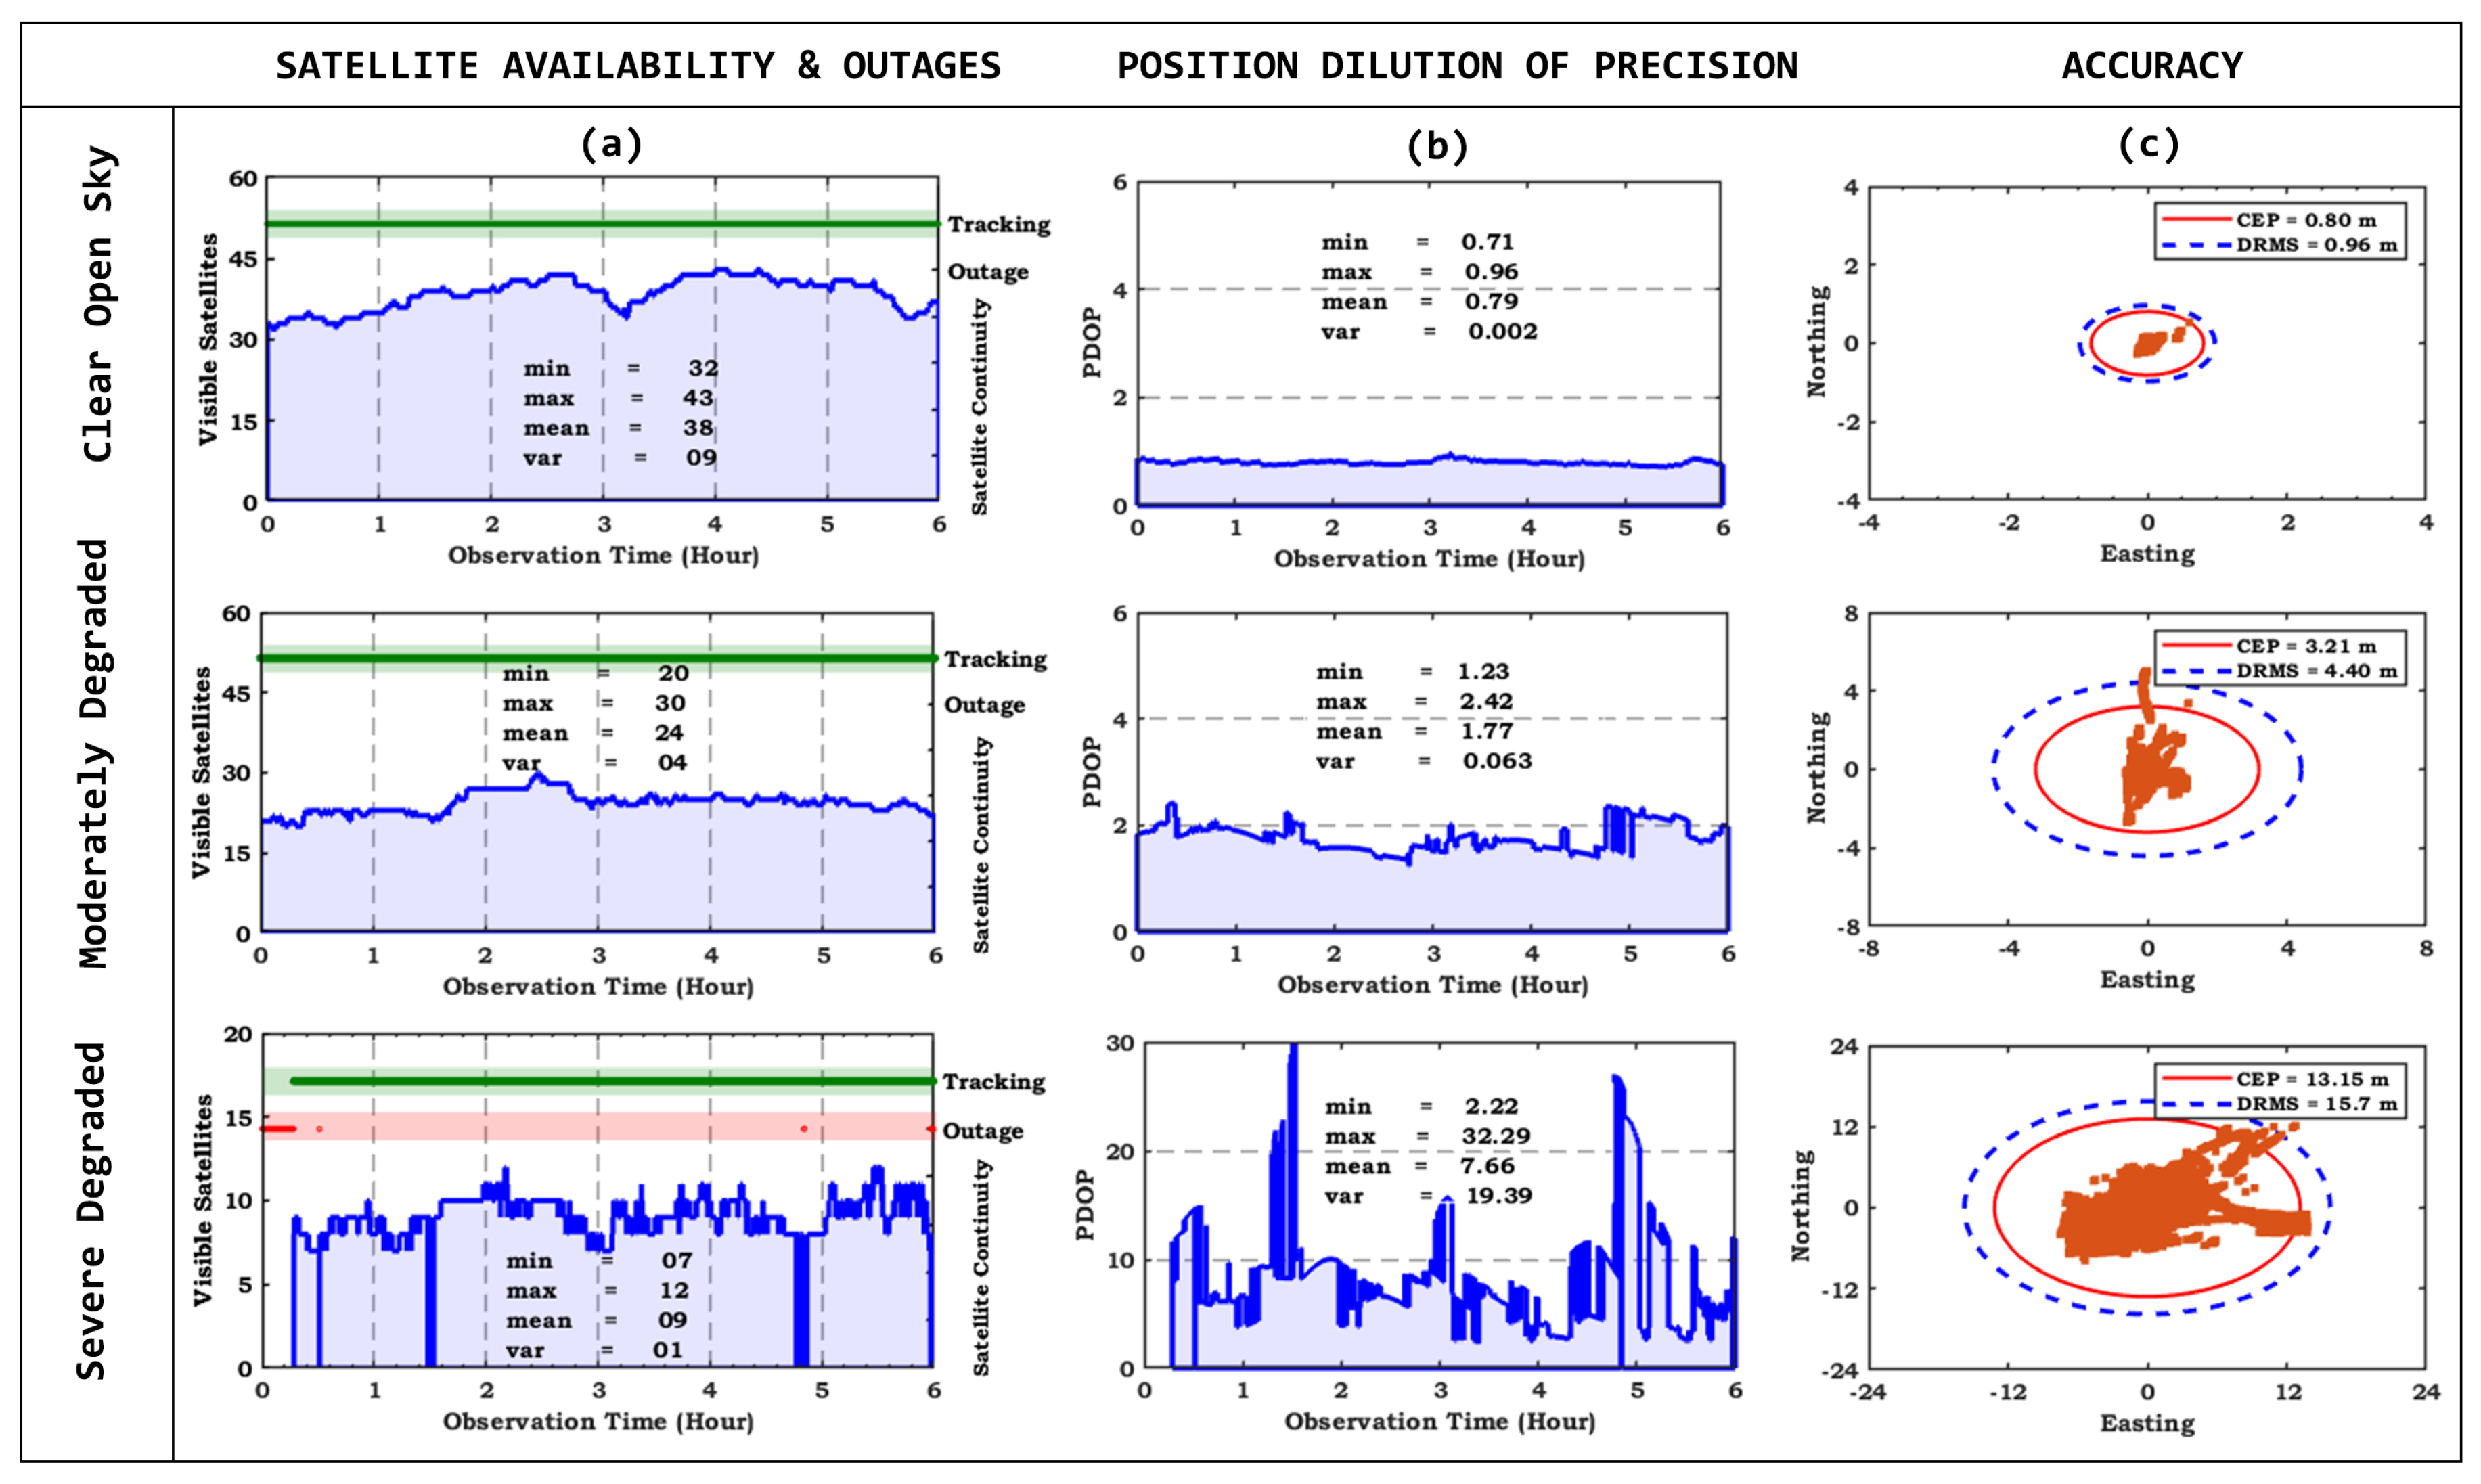
Figure 9.
Satellite Signal Characteristics in Urban Canyon.
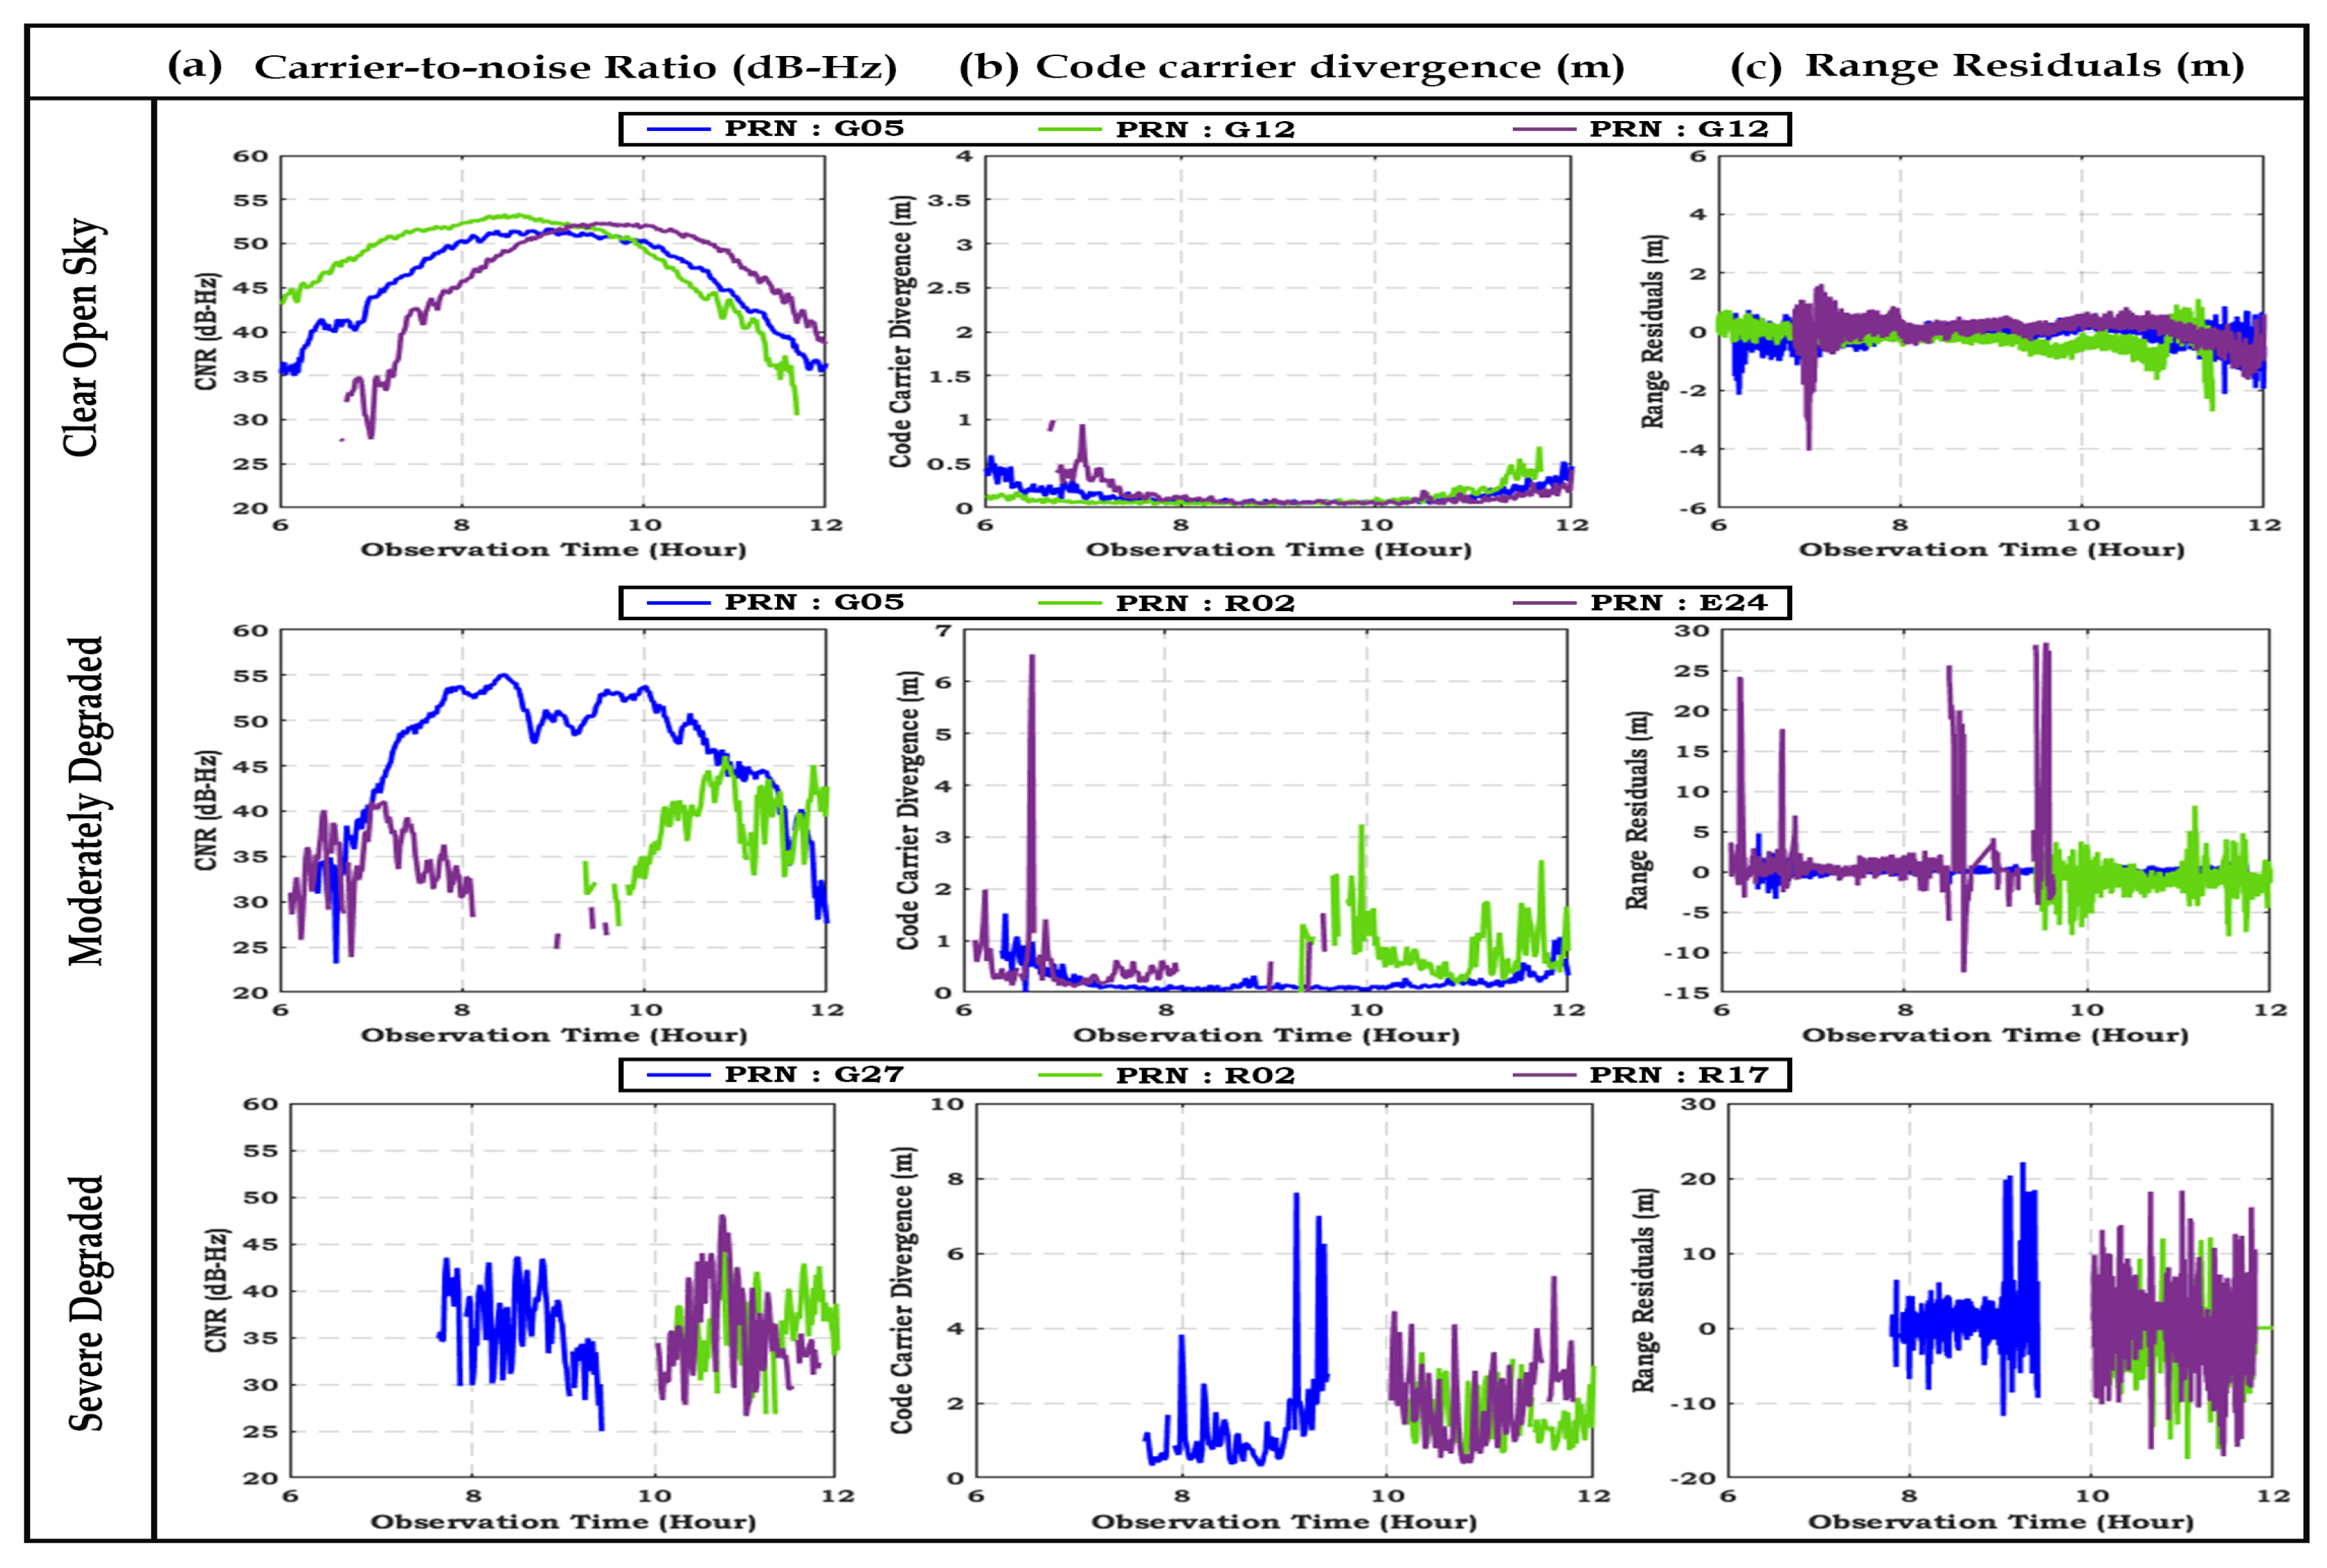
Figure 10.
Histogram of CNR for all the environments.
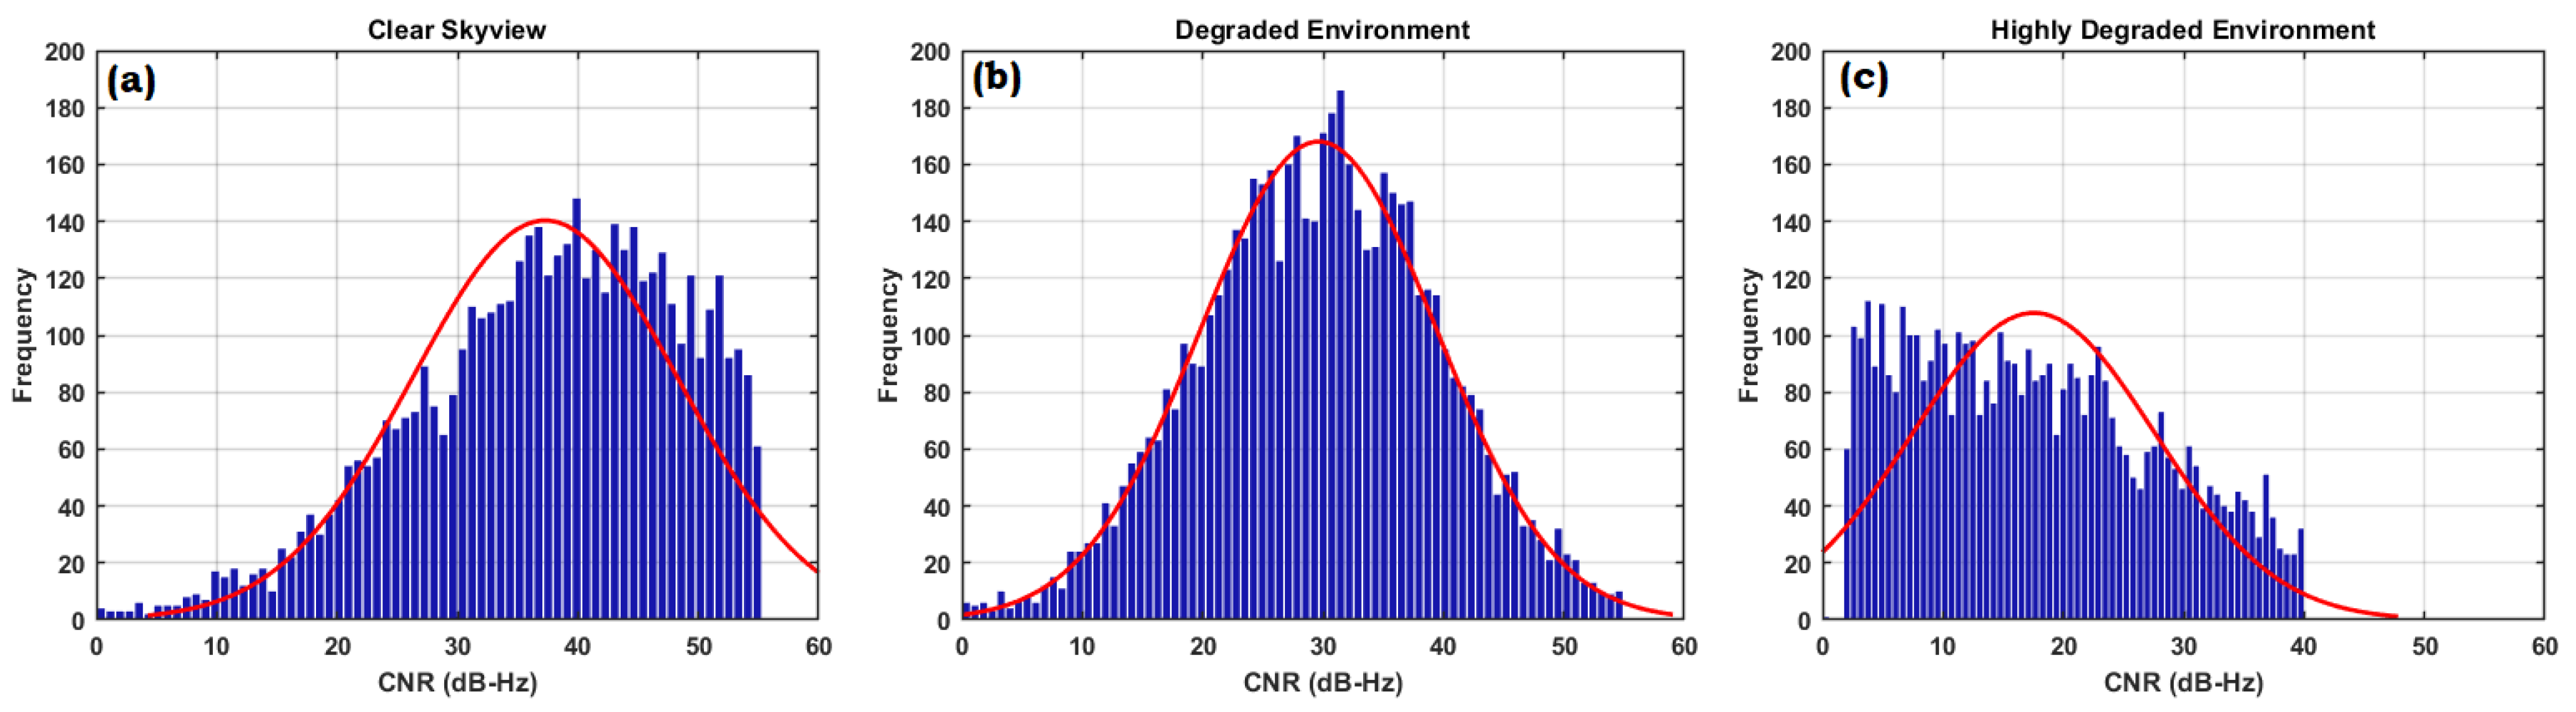
Figure 11.
Histogram of CCD for all the environments.
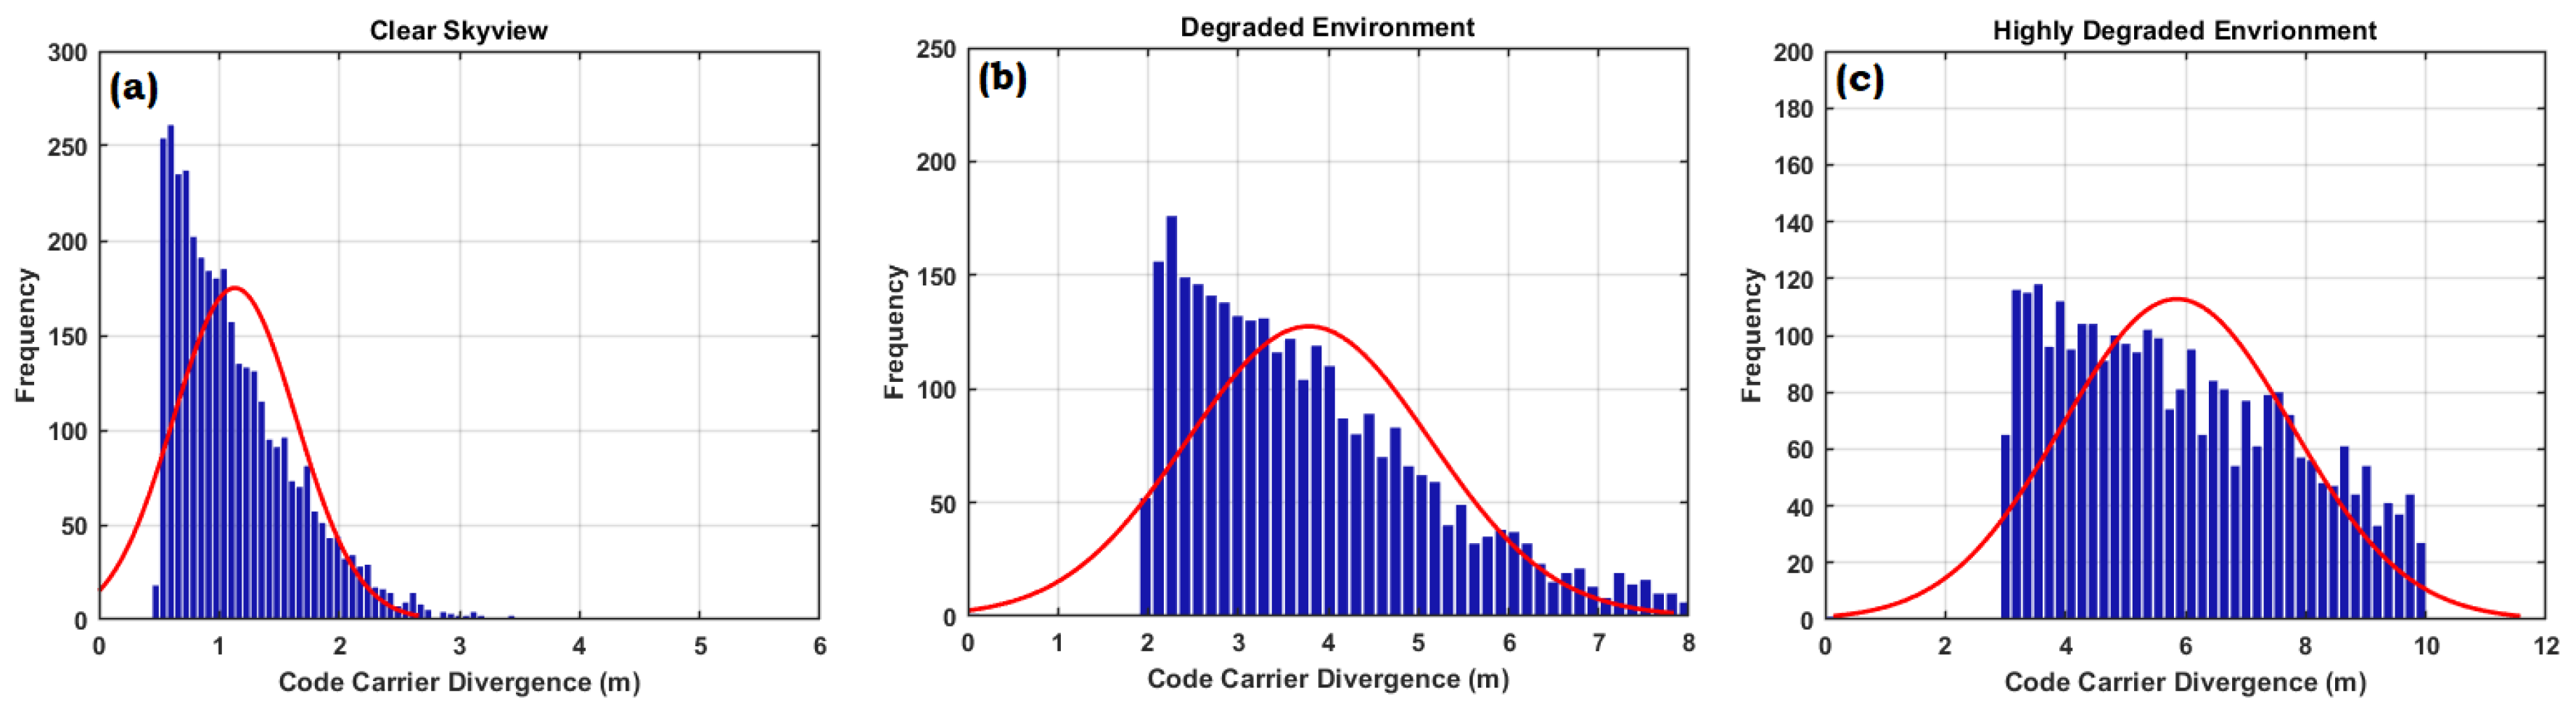
Figure 12.
Histogram of RR for all the environments.
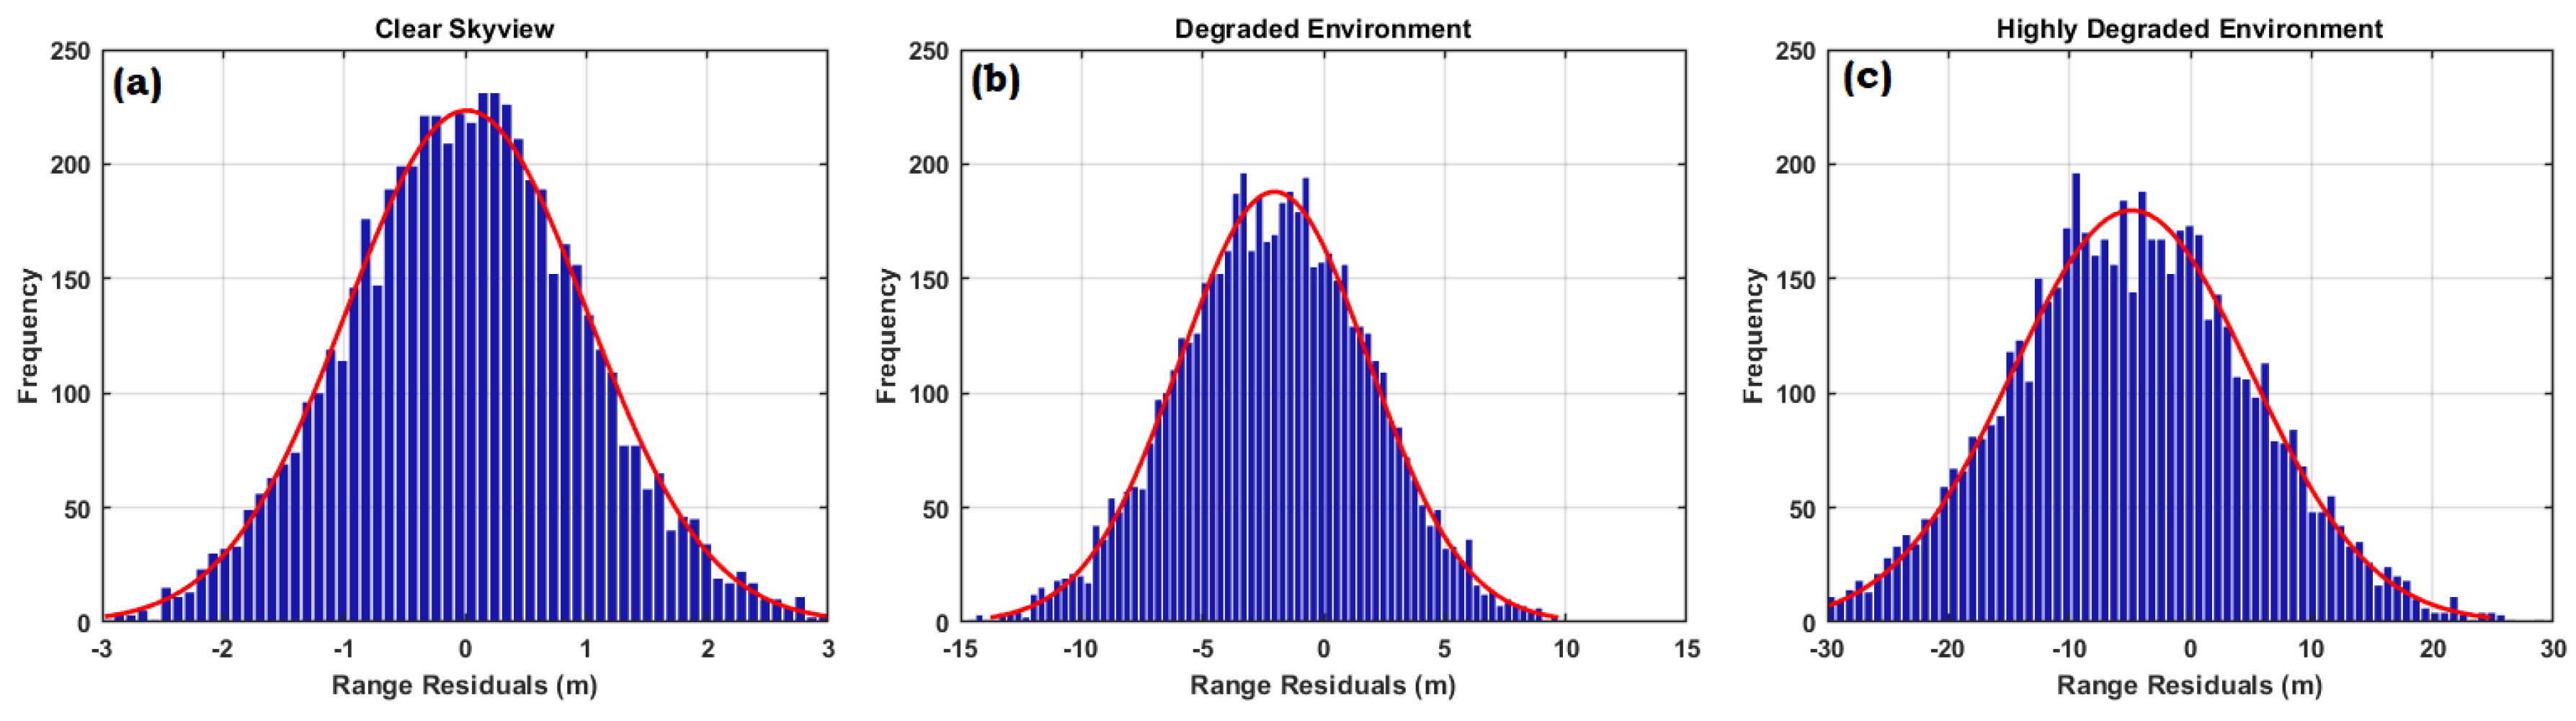
Figure 14.
Fuzzy inference system
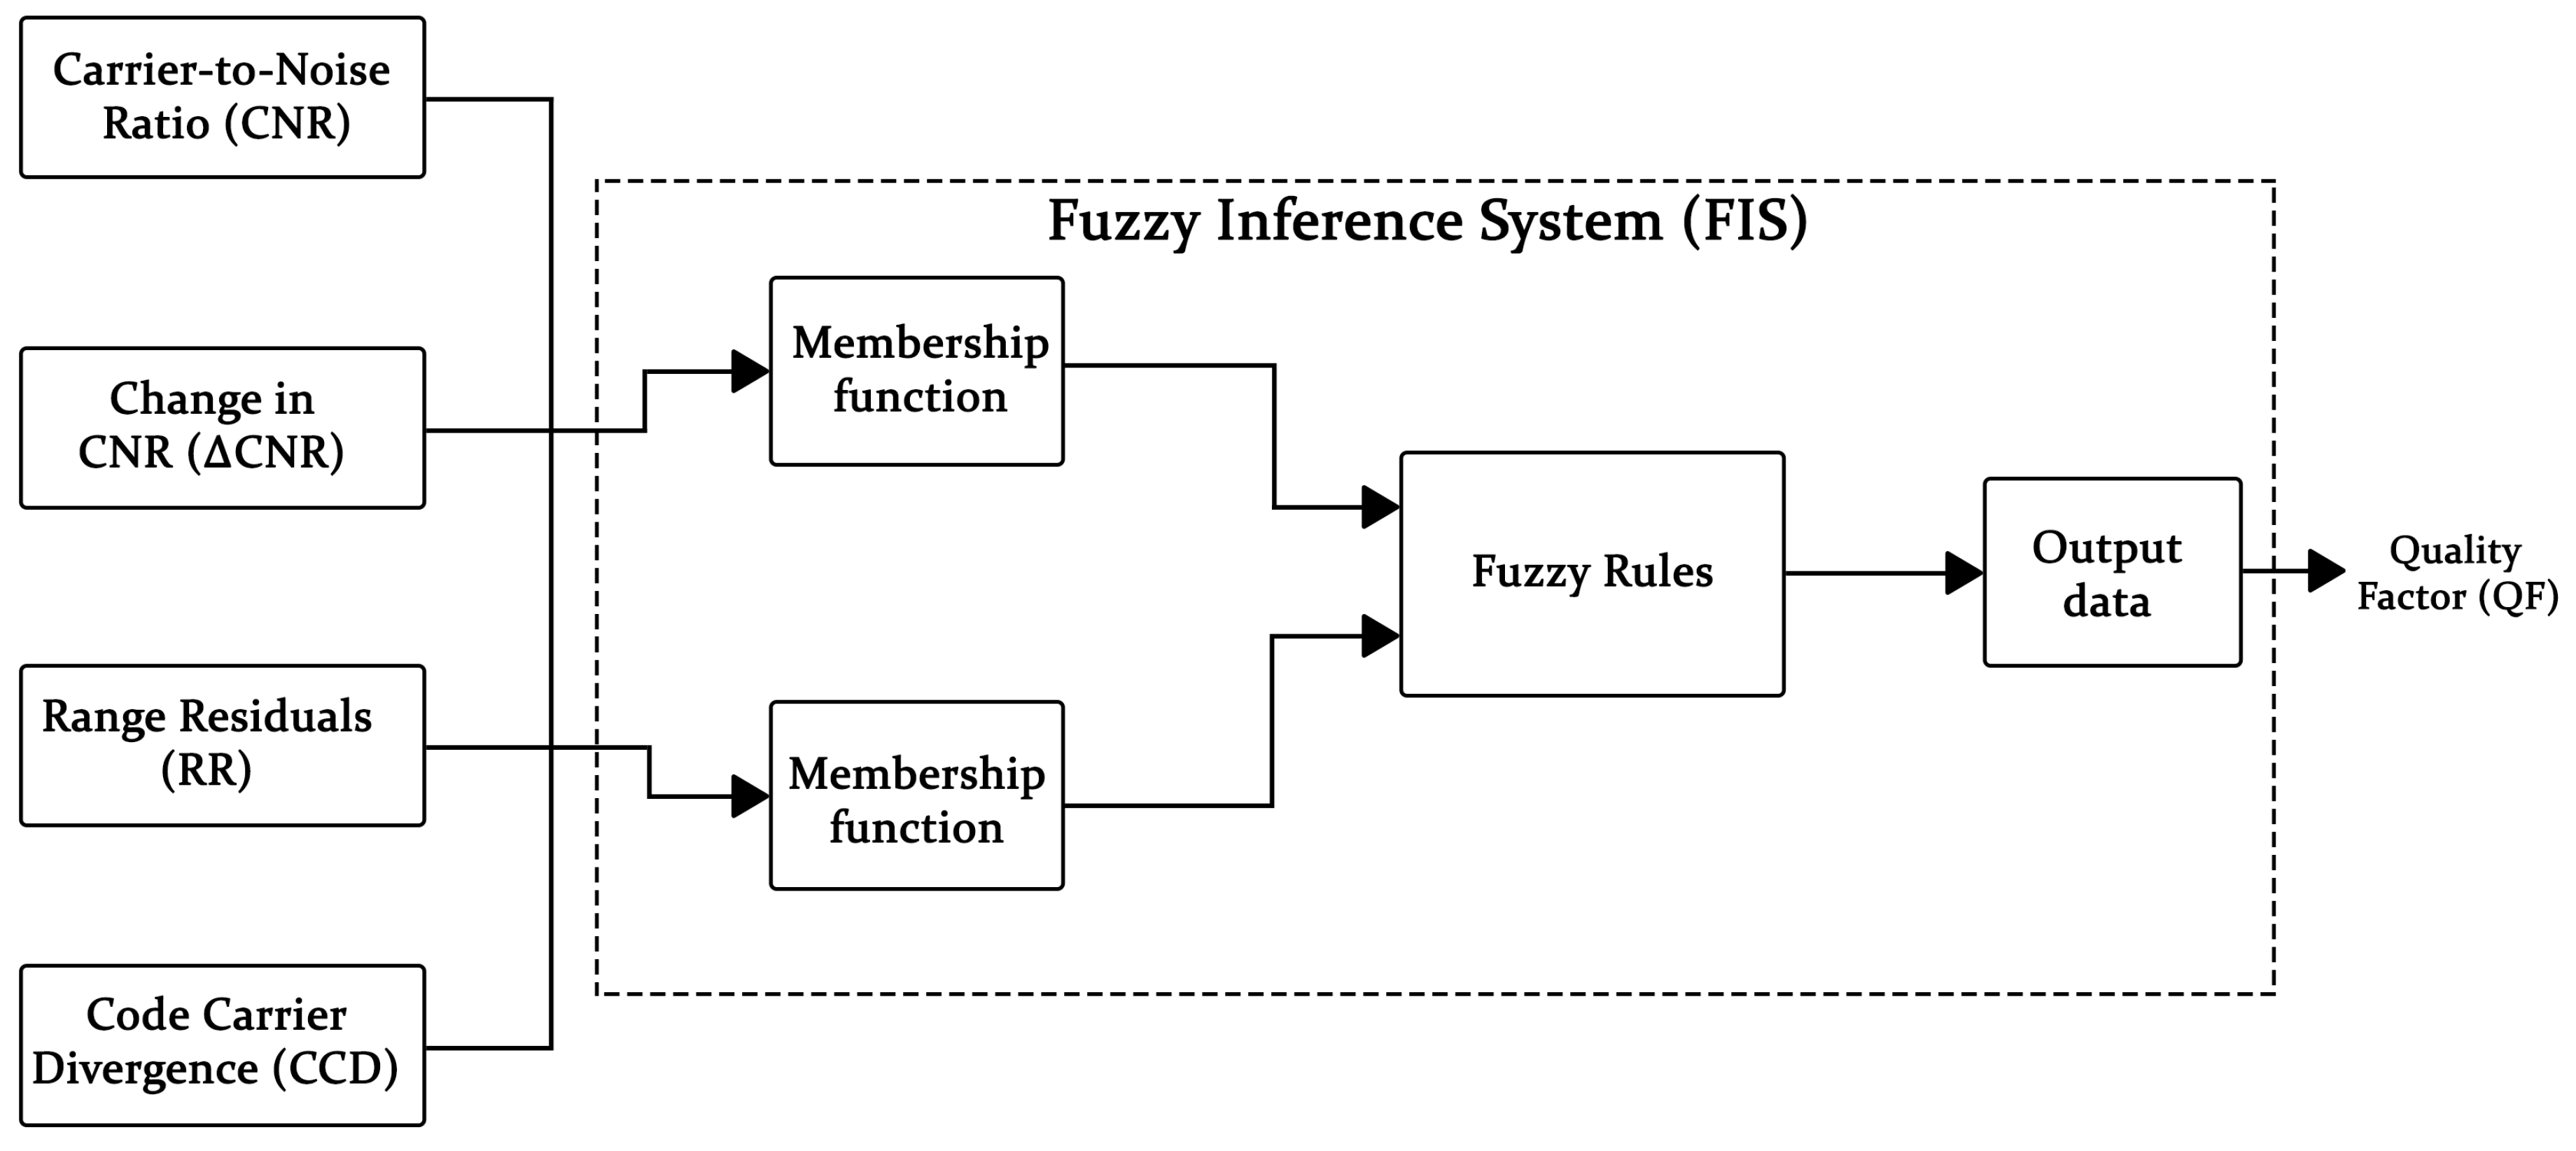
Figure 15.
Fuzzy logic memebrship functions
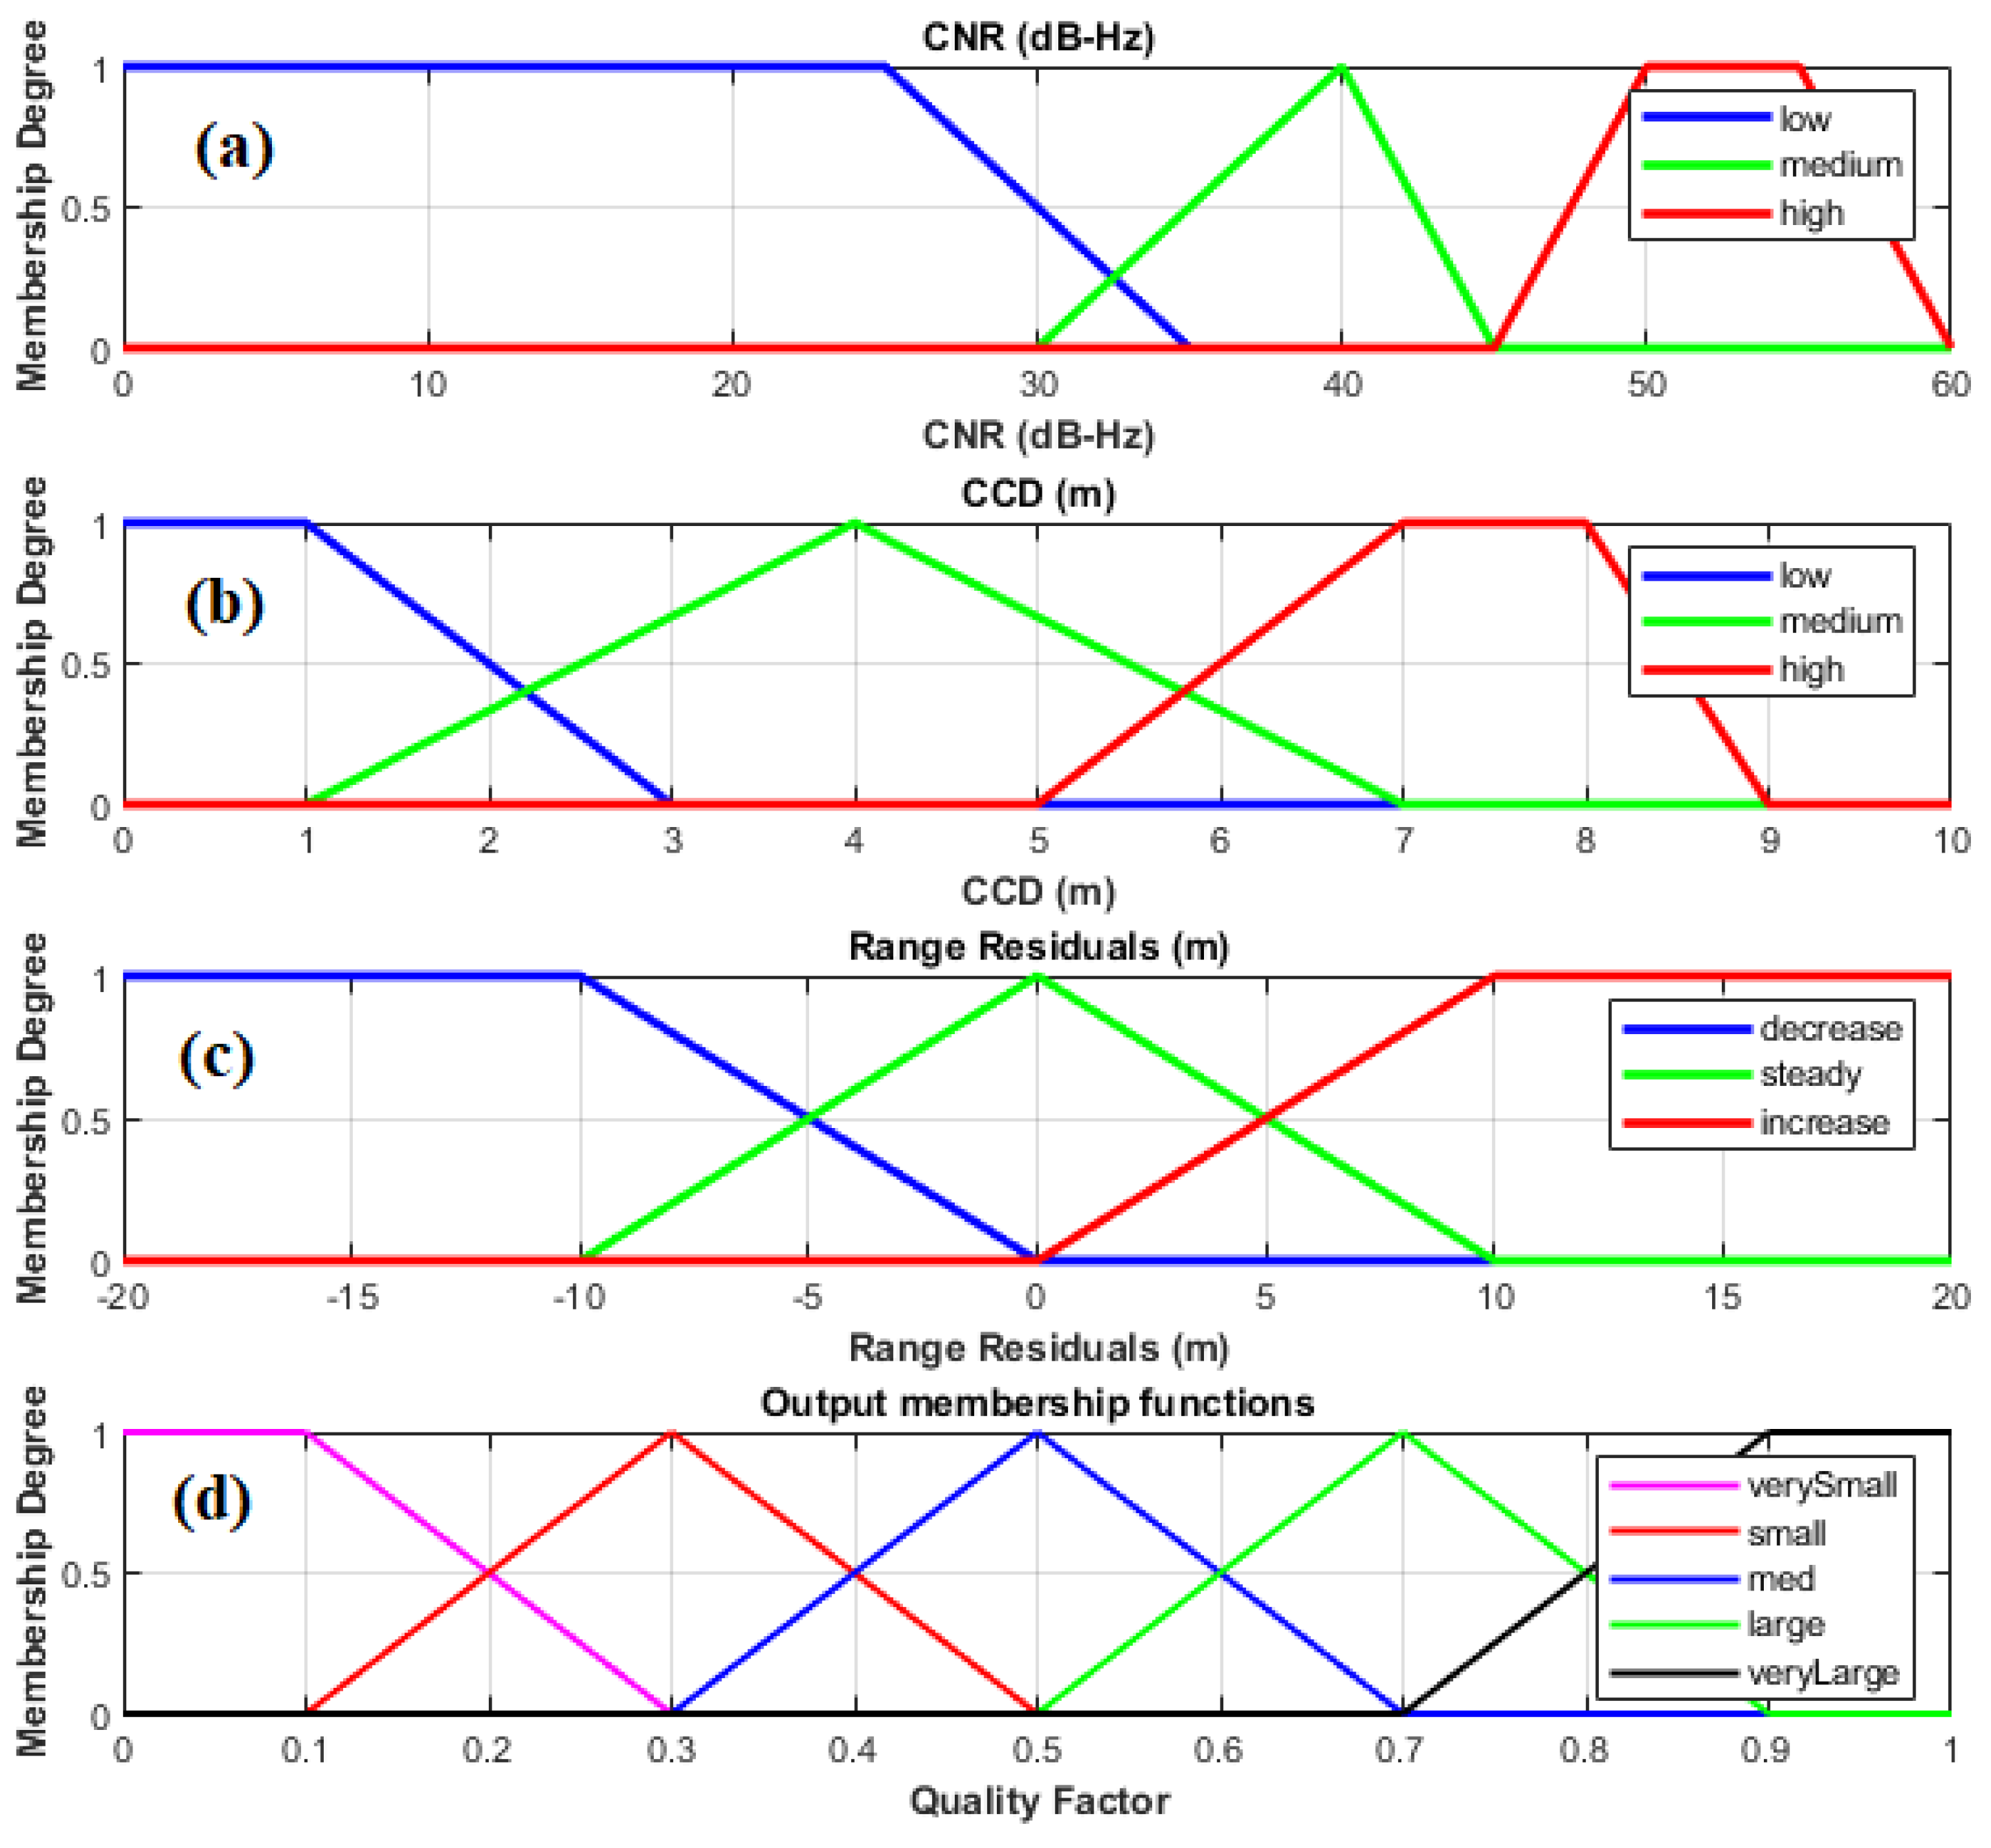
Figure 16.
Performance after mitigation strategy.
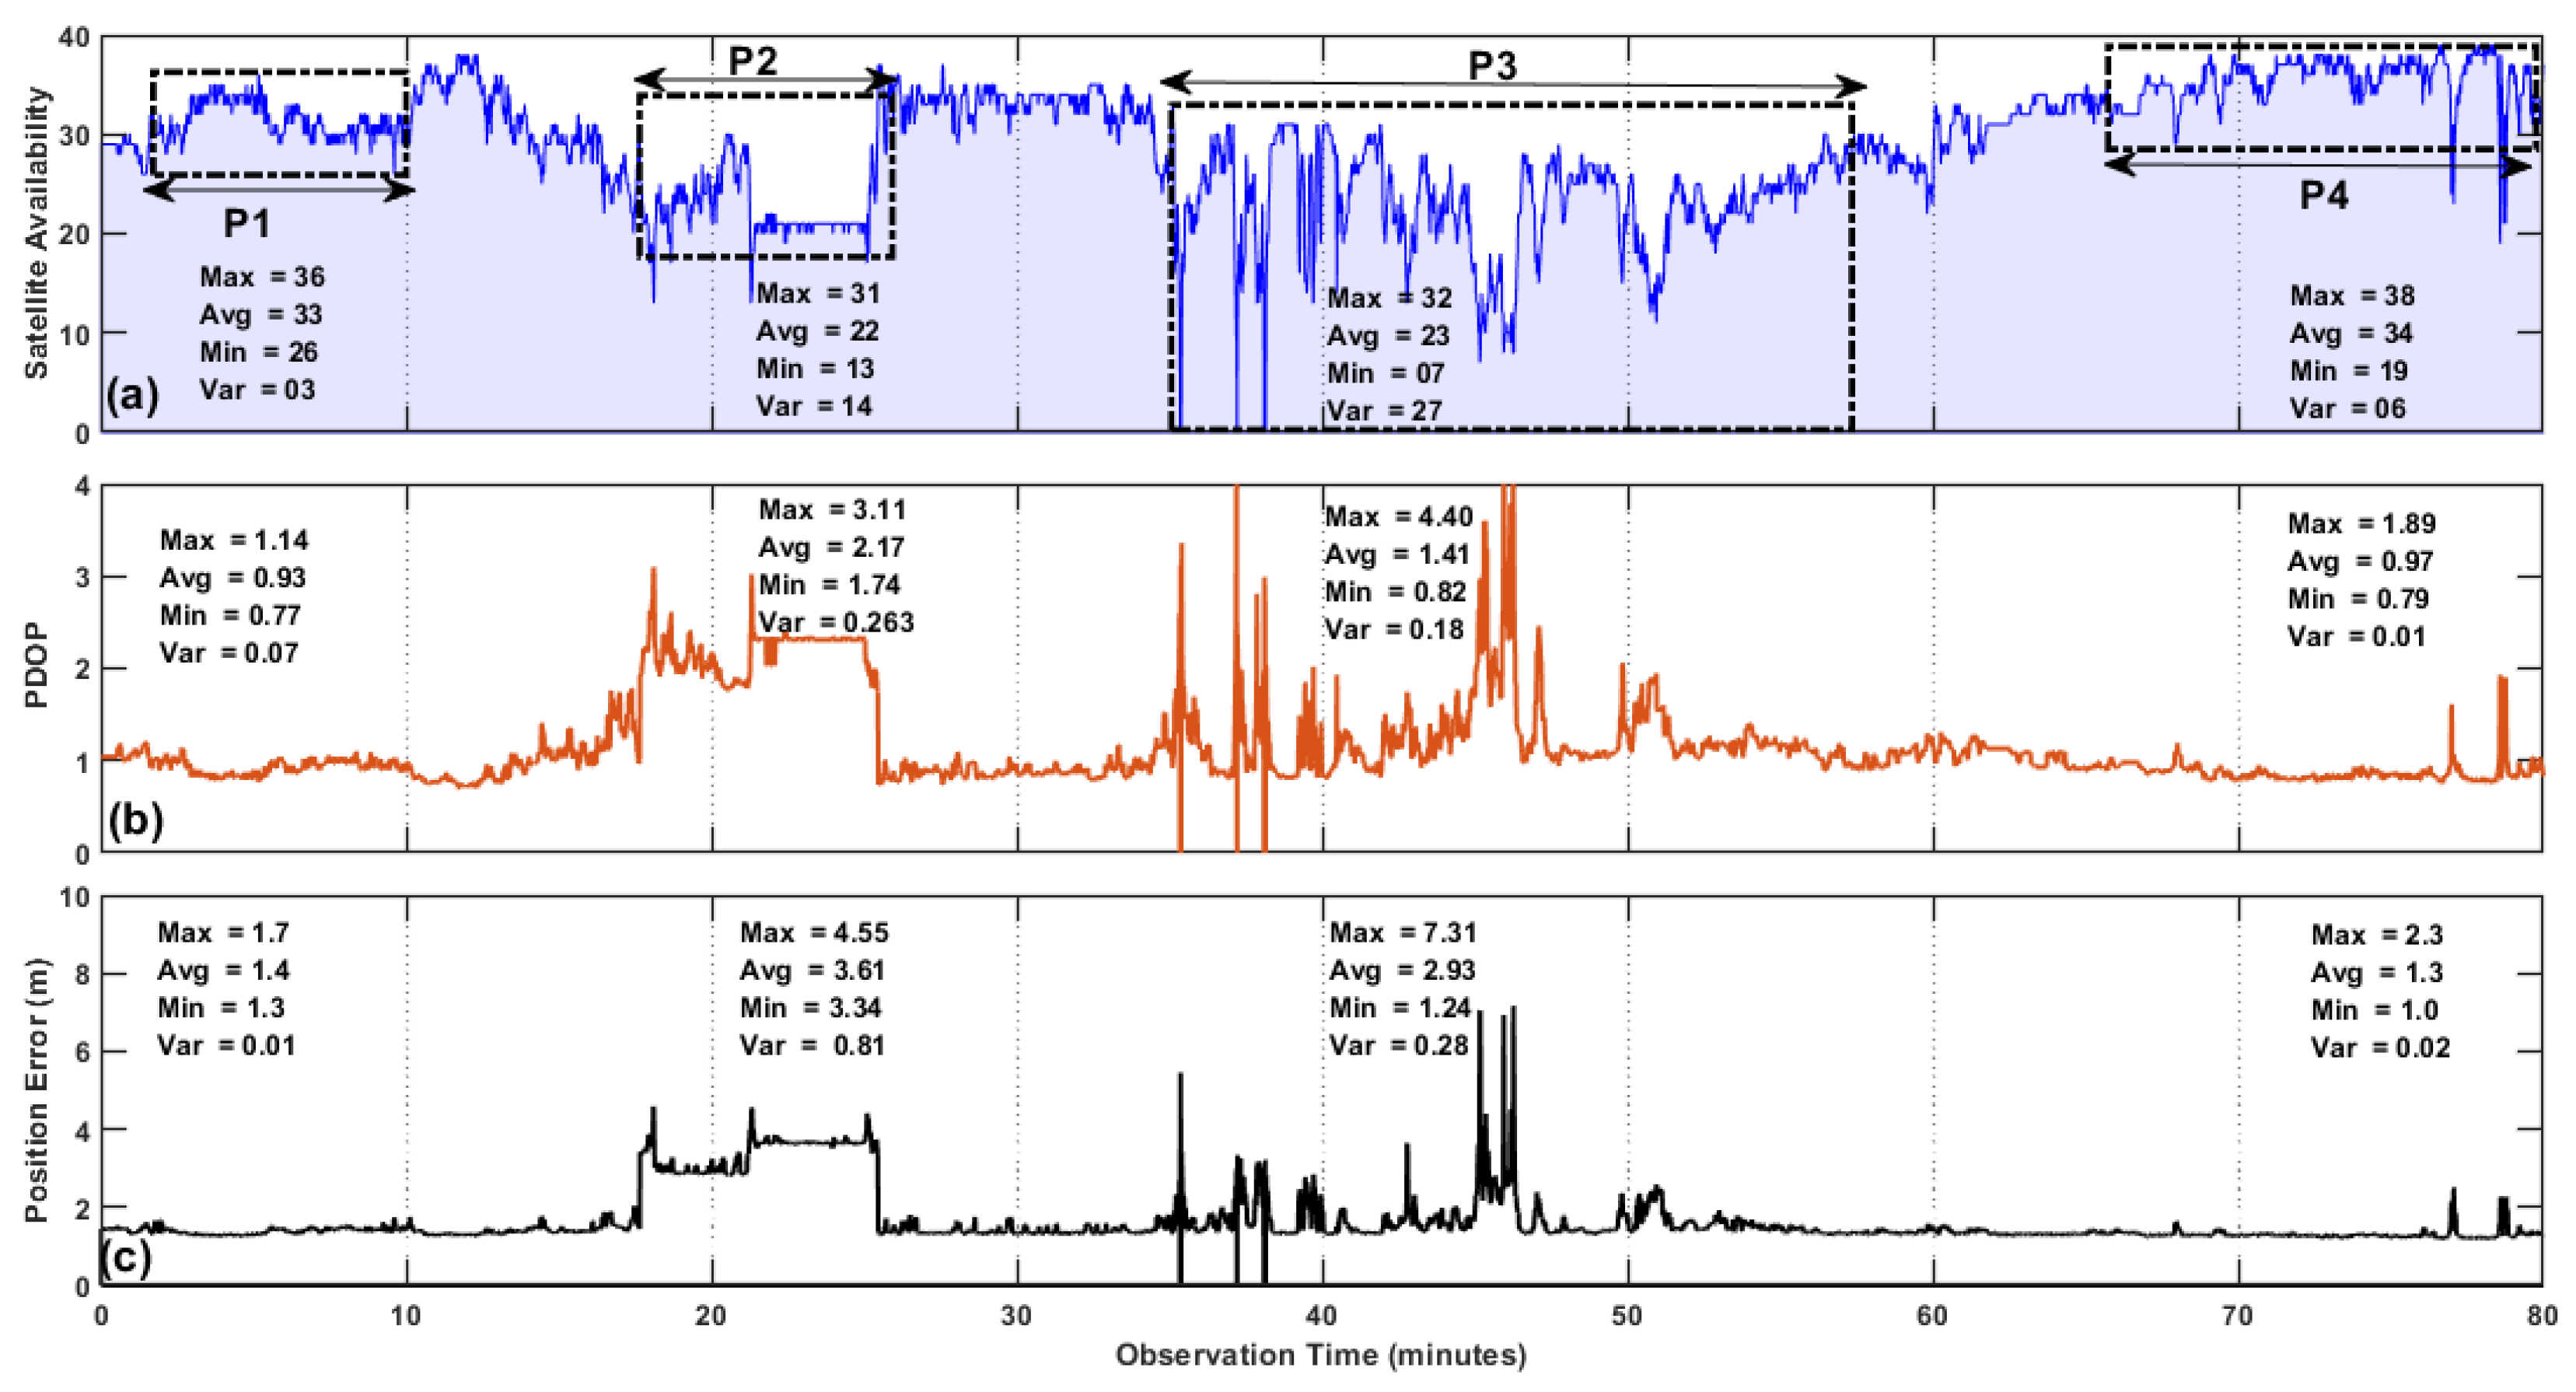
Table 1.
Comparison of different approaches proposed in the Literature and their limitations.
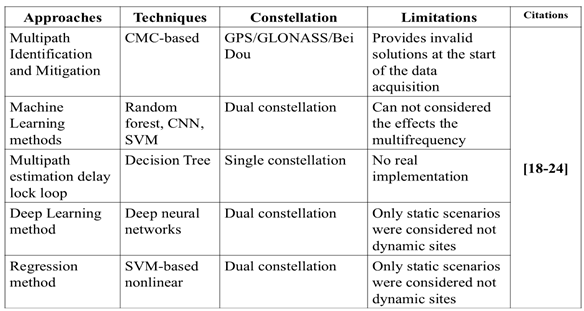
Table 2.
Observation sites, Observation periods and Constellation for experiments performed.
| Experiment | Observation Sites | Constellation | Observation Period |
|---|---|---|---|
| Exp1 | Clear Open Sky | GNSS | 06:00am to 12:00pm |
| (Static) | (G+R+C+E) | January 25, 2021 | |
| Exp2 | Mediocre Multipath | GNSS | 06:00am to 12:00pm |
| (Static) | (G+R+C+E) | January 26, 2021 | |
| Exp3 | Worst Multipath | GNSS | 06:00am to 12:00pm |
| (Static) | (G+R+C+E) | January 27, 2021 | |
| Exp4 | Urban Canyon | GNSS | 06:00am to 12:00pm |
| (Moving) | (G+R+C+E) | January 28, 2021 |
Table 4.
GNSS receiver settings based on different signal conditions.
| Receiver Settings | Environmental Contexts | ||
|---|---|---|---|
| Standard | Degraded | Highly Degraded | |
| DLL Bandwidth (Hz) | 0.25 | 0.25 | 01 |
| CNR Mask (dB-Hz) | 10 | 35 | 10 |
| Elevation Mask | 10° | 20° | 10° |
| PLL Bandwidth (Hz) | 15 | 15 | 15 |
| Data Rate (Hz) | 01 | 01 | 01 |
Disclaimer/Publisher’s Note: The statements, opinions and data contained in all publications are solely those of the individual author(s) and contributor(s) and not of MDPI and/or the editor(s). MDPI and/or the editor(s) disclaim responsibility for any injury to people or property resulting from any ideas, methods, instructions or products referred to in the content. |
© 2024 by the authors. Licensee MDPI, Basel, Switzerland. This article is an open access article distributed under the terms and conditions of the Creative Commons Attribution (CC BY) license (http://creativecommons.org/licenses/by/4.0/).
Copyright: This open access article is published under a Creative Commons CC BY 4.0 license, which permit the free download, distribution, and reuse, provided that the author and preprint are cited in any reuse.


