3.1. Pore Structure Characteristics of Quartz Sand
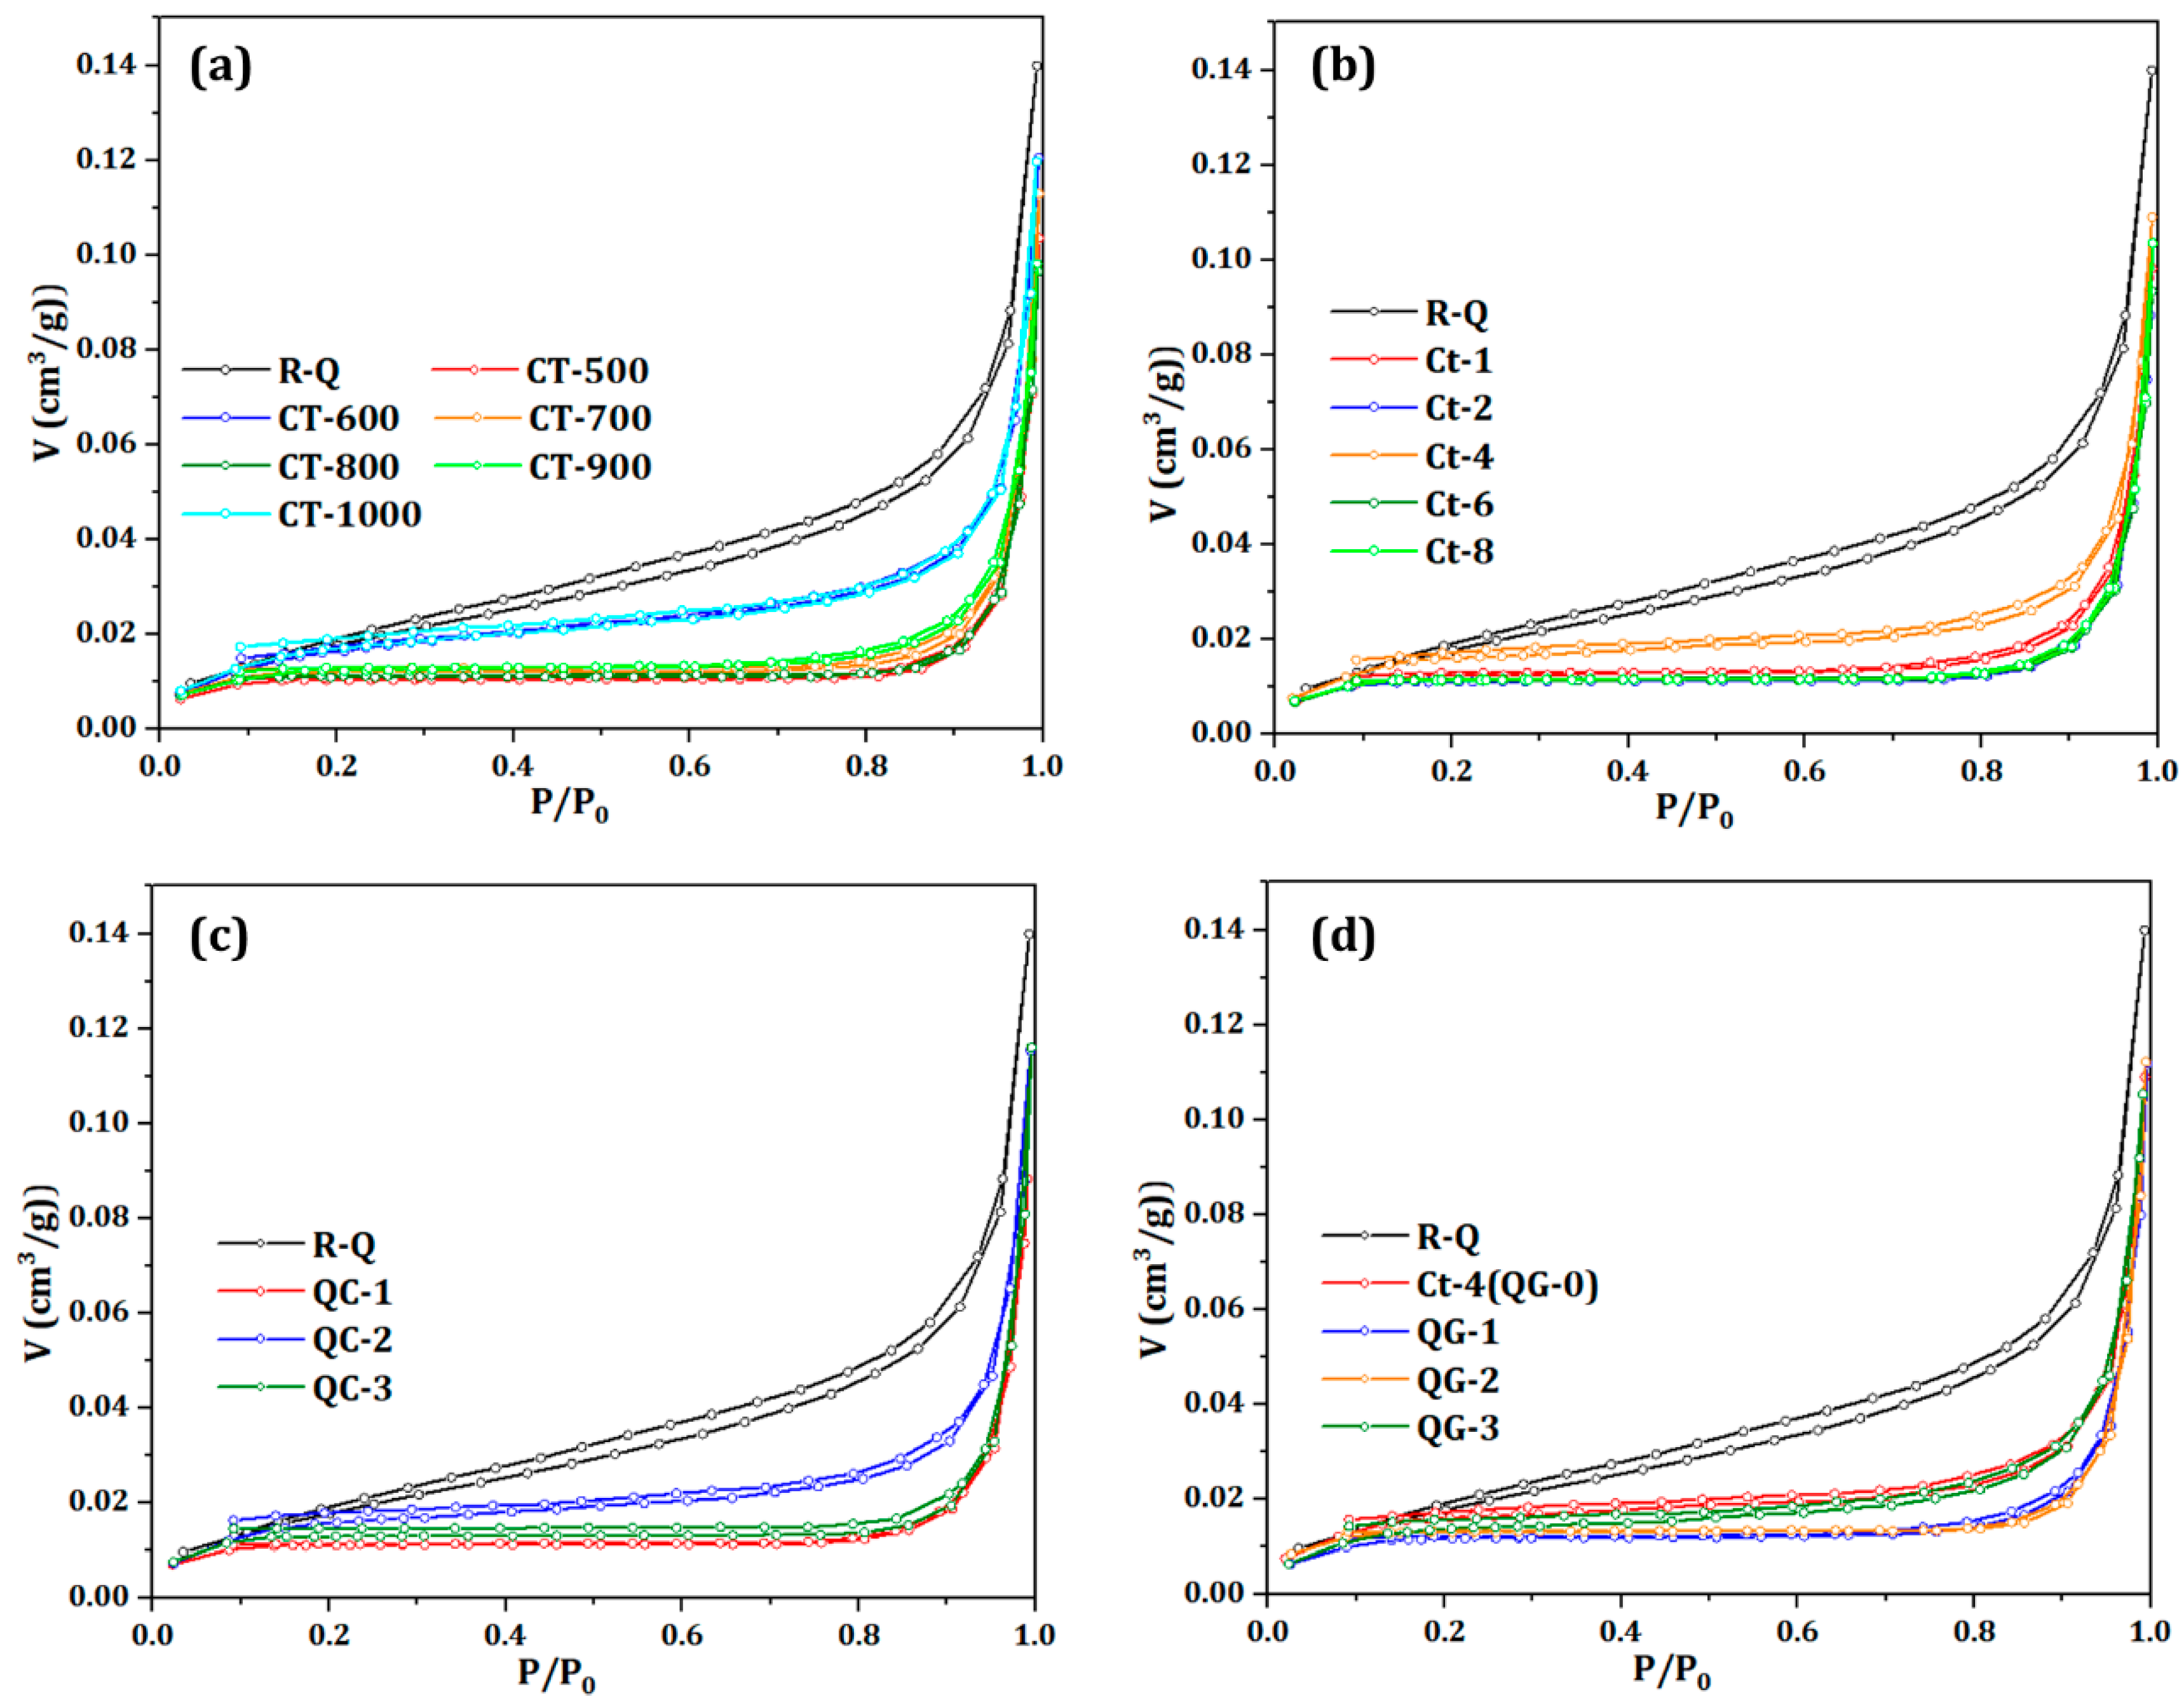
Figure 2 shows the adsorption equilibrium isotherm curves of quartz sand under different pretreatment conditions. As can be seen from
Figure 2, the N
2 adsorption-desorption isotherm curves of all quartz sand samples are typical type IV isotherms, and the adsorption-desorption process can be divided into three stages. In the low pressure segment (0<
p/
p0 ≤ 0.1), the adsorption capacity increased rapidly, and the adsorption capacity was greater than 0.01cm
3/g, mainly due to micropore filling and monolayer adsorption. In the middle pressure section (0.1<
p/
p0≤ 0.9), the isotherm of raw sand showed a significant upward trend, while the isotherm of cracked sand was a horizontal line. With the increase of the relative pressure, the adsorption capacity of the samples in the high pressure section (
p/
p0 > 0.9) also increased sharply, and capillary condensation occurred in both the middle and large pores. The desorption curves of all samples showed no obvious adsorption platform, and all showed the characteristics of H3 or H4 hysteresis loops, indicating that the pore structure was very irregular [
25]. Among them, the raw material sand is the mesoporous slit hole and the macroporous slit hole with parallel plate structure, which is the typical characteristic of H3 hysteresis ring. Compared with the original sand, the adsorption capacity of cracked sand decreased significantly, and an obvious hysteresis loop began to appear near the relative pressure 0.8, belonging to the H4 type hysteresis loop. The hysteresis loop range is very narrow, the adsorption curve and desorption curve are very close, basically parallel. This indicates that the fractures of quartz sand have poor connectivity and more narrow holes with conical structure are formed. The main reason for the formation of the semi-closed wedge-shaped pores is that the shrinkage and bridging of parallel plate pores are intensified by high temperature expansion.
In
Figure 2a and
Figure 2b, the adsorption capacity of CT-600, CT-1000 and Ct-4 samples is significantly higher than that of other cracked sands, indicating that phase-change cracking can effectively counteract the pore closure caused by thermal expansion. In general, 573℃ and 870℃ respectively correspond to the transformation of α-quartz to β-quartz and the transformation of β-quartz to β-tridymite, and the volume expansion rate can reach 0.5%-1% [
26]. This lattice expansion can effectively destroy the Si-O tetrahedron in the quartz crystal, forming phase transition fractures. In addition, it can be seen from
Figure 2c and
Figure 2d that repeated quenching and grinding make quartz sand undergo a process of thermal expansion bridging-cracking-thermal expansion bridging successively, showing a trend of first decreasing and then increasing.
3.2. Influence of Calcination Temperature on Pore Structure of Quartz Sand
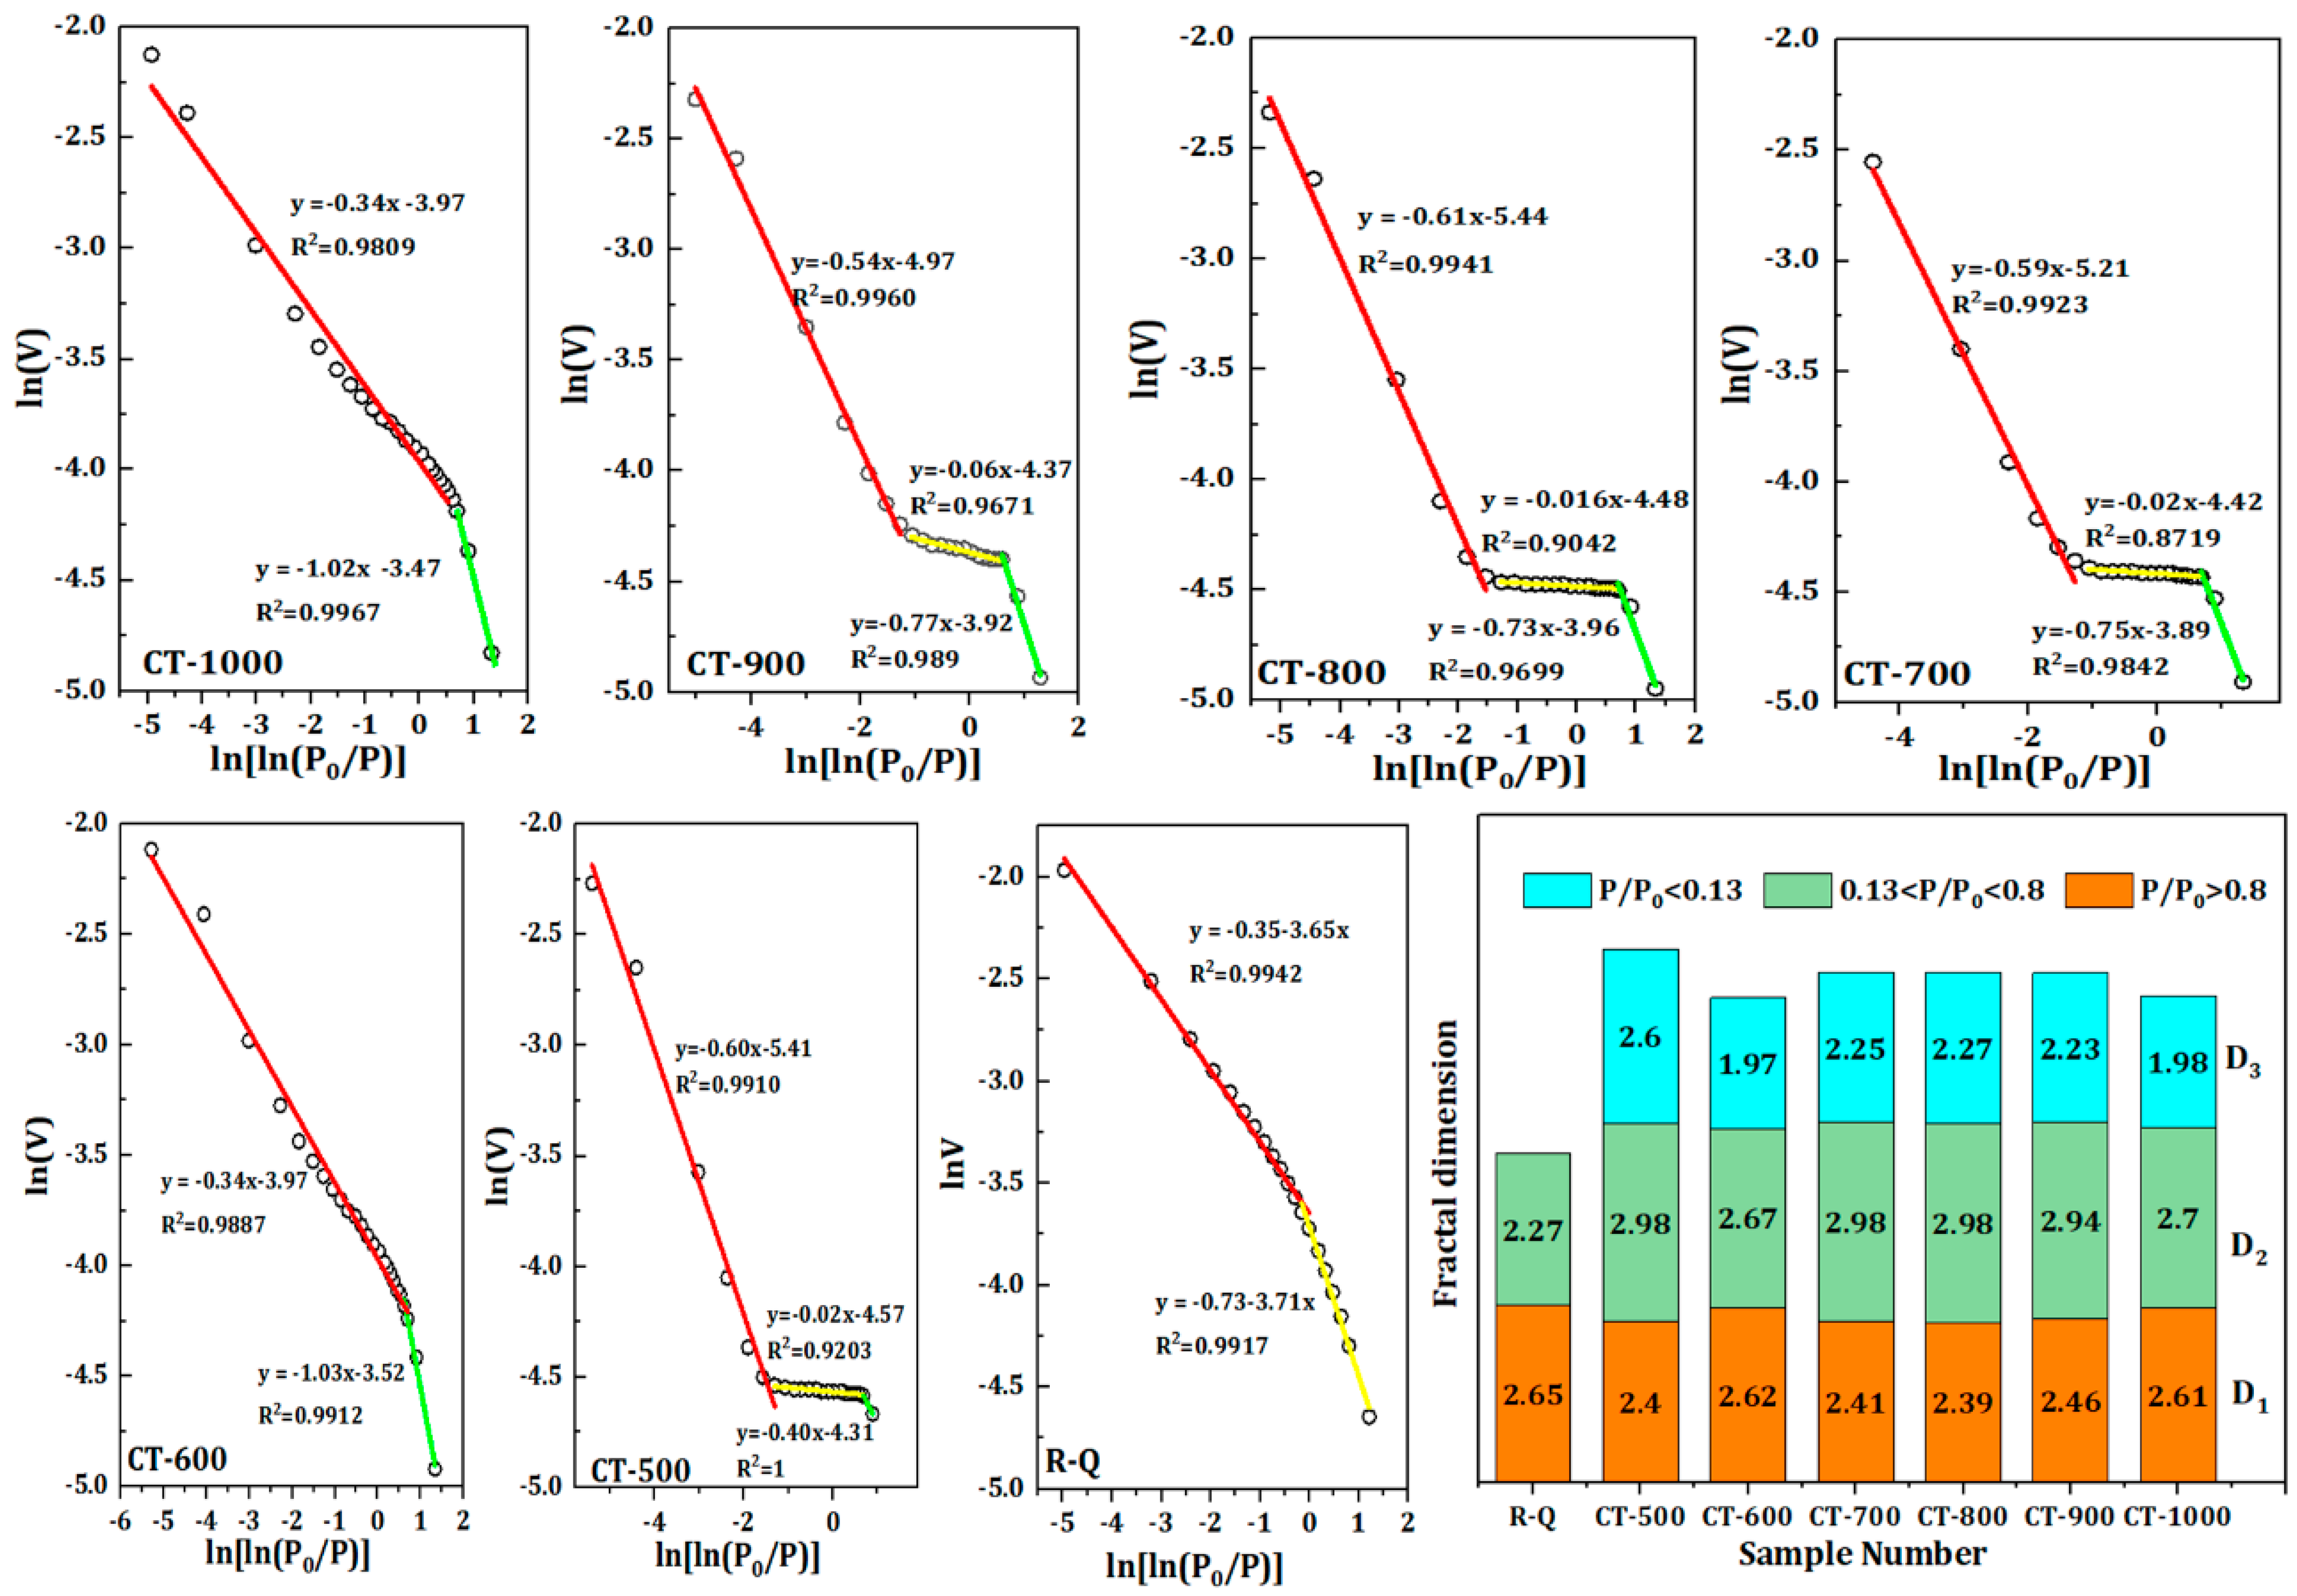
In order to establish the quantitative relationship of fracture structure, the adsorption curve of quartz sand is first fitted linearly, and the fractal dimension of three different stages is obtained.
Figure 3 shows the piecewise fitting diagram of adsorption curves of quartz sand samples at different calcination temperatures. As can be seen from
Figure 3, there is an discernible linear correlation between LnV and Ln (Ln (
p0/
p)), with the correlation coefficient R
2 of the fitted curve exceeding 0.97. This suggests that the pore structure exhibits notable fractal characteristics. The fitting lines of the cracked sand indicate a considerable increase in new micropore porosity, exhibiting linear properties on the low-pressure side that differ from those of the raw sand. The mean values for D
1 and D
3 are 2.48 and 2.22, respectively. The low-pressure and high-pressure fracture structures are typically simple, with relatively smooth fracture surfaces, as evidenced by the fractal dimensions, which are approximately 2. Conversely, the fracture surface is rough and the fracture structure is more complex, as illustrated by the average value of 2.88 for the fractal dimension D
2 in the medium-pressure portion. This is concurrent with a notable elevation in the ratio of Me50. Additionally, the pattern D
1 < D
2 > D
3 is evident in the fractal dimensions. This may be attributed to semi-closed fractures exhibiting intricate morphologies and poor connectivity, which enhances the heterogeneity of the numerous mesoporous fracture structures and elevates the fractal dimensions.
The influence of calcination temperature on the specific surface area and fracture structure of quartz sand is shown in
Figure 4.
Figure 4 shows that while the change trend of Mi and Me50 volume is inversely proportional, the change trend of Ma, Me10, and SBET exhibits a similar “S”-shaped pattern with an increase in calcination temperature. Among them, the fractal dimensions D
1 and D
2 are consistent with the variation trend of S
BET, Ma, and Me10, while D
2 and D
3 are consistent with the variation trend of Mi and Me50. In comparison to the pore structure of the original quartz sand, the proportion of macropore in the cracked sand is reduced by over 22% from the initial 40.63%. Additionally, the proportion of Me10 decreased significantly, from 32.84% to 0.05–18.18%. The CT-600 and CT-1000 samples exhibited the highest mesopore proportions, at 18.36% and 15.80%, respectively. The specific surface areas of CT-600 and CT-1000 are 0.0634 and 0.0653 m
2/g, respectively, in comparison to other samples. Which, in contrast to other samples, has a specific surface area that ranges from 38.18 to 49.59 % of that of raw sand, making it significantly larger than those of other samples and barely different from that of raw sand. Thus, it is evident that the mesoporous structure produced by the phase transition, particularly the Me10 ratio, is the primary determinant of the specific surface area of quartz sand. In accordance with the aforementioned findings, the percentage of broken sand in Mi exhibited an increase, ranging from 0% to 3.00-13.57%. In particular, the proportion of Me50 of 26.53% surged by more than 34%, reaching 60.54-76.98%, accounting for more than 80% of the total mesopore. The structural change can be attributed to the combined effect of thermal expansion bridging and temperature difference stress cracking. The application of high-temperature expansion results in the closure of fractures of varying scales, leading to the formation of smaller fractures. The pronounced rise in the proportion of Mi and Me50 is concomitant with the marked decline in the proportion of Me10 and Ma. It is noteworthy that, despite the high temperature expansion, Me50 did not form a greater proportion of Me10. However, their proportion did increase significantly, accounting for over 60%. The primary cause of this anomalous phenomenon can be attributed to the prevailing influence of temperature difference stress cracking during the quenching process [
27,
28]. In addition, due to the small particle size of quartz sand, the thermal transfer process in ultra-low temperature environment is very short, and the existence time of temperature difference stress is very short. This can better preserve the fracture structure in the state of high temperature expansion, so that the mesoporous fracture structure generated by the macropore can be preserved. And the decrease of the proportion of macropores is inconsistent with the increase of the proportion of Me50, so the formation of new mesopore is more likely to be the result of temperature difference cracking.
The calcination temperature (T) was considered an independent variable and the function relation
y = f (T
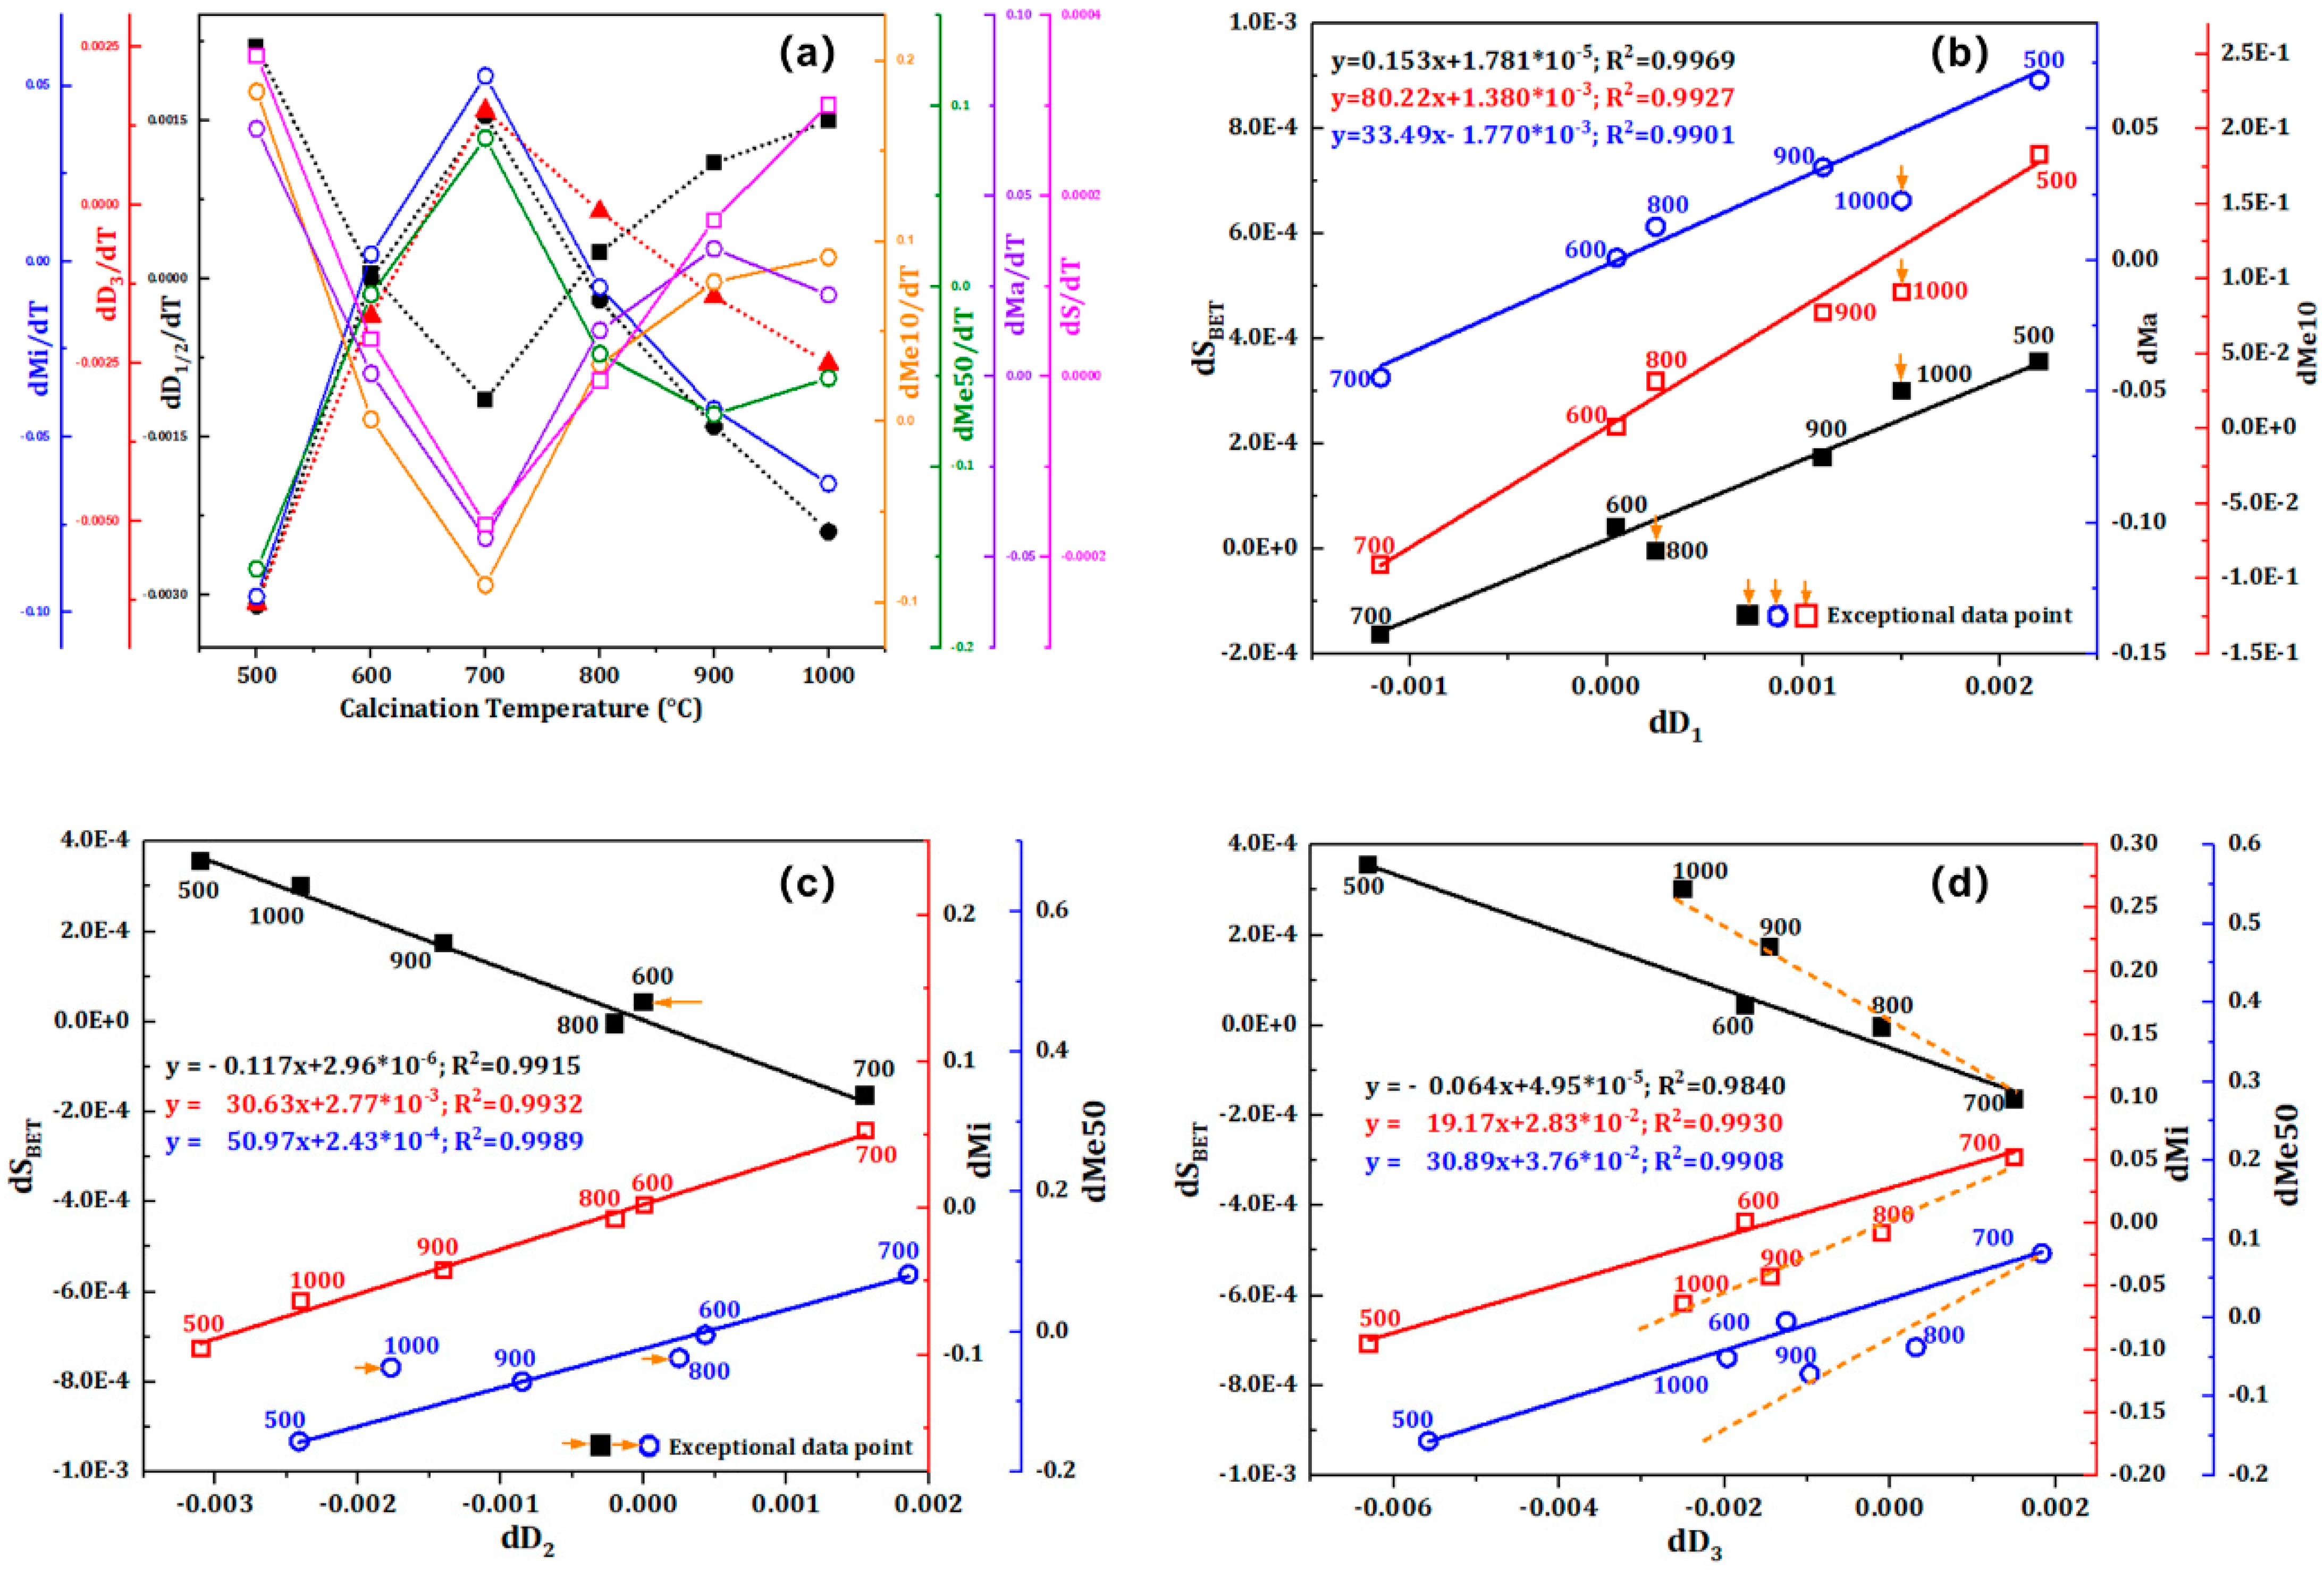
) was addressed using the first derivative in order to further ascertain the influence of calcination temperature on the fractal dimension, fracture structure, and specific surface area. The relationship between dD, dS
BET, and dP, as well as the first-order derivative relationships between calcination temperature and fractal dimension, pore volume distribution, and specific surface area, are displayed in
Figure 5. It can be seen from
Figure 5a that the first derivative of the fractal dimension, S
BET, and pore volume distribution can be seen to monotonically decline or grow in the two temperature intervals. The calcination temperature that corresponds to the first derivative’s inflection point is 700 °C. The specific surface area of broken quartz sand changes more quickly at temperatures above 700 °C during calcination. It is evident that the α-β and β-β phase transitions are strongly linked to the cracked structure changes in quartz sand, which exacerbate the development of more intricate cracking patterns. Studies using thermal cracking-acoustic testing have also demonstrated that, as a result of expansion and heating, nearly all fluid inclusions will thermally burst at 700°C [
29]. In addition,
Figure 5b, 5c, and 5d show that there is a substantial correlation between dD and dSBET and dP, and the linear fitting line’s correlation coefficient (R
2) is higher than 0.99. Data points over 700 °C in
Figure 5d were considerably deviating from the fitting line, whereas dSBET and dP data points with calcination temperatures of 1000 °C in
Figure 5b and 5c were significantly deviating from the fitting line. This is clearly associated with the β-β phase transition, which promotes the creation of further microporous fractures. Therefore, we may conclude that the synergistic effect of greater temperature difference stress and β-β phase transformation expansion is the main reason for the increase of Me10 ratio in macroporous fractures and mesoporous fractures.
3.3. Influence of Phase Transition on Pore Structure of Quartz Sand
The influence of calcination duration on the cracking effect of quartz sand was examined, and 900 °C was identified as the phase transformation temperature to facilitate a detailed investigation of the impact of phase transformation on fracture structures.
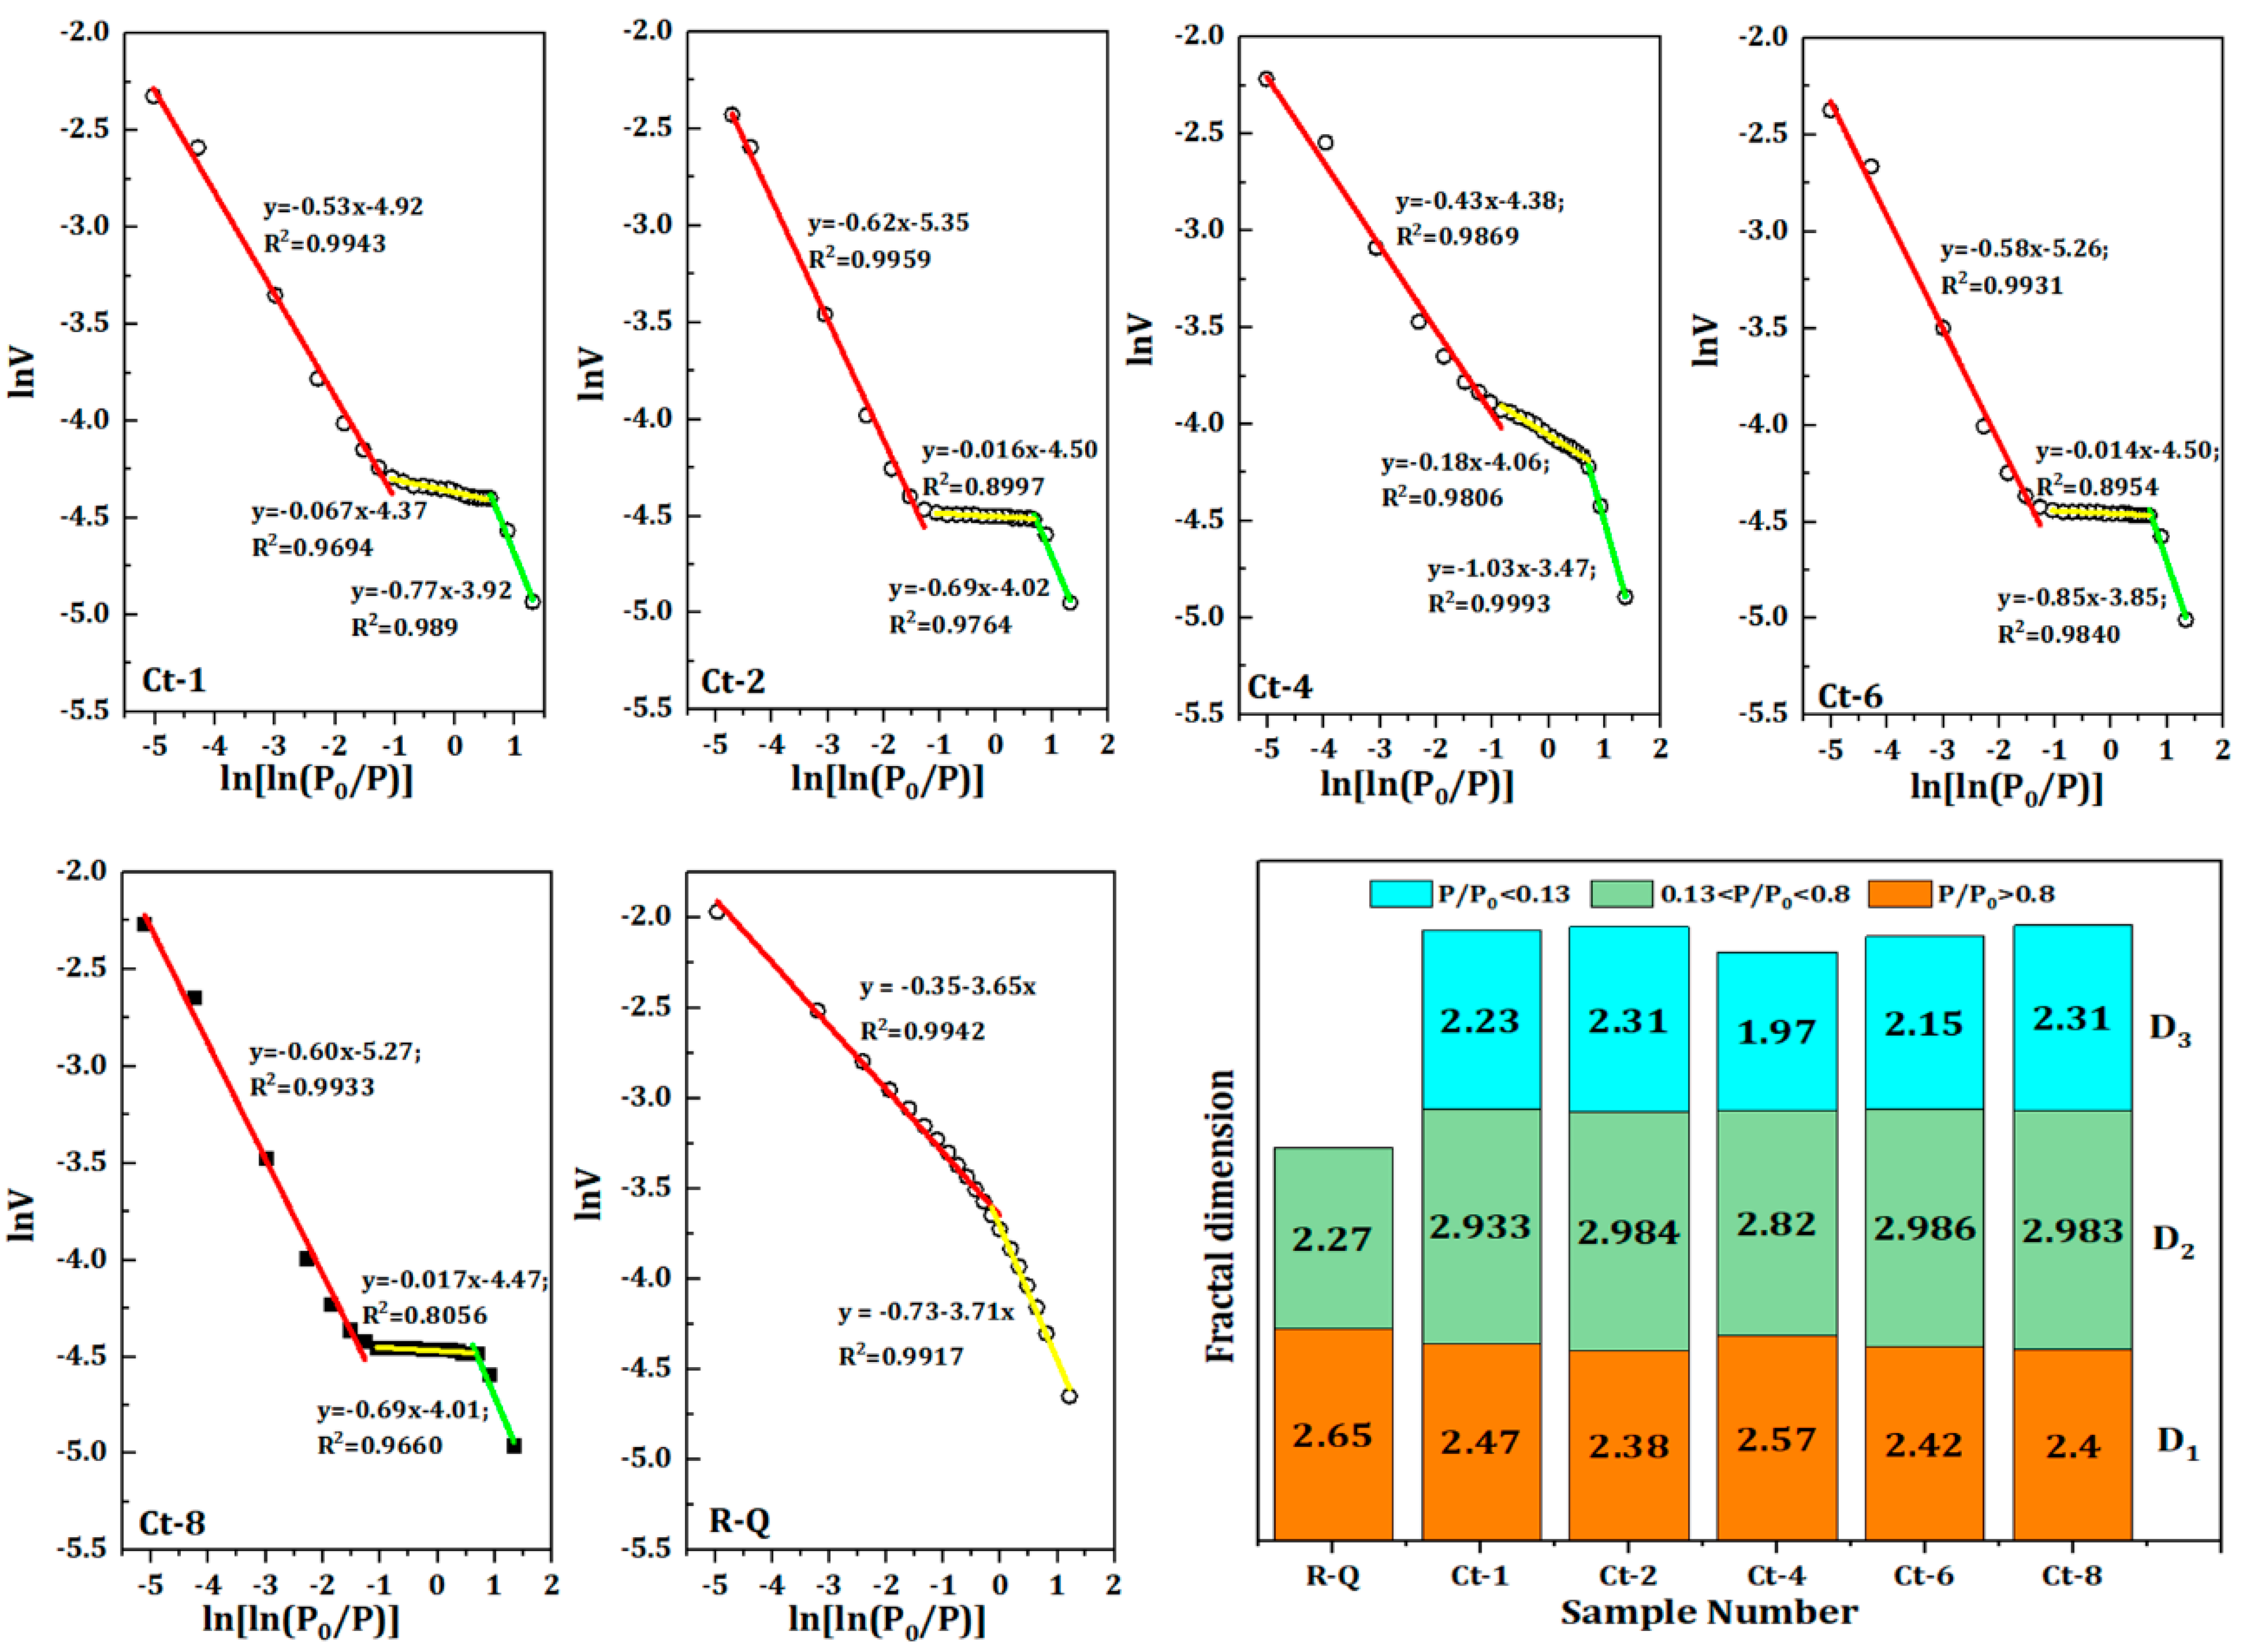
Figure 6 presents the segmented fitting graph of the adsorption curve for the sample of cracked sand. As illustrated in
Figure 6, the impact of calcination duration on the pore structure of cracking sand is in line with the findings presented in
Section 3.2. Among the aforementioned characteristics, the fractal dimension D
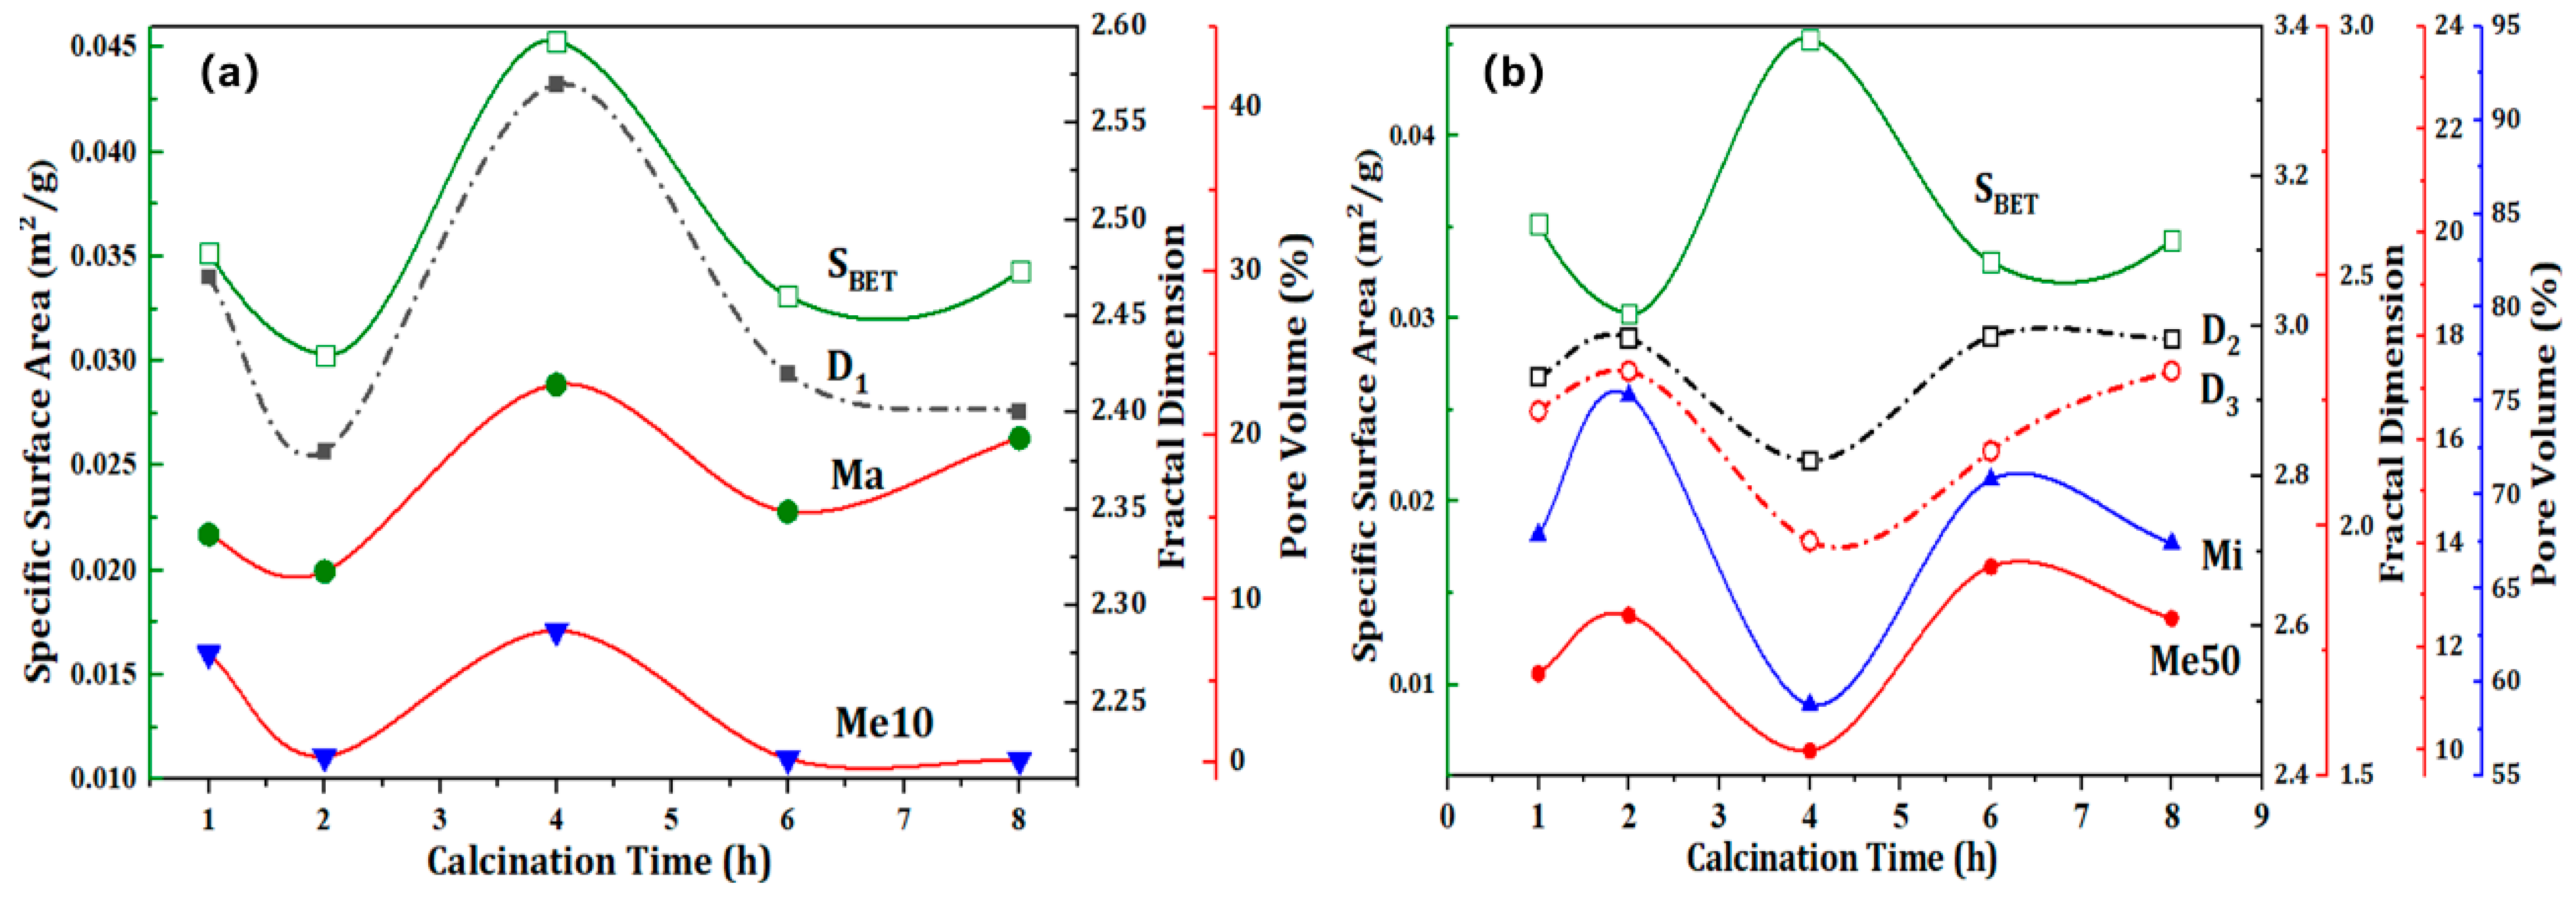
2 is particularly noteworthy, exhibiting a value that is nearly equal to 3. This observation suggests that the alterations in its mesoporous structure are among the most intricate. The fractal dimension values of the cracked sand are at their minimum when the calcination time is 4 hours. This is due to phase changes that cause lattice expansion, resulting in the formation of additional new open fractures, which offset the thermal expansion compensation effect of the existing fractures. Furthermore, the impact of calcination duration on specific surface area and pore volume serves to corroborate this conclusion.
In order to further study the effect of phase change on the fracture structure, 900°C was chosen as the phase change temperature to investigate the impact of calcination time on the fracturing effect of quartz sand.
Figure 6 shows the segmented fitting graph of the adsorption curve for the cracking sand sample, as well as the relationship between calcination time and the changes in fractal dimension, specific surface area, and pore volume ratio. From
Figure 6, it can be seen that the variation pattern of the fractal dimension is consistent with the influence of calcination temperature on the fractal dimension. The fractal dimension D
2 is close to 3, indicating that its mesoporous fractures and structural changes are also the most complex. In addition, as seen in
Figure 6, the effect of calcination time on fractal dimension, specific surface area, and pore volume is relatively complex, but the pattern of change in its second derivative curve is still similar to that of the influence of calcination temperature. The trend of D
1 changes is consistent with S
BET, Ma, and Me10, while the trends of D
2 and D
3 are the same as those of Mi and Me50, showing a significant turning point at 4 hours.
In order to further examine the influence of phase change on the fracture structure, 900 °C was selected as the phase change temperature for investigation into the impact of calcination time on the fracturing effect of quartz sand.
Figure 6 illustrates the segmented fitting graph of the adsorption curve for the cracking sand sample, along with the relationship between calcination time and the alterations in fractal dimension, specific surface area, and pore volume ratio. From
Figure 6, the variation pattern of the fractal dimension is in accordance with the impact of calcination temperature on the fractal dimension. The fractal dimension D₂ is approximately 3, which indicates that its mesoporous fractures and structural alterations are also the most intricate. Furthermore, as illustrated in
Figure 6, the impact of calcination time on fractal dimension, specific surface area, and pore volume is notably intricate. Nevertheless, the pattern of change in its second derivative curve remains analogous to that of the influence of calcination temperature. The trend of D
1 changes is consistent with S
BET, Ma, and Me10, while the trends of D
2 and D
3 are the same as those of Mi and Me50, exhibiting a notable turning point at the four-hour mark.
The impact of calcination time on the specific surface area and fractured structure of quartz sand is illustrated in
Figure 7. As illustrated in
Figure 7, the patterns in the alterations of S
BET, Ma, and Me10 are in accordance with the impact of calcination temperature, which corroborates with the fractal dimension D
1. Meanwhile, the trends in the changes of Mi and Me50 are consistent with the fractal dimensions. The Ct-4 sample exhibits the highest specific surface area, with the cracked sand displaying a specific surface area of 0.0453 m
2/g. In comparison, the specific surface areas of the other cracked sands are less than 50 % of that of the original sand. This is due to the substantial expansion and bridging of the pore structure resulting from prolonged high-temperature calcination, which has led to a notable reduction in the specific surface area. In the initial phase of quartz sand roasting, approximately two hours, the heat absorption of the quartz sand is insufficient to cause significant phase transformation cracking. The absorption of heat by the quartz sand is insufficient to cause significant phase transformation cracking in the initial stage, which is defined as lasting for approximately two hours. This phenomenon is mainly manifested by the expansion and contraction of the original fracture space under the influence of calcination, which results in the preferential compression of Me10 and Ma within the original sand, thereby forming smaller dimensions of Mi and Me50. The proportion of Me10 and Ma was found to decrease from 32.84 % and 40.63 %, respectively, to 0.4 % and 11.71 %. Conversely, the proportions of Mi and Me50 have increased considerably, reaching 12.61 % and 75.29 %, respectively. Upon reaching the calcination temperature for a period of four hours, the phase transformation expansion and cracking of the quartz lattice is complete, resulting in a considerable number of new phase transformation fractures. This is accompanied by a notable increase in the ratios of Me10 and Ma, which reach 8.07 % and 23.13 %, respectively. Upon completion of the quartz phase transition, new fractures will undergo further thermal expansion bridging, resulting in a significant reduction in the ratio of Me10. This is particularly evident in the Ct-6 and Ct-8 samples, where the Me10 ratio has decreased to 0.27 % and 0.19 %, respectively. It can be concluded that the optimal calcination time is four hours, as this allows for the reduction of thermal expansion bridging of a large number of pores and the achievement of complete phase transformation cracking.
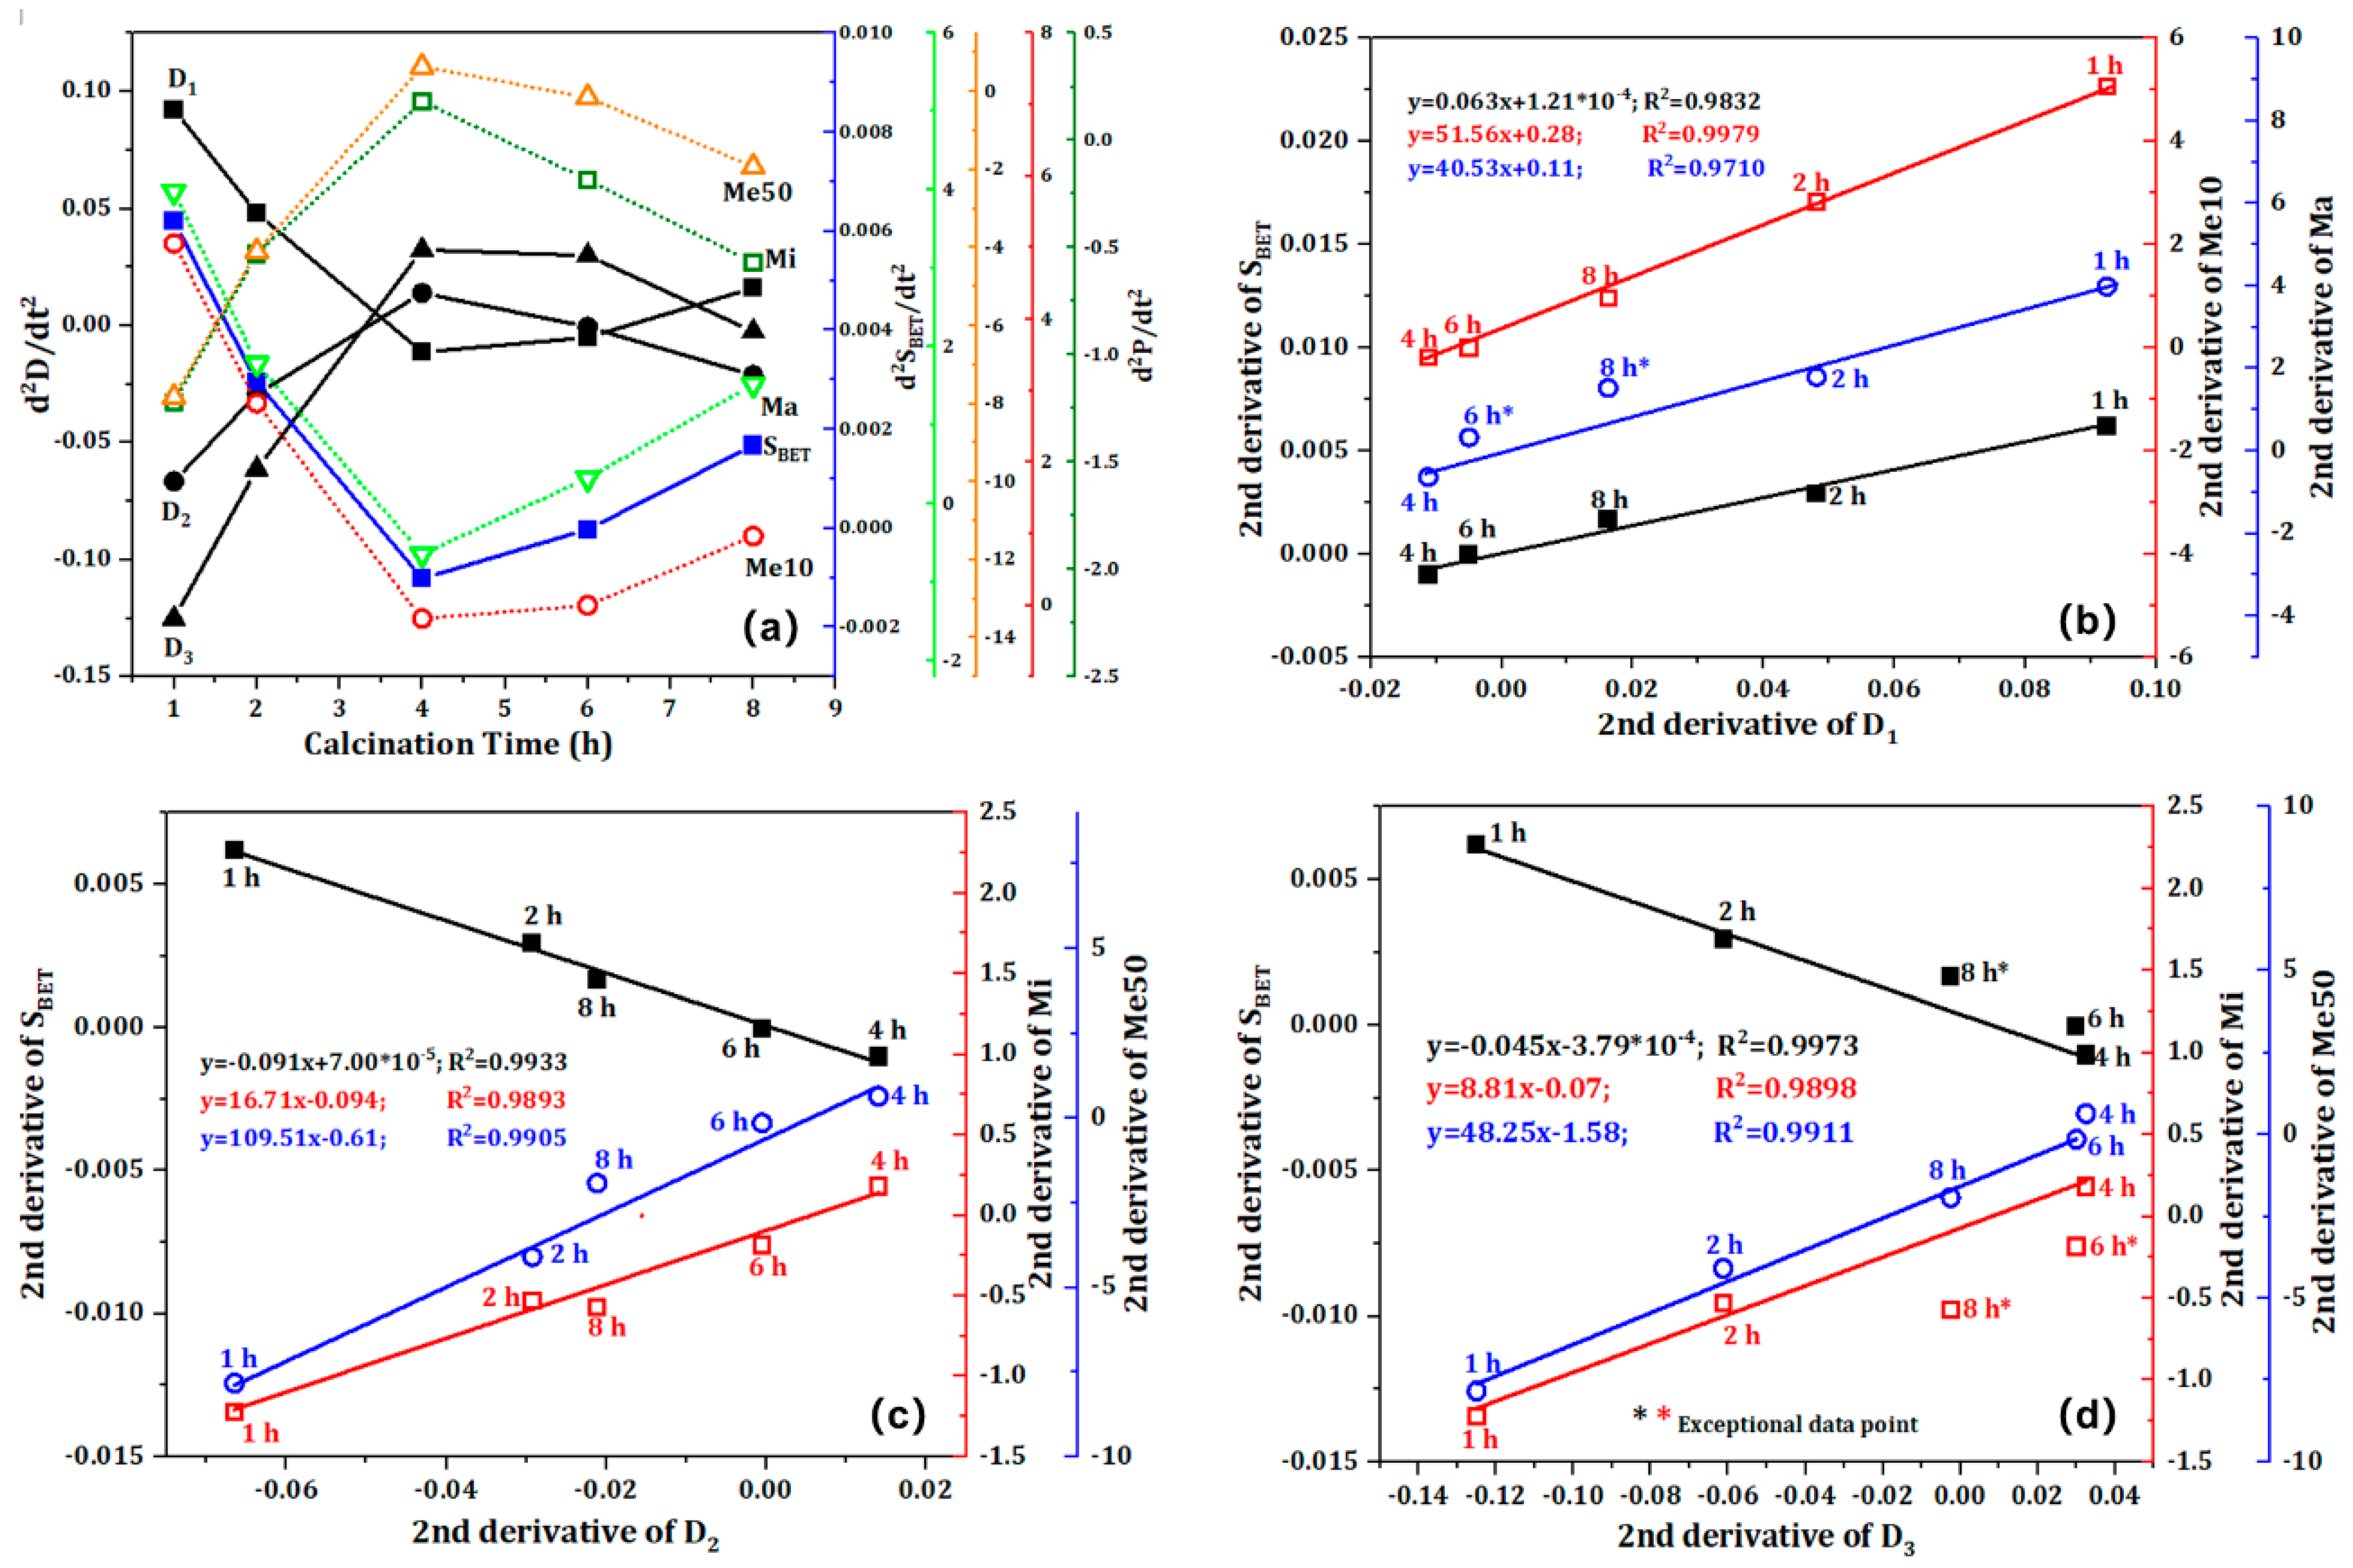
Using the calcination time (t) as the independent variable, the second derivative of the function relationship y= f(t) is processed. The correlation between calcination time and fractal dimension, pore volume distribution, and S
BET is illustrated in
Figure 8. As illustrated in
Figure 8a, it is apparent that the fractal dimension, S
BET, and pore volume distribution all exhibit a cubic functional relationship with respect to calcination time. Upon exceeding a calcination time of four hours, the second derivative exhibits a monotonic variation pattern. This not only serves to further validate the conclusions drawn from
Figure 6, but also suggests that the impact of calcination time on the cracked structure is more intricate than previously thought.
Figure 8b, 8c, and 8d illustrate a significant correlation between the fractal dimension, S
BET, and pore volume, with R
2 values for the linear fitting lines of their second derivatives exceeding 0.97. dS
BET, dMa, and dMe50 demonstrate a positive correlation with dD
1, while dMi and dMe10 exhibit a positive correlation with dD
2 and dD
3, respectively. The phase change data points are situated predominantly on the regression line, whereas Ct-6 and Ct-8 exhibit notable deviations. This is attributable to the extended calcination period, which has the effect of intensifying the deterioration of phase transformation fractures.
3.4. Influence of Cracking Frequency on the Formation of Pores in Quartz Sand
In order to achieve more optimal cracking effects, we conducted further studies to ascertain the impact of quenching frequency and quenching-grinding frequency on the fracturing of quartz sand. In order to mitigate the influence of phase transitions, the calcination temperature was set at 900 °C. The interval for calcination in the experiment investigating the effect of quenching frequency is set at two hours, while the interval for the experiment investigating the effect of quenching-grinding frequency is set at four hours.
Figure 9 illustrates the influence of quenching frequency and grinding frequency on the fractal structure of quartz sand pores. A comparison of the fractals in
Figure 9 using the fractal dimension reveals that the values of D
1, D
2, and D
3 are similar, indicating that the quenching frequency and grinding frequency have a minimal impact on the pore volume distribution. However, the fractal dimension of the mesoporous pores in cracked sand is approximately 3, and the R
2 values of the regression lines are predominantly within the range of 89% to 93%. Both results indicate that the repeated quenching and grinding processes result in an increase in the complexity of the mesoporous structure.
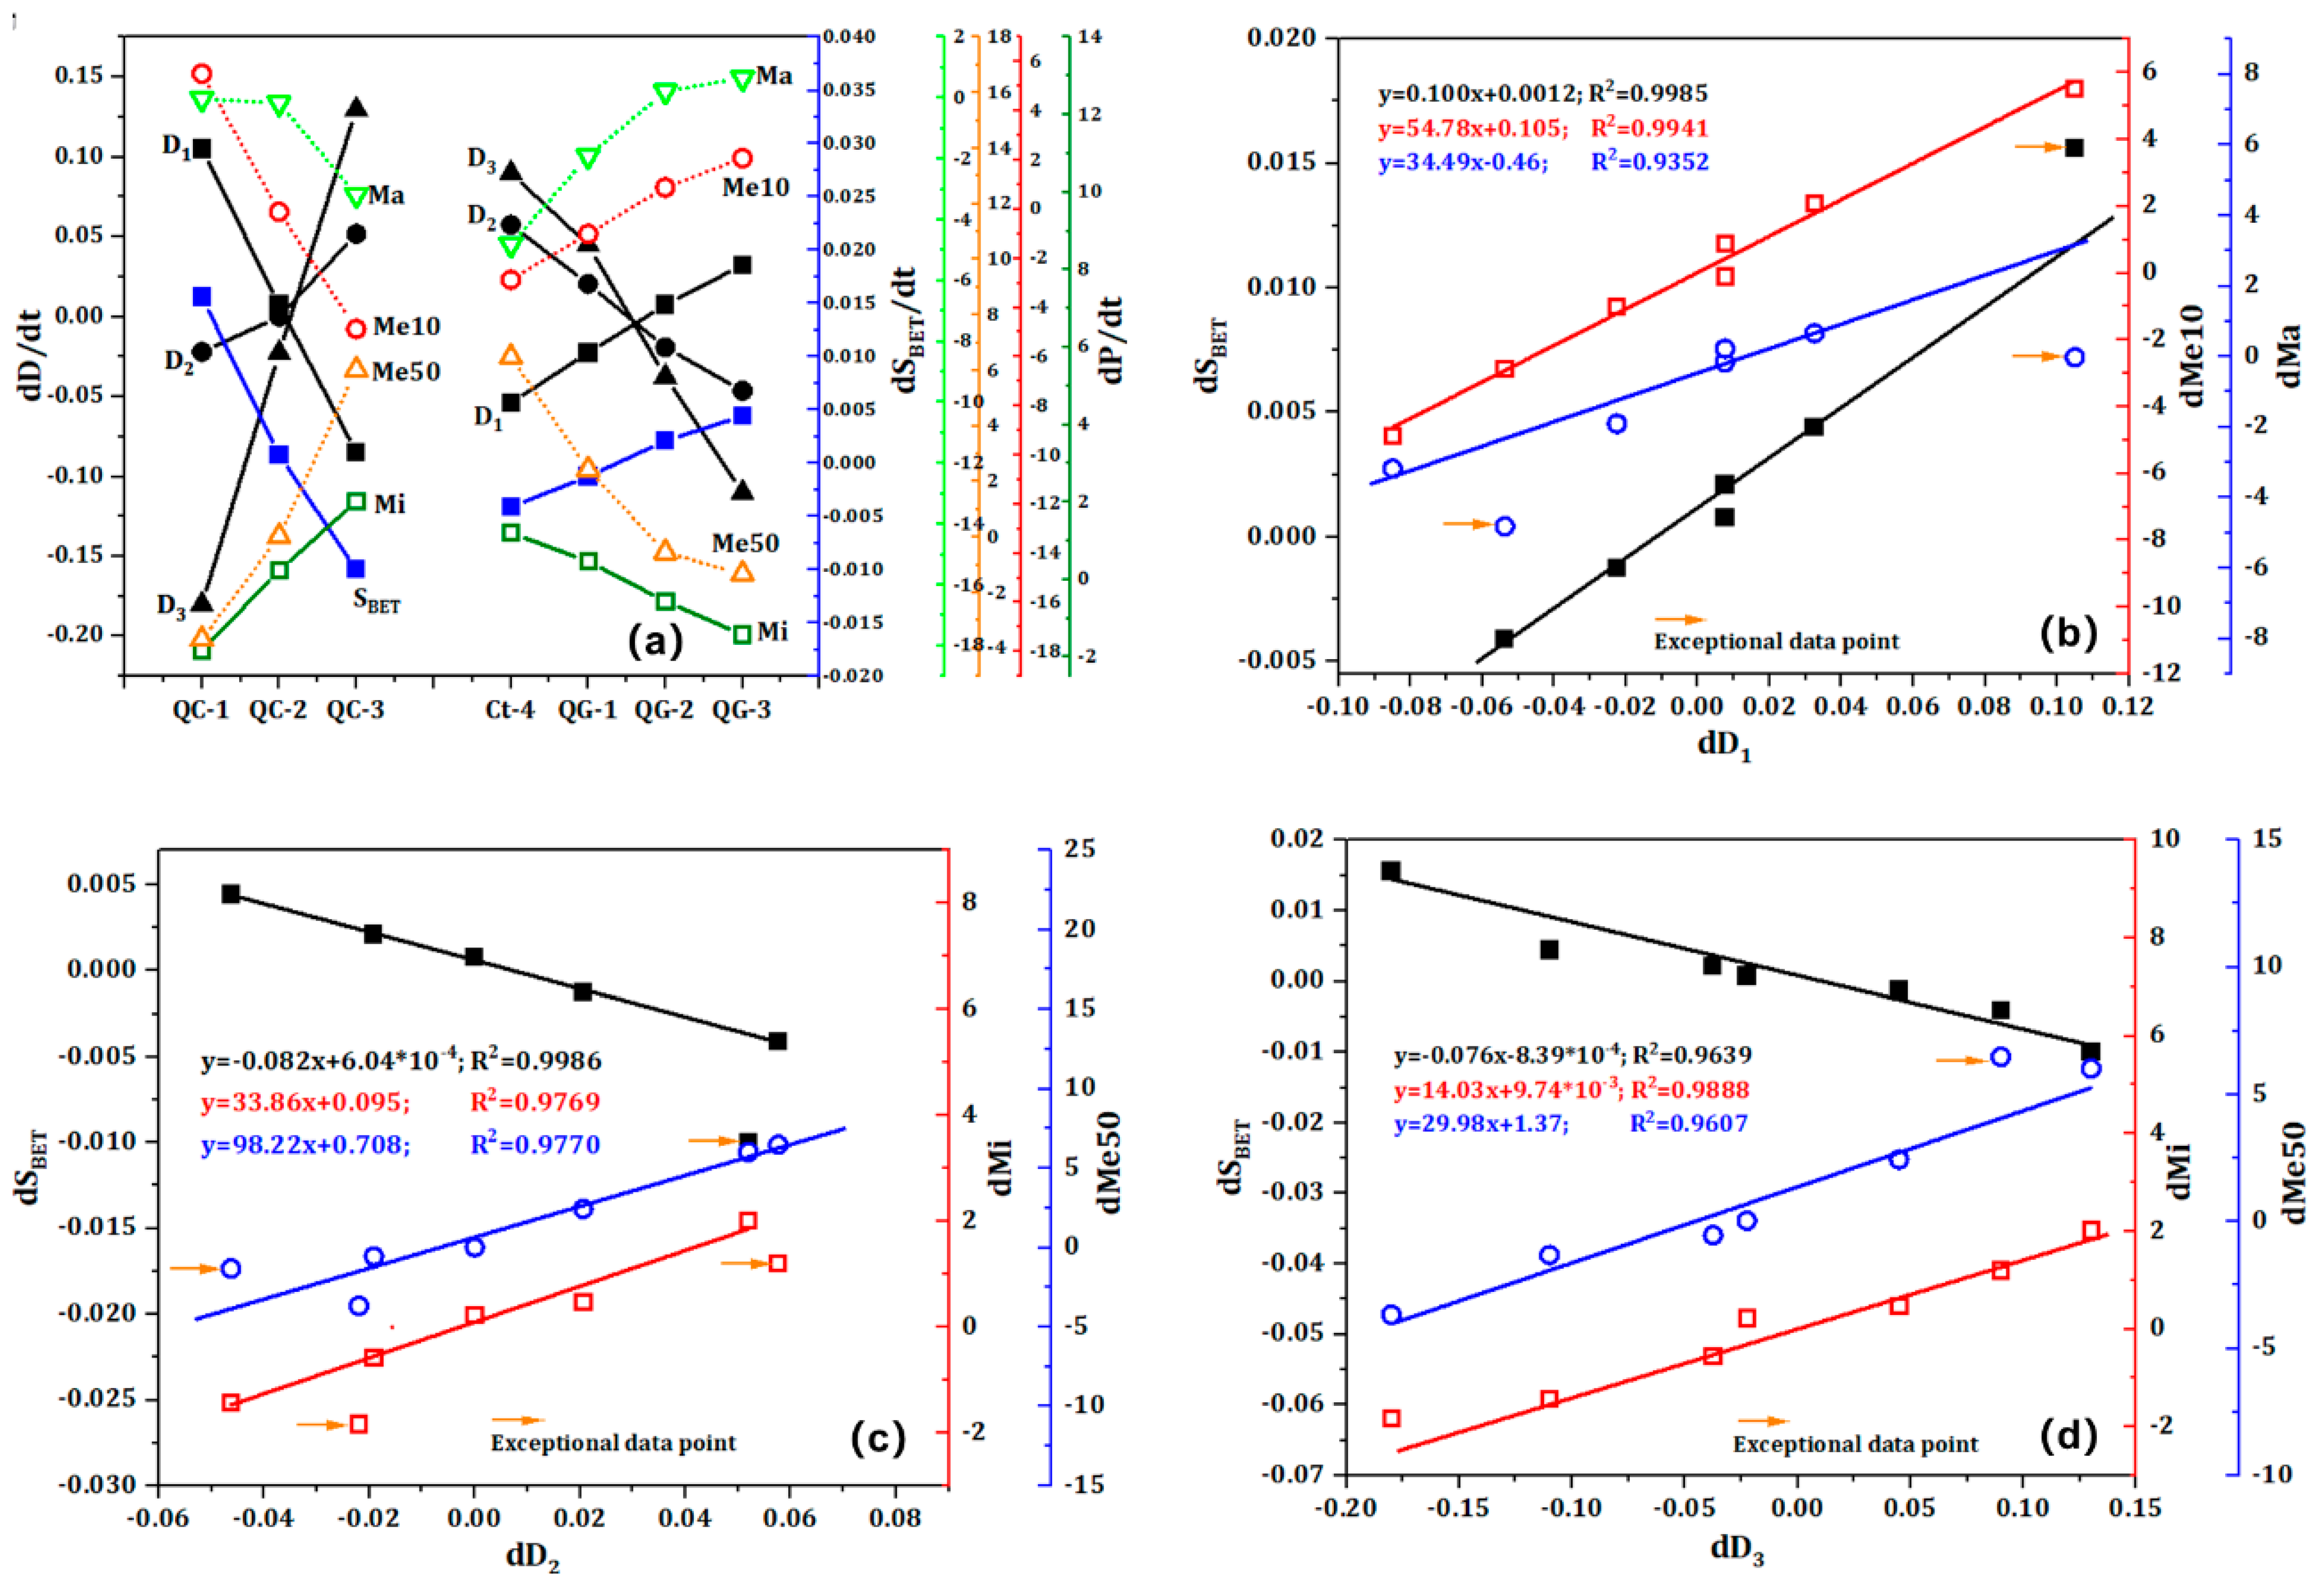
Figure 10 illustrates the impact of varying quenching and grinding frequencies on the fractal dimension, specific surface area, and pore volume distribution of quartz sand. Additionally, it elucidates the differential relationship between fractal dimension, pore structure, and specific surface area.
Figure 10a illustrates a positive correlation between D1 and S
BET, Ma, and Me10, while D
2 and D
3 also demonstrate a positive correlation with Mi and Me50. It can thus be concluded that this positive correlation is a universal rule in the calcination-quenching process and is not affected by heat treatment temperature, thermal stress, or grinding effects. As the frequency of quenching and grinding increases, both the specific surface area and the volume distribution reach a maximum value. The QC-2 and QG-3 samples exhibited the highest specific surface areas, reaching 0.0615 m²/g and 0.0531 m²/g, respectively. Furthermore, the volume distribution of pores at different scales can be effectively controlled by adjusting the quenching frequency and grinding frequency. Of particular note is the QC-2 sample, which exhibited a Me10 ratio of 11.44%. The corresponding ratios of Mi and Me50 have decreased to 67.95% and 8.95%, respectively. In comparison to the Ct-4 sample, the Me10 ratio is 8.07%, with a discrepancy of 3.37% between the two. Moreover, the volume distribution of the QG-3 sample also exhibits a notable increase in the Me10 ratio, while the Mi and Me50 ratios have decreased. It can thus be concluded that the effects of thermal expansion are not offset by the temperature difference and external forces generated by grinding. Nevertheless, the implementation of multiple quenching and grinding processes can effectively regulate the Me10 ratio and enhance the specific surface area.
Based on these findings, it can be concluded that the effects of thermal expansion are not negated by the temperature differential and external forces generated by grinding. Nevertheless, the implementation of multiple quenching and grinding processes can effectively regulate the Me10 ratio and enhance the specific surface area. The distinction between the QC and QG samples lies in the nature of the cracking process. In the case of the QC samples, this is a phase-changing, segmented cracking process, whereas in the case of the QG samples, it is a phase-changing, repeated cracking process. A noteworthy aspect of the segmented cracking process is that the initial phase change fracture necessitates the reabsorption of heat for a secondary phase change expansion, thereby providing a certain buffer time to reduce the expansion of fracture closure. This significantly increases the Me10 ratio. The repeated cracking process of QG samples is characterized by the application of mechanical forces, namely friction and pressure, to the local powder. However, the duration of thermal stress is relatively short, which makes it challenging for a synergistic effect to form between the two. Furthermore, prolonged and repeated calcination resulted in a continuous decrease in the specific surface area of the QG-1 and QG-2 samples, due to the intensification of fracture closure [
29,
30,
31].
As illustrated in
Figure 10b,
Figure 10c, and
Figure 10d, a notable linear correlation is evident between the fractal dimension variable and the porosity variable, irrespective of whether the quartz sand is subjected to mechanical force or thermal stress. The influence of two different forces is evident in the positive linear correlation between dS
BET, dMa, and dMe50 with dD
1, while dMi and dMe10 also exhibit a positive linear correlation with dD
2 and dD
3. The correlation coefficient (R
2) of the fitting lines is mostly. Nevertheless, the correlation coefficients R
2 for the Me10 and Mi fitting lines are only 0.9352 and 0.9607, respectively, and the deviations of some data points are considerable. It is evident that external forces exert a more pronounced influence on small-scale fractures, which may be attributed to the shear forces experienced by the particles during the quenching and grinding processes.
3.5. Analysis of Ultra-Low Temperature Cracking Process of Quartz Sand
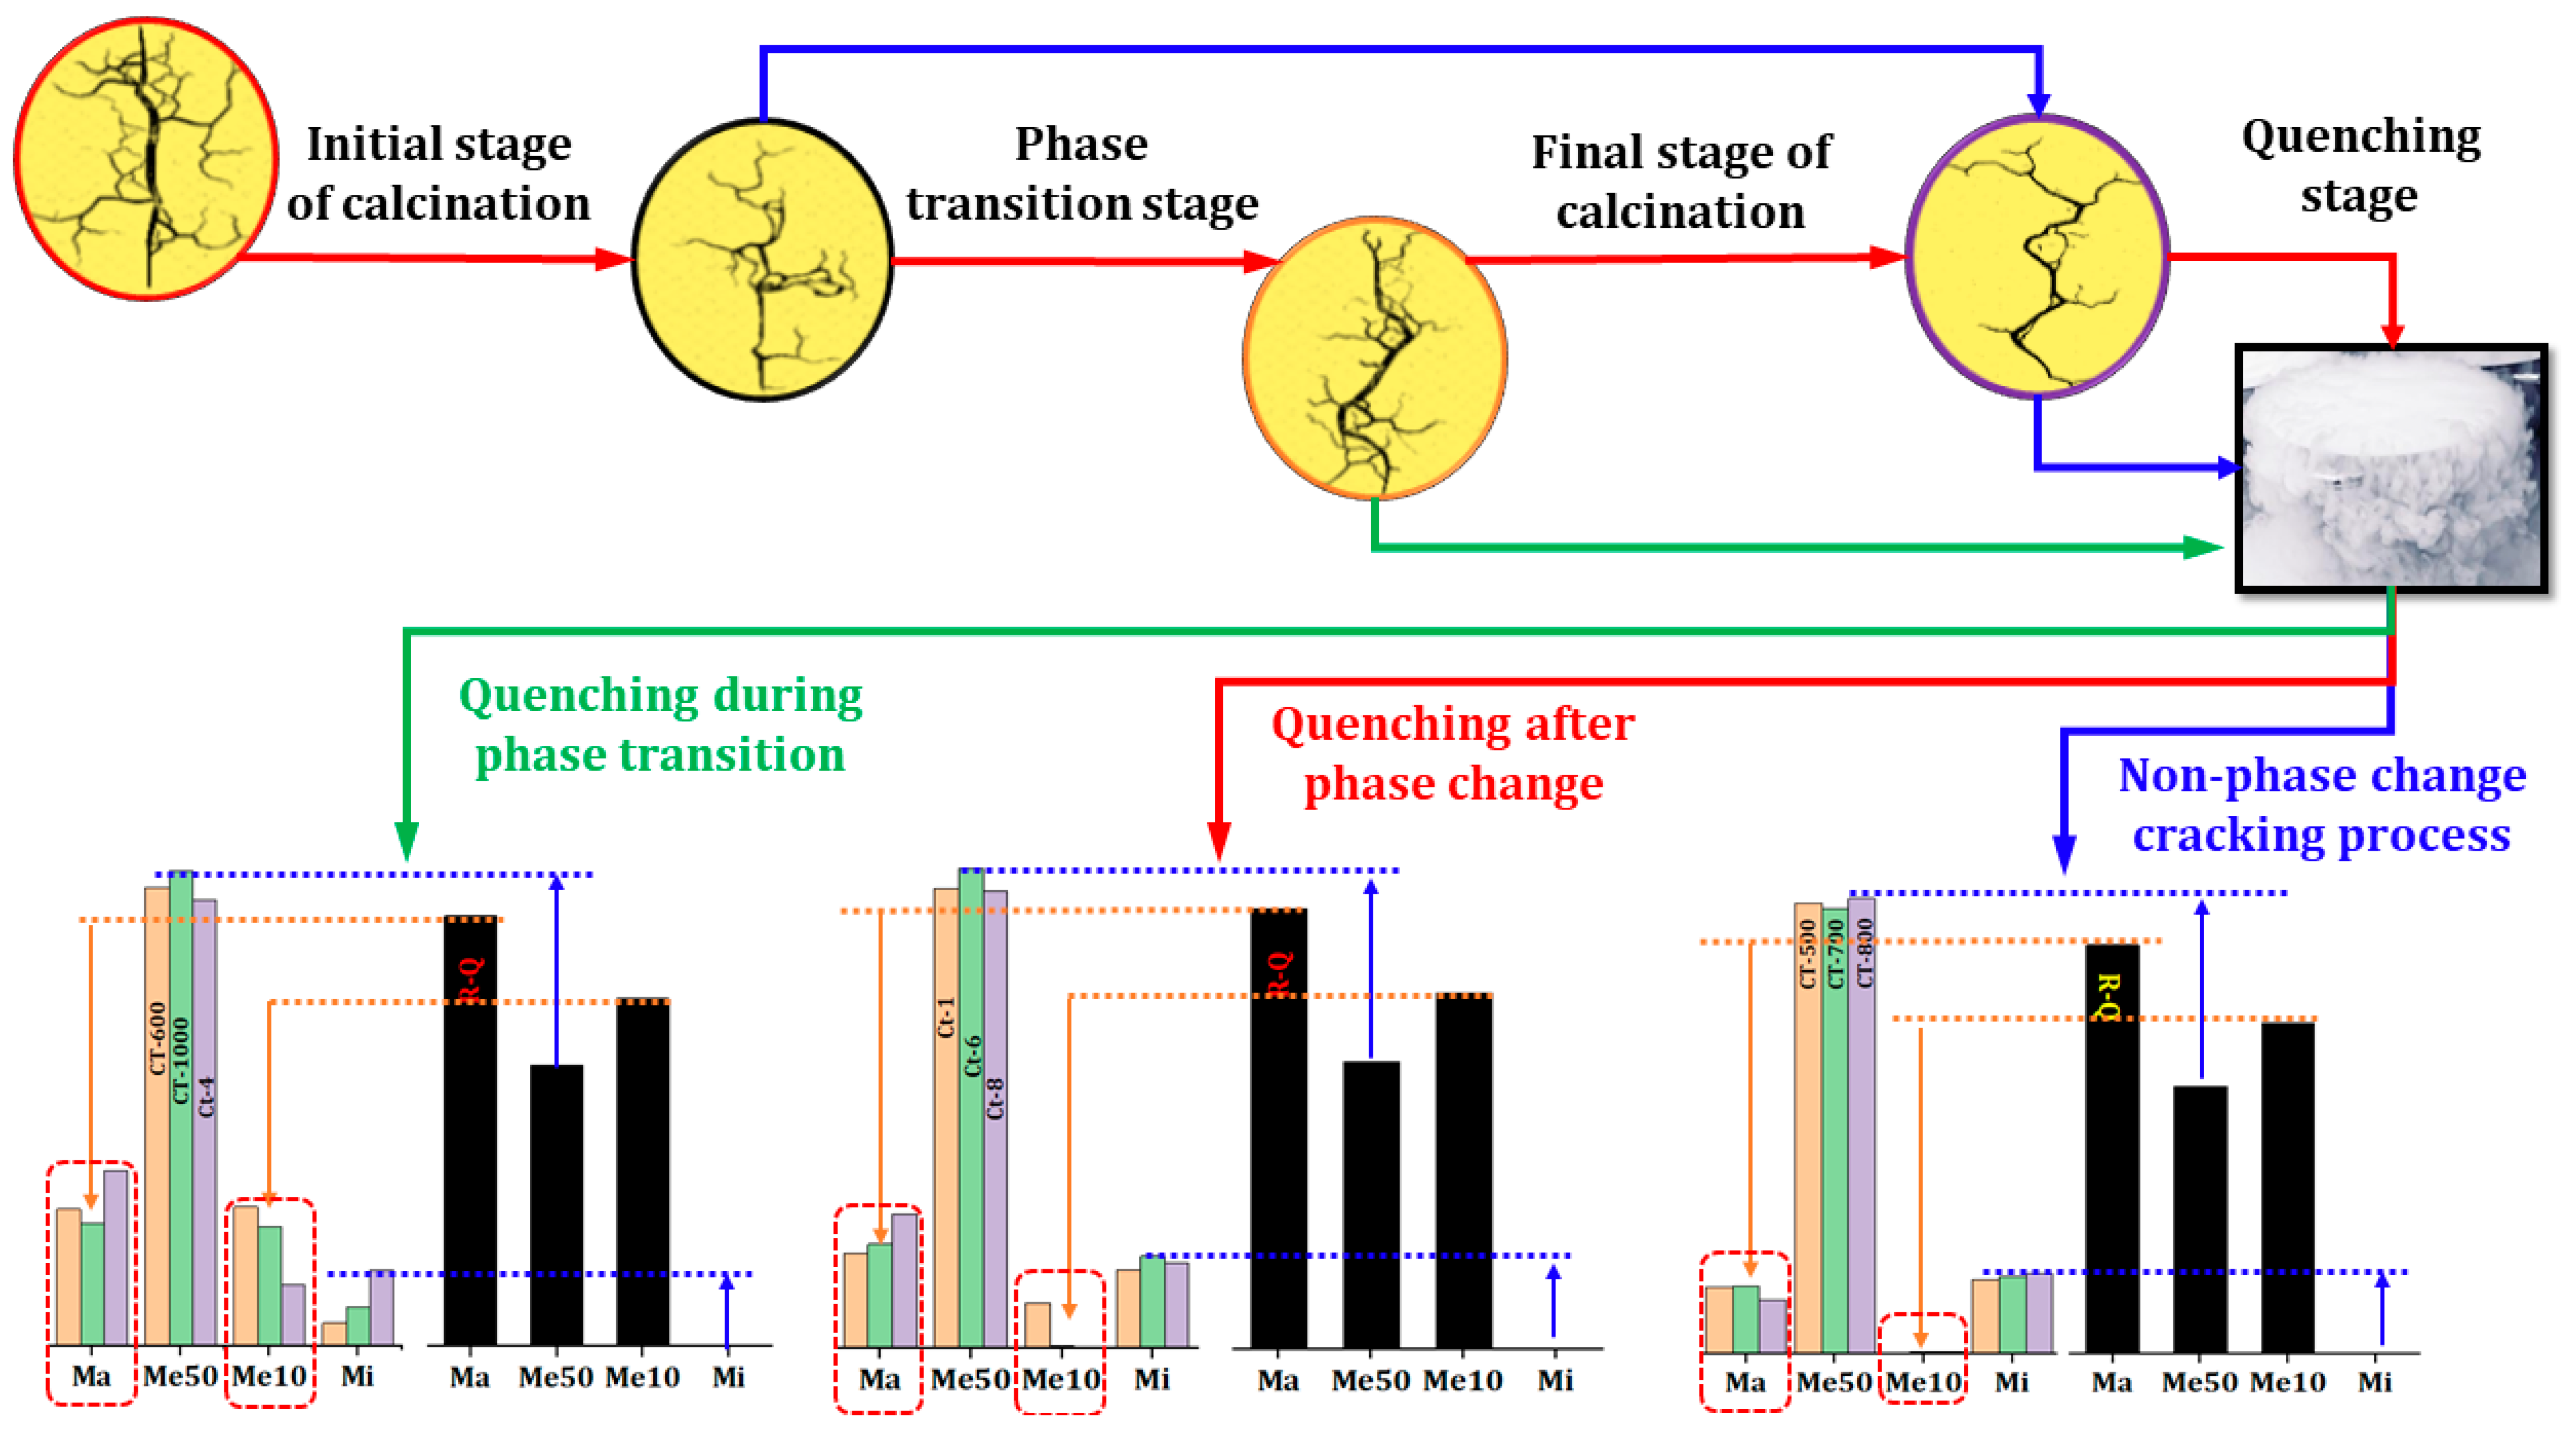
According to the results of the BET analysis, heat treatment causes a considerable decrease in the specific surface area of quartz sand while dramatically increasing the proportion of mesoporous pores. The results of this experiment are mainly due to pore closure caused by thermal expansion. And by analyzing the pore structure of quartz sand and fractal analysis, the cracking process of quartz sand can be summarized as the combined effects of thermal expansion closure and various fracturing factors. The creation and alterations in quartz sand’s pore structure throughout calcination process and the ultra-low temperature quenching process are examined in
Figure 11.
(1) The calcination process of quartz sand
During the calcination process, the quartz sand particles gradually absorb heat and begin to expand, which accelerates the reduction and closure of the pores in the quartz sand particles. The specific surface area of the quartz sand was reduced greatly as a result of the closure of many pores, resulting in wedge-shaped pores [
32,
33,
34]. In terms of changes in pore structure, large pores tend to preferentially form smaller pores of similar size. The huge rise in the fraction of micropores in cracked sand can be attributed to the large-scale shrinkage of Me10 pores, which results in the formation of Mi pores. This is key evidence supporting the alterations in the non-phase transition pore structure. Furthermore, the notable decrease in the pore ratio of Ma and Me10 provides strong evidence for the above conclusion.
With the increase in calcination temperature and calcination time, the phase transition of quartz crystals becomes the main factor affecting pore structure. Phase transition lead to the formation of new fractures on the surfaces of quartz particles, fracture interfaces, and heterogeneous material interfaces. The most direct evidence is that the Me10 ratio of cracked sand is significantly higher than that of non-phase change cracked sand. The SBET of phase change cracked sand is very close to that of raw quartz sand, with the Me10 ratio significantly higher than that of other cracked sands. Among them, the proportion of Me10 fractures in the CT-600 and CT-1000 samples reached 18.36% and 15.80%, respectively, which is 47.88 to 367.2 times higher than that of other CT samples. The observed result is primarily attributed to the disparities in phase transformation. CT-1000 belongs to the reconstructive α-α phase transformation, which exhibits a more significant volume expansion effect compared to the displacement-type α-β phase transformation of CT-600.As the phase change time extends, the fractures in quartz sand reheat and expand, consequently leading to a reduction in specific surface area.
Therefore, calcination is the result of the combined effects of phase change expansion and expansion closure on the variation of pore distribution. Non-phase transformation calcination, the initial stage of calcination, and the cracking of quartz sand after the phase transformation all exhibit thermal expansion closure, while the phase transformation process shows phase transformation cracking.
(2) Liquid Nitrogen Quenching Process
During the quenching process, the ultra-low temperature environment and the rapid evaporation of liquid nitrogen facilitate near-instantaneous heat transfer between high-temperature quartz sand and liquid nitrogen. This enables the preservation of the pore distribution characteristics of the quartz sand in its expanded state to the greatest extent possible. Concurrently, the transient cooling shrinkage of the quartz sand surface and the internal thermal expansion collectively generate extreme shear stress, which further accelerates the formation of new fractures in the quartz sand particles and the subsequent cracking of the pores. Nevertheless, the BET test results demonstrate that the specific surface area and the proportion of macropores of all cracked sands remained unaltered. It is noteworthy that the porosity ratio of Me10 has undergone a pronounced decline, whereas the porosity ratio of Me50 has exhibited a marked increase, with Me50’s porosity ratio exceeding 60%. This value is considerably higher than that of the original sand (26.53%). It can therefore be inferred that the primary function of quenching is not only to transiently solidify the high-temperature pore structure of quartz sand, but also to regulate the relative proportions of mesoporous pores. The finding that repeated quenching and cracking does not significantly increase the specific surface area of quartz sand provides strong support for this conclusion. Furthermore, the combined effect of mechanical force and thermal stress does not lead to a notable increase in the specific surface area, but it can enhance the relative abundance of Me10 pores. This provides further confirmation of the impact of temperature differential stress and mechanical force on pore cracking.
In conclusion, the primary factors responsible for the cracking of quartz sand are thermal expansion and phase change effects, which have the potential to significantly alter the pore structure of quartz sand. The specific surface area of the fractured sand did not expand appreciably because mechanical force and temperature difference stress are unable to encourage the production of additional and larger pore structures. On the other hand, the mesoporous fractures can be successfully regulated by the thermal stress produced by quenching, especially by increasing the proportion of Me50 pores. It is evident that the larger size Me50 with a higher ratio is better suited for the mass transfer of quartz sand leaching in the liquid-solid phase. Therefore, regulating the proper degree of phase change and pore distribution will become crucial to future research on the pretreatment technique for quartz sand purification in order to produce a bigger specific surface area and more large-sized pores.

