1. Introduction
Stability studies remain a crucial aspect of power systems dynamic analysis. Despite the fact that stability problems in power systems have been researched for a very long time [
1,
2,
3], the increasing penetration of renewable energy sources, and the rapidly evolving technological advancements, give rise to more intricate and complex system dynamics, that necessitates a deeper and wider perspective regarding their stability [
4,
5,
6]. The core of the problem lies in the fact that renewable energy sources, such as wind and solar, are inherently intermittent and often unpredictable due to their dependence on environmental conditions. This variability introduces challenges in maintaining a stable frequency within the power grid, a parameter that is crucial for the reliable operation of electrical power systems. Frequency stability is maintained by balancing the supply and demand of power within the grid. However, the intermittent nature of renewable sources can lead to significant deviations if not properly managed. These deviations can cause a range of issues, from minor inefficiencies to severe system failures, including blackouts or damage to sensitive infrastructure. Energy storage systems (ESS) have emerged as a vital solution to address these challenges, providing the necessary flexibility to absorb or release energy in response to fluctuations in supply and demand [
7,
8,
9]. By quickly adjusting their output, ESS can help smooth out the variability in renewable energy generation, thereby stabilizing the frequency of the grid.
Many works in the recent literature study stability problems in power systems, using different approaches. This vast field of research can be divided roughly to three main approaches: Numerical analysis [
10,
11,
12], linearization based techniques [
13,
14,
15,
16], and direct methods - which utilize at their core various Lyapunov energy functions [
17,
18,
19]. Considering the direct methods, one may examine for instance, work [
20], that presents a theoretical foundation of direct methods for both network-reduction and network-preserving power system models. The authors suggest a systematic procedure for constructing energy functions for both network-reduction and network-preserving power system models, utilizing the “boundary of stability region based controlling unstable equilibrium point” (or BCU) method for commuting the unstable equilibrium point, together with an algorithm for the numerical solution of the direct method. Finally, a practical demonstration of the proposed method for online transient stability assessments on two power systems is outlined. Moreover, paper [
21] introduces a novel framework to construct the Region of Attraction (ROA) of a power system centered around a stable equilibrium by using stable state trajectories of the system dynamics. The proposed method leverages a Lyapunov function along with the Gaussian process approach. In addition, a sampling algorithm is designed to reconcile the tradeoffs between the exploitation for enlarging the ROA and the exploration for enhancing the confidence level of the sample region. The writers conduct various simulations and experimental validations to substantiate the assessment approach for the ROA of an IEEE test system with real data. It is demonstrated that the proposed approach can significantly enlarge the estimated ROA compared to previous works.
As described above, a large number of works utilize linearization techniques to study the stability of power systems. Due to the vast amount of research in this field, we naturally review only several representative papers. For example, study [
22] investigates the application of a multi-variable nonlinear controller for generators. The proposed controller is based on linearization, and its main goal is to improve the transient stability and voltage regulation under post-fault conditions. Simulation results show the improvement in swing stability and system damping under large disturbances, as well as robust terminal voltage regulation. To continue this line of thinking, researchers in [
23] offer a new framework to study integration methods for power systems impacted by delays. They use matrix-pencil theory for numerical stability analysis and accuracy analysis. The proposed approach covers all implicit Runge–Kutta methods for time-delay systems. The authors illustrate the idea through simulations on the IEEE 14-bus system, and consider three examples of implicit integration methods, such as “Backward Euler”, “trapezoidal”, and “2-s Radau IIA”.
As seen in the literature review above, there exist three central approaches to analyze the stability of power system dynamic models, namely - numeric simulations, linearization techniques, and direct methods that utilize a variety of Lyapunov functions. In this paper, we continue the line of thinking represented by this last approach, and propose a new criterion for finding global stability properties of equilibrium points in nonlinear power system models. Our approach is based on the Popov stability criterion, which provides exactly this kind of information. With respect to previous works, the proposed method has the following properties:
With respect to linearization techniques, the proposed approach provides information on the global stability of an equilibrium point of a power system model, rather then on its local stability.
With respect to numerical techniques, the proposed approach provides analytical conditions, which apply generally to the type of system under study.
With respect to direct methods, the proposed approach provides a systematic procedure for applying the Popov stability criterion in various power system models, which has not been used before in this application, and thus enables a systematic analysis of several small-scale systems, as described in the text below.
We present first the general mathematical background, and then proceed with practical applications of this proposed approach.
2. Materials and Methods
2.1. Mathematical Background - The Popov Stability Criterion
The Popov stability criterion applies to nonlinear feedback systems that include a memory-less nonlinear component. Unlike linearization techniques, this criterion provides conditions for
global asymptotic stability of an equilibrium point. Consider the following dynamic system:
where
A is a constant matrix,
b and
c are constant vectors, and
is a continuous function of
that describes the nonlinearity. It is assumed that
The eigenvalues of the constant matrix A are in the open left half-plane,
,
, for all , where k is a positive constant.
Popov’s stability criterion states that an equilibrium point of the dynamic system (
1) is globally asymptotically stable if there exist real numbers
such that the inequality
holds for every real
. Defining
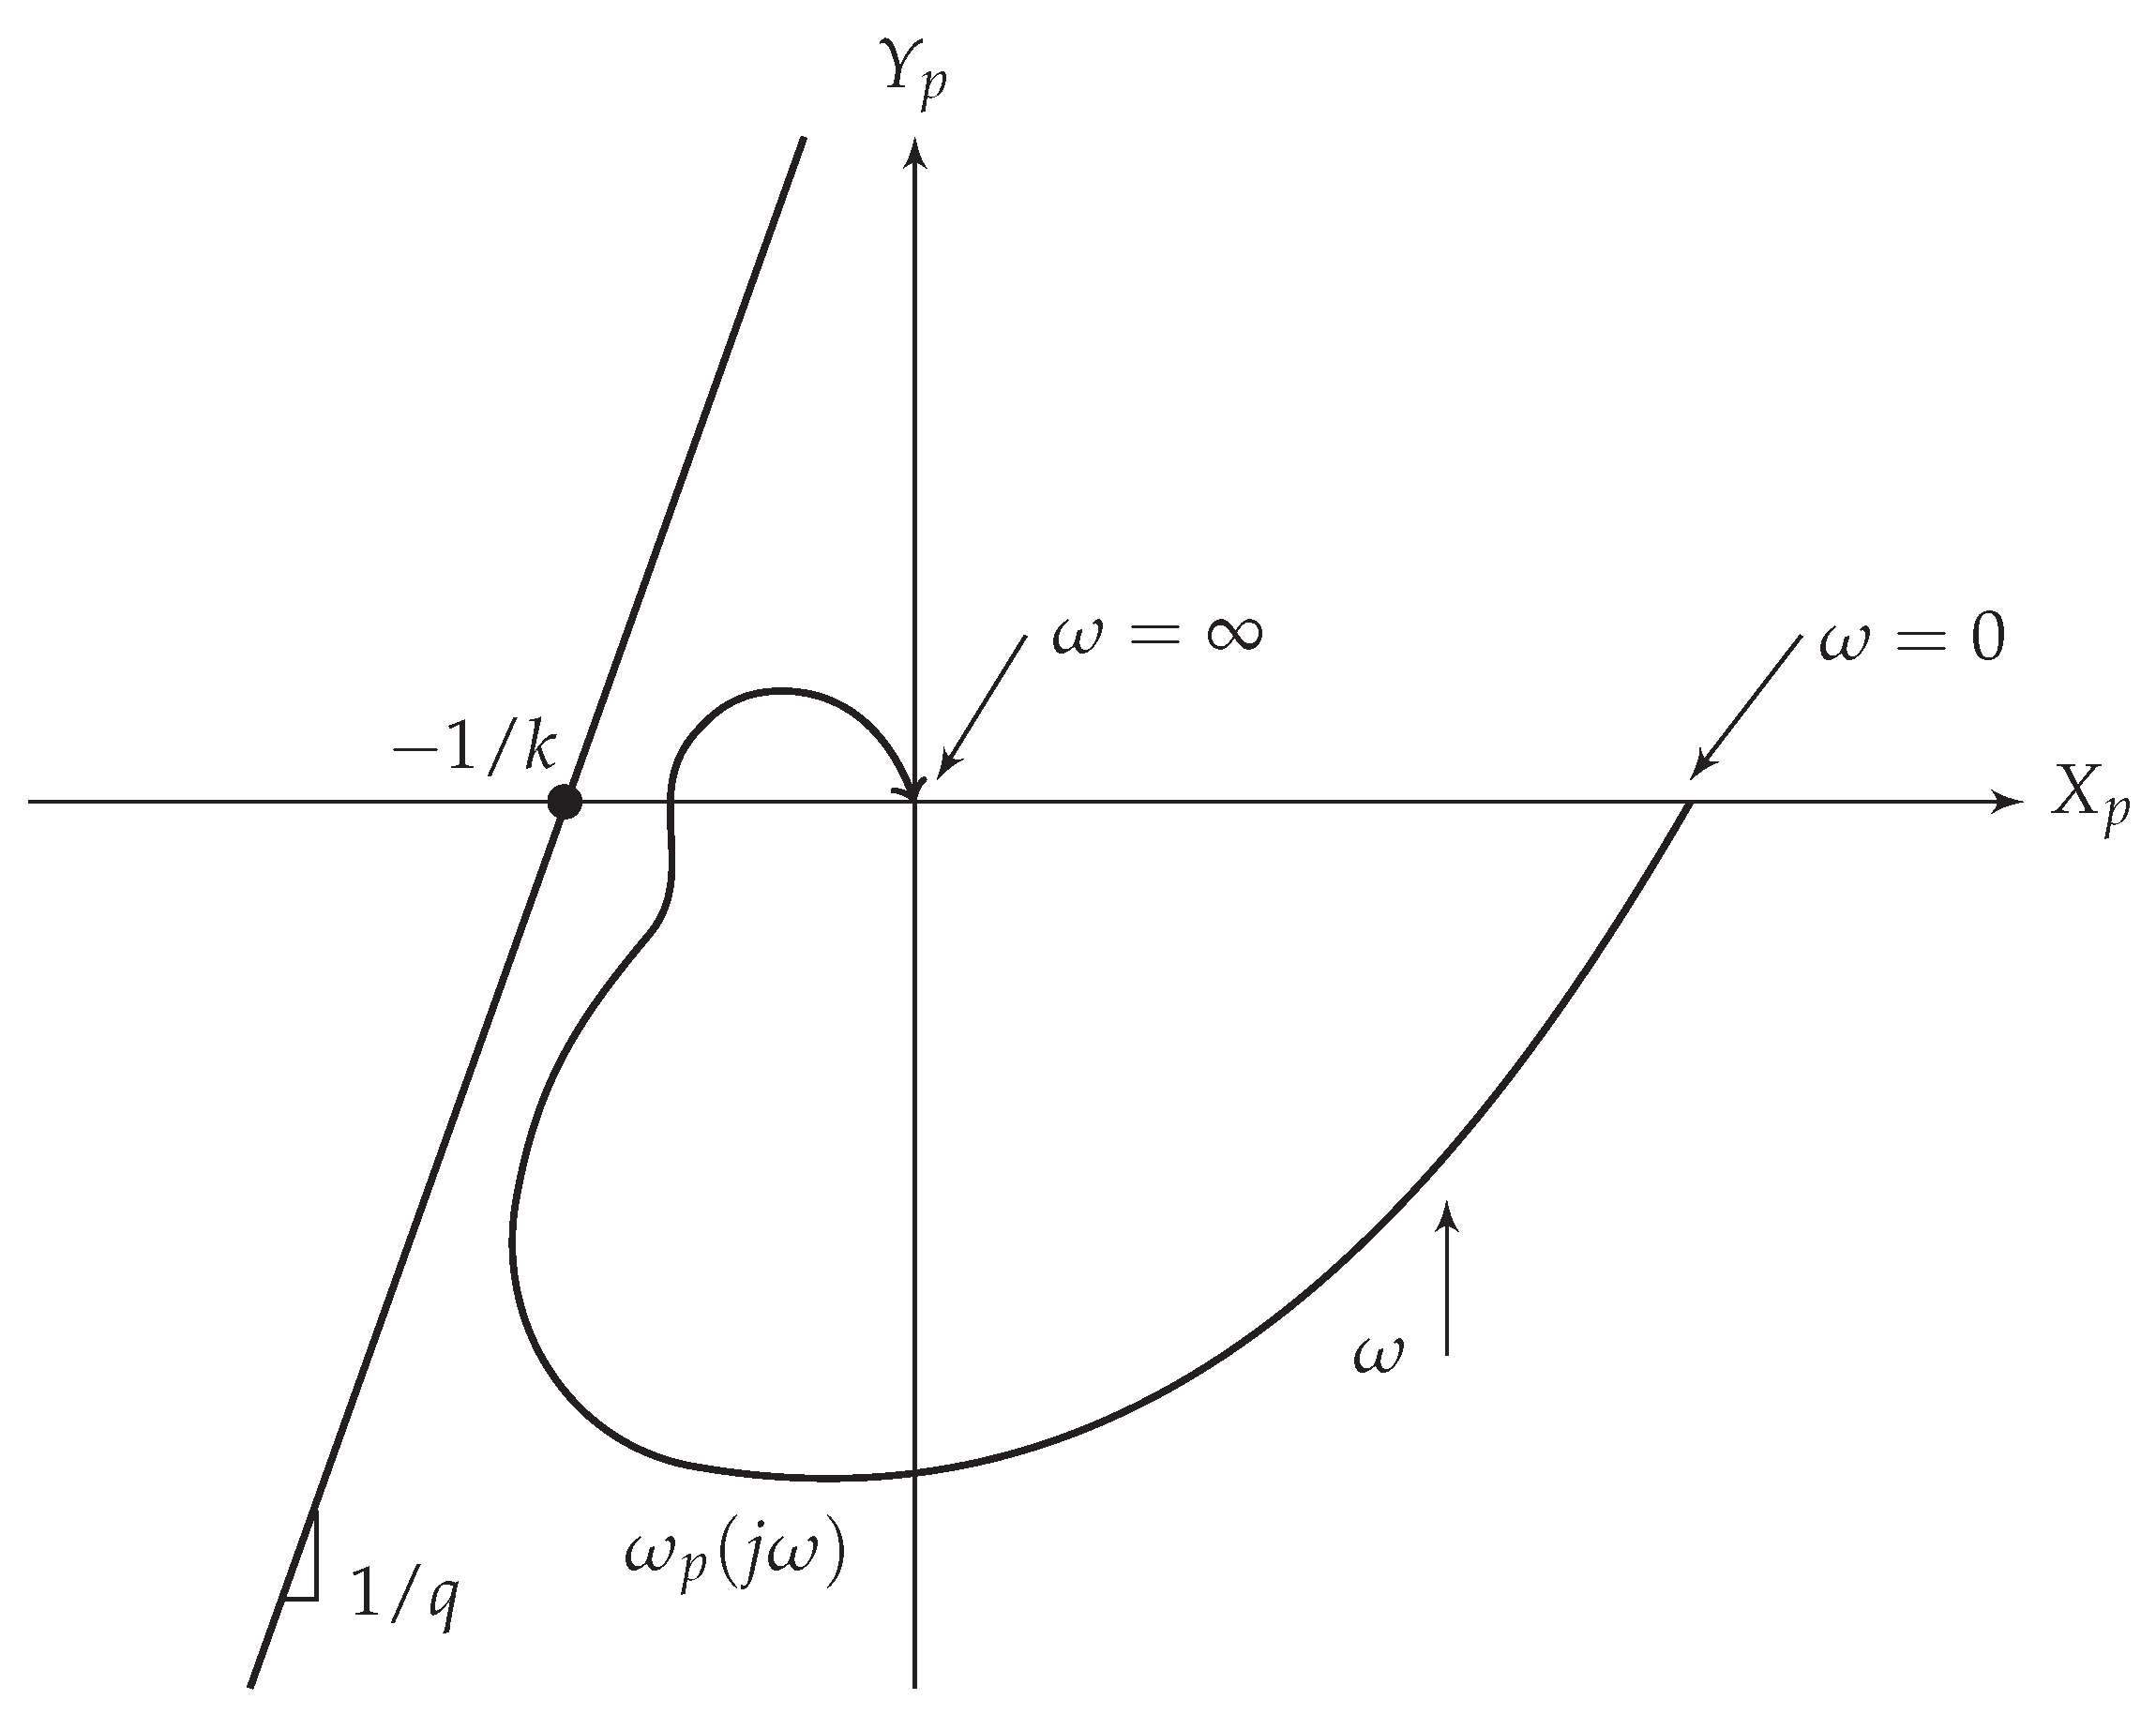
one can plot the “Popov plot”, shown in
Figure 2. In this figure, if the plot is indeed in the right-half plane defined by the straight line with slope
which intersects with x-axis at
, then the conditions of the Popov criterion hold, and the equilibrium point of (
1) is globally asymptotically stable, for every
. We proceed by describing the implementation of this criterion in power system dynamic models.
2.2. Dynamic Stability of a Synchronous Generator, Connected to a Non-Linear Frequency Dependent Load
Consider a system consisting of a synchronous generator connected to non-linear load. We adopt an idealized model, where all the power generated is transferred without loss directly to the load. The system is described by the following differential equation:
where
represents the moment of inertia of the rotor,
is the electrical frequency of the rotor,
stands for the damping coefficient, and without loss of generality,
represents the reference power, where
is the nominal angular velocity. The power consumed by the load is a general non-linear function of the electrical angular frequency
. For the system (
4) there is at least one equilibrium point located at
. It is trivial to verify that linearizing (
4) in a small neighborhood of the equilibrium point
leads to
where
, so the equilibrium point
is
locally asymptotically stable if
We extend here this well-known result by providing a sufficient condition for
global asymptotic stability of the equilibrium
, that is, we provide a condition under which any trajectory
of (
4) converges to
as
, from any initial point. Our main claim consists of two parts, and it is the following one:
Theorem 1.
Consider the dynamic system (4) with a load profile , which is generally a nonlinear but continuous function of ω. If there exists a constant k such that
for all , then the equilibrium point is the only equilibrium point of (4), and it isglobally asymptotically stable
.
In addition, if is differentiable at , and , or equivalently
then the equilibrium isunstable
.
Proof. We start by proving the second part of the theorem, the instability condition given in (
8). Examine the linearized system described in (
5). It is clear that this system has one real pole with value
. A strictly positive pole means that the equilibrium point
is unstable, thus, the system is unstable if
which is the same as
and by definition of the derivative, we get
Now, the following equivalent expression may be used
Substituting (
12) in (
10) results in
which completes the proof for the instability condition in (
8).
Now, we proceed to prove the first claim in the main theorem, the stability condition given in (
7), based on Popov’s criterion. Let us define
and
. Substitute these values in (
4) to obtain
Assuming condition (
7) is true, we now show that (
2) holds. For the choice of
and
, the transfer function of the system is
Following, we shall now find
and a small and positive constant
that satisfy (
2). Substitution of (
15) in the right expression of (
2) results in
For the choice of
we can directly choose the lower bound to be
. Now, by analysing the “Popov plot” we find the values of
for which (
2) holds. To plot the “Popov plot”, we rely on
Notice that by taking
the resulting point on the “Popov plot” is
, and for
the point on the “Popov plot” is
. Between these points the transfer function is continuous and is shaped like a quarter of a circle. By the geometric interpretation of (
2), it is sufficient to find a straight line, with a slope of
that intersects the x-axis at
, and is located strictly to the left of the plot of the “Popov plot” of the transfer function. In this case, it is clear that for every choice of a positive slope, the “Popov plot” of the transfer function will be strictly to the right of this straight line, in particular for the value of
. Consequently, if condition (
7) holds, then there exist
and a small positive constant
such that (
2) holds, meaning that the equilibrium is globally asymptotically stable, as desired. □
The following corollary can be used to analyze the stability of a typical small power system, in which a synchronous machine is feeding a general frequency dependant impedance .
Corollary 1.
If the load power is given by
where is constant, is bounded from above, is bounded from below by a positive constant, , and
for all , then the equilibrium point is the only equilibrium point of (4), and it is globally asymptotically stable.
Proof. To prove this statement, we show that it satisfies the conditions of Theorem 1. Substituting (
18) and
in Corollary 1 results in
which yields directly the lower bound:
Following, using the fact that
is constant,
, and
, we proceed to determine the upper bound. Examining the expression
and substituting (
18), results in
For
and
the expression (
23) is well defined, and the upper and lower bounds can be calculated directly. Let us denote them by
respectively. In the regions
and
the expression (
23) is continuous, thus there are no additional extremum points that can be found there. Finally, consider the limit
We now show that this limit exists, and is finite. That is, our goal is to prove that
We rely on the following assumptions presented in Theorem 1:
There exists such that ,
There exists such that ,
.
Examining the limit (
24) again, application of L’Hopital’s rule results in
Since
, we have that
. Hence, the following limits are well defined:
,
,
,
.
Therefore, the original limit we are interested in is equal to
Note that, depending on the system’s parameters, it is possible to get
or
. In each case, the value of
C is a candidate for upper or lower limit respectively. w.l.o.g. assuming
we deduce it is a candidate for the upper bound. Consequently, (
22) is bounded by
where
and
. Thereby, the conditions of Theorem 1 holds in this unique case, meaning that
is indeed the only equilibrium point of (
4), and it is globally asymptotically stable. □
2.3. Synchronous Machine Driving a Resistive-Inductive Load
In this case study, we analyze a system in which the nonlinear load has a resistive-inductive behavior. The main claim used for the analysis is Corollary 1. Our aim is to find the minimal value of
D which bounds from above the expression (
19), which is derived from the active power of the system. For this type of model, the active power is given by
Substitution of (
29) in (
30) leads to
Re-writing this equation results in
or alternatively
Next, we aim to find the minimal value that bounds (
33) from above. For this purpose, notice that the expression given in (
33) consists of continuous functions of
. Hence, the derivative may be calculated directly and is given by
which critical points are
Since
, the only valid root is
, so to analyze (
34) we examine its behavior close to the critical point
. Given that
and
, it is sufficient to look at the sign of the expression
. When
, the derivative (
34) is negative, and when
, the expression (
34) is positive, meaning that
is a maximum point. Consequently, the upper bound may be defined as
This results in a strict upper bound for the expression given in (
33). Indeed, the condition given in (
19) holds, therefore,
is the only global asymptotic equilibrium point of the given system, as desired, and a simplified expression is
Notice that the active power at the operating point is given by
and the reactive power at the operating point is defined as
. We therefore have
. Substituting these terms in (
37) produces
which is the same as
Re-arranging the terms in the expression above, yields
or
which may be written as
thereby leading to
In conclusion, using the fact that
, the bound on
D may be presented in the following way
2.4. Synchronous Machine Driving a Lossless Synchronous Motor, with a Quasi-Linear Mechanical Load
Examine the following non-linear load function:
where
is given by
where
.
To prove that
is indeed the global asymptotic stable point, we aim to prove that the conditions of Theorem 1 hold. We start by analyzing separately the domains
and
. Define two constants for each domain
which denote the upper and lower bound of
accordingly. Following, the global upper and lower bounds are given by
and
, where the superscript
denotes the domain. Consider the domain
, the expression that we are interested in is given by
Alternatively, we have
which is equal to
This can be further simplified as follows:
Using the extreme value theorem, since the expression (
47) is continuous on a closed and bounded interval
, it must attain a minimum and maximum values there. Moreover, since the function is monotonic, it is assured it will attain them only once on this interval. Hence, (
50) is bounded from below by
, and since it is monotonically increasing, the maximum value is obtained at
and equals to
. Next, looking at the domain
, substituting (
45) in the expression (
47) equals to
which yields
Note that
since
. Hence, the function (
52) is continuous and strictly monotonically decreasing on the interval
, which leads to a lower bound
which reduces to
The upper bound on this interval can be calculated by examining the limit
, which is
Consequently, we can choose
as the upper bound on the current interval. Summarizing, we can globally bound (
47) from below by
where the global upper bound is
This proves that the conditions of Theorem 1 hold, and therefore is indeed the global asymptotic equilibrium point, as desired.
3. Numeric Results
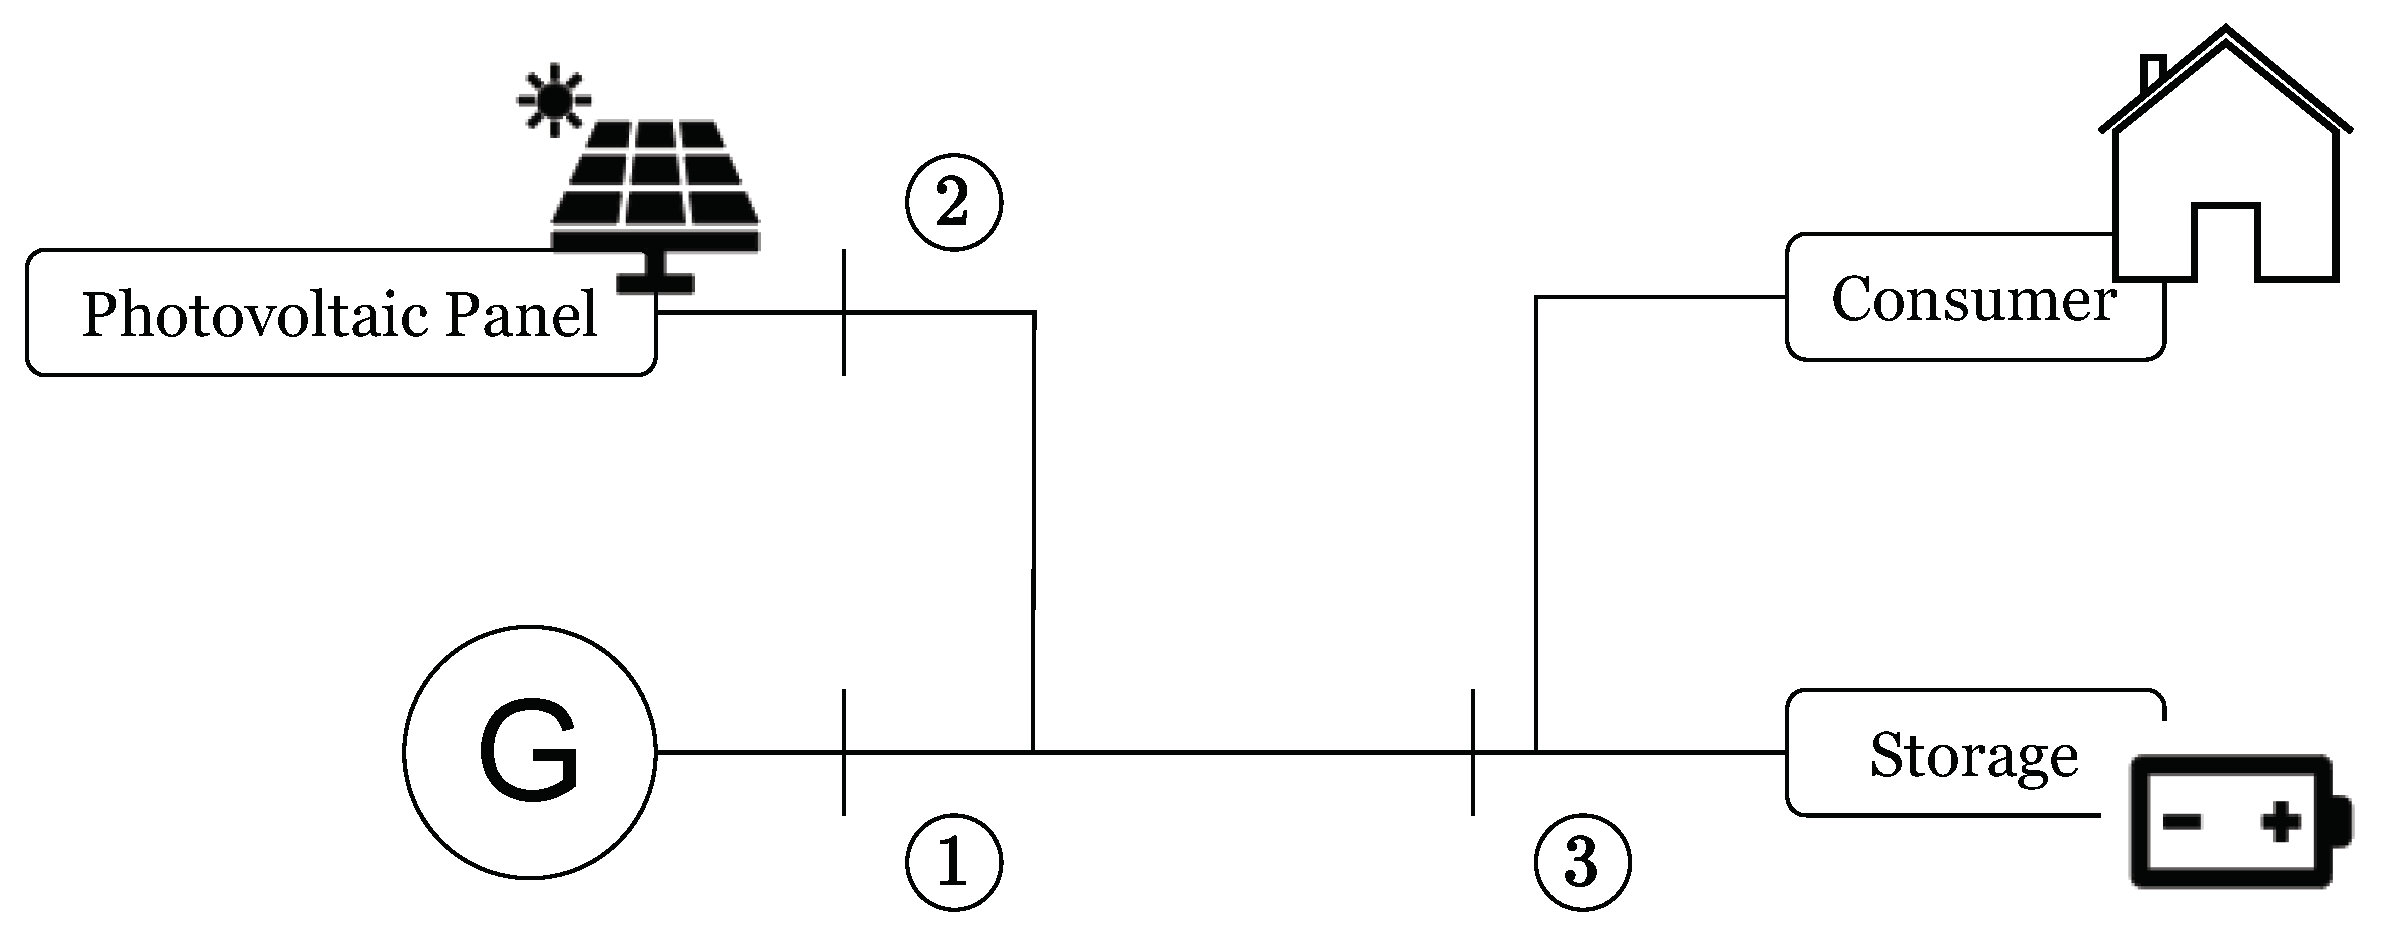
To demonstrate this result, we consider here the classical problem of managing an ideal grid connected storage device, and focus on the behavior of the poles given different values of the damping coefficient of the generator. Consider a microgrid system comprising a grid-connected ideal storage device and a photovoltaic (PV) panel, as illustrated in
Figure 3.
The storage device is charged by both the grid and the PV, and supplies an aggregated load characterized by its active power consumption. The load’s active power demand, represented by a continuous, positive function , is defined over a finite time interval , where T is a known constant. The power generated by the PV panel is modeled as a piecewise continuous, non-negative function . The net power consumption of the load is given by . The rate of charge or discharge of the storage device is described by , where is the power supplied by the grid, and is the power flowing into the storage device. Additionally, the quantities , and represent the generated energy, the load energy, and the stored energy, respectively. These energy values are derived from their corresponding power functions via the relation .
To verify our finding we performed a MATLAB simulation, using Simulink to model the storage device as an R-L circuit, using the idea presented in [
24] and the analysis presented in
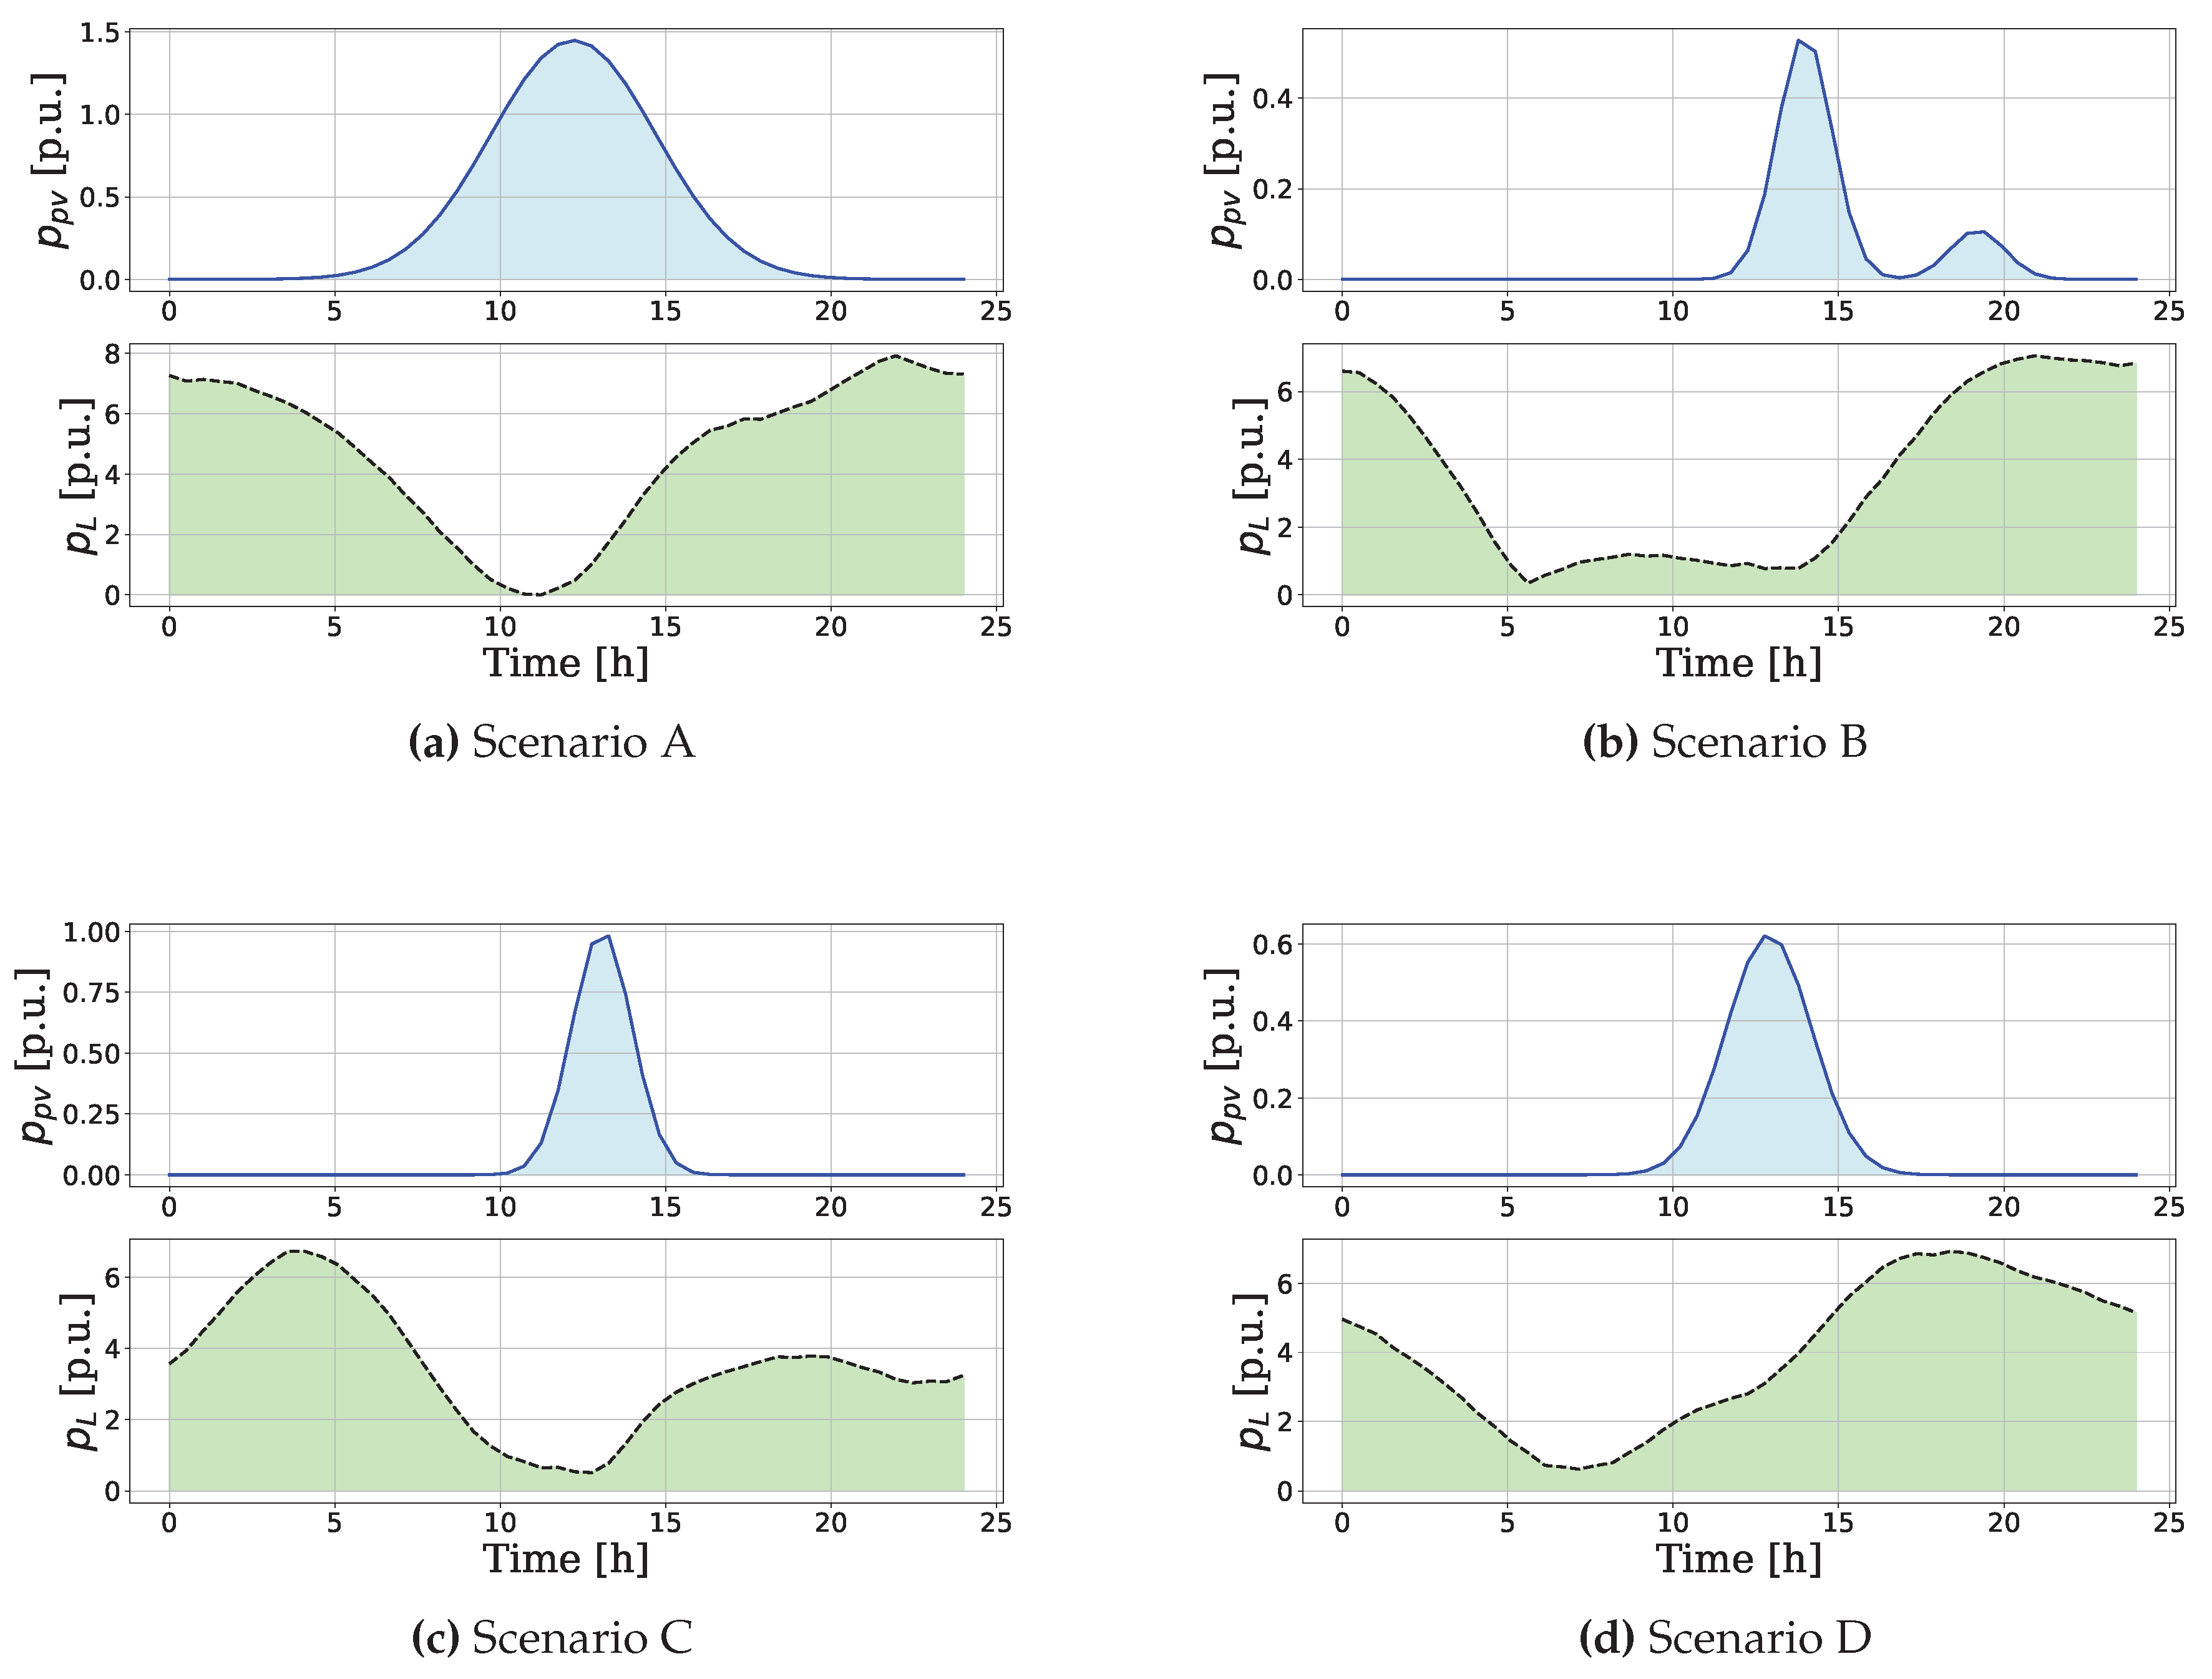
Section 2.3. The solar generation and the consumption profiles are presented in
Figure 4.
The critical value of the bound
D which defines the stability condition is
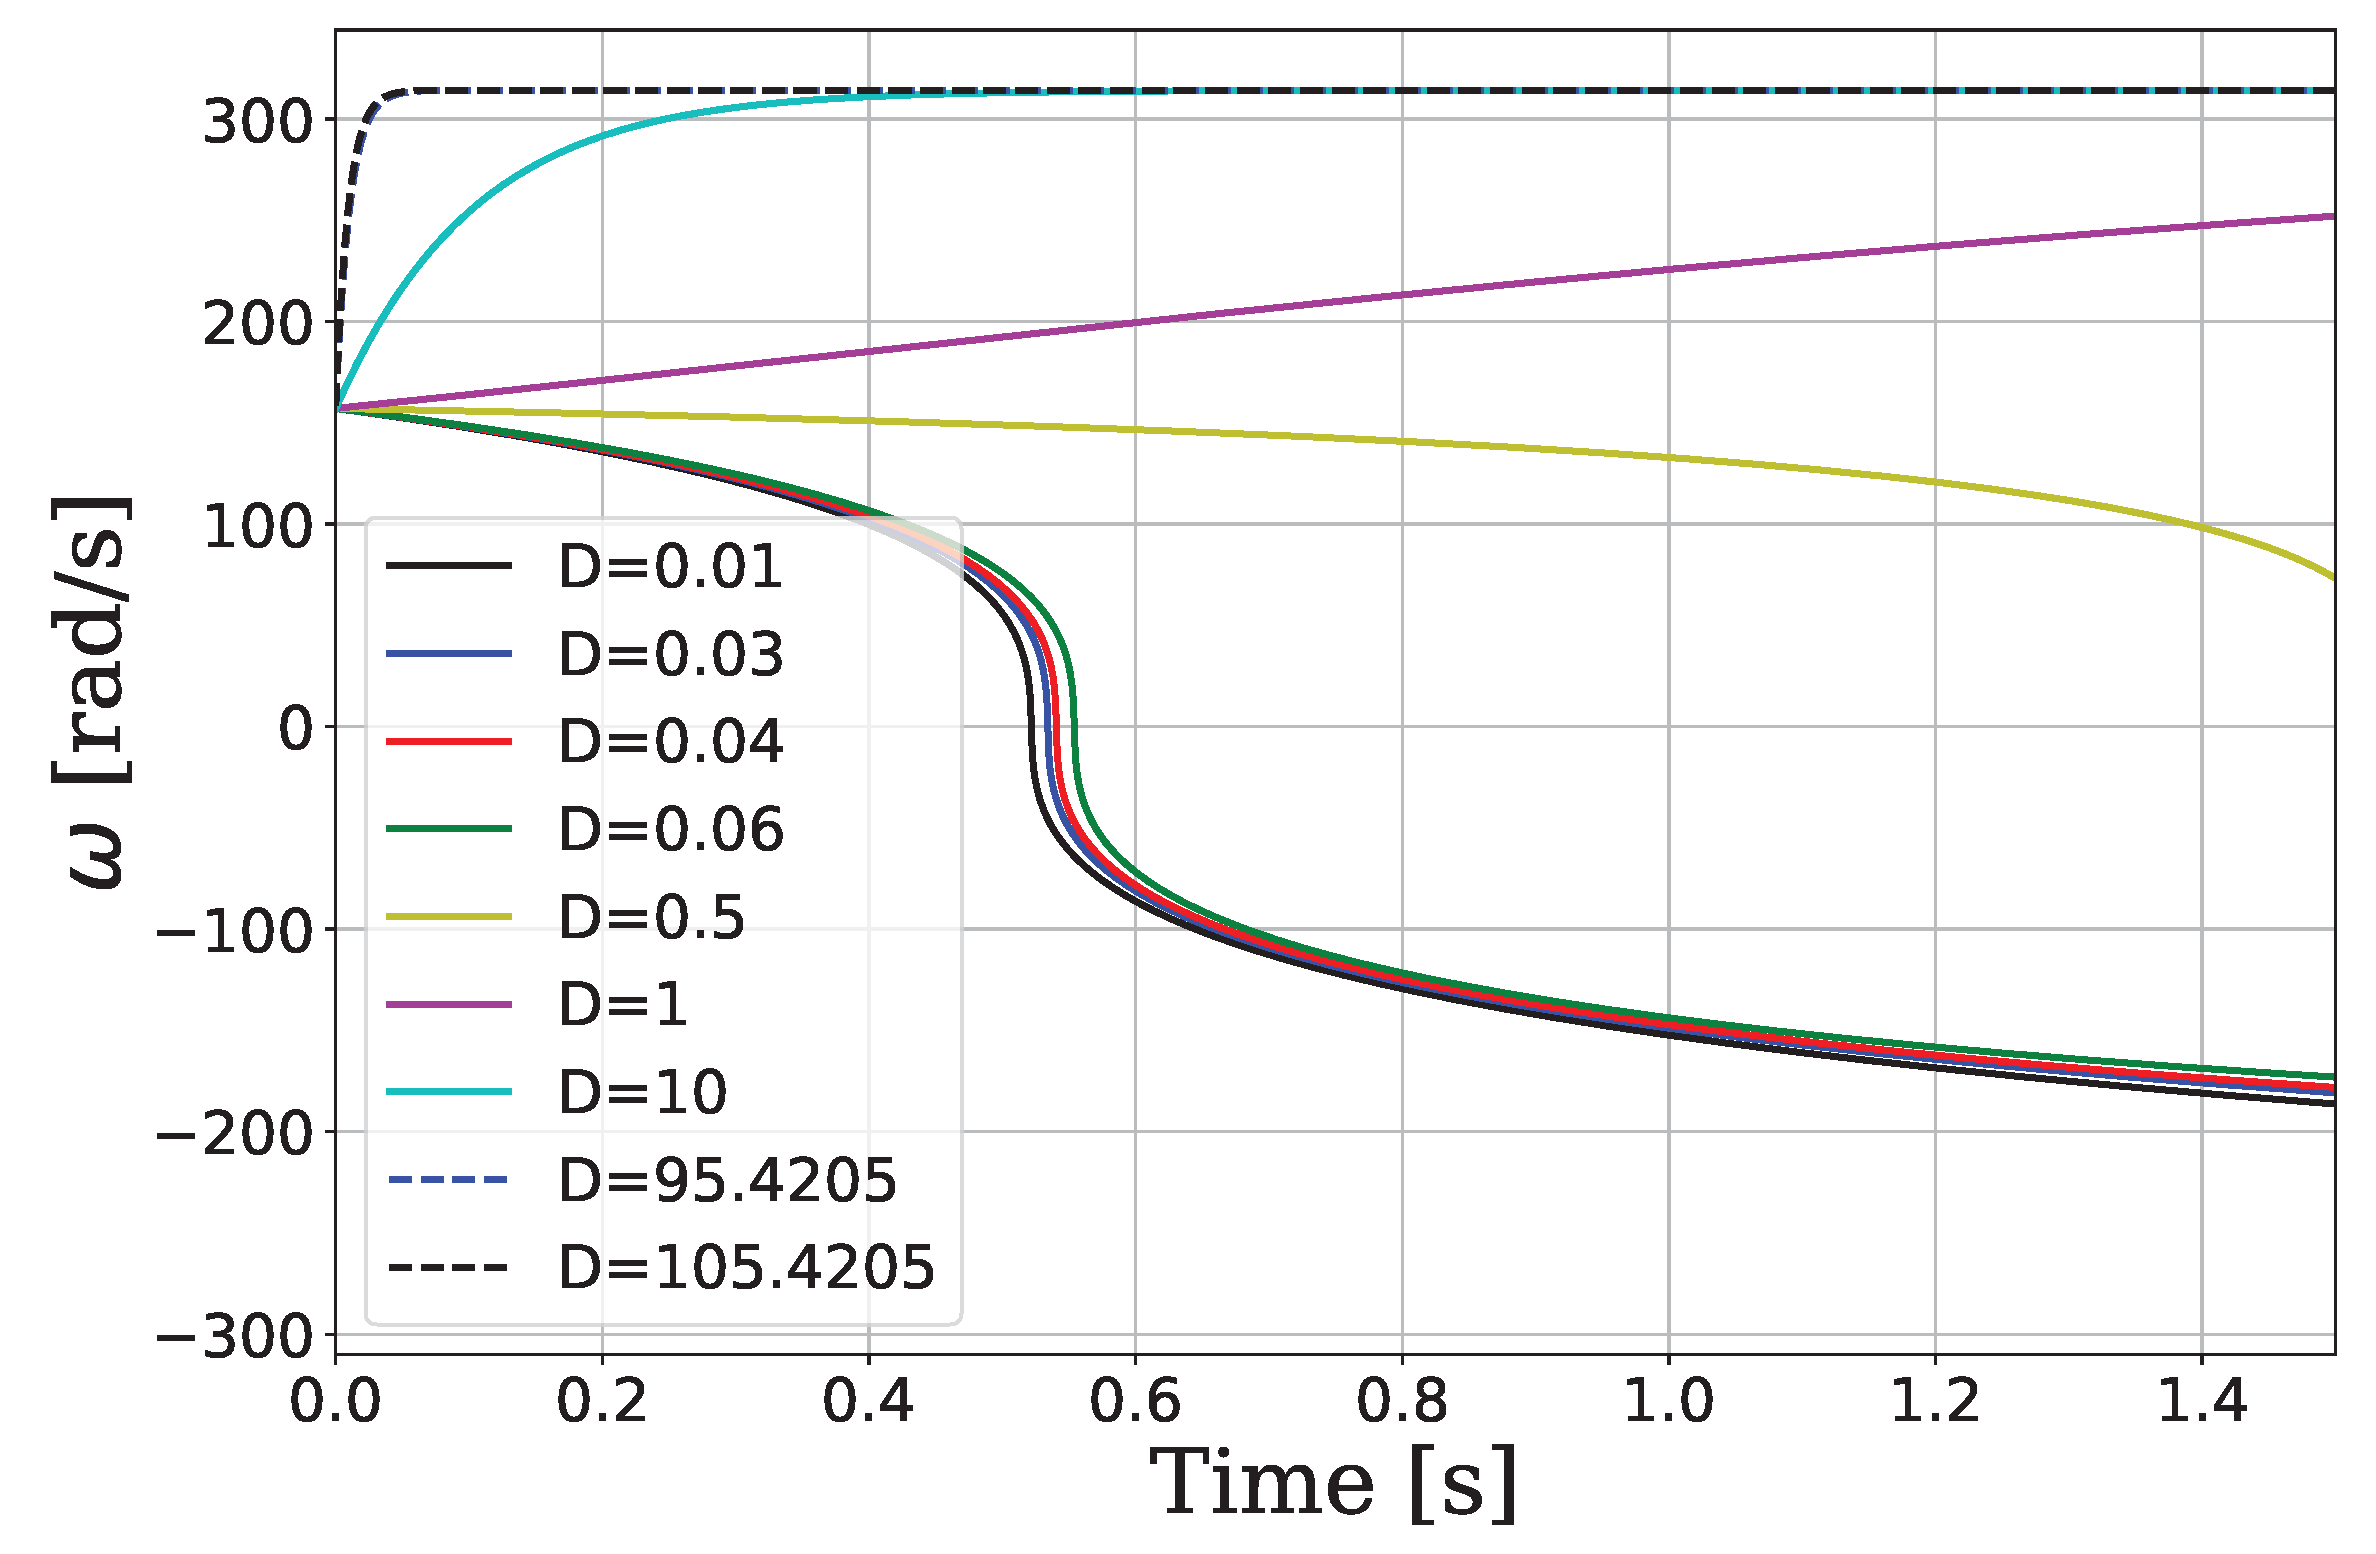
. Performing the simulation for different values of D, shows clearly that for all values of D which are above the threshold value
, the system is stable and the frequency converges to the globally asymptotically stable point
. On the contrary, for all values of D that are beneath the threshold
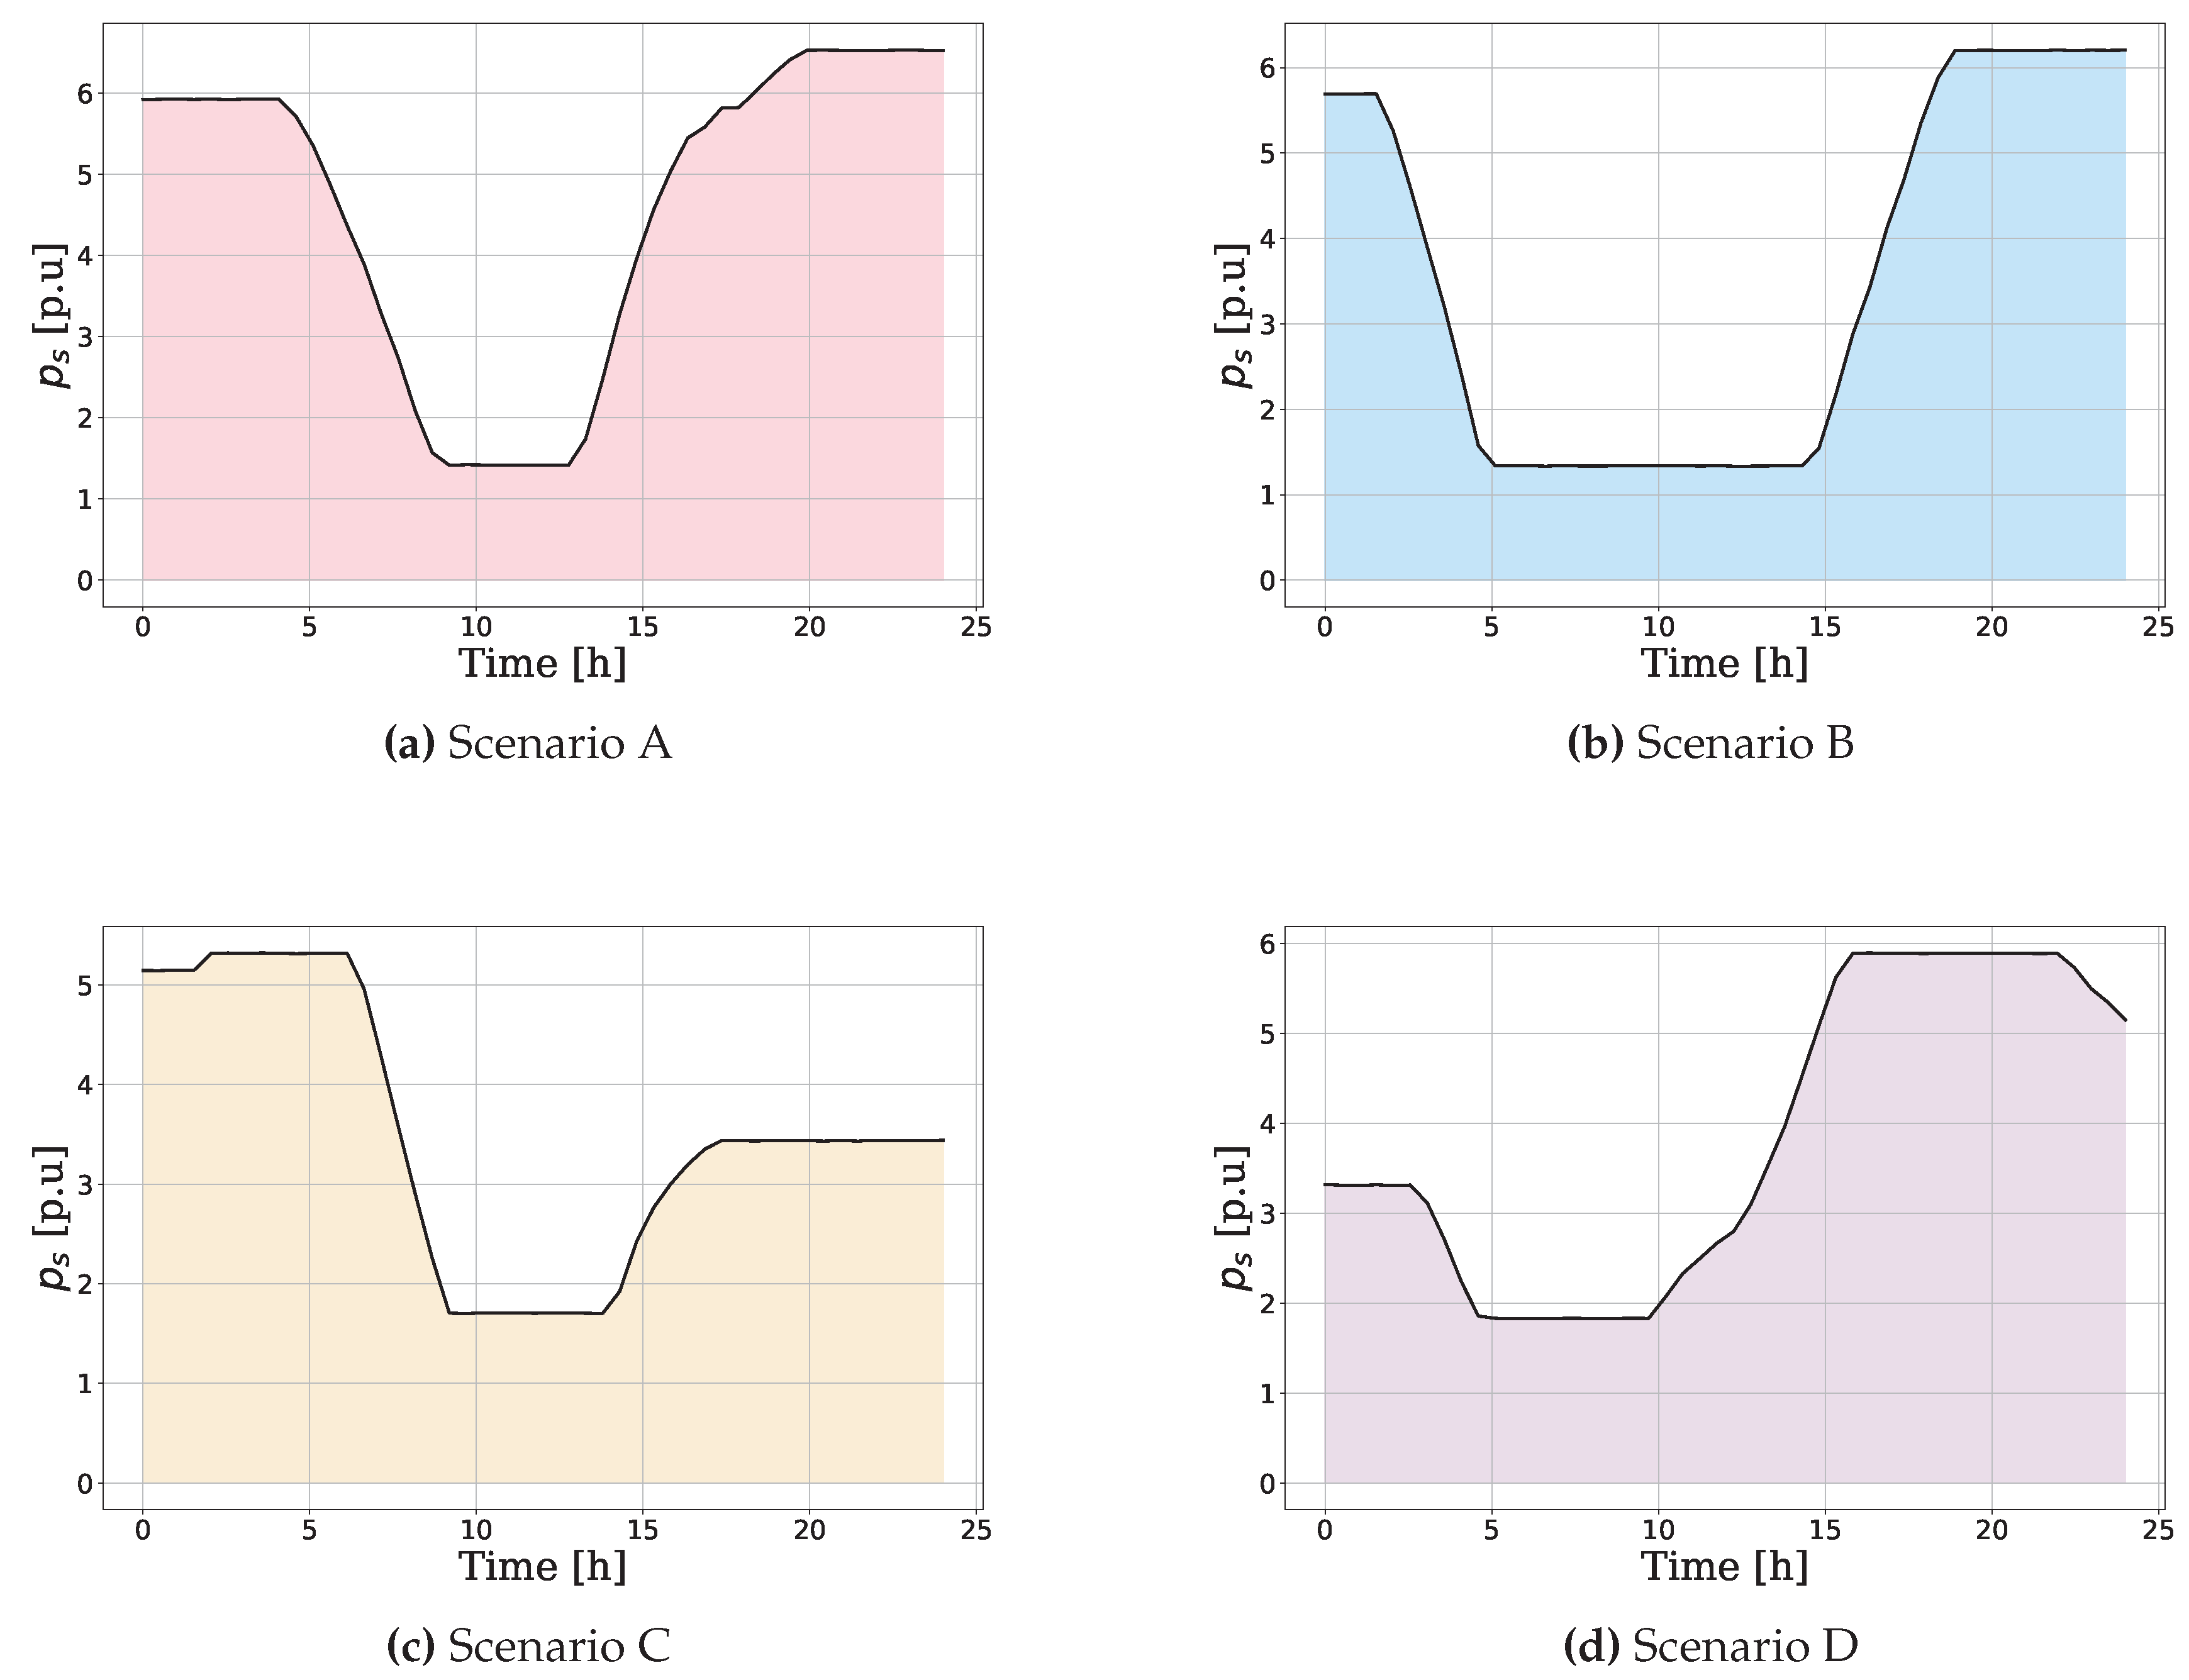
the system diverges. For values of D in which the system is stable, the scheduling policy of the storage device is presented in
Figure 5.
Examining
Figure 6, it can be observed how for different values of
D, the frequency either stabilizes on the unique global stable point
, or diverges.
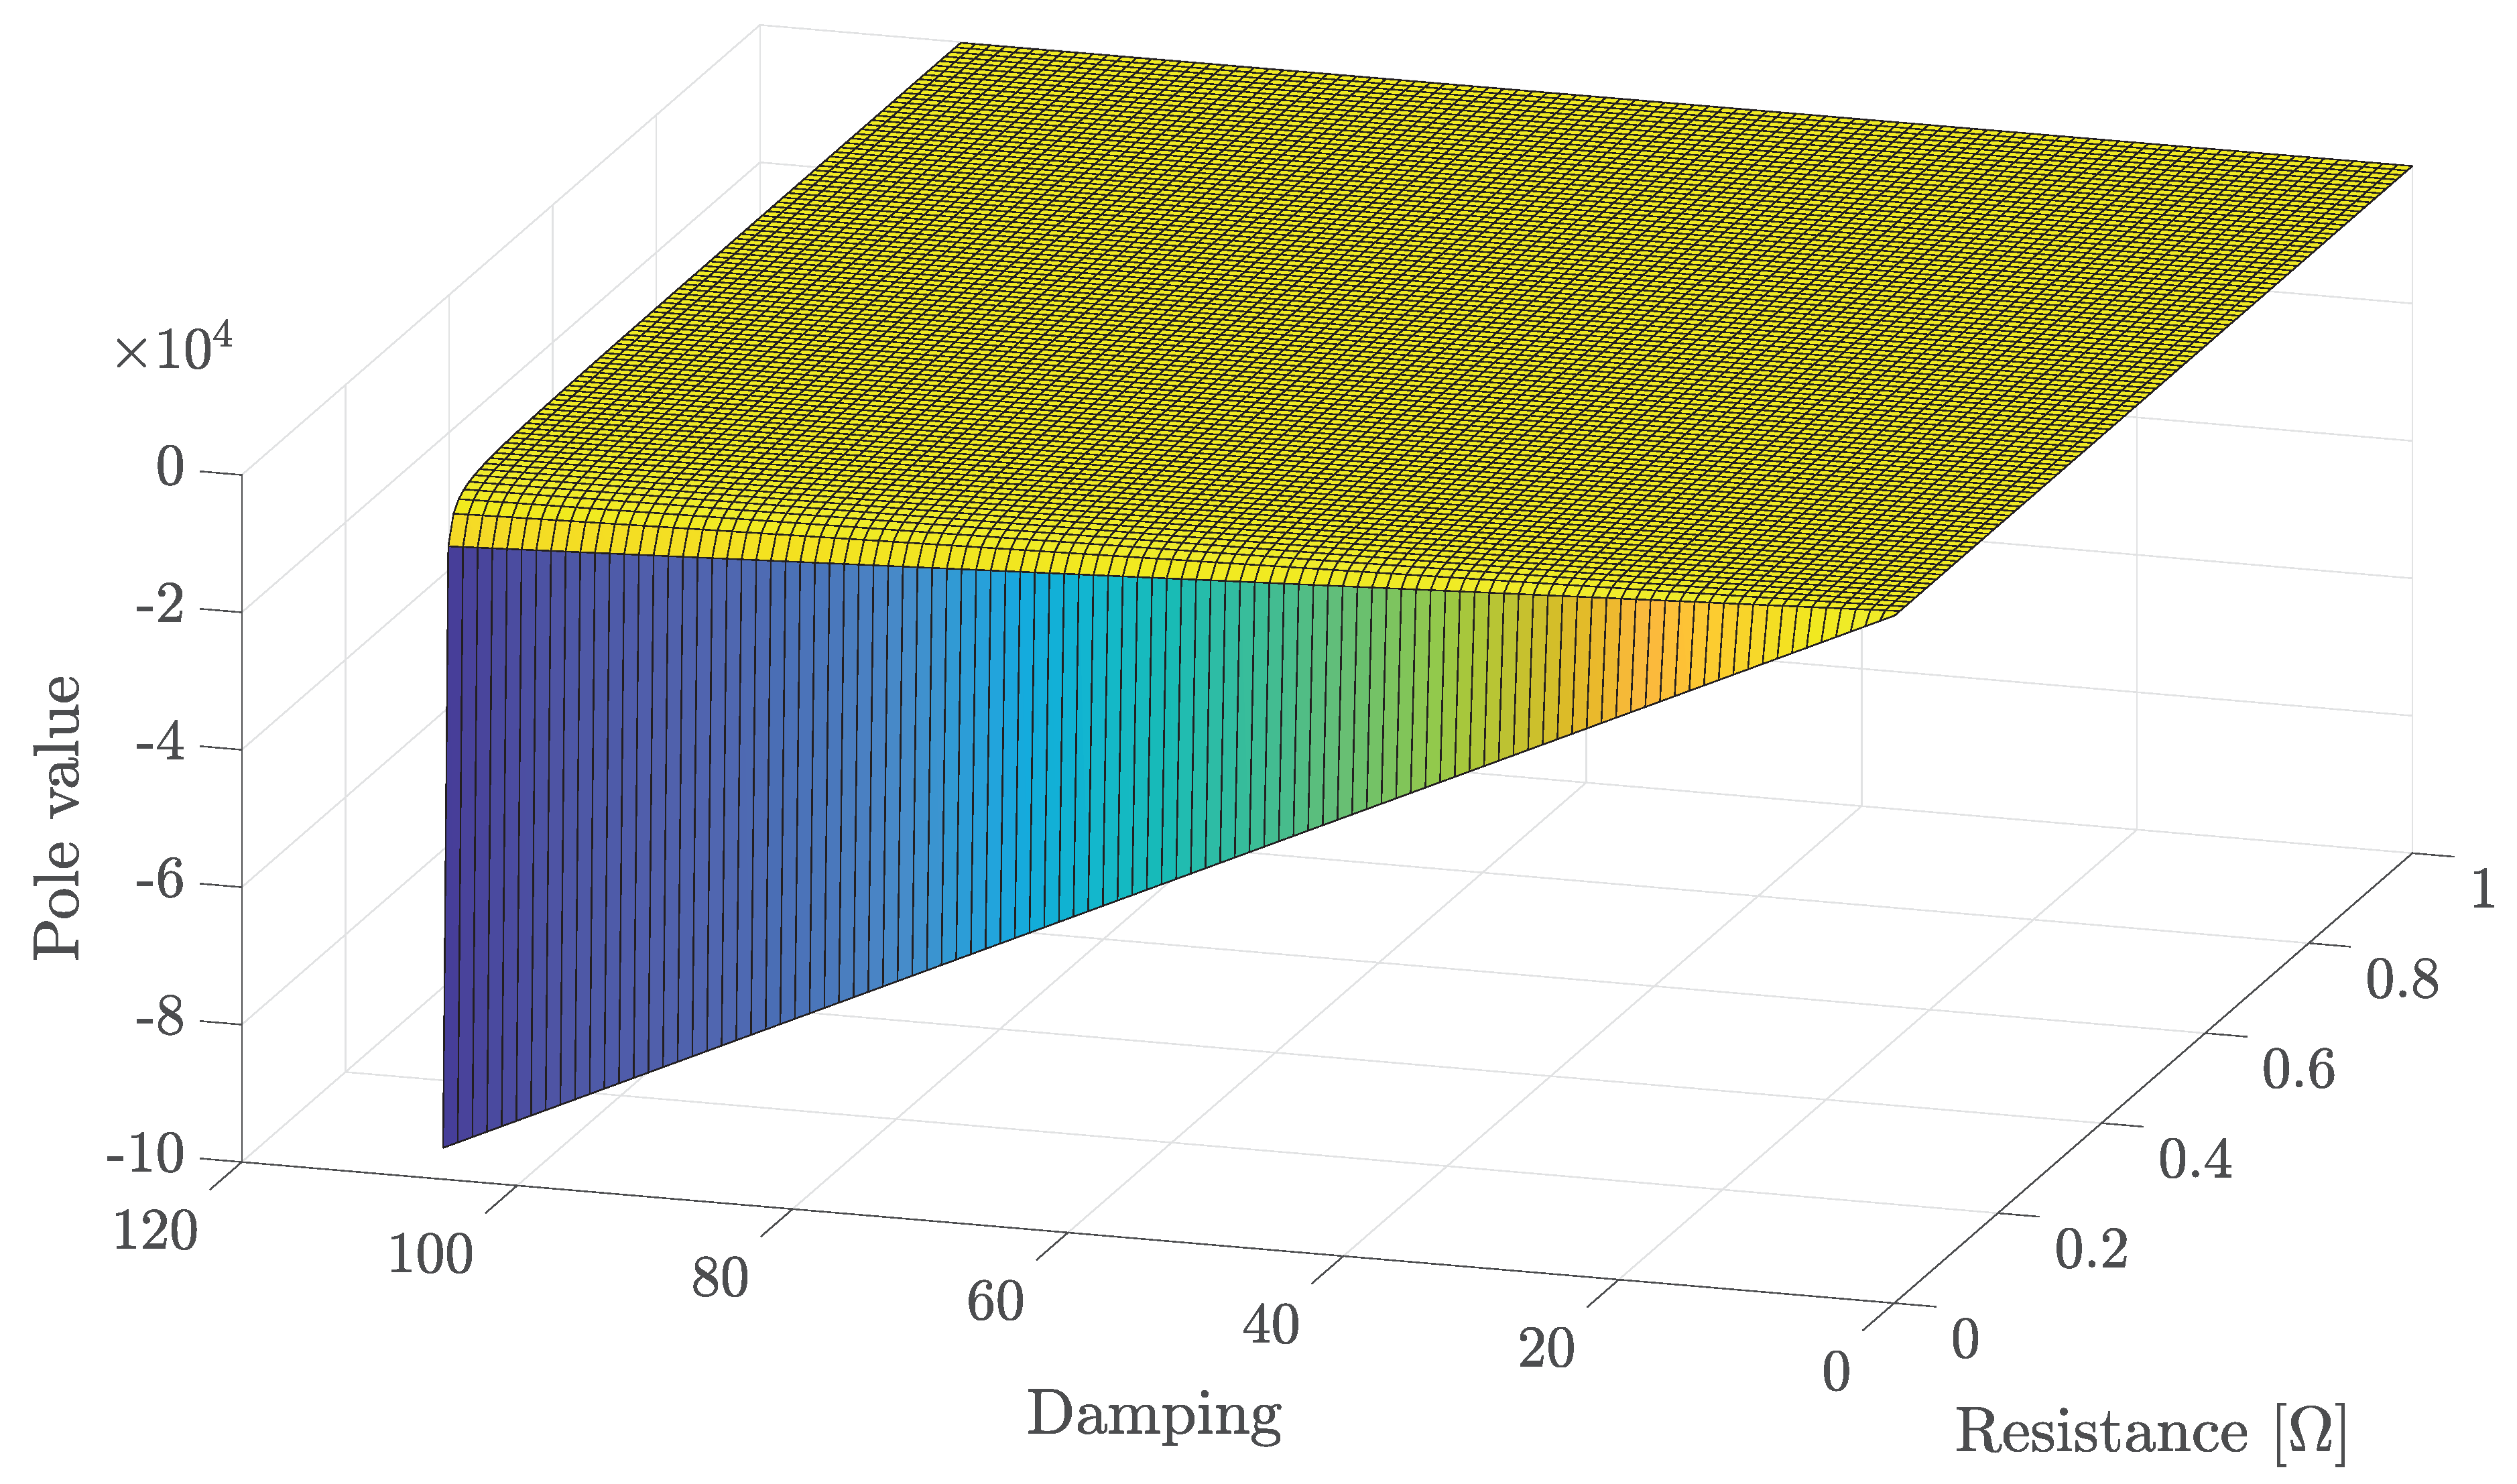
Figure 7 presents how the poles move as the values of the damping coefficient
D and the resistance R changes, thus showing the transition of the system from a stable to an unstable state. We examine the following values of the resistance
in units of
, and the damping coefficient values tested are
.
4. Discussion & Conclusions
Stability problems in power systems are typically explored using one of three main approaches: numerical methods, linearization techniques, or direct methods, which utilize Lyapunov energy functions. This paper belongs to the third category, and highlights the usefulness of the Popov stability criterion in the analysis of nonlinear power system models. The main advantage of this criterion is that it provides conditions for global asymptotic stability of an equilibrium point. This stands in contrast to linearization techniques, which only provides conditions for local stability. We show a general method to apply this stability criterion, and examine its uses in several specific applications. More specifically, we examine small power systems such as synchronous machine driving a resistive-inductive load and a synchronous machine driving a lossless synchronous motor, with a quasi-linear mechanical load. Following we rely on a simplified model of a storage device that is powered by a synchronous machine, to analyze the frequency stability for varying system parameters. For instance, we evaluate for which practical parameters of the storage and the synchronous machine, such as the resistance and damping coefficient, the equilibrium is globally asymptotically stable.
Author Contributions
Conceptualization, E.G. and Y.L.; methodology, Y.L; software, E.G. and Y.L.; validation, E.G. J.B and L.K.; formal analysis, E.G. and Y.L.; writing—original draft preparation, E.G.; writing—review and editing, E.G. and Y.L.; visualization, E.G. and J.B.; supervision, Y.L.; Funding acquisition J.B. All authors have read and agreed to the published version of the manuscript.
Funding
The work of J. Belikov was partly supported by the Estonian Research Council grant PRG1463.
Institutional Review Board Statement
Not applicable.
Data Availability Statement
Conflicts of Interest
The authors declare no conflict of interest.
References
- Kundur, P. Power System Stability and Control; McGraw-Hill, 1994.
- Kundur, P.; Paserba, J.; Ajjarapu, V.; Andersson, G.; Bose, A.; Canizares, C.; Hatziargyriou, N.; Hill, D.; Stankovic, A.; Taylor, C.; Van Cutsem, T.; Vittal, V. Definition and classification of power system stability IEEE/CIGRE joint task force on stability terms and definitions. IEEE Transactions on Power Systems 2004, 19, 1387–1401. [Google Scholar] [CrossRef]
- Caliskan, S.Y.; Tabuada, P. Compositional Transient Stability Analysis of Multimachine Power Networks. IEEE Transactions on Control of Network Systems 2014, 1, 4–14. [Google Scholar] [CrossRef]
- Fernández-Guillamón, A.; Gómez-Lázaro, E.; Muljadi, E.; Ángel Molina-García. Power systems with high renewable energy sources: A review of inertia and frequency control strategies over time. Renewable and Sustainable Energy Reviews 2019, 115, 109369. [Google Scholar] [CrossRef]
- Meegahapola, L.; Sguarezi, A.; Bryant, J.S.; Gu, M.; Conde D., E. R.; Cunha, R.B.A. Power System Stability with Power-Electronic Converter Interfaced Renewable Power Generation: Present Issues and Future Trends. Energies 2020, 13. [Google Scholar] [CrossRef]
- H. Bevrani, A. Ghosh, G.L. Renewable energy sources and frequency regulation: survey and new perspectives. IET Renewable Power Generation 2010, 4, 438–457. [Google Scholar] [CrossRef]
- Golpîra, H.; Atarodi, A.; Amini, S.; Messina, A.R.; Francois, B.; Bevrani, H. Optimal Energy Storage System-Based Virtual Inertia Placement: A Frequency Stability Point of View. IEEE Transactions on Power Systems 2020, 35, 4824–4835. [Google Scholar] [CrossRef]
- Mosca, C.; Arrigo, F.; Mazza, A.; Bompard, E.; Carpaneto, E.; Chicco, G.; Cuccia, P. Mitigation of frequency stability issues in low inertia power systems using synchronous compensators and battery energy storage systems. IET Generation, Transmission & Distribution 2019, 13, 3951–3959. [Google Scholar] [CrossRef]
- Serban, I.; Teodorescu, R.; Marinescu, C. Energy storage systems impact on the short-term frequency stability of distributed autonomous microgrids, an analysis using aggregate models. IET Renewable Power Generation 2013, 7, 531–539. [Google Scholar] [CrossRef]
- Süli, E.; Mayers, D.F. An introduction to numerical analysis; Cambridge university press, 2003.
- Nielsen, K.L. Methods in numerical analysis.; MACMILLAN, 1956.
- Montoya, O.D.; Gil-González, W. On the numerical analysis based on successive approximations for power flow problems in AC distribution systems. Electric Power Systems Research 2020, 187, 106454. [Google Scholar] [CrossRef]
- Socha, L. Linearization methods for stochastic dynamic systems; Springer Science & Business Media, 2007.
- Liang, X. Linearization Approach for Modeling Power Electronics Devices in Power Systems. IEEE Journal of Emerging and Selected Topics in Power Electronics 2014, 2, 1003–1012. [Google Scholar] [CrossRef]
- Sun, J. Small-Signal Methods for AC Distributed Power Systems–A Review. IEEE Transactions on Power Electronics 2009, 24, 2545–2554. [Google Scholar] [CrossRef]
- Persson, J.; Söder, L. Comparison of threes linearization methods. Proceedings of 16th Power System Computation Conference, Power Systems Computation Conference ( PSCC ), 2008;, 2008.
- Slotine, J.J.E. Applied nonlinear control; Pearson, 1991.
- Isidori, A. Nonlinear control systems: an introduction; Springer, 1985.
- Willems, J. Direct method for transient stability studies in power system analysis. IEEE Transactions on Automatic Control 1971, 16, 332–341. [Google Scholar] [CrossRef]
- Chang, H.D.; Chu, C.C.; Cauley, G. Direct stability analysis of electric power systems using energy functions: theory, applications, and perspective. Proceedings of the IEEE 1995, 83, 1497–1529. [Google Scholar] [CrossRef]
- Zhai, C.; Nguyen, H.D. Estimating the Region of Attraction for Power Systems Using Gaussian Process and Converse Lyapunov Function. IEEE Transactions on Control Systems Technology 2022, 30, 1328–1335. [Google Scholar] [CrossRef]
- Kazemi, A.; Motlagh, M.J.; Naghshbandy, A. Application of a new multi-variable feedback linearization method for improvement of power systems transient stability. International Journal of Electrical Power & Energy Systems 2007, 29, 322–328. [Google Scholar] [CrossRef]
- Tzounas, G.; Dassios, I.; Milano, F. Small-signal stability analysis of implicit integration methods for power systems with delays. Electric Power Systems Research 2022, 211, 108266. [Google Scholar] [CrossRef]
- Yang, J.; Cai, Y.; Pan, C.; Mi, C. A novel resistor-inductor network-based equivalent circuit model of lithium-ion batteries under constant-voltage charging condition. Applied Energy 2019, 254, 113726. [Google Scholar] [CrossRef]
|
Disclaimer/Publisher’s Note: The statements, opinions and data contained in all publications are solely those of the individual author(s) and contributor(s) and not of MDPI and/or the editor(s). MDPI and/or the editor(s) disclaim responsibility for any injury to people or property resulting from any ideas, methods, instructions or products referred to in the content. |
© 2024 by the authors. Licensee MDPI, Basel, Switzerland. This article is an open access article distributed under the terms and conditions of the Creative Commons Attribution (CC BY) license (http://creativecommons.org/licenses/by/4.0/).

