Preprint
Article

Influence of Soil Ecological Stoichiometry on aboveground biomass Under Fertilizer Application and Mixed Sowing Treatments

Altmetrics

Downloads

38

Views

27

Comments

0

This version is not peer-reviewed

Submitted:

10 October 2024

Posted:

11 October 2024

You are already at the latest version

Alerts
Abstract
The construction of artificial grasslands using native species is an effective measure to restore degraded grassland. In this study, three native grass species, Elymus nutans, Elymus tangutorum and Poa litwinowiana, domesticated in the northern Tibetan Plateau, were used as test subjects. Three monocultures El. N, El. T and Po. L and four mixed combinations El. N+El. T, El. N+Po. L, El. T+Po. L and El. N + El. T + Po. L were set up, with 7 sowing combinations as the main zones, and nested fertilization and non-fertilization as the secondary zones. The optimal sowing combinations were selected to clarify the community growth dynamics of different grass pasture, and to investigate the transgressive overyielding and diversity effects of artificial grassland and the response of soil chemometrics to fertilizer application, with a view to providing a scientific basis for ecological restoration of degraded grassland in the northern Tibetan Plateau. The results show that the different sowing combinations of grassland all exhibit significant growth, with aboveground biomass peaking on 20 September. The type of El. N is the dominant community of the mixed combinations. The forage yield was highest in the combination, and the fertilization treatment significantly increased the forage yield. El. N + El. T + Po. L mixed sowing with fertilizer application is the recommended methodology to establish artificial grassland in the northern Tibetan Plateau. The relative yield totals of the mixed combinations were all greater than 1, and all were transgressive overyielding. Combined with the analysis of the distribution of soil ecological stoichiometric characteristics under fertilizer and non-fertilizer treatments, it was found that aboveground biomass and transgressive overyielding coefficients responded to soil ecological stoichiometry in completely different ways. Under the unfertilized treatment, soil C, N and P are regulated primarily through microbial stoichiometry under the resource dependence of soil dissolved nutrient stoichiometry, which affected aboveground of artificial grassland. Under the fertilizer treatment, microbially mediated extracellular enzyme stoichiometry was dynamically changing to regulate the new substrate environmental supply and demand balance derived from fertilizer application. Future research should further explore the long-term effects of these combinations under different environmental conditions and integrate other ecological restoration techniques to enhance the sustainability and ecological benefits of artificial grasslands. This will help achieve ecological balance and efficient utilization of forage resources in the Tibetan Plateau region, providing a more comprehensive scientific basis for regional environmental protection.
Keywords: 
Subject: Environmental and Earth Sciences  -   Ecology

1. Introduction

The landscape of grassland is one of Chinese major natural landscapes, which play an important role in the C and N cycles of terrestrial ecosystems [1]. Tibetan Plateau is located on the ‘roof of the world’ as the ecological barrier in the southwest of China, with high cold and oxygen deprivation. Natural grassland is the largest and most important ecosystem in Tibet [2]. The alpine grassland of the Tibetan Plateau covers an area of 1. 27×108 km2, accounting for 50. 9 % of the total area [3]. For a long time, the natural grassland ecosystem of Tibet has not only provided the material basis for the production and livelihood of local farmers and herdsmen, but is also an important ecological natural green barrier and a major source of water resources in China [4]. And its ecological environment directly or indirectly affects the ecological security of the region and the surrounding areas, and has a great impact on the production and livelihood of local farmers and herdsmen [5]. In recent years, with the increasing population and demand for livestock products, Tibetan grassland have been affected by a combination of factors such as overgrazing, indiscriminate logging, rodent pest and mining damage, resulting in serious damage to the region’s grassland ecosystem. The area of degraded grassland is about 4. 5×10⁷ km2 and nearly 1/3 of the alpine grassland is in a serious state of degradation [6], even forming a large area of secondary bare land that cannot be restored naturally. But the restoration of degraded grasslands is a long process, taking tens or even hundreds of years [7]. These problems have led to poor improvements in grassland livestock farming. As the main source of forage for livestock in grassland areas, hay harvested from natural pastures can effectively solve the problem of grass-livestock unbalanced and plays a key role in ensuring that livestock can safely survive the winter [8,9]. Long-term haying can lead to soil nutrient depletion, which will eventually be reflected in the productivity of the grass, thus affecting the yield of the forage [10].
Currently, establishing stable, high-quality, high-yield artificial grasslands is an effective approach to restoring severely degraded grasslands and secondary bare grounds [4,11]. This strategy not only alleviates grazing pressure on natural grasslands but also enhances grassland productivity and restores ecological functions [7,12,13,14]. Techniques such as fertilization, mixed sowing, root cutting, and fencing restoration play crucial roles in this effort. Multi-species communities can effectively increase environmental resource use efficiency [15,16], resulting in higher productivity and stability over time compared to single-species or monoculture systems [17,18,19].
Ecological stoichiometry, an emerging field, integrates basic principles of ecology and stoichiometry [20,21]. It studies the mass balance of multiple chemical elements, primarily carbon, nitrogen, and phosphorus, in ecological interactions [22], gradually becoming a critical tool in ecological research [21]. Soil serves as a vital substrate and environmental condition for plant growth; carbon concentration depends on inputs from plant, animal, necromass, and humus, and their humification factor [23]. Nitrogen derives mainly from litter decomposition, biological nitrogen fixation, and dissolved nitrogen from precipitation [24]. Soil nitrogen and phosphorus are essential chemical elements for plant growth and crucial factors in terrestrial ecosystems for determining species abundance [25]. Soil nutrient supply, plant nutrient demand, and restitution maintain dynamic elemental ratios [26]. Numerous studies indicate that ecological stoichiometry serves as an indicator of microbial metabolic limitations [27]. Stoichiometric ratios of soil carbon, nitrogen, and phosphorus reflect microbial metabolic constraints in degraded grasslands. Soil microbial biomass, as a nutrient source and reservoir, reflects grassland soil nutrient status [28]. Their stoichiometric ratios can be used as indicators of soil microbial metabolic limitations and reflect grassland nutrient requirements [29]. Additionally, extracellular enzymes play a vital catalytic role in organic matter decomposition and nutrient cycling [30]. Exploring the stoichiometry of extracellular enzymes involved in carbon, nitrogen, and phosphorus cycling can reflect the biogeochemical balance between microbial metabolism, nutrient demand, and environmental nutrient effectiveness [31,32,33]. Through the lens of ecological stoichiometry, we can explain the impact of fertilization, mixed sowing, and other restoration techniques on plant competitive strategies. Fertilization significantly alters plant reproductive allocation strategies, favoring taller species capable of rapid nutrient uptake, while lower species face competitive disadvantages and are easily excluded from the community [34,35]. Simultaneously, mixed sowing and fertilization have complementary effects, alleviating nitrogen limitations, increasing forage yield, significantly improving soil nutrients, and maintaining grassland stability [36,37].
In degraded grassland ecosystem, soil degradation lags behind vegetation degradation and is a more serious degradation than vegetation degradation. Therefore, the recovery time for soil degradation is also much longer than that for vegetation. Appropriate fertilizer application is an important measure to ensure the balance between substract input and output and to achieve sustainable development [38]. Constrained by the cold and arid climatic conditions of the northern Tibetan Plateau, the adaptation of grass species is the main issue facing the construction of artificial grassland for the restoration of alpine degraded grassland in the northern Tibetan Plateau. The selection of native species for grassland restoration that close to the zonal vegetation of the degraded grassland restoration areas becomes crucial to ensure the stability and sustainability of the re-established grassland communities. In view of this, the present study was conducted to investigate the dynamics of forage yield under different sowing combinations and fertilization conditions, which focus on the three grasses in artificial grassland communities planted with domesticated native grasses in the northern Tibetan Plateau. In order to clarify the causes of the transgressive overyielding effect and its correlation with soil stoichiometry, to identify the adaptation of different native grasses to the environment and the co-existence and competition in community composition, and to determine the relationship between aboveground biomass and soil ecological stoichiometry. The purpose of this study is to provide a scientific basis for the ecological restoration of degraded grassland in the northern Tibetan Plateau.

2. Materials and Methods

2.1. Study Area

This study was carried out in the city of Naqu, Tibet Autonomous Region, in the heart of the Tibetan Plateau (92°07′ E, 31°26′ N). Study area is characterized by a dry, windy, semi-arid monsoon climate, with a combination of rain and heat. The annual average temperature is -2.9 ℃, the mean annual precipitation is 400mm, mainly occurring between June and September. There is no absolute frost-free period. The study area is a flat, heavily degraded alpine grassland with Koeleria argentea, Potentilla bifurca, Stipa purpurea, Stracheya tibetifca, Heteropappus hispidu and Lepidium apetalum as the main miscellaneous grasses.

2.2. Methods

In this study, the grass species were Elymus nutans (El. N), Elymus tangutorum (El. T) and Poa litwinowiana (Po. L), all harvested from the northern Tibetan Plateau. They were cultivated and domesticated for three years at the ‘Northern Tibetan Alpine Grassland Ecological and Technological Park’ in Naqu City (31°26′ N, 92°01′ E, 4512 m) then used to establish a perennial mixed artificial grassland.
Treatment Forage type No.
Fert. El. N Ⅰ.
El. T Ⅱ.
Po. L Ⅲ.
El. N + El. T Ⅰ. + Ⅱ.
El. N + Po. L Ⅰ. + Ⅲ.
El. T + Po. L Ⅱ. + Ⅲ.
El. N + El. T + Po. L Ⅰ. + Ⅱ. + Ⅲ.
No-Fert. El. N Ⅰ.
El. T Ⅱ.
Po. L Ⅲ.
El. N + El. T Ⅰ. + Ⅱ.
El. N + Po. L Ⅰ. + Ⅲ.
El. T + Po. L Ⅱ. + Ⅲ.
El. N + El. T + Po. L Ⅰ. + Ⅱ. + Ⅲ.
The experiment was sown in early June 2019 as monocultures and mixed combinations. The monocultures were done as a single sowing of El. N (Ⅰ.), El. T (Ⅱ.) and Po. L (Ⅲ.) at 2.25g·m-2, 2.25 g·m-2 and 1.50 g·m-2, respectively. The mixed sowings were two mixes and three mixes with four sowing combinations, El. N+ El. T (Ⅰ.+Ⅱ.), El. N+Po. L (Ⅰ. + Ⅲ.), El. T+Po. L (Ⅱ. + Ⅲ.) and El. N + El. T + Po. L (Ⅰ. + Ⅱ. + Ⅲ.). The amount of individual sowing rate of each forage type in two mixes was 50 %, 33.3 % of the monocultures sowing rate for the three mixtures, 7 sowing combinations in total. The sowing combinations were random-distributed and replicated 4 times, each time on 3 m x 4 m plots with a 1 m buffer strip between the sowing combinations. Each sowing combination was divided into two sub-zones of 3.0 m x 2.0 m which containing two treatments, one is control (No-Fert.) and the other is fertilization (Fert.), with a 0. 5 m horizontal and vertical separation strip. The fertilizer treatment was (NH4)2HPO4, applied once in early June of the second year after sowing (sprinkler irrigation after fertilization). The fertilizer application was 60 g·m-2 (10. 8 g·m-2 for pure N and 27. 6 g·m-2 for pure P). The sowing was sown at a depth of 3-5 cm, in rows 25 cm apart, mulched after sowing, and weeded twice by hand after emergence. The experimental site undergoes a natural winter, with pre-winter watering and no mulching measures.
Sampling was carried out on the 20th of each month from July to September (plant growing season) after sowing. To eliminate interference between adjacent sowing treatments, one row on each side of treatments was left unmeasured and unsampled. To ensure that the biomass collection from July to September was within the same sample site, two randomly fixed 0. 25 m x 0. 25 m squares were design before the first fertilizer application. The aboveground biomass was harvested, dried at 65°C to a constant weight. Soil samples was collected at the last harvest. In each quadrat, a homogenized sample (0-10cm) was collected from the four corners and center using a soil auger (20-cm depth and 5-cm diameter). Soil samples were sieved through a 2-mm mesh to remove large stones and roots. Each soil sample was divided into two parts, with one of those subsamples air-dried and another part of subsamples retained at 4°C to measure the soil properties and extracellular enzymes.

2.3. Measurement Methods

Soil properties: the following parameters were measured: soil organic carbon (SOC, g·kg-1), soil total nitrogen (TN, g·kg-1), soil total phosphorus (TP, g·kg-1), soil dissolved organic carbon, nitrogen and inorganic phosphorus (DC, DN and DP; mg·kg-1) and soil microbial biomass carbon, nitrogen and phosphorus (MBC, MBN, and MBP; mg·kg-1). SOC was measured by potassium dichromate oxidation [39]. TN and TP were determined by standard protocols [40]. The concentrations of MBC, MBN and MBP were measured using the chloroform fumigation-extraction method according to Vance et al., (1987) and Brookes et al., (1985) [41,42], respectively. Briefly, one part was fumigated with CHCl3 for 24 h at 25℃, and the others were non-fumigated. The fumigated and non-fumigated soil were extracted in 50 ml 0.5 M K2SO4 at a ratio of 1∶4 (W/V) for MBC and MBN, and 50 ml 0.5 M NaHCO3 at a ratio of 1∶20 (W/V) for MBP. MBC, MBN and MBP were calculated according to the difference between fumigated and non-fumigated values and adjusted using conversion coefficients E, where EC, EN and EP were 0.45, 0.45 and 0.40, respectively [43]. The concentrations of DC, DN and DP were calculated from the non-fumigated values [44].
Soil extracellular enzymes: the following extracellular enzyme activities were measured, which are associated with the microbial acquisition of C (BG, β-1,4-glucosidase; CBH, β-D-cellobiohydrolase), N (NAG, β-N-acetylglucosaminidase; LAP, Leucine aminopeptidase), and P (AP, Alkaline phosphatase). 1 g fresh soil was added to 250 mL of 0.5 M acetate buffer and dispersed by ultrasonic disaggregation (50 J/s for 120s) [45]. Using 96-well plates standard fluorimetric techniques for analysis (Table S1) [46,47].

2.4. Statistical Analysis

We examined the statistical distributions of aboveground biomass, relative total yield (RTY), over yield (OY), transgressive overyielding effect (OY1 and OY2), total nutrient stoichiometry (TNS) dissolved nutrient stoichiometry (DNS), microbial biomass stoichiometry (MBS) and, extracellular enzyme stoichiometry (EES) by expected probability (Q-Q) plots, and calculated the skewness and kurtosis for each indicator. All data were tested for homogeneity of variance before analysis, and those with variance were log-transformed. The statistical analyses were carried out with R software v3.4.2 (http://www.r-project.org). We used the rda and varpart functions of the ‘vegan’ package to run redundancy analysis (RDA) and variance partitioning analysis (VPA), respectively. VPA was used to analysis the explanation of the impact of TNS, DNS, MBS, EES on yield indicators. RDA was to explore the relationship between stoichiometric characteristics and yield indicators.

2.4.1. The Competitiveness of Inter-Species

The relative yield total (RYT) can characteristic the competitiveness between mixed species. It is calculated as follows:
RYT = Y ij Y ii + Y ji Y jj
where, Yij is the biomass of i specie in mixed sowing. Yji is the biomass of j specie in mixed sowing. Yjj is the biomass of i species in monoculture. Where RYT>1, the interspecific competition of the mixing sowing is less than the intraspecific competition, showing a symbiotic relationship. When RYT=1, the interspecific competition of the mixing sowing is equal to the intraspecific competition. When RYT<1, the interspecific competition of the mixing sowing is greater than the intraspecific competition, showing an antagonistic relationship [48].

2.4.2. The Effect of Super-Production

Over-yield (OY) is the difference between the mixed aboveground biomass and the mean monoculture aboveground biomass of each species in the community.
OY = B mc B s
where, Bmc is the above-ground biomass of the mixed community. Bs is the average above-ground biomass of each species in the mixed community. When OY>0 indicating over-production.
Transgressive overyielding effect 1 (OY1) is the above-ground biomass of the mixed community exceeds the above-ground biomass of the monoculture species with the highest biomass in that community. It emphasises the differences between the mixed species and the link with over-production effect [49].
OY 1 = B mc maxB imno
where, max Bimno is the above-ground biomass of the highest productivity species in the mixed community. When OY1>0, indicating an transgressive overyielding effect.
Transgressive overyielding effect 2 (OY2) is the above-ground biomass of a mixed community exceeds the average above-ground biomass of the monoculture species within that community. It explains the relationship between the above-ground biomass of the mixed community and monoculture species of the mixed community [49].
OY 2 = B mc B imno B imno
where, Bimno is the mean monoculture above-ground biomass of each species in the mixed community. When OY2>0, indicating an transgressive overyielding effect.

3. Results

3.1. Dynamic Change of Aboveground Biomass Indicators under Different Sowing Combinations

3.1.1. Forage Yield

As the phenological period progressed, the forage yield increased gradually in both the monoculture and mixed treatments, reaching a peak on 20 September (Table 1). In the monosowed treatments, rapid growth occurred from 20 July to 20 August. In particular, the forage yield of treatments Ⅰ. was higher than treatments Ⅱ., and the yield of treatments Ⅲ. was the lowest. The application of fertilize significantly increased the forage yield in the early period. The total forage yield was highest in treatment Ⅰ. + Ⅱ. + Ⅲ., followed by Ⅰ. + Ⅱ. and lowest in treatment Ⅰ. +Ⅲ. The forage yield increased more than 88.23 % after fertilization. In the mixed sowing treatments, El. N was overwhelmingly dominant except on 20 August among the mixed combination of Ⅰ. + Ⅱ., Ⅰ. +Ⅲ. And Ⅰ. + Ⅱ.+Ⅲ. Its forage yield accounted for more than 70 % of total yield at that time. On 20 August, the forage yield of El. N in the mixed combination of Ⅰ. + Ⅱ.+Ⅲ. decreased to 45.68 % and 48.39 % in non-fert. and fert. treatments, respectively. The total percentage of El. T and Po. was over than 50 %. Ⅰ. The contribution of Po. to the forage yield was greater in mixed combination of Ⅰ. +Ⅲ. than Ⅱ. + Ⅲ.

3.1.2. RYT and OY

As Figure 1-a shown, the RYT values of mixed combinations Ⅰ. +Ⅱ., Ⅰ. +Ⅲ., Ⅱ.+Ⅲ. and Ⅰ. + Ⅱ.+Ⅲ. under non-fert. and fert. treatments were greater than 1. 0. The highest RYT values of 1. 58, 1. 65, 2. 07 and 2.87 were recorded on 20 September for the mixed combination of Ⅰ. + Ⅱ.+Ⅲ. This indicates that intra-species competition is less than inter-species competition for each species in the El. N +El. T, El. N +Po. L and El. N + El. T+ Po. L mixed combination during different phenological periods. The RYT values for the mixed Ⅱ.+Ⅲ. were greater than 1. 0 under fert. treatment and less than 1. 0 under non-fert. treatment. This indicates that intra-species competition was greater than inter-species competition in the El. T +Po. L mixed combination, and that inter-species competition increased after fertilization and tended to be closer to intra-species competition. All mixed combination except the Ⅱ.+Ⅲ. were over-productive compared to the monoculture treatment, the Ⅰ. + Ⅱ.+Ⅲ. mixed combinations’ over-producing were 139.39, 612.99 and 1135.917 g·m-2 in July, August and September under the fert. treatment, respectively (Figure 1-b).

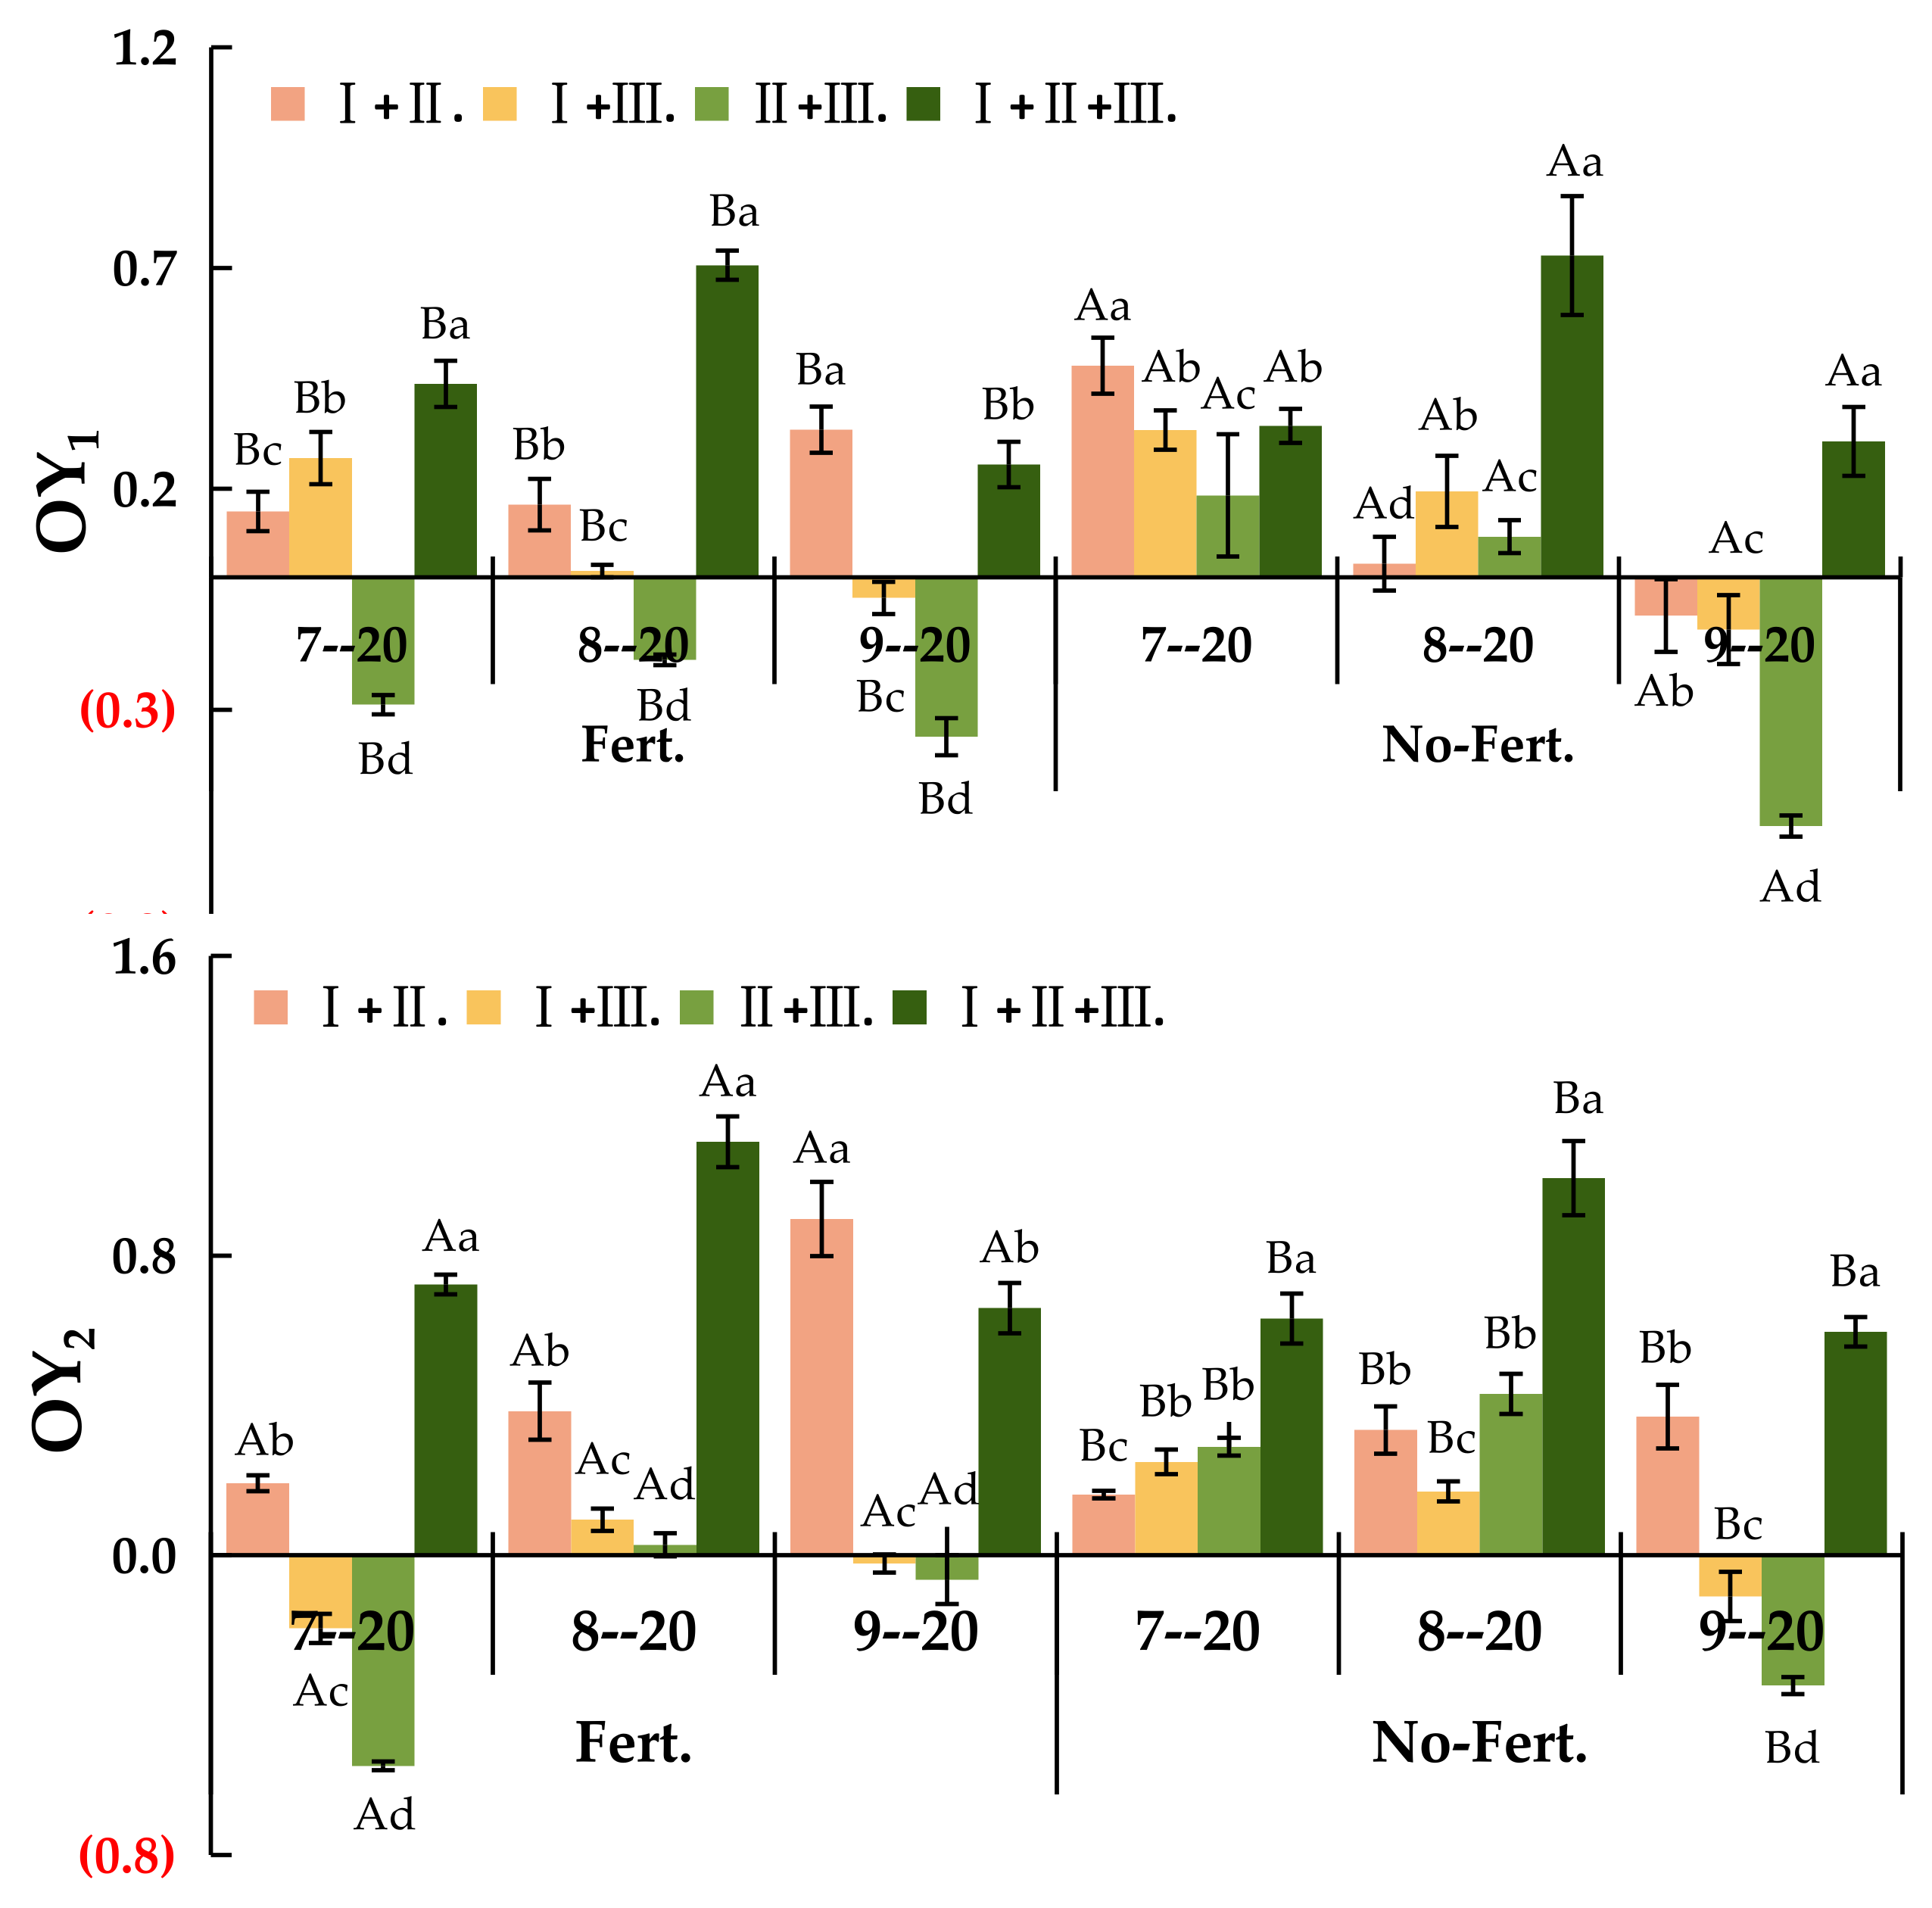
3.1.3. OY1 and OY2

As Figure 2 shown, The fert. treatment significantly increased the over-yielding effect of the mixed combinations (P<0.05). Under fert. treatment, the value of OY1 was greater than 0 for all mixed combinations except Ⅱ.+Ⅲ. in different phenological stages which indicated the transgressive over-yielding effect 1. Under non-fert. treatment, the value of OY1 was greater than 0 only for Ⅰ. + Ⅱ.+Ⅲ. mixed combination on 20 September, while all other values were negative indicated the absence of transgressive over-yielding effect 1 (Figure 2-a). The value of OY2 was significantly higher under the fert. treatment than the non-fert. treatment for all mixed combinations in different phenological stages (P<0.05). Under the fert. treatment, there was an transgressive over-yielding effect 2 in all mixed combinations except for the Ⅰ.+Ⅲ. and Ⅰ. + Ⅱ.+Ⅲ., where the value of OY2 was less than 0 in 20 July and September. Under the non-fert. treatment, there was no transgressive over-yielding effect 2, except in the Ⅰ.+Ⅲ. and Ⅰ. + Ⅱ.+Ⅲ. mixed combinations on 20 September (Figure 2-b).

3.2. Influential Factors of Forage Yield Indicators

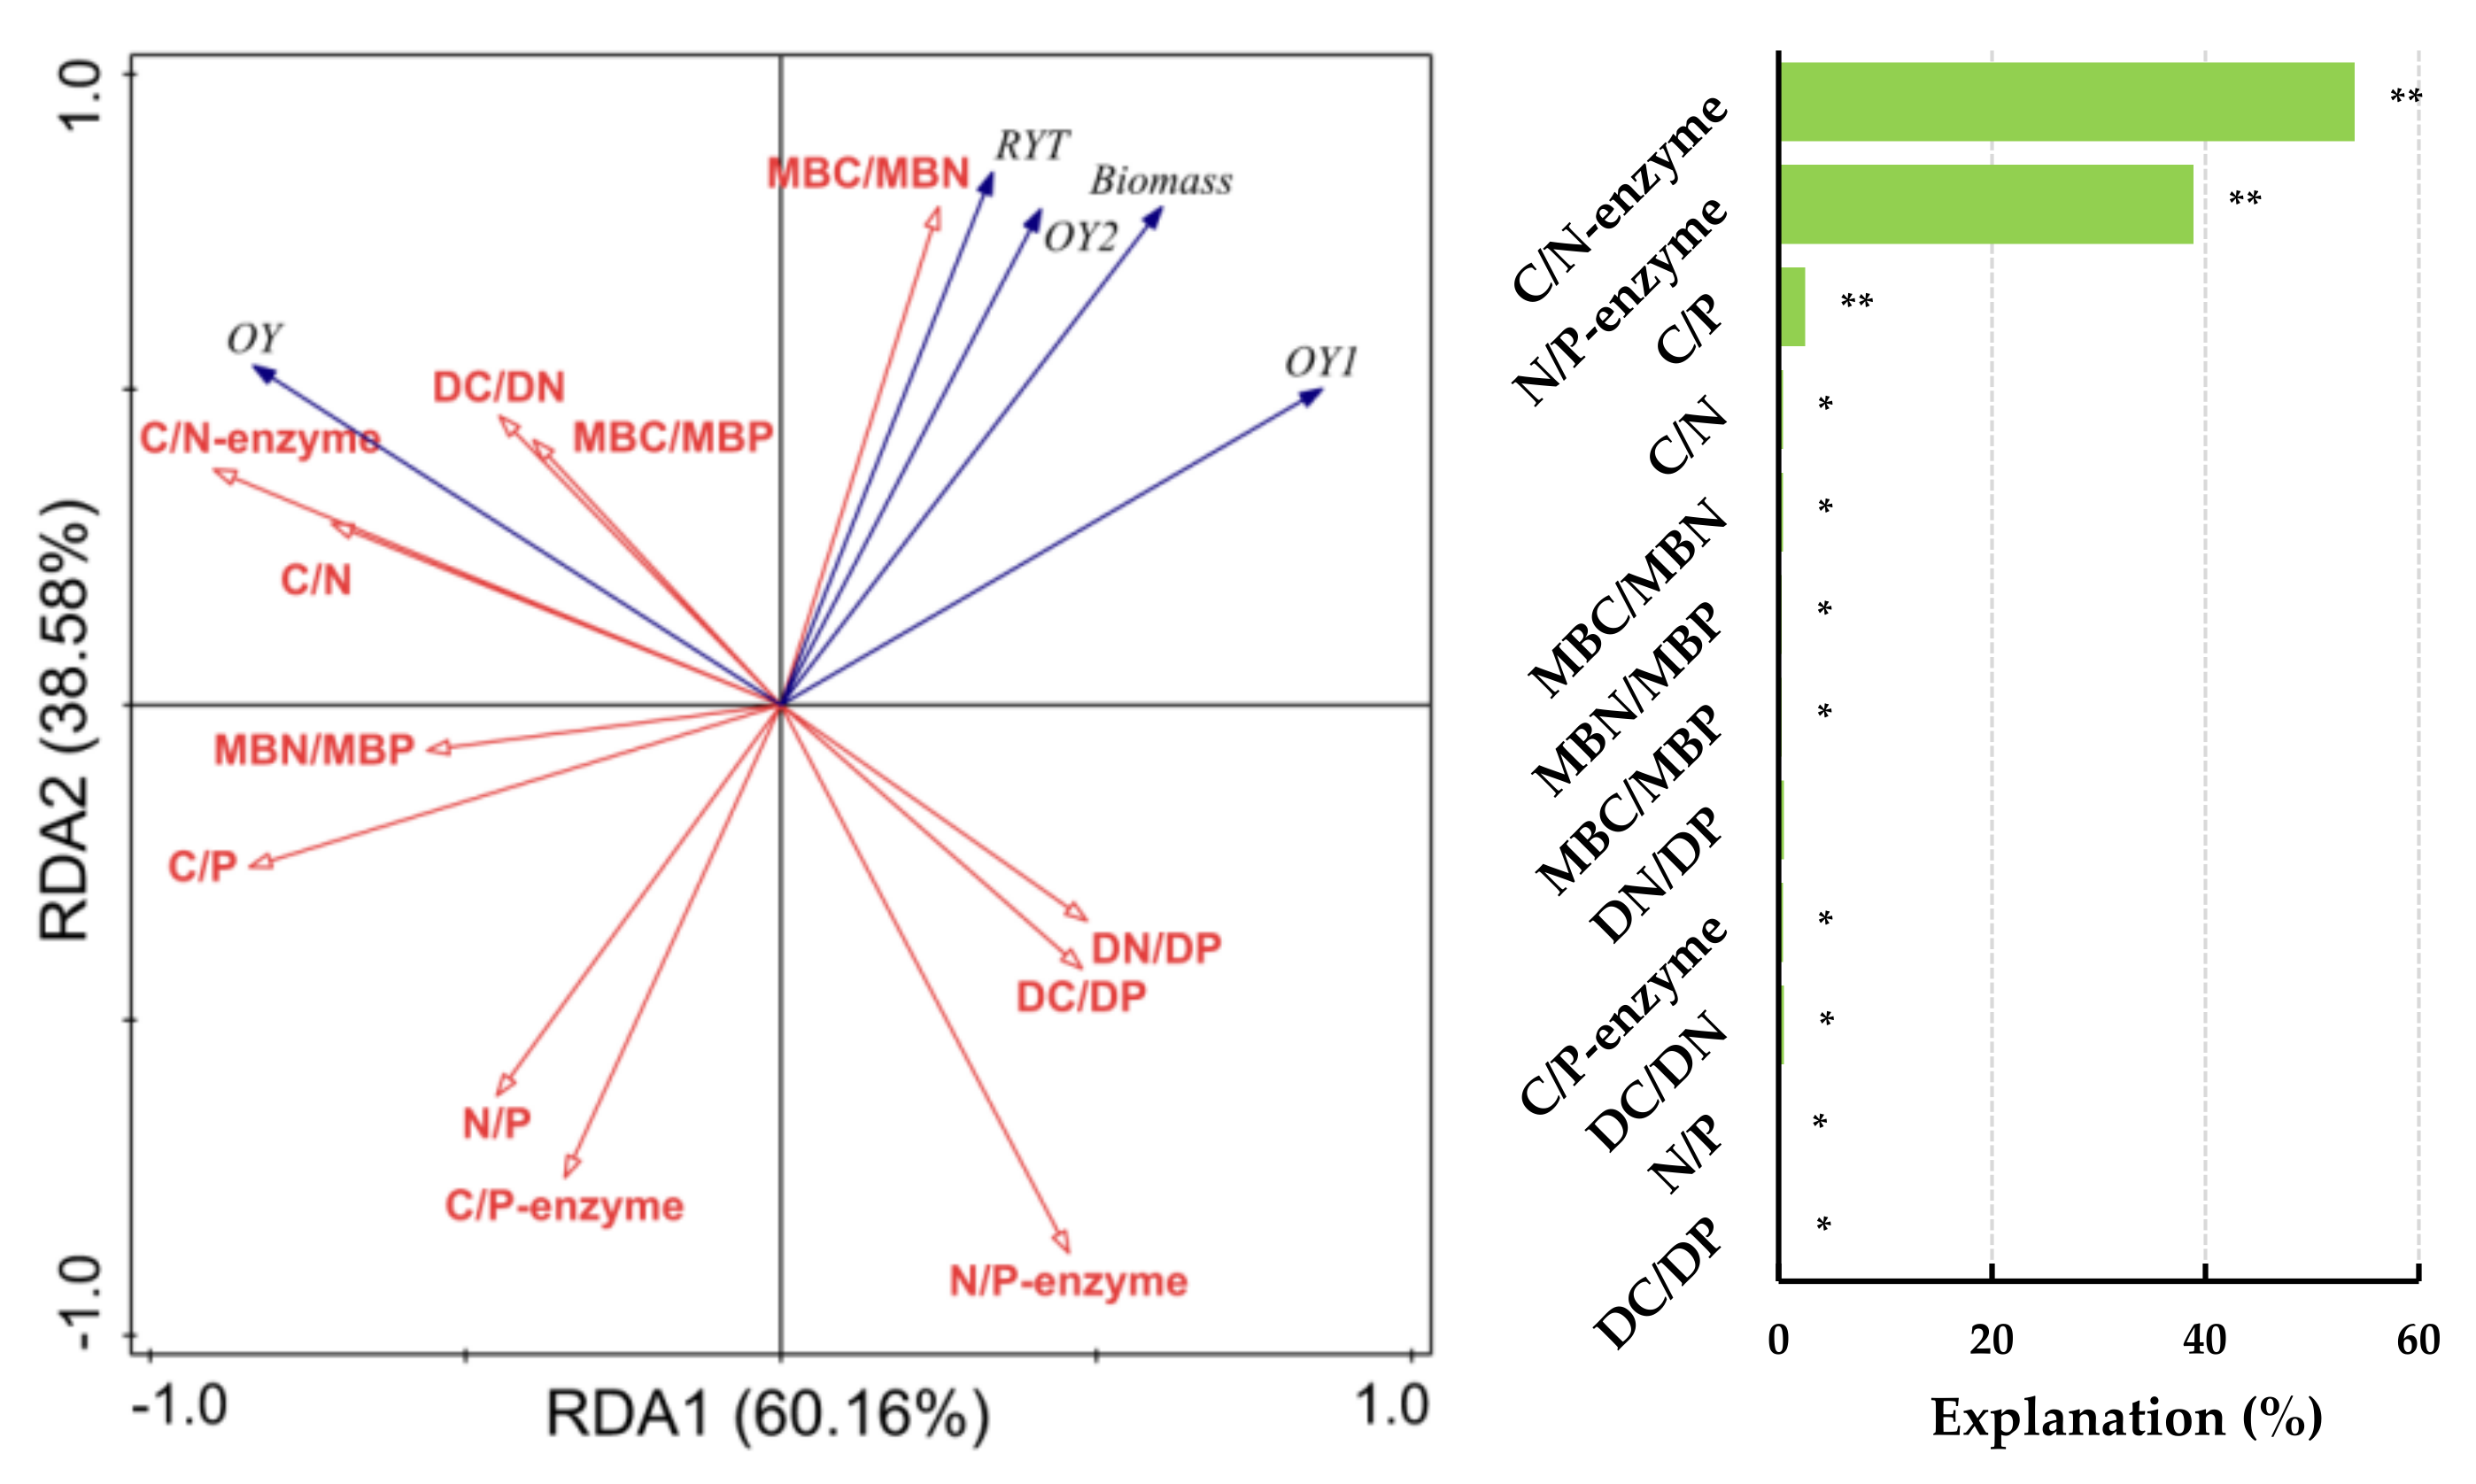
The factors influencing forage yield indicators between different sowing combinations under fertilization treatment were analyzed based on RDA (Figure 3). Forage yield, RYT, OY1 and OY2 were significantly and positively correlated with MBC/MBN (P<0.01), the correlation coefficients were 0.775, 0.704, 0.606 and 0.666, respectively. While significantly and negatively correlated with C/P, N/P and C/P-enzyme (P<0.01). RYT also significantly and negatively correlated with N/P-enzyme (P<0.01). OY significantly and positively correlated with C/N, C/P, DC/DN, C/N-enzyme and N/P-enzyme (P<0.01), while significantly and negatively correlated with DC/DP and N/P-enzyme (P<0.01). The ratios of C/N-enzyme, N/P-enzyme and C/P (54.0 % and 38.9 %) explained the most under fert. treatment, respectively.
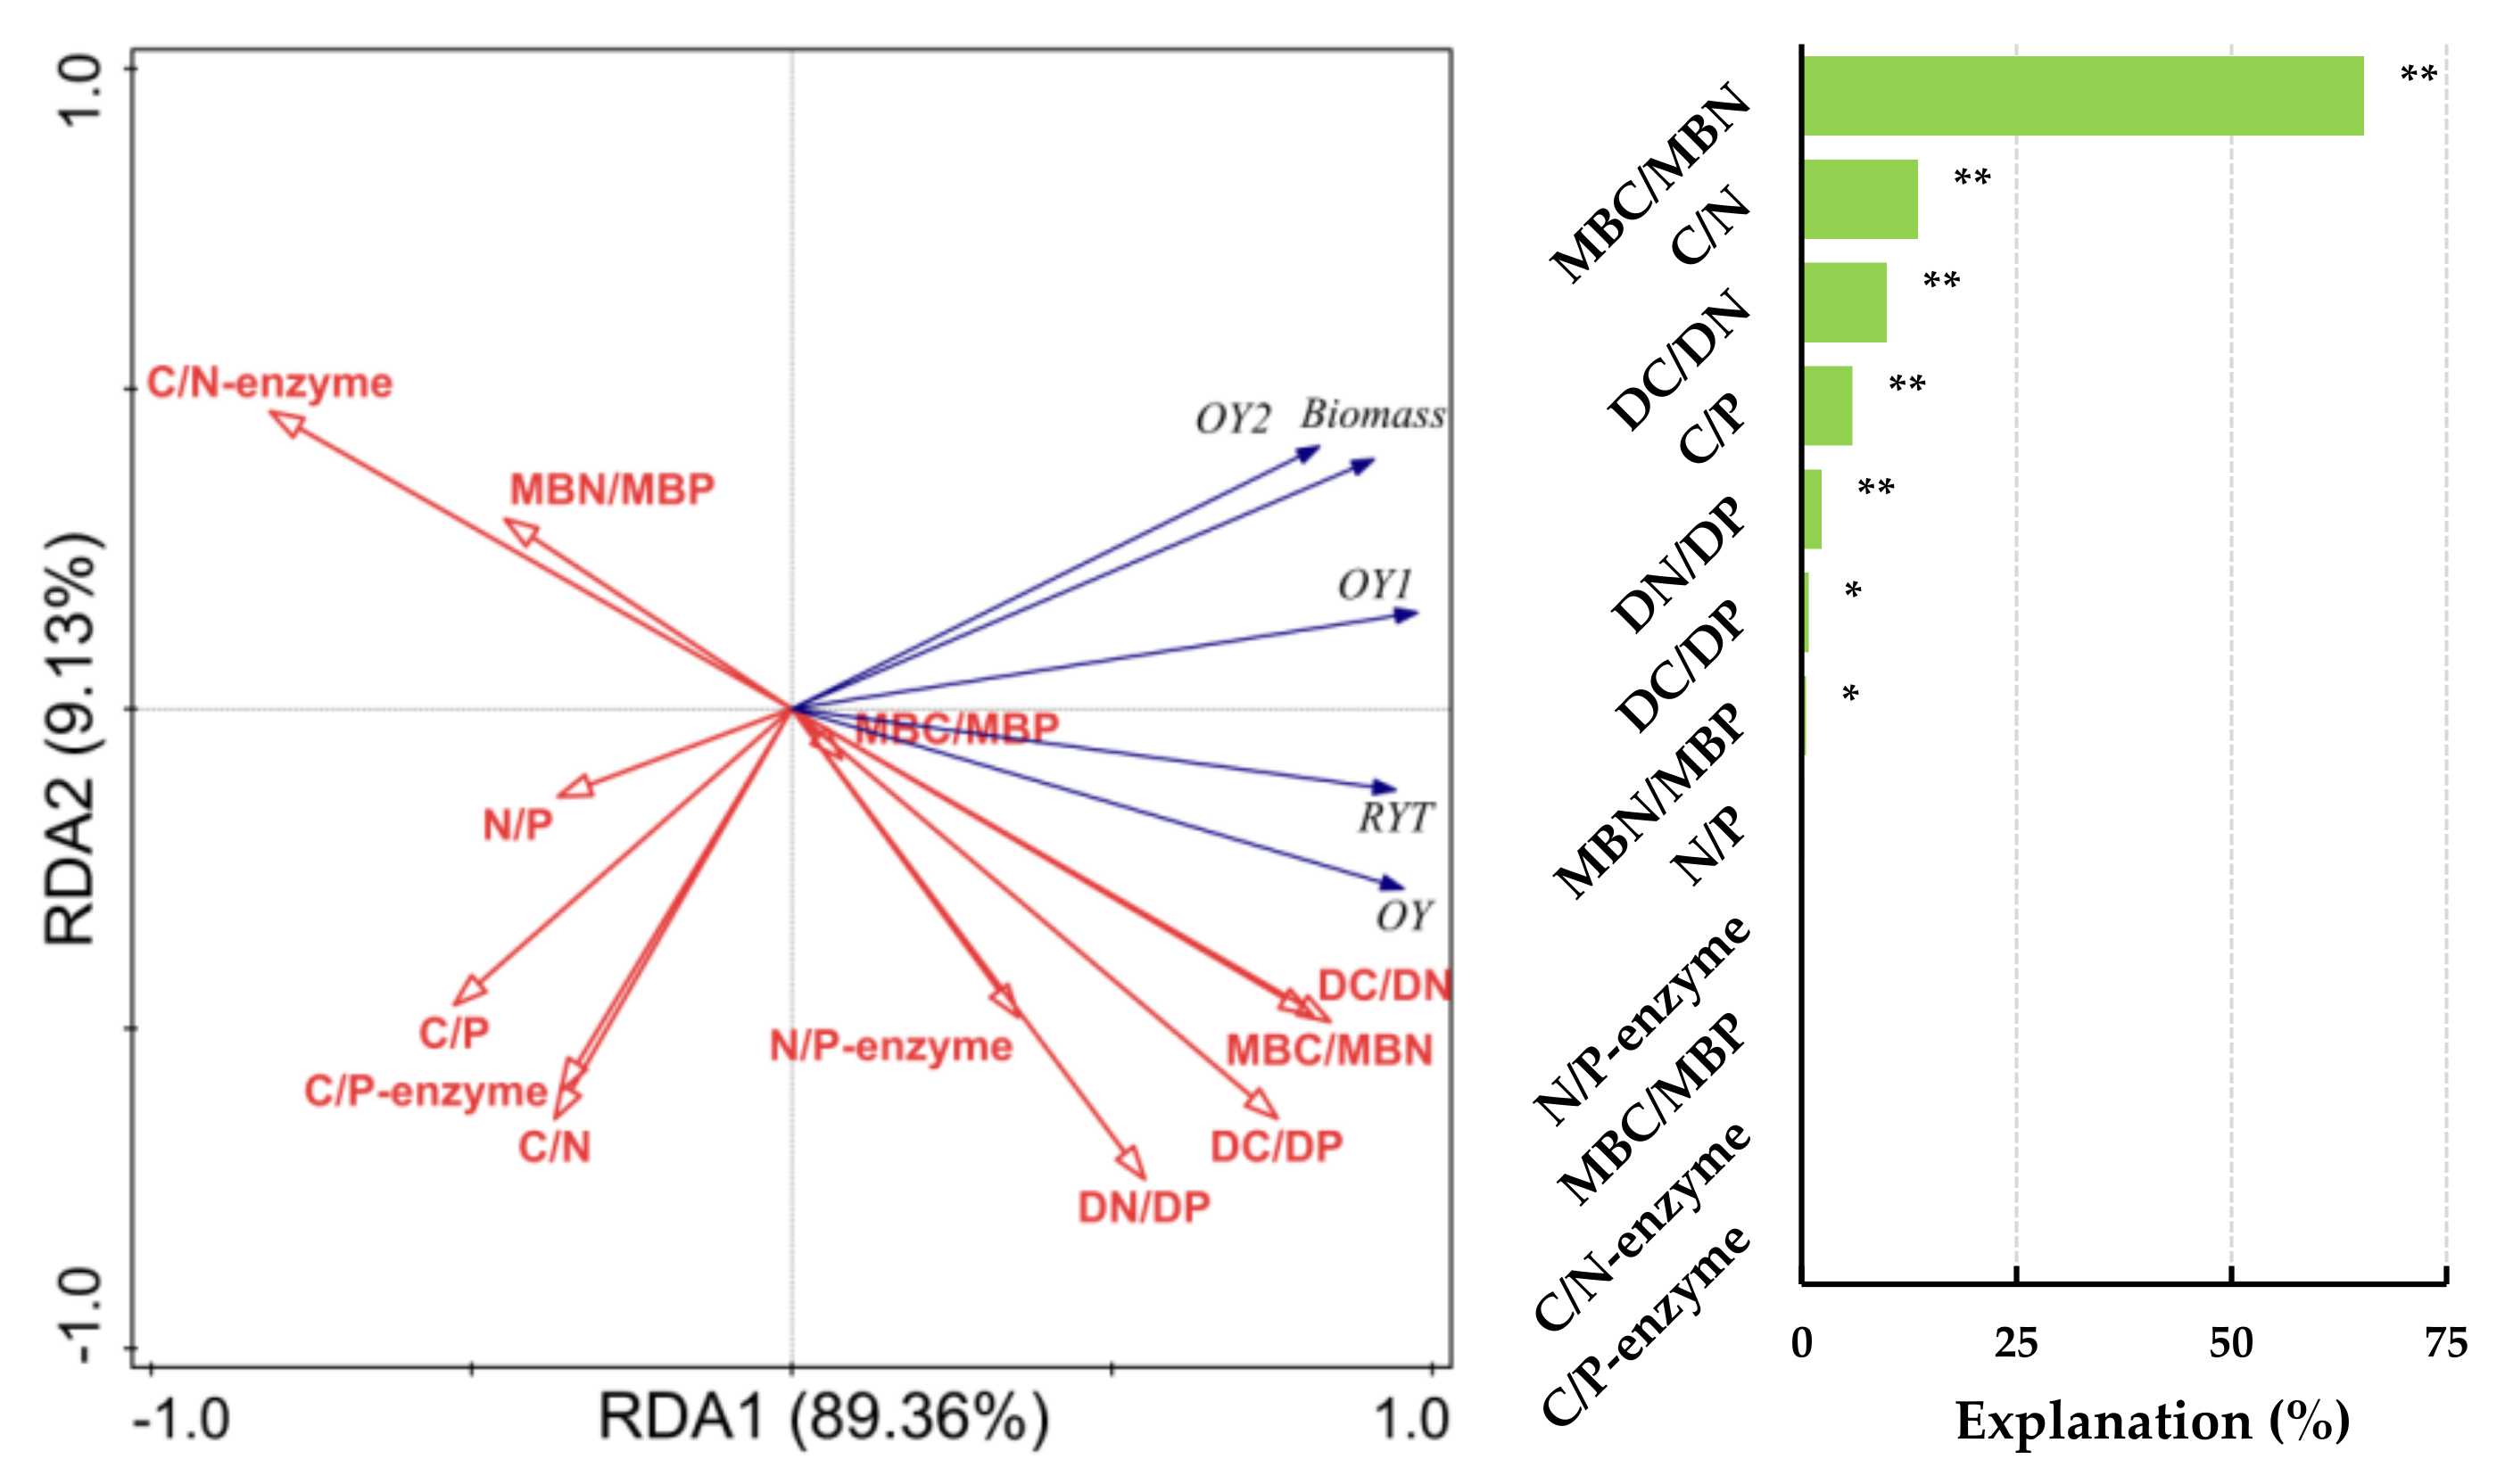
The factors influencing forage yield indicators between different sowing combinations under non-fert. treatment was analyzed based on RDA (Figure 4). Forage yield and OY2 were significantly and positively correlated with DC/DN and MBC/MBN. While significantly and negatively correlated with C/N and C/N-enzyme (P<0.01). Forage yield also significantly and negatively correlated with C/P and C/P-enzyme. RYT, OY and OY1 were significantly and positively correlated with DC/DN, DC/DP, DN/DP and MBC/MBN. While significantly and negatively correlated with MBN/MBP and C/N-enzyme (P<0.01). OY1 also significantly and negatively correlated with C/N and C/P (P<0.05). The ratios of MBC/MBN and C/N (65.4 % and 13.5 %) explained the most under non-fert. treatment, respectively.

3.3. The Relationship between Soil Ecological Stoichiometry Characteristics and Forage Yield

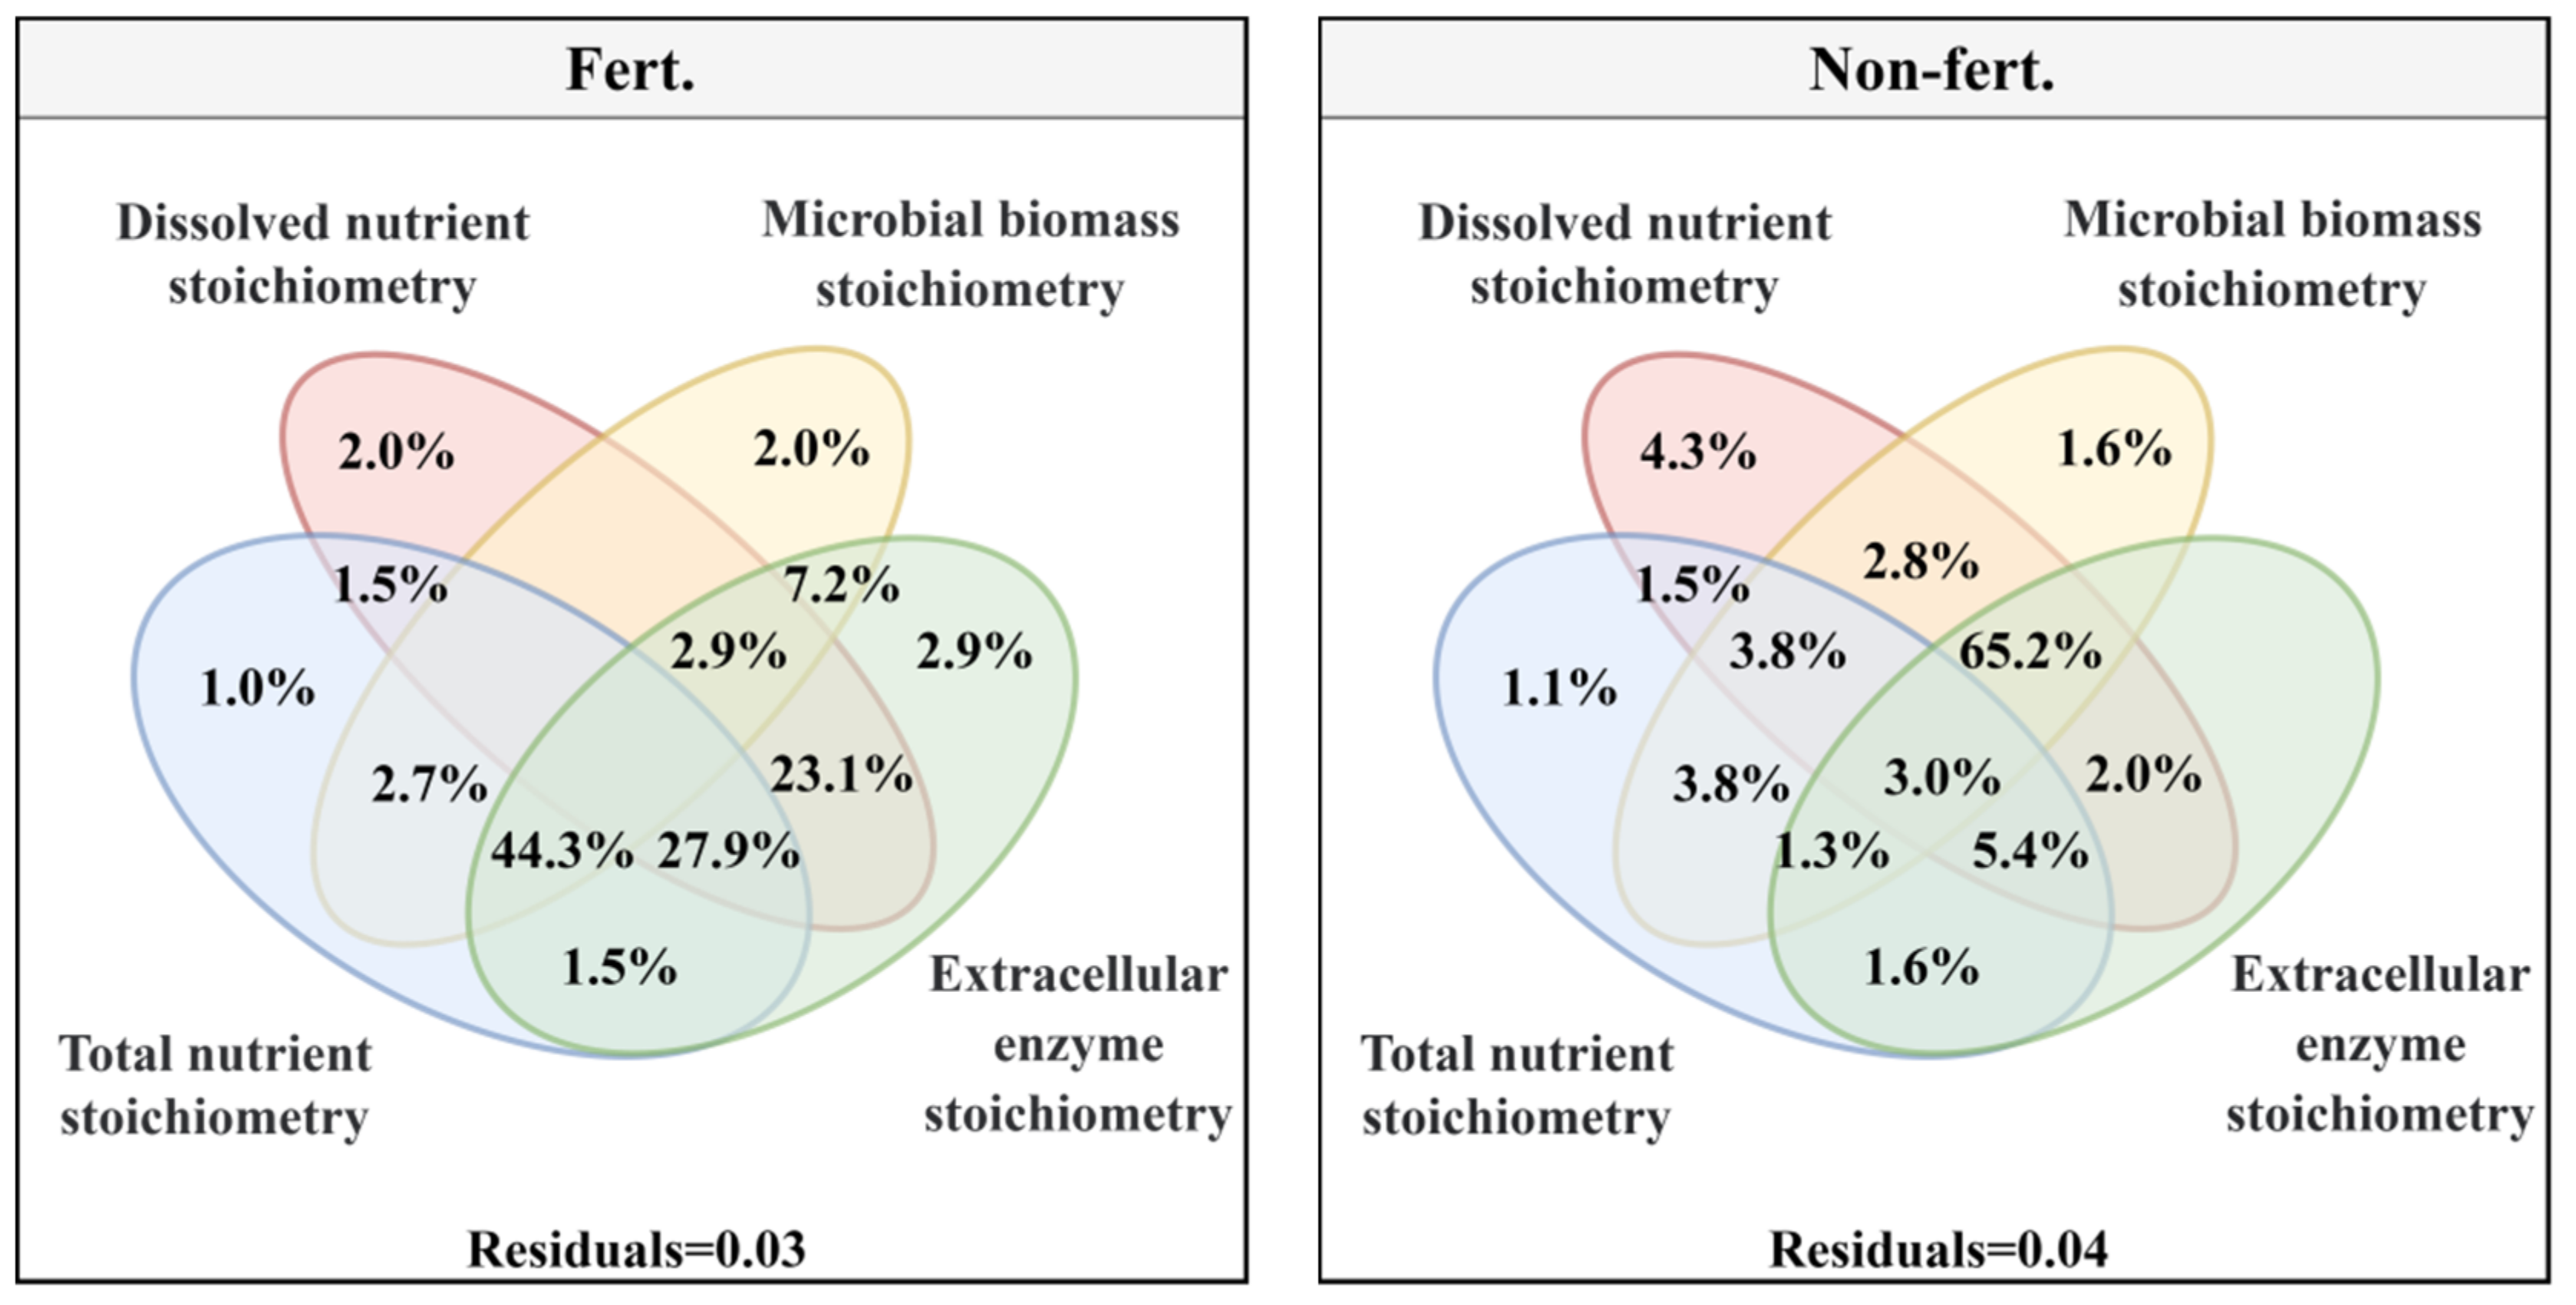
Under fert. treatment, forage yield indicates were affected by the combined effect of soil microbial biomass stoichiometry, total nutrient stoichiometry and extracellular enzyme stoichiometry (44.3%), soil dissolved nutrient stoichiometry, total nutrient stoichiometry and extracellular enzyme stoichiometry (27.9%), soil dissolved nutrient stoichiometry and extracellular enzyme stoichiometry (23.1%) explains more than the other single and combined effect (Figure 5a). While forage yield indicates just affected by the combined effect of soil microbial biomass stoichiometry, soil dissolved nutrient stoichiometry and extracellular enzyme stoichiometry (65.2%) explains more than the other single and combined effect under non-fert. treatment (Figure 5b)

4. Discussion

4.1. The Effect of Mixed-Sowing on Aboveground Biomass

In present study, the aboveground biomass in the Ⅰ.+Ⅱ., Ⅰ.+Ⅲ. and Ⅰ.+Ⅱ.+Ⅲ. mixed combinations (except at gestation period) reached more than 70% of the total community yield (Table 1). This is mainly because the species of El. N is the dominant due to its large size and higher competitive ability [50,51]. As a result, it has access to more light resources in the mixed community and can quickly occupy a higher ecological position, dominating the mixed system [52,53]. The species of El. T and Po. L are the next most competitive with relatively weak growth. At gestation period, the contribution of El. N to forage yield in the Ⅰ. + Ⅱ. Ⅲ mixed combinations decreases to below 50%. In contrast, the contribution of El. T and Po. L to forage yield peaked. This is due to the fact that El. N grows faster early in the growing season, and its above-ground biomass dominants at the nodulation period [2]. In contrast, the species of Po. L grows slowly after re-greening, but reaches full bloom at the gestation stage.
Compared to the monoculture, the mixed communication of Ⅰ.+Ⅱ.+Ⅲ had the highest forage yield of 2793.04 g·m-2, even for the unfertilized mixed combination (1363.09 g·m-2). The increase in plant diversity enhanced the overall resource utilization of the community that resulting in high yields [54,55]. Ecological niche differentiation in mixed seeding systems results in differences in the distribution of spatial, light and nutrient resources between species [56,57]. In present study, the ratio of RYT among all mixed combinations was greater than 1.0, except for the fert. treatment of Ⅱ.+Ⅲ. (Figure 1). This indicates that the interspecific competition in mixed combinations is less than the intraspecific competition of the forage species [54]. Different species will use ecological niche separation to achieve stable coexistence [58]. Discovering the mechanism of action between species diversity and productivity is a key issue in the study of diversity-productivity relationships [59,60]. The transgressive overyielding effect can be used as important evidence to explain the positive correlation between plant diversity and community or ecosystem productivity [61,62]. The results showed that there was a transgressive overyielding effect in all different treatments of mixed combinations, except for the fert. treatment in the mixed combination of Ⅱ. +Ⅲ., and both OY1 and OY2 were higher in he mixed combination of Ⅰ.+ Ⅱ.+ Ⅲ. than in the other mixes (Figure 2).

4.2. The Effect of Fertilizer Application on Aboveground Biomass and Con-Existence of Species in Mixed Combinations

Fertilizer application as a management practice is a key factor in regulating forage yield in grassland ecosystems [38,63]. Compared to non-fert. treatment, an increasing in aboveground biomass at all stages of the growing season in mixed combinations under fertilizer conditions (Table 1). Forage productivity of tall plant El. N, medium height El. T and low Po. L all responded positively to the fertilizer treatment. This positive response of aboveground biomass to fertilizer treatment reduces the overlap of species’ ecological niches, reduces environmental competition between species and promotes species coexistence [64,65]. Although El. N and El. T are conspecific and have similar resource requirements, intraspecific competition is greater than interspecific competition for the dominant species El. N [2,3]. This means that conspecific individuals are more similar in resource requirements than heterospecific individuals [66,67]. This is the reason why in mixed combination Ⅰ. + Ⅱ., species El. N and El. T are still able to co-exist and obtain transgressive overyielding. The positive effect of below-ground biomass of grasses and fertilizer application, increasing soil nutrients and significantly increasing community productivity through the return of organic matter by root secretions and below-ground biomass [68]. In addition, competition between grassland species is asymmetrical and the competitiveness derived from this can change depending on the age class of the grassland.
Under fertilizer conditions, the increase in forage yield of Po. L was less than that of El. N and El. T. Compared to the above-ground biomass, the competitive advantage of the El. N root system became weaker, and the species of Po. L was more competitive with a stronger growth potential. Different species respond asynchronously to environmental perturbations and there are differences in species’ responses following fluctuating environments [69,70]. Fertilizer treatments in different mixed combinations had a significant increase in forage yield in El. N and a minor increase in El. T. and Po. L (Table 1 and Figure 2). Therefore, the effect of transgressive overyielding in mixed combinations in this study was mainly due to fertilizer application. For artificial grasslands established to cultivate forage, appropriate amounts of supplementary fertilizer can compensate for nutrient loss from the soil over time and promote C cycling [71], as well as improve grassland productivity. The selection of high-yielding, low-carbon native grass species to complement planting and management practices is crucial for the sustainable development of the Tibetan Plateau.

4.3. The Response Strategies of Soil Ecological Stoichiometry Characteristics to Mixed Combinations and Fertilizer Application

The diversity of nutrient use strategies among species plays a crucial role in regulating ecosystem structure, function, stability, and diversity [72]. Altering mixed species combinations and adding nitrogen (N) fertilizers can influence soil nutrient status, thereby promoting forage growth and increasing yields [73]. Central to ecological stoichiometry theory is the concept of biochemical homeostasis [74]. Soil microorganisms are pivotal in linking various ecosystem functions and services within the framework of ecological stoichiometry [75]. Their resource dependency represents a robust adaptation strategy for maintaining homeostasis [76]. In this study, soil ecological stoichiometry responded differently to aboveground biomass and indicators of transgressive overyielding under varying mixed species combinations and fertilizer treatments in artificial grasslands. Forage yield and transgressive overyielding coefficients exhibited significant positive correlations with DC/DN and MBC/MBN under the non-fertilized treatment, while being constrained by C/N and C/N-enzyme relationships (Figure 3 and Table S1). This indicates that stoichiometric characteristics readily utilized by microorganisms play a regulatory role in forage yield and transgressive overyielding under unfertilized conditions. Levels of DC, DN, and MBC/MBN in the soil determine species coexistence and yield in mixed species combinations. Soil microbial biomass stoichiometry serves as a valuable metric for determining whether soil microorganisms are in a homeostatic or non-homeostatic state [77]. Under strict homeostasis, changes in resource stoichiometry have minimal impact on organism stoichiometry. However, despite maintaining relative homeostasis, soil microbial biomass exhibits sensitivity to C: N ratios [74].
In contrast, aboveground biomass and transgressive overyielding coefficients of grassland were only significantly positively correlated with MBC/MBN in the fert. treatments and were constrained by N/P, C/P and C/P-enzyme (Figure 4 and Table S2). That means that forage yield and over-yield coefficients under fertilizer treatments are limited by P. Although an important mechanism for forage to maintain their survival in a severely P-limited environment through high nutrient recovery and utilization of their own P at a constant rate [25]. Nitrogen and phosphorus are the main nutrients that limit plant growth and can characteristics the nutrient limitation. Therefore, they are widely used to analyse N and P limitation in ecosystems, communities and plant populations [78]. The ratio of N/P can determine community structure and function [79]. When N/P < 14, plant growth is limited by N; when N/P > 16, plant growth is limited by P; when 14 < N/P < 16, plant growth is limited by both N and P [80]. The results showed that under the non-fert. treatment I.+III., II. +III. and Ⅰ. + II.+ III. The soil DN/DP of the mixed combinations were all greater than 16, forage growth was limited by P. The fertilization process disrupts the microbial homeostasis of the soil native system, and each of the P-related stoichiometric traits corresponds to community coexistence and yield. The main mechanism of species coexistence in plant communities is the slightly different nutrient use of N and P by different species, i.e. the differentiation of the nutritional ecological niche of the community [81]. It is a common fact that N deficiency in soils limits the productivity of grasslands, and compensating for degraded grasslands through fertilization measures is the key to increasing forage yield. The right amount of N fertilizer application can improve the yield and quality of forage and increase the accumulation of N in forage ([73,82] Forage yield was significantly greater in the fert. treatment than in the non-fert. treatment (Table 1). The addition of N addresses to a certain extent the problem of insufficient soil nitrogen content, thus promoting plant growth, increasing plant biomass and the input of organic carbon to the vegetation and effectively improving ecosystem productivity and forage quality [83,84].
The response strategies of soil ecological stoichiometry under fertilizer and unfertilized treatments are quite different [85,86]. Under the non-fert. treatment, soil microorganisms initiated strong adaptive strategies to maintain their homeostasis. Thus, under the resource dependence of soil dissolved nutrient stoichiometry, microbial-related soil microbial biomass stoichiometry and extracellular enzyme stoichiometry characteristics that contributed 65.2% of the explanation for forage yield. In contrast, under the fertilizer treatment, the first response of soil dissolved nutrient stoichiometry leads to a change in total nutrient stoichiometry, causing soil microorganisms to initiate extracellular enzymes to coordinate the change in resources. In the systems of plant-microbial-soil, microbially mediated soil C, N and P cycling is always dynamic [87], which may result in an imbalance between substrate supply and microbial demand [31]. Microorganisms need to adapt to metabolic limitations caused by inadequate substrate resource availability by adjusting their own elemental utilization efficiency or by producing specific extracellular enzymes to mobilize resources in order to maintain normal life activities [88,89] Thus, soil microbial biomass stoichiometry, total nutrient stoichiometry and extracellular enzyme stoichiometry (44.3%), soil dissolved nutrient stoichiometry, total nutrient stoichiometry and extracellular enzyme stoichiometry (27.9%), soil dissolved nutrient stoichiometry and extracellular enzyme stoichiometry combined to affect forage yield under the fertilizer treatments.

5. Conclusions

The aboveground biomass peak at the end of the growing season. The highest above-ground biomass was found in the mixed combination of Ⅰ. + II. + III. Fertilizer application and mixed sowing significantly increased community productivity. The response strategies of soil ecological stoichiometry were quite different between the fertilized and unfertilized treatments. Under the non-fert. treatment, soil microorganisms regulated soil C, N and P in a source-dependent bay by soil dissolved nutrient stoichiometry, which influenced aboveground biomass. In contrast, the microbially mediated extracellular enzyme stoichiometry has been dynamically changing to regulate the new substrate environmental supply and demand balance derived from fertilizer application.

Supplementary Materials

The following supporting information can be downloaded at the website of this paper posted on Preprints.org.

Author Contributions

Wenxia Cao and Wei Wei: Writing-review & editing, Visualization, Validation, Supervision, Project administration, Funding acquisition, Formal analysis, Data curation, Conceptualization. Fei Xia: Investigation. Juanjuan Zhou: Writing-original draft, Investigation.

Funding

This research has been funded by the Key Research and Development Program of Tibet Autonomous Region (Grant No. XZ202201ZY0005N), Institute of Pratacultural Science, Tibet Academy of Agricultural and Animal Husbandry Science (Grant No. CYS-TC-2021-002), Important Science and Technology Plan Project of Tibet Autonomous Region (Grant No. XZ202101ZD0003N).

Data Availability Statement

Data will be made available on request.

Conflicts of Interest

The authors declare that they have no known competing financial interests or personal relationships that could have appeared to influence the work reported in this paper.

References

  1. Kang, L.; Han, X.G.; Zhang, Z.B.; Sun, O.J. Grassland ecosystems in China: review of current knowledge and research advancement. Philos T R Soc B 2007, 362, 997–1008. [Google Scholar] [CrossRef] [PubMed]
  2. Qiu, Y.S.; Xie, W.G. Anatomical and Physiological Characteristics of Awn Development in Elymus nutans, an Important Forage Grass in Qinghai-Tibet Plateau. Agronomy 2023, 13(3), 862. [Google Scholar] [CrossRef]
  3. Gu, M.H.; Dong, S.K.; Wang, T.; Xie, Z.K. Interspecific interactions under fertilization among Elymus nutans, Festuca sinensis and Festuca ovina on the eastern Qinghai-Tibetan plateau. Plant Spec Biol 2012, 27, 159–163. [Google Scholar] [CrossRef]
  4. Shang, Z.H.; Dong, Q.M.; Shi, J.J.; Zhou, H.K.; Dong, S.K.; Shao, X.Q.; Li, S.X.; Wang, Y.L.; Ma, Y.S.; Ding, L.M.; et al. Research progress in recent ten years of ecological restoration for “black soil land” degraded grassland on Tibetan Plateau concurrently discuss of ecological restoration in San jiang yuan region. Acta Agrestia Sinica 2018, 26(1): 1-21. [CrossRef]
  5. Littlejohn, C.P.; Hofmann, R.W.; Wratten, S.D. Delivery of multiple ecosystem services in pasture by shelter created from the hybrid sterile bioenergy grass Miscanthus x giganteus. Sci. Rep 2019, 9, 5575. [Google Scholar] [CrossRef]
  6. Sun, J.; Zhang, Z.C.; Dong, S.K. Adaptive management of alpine grassland ecosystems over Tibetan Plateau. Pratacultural Science 2019, 36(4): 933-938. [CrossRef]
  7. Zhao, Z.; Chen, J.C.; Bai, Y.P.; Wang, P. Assessing the sustainability of grass-based livestock husbandry in Hulun Buir, China. Phys Chem Earth, Parts A/B/C 2020, 120, 102907. [CrossRef]
  8. Soleymani, A.; Shahrajabian, M.H.; Khoshkharam, M. Effect of different fertility systems on fresh forage yield and qualitative traits of forage corn. Res. Crop 2012, 13, 861–865. [Google Scholar]
  9. Crotty, F.V.; Fychan, R.; Sanderson, R.; Marley, C.L. ncreasing legume forage productivity through slurry application-A way to intensify sustainable agriculture?. Food Energy Secur 2018, 7(4), e00144. [CrossRef]
  10. Dong, S.K.; Shang, Z.H.; Gao, J.X.; Boone, R.B. Enhancing sustainability of grassland ecosystems through ecological restoration and grazing management in an era of climate change on Qinghai-Tibetan Plateau. Agriculture, Ecosystems and Environment 2020,287,106684. [CrossRef]
  11. Wang, W.Y.; Li, W.Q.; Zhou, H.K.; Kang, Q.; Ma, X.L.; Liu, P.; Wang, Z. Dynamics of soil dissolved organic nitrogen and inorganic nitrogen pool in alpine artificial grasslands. Ecol. Environ Sci 2016, 25(1): 30-35. [CrossRef]
  12. Chen, K.; Zhou, H.K.; Lu, B.B.; Wu, Y.; Wang, J.; Zhao, Z.W.; Li, Y.Z.; Wang, M.; Zhang, Y.; Chen, W.J.; et al. Single-species artificial grasslands decrease soil multifunctionality in a temperate steppe on the Qinghai–Tibet plateau. Agronomy 2021, 11, 2092. [Google Scholar] [CrossRef]
  13. Cui, G.W.; Li, H.Y.; Sun, T. An Experimental Study of Variety Screening, Sequential Cropping, Compaction and Mixed Cropping Techniques for the Cultivation of Annual Forage Crops in Agro-pastoral Area of Tibet, China. Int. J. Agric. Biol. 2014, 16(1).
  14. Poltoretskyi, S.; Prykhodko, V.; Poltoretska, N. Agro-ecological and biological aspects of the components selection for mixed sowings of forage crops. Ukr J. Ecol 2019, 9(3): 31-36.
  15. Zhang, Q.G.; Zhang, D.Y. Competitive hierarchies inferred from pair-wise and multi-species competition experiments. Acta oecologica 2012, 38, 66–70. [Google Scholar] [CrossRef]
  16. Kayal, M.; Lenihan, H.S.; Brooks, A.J.; Holbrook, S.J.; Schmitt, R.J.; Kendall, B.E. Predicting coral community recovery using multi-species population dynamics models. Ecol. Lett 2018, 21, 1790–1799. [Google Scholar] [CrossRef]
  17. Lamb, E.G.; Kennedy, N.; Siciliano, S.D. Effects of plant species richness and evenness on soil microbial community diversity and function. Plant Soil 2011, 338, 483–495. [Google Scholar] [CrossRef]
  18. Hooper, D.U.; Chapin, F.S.; Ewel, J.J.; Hector, A.; Inchausti, P.; Lavorel, S.; Lawton, J.H.; Lodge, D.M.; Loreau, M.; Naeem, S.; et al. Effects of biodiversity on ecosystem functioning: A consensus of current knowledge. Ecol. Monogr 2005, 75, 3–35. [Google Scholar] [CrossRef]
  19. Loreau, M.; Naeem, S.; Inchausti, P.; Bengtsson, J.; Grime, J.P.; Hector, A.; Hooper, D.U.; Huston, M.A.; Raffaelli, D.; Schmid, B.; et al. Biodiversity and ecosystem functioning: Current knowledge and future challenges. Science 2001, 294, 804–808. [Google Scholar] [CrossRef] [PubMed]
  20. Van de Waal, D.B.; Elser, J.J.; Martiny, A.C.; Sterner, R.W.; Cotner, J.B. Editorial: Progress in ecological stoichiometry. Front Microbiol 2018, 9: 1957. [CrossRef]
  21. Ott, D.; Digel, C.; Rall, B.C.; Maraun, M.; Scheu, S.; Brose, U. Unifying elemental stoichiometry and metabolic theory in predicting species abundances. Ecol. Lett 2014, 17, 17(10),1247–1256. [Google Scholar] [CrossRef] [PubMed]
  22. Sanders, A.J.; Taylor, B.W. Using ecological stoichiometry to understand and predict infectious diseases. Oikos 2018, 127(10), 1399–1409. [Google Scholar] [CrossRef]
  23. Stockmann, U.; Adams, M.A.; Crawford, J.W.; Field, D.J.; Henakaarchchi, N.; Jenkins, M.; Minasny, B.; McBratney, A.B.; Vivien de Remy de Courcelles, V.R.; Singh, K.; et al. The knowns, known unknowns and unknowns of sequestration of soil organic carbon. Agr Ecosyst Environ 2013, 164, 80–99. [Google Scholar] [CrossRef]
  24. Kaye, J.P.; Hart, S.C. Competition for nitrogen between plants and soil microorganisms. Trends Ecol. Evol 1997, 12(4), 139-143. [CrossRef]
  25. Güsewell, S.; Bollens, U. Composition of plant species mixtures grown at various N: P ratios and levels of nutrient supply. Basic Appl Ecol. 2003, 4, 453–466. [Google Scholar] [CrossRef]
  26. Sinsabaugh, R.L.; Lauber, C.L.; Weintraub, M.N.; Ahmed, B.; Allison, S.D.; Crenshaw, C.; Contosta, A.R.; Cusack, D.; Frey, S.; Gallo, M.E.; et al. Stoichiometry of soil enzyme activity at global scale. Ecol. Lett 2008, 11, 1252–1264. [Google Scholar] [CrossRef]
  27. Moorhead, D.L.; Sinsabaugh, R.L.; Hill, B.H.; Weintraub, M.N. Vector analysis of ecoenzyme activities reveal constraints on coupled C, N and P dynamics. Soil Biol. Biochem 2016, 93, 1–7. [Google Scholar] [CrossRef]
  28. Cleveland, C.C.; Liptzin, D. C: N: P stoichiometry in soil: is there a “Redfield ratio” for the microbial biomass?. Biogeochemistry 2007, 85,235-252.
  29. Manzoni, S.; Čapek, P.; Mooshammer, M.; Lindahl, B.D.; Richter, A.; Šantrůčková, H. Optimal metabolic regulation along resource stoichiometry gradients. Ecol. Lett 2017, 20, 1182–1191. [Google Scholar] [CrossRef]
  30. Burns, R.G.; DeForest, J.L.; Marxsen, J.; Stromberger, M.E.; Wallenstein, M.D.; Weintraub, M.N.; Zoppini, A. Soil enzymes in a changing environment: current knowledge and future directions. Soil Biol Biochem 2013, 58, 216–234. [Google Scholar] [CrossRef]
  31. Cui, Y.X.; Moorhead, D.L.; Guo, X.B.; Peng, S.S.; Wang, Y.Q.; Zhang, X.C.; Fang, L.C. Stoichiometric models of microbial metabolic limitation in soil systems. Glob. Ecol. Biogeogr 2021, 30, 2297–2311. [Google Scholar] [CrossRef]
  32. Xue, Z.M.; Liu, C.H.; Zhou, Z.C.; Wanek, W. Extracellular enzyme stoichiometry reflects the metabolic C-and P-limitations along a grassland succession on the Loess Plateau in China. Appl Soil Ecol. 2022, 179, 104594. [Google Scholar] [CrossRef]
  33. Liu, C.H.; Wang, B.R.; Zhu, Y.Z.; Qu, T.T.; Xue, Z.J.; Li, X.Y.; Zhou, Z.C.; An, S.S. Eco-enzymatic stoichiometry and microbial non-homeostatic regulation depend on relative resource availability during litter decomposition. Ecol. Indic 2022, 145: 109729. [CrossRef]
  34. Farrer, E.C.; Suding, K.N. Teasing apart plant community responses to N enrichment: the roles of resource limitation, competition and soil microbes. Ecol. Lett 2016, 19, 1287–1296. [Google Scholar] [CrossRef] [PubMed]
  35. He, J.S.; Wolfe-Bellin, K.S.; Schmid, B.; Bazzaz, F.A. Density may alter diversity-productivity relationships in experimental plant communities. Basic Appl Ecol. 2005, 6(6), 505-517. [CrossRef]
  36. Li, W.X.; Lu, J.W.; Yang, J. Effect of fertilization on the grass yield, water utilizing and nutrition uptake of Sudan grass and Ryegrass rotation regime. Acta Prataculturae Sinica 2009, 18, 165–170. [Google Scholar] [CrossRef]
  37. Jaja, N.; Codling, E.E.; Rutto, L.K.; Timlin, D.; Reddy, V.R. Poultry litter and inorganic fertilization: effects on biomass yield, metal and nutrient concentration of three mixed-season perennial forages. Agronomy 2022, 12, 570. [Google Scholar] [CrossRef]
  38. Guretzky, J.; Kering, M.; Mosali, J.; Funderburg, E.; Biermacher, J. Fertilizer rate effects on forage yield stability and nutrient uptake of midland bermudagrass. J. Plant Nutr 2010, 33, 1819–1834. [Google Scholar] [CrossRef]
  39. Nelson, D.W.; Sommers, L.E. Total carbon, organic carbon, and organic matter. Methods of Soil Analysis Parts 3-Chemical Methods Ⅱ 1996. [CrossRef]
  40. Bao, S.D. Analysis on soil and agricultural chemistry. China Agri-cultural Press 2005, Beijing.
  41. Vance, E.D.; Brookess, P.C.; Jenkinson, D.S. An extraction method for measuring soil microbial biomass C. Soil Biol Biochem 1987, 19, 703–707. [Google Scholar] [CrossRef]
  42. Brookes, P.C.; Landman, A.; Pruden, G.; Jenkinson, D.S. Chloro-form fumigation and the release of soil nitrogen: a rapid direct extraction method to measure microbial biomass nitrogen in soil. Soil Biol Biochem 1985, 17, 837–842. [Google Scholar] [CrossRef]
  43. Brookes, P.C.; Powlson, D.S.; Jenkinson, D.S. Measurement of microbial biomass phosphorus in soil. Soil Bio Biochem 1982, 14(4): 319-329. [CrossRef]
  44. Hu, Y.; Lu, Y.H.; Liu, C.K.; Shang, P.; Liu, J.; Zheng, C.M. Sources and Dynamics of Dissolved Inorganic Carbon, Nitrogen, and Phosphorus in a Large Agricultural River Basin in Arid Northwestern China. Water 2017, 9, 415. [Google Scholar] [CrossRef]
  45. De Cesare, D.; Sassone-Corsi, P. Transcriptional regulation by cyclic AMP-responsive factors. Prog Nucleic Acid Re 2000, 64, 343–369. [Google Scholar] [CrossRef]
  46. Grandy, A.S.; Sinsabaugh, R.L.; Neff, J.C. Nitrogen deposition effects on soil organic matter chemistry are linked to variation in enzymes, ecosystems and size fractions. Biogeochemistry 2008, 91(1): 37-49. [CrossRef]
  47. Zhang, L.L.; Wu, Z.J.; Chen, L.J.; Li, D.P.; Ma, X.Z.; Shi, Y.F. A microplate fluorimetric assay for sacchariase activity measurement. Spectrosc Spect Anal 2009, 29, 1341–1344. [Google Scholar] [CrossRef]
  48. Jiang, W.T.; Yuan, G.Y.; Shen, Y.Y.; Yang, X.L. Effects of temperature and mixed sowing ratio on growth and interspecific competition of Onobrychis viciaefolia and Elymus nutans community. Chinese Journal of Grassland 2021, 43, 22–29. [Google Scholar] [CrossRef]
  49. Siebenkäs, A.; Schumacher, J.; Roscher, C. Resource availability alters biodiversity effects in experimental grass-forb mixtures. PLOS One 2016, 11(6): 1-21. [CrossRef]
  50. Pantel, A.; Romo, J.T.; Bai, Y. Above-ground net primary production for Elymus lanceolatus and Hesperostipa curtiseta after a single defoliation event. Rangeland Ecol Manag 2011, 64(3), 283–290. [Google Scholar] [CrossRef]
  51. Harrison, K.; Hebda, R.J. A morphometric analysis of variation between Elymus alaskanus and Elymus violaceus (Poaceae): implications for recognition of taxa. Madroño 2011, 58(1), 32-49. [CrossRef]
  52. Soe Htet, M.N.; Wang, H.L.; Yadav, V.; Sompouviseth, T.; Feng, B. Legume Integration Augments the Forage Productivity and Quality in Maize-Based System in the Loess Plateau Region. Sustainability 2022, 14, 6022. [Google Scholar] [CrossRef]
  53. Bork, E.W.; Gabruck, D.T.; McLeod, E.M.; Hall, L.M. Five-year forage dynamics arising from four legume-grass seed mixes. Agron. J 2017, 109, 2789–2799. [Google Scholar] [CrossRef]
  54. Li, T.F.; Peng, L.X.; Wang, H.; Zhang, Y.; Wang, Y.X.; Cheng, Y.X.; Hou, F.J. Multi-cutting improves forage yield and nutritional value and maintains the soil nutrient balance in a rainfed agroecosystem. Front Plant Sci 2022, 13. [Google Scholar] [CrossRef]
  55. Ginwal, D.S.; Kumar, R., Ram, H.; Meena, R.K.; Kumar, U. Quality characteristics and nutrient yields of maize and legume forages under changing intercropping row ratios. Indian J. Anim. Sci 2019, 89(3),281-286. [CrossRef]
  56. Iqbal, A.; Akbar, N.; Khan, H.Z. Productivity of summer legume forages intercropped with maize as affected by mixed cropping in different sowing techniques. J. Anim. Plant Sci 2012, 22, 758–763. [Google Scholar]
  57. Bork, E.W.; Gabruck, D.T.; McLeod, E.M.; Hall, L.M. Five-year forage dynamics arising from four legume-grass seed mixes. Agron. J 2017, 109, 2789–2799. [Google Scholar] [CrossRef]
  58. Pocheville, A. The ecological niche: history and recent controversies. Handbook of evolutionary thinking in the sciences 2015, 547-586.
  59. White, A.; Darby, H.; Ruh, L.; Sands, B. Long term influence of alternative corn cropping practices and corn-hay rotations on soil health, yields and forage quality. Front. Environ. Sci 2023, 11: 243. [CrossRef]
  60. Letten, A.D.; Ke, P.J.; Fukami, T. Linking modern coexistence theory and contemporary niche theory. Ecol. Monogr 2017, 87(2): 161-177. [CrossRef]
  61. Tilman, D.; Reich, P.B.; Knops, J.; Wedin, D.; Mielke, T.; Lehman, C. Diversity and productivity in a long-term grassland experiment. Science 2001, 294, 843–845. [Google Scholar] [CrossRef]
  62. Li, L.; Tilman, D.; Lambers, H.; Zhang, F.S. Plant diversity and overyielding: insights from belowground facilitation of intercropping in agriculture. New Phytol 2014, 203, 63–69. [Google Scholar] [CrossRef]
  63. Ziadi, N.; Simard, R.R.; Allard, G.; Parent, G. Yield response of forage grasses to N fertilizer as related to spring soil nitrate sorbed on anionic exchange membranes. Can. J. Soil Sci 2000, 80, 203–212. [Google Scholar] [CrossRef]
  64. Buche, L.; Spaak, J.W.; Jarillo, J. Niche differences, not fitness differences, explain predicted coexistence across ecological groups. J. Ecol. 2022, 110(11): 2785-2796. [CrossRef]
  65. Spaak, J.W.; Carpentier, C.; De Laender, F. Species richness increases fitness differences, but does not affect niche differences. Ecol. Lett 2021, 24, 2611–2623. [Google Scholar] [CrossRef]
  66. Schaub, S.; Finger, R.; Leiber, F.; Probst, S.; Kreuzer, M.; Weigelt, A.; Buchmann, N.; Scherer-Lorenzen, M. Plant diversity effects on forage quality, yield and revenues of semi-natural grasslands. Nat. Commun 2020, 11, 768. [Google Scholar] [CrossRef]
  67. Adler, P.B.; Smull, D.; Beard, K.H.; Choi, R.T.; Furniss, T.; Kulmatiski, A.; Meiners, J.M.; Tredennick, A.T.; Veblen, K.E. Competition and coexistence in plant communities: intraspecific competition is stronger than interspecific competition. Ecol. Lett 2018, 21, 1319–1329. [Google Scholar] [CrossRef] [PubMed]
  68. Shi, Y.J.; Gao, S.; Zhou, D.H.; Liu, M.X.; Wang, J.F.; Knops, J.M.H.; Mu, C.S. Fall nitrogen application increases seed yield, forage yield and nitrogen use efficiency more than spring nitrogen application in Leymus chinensis, a perennial grass. Field Crop Res 2017, 214, 66–72. [Google Scholar] [CrossRef]
  69. Loreau, M.; de Mazancourt, C. Species synchrony and its drivers: neutral and nonneutral community dynamics in fluctuating environments. Am. Nat 2008, 172, E48–E66. [Google Scholar] [CrossRef]
  70. Kreyling, J.; Beierkuhnlein, C.; Ellis, L.; Jentsch, A. Invasibility of grassland and heath communities exposed to extreme weather events–additive effects of diversity resistance and fluctuating physical environment. Oikos 2008, 117, 1542–1554. [Google Scholar] [CrossRef]
  71. 71bPetersen, U.; Isselstein, J. Nitrogen addition and harvest frequency rather than initial plant species composition determine vertical structure and light interception in grasslands. AoB Plants 2015, 7. [Google Scholar] [CrossRef]
  72. Chapin Iii, F.S.; Zavaleta, E.S.; Eviner, V.T.; Naylor, R.L.; Vitousek, P.M.; Reynolds, H.L.; Hooper, D.U.; Lavorel, S.; Sala, O.E.; Hobbie, S.E. Consequences of changing biodiversity. Nature 2000, 405, 234–242. [Google Scholar] [CrossRef]
  73. Jungers, J.M.; DeHaan, L.R.; Betts, K.J.; Sheaffer, C.C.; Wyse, D.L. Intermediate wheatgrass grain and forage yield responses to nitrogen fertilization. Agron J. 2017, 109, 462–472. [Google Scholar] [CrossRef]
  74. Zechmeister-Boltenstern, S.; Keiblinger, K.M.; Mooshammer, M.; Peñuelas, J.; Richter, A.; Sardans, J.; Wanek, W. The application of ecological stoichiometry to plant–microbial–soil organic matter transformations. Ecol. Monogr 2015, 85(2), 133–155. [Google Scholar] [CrossRef]
  75. Bai, X.J.; Dippold, M.A.; An, S.; Wang, B.R.; Zhang, H.X.; Sebastian, L. Extracellular enzyme activity and stoichiometry: The effect of soil microbial element limitation during leaf litter decomposition. Ecol. Indic 2021, 121, 107200. [Google Scholar] [CrossRef]
  76. Schimel, J.P.; Weintraub, M.N. The implications of exoenzyme activity on microbial carbon and nitrogen limitation in soil: a theoretical model. Soil Biol. Biochem 2003, 35, 549–563. [Google Scholar] [CrossRef]
  77. Sterner, R.W.; Elser, J.J. Stoichiometry and homeostasis. In: Sterner, R.W., Elser, J.J. (Eds.), Ecological Stoichiometry: The Biology of Elements from Molecules to the Bio-Sphere. Princeton University Press 2017, Princeton, NJ, USA, 1–43.
  78. Tessier, J.T.; Raynal, D.J. Use of nitrogen to phosphorus ratios in plant tissue as an indicator of nutrient limitation and nitrogen saturation. J. Appl. Ecol 2003, 40, 523–534. [Google Scholar] [CrossRef]
  79. Elser, J.J.; Acharya, K.; Kyle, M.; Cotner, J.; Makino, W.; Markow, T.; Watts, T.; Hobbie, S.; Fagan, W.; Schade, J.; et al. Growth rate–stoichiometry couplings in diverse biota. Ecol. Lett 2003, 6, 936–943. [Google Scholar] [CrossRef]
  80. Fujita, Y.; de Ruiter, P.C.; Wassen, M.J.; Heil, G.W. Time-dependent, species-specific effects of N: P stoichiometry on grassland plant growth. Plant Soil 2010, 334: ,99-112. [CrossRef]
  81. Feldhaar, H. Ant nutritional ecology: linking the nutritional niche plasticity on individual and colony-level to community ecology. Curr. Opin. Insect Sci. 2014, 5, 25–30. [Google Scholar] [CrossRef]
  82. Kering, M.K.; Guretzky, J.; Funderburg, E.; Mosali, J. Effect of nitrogen fertilizer rate and harvest season on forage yield, quality, and macronutrient concentrations in midland Bermuda grass. Commun. Soil Sci. Plant Anal 2011, 42, 1958–1971. [Google Scholar] [CrossRef]
  83. Wang, F.; Weil, R.R.; Nan, X.X. Total and permanganate-oxidizable organic carbon in the corn rooting zone of US Coastal Plain soils as affected by forage radish cover crops and N fertilizer. Soil Till Res 2017, 165, 247–257. [Google Scholar] [CrossRef]
  84. Malhi, S.S.; Nyborg, M.; Soon, Y.K. Long-term effects of balanced fertilization on grass forage yield, quality and nutrient uptake, soil organic C and N, and some soil quality characteristics. Nutr Cycl Agroecosys 2010, 86, 425–438. [Google Scholar] [CrossRef]
  85. Lu, J.Y.; Tian, H.; Zhang, H.S.; Xiong, J.B.; Yang, H.M.; Liu, Y. Shoot-soil ecological stoichiometry of alfalfa under nitrogen and phosphorus fertilization in the Loess Plateau. Sci. Rep 2021, 11, 1–10. [Google Scholar] [CrossRef]
  86. Liu, Q.; Xu, H.W.; Yi, H.J. Impact of fertilizer on crop yield and C: N: P stoichiometry in arid and semi-arid soil. Int. J. Environ 2021, 18, 4341. [Google Scholar] [CrossRef] [PubMed]
  87. Sokol, N.W.; Sanderman, J.; Bradford, M.A. Pathways of mineral-associated soil organic matter formation: Integrating the role of plant carbon source, chemistry, and point of entry. Glob Chang Biol 2019, 25, 12–24. [Google Scholar] [CrossRef] [PubMed]
  88. Sinsabaugh, R.L. Phenol oxidase, peroxidase and organic matter dynamics of soil. Soil BiolBiochem 2010, 42, 391–404. [Google Scholar] [CrossRef]
  89. Zhang, X.Y.; Jia, J.; Chen, L.T.; Chu, H.Y.; He, J.S.; Zhang, Y.J.; Feng, X.J. Aridity and NPP constrain contribution of microbial necromass to soil organic carbon in the Qinghai-Tibet alpine grasslands. Soil Biol Biochem 2021, 156, 108213. [Google Scholar] [CrossRef]
Figure 1. The RYT and OY of different sowing combinations under fert. and non-fert. treatments. Note: Uppercase letters mean different fertilization treatments of the same sowing combination (P<0.05); Different lowercase letters mean different sowing combinations of the same fertilization treatments (P<0.05). RYT, relative yield total; OY, Over-yield; Ⅰ. +Ⅱ., El. N + El. T; Ⅰ. +Ⅲ., El. N + Po. L; Ⅱ.+Ⅲ., El. T + Po. L; Ⅰ. + Ⅱ.+Ⅲ., El. N + El. T + Po. L The same below.
Preprints 120880 g001
Figure 2. The OY1 and OY2 of different sowing combinations under fert. and non-fert. treatments Note: Uppercase letters mean different fertilization treatments of the same sowing combination (P<0.05); Different lowercase letters mean different sowing combinations of the same fertilization treatments (P<0.05). OY1, Transgressive overyielding effect 1; OY2, Transgressive overyielding effect 2; Ⅰ. +Ⅱ., El. N + El. T; Ⅰ. +Ⅲ., El. N + Po. L; Ⅱ.+Ⅲ., El. T + Po. L; Ⅰ. + Ⅱ.+Ⅲ., El. N + El. T + Po. L The same below.
Preprints 120880 g002
Figure 3. Redundancy analysis (RDA) identifies the relationships between forage yield indicators and soil ecological stoichiometric ratios under fert. treatment.Note: RYT, relative yield total; OY, Over-yield; OY1, Transgressive overyielding effect 1; OY2, Transgressive overyielding effect 2; Soil total nutrients stoichiometry (C/N, C/P and N/P); Soil dissolved nutrients stoichiometry (DC/DN, DC/DP and DN/DP); Soil microbial biomass stoichiometry (MBC/MBN, MBC/MBP and MBN/MBP) and soil extracellular enzyme stoichiometry (C/N-enzyme, C/P-enzyme and N/P-enzyme) under the fert. treatments. The significance level of the simple effect was P<0.05* and P<0.01**.
Preprints 120880 g003
Figure 4. Redundancy analysis (RDA) identifies the relationships between forage yield indicators and soil ecological stoichiometric ratios under non-fert. treatment. Note: RYT, relative yield total; OY, Over-yield; OY1, Transgressive overyielding effect 1; OY2, Transgressive overyielding effect 2; Soil total nutrients stoichiometry (C/N, C/P and N/P); Soil dissolved nutrients stoichiometry (DC/DN, DC/DP and DN/DP); Soil microbial biomass stoichiometry (MBC/MBN, MBC/MBP and MBN/MBP) and soil extracellular enzyme stoichiometry (C/N-enzyme, C/P-enzyme and N/P-enzyme) under the non-fert. treatments. The significance level of the simple effect was P<0.05* and P<0.01**.
Preprints 120880 g004
Figure 5. The effect of soil ecological stoichiometry on forage yield indicators Note: Variance partitioning analysis (VPA) was performed to determine the effect of soil ecological stoichiometry on forage yield indicators. Soil total nutrients stoichiometry (C/N, C/P and N/P); Soil dissolved nutrients stoichiometry (DC/DN, DC/DP and DN/DP); Soil microbial biomass stoichiometry (MBC/MBN, MBC/MBP and MBN/MBP) and soil extracellular enzyme stoichiometry (C/N-enzyme, C/P-enzyme and N/P-enzyme) under the non-fert. treatments. The significance level of the simple effect was P<0.05* and P<0.01**.
Preprints 120880 g005
Table 1. Dynamic change of aboveground biomass under different sowing combinations.
Sowing combinations Component Sampling time (Month-day)
Fert. No-Fert.
7-20 8-20 9-20 7-20 8-20 9-20
Ⅰ., Ⅱ., Ⅲ. Ⅰ. -- El. N 361.51 1003.47 1972.35 91.49 620.59 91.49
Ⅱ. -- El. T 334.29 702.02 801.46 32.14 337.65 39.64
Ⅲ. -- Po. L 208.58 1177.15 2188.39 36.16 634.82 36.16
Ⅰ. + Ⅱ. Ⅰ. 378.50 775.79 1848.49 54.98 368.69 812.92
Ⅱ. 38.51 375.08 778.99 21.75 273.33 169.60
Total 417.01 1150.87 2627.48 76.73 642.02 982.52
Ⅱ. + Ⅲ . Ⅱ. 354.55 841.55 1755.33 87.47 464.21 792.9
Ⅲ. 107.82 348.57 336.59 24.97 278.80 128.28
Total 462.37 1190.13 2091.91 112.43 743.02 921.07
Ⅰ. +Ⅲ. Ⅰ. 165.06 588.58 1074.38 53.15 365.41 314.18
Ⅲ. 70.91 355.11 329.16 33.72 332.90 141.25
Total 235.98 943.69 1403.54 86.87 698.31 455.43
Ⅰ. + Ⅱ. + Ⅲ. Ⅰ. 434.00 958.97 2280.90 128.17 489.80 1019.95
Ⅱ. 22.29 557.55 268.95 45.10 310.07 174.60
Ⅲ. 19.06 480.08 243.19 36.73 267.79 168.54
Total 475.35 1996.60 2793.04 209.99 1067.67 1363.09
Disclaimer/Publisher’s Note: The statements, opinions and data contained in all publications are solely those of the individual author(s) and contributor(s) and not of MDPI and/or the editor(s). MDPI and/or the editor(s) disclaim responsibility for any injury to people or property resulting from any ideas, methods, instructions or products referred to in the content.
Copyright: This open access article is published under a Creative Commons CC BY 4.0 license, which permit the free download, distribution, and reuse, provided that the author and preprint are cited in any reuse.
Prerpints.org logo

Preprints.org is a free preprint server supported by MDPI in Basel, Switzerland.

Subscribe

© 2024 MDPI (Basel, Switzerland) unless otherwise stated