1. Introduction
The energy and power densities of a source are responsible for the effective performance of a standalone load that is not connected to the grid [
1]. For example, in a battery electric vehicle (BEV), the battery suffers from many short-term transients which require colossal power [
2,
3,
4]. Being a single source and due to these transients, the battery’s performance gets degraded [
5,
6]. In literature, multiple storage is identified as the only option to safeguard the battery. The ultracapacitor (UC) technology is one of the best hybridization sources due to its favorable properties [
7,
8,
9,
10,
11,
12].
To control the power transaction between the sources and the load, various EMSs are reported in the literature as rule-based and optimization-based. Being simple in nature, easily understandable, and real-time implementable, the rule-based EMS is preferred widely [
13,
14,
15,
16]. A review on intelligent energy management system for electrified vehicles is presented in [
13] where characteristics of rule-based EMSs are discussed. In [
14], a novel rule-based approach has been devised to achieve effective power balance between battery and supercapacitor. The supercapacitor is in a charged state at the end of each cycle in this method. On board transaction strategy is discussed in [
15]. Reference [
16] shows how rule-based EMS can be applied to solar, fuel cell and biomass energy storage systems. Classical EMSs are widely available in the literature [
11,
17,
18,
19]. Dc-link voltage regulation is considered as a prime controlling factor in microgrid systems in [
11]. UC voltage and battery current rate regulation are taken as essential criterion in [
17]. In [
18], a diesel generator, a battery, and a photovoltaic system are utilized as HESS to provide power supply in critical circumstances. The management of the energy is dependent on fuzzy rules-based EMS. Multiple sources like battery, UC, photovoltaic (PV) panel, and fuel cell (FC) and their integration in a specific manner are presented in [
20] with a power tracking control mechanism. For battery-UC hybrid energy storage system (HESS), a control algorithm based on energy is presented in [
21] for a grid system. Reference [
22] has demonstrated that the UC’s SOC is a controlling factor for generating the battery’s reference current. Fuzzy logic controllers are also reported for controlling UC voltage, battery peak power, power allocation, and energy level handling [
23,
24,
25].
The way of interconnection between the battery and UC decides the topologies. These topologies are important in regulating the source parameters. A passive topology lacks any control over performance indicators as converters are not present [
26]. In a semi-active topology, only one converter is utilized, and the performance indicators of the other source remain uncontrolled. This strategy increases the current of the controlled source. In this strategy, the current of the controlled source increases [
27]. Cascade topology is also employed to enhance battery life. However, as a series connection, the control is intricate and frequent charging of the UC is necessary [
28]. Multiport topologies have been developed that are both compact and complex, capable of utilizing multiple sources [
29,
30]. The existing and proposed topologies are compared and presented in [
31]. The shared bus topology is widely used to control performance indicators because it employs individual converters for the sources, making the control process straightforward [
32,
33].
Rule-based EMSs suffer in pinpoint power distribution, but they ease in real-time implementation. Optimization-based EMS overcomes this limitation, but its real-time implementation is complex. Also, limited work is verified through hardware development. In [
26], a review of different EMSs is presented. The conventional and modified rule-based EMS (MRB-EMS) is presented in [
34,
35]with DC-link voltage compensation. Accurate power allocation with a fuzzy logic controller is presented in [
36].
In this experimental study, a hardware setup is developed with the help of the dSPACE MicroLabBox controller, converters, sources, level shifters, driver circuits, and sensors. Two different modes of power-sharing strategy are examined here. These modes are low and high-power-demand modes. DC-link voltage or load voltage is regulated to 48V irrespective of load power variations. Battery current rate limiter is also implemented and examined. The results analyzed after a detailed experimental study concur with the simulation results and confirm the effectiveness of the proposed power allocation strategy.
This paper is organized as follows. The circuit topology and its operation are discussed in Section - 2.
Section 3 gives an overview of EMS and its development. The component design and selection of ratings are presented in Section – 4. The experimental setup and its discussion are given in section – 5. The performance analysis is provided in Section – 6, and Section – 7 presents the conclusion.
2. Topology and Modes of Operation
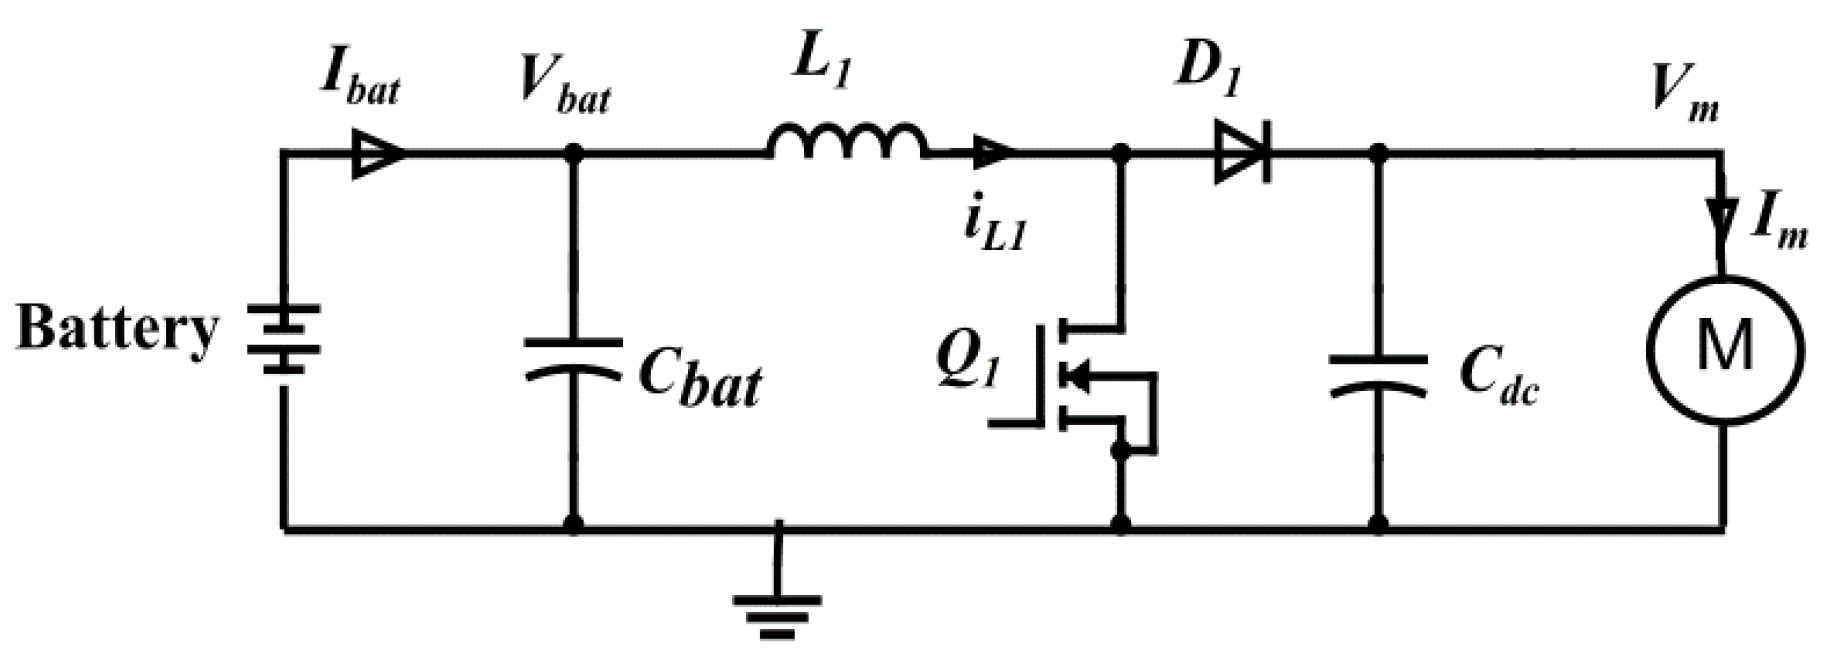
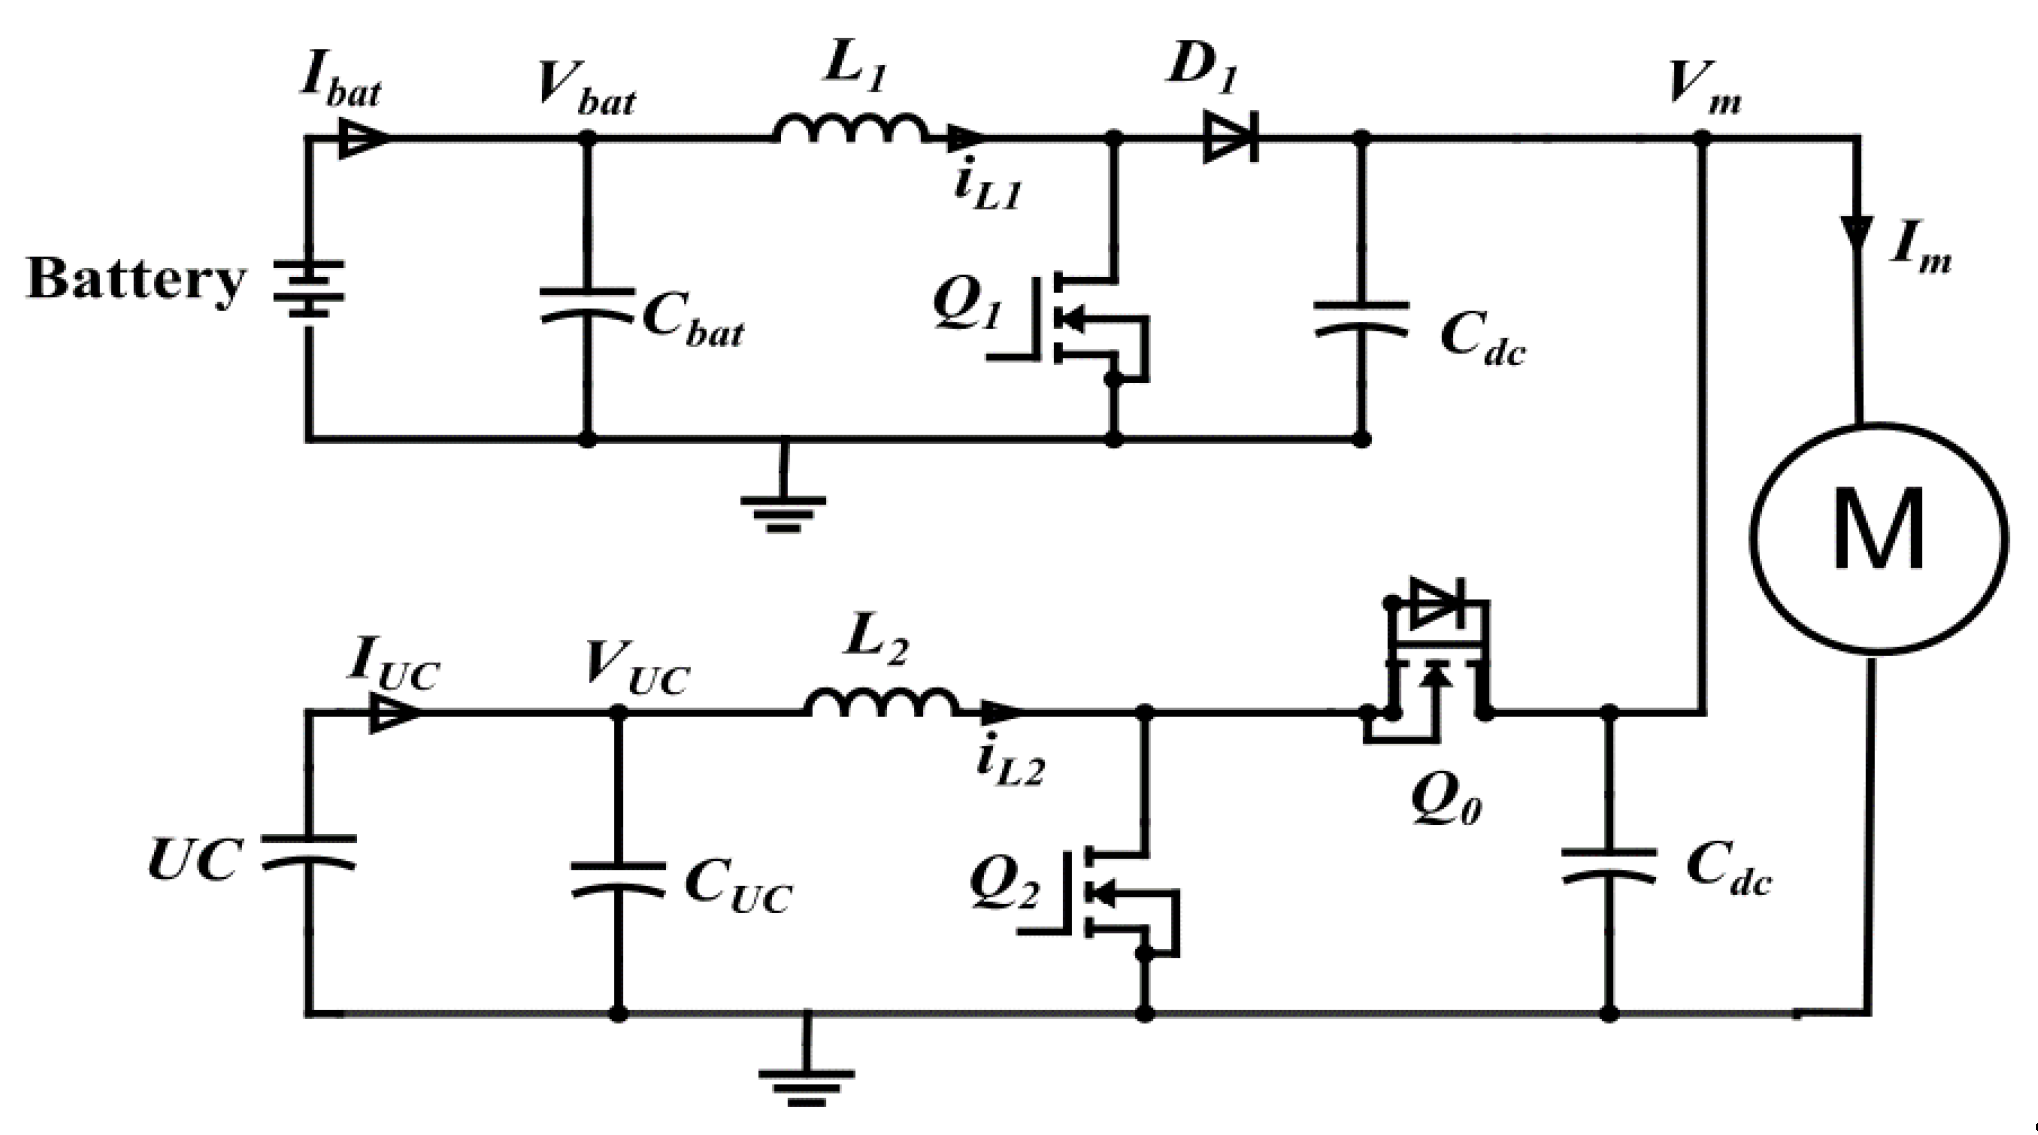
The performance indicators are effectively controlled by shared bus topology. It consists of a boost and one bidirectional dc-dc converter. The boost converter controls the power flow between the battery and the load, whereas the bi-directional converter controls the power transaction between UC and the load. The circuit topologies are shown in
Figure 1 and
Figure 2. The working patterns of the switches Q1, Q2, and Q0, decide their modes of operation. For experimental study purposes, two modes are explored and studied.
2.1. Mode I – Low Power Demand Mode (LPDM)
In this mode, the required load power is less than the base power. The battery alone is sufficient to tackle the load requirement. After analyzing the complete power profile, base power is defined. The base power should be such that the battery should able to provide it easily. It is a transient free power. The circuit configuration for LPDM is presented in
Figure 1. It shows the battery voltage (
Vbat), battery current (
Ibat), load voltage (
Vm), load current (
Im), input capacitor (
Cbat), Inductor (
L1), Inductor current (
iL1), switch (
Q1), diode (
D1), and dc-link capacitor (
Cdc), all related to the boost converter circuit.
Expression for load voltage for this mode is given by Equation (1).
2.2. Mode II – High Power Demand Mode (HPDM)
In this mode, the power required by the load is more than the base power. This additional requirement of power is fulfilled by the UC bank.
Figure 2 represents the circuit configuration for this mode of operation. It shows the UC voltage (
VUC), UC current (
IUC), input capacitor (
CUC), inductor (
L2), inductor current (
iL2), and switches (
Q2 and
Q0), all related to the bi-directional converter circuit.
dQ1 and
dQ2 are the duty ratios of the two pulses generated for
Q1 and
Q2 switches respectively. In this mode, both converters operate together to provide the required power to the load.
Equations (2) – (6) represent the operation of this mode. Here, two pulses are generated for the switches
Q1 and
Q2 simultaneously for the operation.
3. Energy Management Strategy
A modified EMS for effective control over performance indicator is presented in [
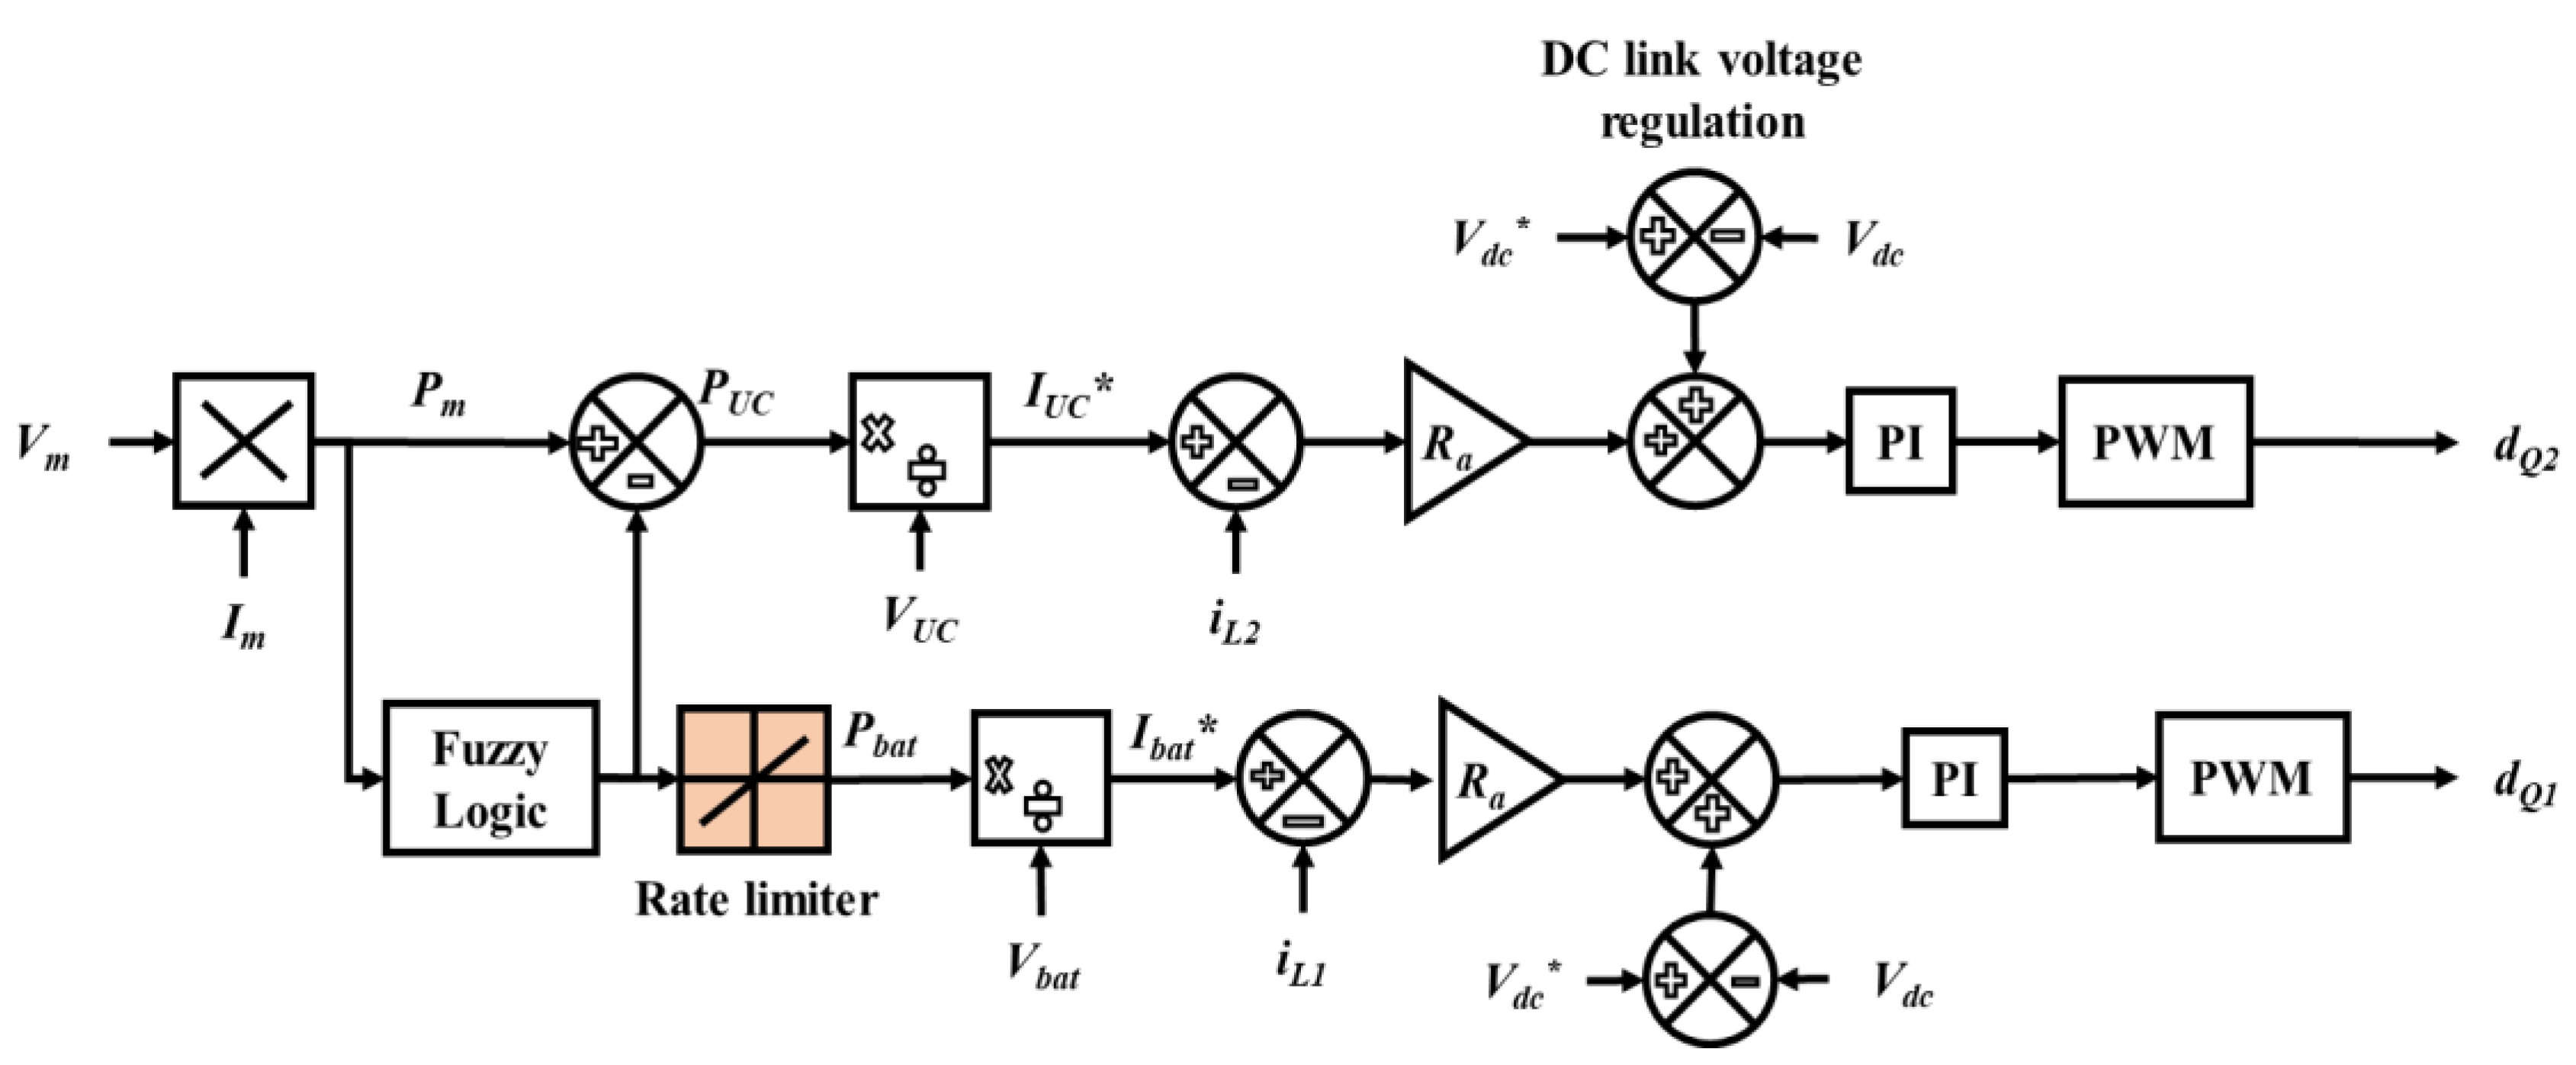
31]. A fuzzy logic controller is used to allocate the power between the battery and UC. In this experimental study, DC-link voltage regulation, power allocation, and rate limiter functionality are the main focus of the investigation. The control strategy used for the experimental verification is shown in
Figure 3.
The total load power (Pm) is calculated from load voltage (Vm) and load current (Im). The fuzzy logic controller allocates power commands to the battery (Pbat). The UC power (PUC) allocation is obtained from load and battery power. Based on Pbat and PUC, current signals Ibat* and IUC* are generated by dividing the power by voltages. Error in battery and UC current is generated by the difference between iL1 and iL2. The resistance Ra converts the error signal into a voltage signal. A DC-link voltage compensation loop regulates the voltage at a constant value of 48 V. Vdc* is taken as reference DC-link voltage. Vdc is the generated DC link voltage. PI controllers minimizes the error, which helps in effective PWM pulse generation for switches Q1 and Q2. The rate limiter performs its function well and limits the high rise of battery current.
The high rising rate of battery current degrades the battery performance. In literature, experiments are performed on lithium batteries with a high discharging current rate, and its impact is noticed. 83C discharging current was imposed on a 3Ah lithium battery, while standard discharging was 1C. As a result, after 400 cycles, it was found that a 20% reduction in capacity occurred along with the reduction in battery life [
37]. Another experiment on lithium-ion phosphate battery had a 2.6 Ah capacity and a standard discharge rate of 1C. The pulsed discharging current imposed was 10.8C. After 700 cycles, 22.8% capacity got reduced and the life cycle by 38%. So, in this experiment, the implemented rate limiter protects the battery from a high current rate. The rising rate used is 100 watts/s based on [
31].
Expressions involved in generating gate pulses for the power switches are shown in Equation (7) as follows –
The battery power (
Pbat) is given by,
where,
The battery power at current step is with respect to time . is the battery power in previous step with time . The steps involved in calculating the rate are power and time in the initial and previous stages. These steps decide the slew rate, whether it is rising or falling.
The output
Y(Pbat) is based on Equations (8) and (9). The rising slew rate (
R) and falling slew rate (F) decide the output nature. The sample time is
.
Gate pulse
dQ1 for switch
Q1 is given by Equation (10).
The kp and ki values are 0.008 and 0.001, respectively.
Equation (11) represents the gate pulse for switch
Q2.
The kp and ki values for gate pulse dQ2 are 0.1 and 0.01, respectively.
The expression of energy with respect to time (
En(t)) is given by Equation (12). This expression is used to calculate the total energy transfer and percentage of energy saved.
4. Rating Selection and Design
4.1. Selection of Battery Rating
Equation (12) provides the energy requirement of the load. The battery should be able to deliver this energy requirement for a load running at 48V with current 25A for 1.5 hours, the energy required will be 1.8kWh. To meet this requirement, the selected battery rating is 24V and 100Ah.
4.2. UC Rating Selection
UC is used to protect the battery during peak power demand mode. This UC should drive and accept the energy from load.
The rating of the UC is calculated based on total energy required (
WUC) and is tabulated in
Table 1.
4.3. Converter Rating Selection
Converters are the medium of power exchange. A well-designed converter provides better efficiency. Converter component rating selection is done through Equations (13) – (17) [
38].
The converter efficiency is
ƞc, and the ripples in voltage and current are Δ
Vm and Δ
iL2, respectively. The duty cycle for the boost converter is
d1, and for the bidirectional converter, it is
d2. The input capacitance for the battery and UC are
CUC and
Cbat, respectively.
fs is the switching frequency. The parameters of the converter are shown in
Table 2. The inductor value is taken as 1.5 mH and the input capacitor as 1200 μF. The value of the output capacitor is 1200 μF.
5. Experimental Setup
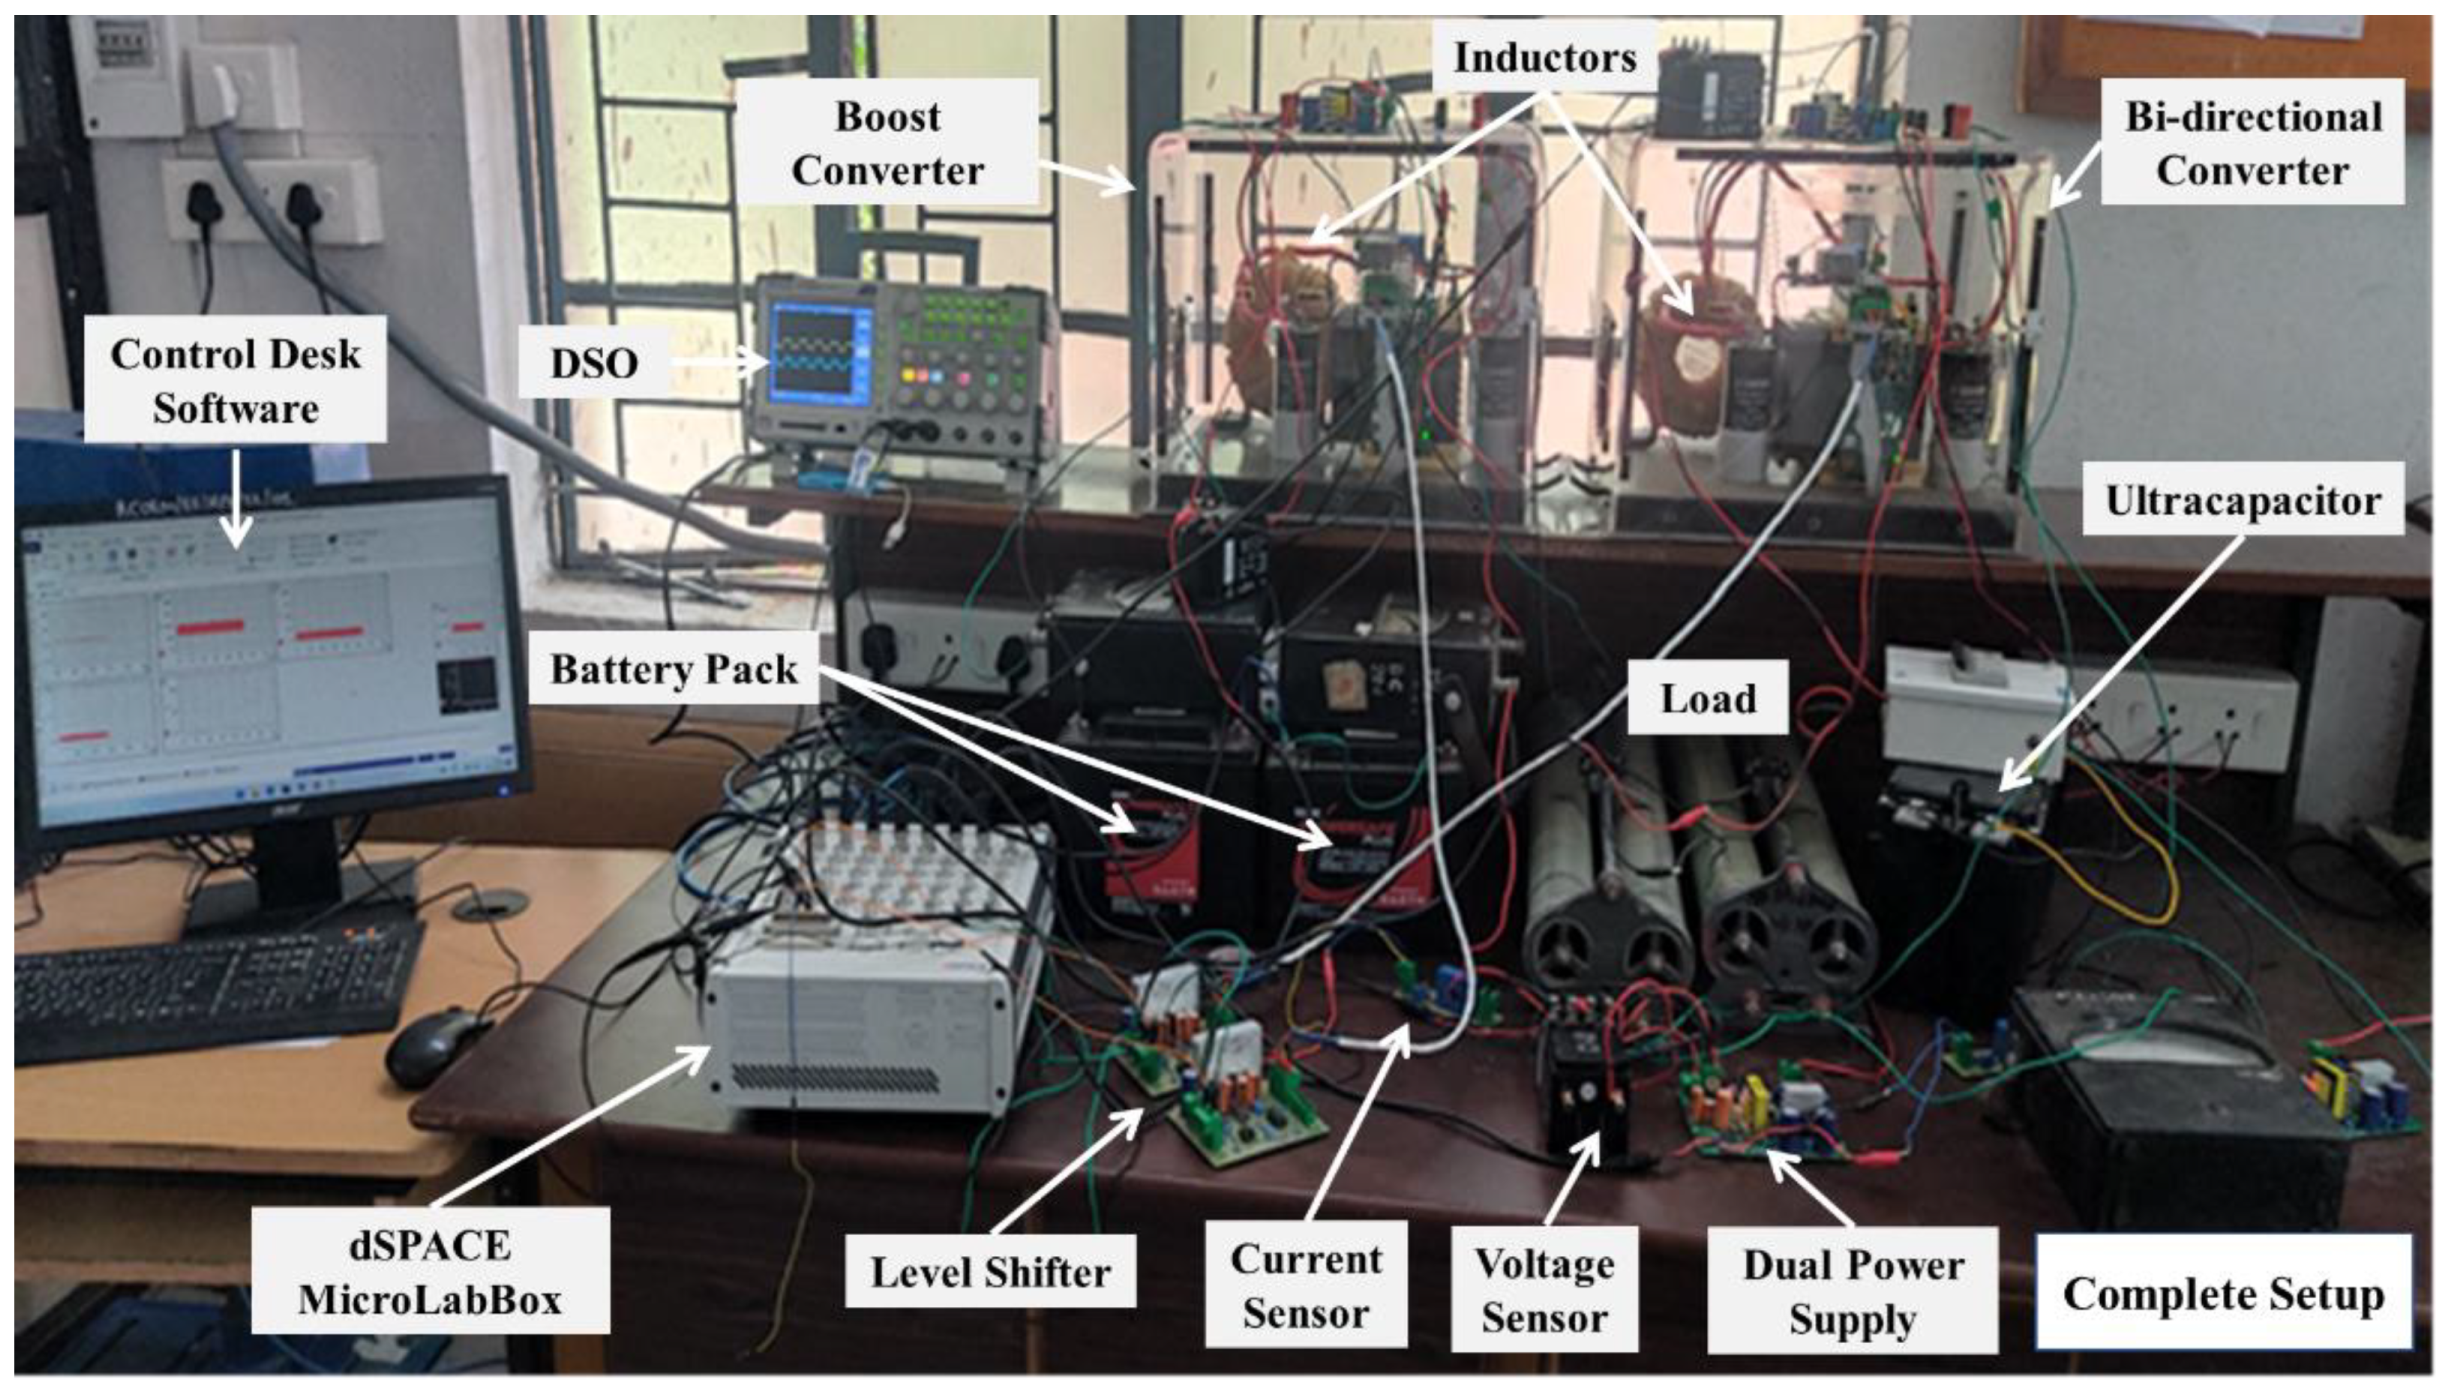
For experimental verification, dSPACE MicroLabBox is used as a controller. The complete experimental setup is shown in
Figure 4. Six analog signals (load voltage and current, battery voltage and battery-boost inductor current, UC voltage, and UC-bidirectional inductor current) are used to develop the EMS for the converters in the real-time interface with dSPACE MicroLabBox. Two digital output pulses are developed for the triggering of converter modules. These two digital pulses have a level of 3.3V, but for the triggering of IGBT, the pulse level should be 15V. A level shifter shifts the pulse level from 3.3V to 15V. The level shifter is powered by 20V AC, which is provided by a 20-0-20 single-phase step-down transformer.
The analog input pin interface of the controller is used to develop the control strategy in real-time environment for the converters. Three current sensors for the inductor current and load current are used for both converters. The conversion ratio of these current sensors is 1A/1mA. Three voltage sensors, each for load voltage, battery voltage, and UC voltage, are used to give the analog signal input to the controller. 10kHz switching frequency is used for the operation of the converters. Shared bus topology is used for the effective control of the performance indicators. The components used in the hardware development are presented in
Table 3.
A variable resistor is used by keeping the DC-link voltage constant to achieve variable power. Operation of the converters are in boost mode.
The main concern in this verification model is the real-time power-sharing strategy for different load conditions. In this experiment, the base power selected is 70 watts. If the total load power requirement is below the base power, the battery will provide the power required by the load. If the power of load needed is higher than the base power, then UC will assist the battery with the increased load power, and both will satisfy the required load power. LPDM and HPDM are two different load conditions used for power-sharing verification.
6. Performance Analysis
In this section of research work, the real-time output results are discussed in context with the power-sharing and DC-link voltage regulation. A comparative analysis of results are performed on the results obtained on the basis of the power demanded mode.
6.1. Analysis for Low Power Demand Mode
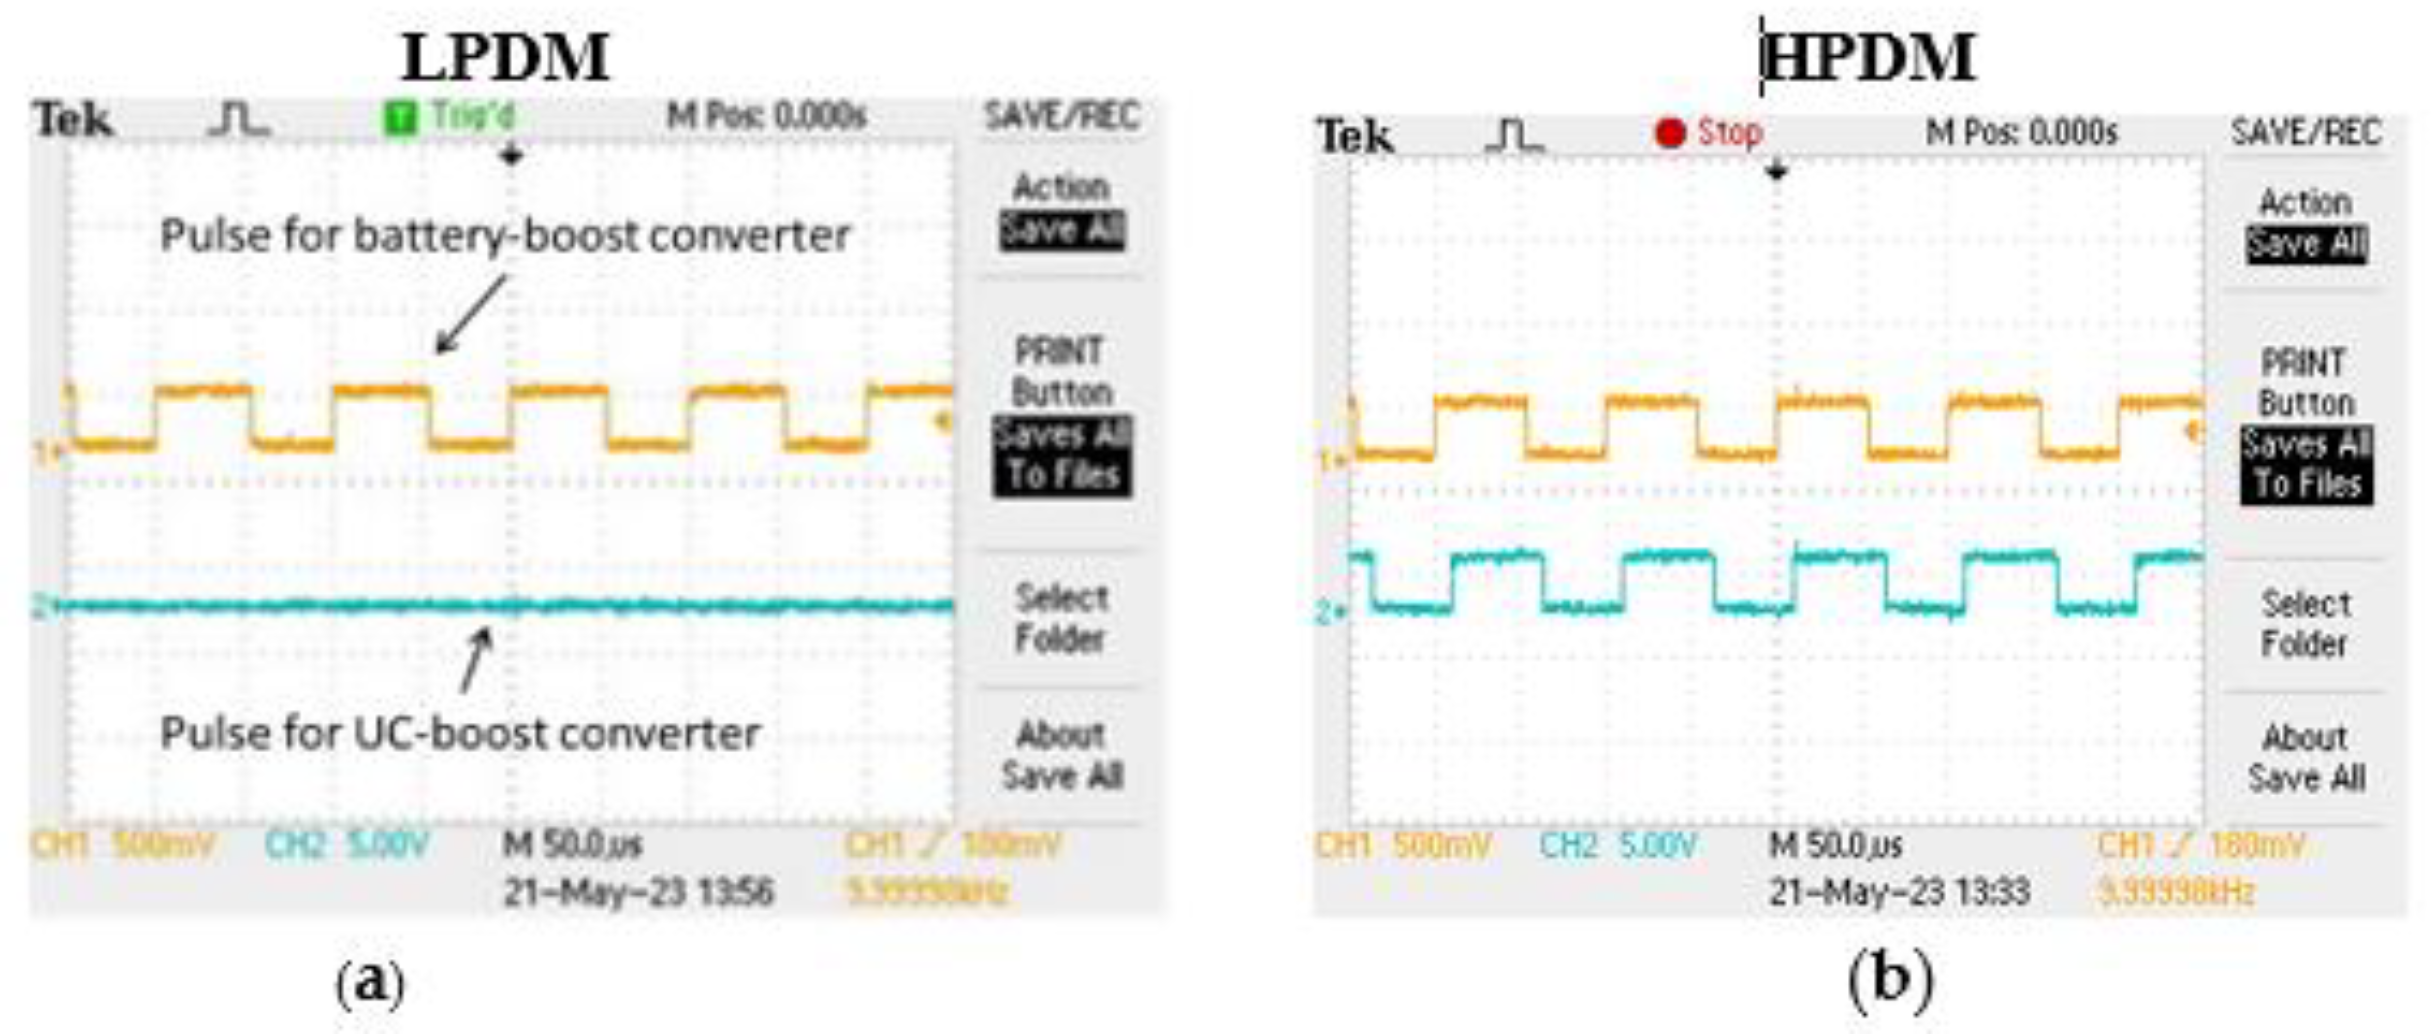
The pulses are generated in real-time for both modes and are shown in
Figure 5. In
Figure 5a, the pulse is generated for switch
Q1 only because in LPDM, the battery alone operates. In
Figure 5b, the pulses are generated for both switches
Q1 and
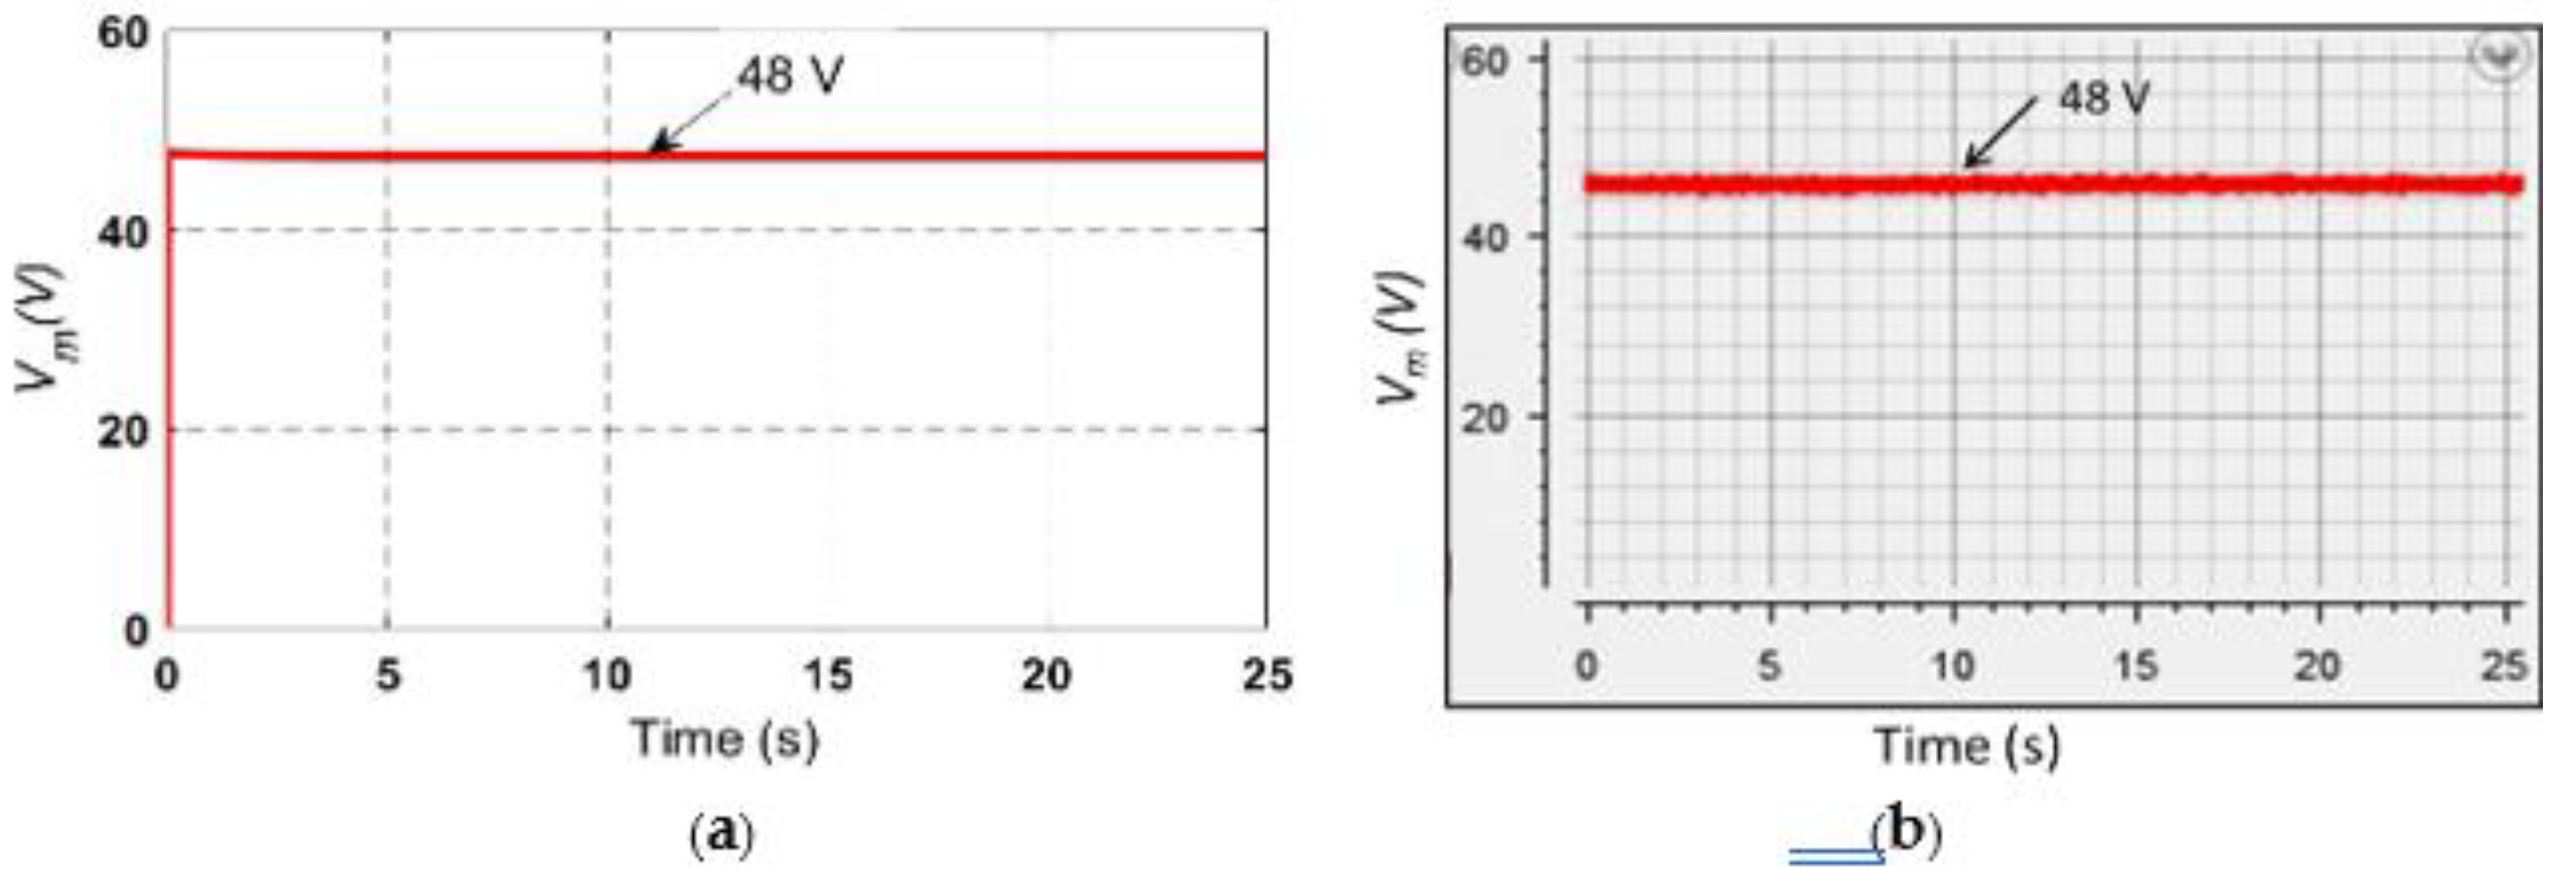
Q2 because of the high power demanded. Here, UC supports the battery. The pulse frequency can be seen as 10kHz in real time on a digital oscilloscope. DC-link voltage or load voltage (
Vm) is shown in
Figure 6. In
Figure 6a,b, for low power demand conditions, dc-link voltage is constant at 48 V for simulated and experimental environment. The ControlDesk software is used to extract all the waveforms in a real-time environment. A voltage sensor captures the DC-link voltage at the load side. The LEM-CV3-500 voltage transducer is used for voltage measurement and its close-loop feedback. An internal loop is used for the compensation of DC-link voltage and is shown in
Figure 3 in the EMS section.
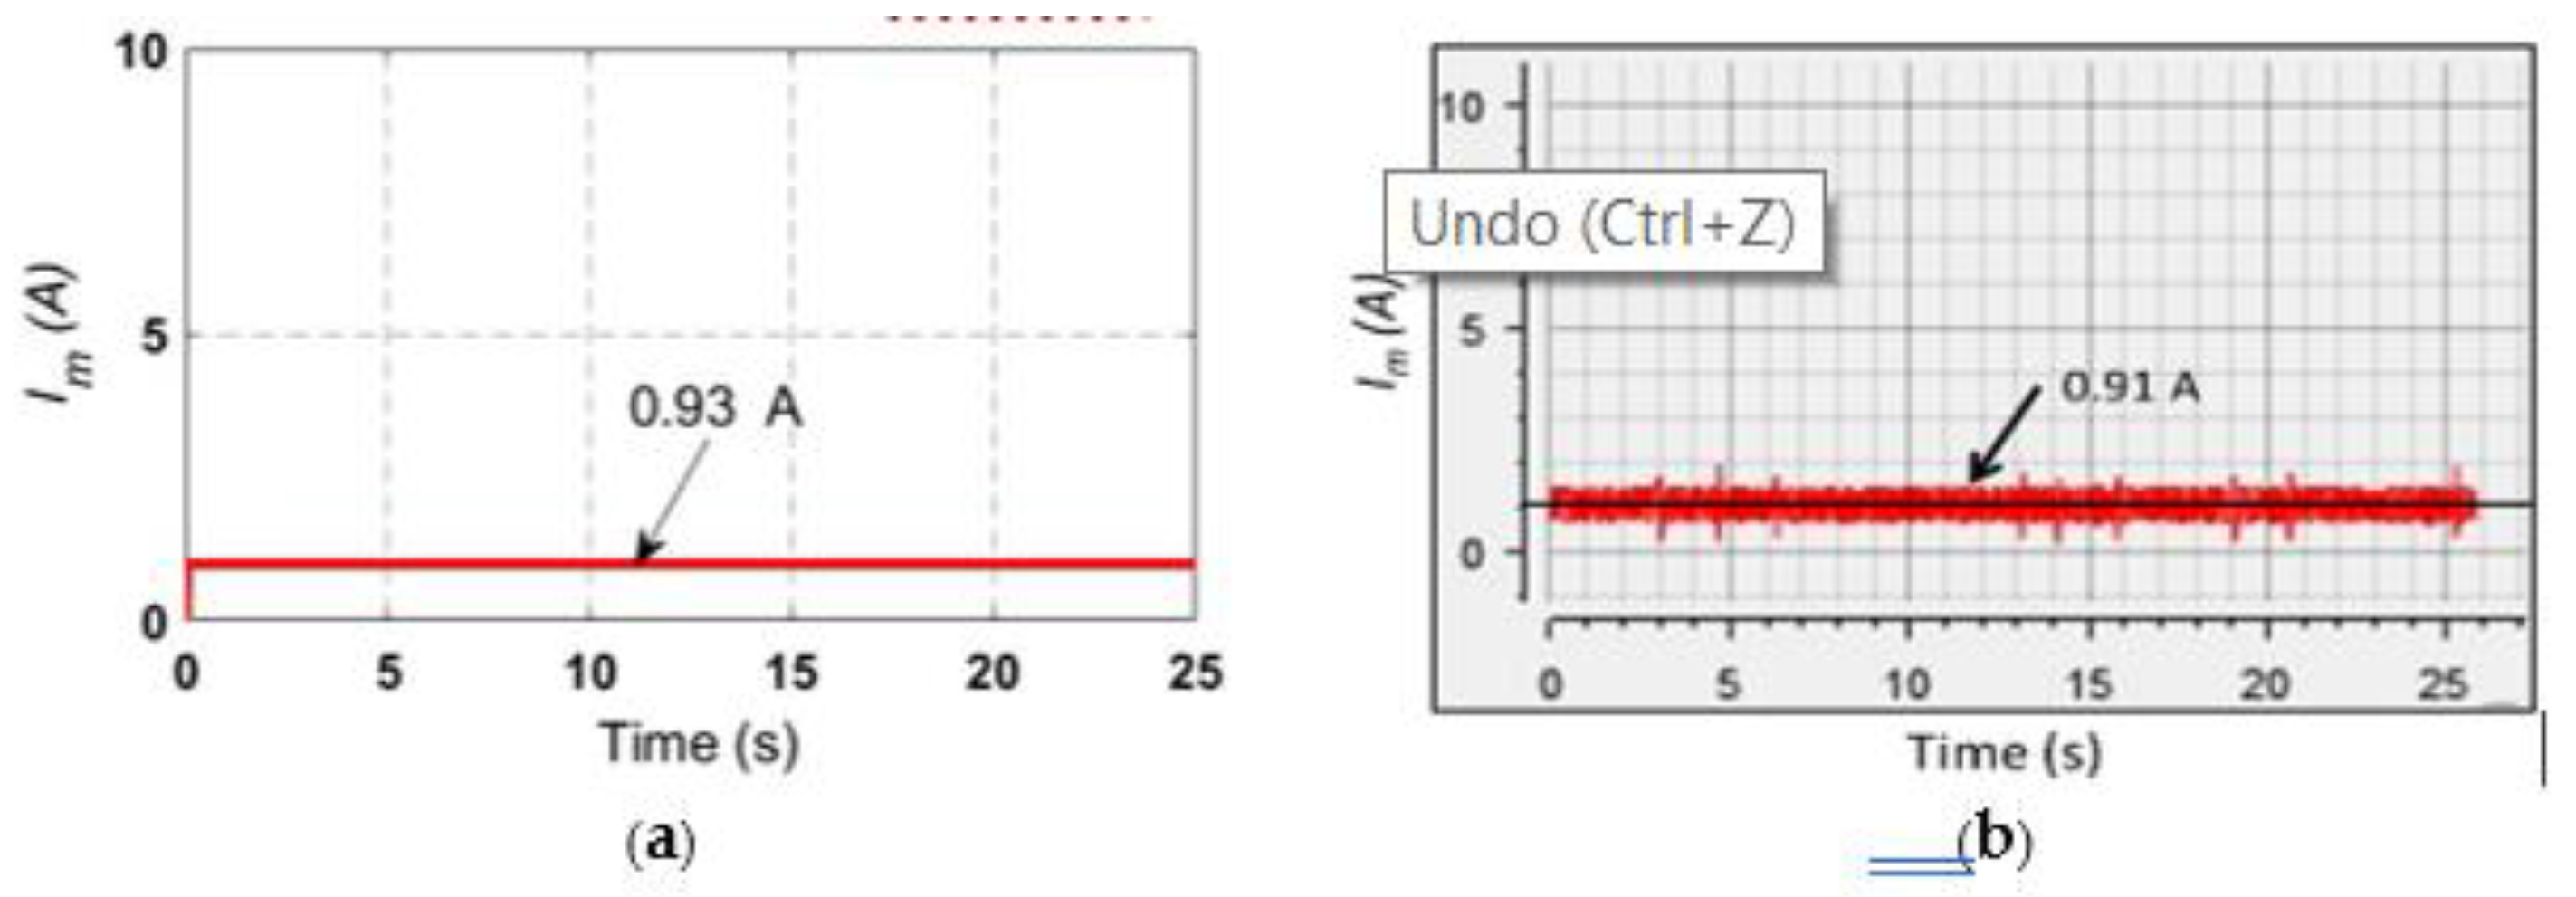
The load current (
Im) for LPDM is displayed in
Figure 7. The load current is 0.93 A in simulation environment for the power requirement of 47.2 watts as shown in
Figure 8. This simulated result is closely matched with the experimental result as shown in
Figure 7b which is 0.91 A for the same power requirement. In order to capture the load current, a current sensor (LA55P) at the load side is used. Its conversion factor is used in the real-time interface of dSPACE Simulink.
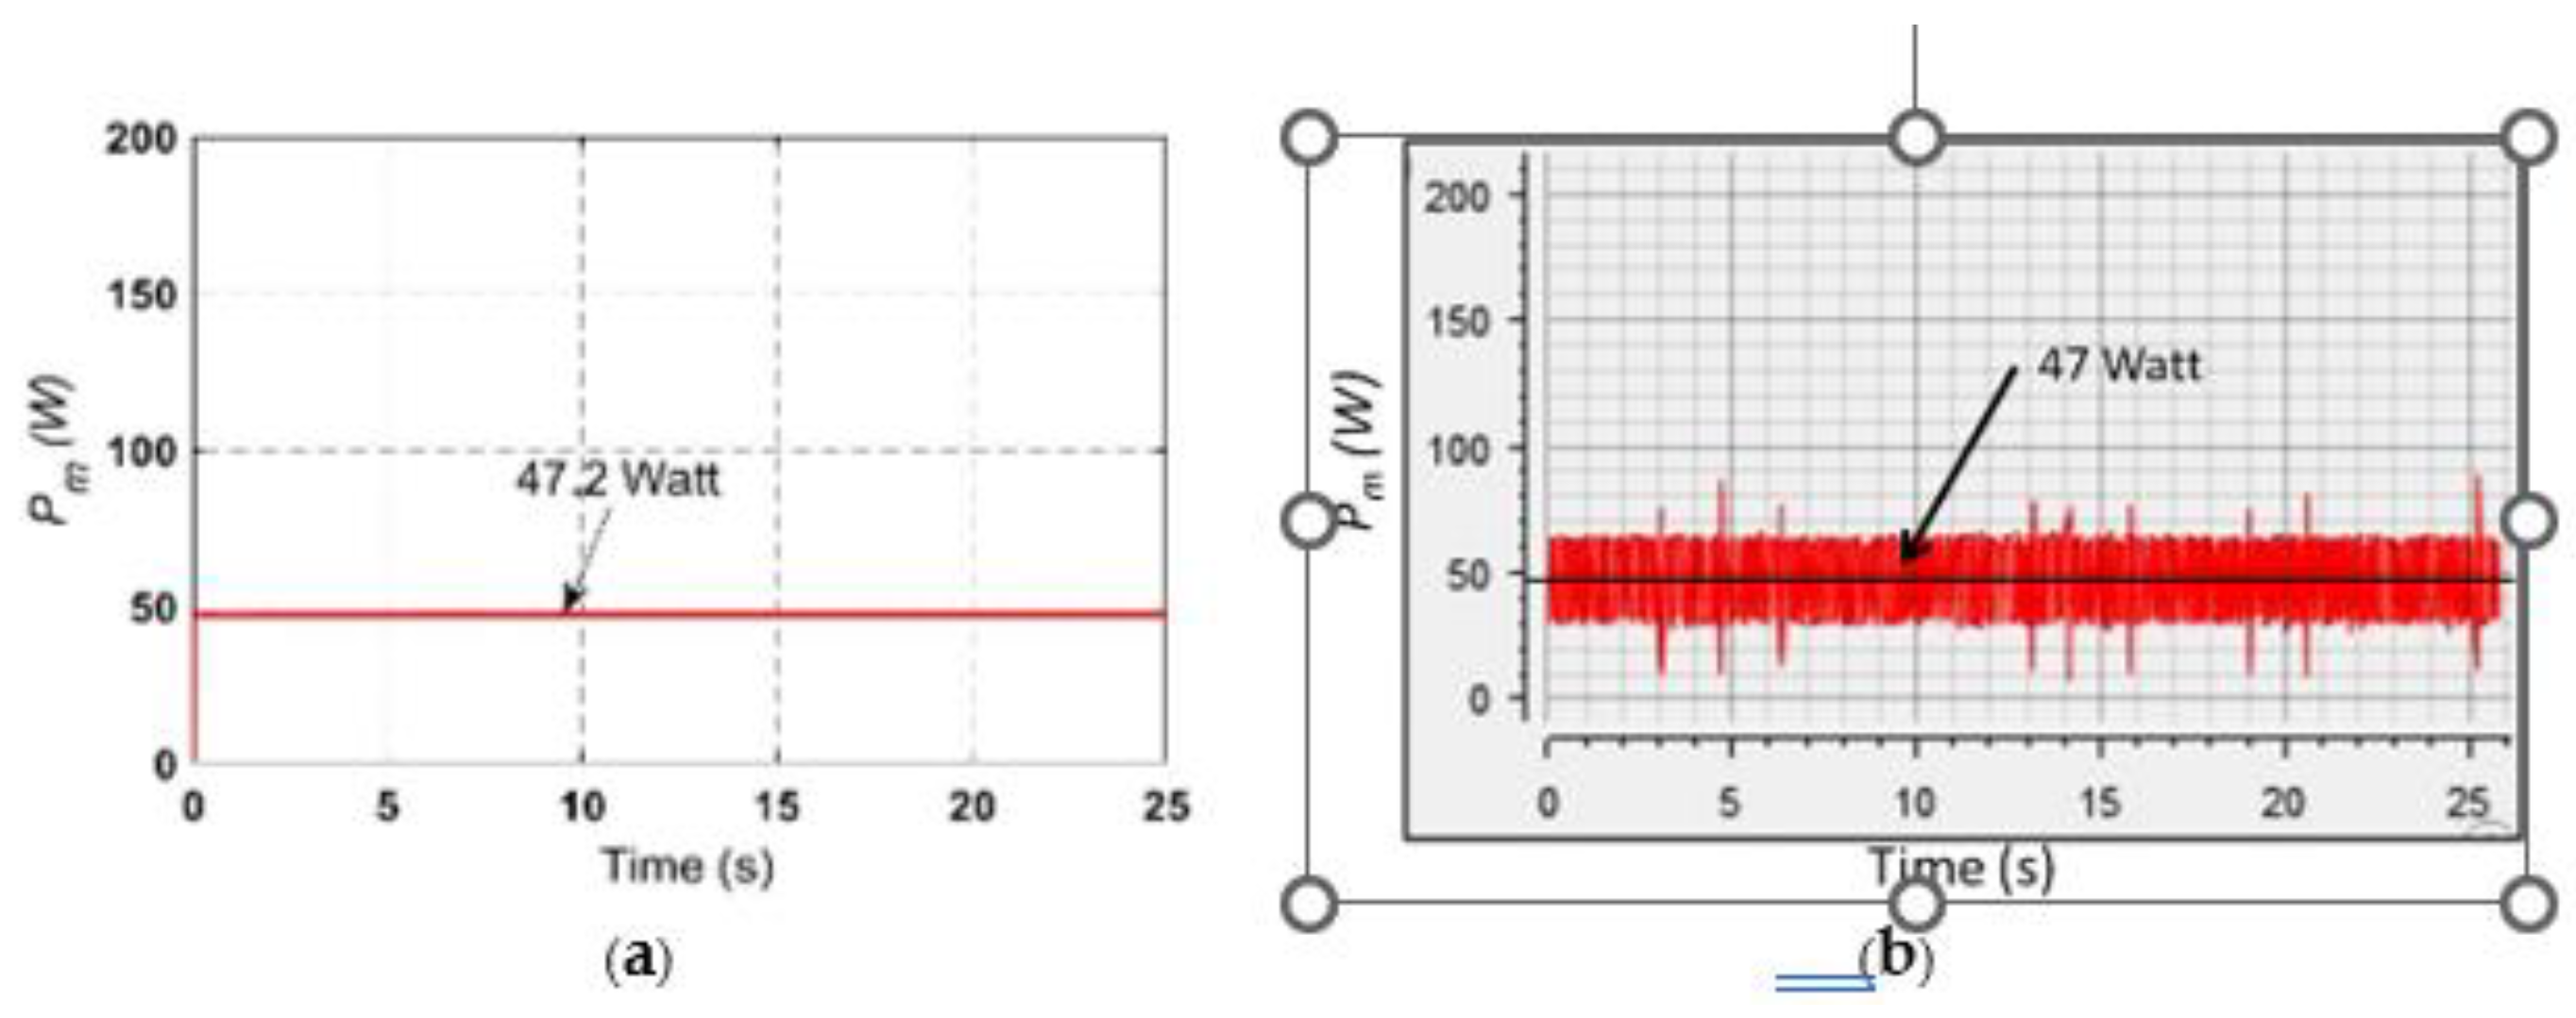
The load power profile P
m for LPDM is presented in
Figure 8. During simulation, load power profile is 47.2 watt as shown in
Figure 8a, whereas during experimentation, average power is 47 watts as shown in
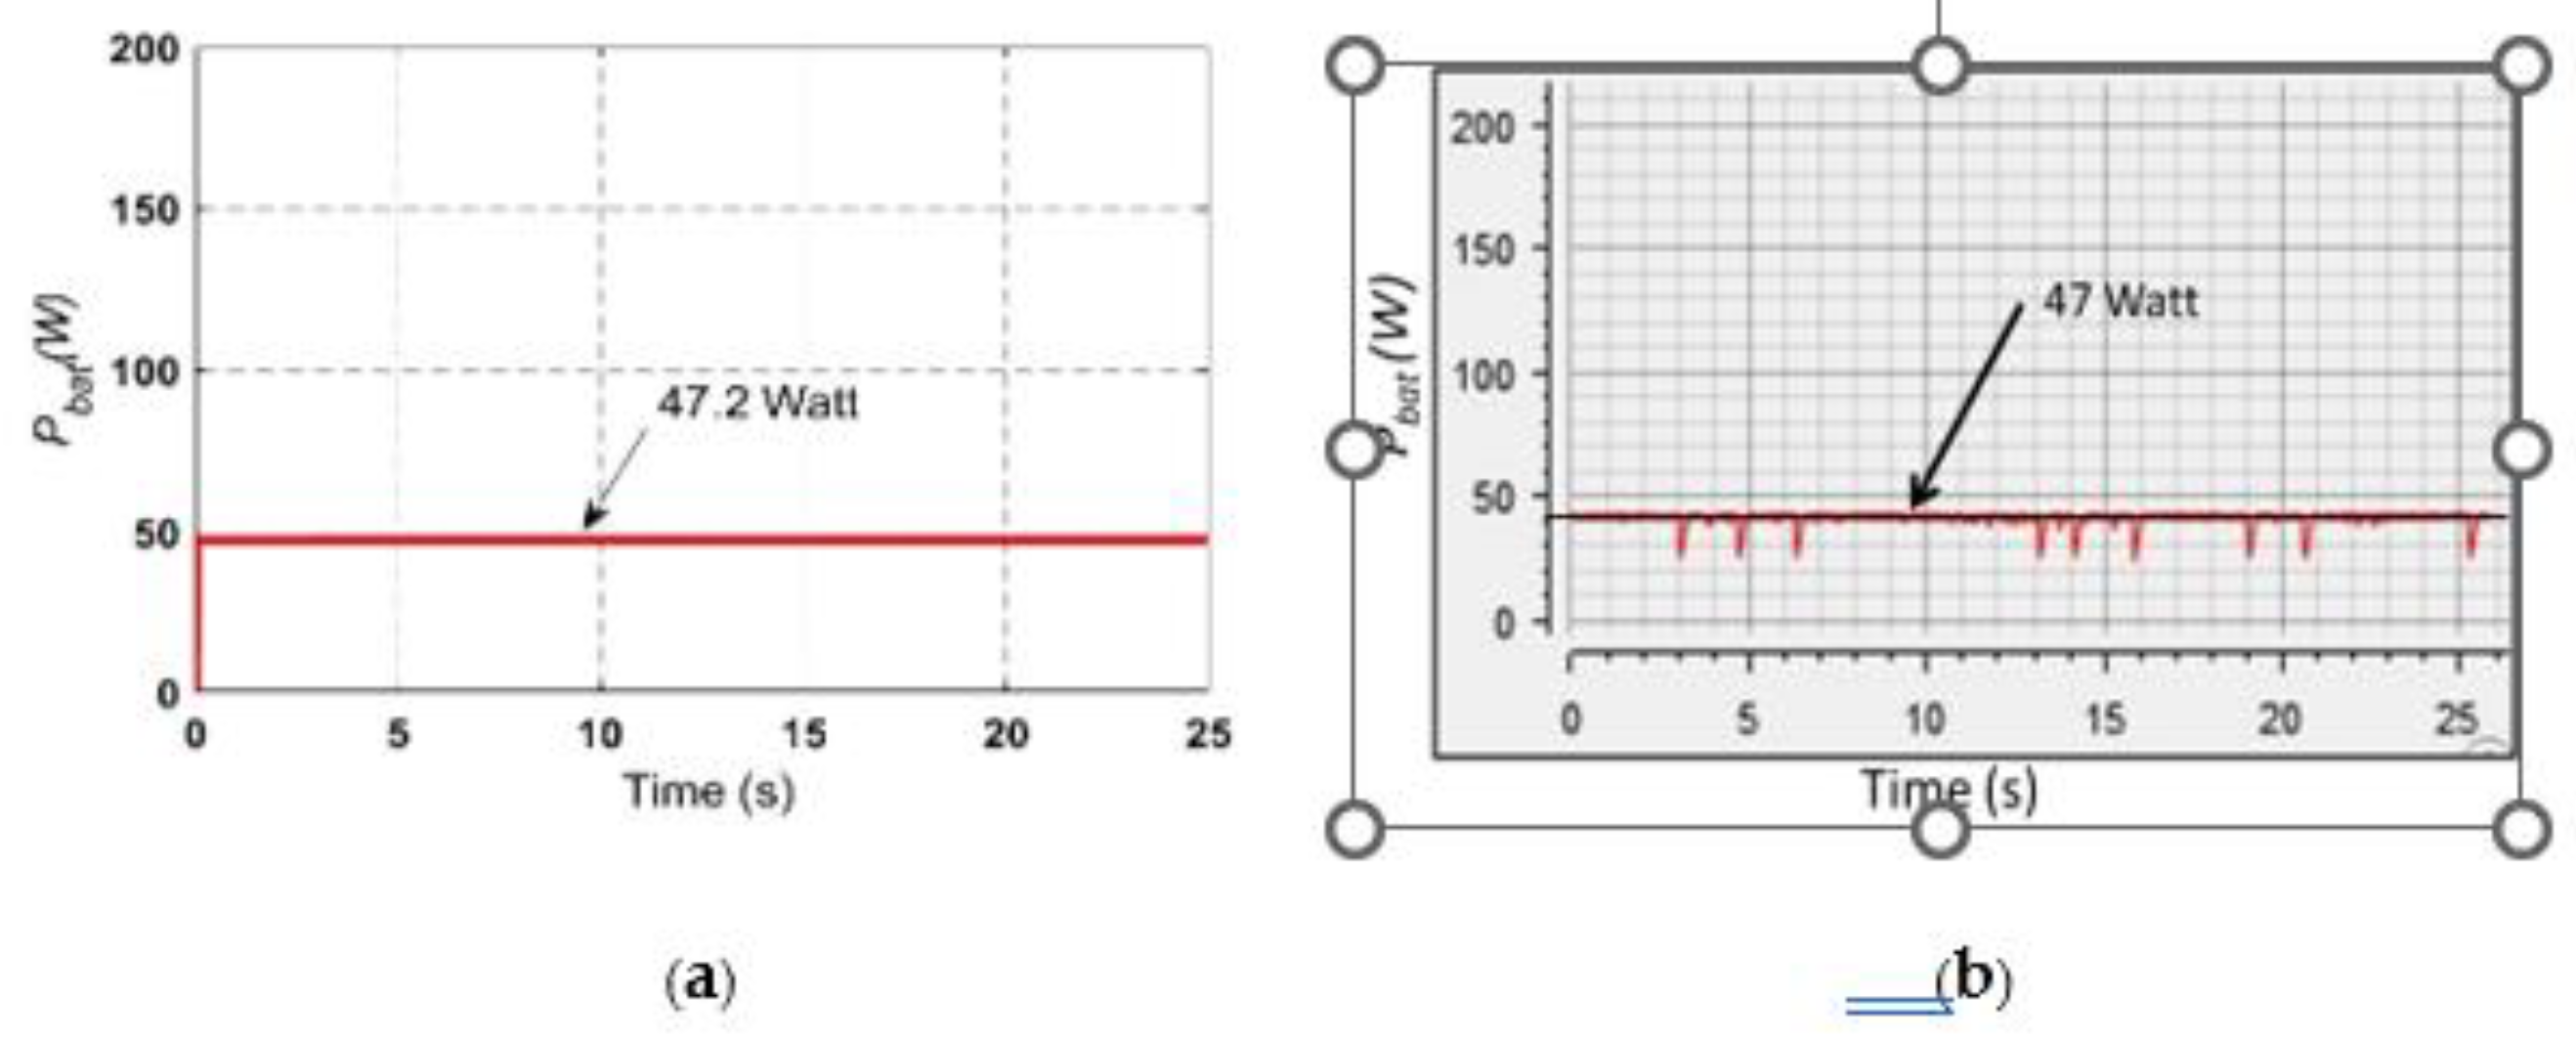
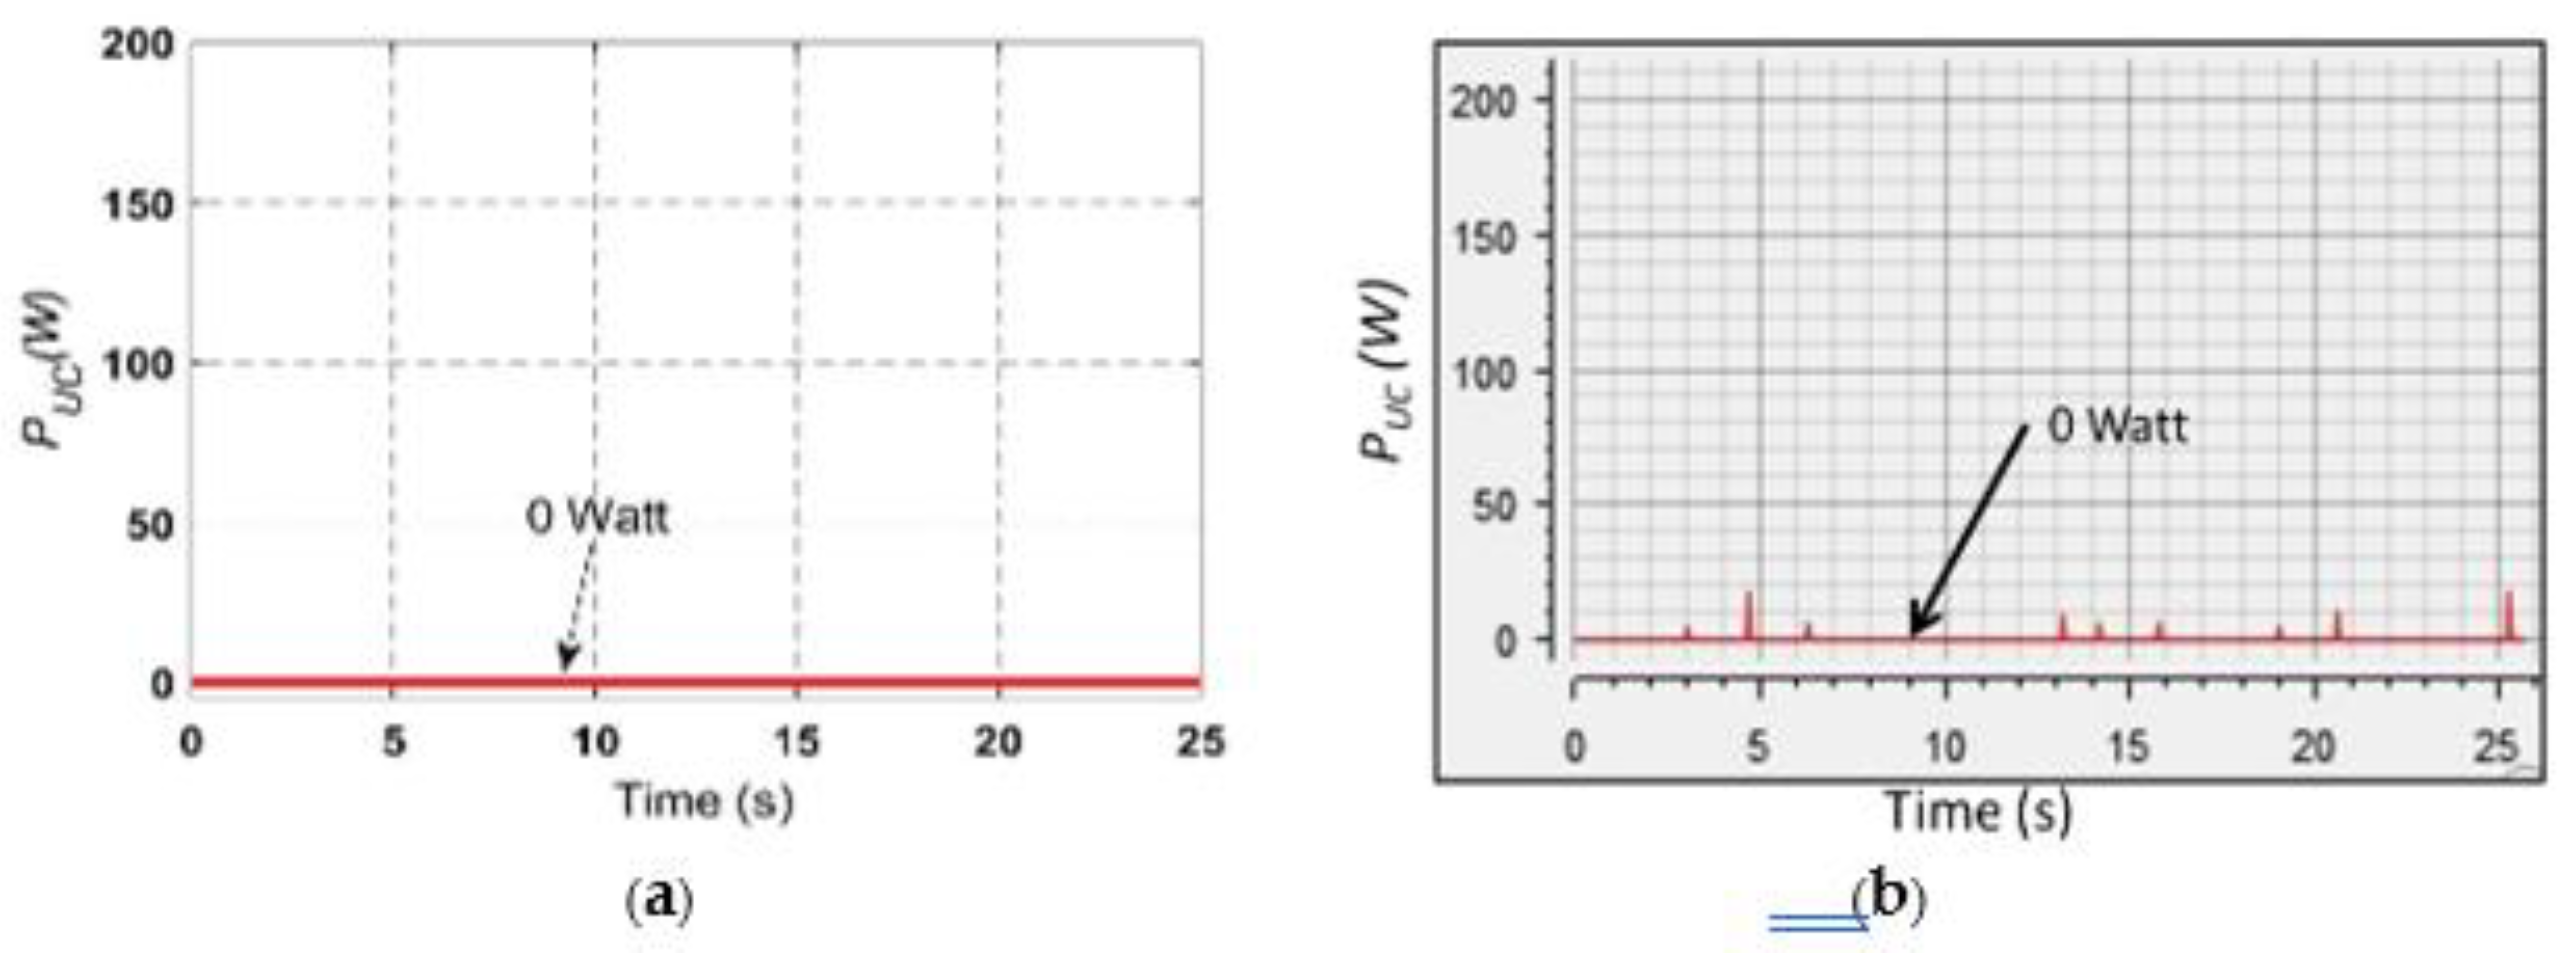
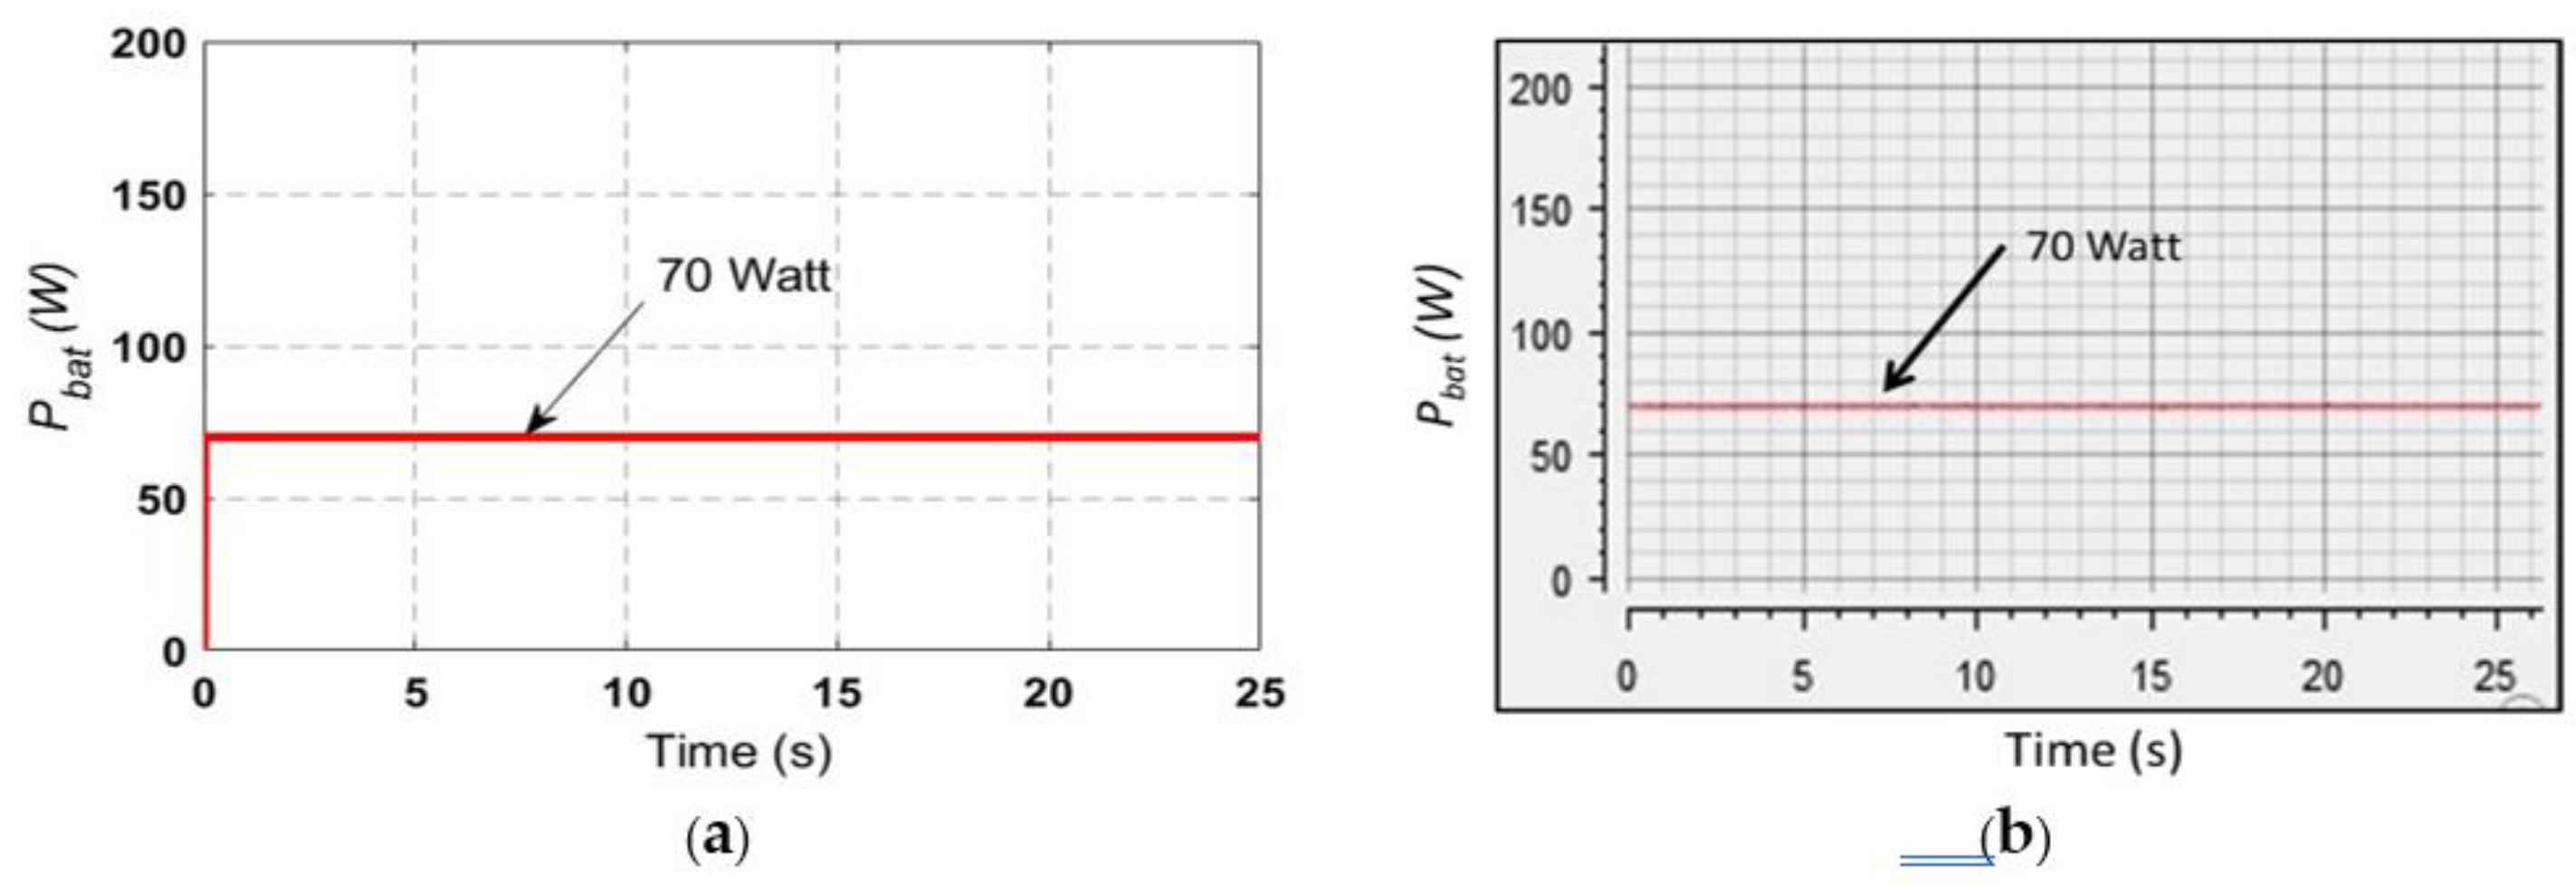
Figure 8b. The base power selected is 70 watts. So, in LPDM, load power required is 47.2 watt. This load requirement is completely fulfilled by the battery only as shown in
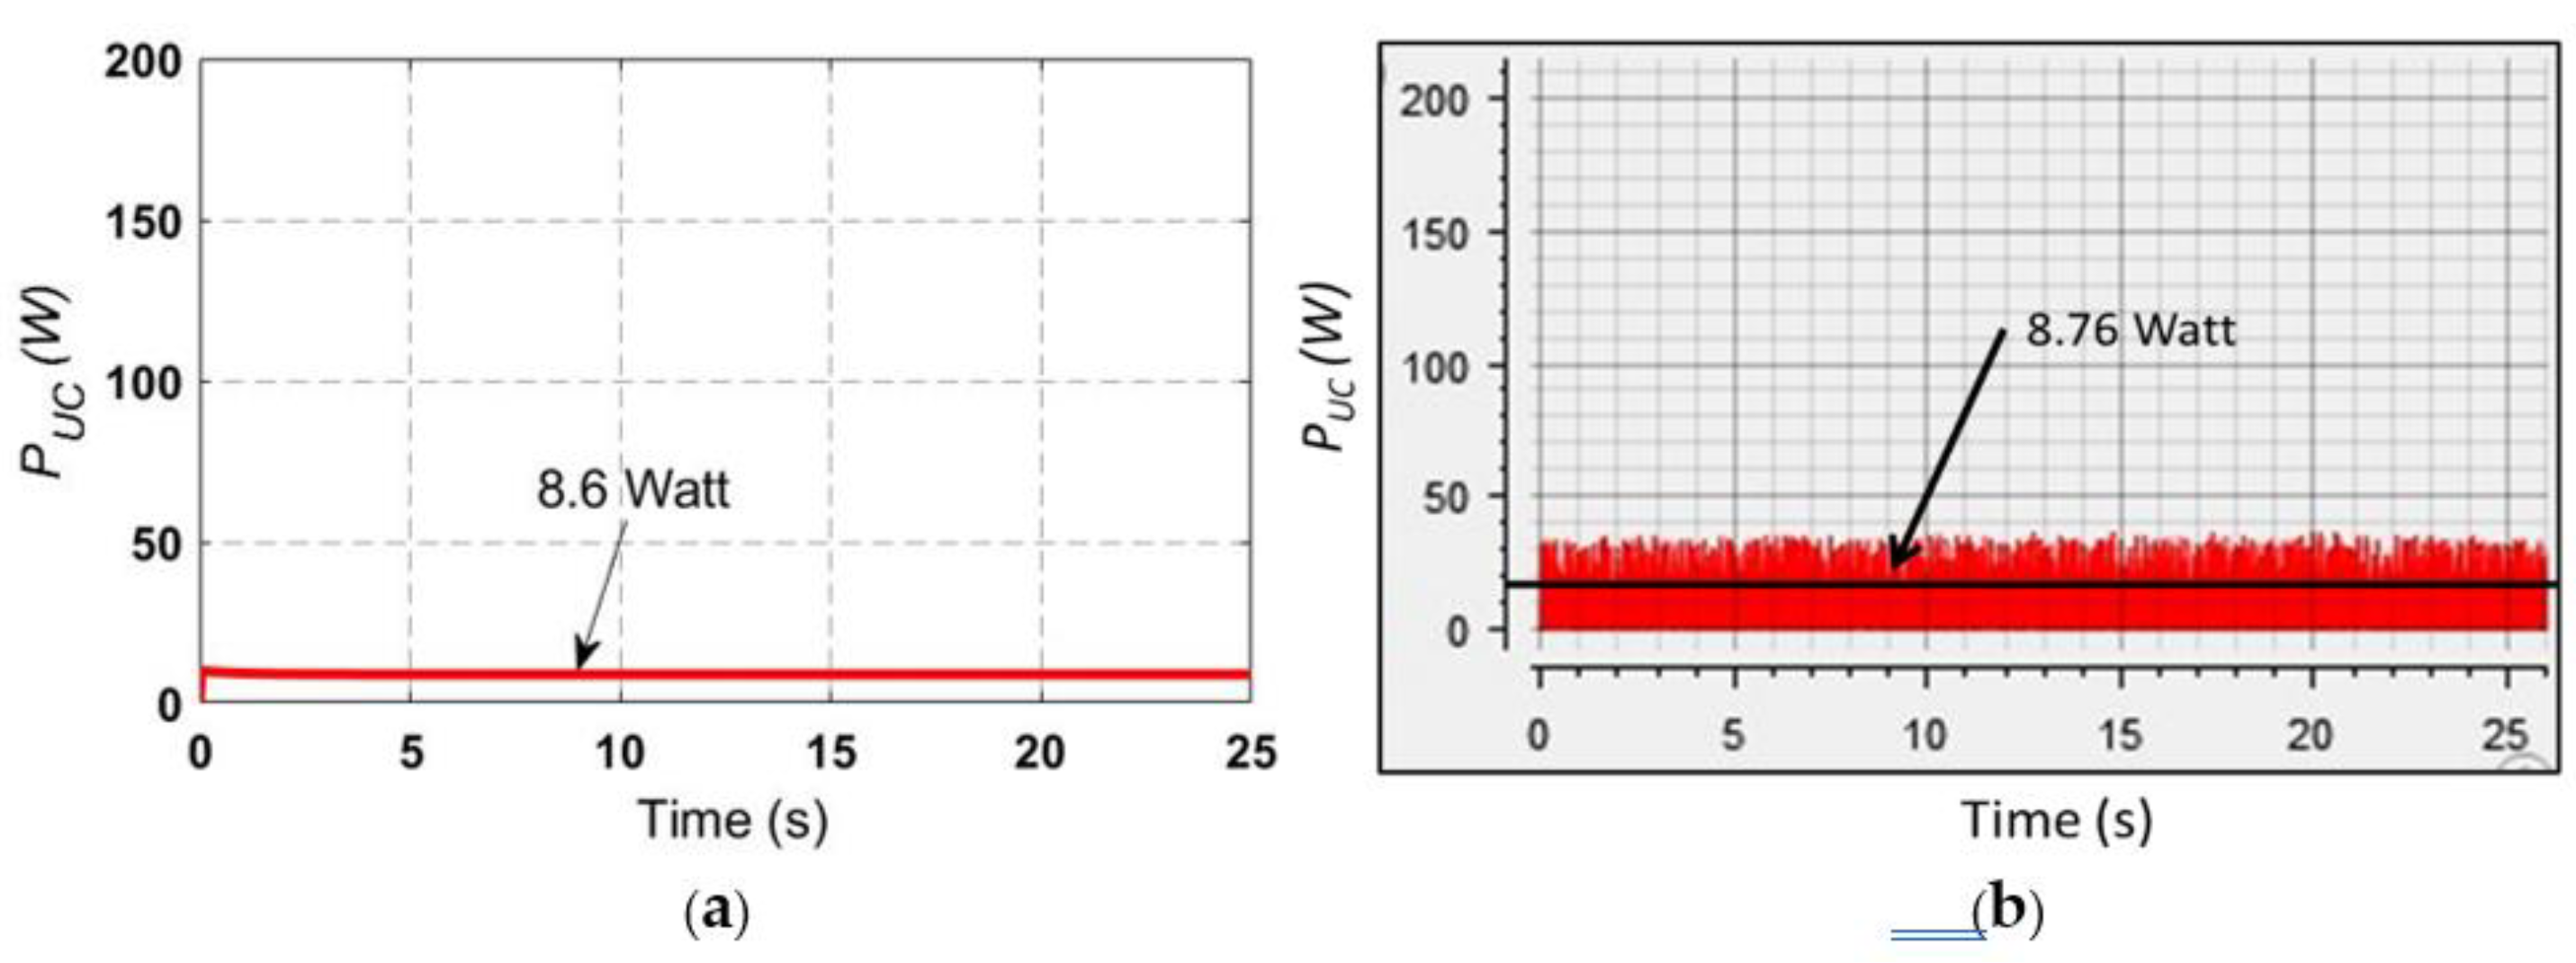
Figure 9a,b during simulation and experimental verification respectively. As, in LPDM, battery alone is handling the load, contribution of the UC is negligible as presented in
Figure 10a,b during simulation and experimentation respectively.
So, during the low power demand mode, the proposed strategy is effective in allocating the power.
6.2. Analysis for High Power Demand Mode
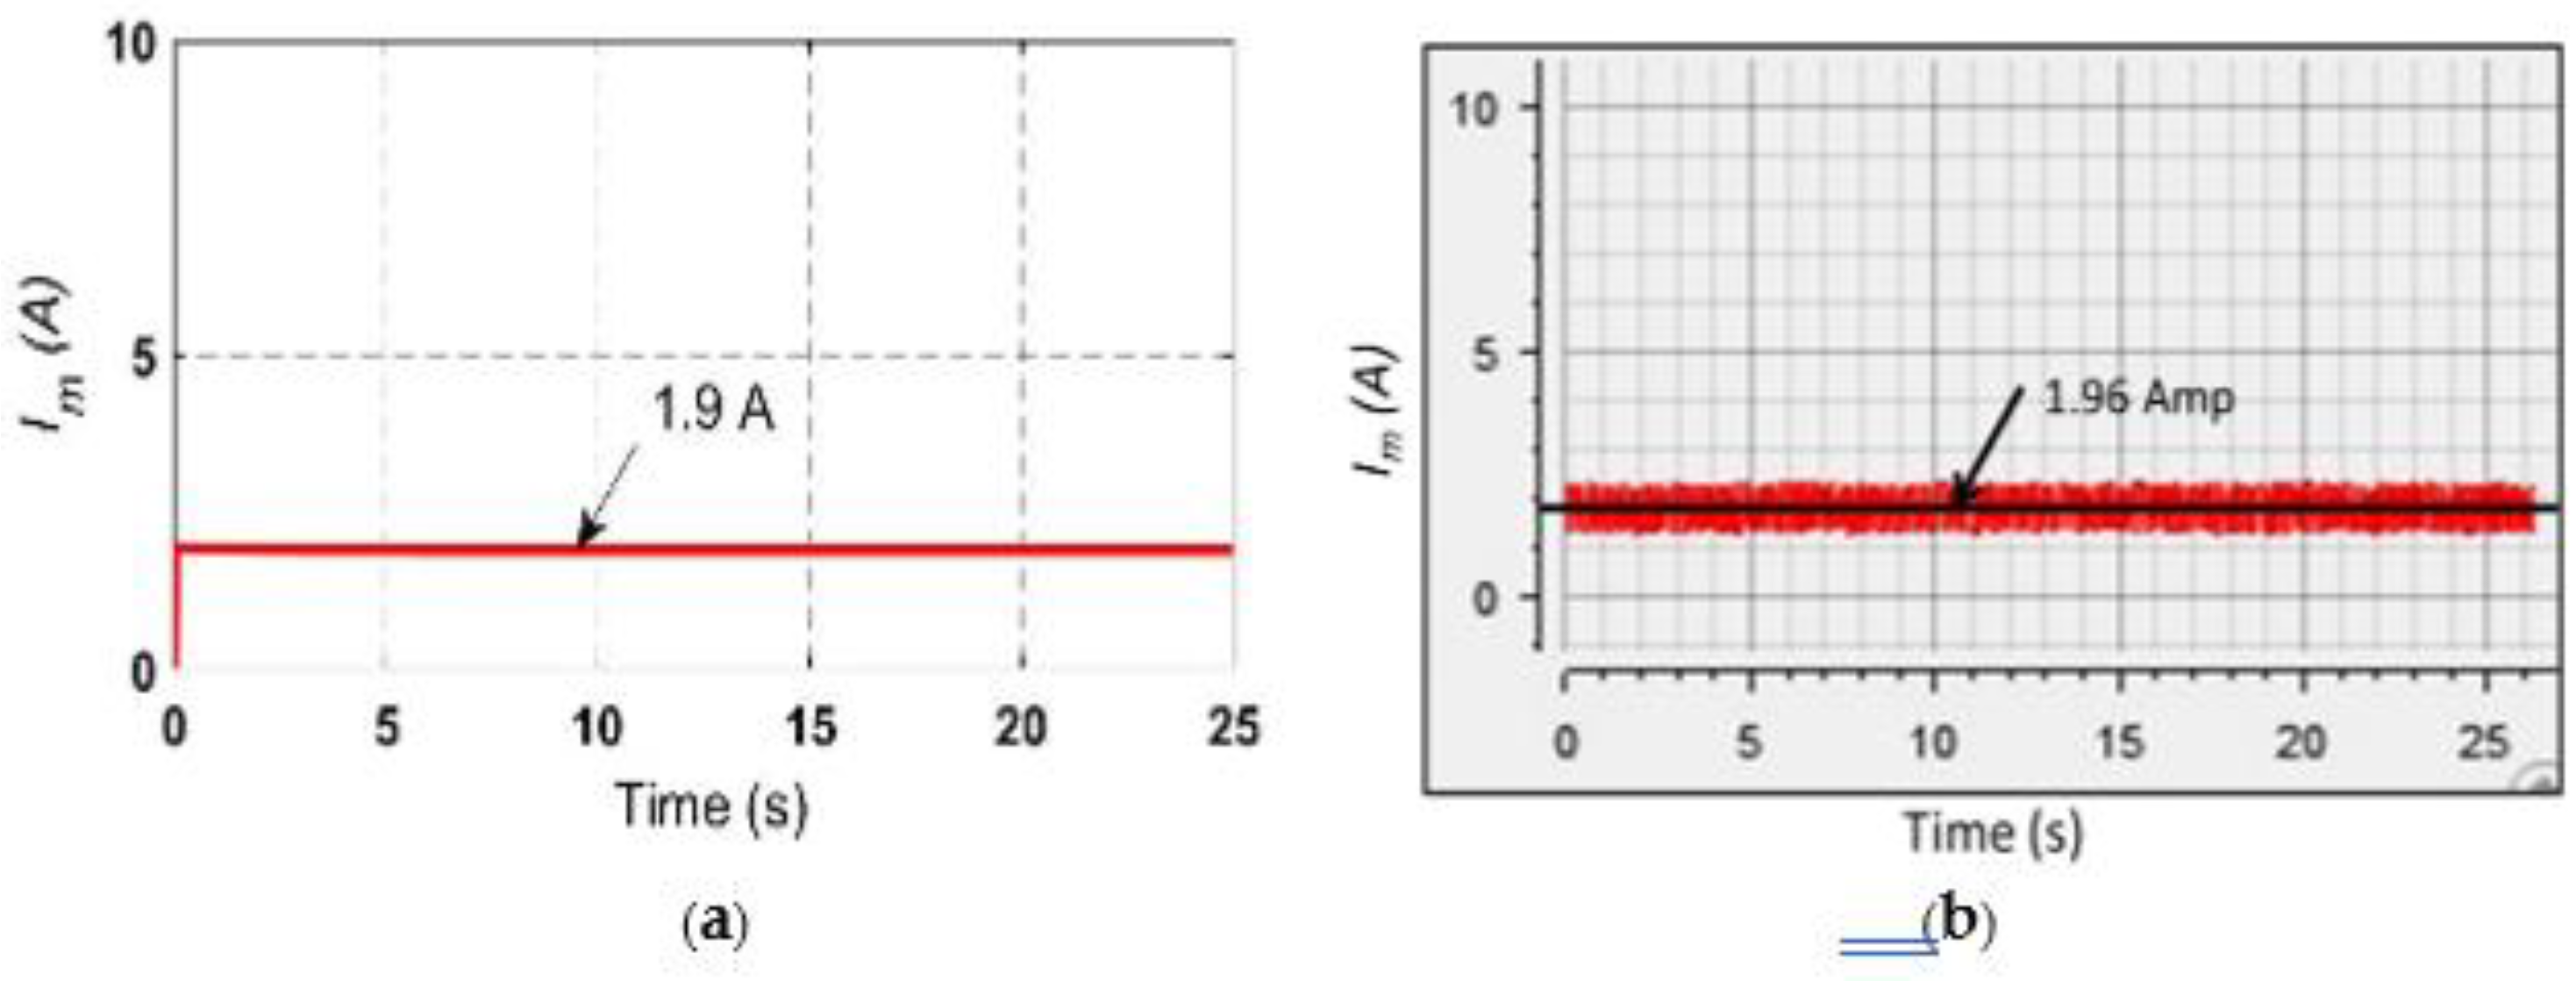
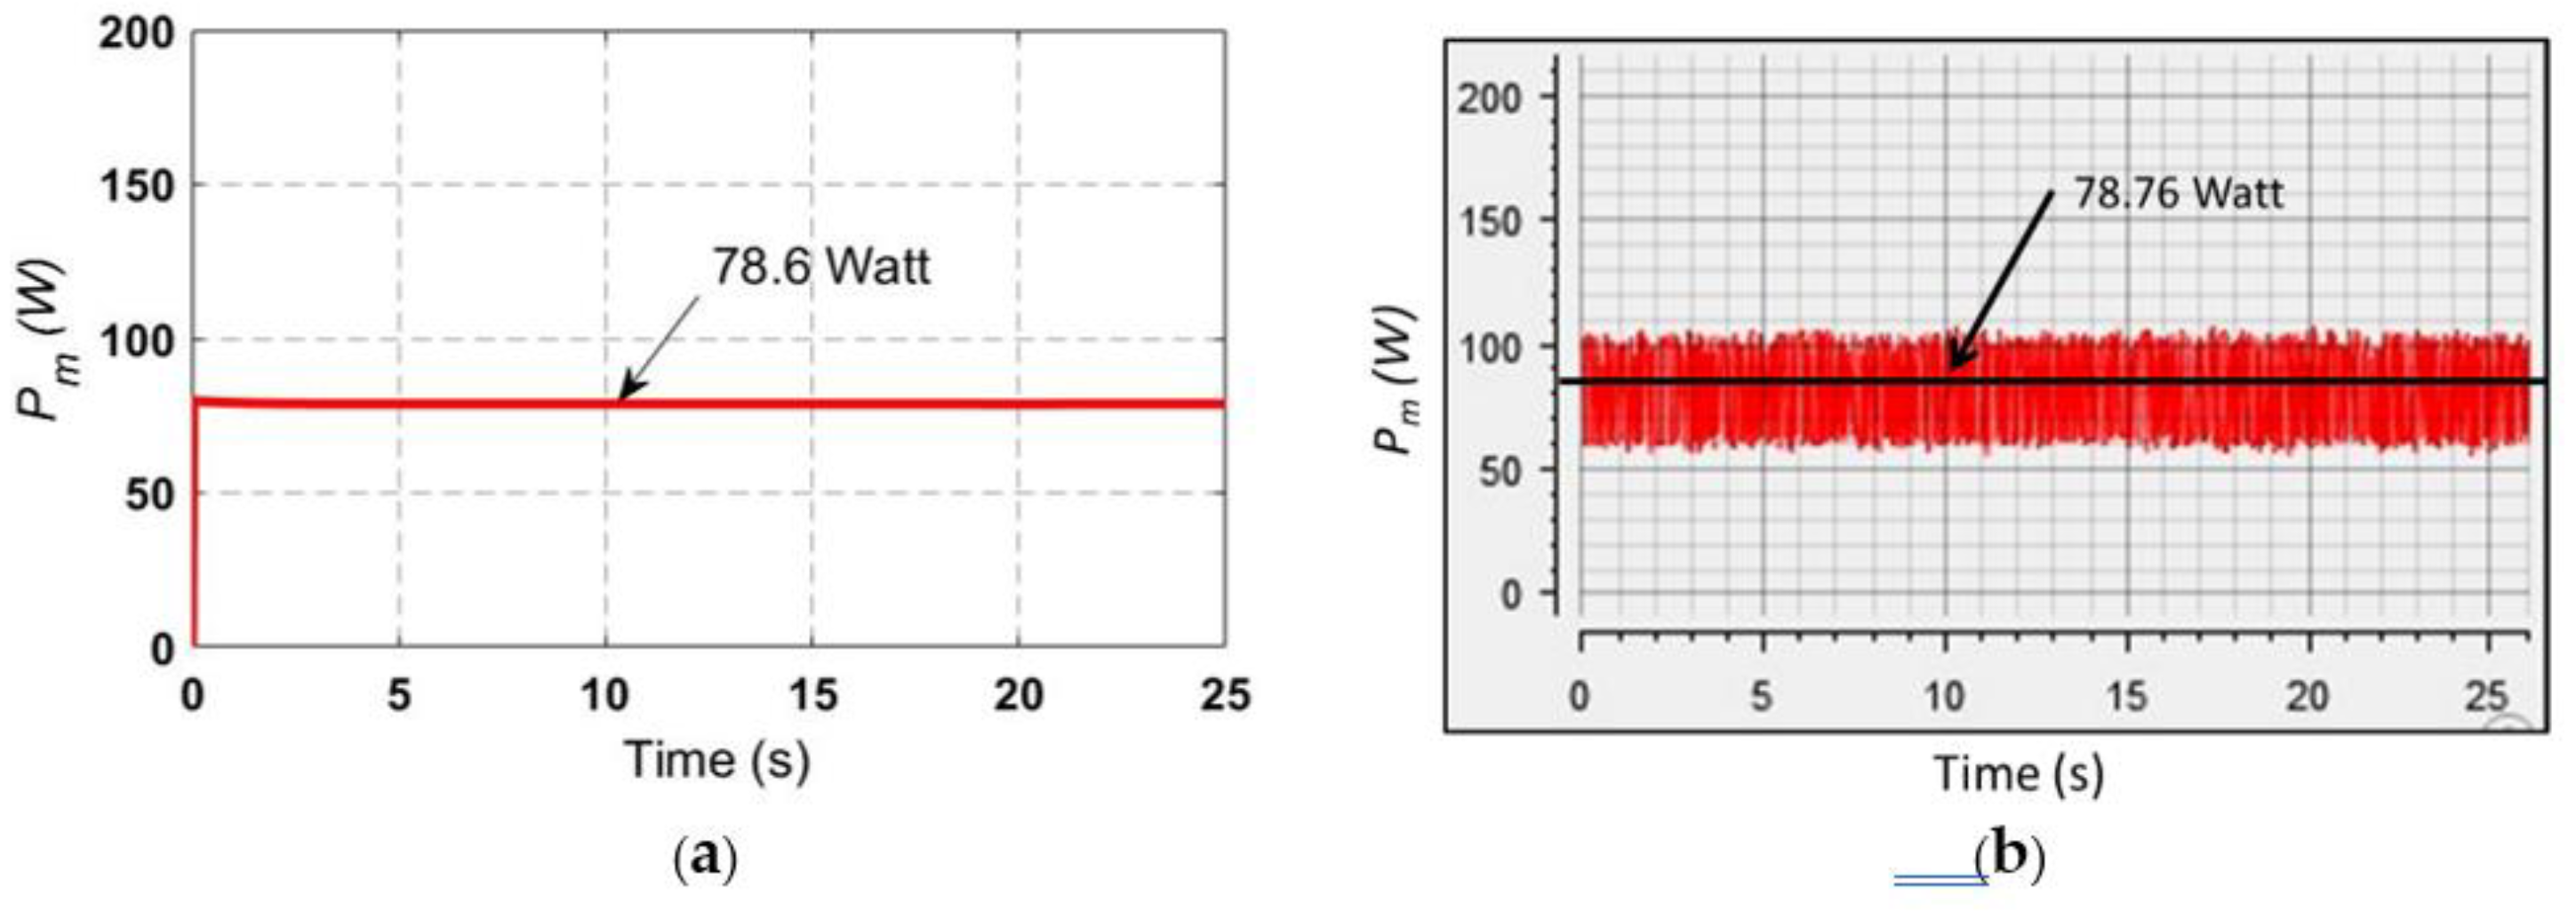
After successful verification of the LPDM, its time to validate the control strategy for the high-power demand mode (HPDM). In this mode, total load power required is 78.6 watts during simulation. For this load, dc-link voltage is constant at 48V as shown in
Figure 11 for both the verification methods (simulation and experimental). To handle this load, the simulated load current is 1.9A which is very close to experimental result which is 1.96A as shown in
Figure 12a and
Figure 12b respectively. The battery handles only 70 watts of power out of 78.6 watt, rest is carried out by UC as per the proposed control strategy and is validated by simulation and experimental results as shown in
Figure 13,
Figure 14 and
Figure 15. As the UC assists the battery with the increased load power from its base power, the UC delivers 8.76 watts of power. UC, being the high-power density, it safeguards the battery from peak power demand. Selection of UC rating is critical as it has to provide the increased load requirement.
7. Conclusions
In this paper, the experimental study is carried out to analyze the power-sharing strategy, and regulation of DC-link voltage. A shared bus topology with modified EMS is used to verify the above indicators. The control strategy is developed in the dSPACE real-time interface (RTI) window. A dedicated RTI library is used for interfacing the hardware dSPACE MicroLabBox.
To create this control strategy in the real-time interface (RTI) window, signals from current and voltage sensors are connected to six analog pins. After processing these signals as per requirement, two pulses are generated for the switches Q1 and Q2. The switching frequency for the pulse width modulation generation is 10kHz. The designed rating of the converter module is 1.2 kW and a load of 500 watts.
This experimentation is carried out for the two operational modes, LPDM and HPDM. The base power for this experiment is taken as 70 watts. The battery provides power only up to base power, and this strategy is also verified by experimentation. For high power demand (87.78 watts), both sources should provide the power to the load in real-time, and it is verified from RTI waveform
Figure 13b to
Figure 15b. Irrespective of the load conditions, dc-link voltage is constant as shown in RTI waveform
Figures 6b and 11b.
From the experimental study, the proposed EMS proved its effectiveness in real-time. The DC-link voltage regulation and power-sharing strategy are also verified. It can be employed in various applications including electric vehicle and microgrids.
Author Contributions
Conceptualization, A.R. and S.B.; methodology, A.R., A.B. and G.G; software, A.R. and S.B.; validation, A.R., G.G.; formal analysis, S.B.; investigation, S.B.; resources, A.B.; data curation, S.T.; writing—original draft preparation, A.R.; writing—review and editing, A.R.; visualization, S.T.; supervision, S.B.; project administration, S.B.; funding acquisition, S.B. and G.G. All authors have read and agreed to the published version of the manuscript.
Funding
This work is supported by the All-India Council of Technical Education under Research Promotion Scheme with Grant No. 8-206/FDC/RPS/(SC&ST)/POLICY-1/2021-22.
Data Availability Statement
The original contributions are included in the article; further enquiries can be directed to first author.
Conflicts of Interest
The authors declare no conflicts of interest.
References
- Sutikno, T.; Arsadiando, W.; Wangsupphaphol, A.; Yudhana, A.; Facta, M. A Review of Recent Advances on Hybrid Energy Storage System for Solar Photovoltaics Power Generation. IEEE Access 2022, 10. [Google Scholar] [CrossRef]
- Timilsina, L.; Badr, P.R.; Hoang, P.H.; Ozkan, G.; Papari, B.; Edrington, C.S. Battery Degradation in Electric and Hybrid Electric Vehicles: A Survey Study. IEEE Access 2023, 11. [Google Scholar] [CrossRef]
- Ranjith Kumar, R.; Bharatiraja, C.; Udhayakumar, K.; Devakirubakaran, S.; Sekar, K.S.; Mihet-Popa, L. Advances in Batteries, Battery Modeling, Battery Management System, Battery Thermal Management, SOC, SOH, and Charge/Discharge Characteristics in EV Applications. IEEE Access 2023, 11. [Google Scholar]
- Ankar, S.J. ; K.P., P. Optimal Sizing and Energy Management of Electric Vehicle Hybrid Energy Storage Systems With Multi-Objective Optimization Criterion. IEEE Trans. Veh. Technol. 2024. [CrossRef]
- Mohammad, J.S.S.; Bhanabhagvanwala, D. Simulation Analysis of Battery/Ultracapacitor Hybrid Energy Storage System for Electric Vehicle. Proc. Int. Conf. Intell. Sustain. Syst. ICISS 2019 2019, 494–498. [Google Scholar] [CrossRef]
- Etxandi-Santolaya, M.; Mora-Pous, A.; Canals Casals, L.; Corchero, C.; Eichman, J. Quantifying the Impact of Battery Degradation in Electric Vehicle Driving through Key Performance Indicators. Batteries 2024, 10. [Google Scholar] [CrossRef]
- Naseri, F.; Farjah, E.; Ghanbari, T. An Efficient Regenerative Braking System Based on Battery/Supercapacitor for Electric, Hybrid, and Plug-in Hybrid Electric Vehicles with BLDC Motor. IEEE Trans. Veh. Technol. 2017, 66, 3724–3738. [Google Scholar] [CrossRef]
- Garg, R.; Yadav, K.; Babber, A.; Jaggi, A.; Sharma, A.; Bijlwan, S. Energy Storage System Analysis Based on State of Charge for Hybrid Electric Vehicle. In Proceedings of the 9th International Conference on Smart Computing and Communications: Intelligent Technologies and Applications, ICSCC 2023; 2023. [Google Scholar]
- Zhang, Q.; Wang, L.; Li, G.; Liu, Y. A Real-Time Energy Management Control Strategy for Battery and Supercapacitor Hybrid Energy Storage Systems of Pure Electric Vehicles. J. Energy Storage 2020, 31, 101721. [Google Scholar] [CrossRef]
- Zahedi, A.; Babaeiyazdi, I.; Ostadian, R.; Rezaei-Zare, A. Globally Optimal Energy Management in a Battery-Ultracapacitor Electric Vehicle. In Proceedings of the 2022 IEEE International Conference on Environment and Electrical Engineering and 2022 IEEE Industrial and Commercial Power Systems Europe, EEEIC / I and CPS Europe 2022; 2022. [Google Scholar]
- Choudhary, M.K.; Sharma, A.K. Integration of PV, Battery and Supercapacitor in Islanded Microgrid. 2020 Int. Conf. Emerg. Front. Electr. Electron. Technol. ICEFEET 2020 2020. [CrossRef]
- Reddy, R.M.; Das, M.; Chauhan, N. Novel Battery-Supercapacitor Hybrid Energy Storage System for Wide Ambient Temperature Electric Vehicles Operation. IEEE Trans. Circuits Syst. II Express Briefs 2023, 70. [Google Scholar] [CrossRef]
- Ostadian, R.; Ramoul, J.; Biswas, A.; Emadi, A. Intelligent Energy Management Systems for Electrified Vehicles: Current Status, Challenges, and Emerging Trends. IEEE Open J. Veh. Technol. 2020, 1, 279–295. [Google Scholar] [CrossRef]
- Jarraya, I.; Abdelhedi, F.; Rizoug, N. An Innovative Power Management Strategy for Hybrid Battery–Supercapacitor Systems in Electric Vehicle. Mathematics 2024, 12. [Google Scholar] [CrossRef]
- Hosseini, S.M.; Soleymani, M.; Kelouwani, S.; Amamou, A.A. Energy Recovery and Energy Harvesting in Electric and Fuel Cell Vehicles, a Review of Recent Advances. IEEE Access 2023, 11. [Google Scholar] [CrossRef]
- Modu, B.; Abdullah, M.P. Bin; Alkassem, A.; Garni, H.Z.A.; Alkabi, M. Optimal Design of a Grid-Independent Solar-Fuel Cell-Biomass Energy System Using an Enhanced Salp Swarm Algorithm Considering Rule-Based Energy Management Strategy. IEEE Access 2024, 12. [Google Scholar] [CrossRef]
- Ravada, B.R.; Tummuru, N.R. Control of a Supercapacitor-Battery-PV Based Stand-Alone DC-Microgrid. IEEE Trans. Energy Convers. 2020, 35, 1268–1277. [Google Scholar] [CrossRef]
- Djilali, A.B.; Yahdou, A.; Bounadja, E.; Benbouhenni, H.; Zellouma, D.; Colak, I. Energy Management of the Hybrid Power System Based on Improved Intelligent Perturb and Observe Control Using Battery Storage Systems. Energy Reports 2024, 11. [Google Scholar] [CrossRef]
- Li, H.; Liu, Z.; Yang, Y.; Yang, H.; Shu, B.; Liu, W. A Proactive Energy Management Strategy for Battery-Powered Autonomous Systems. Appl. Energy 2024, 363. [Google Scholar] [CrossRef]
- Han, Y.; Xie, X.; Deng, H.; Ma, W. Central Energy Management Method for Photovoltaic DC Micro-Grid System Based on Power Tracking Control. IET Renew. Power Gener. 2017, 11, 1138–1147. [Google Scholar] [CrossRef]
- Abeywardana, D.B.W.; Hredzak, B.; Agelidis, V.G.; Demetriades, G.D. Supercapacitor Sizing Method for Energy-Controlled Filter-Based Hybrid Energy Storage Systems. IEEE Trans. Power Electron. 2017, 32, 1626–1637. [Google Scholar] [CrossRef]
- Zhang, Q.; Deng, W.; Zhang, S.; Wu, J. A Rule Based Energy Management System of Experimental Battery/Supercapacitor Hybrid Energy Storage System for Electric Vehicles. J. Control Sci. Eng. 2016, 2016, 18–20. [Google Scholar] [CrossRef]
- Akar, F.; Tavlasoglu, Y.; Vural, B. An Energy Management Strategy for a Concept Battery/Ultracapacitor Electric Vehicle with Improved Battery Life. IEEE Trans. Transp. Electrif. 2017, 3, 191–200. [Google Scholar] [CrossRef]
- Trovao, J.P.F.; Roux, M.A.; Menard, E.; Dubois, M.R. Energy- and Power-Split Management of Dual Energy Storage System for a Three-Wheel Electric Vehicle. IEEE Trans. Veh. Technol. 2017, 66, 5540–5550. [Google Scholar] [CrossRef]
- Sellali, M.; Betka, A.; Drid, S.; Djerdir, A.; Malik, O.P. Hardware Implementation of an Improved Control Strategy for Battery–Supercapacitor Hybrid System in Electric Vehicles. IET Electr. Syst. Transp. 2020, 10, 204–212. [Google Scholar] [CrossRef]
- Ranjan, A.; Bodkhe, S.B. Energy Management Strategy for Hybrid Energy Storage Systems in Electric Vehicle – A Review. 2022, 11, 88–101. [CrossRef]
- Al Takrouri, M.; Md Ayob, S.; Nik Idris, N.R.; Aziz, M.J.A.; Ayop, R.; Said, M.F.B.M. Comparative Analysis of Passive and Semi-Active Hybrid Energy Storage System Topologies for Electric Vehicle. In Proceedings of the 2023 IEEE Conference on Energy Conversion, CENCON 2023; 2023. [Google Scholar]
- Badawy, M.O.; Husain, T.; Sozer, Y.; De Abreu-Garcia, J.A. Integrated Control of an IPM Motor Drive and a Novel Hybrid Energy Storage System for Electric Vehicles. IEEE Trans. Ind. Appl. 2017, 53, 5810–5819. [Google Scholar] [CrossRef]
- Fathabadi, H. Plug-In Hybrid Electric Vehicles: Replacing Internal Combustion Engine with Clean and Renewable Energy Based Auxiliary Power Sources. IEEE Trans. Power Electron. 2018, 33, 9611–9618. [Google Scholar] [CrossRef]
- Gan, C.; Jin, N.; Sun, Q.; Kong, W.; Hu, Y.; Tolbert, L.M. Multiport Bidirectional SRM Drives for Solar-Assisted Hybrid Electric Bus Powertrain with Flexible Driving and Self-Charging Functions. IEEE Trans. Power Electron. 2018, 33, 8231–8245. [Google Scholar] [CrossRef]
- RANJAN, A.; BODKHE, S.B.; GOYAL, G.N.; AWARE, M. V. Heuristics EMS for HESS of Electric Vehicle to Extended Battery Operation Using Rate Limiter. Adv. Electr. Comput. Eng. 2022, 22, 11–22. [Google Scholar] [CrossRef]
- Denis, N.; Dubois, M.R.; Trovao, J.P.F.; Desrochers, A. Power Split Strategy Optimization of a Plug-in Parallel Hybrid Electric Vehicle. IEEE Trans. Veh. Technol. 2018, 67, 315–326. [Google Scholar] [CrossRef]
- Singh, A.; Pattnaik, S. Design of a Efficient Power Sharing Strategy for a Battery-Ultracapacitor Hybrid Energy Storage System. 1st IEEE Int. Conf. Power Electron. Intell. Control Energy Syst. ICPEICES 2016 2017. [CrossRef]
- Ranjan, A. Hybrid Energy Storage System for Electric Vehicle. Helix 2019, 9, 5801–5805. [Google Scholar] [CrossRef]
- Ranjan, A.; Bodkhe, S.B. Modified Energy Management Strategy for HESS in Electric Vehicle. In Proceedings of the 2021 9th IEEE International Conference on Power Systems (ICPS); IEEE, December 16 2021; pp. 1–6. [Google Scholar]
- Ranjan, A.; Bodkhe, S.B. Fuzzy Logic Controller Based Modified Energy Management Strategy for Battery and UC with Improved Battery Performance. ECS Trans. 2022, 107, 2457–2469. [Google Scholar] [CrossRef]
- Wong, D.; Shrestha, B.; Wetz, D.A.; Heinzel, J.M. Impact of High Rate Discharge on the Aging of Lithium Nickel Cobalt Aluminum Oxide Batteries. J. Power Sources 2015, 280, 363–372. [Google Scholar] [CrossRef]
- Dong, J.; Liu, R.; Tang, K.; Wang, Y.; Zhang, X.; Su, Z. Sparse Gradient Pursuit for Robust Visual Analysis. Lect. Notes Comput. Sci. (including Subser. Lect. Notes Artif. Intell. Lect. Notes Bioinformatics) 2017, 10111 LNCS, 369–384. [CrossRef]
|
Disclaimer/Publisher’s Note: The statements, opinions and data contained in all publications are solely those of the individual author(s) and contributor(s) and not of MDPI and/or the editor(s). MDPI and/or the editor(s) disclaim responsibility for any injury to people or property resulting from any ideas, methods, instructions or products referred to in the content. |
© 2024 by the authors. Licensee MDPI, Basel, Switzerland. This article is an open access article distributed under the terms and conditions of the Creative Commons Attribution (CC BY) license (http://creativecommons.org/licenses/by/4.0/).
