Preprint
Article

Unveiling Complex Breakup Dynamics in the Transitional Regime of Entrapped Air within High-Density Media

Altmetrics

Downloads

51

Views

26

Comments

0

This version is not peer-reviewed

Submitted:

10 October 2024

Posted:

12 October 2024

You are already at the latest version

Alerts
Abstract
The dynamics of a quiescent finite-size air filament in a static liquid is investigated through axisymmetric numerical simulations. Due to surface tension, the two ends of the air filament retract and form bulges. We categorize the observed breakup behavior into four distinct regimes on a phase diagram, labeled I, II, III, and IV, each with its appropriate scaling. For Ohnesorge number, Oh ≤ Oh lim = 0.1, the mass of the detached bubble is approximately more than 2.1 times the size of the initial radius of the filament. Using this assumption, a first-order approximate mathematical model is reported for Oh ≤ Oh lim that shows if the aspect ratio (Γ) of the filament is greater than 11, the filament will always breakup. In the neck-reopening regime, the jump distance from the neck to the center of the filament exhibits an increasing trend with an increase in Γ and decreases when Oh is increased. For the same regime, a recirculating flow generated around the stagnation point at the center of the filament induces the reopening of the neck, ultimately resulting in a breakup at the center of the filament.
Keywords: 
Subject: Engineering  -   Mechanical Engineering

1. Introduction

The formation of a fluid filament often accompanies the breakup of fluid masses into disconnected pieces. In both industry and nature, the vital importance of the formation, dynamic behavior, and disintegration/retraction of fluid filaments extends to a wide range of liquid–gas interface-related processes. An important applications of this phenomenon include ensuring proper drop formation in ink-jet printing [1,2,3] and controlling the dissolved oxygen (DO) concentration in municipal wastewater treatment plants [4,5,6,7]. Bubble dynamics play a key role in the exchange of gases between the ocean and atmosphere [8,9,10,11,12,13,14,15,16]. Controlled aeration emerges as a significant method for safeguarding substantial spillways against cavitation damage [17]. However, in certain industrial processes, aeration is of vital importance, such as when it is employed to enhance maximal contact in liquid–gas reactors [18], while proving detrimental in other cases, like in the casting of glass or polymers [19]. The dynamics of bubbles play a crucial role in studying a rising bubble ring [20] and in the interaction of bubbles with turbulence [21]. Also, in electrochemical processes, proper understanding and control of bubble formation are required [22].
While extensive research has been conducted on the contraction of a liquid film, limited attention has been given to the contraction of an air film. Taylor [23] and Culick [24] independently conducted investigations on the contraction of a thin liquid film, proposing a constant Taylor-Culick contraction velocity, U T C = 2 σ / ρ l e , with ρ l the liquid density, σ the surface tension, and e the thickness of the sheet. They demonstrated that this formula can be elucidated through a balance between surface tension force and the inertia of a growing rim that accumulates all the displaced liquid [25]. Analogous to a liquid film, a similar contraction mechanism is observed for an air film contracting in a liquid, where the displaced air accumulates into a rim. However, in this case, the surface tension force pulling on the rim is balanced by the resistance of the surrounding liquid, rather than the inertia of the rim. Recently, Ma et al. presented both physical and numerical models for a contracting gas filament [26]. They analyzed the dynamics of the gas filament and proposed a phase diagram correlating aspect ratio ( Γ ) and O h to predict the fate of the air filaments over limited parametric space. In a separate study, a detailed phase diagram illustrating the outcomes of air filament was presented [27]. It was shown that the air filament recoils into a single bubble when its aspect ratio is small and ruptures at both ends for large aspect ratios. In the transition regime, between recoiling and end-pinching, the neck connecting the bulge to the filament can reopen and escape pinch-off, or the filament can rupture in its middle region. However, the transitional regime and the dynamic behavior of the filament within the regime received scant attention.
This paper investigates the fate of an axisymmetric air filament embedded in an external liquid with varying viscosity within the transitional regime. The phase diagram is segmented into different breakup regimes, each with its appropriate scaling. Through a comprehensive numerical investigation, we explore the trends and reasons behind the distinct behavior exhibited by the filament in this regime.

2. Numerical Method and Simulations

2.1. Numerical Method

We examine a finite-size axisymmetric air filament embedded in a static liquid with constant densities ρ g and ρ l and dynamic viscosities μ g and μ l . The system is solved by using the incompressible Navier–Stokes equations, employing the one-fluid approach as depicted below :
ρ ( t u + u · u ) = p + · ( 2 μ D ) + σ κ δ s n , · u = 0 ,
where u is the velocity of the fluid, μ μ ( x , t ) is the viscosity , ρ ρ ( x , t ) is the density and D is the deformation tensor. The surface tension term is acting only at the interface by using the Dirac distribution function δ s and the surface tension coefficient is denoted by σ . κ and n denote the local curvature and the normal unit vector to the interface, respectively. We use the Basilisk open-source solver [28], an improved version of the Gerris solver, widely used for various multi-phase flow problems. [27,29,30]. Basilisk makes use of the Volume-Of-Fluid (VOF) method to track the liquid-gas interface on an octree-structured grid, enabling adaptive mesh refinement. Physical properties such as μ and ρ are defined using the volume fraction of the liquid phase f. Linear interpolation is used for cells containing the interface of the filament.
μ ( f ) = f μ l + ( 1 f ) μ g ρ ( f ) = f ρ l + ( 1 f ) ρ g
The transport equation of f is given by:
t f + · ( u f ) = 0 .
The calculation of surface tension employs a balanced-force technique, and the curvature of the interface is precisely determined using the height function. The adaptive mesh refinement is based on a criterion of wavelet-estimated discretization error [31]. Further details of numerical methods used in Basilisk are provided in [32].

2.2. Numerical Simulations and Results

We numerically investigate a two-dimensional axisymmetric air filament embedded in a denser environment. The initial length and diameter of the air filament are 2 L 0 and D = 2 R 0 , see Figure 1 (a). The length of filament at any arbitrary time is given by 2 L = 2 L ( t ) , depicted in Figure 1 (b). A fixed value of the diameter D = 1 mm is considered. The computational domain has dimensions of 50 D × 50 D , with the bottom boundary corresponding to the symmetrical axis of the filament. Free-slip boundary conditions are applied to the other boundaries, and the filament is centered in the middle of the computational domain ( z / D = 25 ). The dynamics of the air filament are characterized by the associated Ohnesorge number O h = μ l / ρ l σ D 0 and its initial aspect ratio Γ = L 0 / R 0 . The liquid/gas physical parameters used are summarized in Table 1
A mesh independence study is first performed using an adaptive mesh up to a maximum number of 2 l × 2 l with the level l = 8 , 9 , 10 , 11 , 12 , for simulations with O h = 0.001 and Γ = 10 . The simulations are run up to the first bubble separation and its radius is compared using the result at l = 12 as a reference value. As shown in Figure 2, less than 0.1% of error is obtained at l = 11 . For the sake of computational resources, the adaptive mesh refinement with a maximum number of 2 11 × 2 11 will be used for the following computations. This corresponds to a minimum mesh size Δ = D / 41 . The air filament contracts due to surface tension effects. As the filament’s tails retract, two bulges form at its end, gathering the displaced inner gas.
The radius of the bulge increases over time and is denoted by R m a x , as illustrated Figure 1 (b). In the case of long air filaments, a neck connecting the bulges to the filament forms, corresponding to the minimum radius along the filament, denoted as R m i n . It is important to note that the location of R m i n along the filament can change with time and does not necessarily correspond to the neck, as we will observe later.
We conduct simulations for O h ranging from [0.001:10], and Γ [6:15], covering the transitional regime. Four distinct breakup behaviors: No-Breakup, Neck-Reopening-Middle-Pinching, Middle-Pinching, and End-Pinching can be observed. These different outcomes of the air filament dynamics are shown on the phase diagram, see Figure 3. We categorize this phase diagram into different regimes, namely I, II, III, and IV, based on distinct breakup behaviors. Regime I shows the neck-reopening-middle-pinching, Regime II depicts no-breakup, Regime III shows the middle-pinching, and Regime IV represents end-pinching. At O h = 0.1 , a critical limit O h l i m is observed for the transition from the neck-reopening regime to the middle-pinching regime. For O h O h l i m , the transition aspect ratio Γ t increases with O h , but is constant for O h > O h l i m . Regime (I) is bound by a power law of Γ t Oh 0.09 above which the filament always undergoes end-pinching. At the lower limit, below Γ t Oh 0.17 , the filament will successfully recoil. In between, the filament always undergoes a neck-reopening-middle-pinching regime. On the contrary, when O h > O h l i m , a constant transition aspect ratio of Γ t = 11 separates the recoiling and middle pinching, while Γ t = 15 segregates middle pinching from end-pinching.
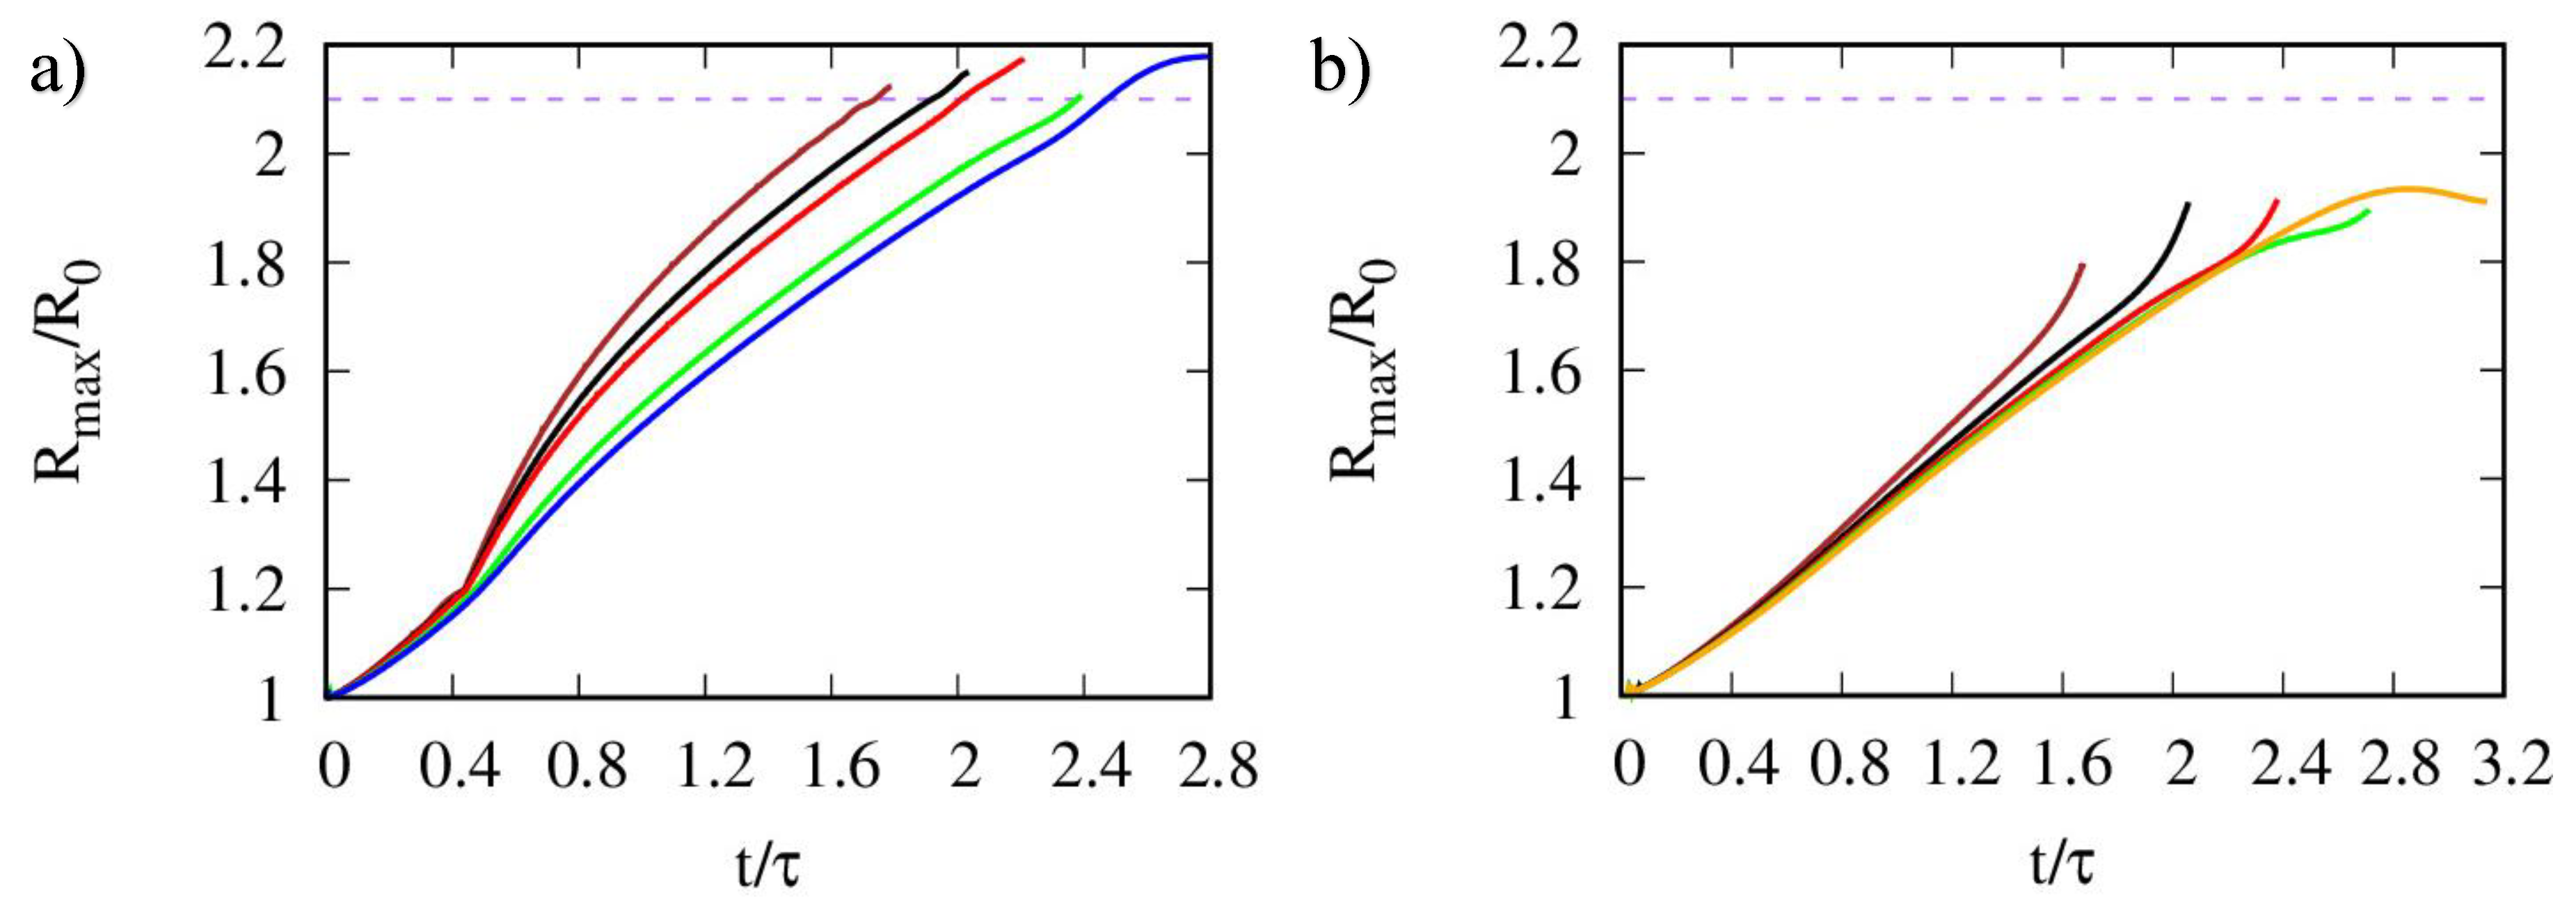
The time evolution of the bulge radius R m a x is depicted in Figure 4 for the breakup (including the middle breakup) and no-breakup regimes respectively for O h O h l i m . It’s important to note that the last point on the curves in Figure 4 (a) and (b) corresponds to the bulge separation time and the bulge collision time, respectively. In the no-breakup regime, notably, the radius of the bulge does not exceed a fixed value of approximately 2.1 R 0 before the two bulges collide, as shown in Figure 4 (b) (observed for all the orange square dots in Figure 3). On the contrary, in the breakup regime, the bulge radius monotonically increases, reaching or even exceeding this value before the separation occurs, as depicted in Figure 4 (a).
Assuming a uniform velocity within the bulges (provided that the two bulges are not too close to each other), its volume, V b u l g e , at any time can be estimated by following [33]:
V b u l g e = π R 0 2 ( L 0 L ( t ) ) + 2 3 π R o 3 ,
where L ( t ) represents half the filament length at the time t. For large aspect ratios, i.e. in the end-pinching regime, the bulge will separate when R m a x 2.1 R 0 . At breakup, the bulge volume corresponds to 4 3 π R m a x 3 . It can be easily shown that a sufficient condition for the air filament to break up is V b u l g e > 4 3 π ( 2.1 R 0 ) 3 , which implies that L 0 L ( t ) 11 R 0 . Therefore, a phenomenological estimate of the limit between breakup and no-breakup can be derived as Γ = L 0 / R 0 > 11 . Based on the observations above, one can conclude that no recoiling is observed above Γ > 11 provided that O h O h l i m .
For the neck-reopening-middle-pinching regime, the neck reopens followed by a jump of the R m i n location from the neck position to the middle of the filament where the subsequent separation will occur. The jump distance reveals an intriguing pattern when Γ is fixed and the O h is varied, or vice versa. At a constant O h = 0.01, increasing Γ results in an increase in the jump distance until it reaches a threshold, beyond which the filament shifts to end-pinching from neck-reopening-middle-pinching. This increase in the magnitude of the jump distance is evident in Figure 5 (a) where the black line represents Γ = 7.5, the blue line represents Γ = 8, the green line represents Γ = 8.5, the red line represents Γ = 9, and the orange line represents Γ = 10. At a constant Γ = 10 , an increase in O h leads to a decreasing jump distance. This could be seen in Figure 5 (b) where the black line represents O h = 0.01, the blue line represents O h = 0.015, the red line represents O h = 0.02, the orange line represents O h = 0.03, and the green line shows O h = 0.04. Further increasing the O h causes the filament to recoil.
Figure 6 illustrates the axial velocity field within the air filament for O h = 0.01 and Γ = 9 at two different time steps at t / τ = 1.69 (before the reopening of the neck) and t / τ = 1.93 (after neck reopening). At both times, a stagnation point is formed in the middle of the filament, characterized by a zero local velocity. Upon inspecting the velocity field, it becomes apparent how the fluid is expelled from the neck to the bulge and toward the center of the filament. However, despite this, a recirculating flow at the stagnation point counteracts the expelled fluid, causing the neck to reopen. The reopening of the neck was previously observed in the recoiling of liquid filaments, allowing the filament to escape from pinch-off through the formation and the shedding of a vortex ring [34]. The velocity vectors (not scaled to magnitude) around the stagnation point and the neck region can be observed in Fig Figure 6.

3. Conclusion

We numerically investigate the dynamics of a quiescent finite-size air filament in a static liquid, focusing on the transitional regime. Surface tension causes the two ends of the air filament to retract, forming bulges. The observed breakup behavior is categorized into four distinct regimes, labeled I, II, III, and IV, each with its appropriate scaling. For O h O h l i m = 0.1 , the mass of the detached bubble is roughly more than 2.1 times the size of the initial radius of the filament. Utilizing this assumption, a first-order approximate mathematical model is presented, demonstrating that if the Γ of the filament exceeds 11, the filament tends to always breakup. In the neck-reopening regime, there is an increasing trend in the jump size from the neck to the center of the filament with an increase in Γ , and it decreases when O h is increased. The reopening of the neck is induced by a recirculating flow around the stagnation point at the center of the filament. This ultimately leads to the breakup at the center of the filament.

Data Availability Statement

The data that support the findings of this study are available from the corresponding author upon reasonable request.

References

  1. Martin, G.D.; Hoath, S.D.; Hutchings, I.M. Inkjet printing-the physics of manipulating liquid jets and drops. Journal of Physics: Conference Series. IOP Publishing, 2008, Vol. 105, p. 012001. [CrossRef]
  2. Kim, B.H.; Kim, T.G.; Lee, T.K.; Kim, S.; Shin, S.J.; Kim, S.J.; Lee, S.J. Effects of trapped air bubbles on frequency responses of the piezo-driven inkjet printheads and visualization of the bubbles using synchrotron X-ray. Sensors and Actuators A: Physical 2009, 154, 132–139. [Google Scholar] [CrossRef]
  3. van der Bos, A. AIR ENTRAPMENT DROP FORMATION INKJET PRINTING. Ph.D. thesis,University of Twente 2011.
  4. Åmand, L.; Olsson, G.; Carlsson, B. Aeration control–a review. Water Science and Technology 2013, 67, 2374–2398. [Google Scholar] [CrossRef] [PubMed]
  5. Harja, G.; Nascu, I.; Muresan, C.; Nascu, I. Improvements in dissolved oxygen control of an activated sludge wastewater treatment process. Circuits, Systems, and Signal Processing 2016, 35, 2259–2281. [Google Scholar] [CrossRef]
  6. Skouteris, G.; Rodriguez-Garcia, G.; Reinecke, S.; Hampel, U. The use of pure oxygen for aeration in aerobic wastewater treatment: a review of its potential and limitations. Bioresource Technology 2020, 312, 123595. [Google Scholar] [CrossRef]
  7. Kim, T.; Hite, M.; Rogacki, L.; Sealock, A.W.; Sprouse, G.; Novak, P.J.; LaPara, T.M. Dissolved oxygen concentrations affect the function but not the relative abundance of nitrifying bacterial populations in full-scale municipal wastewater treatment bioreactors during cold weather. Science of the Total Environment 2021, 781, 146719. [Google Scholar] [CrossRef]
  8. Melville, W.K. The role of surface-wave breaking in air-sea interaction. Annual review of fluid mechanics 1996, 28, 279–321. [Google Scholar] [CrossRef]
  9. Deane, G.B.; Stokes, M.D. Scale dependence of bubble creation mechanisms in breaking waves. Nature 2002, 418, 839–844. [Google Scholar] [CrossRef]
  10. Wanninkhof, R.; Asher, W.E.; Ho, D.T.; Sweeney, C.; McGillis, W.R. Advances in quantifying air-sea gas exchange and environmental forcing. Annual review of marine science 2009, 1, 213–244. [Google Scholar] [CrossRef]
  11. Kiger, K.T.; Duncan, J.H. Air-entrainment mechanisms in plunging jets and breaking waves. Annual Review of Fluid Mechanics 2012, 44, 563–596. [Google Scholar] [CrossRef]
  12. Wilson, T.W.; Ladino, L.A.; Alpert, P.A.; Breckels, M.N.; Brooks, I.M.; Browse, J.; Burrows, S.M.; Carslaw, K.S.; Huffman, J.A.; Judd, C.; others. A marine biogenic source of atmospheric ice-nucleating particles. Nature 2015, 525, 234–238. [Google Scholar] [CrossRef]
  13. Veron, F. Ocean spray. Annual Review of Fluid Mechanics 2015, 47, 507–538. [Google Scholar] [CrossRef]
  14. Lubin, P.; Glockner, S. Numerical simulations of three-dimensional plunging breaking waves: generation and evolution of aerated vortex filaments. Journal of Fluid Mechanics 2015, 767, 364–393. [Google Scholar] [CrossRef]
  15. Deike, L.; Melville, W.K.; Popinet, S. Air entrainment and bubble statistics in breaking waves. Journal of Fluid Mechanics 2016, 801, 91–129. [Google Scholar] [CrossRef]
  16. Chan, W.H.R.; Mirjalili, S.; Jain, S.S.; Urzay, J.; Mani, A.; Moin, P. Birth of microbubbles in turbulent breaking waves. Physical Review Fluids 2019, 4, 100508. [Google Scholar] [CrossRef]
  17. Ruan, S.p.; Wu, J.h.; Wu, W.w.; Xi, R.z. Hydraulic research of aerators on tunnel spillways. Journal of Hydrodynamics, Ser. B 2007, 19, 330–334. [Google Scholar] [CrossRef]
  18. Park, C.P.; Kim, D.P. Dual-channel microreactor for gas- liquid syntheses. Journal of the American Chemical Society 2010, 132, 10102–10106. [Google Scholar] [CrossRef]
  19. Ren, X.; Bachman, M.; Sims, C.; Li, G.; Allbritton, N. Electroosmotic properties of microfluidic channels composed of poly (dimethylsiloxane). Journal of Chromatography B: Biomedical Sciences and Applications 2001, 762, 117–125. [Google Scholar] [CrossRef] [PubMed]
  20. Cheng, M.; Lou, J.; Lim, T. Motion of a bubble ring in a viscous fluid. Physics of Fluids 2013, 25, 067104. [Google Scholar] [CrossRef]
  21. Martínez-Bazán, C. About bubbles and vortex rings. Journal of Fluid Mechanics 2015, 780, 1–4. [Google Scholar] [CrossRef]
  22. Abadie, T.; Matar, O. Numerical modelling of bubble dynamics and growth in supersaturated water using a Front-Tracking method. Bulletin of the American Physical Society 2021, 66. [Google Scholar]
  23. Taylor, G.I. The dynamics of thin sheets of fluid II. Waves on fluid sheets. Proceedings of the Royal Society of London. Series A. Mathematical and Physical Sciences 1959, 253, 296–312. [Google Scholar] [CrossRef]
  24. Culick, F.E. Comments on a ruptured soap film. Journal of applied physics 1960, 31, 1128–1129. [Google Scholar] [CrossRef]
  25. De Gennes, P.G.; Brochard-Wyart, F.; Quéré, D.; Phenomena, W. Drops, bubbles, pearls, waves, 2004. [CrossRef]
  26. Ma, Y.; Cheng, Y.; Zhang, D.; Zhang, K.; Wang, F. Numerical prediction of breakup mode of contracting gas filament in liquid. Int J Numer Meth Fluids. 2021, 1–12. [Google Scholar] [CrossRef]
  27. Osama, M.; Deng, P.; Thoraval, M.J.; Agbaglah, G.G. Dynamics of finite-size air filaments in a static liquid. Physics of Fluids 2022, 34, 062106. [Google Scholar] [CrossRef]
  28. Popinet, S. Basilisk, a free-software program for the solution of partial differential equations on adaptive cartesian meshes. URL http://basilisk. fr () 2018.
  29. Osama, M. Computational Analysis of Finite Size Air Filaments in Static Liquid. Master’s thesis, Wayne State University, 2024.
  30. Osama, M.; Agbaglah, G.G. Breakup regimes of the long-time dynamics of a finite-size air filament in a dense fluid. Physics of Fluids 2023, 35. [Google Scholar] [CrossRef]
  31. Van Hooft, J.A.; Popinet, S.; Van Heerwaarden, C.C.; Van der Linden, S.J.; de Roode, S.R.; Van de Wiel, B.J. Towards adaptive grids for atmospheric boundary-layer simulations. Boundary-layer meteorology 2018, 167, 421–443. [Google Scholar] [CrossRef]
  32. Popinet, S. An accurate adaptive solver for surface-tension-driven interfacial flows. J. Comput. Phys. 2009, 228, 5838–5866. [Google Scholar] [CrossRef]
  33. Pierson, J.L.; Soares, E.J.; Popinet, S. Revisiting the Taylor-Culick approximation: Retraction of an axisymmetric filament. Phys. Rev. Fluids 2020, 5, 073602. [Google Scholar] [CrossRef]
  34. Hoepffner, J.; Paré, G. Recoil of a liquid filament: Escape from pinch-off through creation of a vortex ring. J. Fluid Mech. 2013, 734, 183–197. [Google Scholar] [CrossRef]
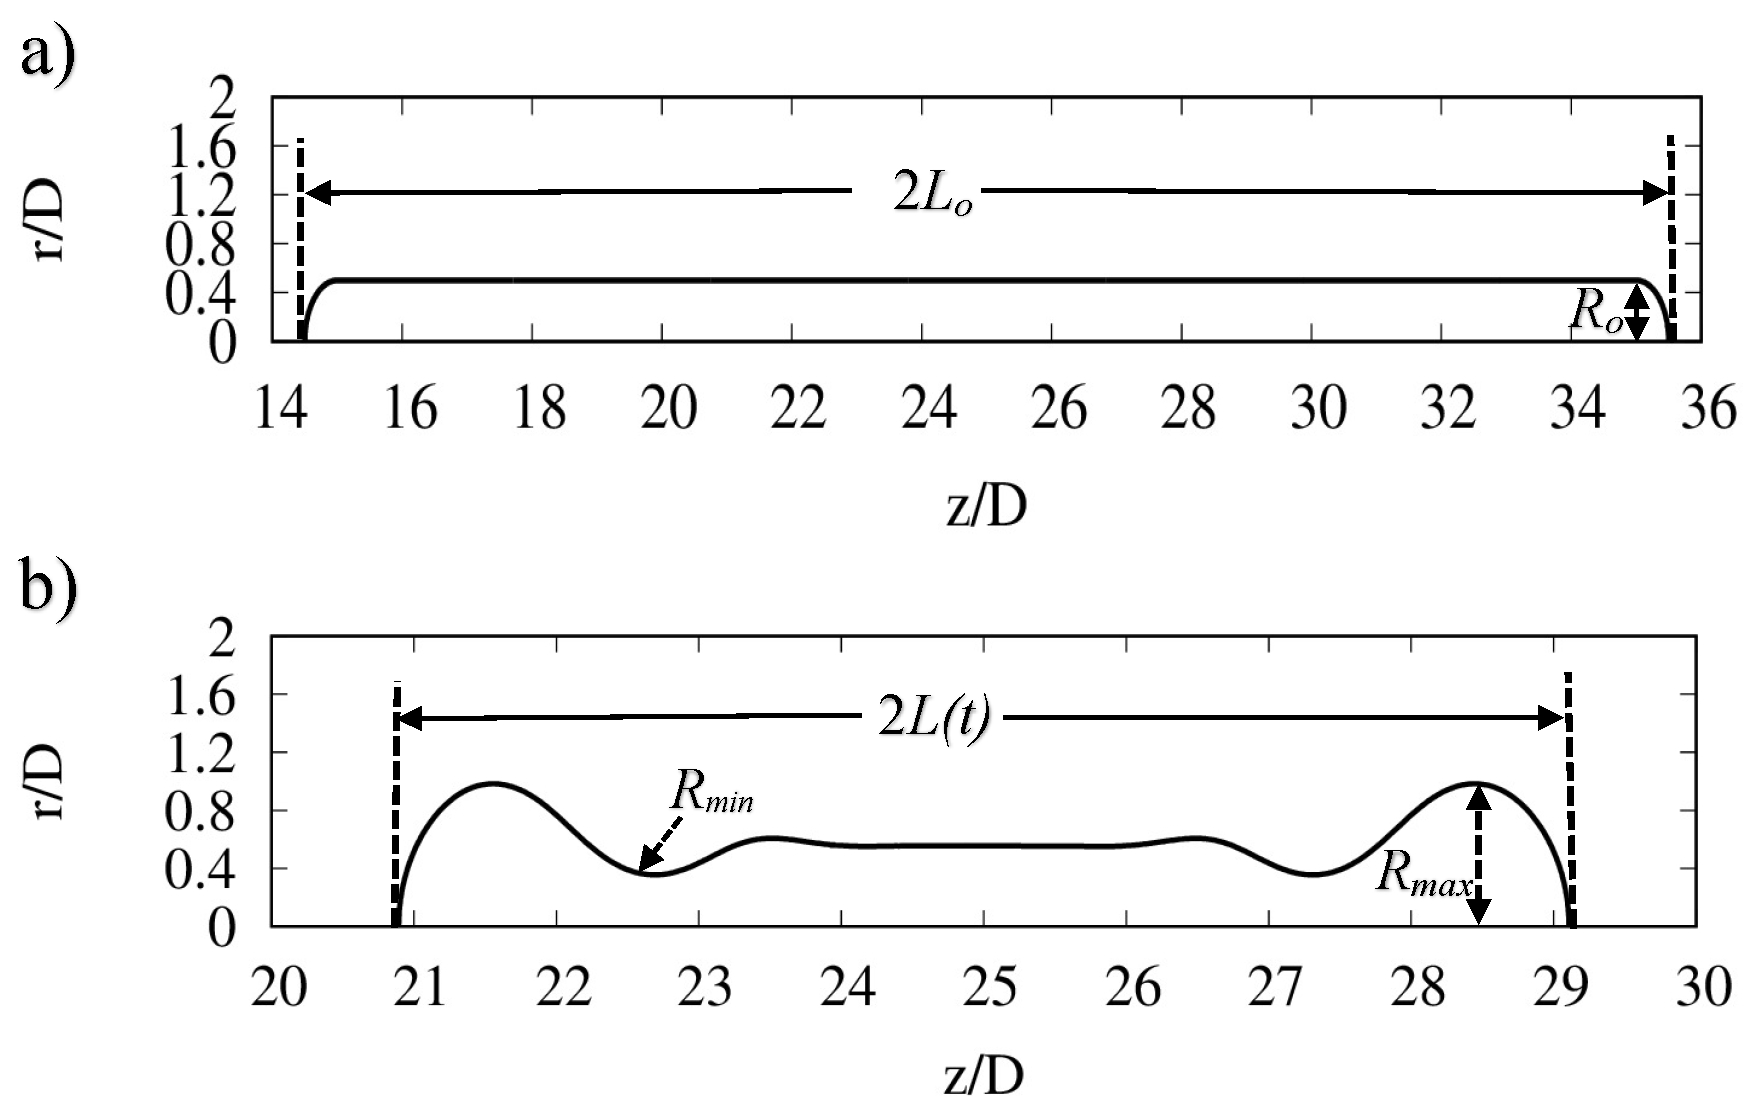
Figure 1. a) Axisymmetric air filament showing the intial length 2 L o and the initial radius of filament R 0 . b) Sketch showing the minimum and maximum radius along the filament R m i n and R m a x , respectively after some time t. The length of the filament is denoted by 2 L ( t ) . The filament is centered in the middle of the computational domain ( z / D = 25 ).
Preprints 120909 g001
Figure 2. Mesh independence study for O h = 0.001 and Γ = 10 . Five different mesh refinements are used 2 l × 2 l , with l = 8 , 9 , 10 , 11 , 12 . The results at l = 12 are considered as reference values. The relative error is calculated using the radius of the first bubble separation and plotted on a log-log scale. The dashed line corresponds to a power-law fit that yields 1 / x 1.53 .
Preprints 120909 g002
Figure 3. Phase diagram of the transition regime of the air filament dynamics, in log-log scale. Four different regimes can be seen. Regime I shows the neck-reopening-middle-pinching (black ×), Regime II depicts no-breakup (orange □), Regime III shows the middle-pinching (green ×), and Regime IV represents end-pinching (blue filled ◯). The red dashed line around regime I correspond to the power-law fit with the exponent of 0.09 (upper line) and brown dashed line correspond to the exponent of 0.17 (lower line).
Preprints 120909 g003
Figure 4. Radius of the bulge as a function of non-dimensional time in the breakup regimes (a) and no-breakup regime (b). The endpoints of the curves correspond to the breakup time in (a) and the recoiling time in (b). For (a), Γ = 10 and, O h = 0.001 (brown line), O h = 0.0055 (black line), O h = 0.01 (red line), O h = 0.03 (green line) and O h = 0.04 (blue line). For (b), O h = 0.1 and, Γ = 6 (brown line), Γ = 7 (black line), Γ = 8 (red line), Γ = 9 (green line) and Γ = 10 (orange line).The purple dashed line represents R m a x / R 0 = 2.1 .
Preprints 120909 g004
Figure 5. (a) Axial position of R m i n showing the jump from the neck position to the middle of the filament in the neck-reopening-middle-pinching regime for (a) constant O h =0.01 and, Γ =7.5 (black), Γ =8 (blue), Γ =8.5 (green), Γ =9 (red), and Γ =10 (orange). For (b) constant Γ =10, and O h =0.01 (black), O h =0.015 (blue), O h =0.02 (red), O h =0.03 (orange), and O h =0.04 (green).
Preprints 120909 g005
Figure 6. Axial velocity field, u z / σ / ρ l D 0 , within the air filament for O h = 0.01 and Γ = 9 at t / τ = 1.69 (a) and t / τ = 1.93 (b). Zoom in on the stagnation point enclosed within a box showing the velocity vectors (not scaled to their magnitude).
Preprints 120909 g006
Table 1. Simulation parameters.
Phase ρ (kg m 3 ) μ (Pa s) σ (N m 1 ) Γ
Liquid 1000 10 3 0.069
Gas 1.2 1.7 × 10 5 6 – 15
Disclaimer/Publisher’s Note: The statements, opinions and data contained in all publications are solely those of the individual author(s) and contributor(s) and not of MDPI and/or the editor(s). MDPI and/or the editor(s) disclaim responsibility for any injury to people or property resulting from any ideas, methods, instructions or products referred to in the content.
Copyright: This open access article is published under a Creative Commons CC BY 4.0 license, which permit the free download, distribution, and reuse, provided that the author and preprint are cited in any reuse.
Prerpints.org logo

Preprints.org is a free preprint server supported by MDPI in Basel, Switzerland.

Subscribe

© 2024 MDPI (Basel, Switzerland) unless otherwise stated