1. Introduction
Paperboard, as a fiber-based material, has become widely used in the packaging industry, thanks in large part to its superior sustainability compared to polymers. The forming process is a key technology in packaging production, which is divided into 2D forming, such as creasing and folding, and 3D forming, such as deep drawing, press forming, and hydroforming. Compared to traditional 2D forming processes, 3D forming processes allow the direct and efficient manufacture of products with more complex geometries [
1].
In order to improve processing and increase production stability, it is necessary to have a strategy for evaluating formed parts using measurable values. Two common approaches are available: evaluating fracture and structural damage of formed parts produced through the forming. However, wrinkles are often present and also unavoidable in paperboard forming and are typically not considered as a complete destructive damage, but rather as a locally limited material failure. Therefore, this strategy fails to adequately characterize the quality of the formed part. Another approach is to use criteria related to the final appearance of the formed part for a more detailed assessment. Hauptmann and Majschak proposed three characteristics, i.e., visual quality, shape accuracy, and shape stability [
2]. One important point to note is the assessment of shape accuracy due to springback effects. Springback effects refer to the geometric changes that occur to a part at the end of the forming process after the part has been released from the forces of the forming tool. Due to the anisotropy of the paper, meaning the varying mechanical properties in the Machine Direction (MD) and Cross Direction (CD), the degree of springback varies in different directions. Oval shapes of deep-drawn parts which were originally formed axisymmetric, in particular without flanges, occurs as a consequence mainly of the springback effect. In certain instances, the cause can also be paper curl, which is a result of the effect of heat.
During the deep drawing process, a high number of uniform wrinkles are desired, as this ensures that the flanges are of essentially the same thickness and damage is reduced [
2]. For the majority of materials, wrinkles that emerge during deep drawing are regarded as a significant defect that not only affects subsequent processes but can also result in substantial deterioration of the mechanical properties of the product. Ultrasonic technology has been employed for in-line detection of wrinkles in deep-drawn products, as the ultrasonic reflection intensity is altered by the occurrence of the wrinkles [
3,
4]. With the growing prevalence of machine vision in production, particularly for process control and quality supervision, the use of ultrasonic technology for in-line detection of wrinkles in deep-drawn products is becoming increasingly common. Moreover, ultrasonic technology has inherent limitations in its application to relatively thin fiber materials. Gupta et al. [
5,
6] utilized RGB and infrared images, along with depth measurements, to discern wrinkles and boundary edges of fiber products positioned on the double-curved surface of a modular gripper. However, this method heavily relies on finely calibrated, handcrafted parameters and assumptions, necessitating recalibration for each new scenario. A non-destructive method of wrinkle identification has been sought for faster quality evaluation and comparison. Wallmeier et al. [
7] utilized an imaging device consisting of an industrial camera and four movable axes for positioning, rotating, and focusing, which could capture three-dimensional grayscale images of the developed elevation of the cup wall. By combining various filtering algorithms, this procedure can be applied to uncolored paperboards of different types. However, the geometry is limited to rotationally asymmetric shapes. Also, due to the inhomogeneous nature of the paperboard surface, edge detection algorithms may misinterpret surface features when there is insufficient contrast between them and the folds. Laser scanning was used to analyze the sample’s morphology and evaluate the wrinkle structure in the data by Müller et al. [
8]. To isolate the wrinkle structure data from the surface roughness, a Butterworth frequency filter was employed in combination with a customized wrinkle detection algorithm. One limitation of the measurement method is its reliability in detecting very fine wrinkle structures with a wrinkle size less than 12
or a high degree of wrinkle compression in the drawing clearance. This method was later extended to inline quality assessment [
9], providing a flexible and efficient way to evaluate the quality of the formed paperboard product in considerably reduced time frames. Wrinkles in the small flange area that serves as a sealing rim independently of the base geometry were evaluated in [
10] using transmitted light.
The objective of this work is to evaluate the wrinkling in deep-drawn paperboard products using an automated recognition program that accounts for the springback effect, thereby enabling accurate evaluation of the final product and optimization of process parameters. Free selection of the region to be detected and display of the wrinkle formation not limited by the number of wrinkles. Additionally, a method for manual correction following the automatic detection under high accuracy requirements is also provided. A photograph platform, designed to be unaffected by ambient light, is used for this purpose. Automatic wrinkle detection is then performed on deep-drawn paperboard products with and without flanges. The developed photograph platform and detection program are utilized to investigate the correlation between various parameters, including material properties, blank holder force, drawing depth, drawing clearance, and punch speed, with the number of wrinkles in the deep drawing process of paper and paperboard.
2. Materials and Methods
2.1. Materials and Deep Drawing Experiments
Two types of paperboard: Paperboard A is a three-layer fiber construction board with chemithermomechanical pulp (CTMP) in the middle layer, providing it with excellent tensile strength. Paperboard B is a paperboard with especially good stretchability (about 15%) and almost isotropic properties due to the special design of the microstructure and the paper manufacturing. The thickness of material A is 0.42 mm and B is 0.35 mm.
A deep drawing experiment on paperboard is carried out with a deep drawing machine for fiber-based materials at the Technical University of Dresden (details in [
2]), consisting of a drawing punch, a blank holder, and a drawing die. The experimental matrix is presented in
Table 1. All experiments are conducted at room temperature and the specimens are not pre-conditioned. The samples of material A have two radii, 65 and 85
to test the automatic procedure for samples without and with flange, while the samples of material B have only 85
.
2.2. Photography Platform Setup
The initial stage of image recognition involves capturing the image. To ensure high-quality and consistent images, a darkroom camera platform must be established to provide a stable and uniform capture environment. As paper is translucent, any wrinkles caused by excess material buildup will appear darker in the image than in other areas. The design of the photographic platform and the wrinkle detection program are based on this principle.
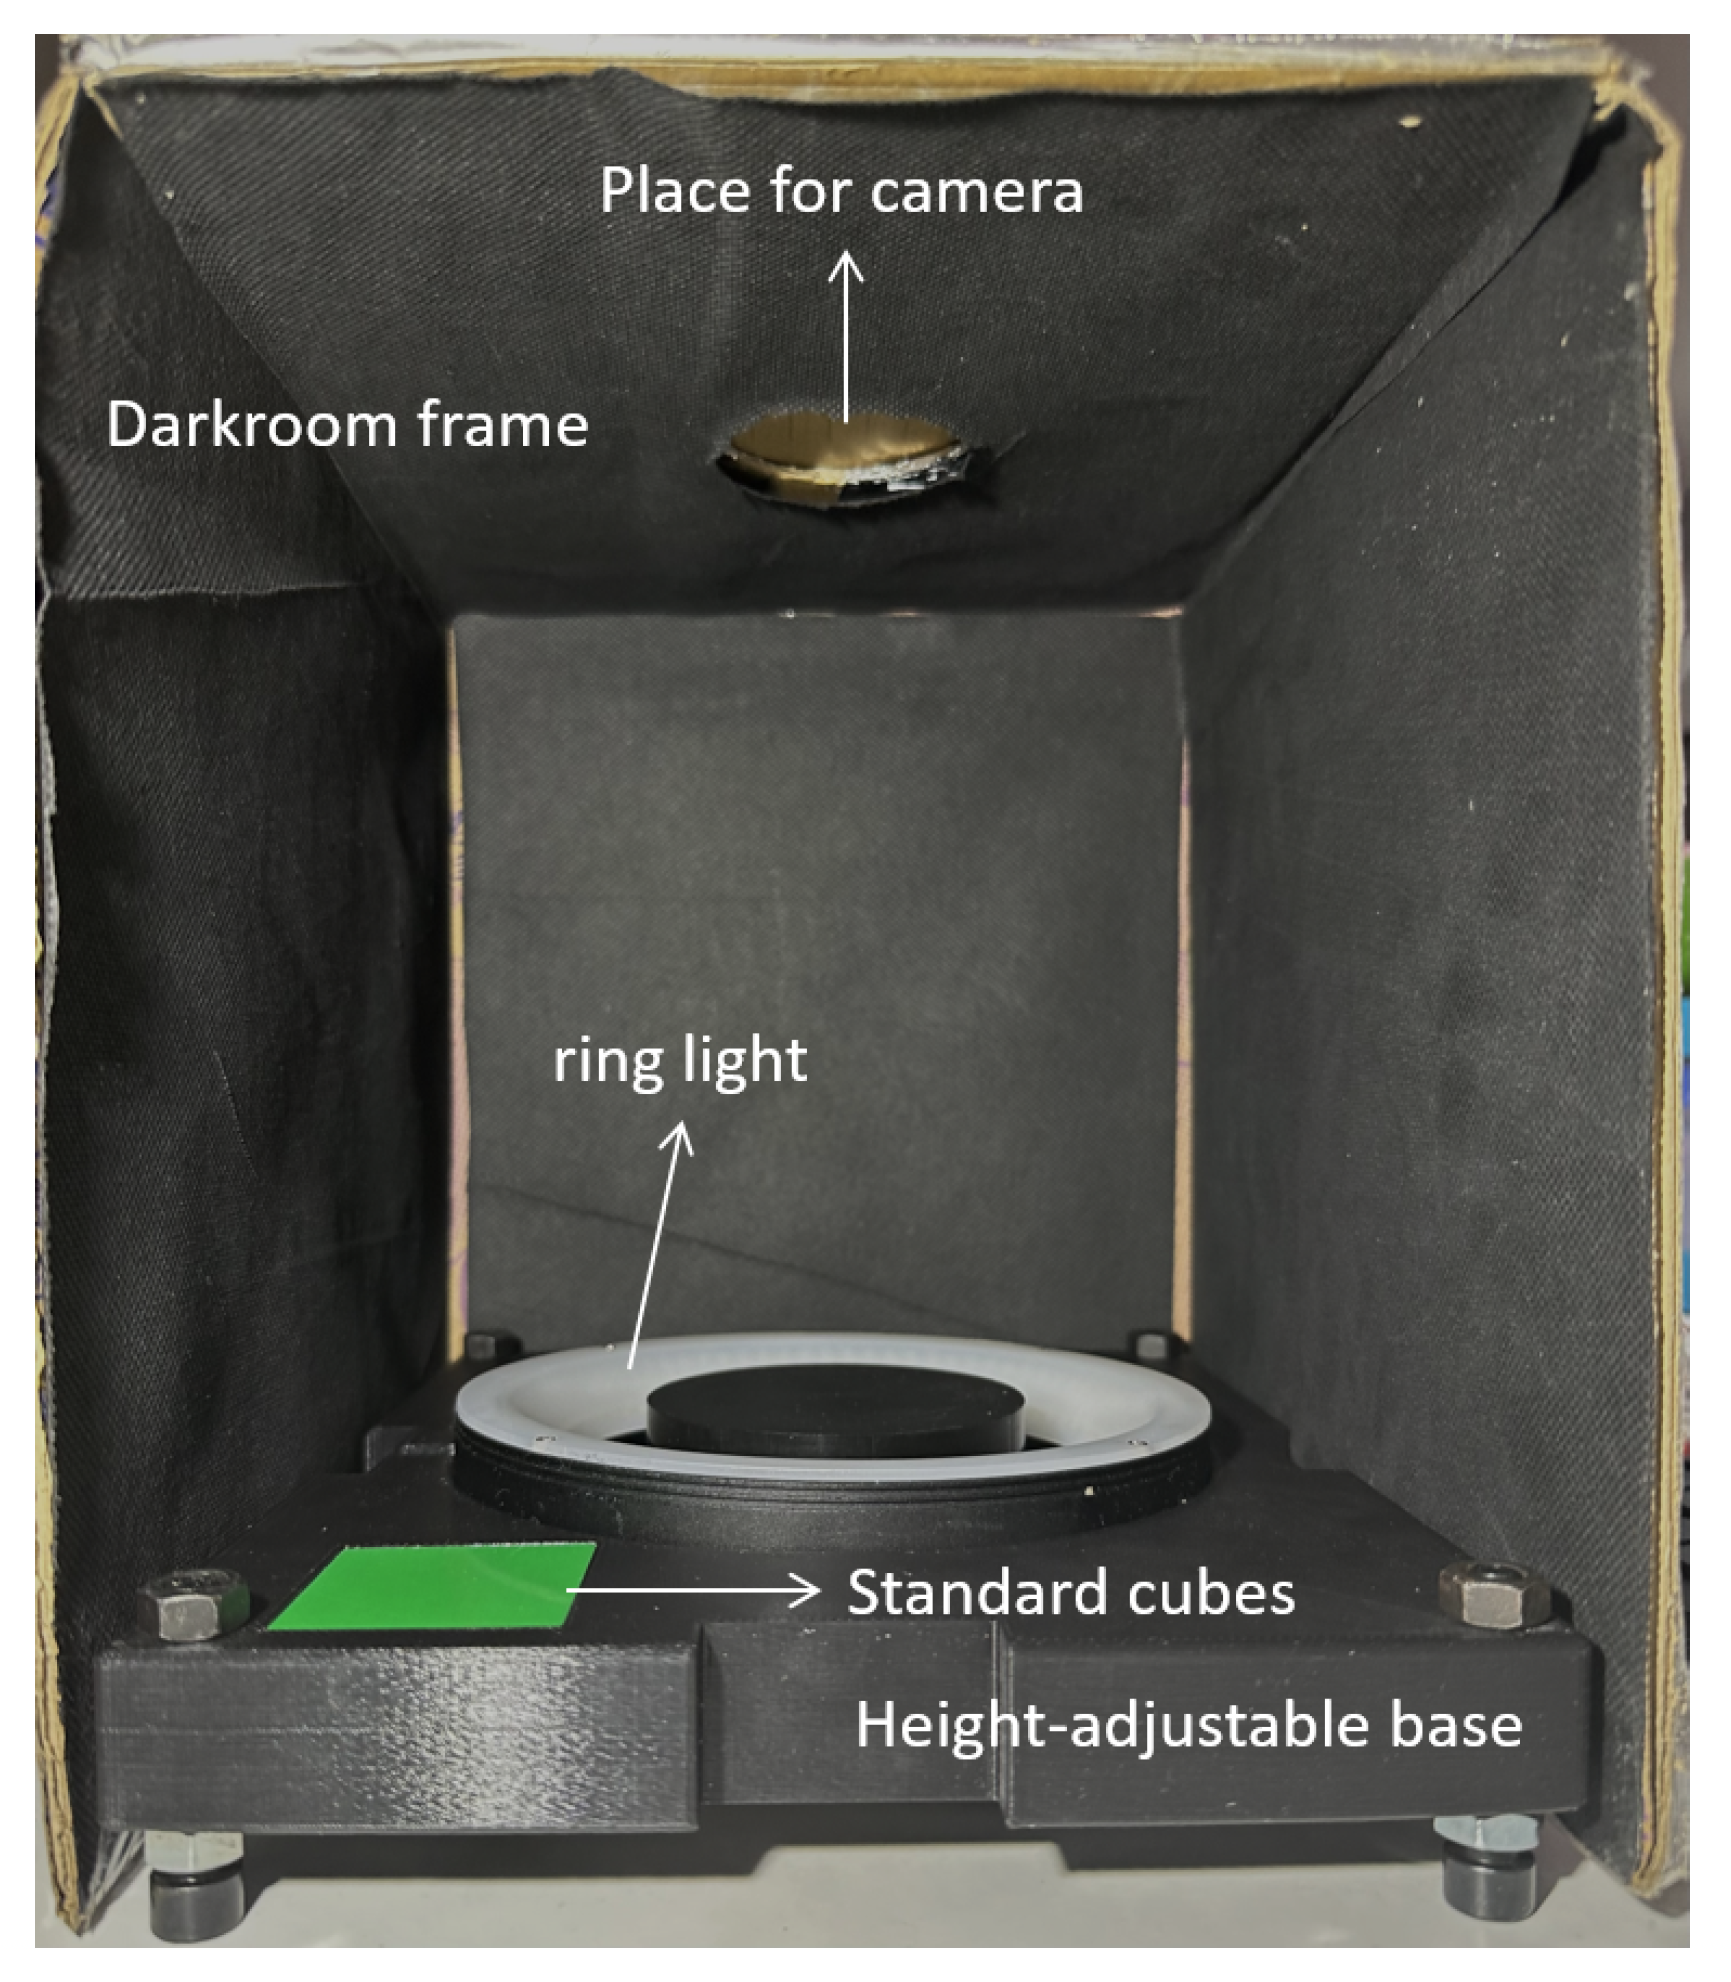
The photograph platform comprises an adjustable base, a darkroom frame, and a space for the camera (see
Figure 1). The camera can be placed over a hollowed-out hole and is tested with cameras from portable devices like mobile phones and tablet devices, or single-lens reflex (SLR) cameras (such as Canon EOS 70D), and industrial cameras (such as Basler C11-2520-12M-P), but with very little difference in the recognition results. The system’s adaptability allows for easy selection of an existing camera device without the need for a specific purchase. The height of the 3D printed base can be adjusted using screws to fit various sample sizes. Additionally, the base includes a green standard block measuring
, which is utilized to convert and calculate the actual geometry of the folds to scale.
The light source is an important part of this photography platform. The experiments utilized cup or deep disk-shaped samples, requiring a ring light source with diffuse light apertures. Depending on the formed part’s shape, different light sources can be used, which can be easily fabricated using 3D printers and light strips. The ring light source provides uniform light intensity and enhances the visibility of the formed part’s wrinkles. The color of the light source has little effect on crease detection, since the actual color difference between the wrinkled and un-wrinkled areas of the sample is small. Furthermore, a 3D-printed ring frame is placed on the base to ensure uniformity of light on the sample, reducing the difference between areas with weaker and stronger light intensity.
In addition, the photography platform features a darkroom system to block out sunlight and interior light, which significantly impacts image quality. The inner surface of the envelope system is coated with a low-reflective material to reduce reflections that also affect image quality. The platform measures approximately .
2.3. Program for Automatic Wrinkle Detection
2.3.1. Procedure of Wrinkle Detection
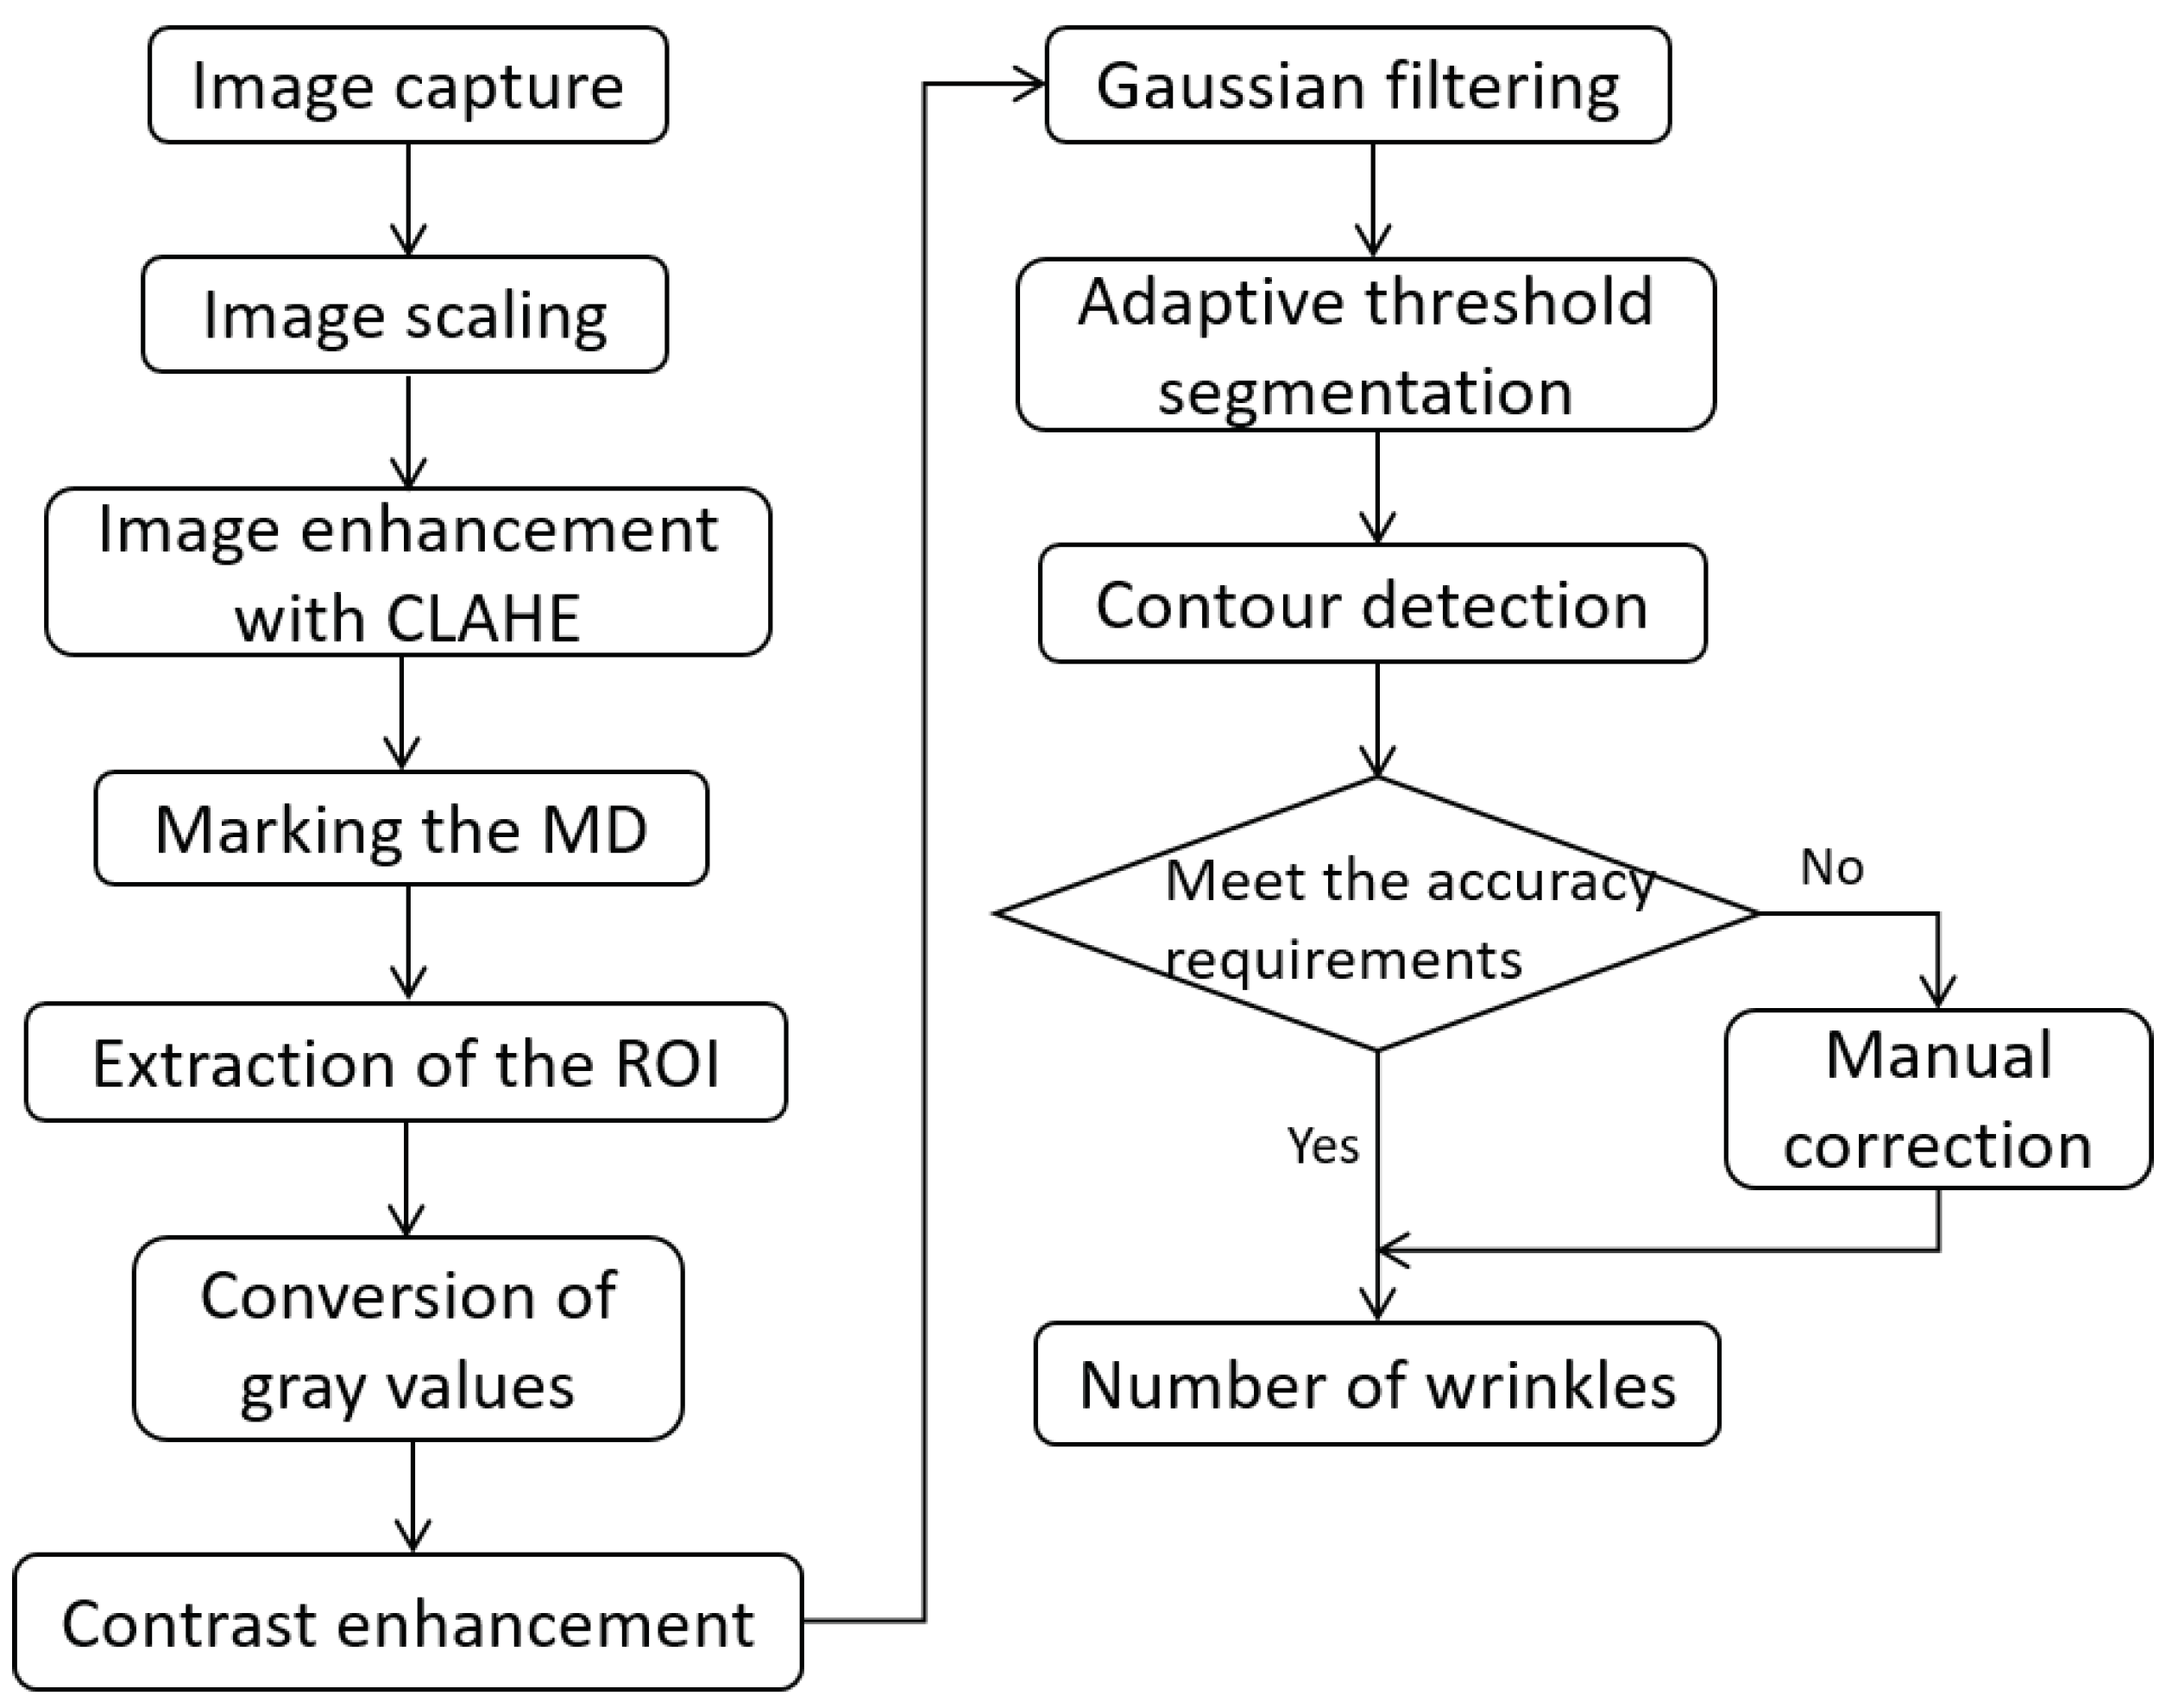
The flow chart of the wrinkle detection program is illustrated in
Figure 2.
Images taken with the photography platform must be scaled to the actual size and enhanced using CLAHE (Contrast Limited Adaptive Histogram Equalization) to improve contrast. Subsequently, the machine direction (MD) and the region of interest (ROI), i.e., the flange area and side wall area, can be marked manually, thereby enabling the documentation of anisotropy in the paper. Different ROI shapes can be selected depending on the shape of the bottom of the molded part, such as a circle, an oval, or a rectangle with rounded corners.
The resulting ROI image must be converted to a grayscale image in the next step, containing only one color channel with values between 0 and 255. To increase the contrast, contrast enhancement is used, since the contrast between the wrinkled and unwrinkled regions is low after conversion to grayscale. After enhancing the contrast, it is necessary to apply Gaussian filtering to remove noise from the image. Then, adaptive Gaussian threshold segmentation is performed by setting all thresholds above the mean value to 255 (white). Finally, by converting the grayscale image to a binary image, only black and white colors emphasize the wrinkles. Contour detection is utilized to identify the contours of the white area, specifically the wrinkles, and then evaluate them based on their size. Contour areas smaller than a manually defined threshold are considered noise and are excluded from the final recognition result.
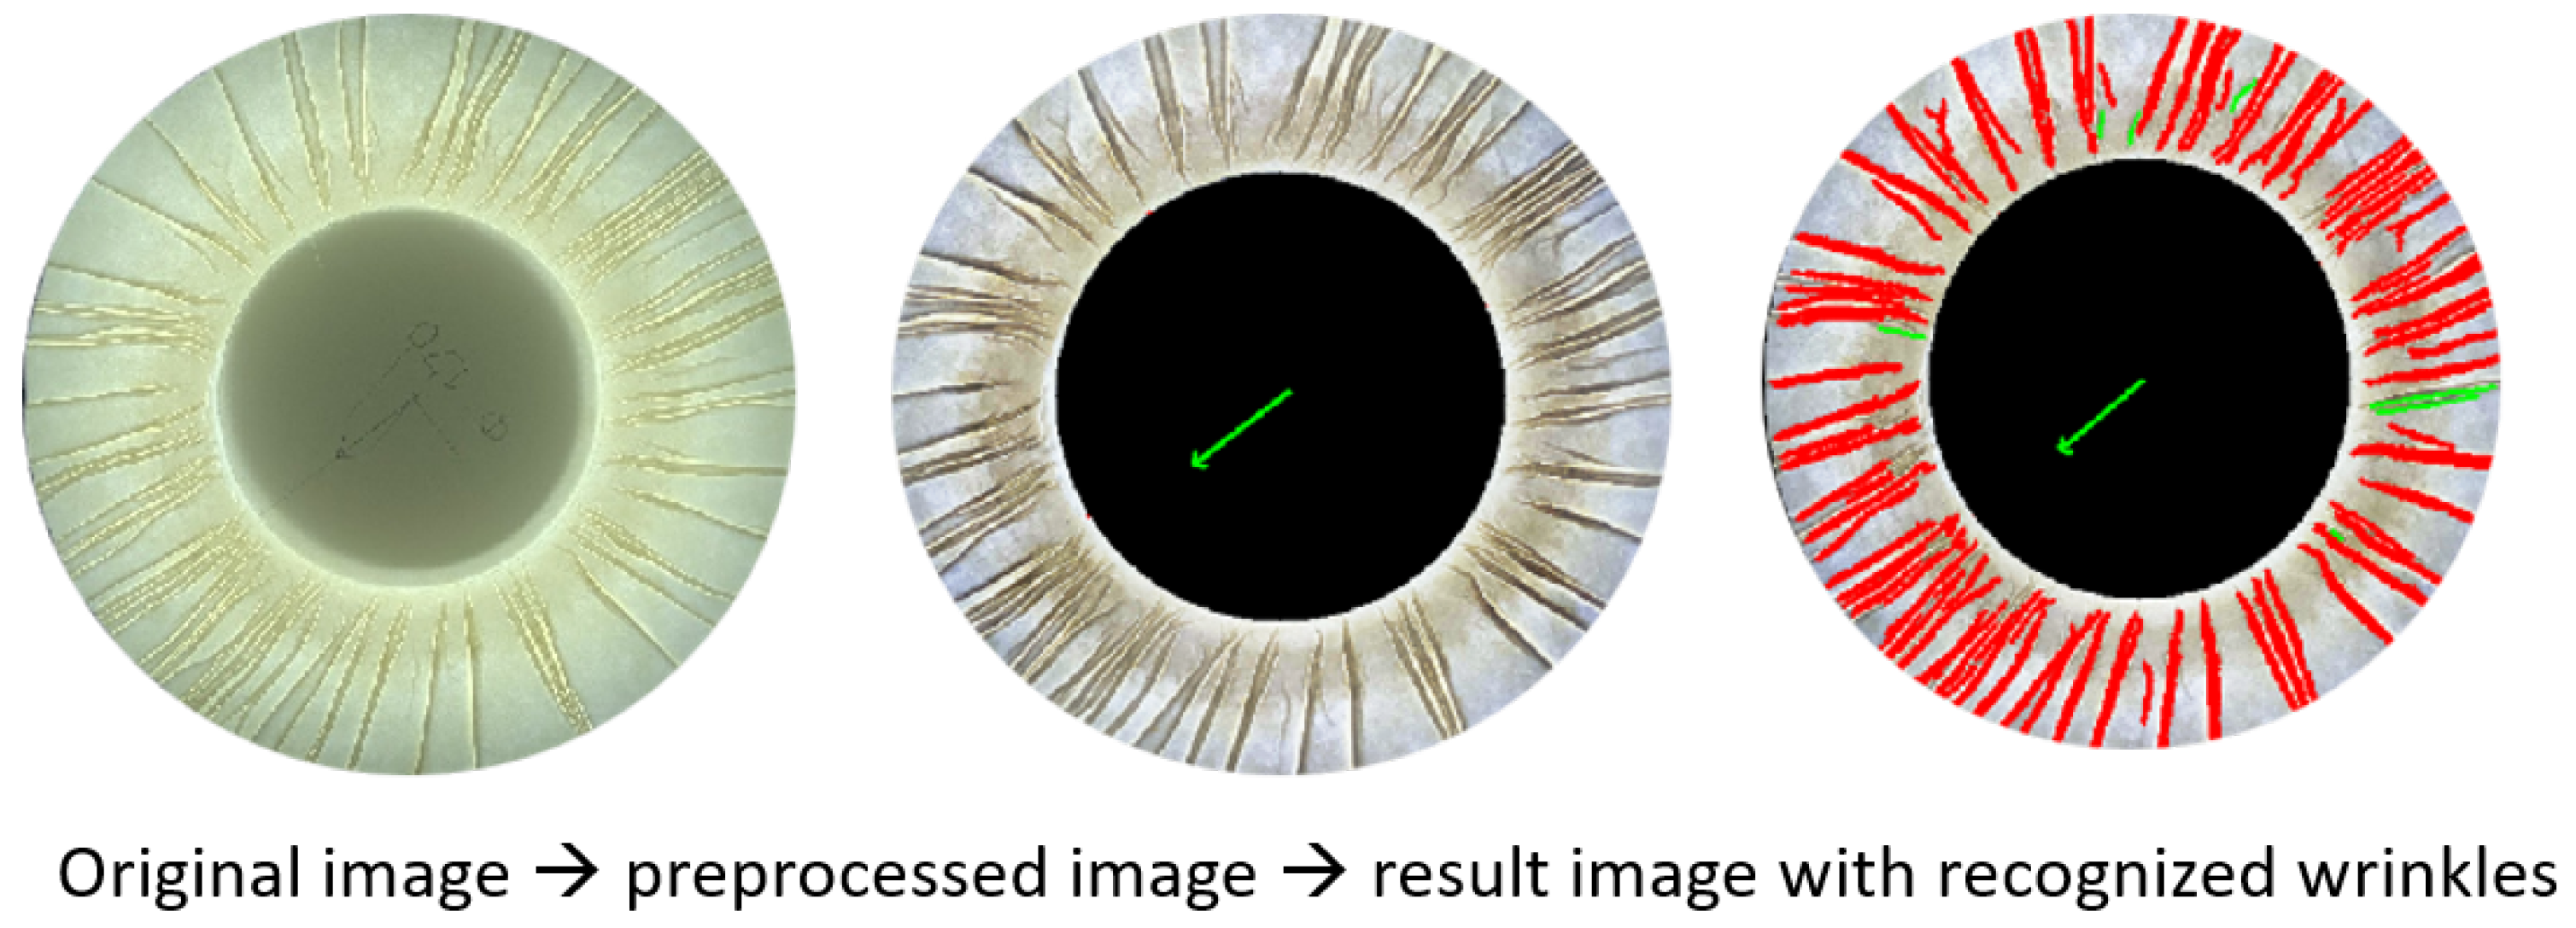
Although the program correctly identifies the vast majority of wrinkles, the automatic detection is always invariant, leading to some omissions and misdetection. In such instances, manual calibration, which involves the removal of incorrectly identified wrinkles and the addition of any missed ones, can be employed to ensure the completely accurate results required. The entire wrinkle detection process for flanged samples took approximately 20 seconds (1 min with manual correction) after multiple tests, and the results are depicted in
Figure 3. Red represents automatically detected wrinkles and green represents wrinkles added during manual correction.
To detect wrinkles in deep-drawn parts without flanges, the resulting side walls are tilted outwards in the MD due to springback effects, while they shrink inwards in the cross direction (CD). To account for this, the wrinkle detection program for formed parts without flanges requires additional steps, including image rotation and transverse stretching after marking the MD, to stretch the sidewall in the CD of the image. The enlarged image displays a wider section of the sidewall in the CD, which is beneficial for identifying wrinkles.
Figure 4 illustrates the wrinkle detection result. For example, although a specimen has been detected with an accuracy of 97%, it can be manually calibrated to 100% for higher accuracy requirements. The entire wrinkle detection process for the flangeless sample required approximately 40 seconds (1.5 min with manual correction) due to the higher number and density of wrinkles in this case.
2.3.2. Parameter Adaptation in Wrinkle Detection Algorithm
This inspection program can be used for deep-drawn formed products of various shapes and materials. The algorithm’s important parameters selection process is briefly described.
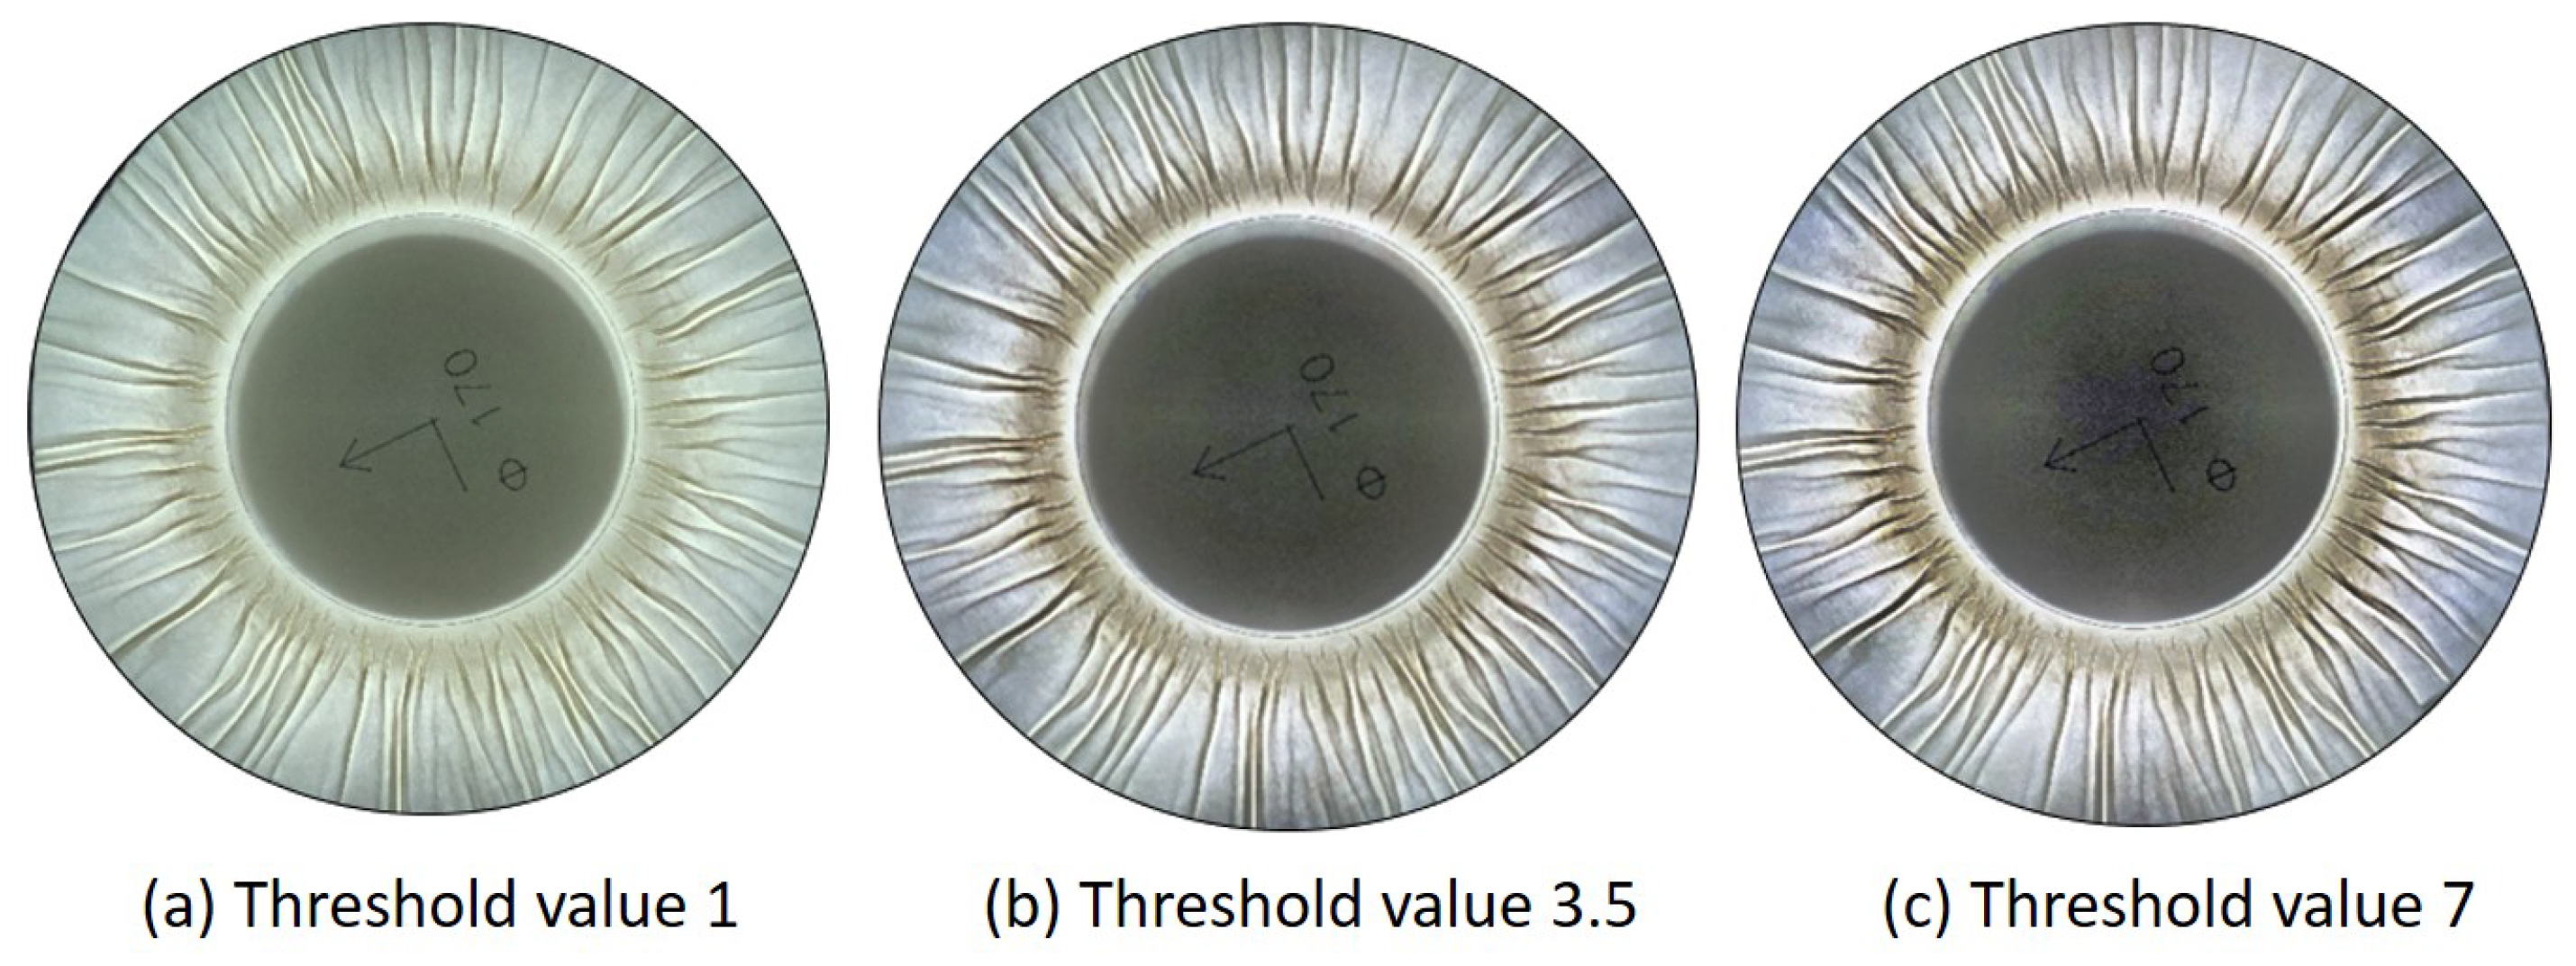
Once the image size is scaled, the contrast limit threshold will be set.
Figure 5 illustrates the contrast limit thresholds’ impact on the image brightness and wrinkle visibility. A smaller threshold results in a brighter image, while a larger threshold results in a darker image with more visible wrinkles. However, a higher threshold value does not necessarily result in better outcomes. This is because a threshold that is too high can introduce significant noise, as demonstrated in (c). Therefore, the optimal parameter is considered to be (b) in the figure, where the threshold value is 3.5.
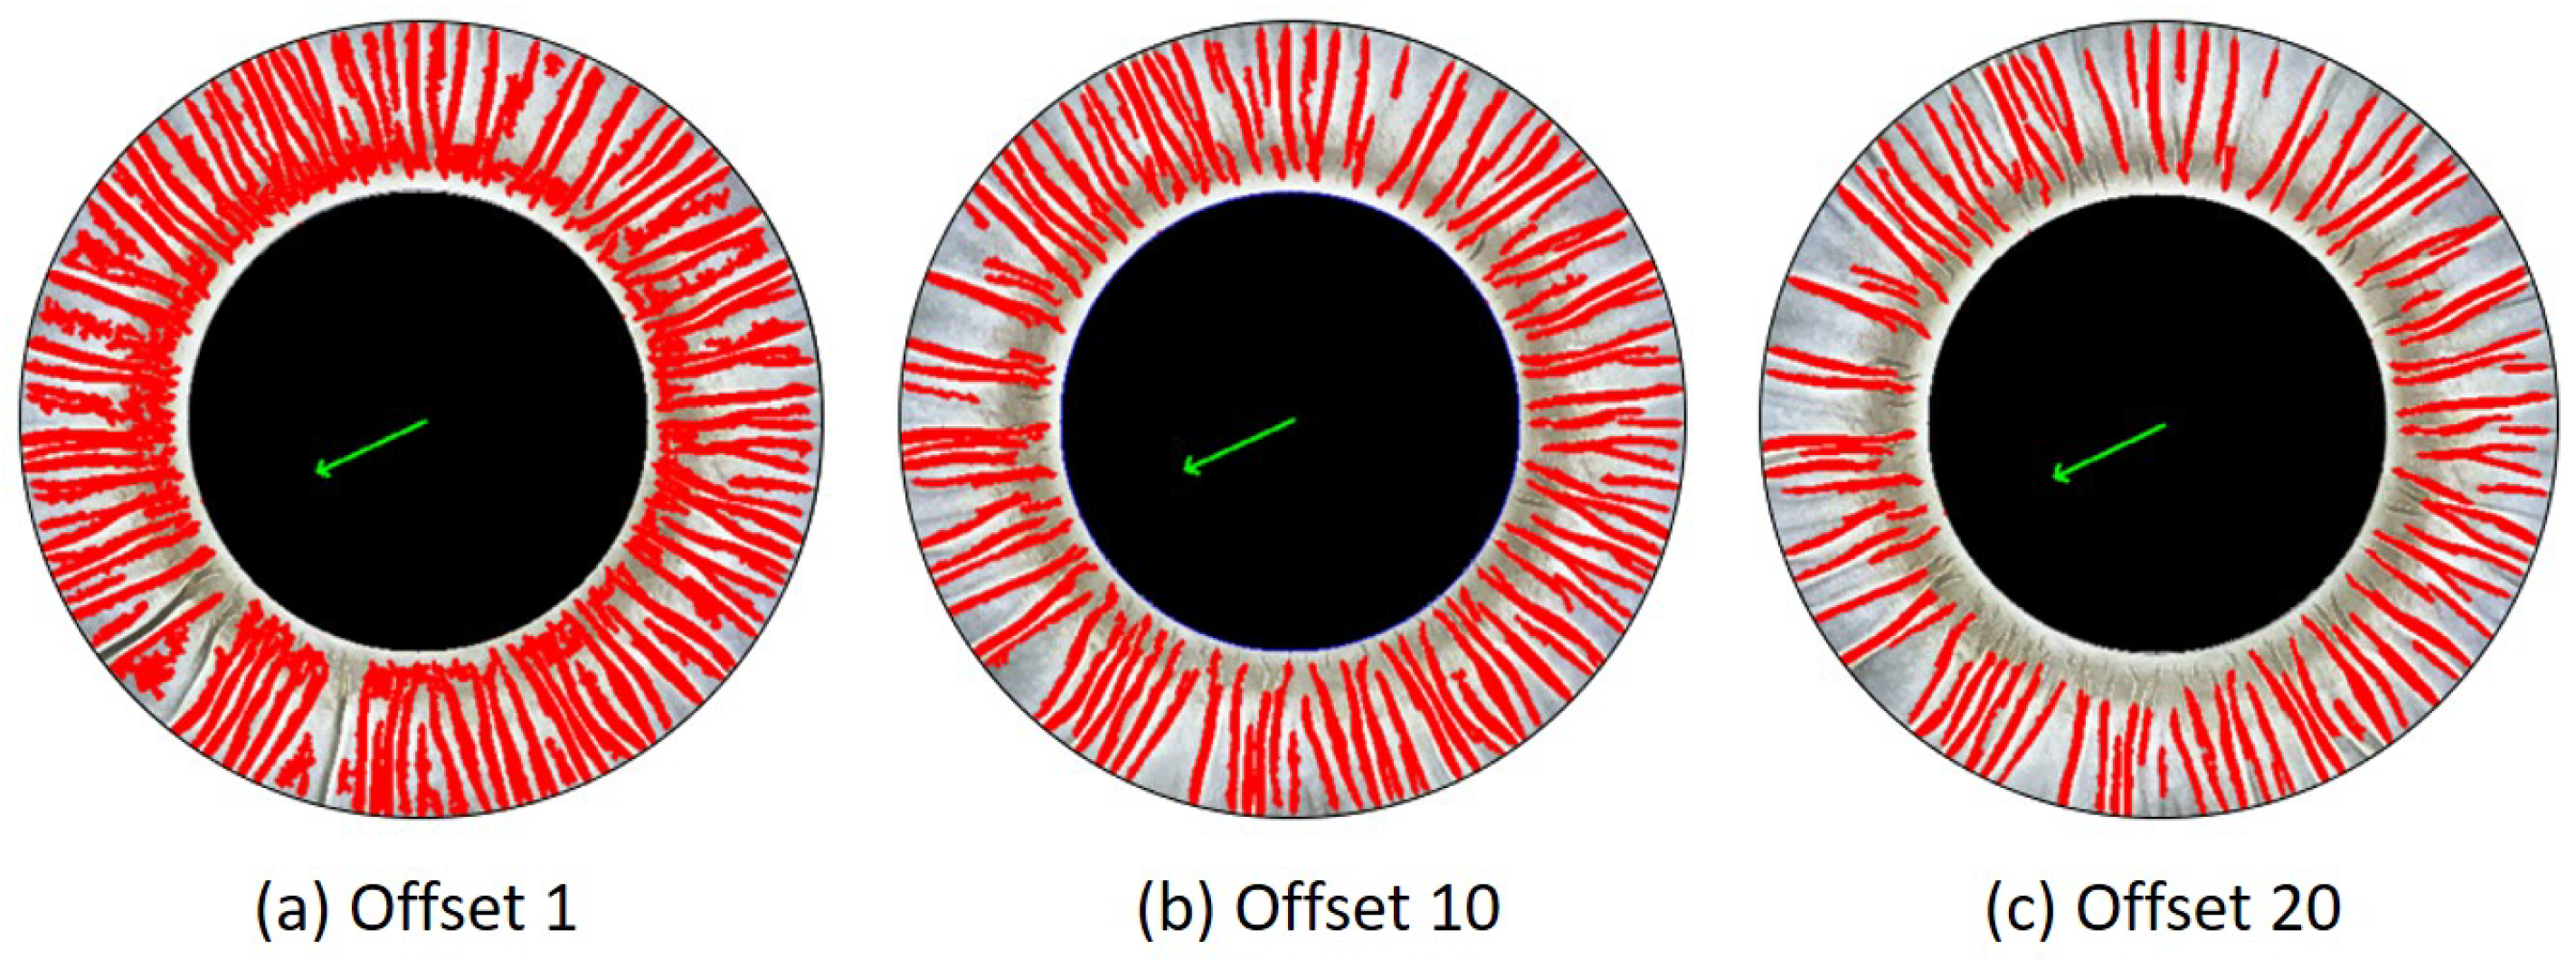
Local adaptive threshold segmentation is a more effective method than the global threshold when different regions of the image have varying brightness. The threshold for each small region of the image is calculated, and an offset can be subtracted to obtain the final threshold.
Figure 6 displays adaptive threshold segmentation with varying thresholds. A small offset leads to a higher threshold, which can detect a large number of wrinkles along with noise. A larger offset results in a smaller threshold, causing more gray values to be considered white. This, in turn, makes some wrinkles unrecognizable and the remaining wrinkles narrower. As a result, the offset of 10 in (b) is an appropriate parameter.
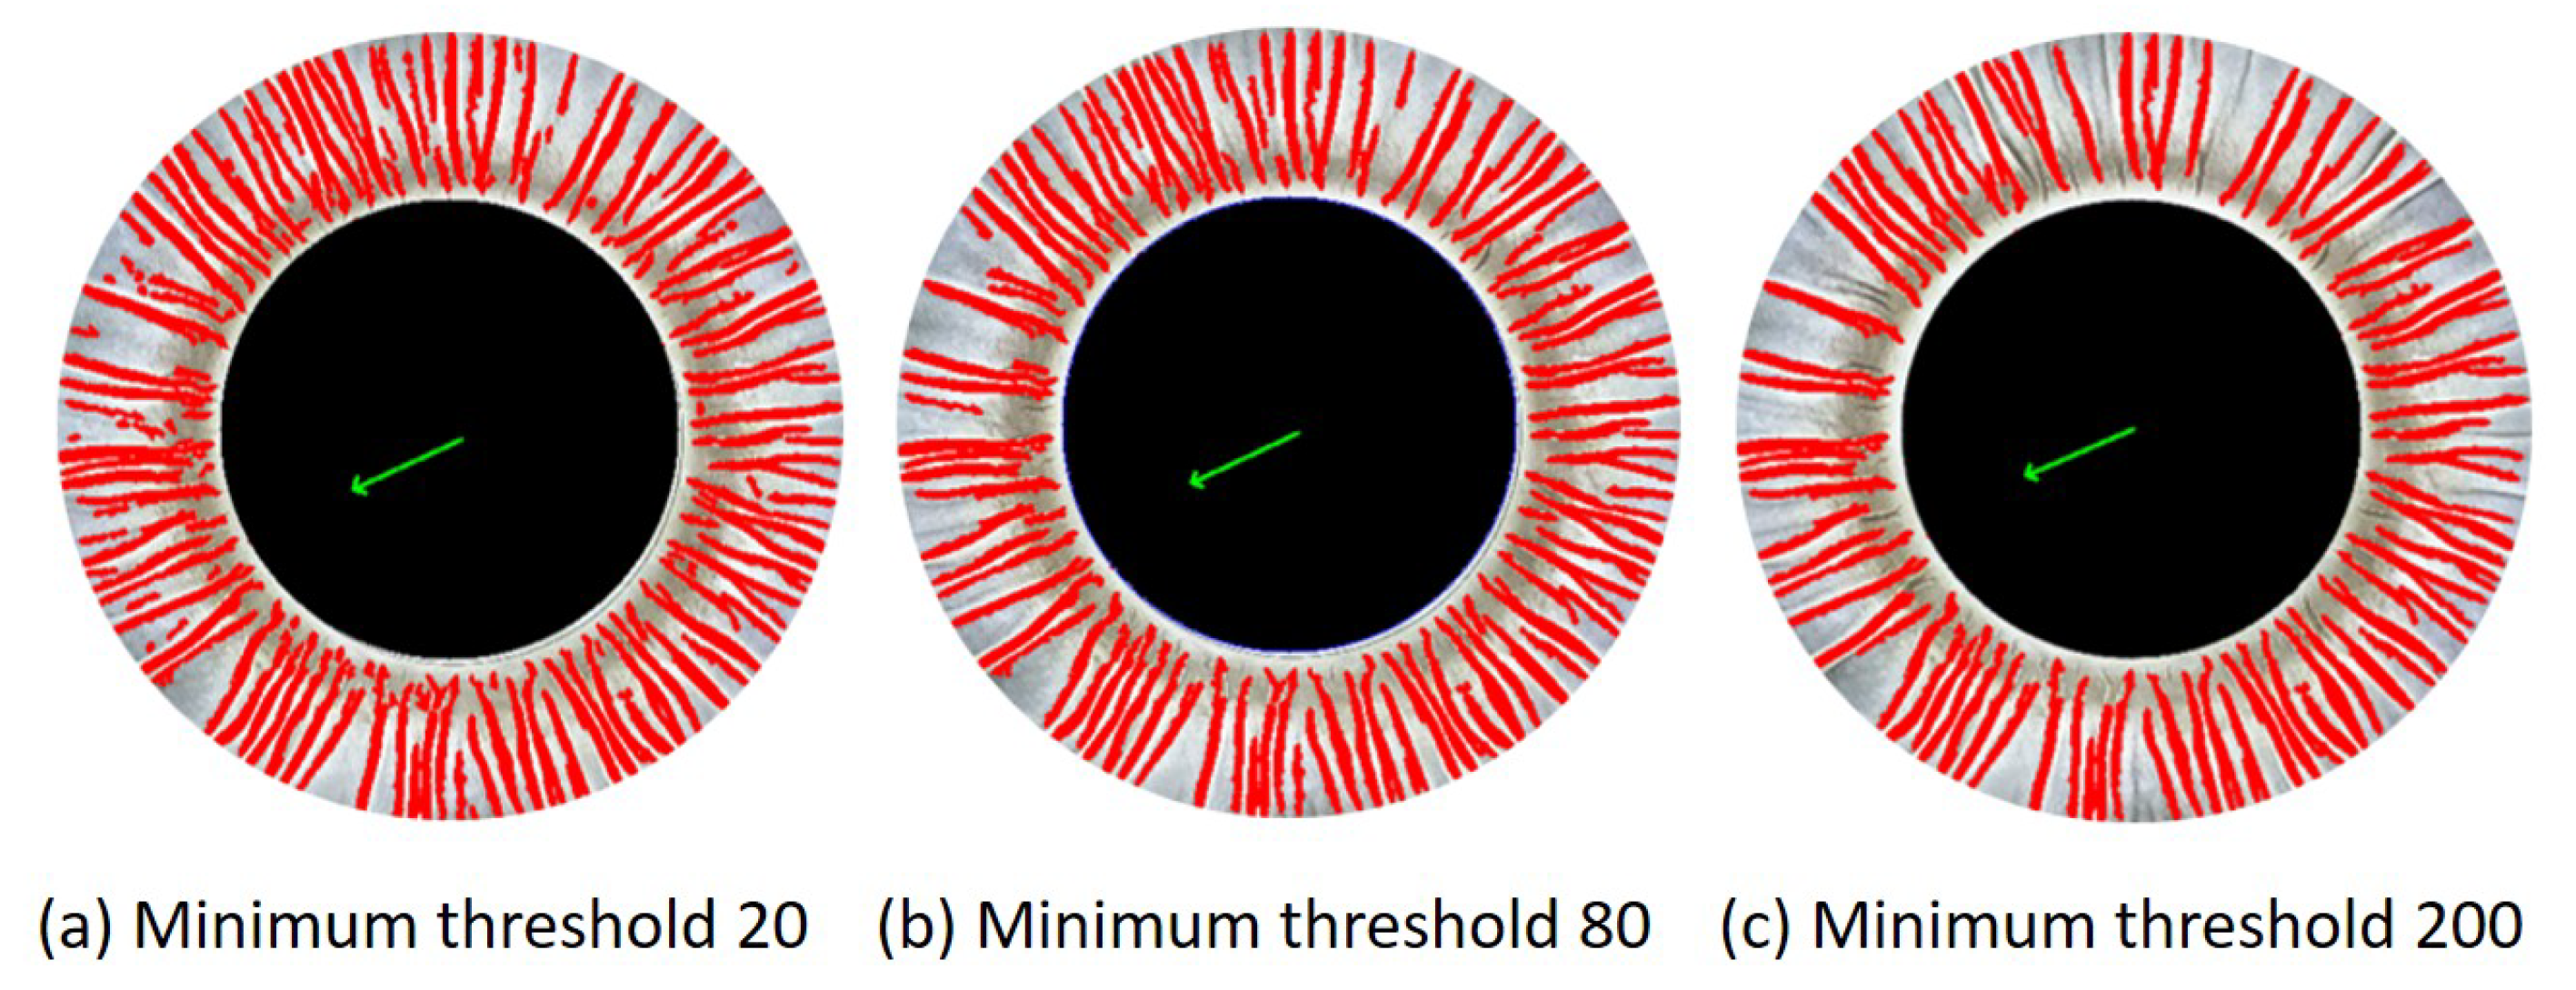
To minimize the misdetection of image noise as small wrinkles, an area limit is placed on the contour area. Finding the right threshold value is a matter of striking a balance between detecting wrinkles and filtering out noise. While it’s important to identify even the smallest wrinkles, it’s also essential to avoid inadvertently filtering out genuine image details, such as noise in the picture or the unique pattern of the paper’s formation. Adjusting the threshold value to achieve this delicate balance is crucial. If the threshold is set too low, small wrinkles can be detected, but more noise will also be present. Conversely, if the threshold is set too high, many small wrinkles will be filtered out. As the minimum threshold increases in
Figure 7, the number of recognized wrinkles decreases. The middle parameter 80 is the most desirable.
The selection of the aforementioned parameters is typically contingent upon the light intensity of the photographic environment and the intrinsic properties of the paper, particularly its light transmission capacity. For papers of similar composition and thickness, there is often no necessity to adjust the parameters, which can be applied directly. In the event of a change in the paper material, if the results are deemed unsatisfactory, manual addition or deletion of wrinkles could be employed for a limited number of samples. However, for a larger number of samples, parameter adjustment is necessary. Alternatively, the optimal parameter selection can be achieved through automatic optimization.
2.3.3. Detection Results with Extremely Fine Wrinkles
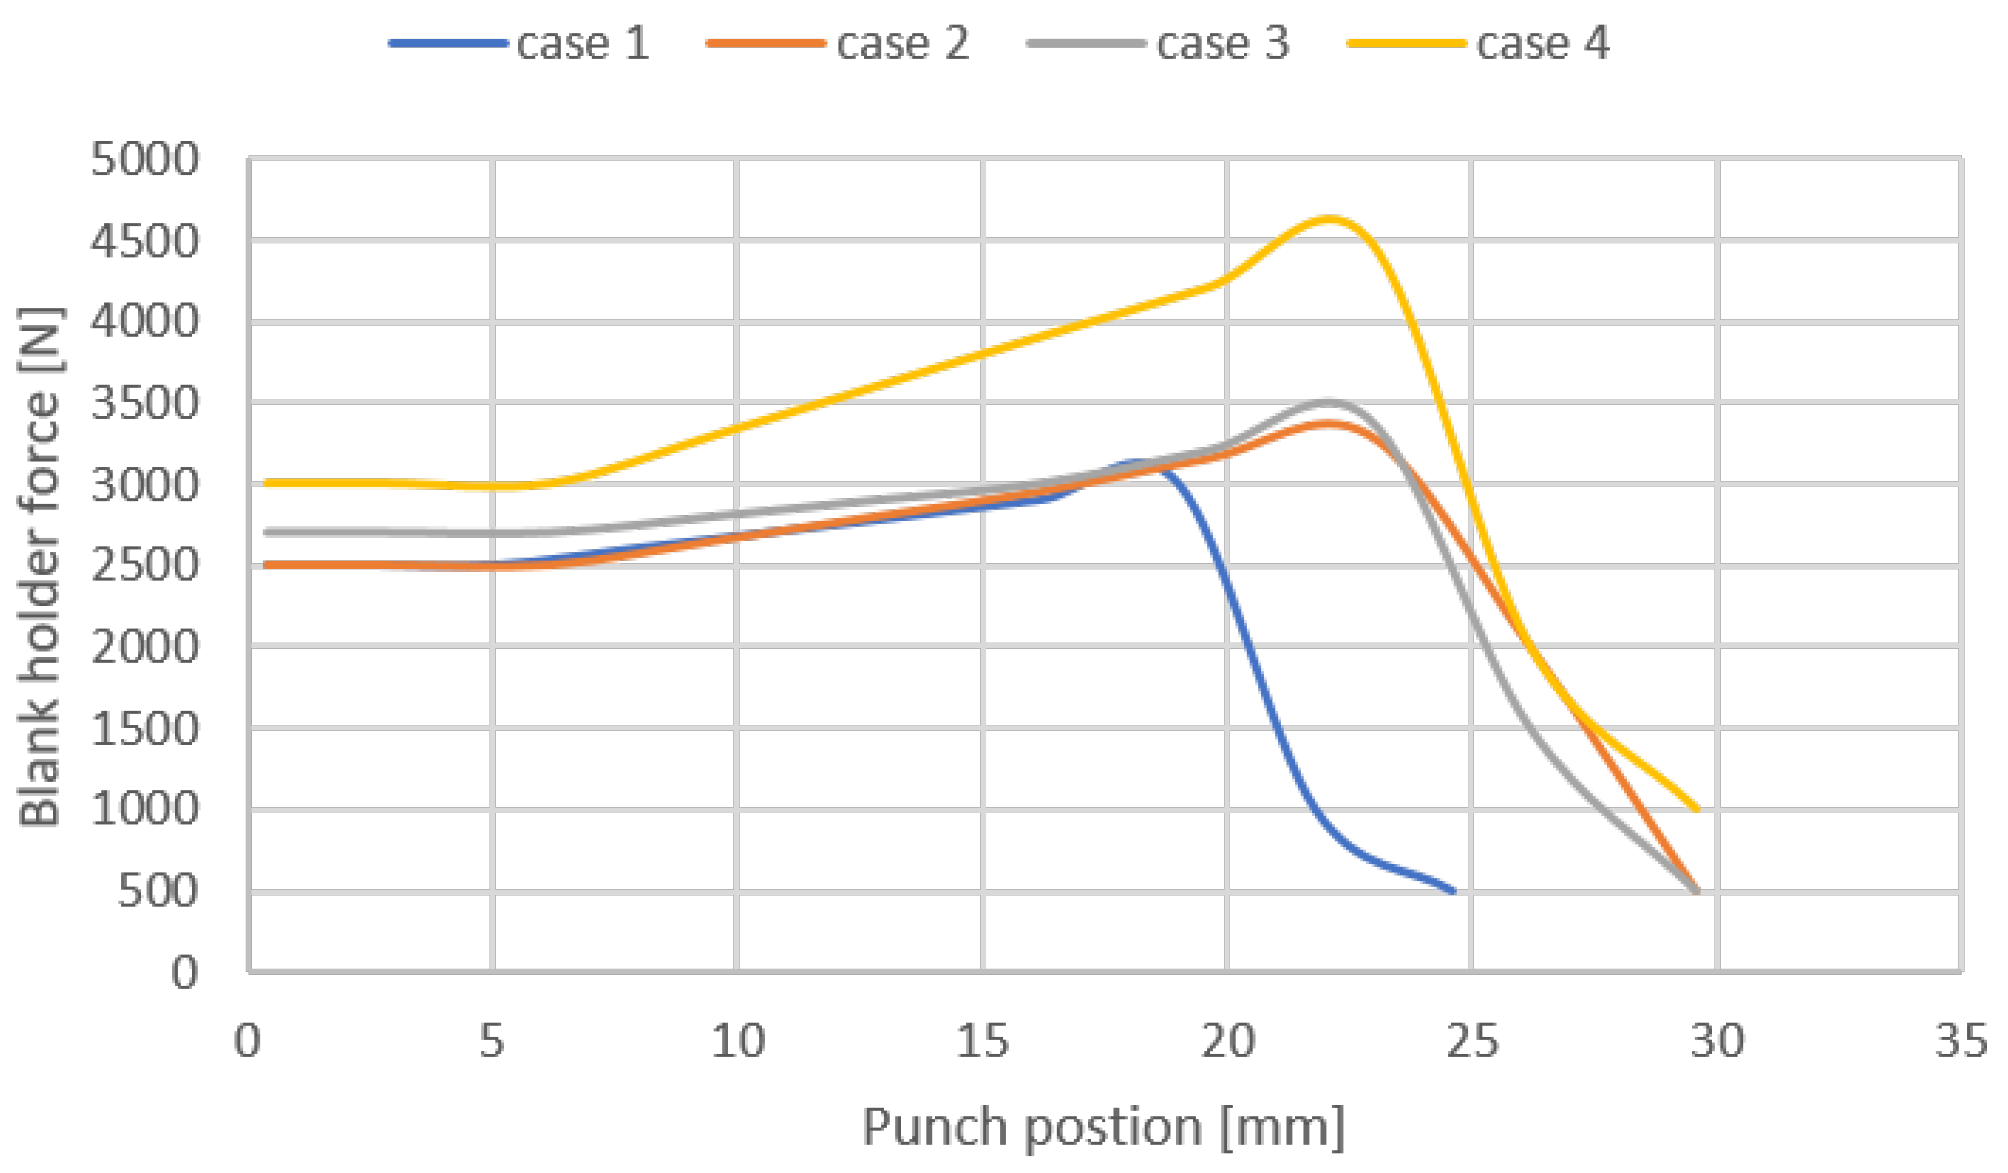
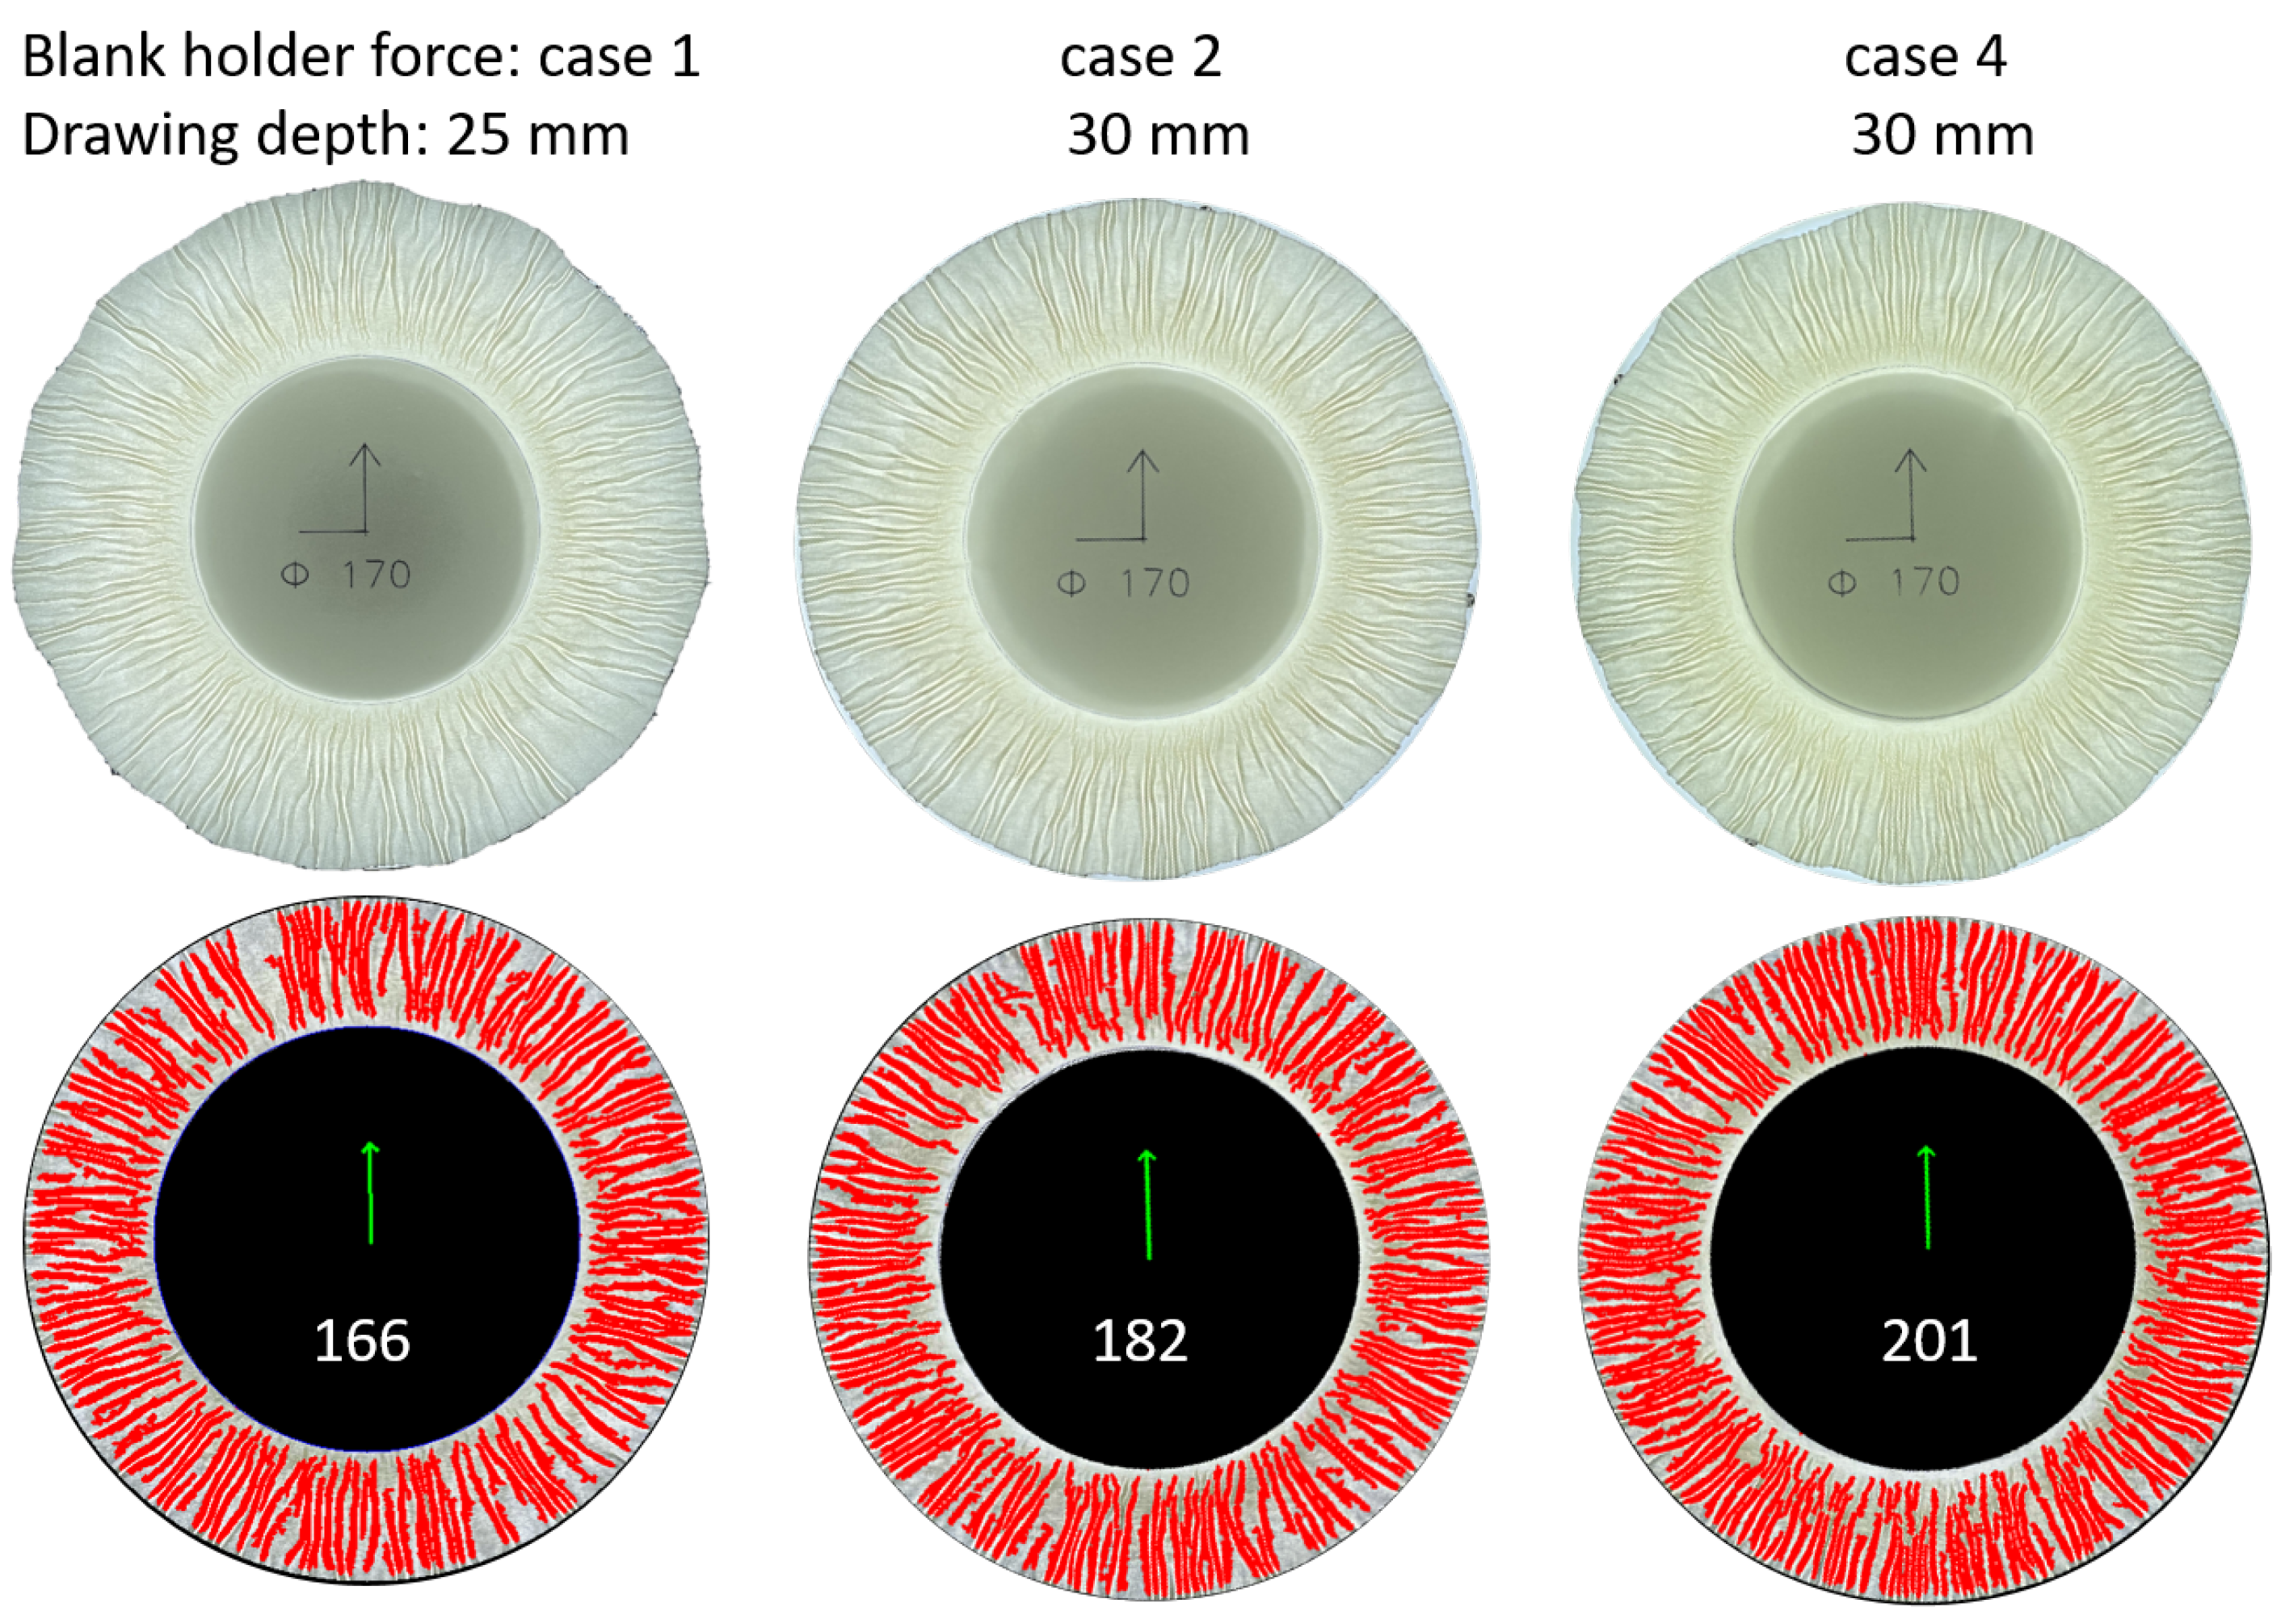
To test the capability of the wrinkle detection program, it is necessary to produce a deep-drawn product with extremely fine and dense wrinkles. To meet this requirement, the paperboard should be subjected to a higher pressure in the thickness direction in the drawing clearance between the cavity and the punch, and a higher blank holder force is required for the reasons described in the next sub
Section 3.2 on the parameter study. Because of the ability of variable blank holder force trajectories to improve wrinkle distribution and three-dimensional structural quality, refer to [
11], the blank holder force trajectories shown in
Figure 8 are applied. In addition, drawing clearance is 0.35
, drawing depth is 25 or 30
, and punch speed is 1.33
.
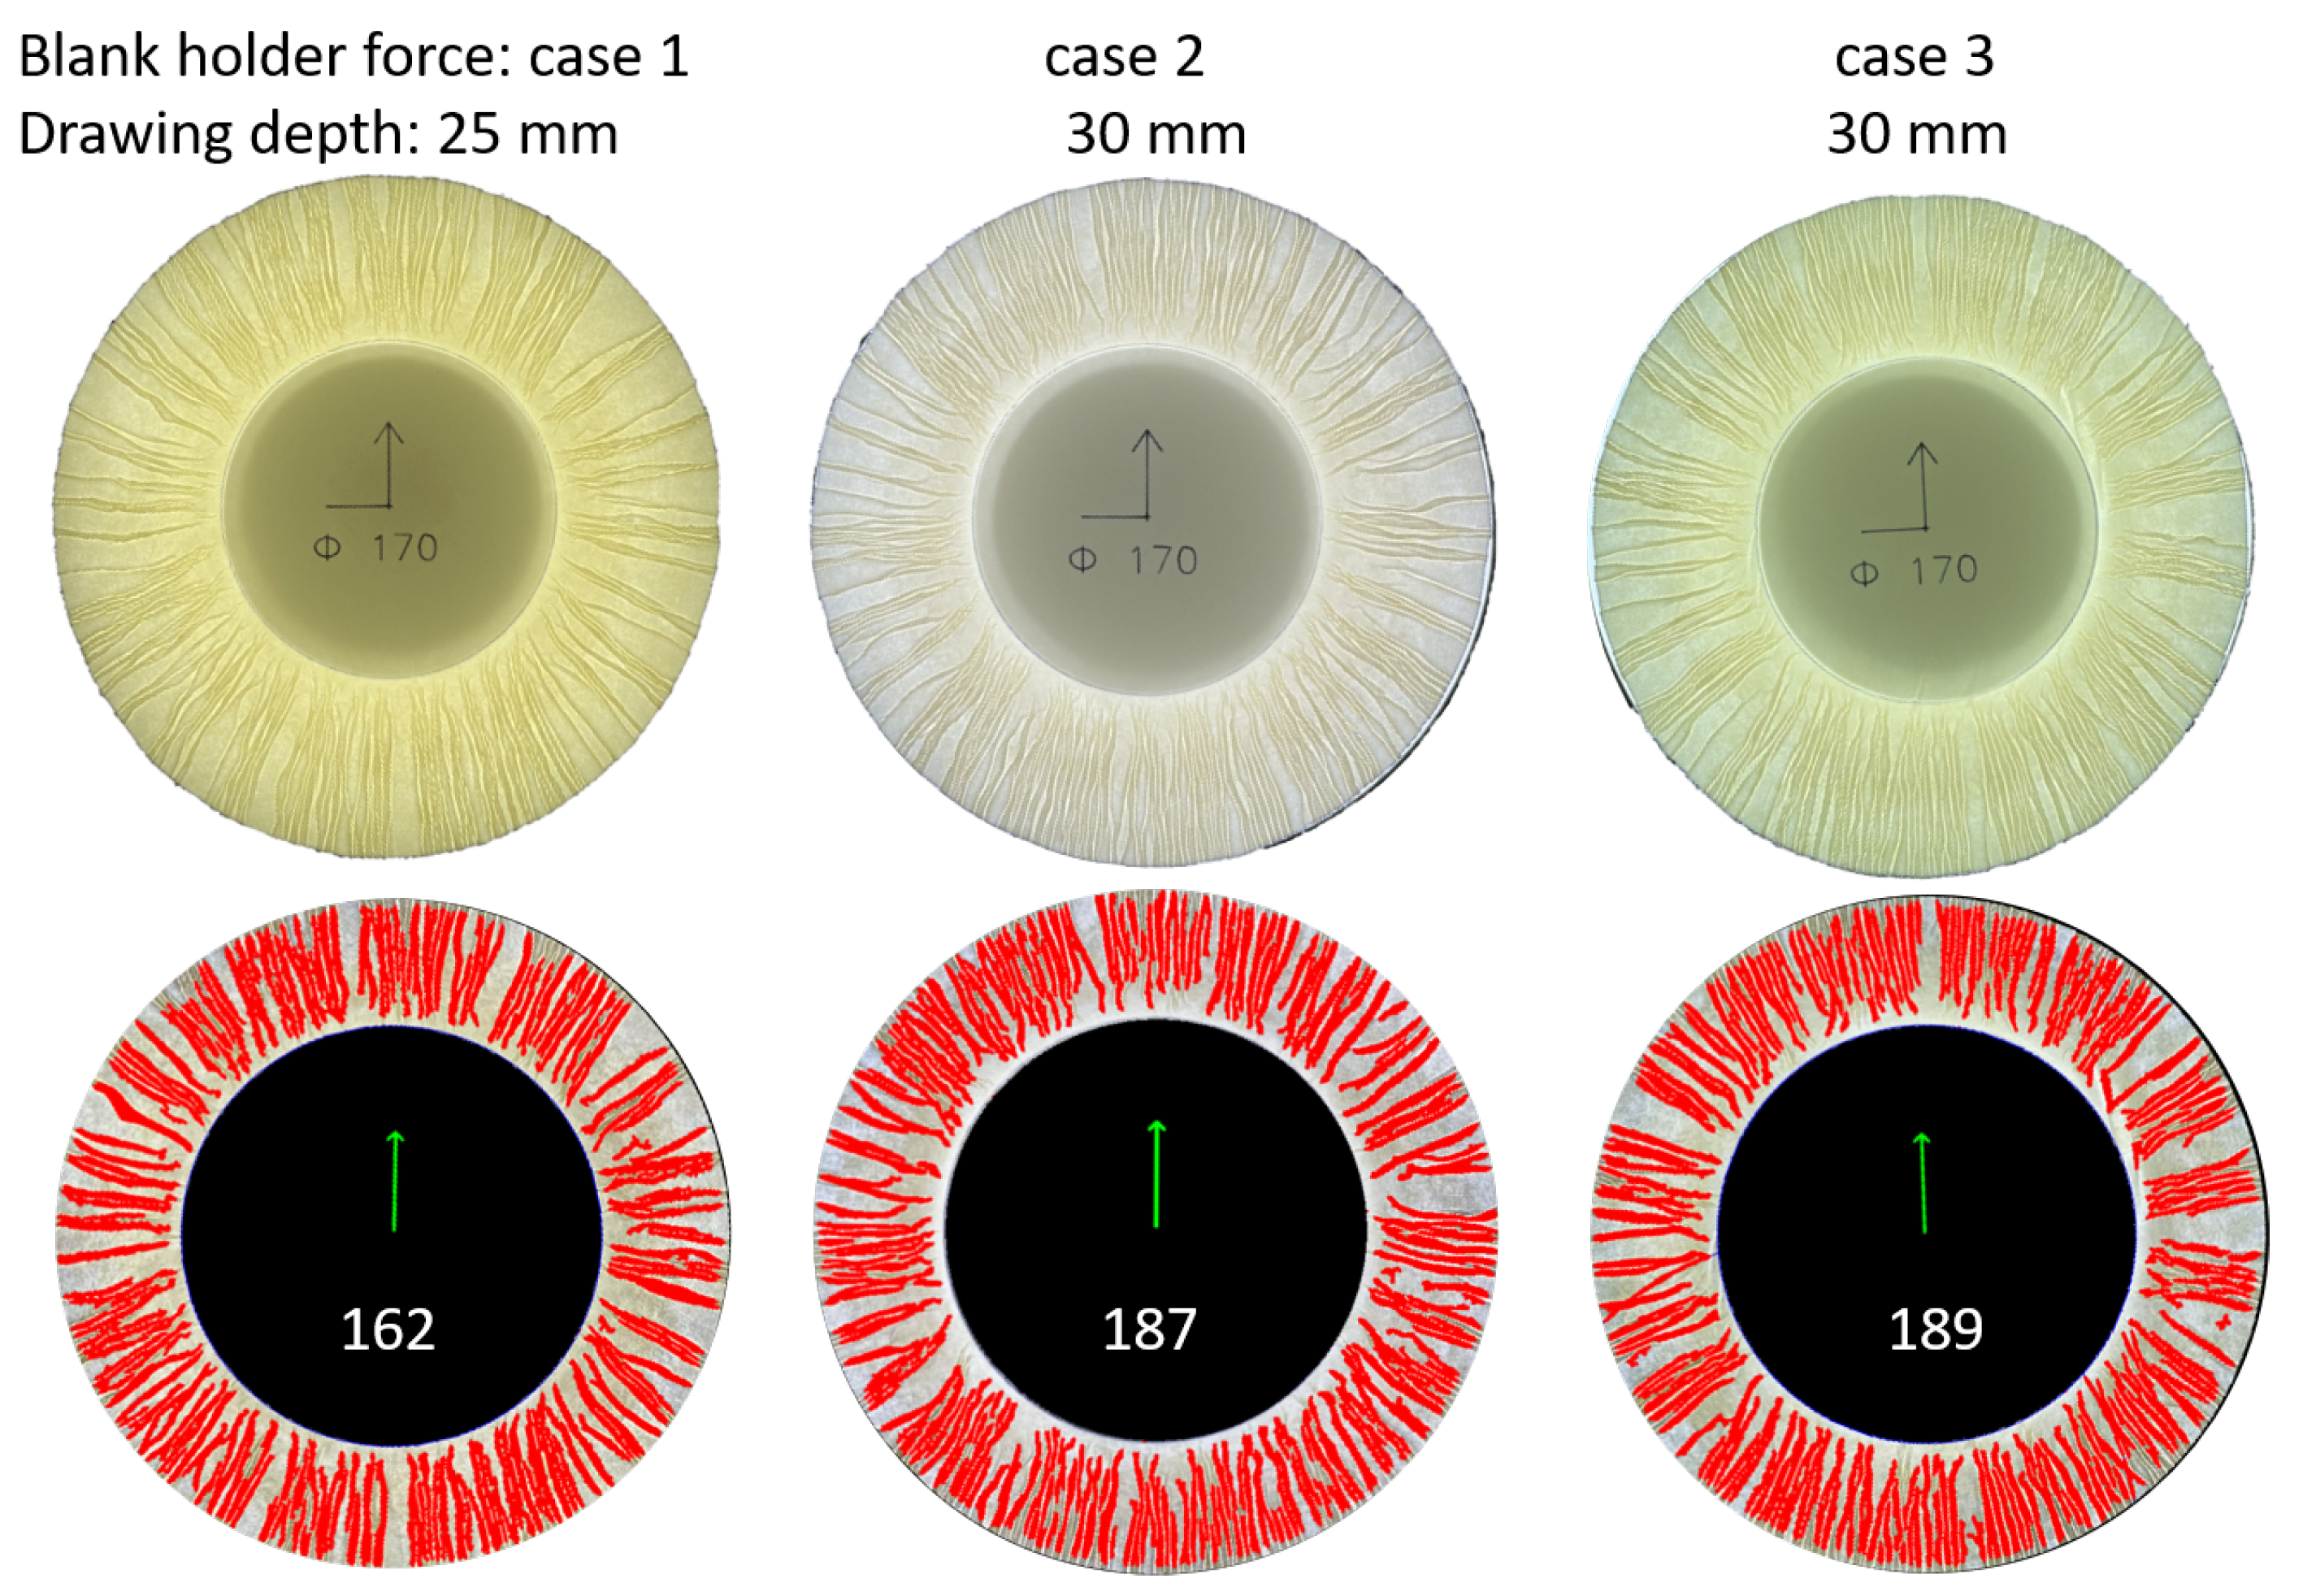
The results of wrinkle detection for materials A and B are shown in
Figure 9 and
Figure 10, which can be seen that the detection results are satisfactory for extremely fine wrinkles.
3. Results
3.1. Evaluation of the Wrinkle Detection Program
3.1.1. Typical Detection Errors
Upon closer examination of the results, three types of error sources are identified in the wrinkle detection program, as depicted in
Figure 11. The first type of error (a) is the unrecognized small wrinkles, which are marked in yellow. This is due to the limitation of the contour area, which filters out noise but also filters out some small wrinkles. Two tightly packed wrinkles are recognized as one wrinkle (b), marked in green, and one wrinkle marked in blue (c) is recognized as two separated wrinkles. These errors can be eliminated through manual methods if the accuracy is extremely high.
3.1.2. Evaluation of the Program
Table 2 presents the results of wrinkle detection for samples with and without a flange. The accuracy of the algorithm is defined as the proportion of actual wrinkles detected, while the standard deviation describes the difference between 10 different images of the same specimen, and the non-recognition and false-detection rates are the proportion of undetected and misdetected wrinkles, respectively, to the actual total number of wrinkles.
The wrinkle detection accuracy is satisfactory for both samples. However, samples without flanges exhibit higher rates of non-detection and false detection, despite apparent higher detection accuracy. The reason for this is that undetected and misdetected wrinkles perform an arithmetic-value offset, resulting in an apparent high detection accuracy. That is, if some of the noise is detected as wrinkles and some of the wrinkles are not detected, the sum calculation will instead give a result that is closer to the correct answer. This illustrates that detection accuracy should not be viewed as a single parameter, but rather evaluated in conjunction with the non-detection and false detection rates.
In summary, the automatic wrinkle detection program uses only one image above the sample to quickly and accurately calculate the number of wrinkles in any deep-drawn sample. There are numerous camera options, and both professional and handheld cameras can be used for photography. This includes samples in the form of flanged deep-dish samples and flangeless cup samples. The application simultaneously takes into account springback effects and paper anisotropy, allowing for a later assessment of product quality.
3.2. Parameters Influencing the Number of Wrinkles in Deep Drawing
This work applies the wrinkle detection system and procedure in a study of process parameters in deep drawing, including material properties (anisotropic Material A and nearly isotropic material B), blank holder force, drawing depth, drawing clearance, and punch speed.
3.2.1. Influence of Material Properties
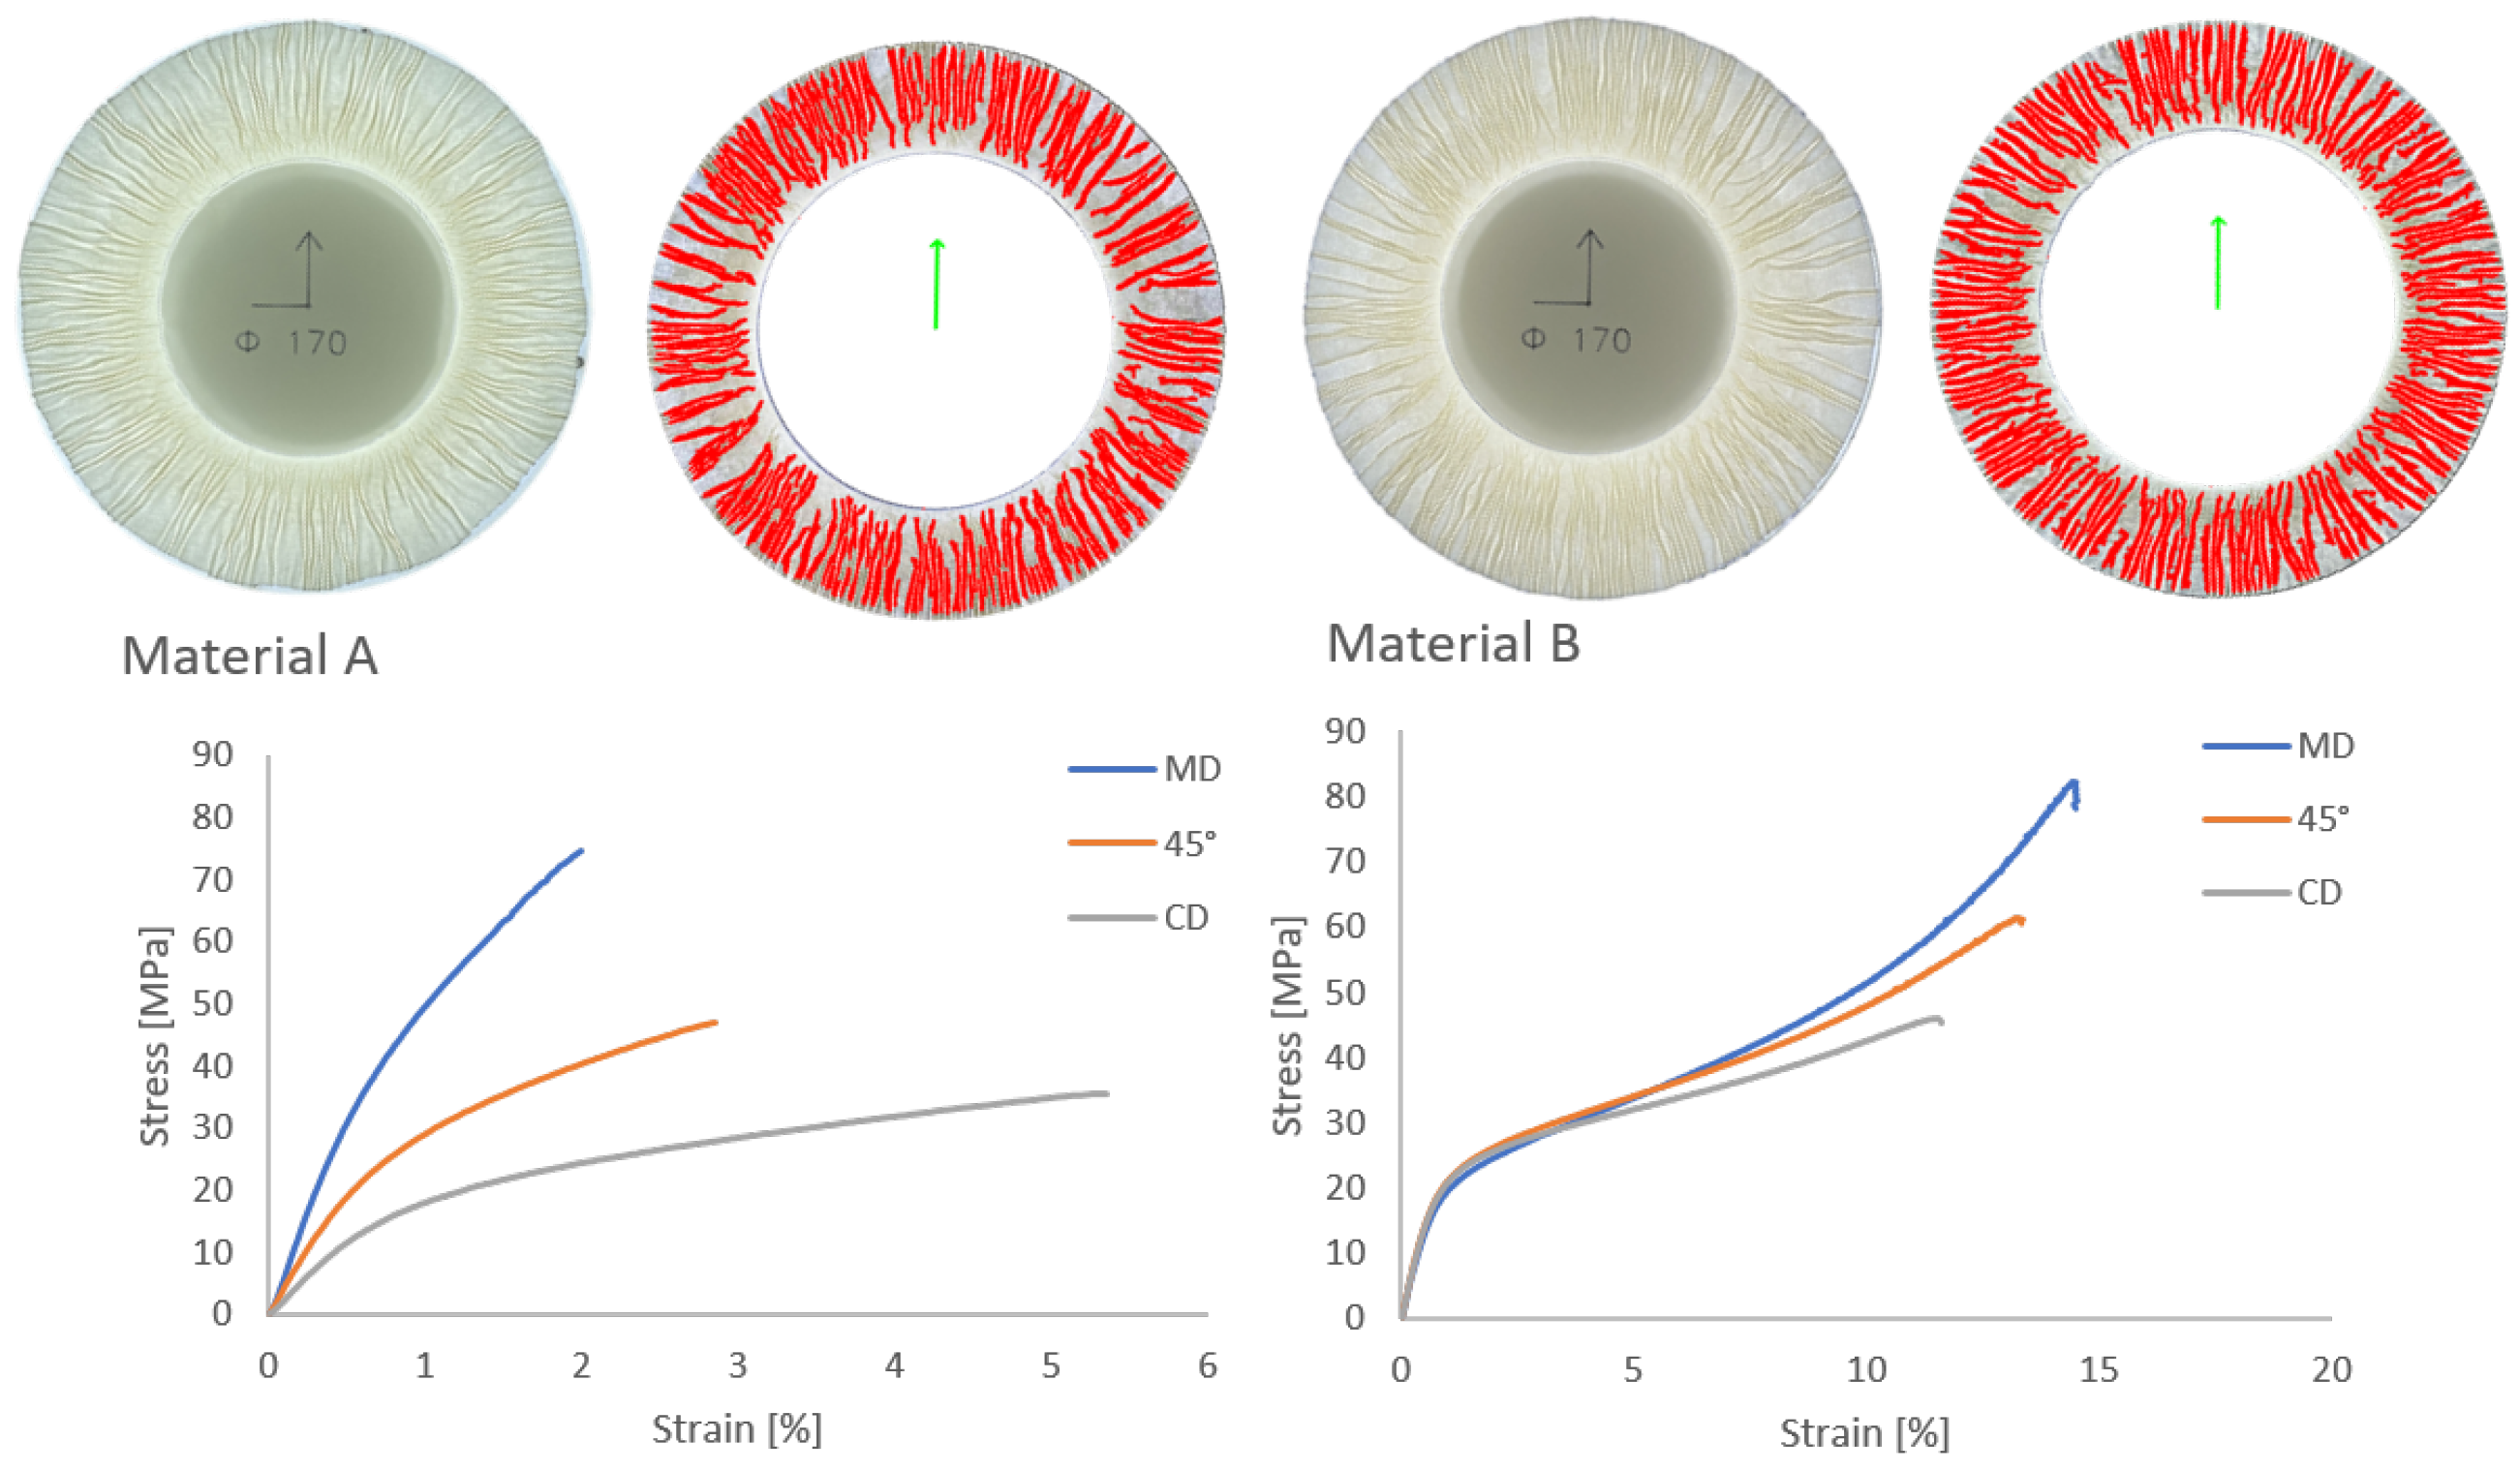
Materials A and B are both fiber-based materials utilized in the 3D forming process. However, their mechanical properties, particularly regarding anisotropy, are markedly disparate. As evidenced by the stress-strain curves depicted in
Figure 12, material A exhibits pronounced anisotropy, a quality commonly observed in industrial paperboards. In contrast, material B exhibits minimal anisotropy due to its unique production process, with the curves in the three directions exhibiting remarkable similarity. Stress-strain curves are measured using a Zwick material tester Z100 at a tensile speed of 20 mm/min on a tensile specimen size of
with digital imaging correlation (DIC) technology. A comparison of the wrinkle distributions of the two materials with a sample radius of 85 mm reveals that material A exhibits a more pronounced distribution of wrinkles in the MD direction, whereas material B displays a nearly uniform distribution. In addition, the number of wrinkles in material B is higher than in material A. This is related to the special process and surface properties of micro-structuring used in the production of material B for higher ductility. Material B also tends to have more wrinkles because the material has a higher strength average in three directions. Therefore, Material B has more wrinkles because the material is less deformed during the process.
3.2.2. Influence of Blank Holder Force
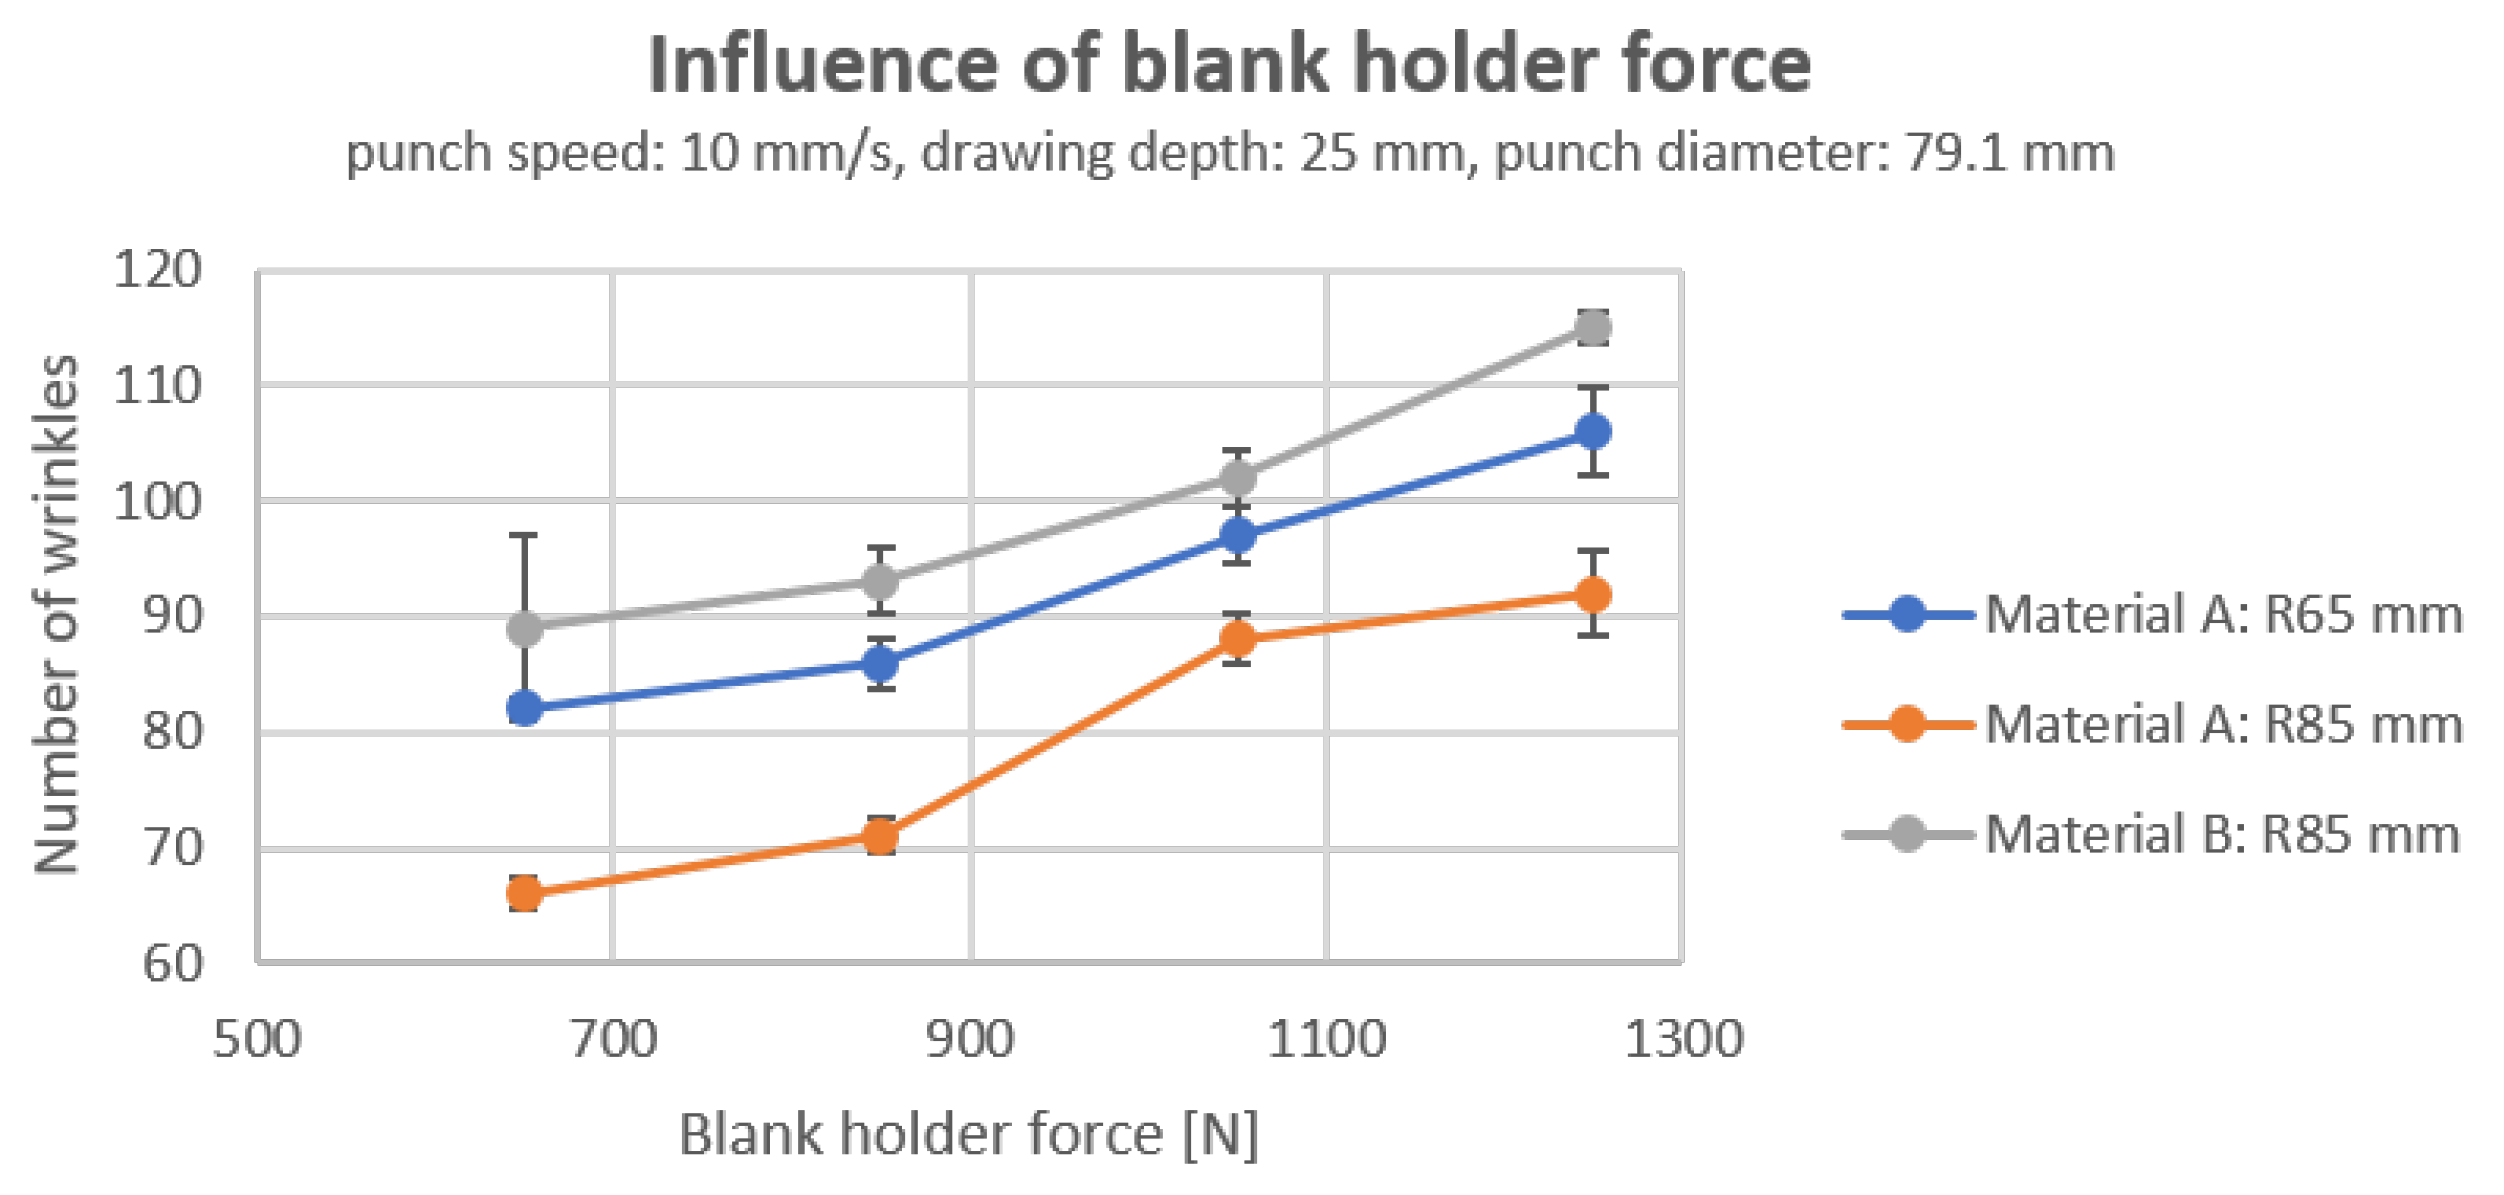
Figure 13 illustrates the correlation between the number of wrinkles and the blank holder force for two materials with different sample sizes. It can be observed that the number of wrinkles increases significantly with increasing blank holder force for both anisotropic material A and nearly isotropic material B and for both specimens with a radius of 65
and a radius of 85
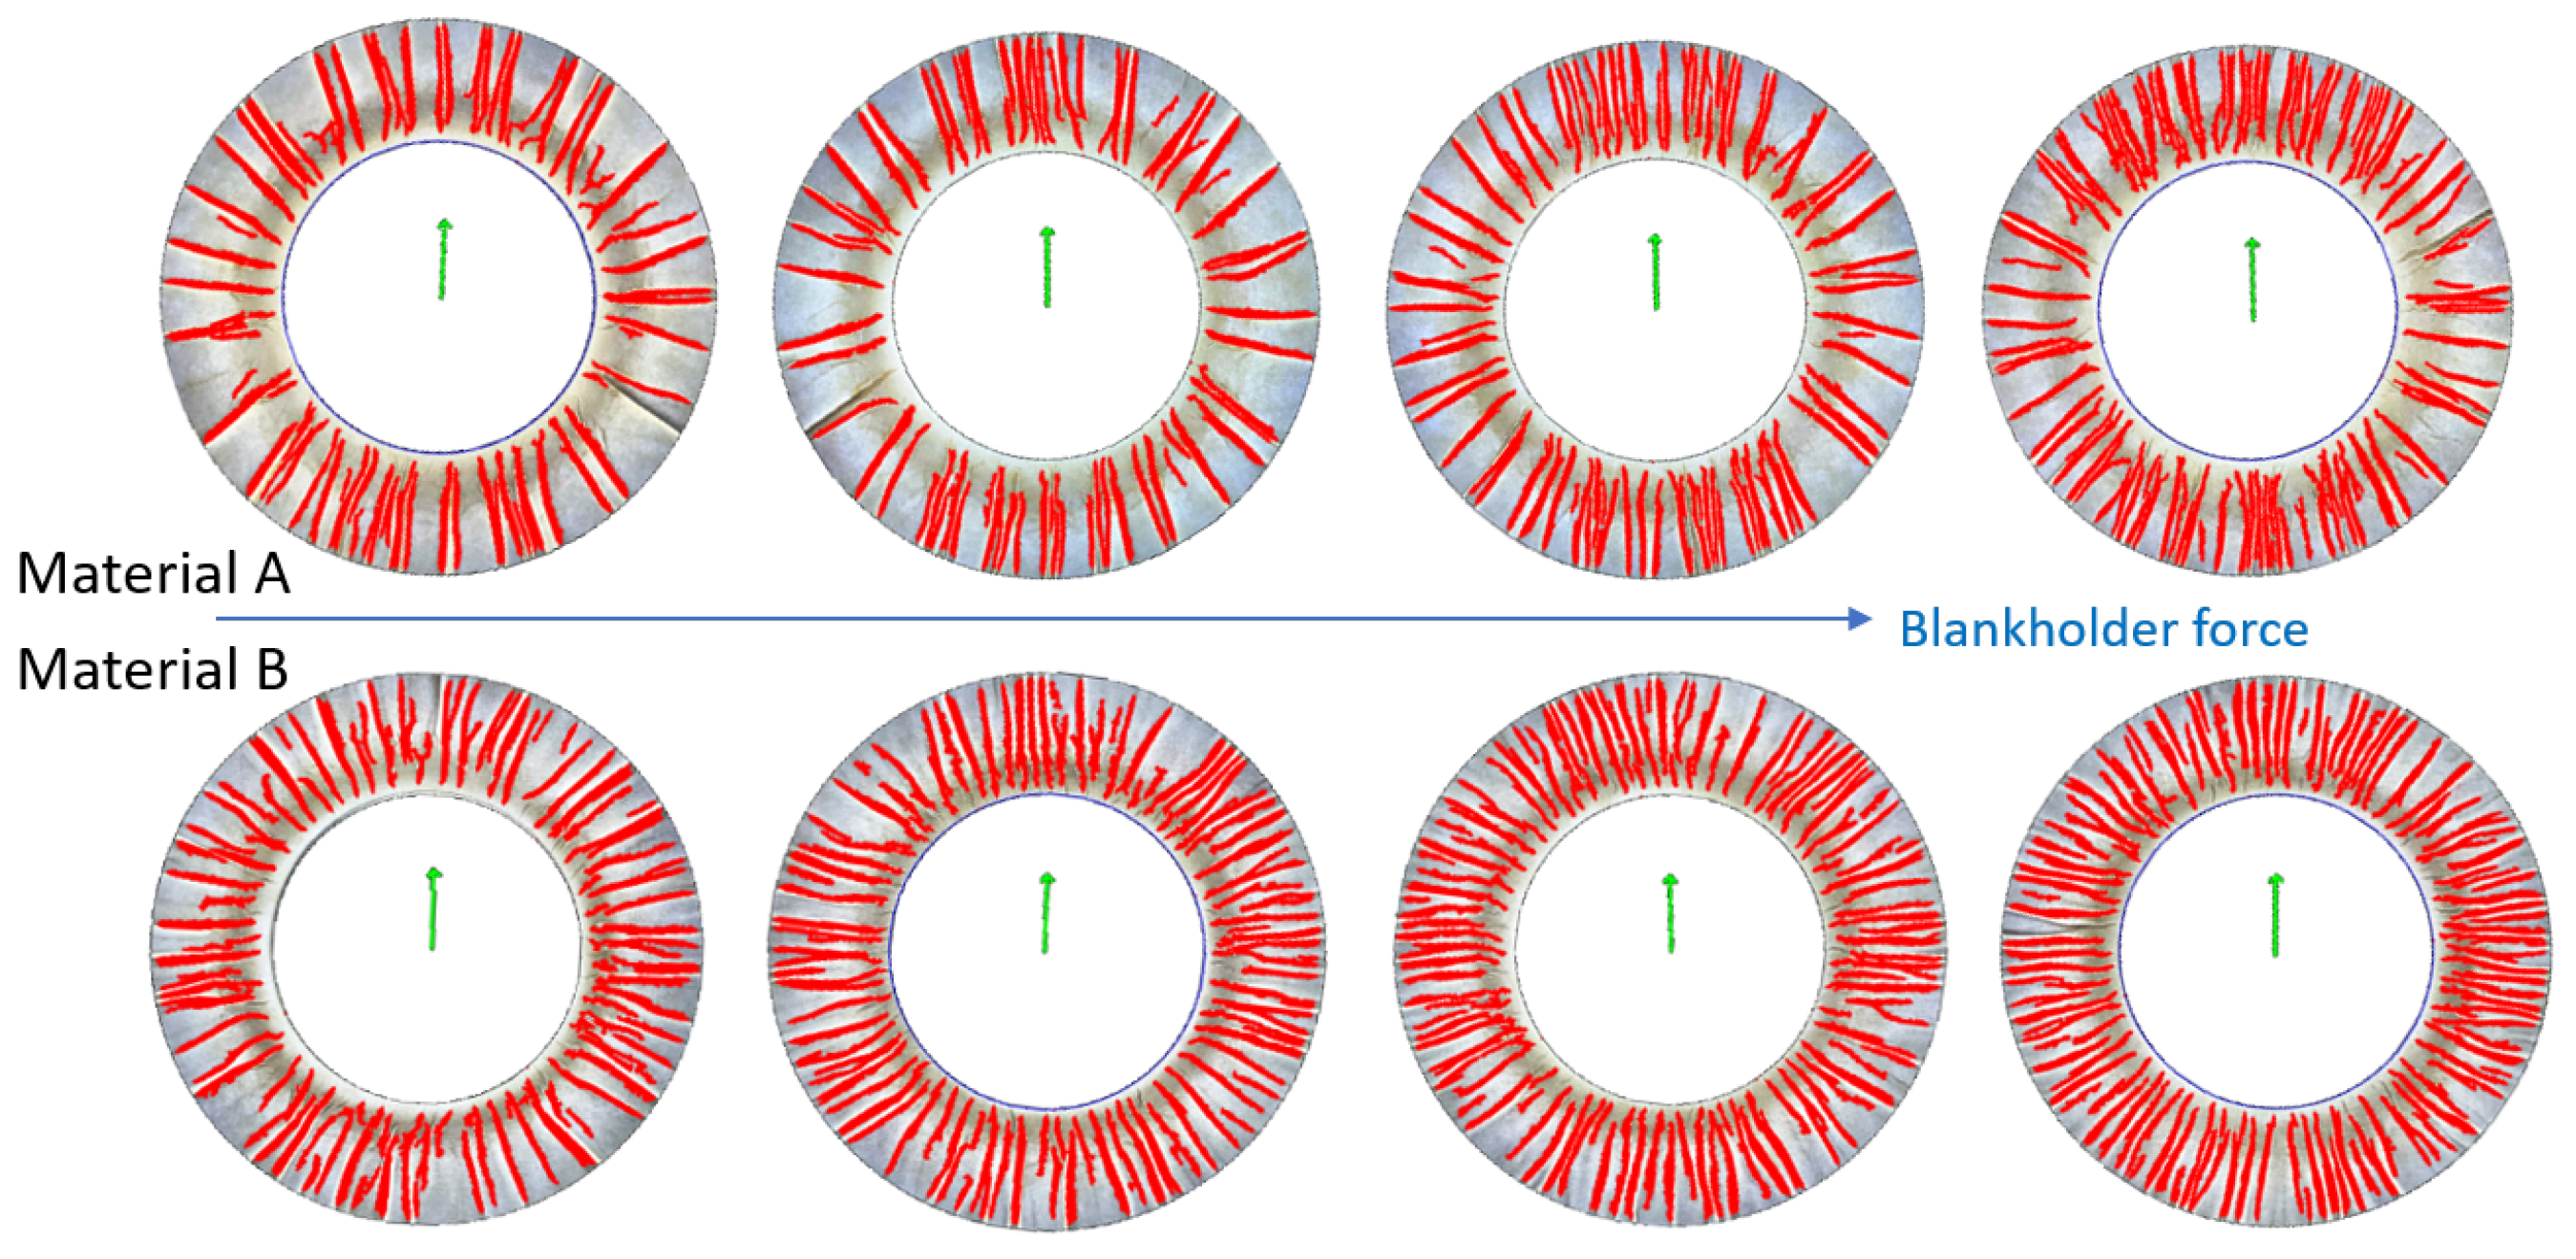
. Observation of the samples indicates that, as the blank holder force is increased, the tendency of the material to increase the thickness is limited, resulting in the generation of finer wrinkles, as shown in
Figure 14.
With a constant blank holder force, 1250N is the limit, but more wrinkles can be obtained by decreasing the blank holder force or adaptive as described in
Section 2.3.3.
Also, when comparing the blue and orange fold lines in
Figure 13, it can be seen that more wrinkles are formed when the radius of the specimen is smaller. The reason for this is that smaller specimens are subjected to higher compressive stresses than larger specimens, i.e., they can be considered to be subjected to higher blank holder forces. Since the process parameters are held constant, the smaller diameter material deforms less and therefore experiences almost no deformation during stretching, resulting in a higher number of wrinkles than the larger diameter specimens.
3.2.3. Influence of Drawing Depth
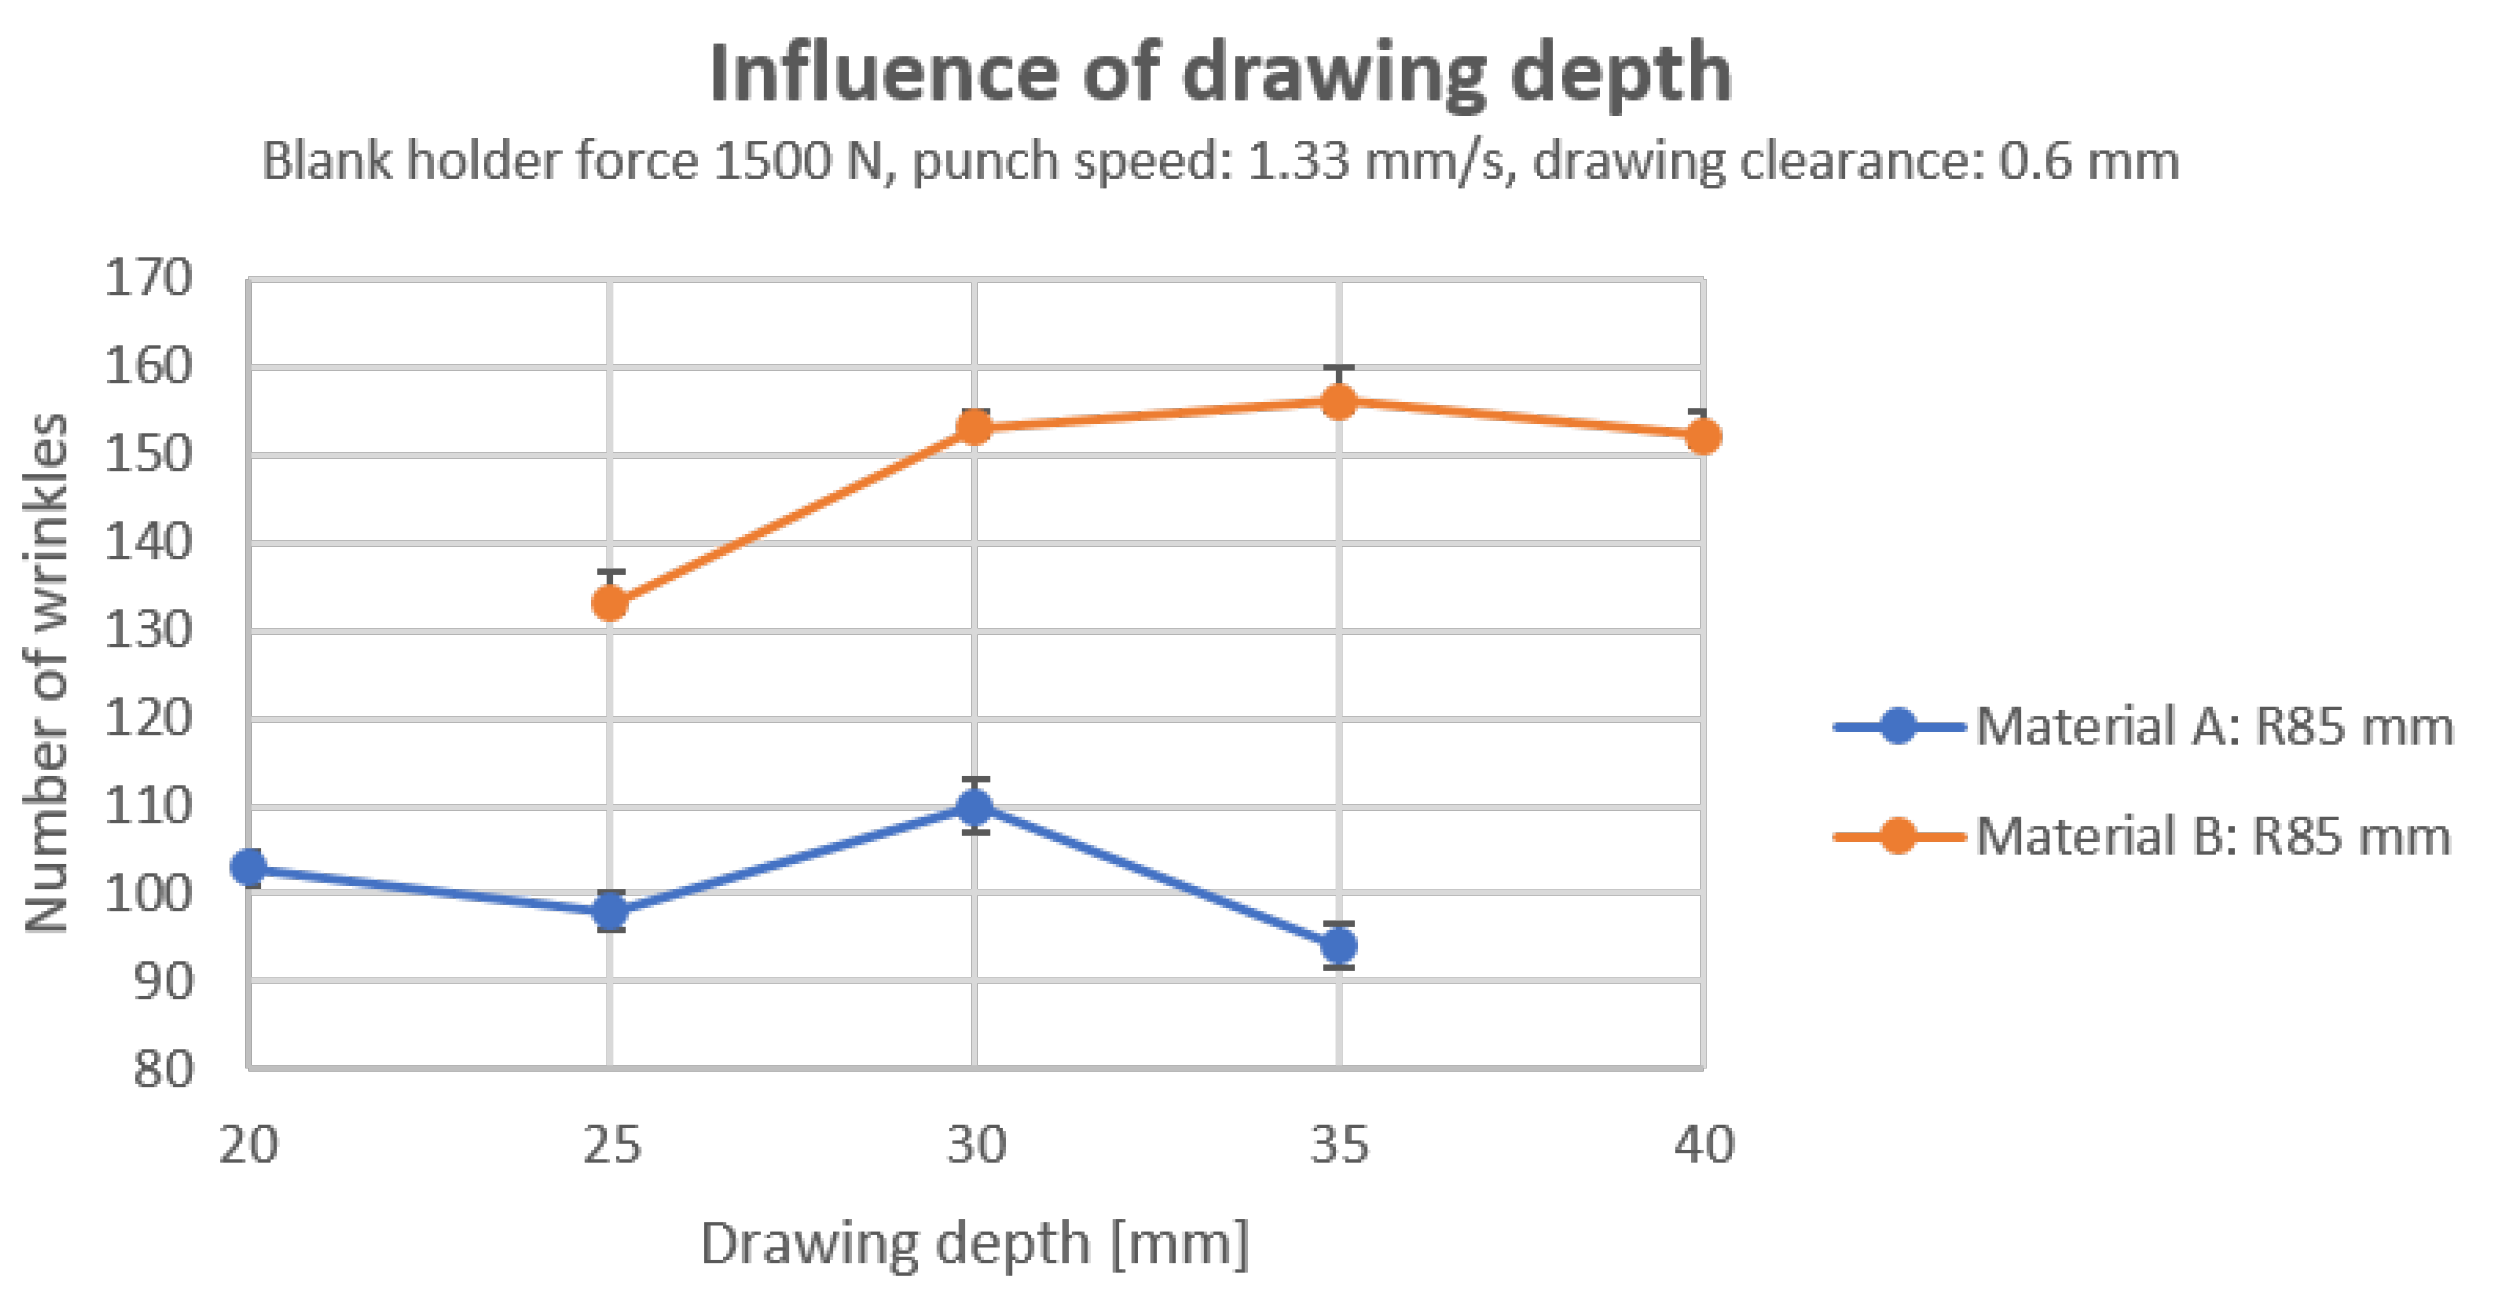
Specimens with a radius of 85 mm of material A and B are utilized to investigate the impact of deep drawing depth on wrinkles, as shown in
Figure 15. However, it can be identified that the quantity of wrinkles remains unaltered from a drawing depth of 20 to 40
, and the fluctuations can be attributed to the inherent inhomogeneity of the material.
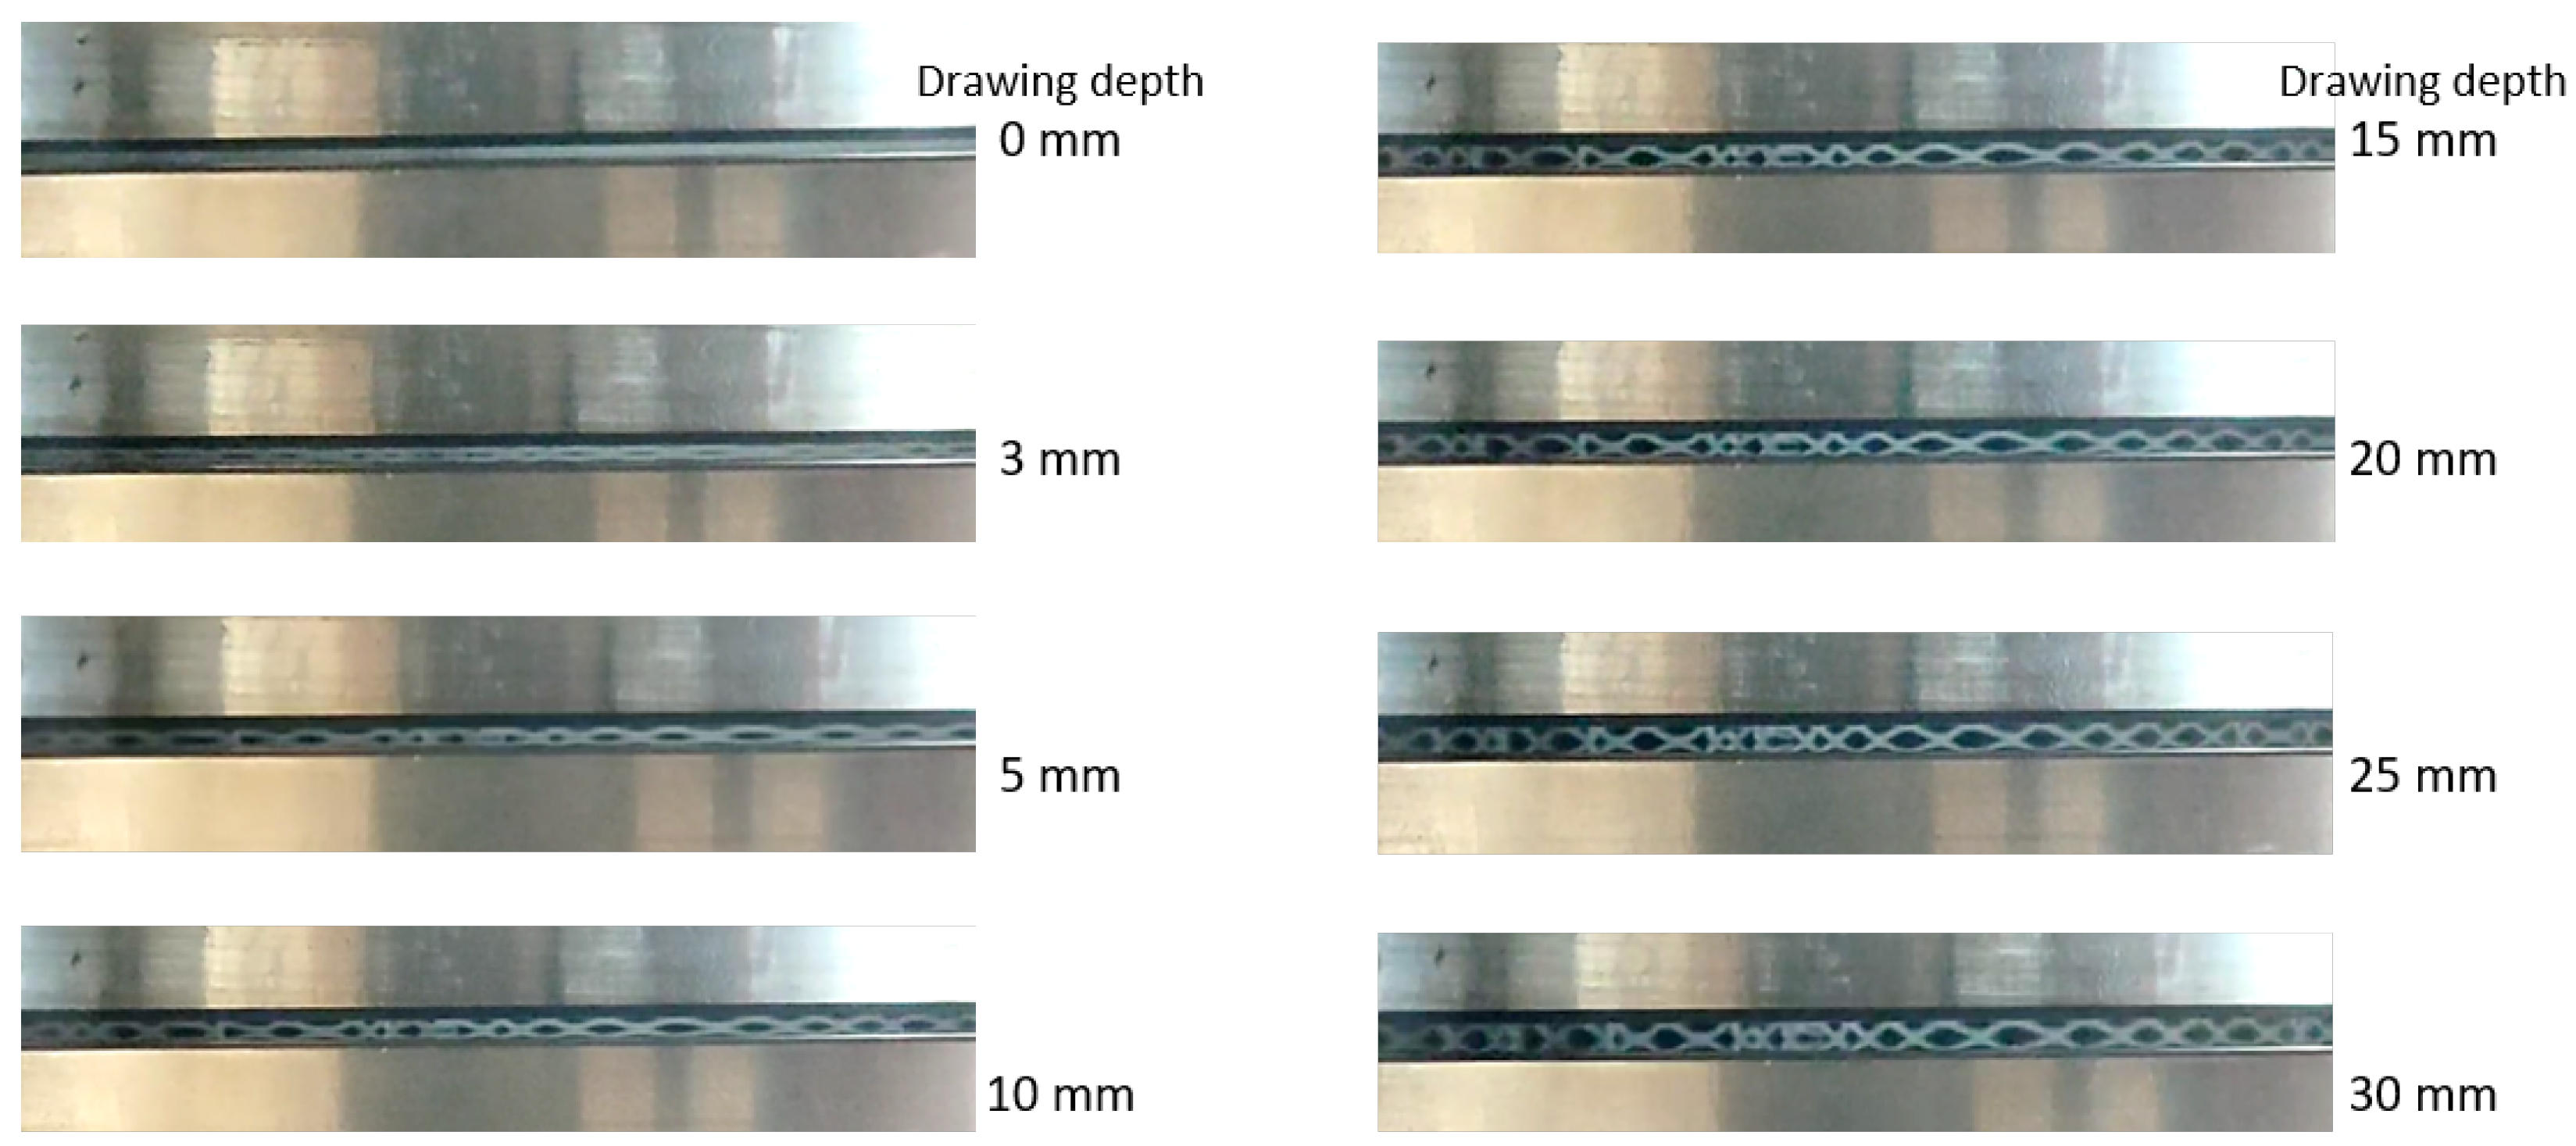
Nevertheless, the number of wrinkles formed during the process of deep drawing is dependent on the drawing depth. When the depth of the drawing is minimal, like approximately 2 to 3
, a limited number of wrinkles are observed (refer to
Figure 16). However, at a certain depth of drawing, around 5 to 6
, the number of wrinkles formed does not increase with the depth of the drawing. During the forming process, wrinkles form at the edges of the specimen, indicating that the number of wrinkles is predetermined at an early stage and then increases. As the number of wrinkles increases, the stiffness of the sample increases, which also corresponds to a tighter gap between the drawing die and the blank holder. The number of wrinkles increases only when the forming force is insufficient to form the material. This explains why there is no significant correlation between drawing depth and wrinkle count.
3.2.4. Influence of Drawing Clearance
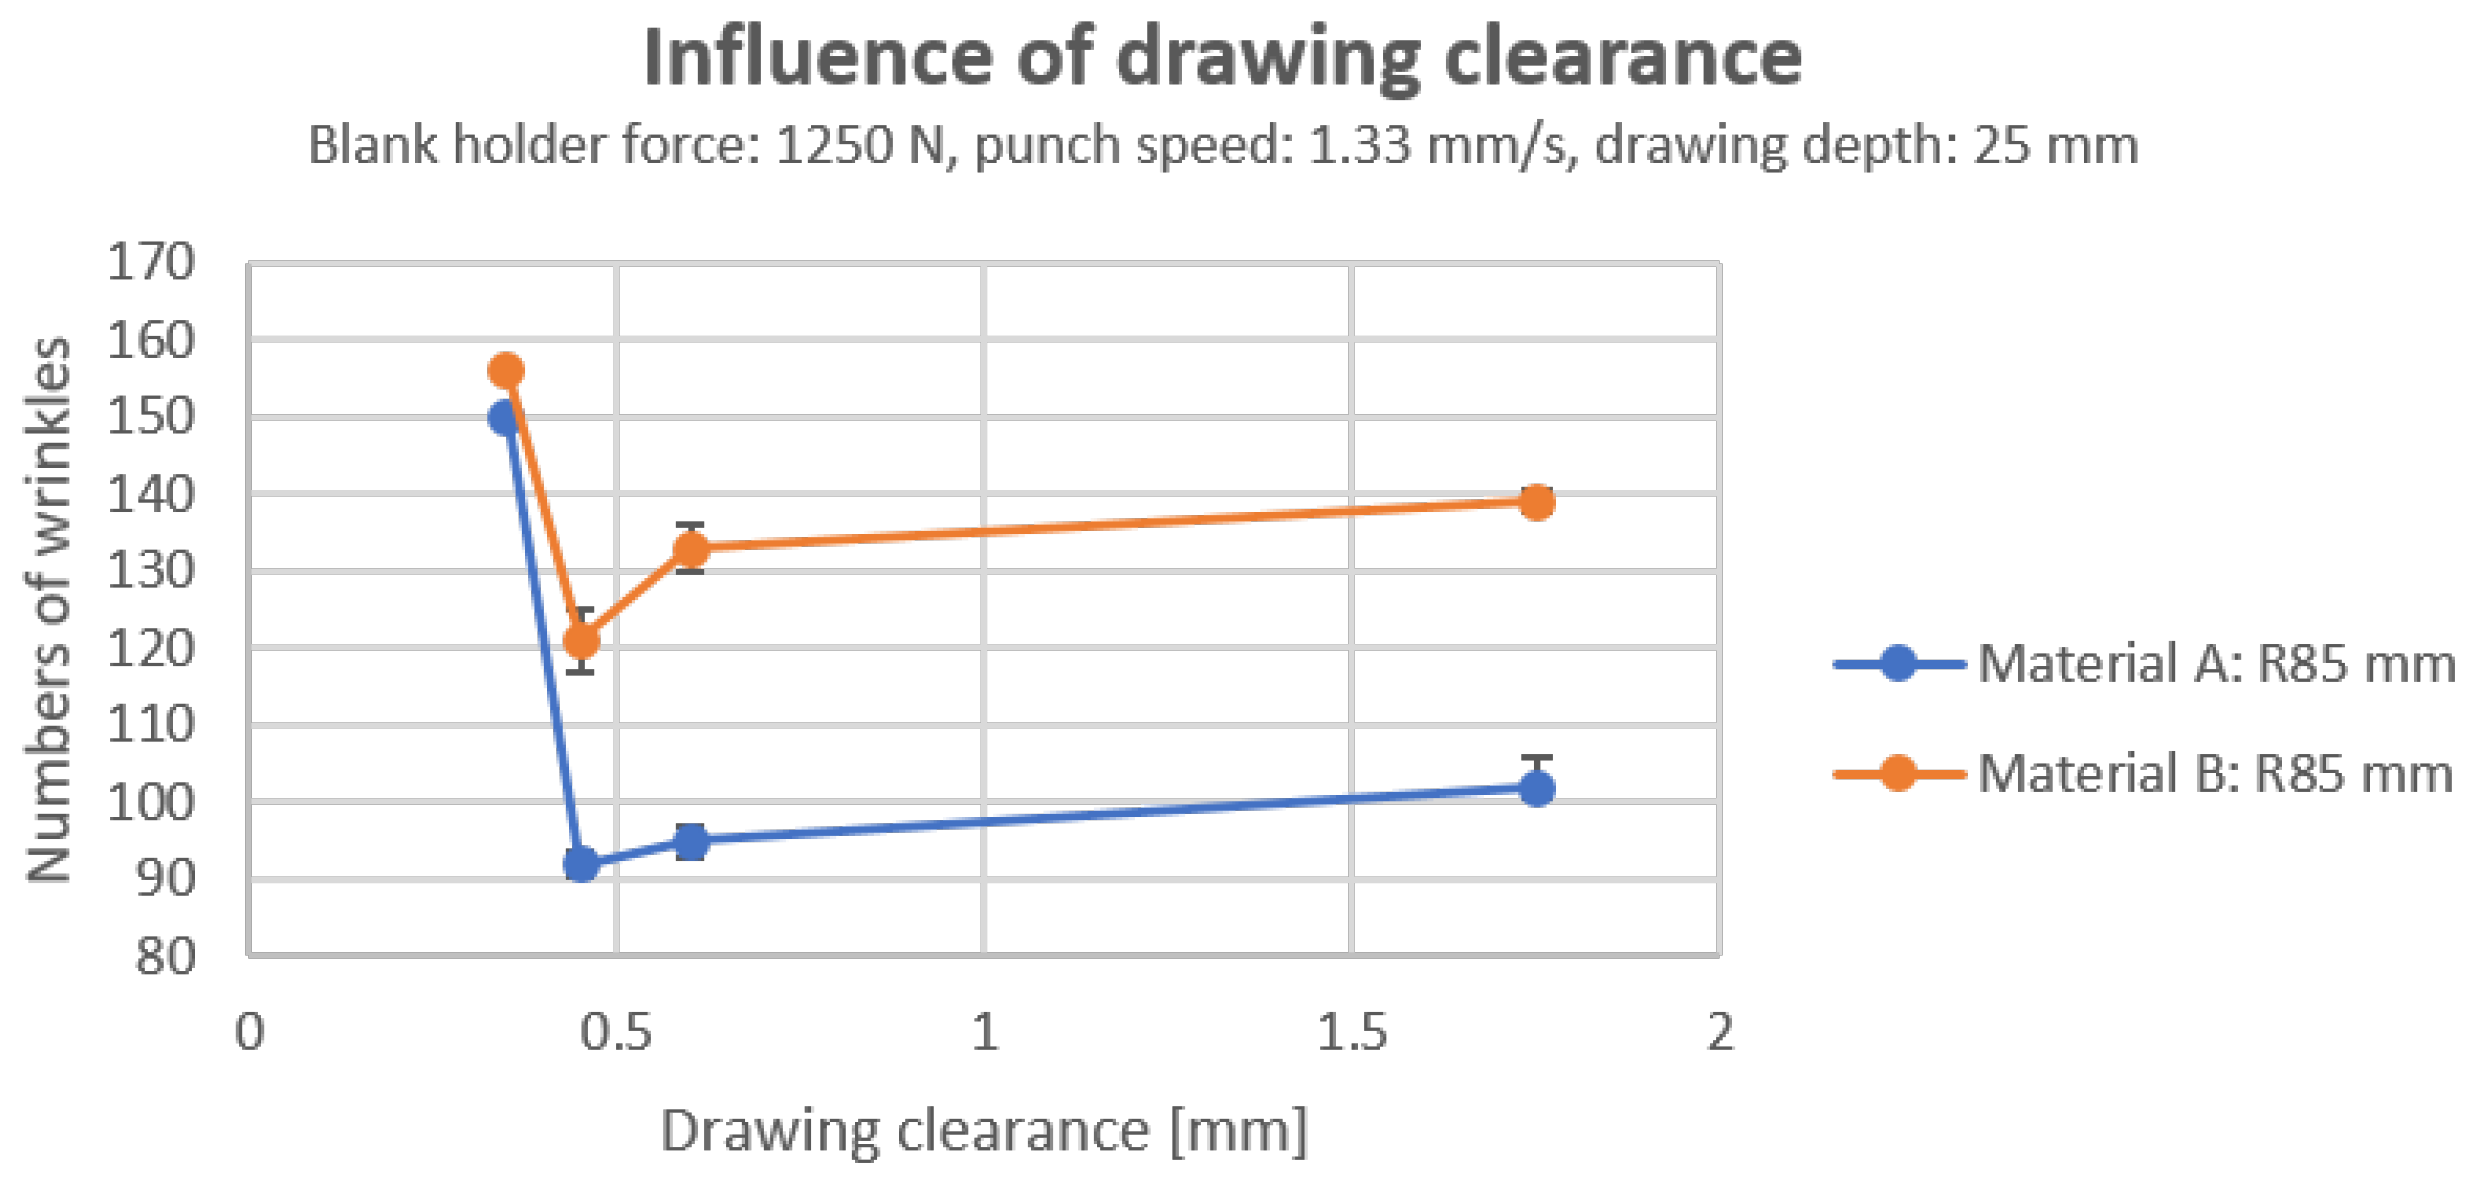
In order to study the effect of drawing clearance on the number of wrinkles, different combinations of punches and the same blank holder are employed. In this study, the punch diameters employed are 76.5, 78.8, 79.1, and 79.3
, with a blank holder diameter of 80
, which means the drawing clearances are 1.75, 0.6, 0.45, and 0.35
, respectively. As shown in
Figure 17, when the drawing clearance is smaller than the material thickness, i.e., in the case of 0.35 mm, the number of wrinkles is significantly higher than in the case of a loose deep-drawing clearance because the wrinkles generated are fine and dense. On the other hand, if the material in the drawing clearance is not subjected to a compressive force in the thickness direction, the number of wrinkles observed during deep drawing increases as the clearance between the drawing surface and the material being drawn increases. This is because a larger clearance impedes the flow of the material to a lesser extent, i.e., the material can flow more easily into the cavity, thereby increasing the probability of wrinkling. This can be thought of as a transition from "compression wrinkling" to "free wrinkling". In the case of free wrinkling, there is no need for an additional position of deviation from the plane because the excess material, i.e., the excess length on the circumference, is considered to be deviated. As a result, there is no resistance in the plane of the sheet to create a new position of deviation, i.e., a wrinkle.
It is also worth noting that the number of wrinkles in material A under compression is close to the number of wrinkles in material B, even though the material behavior of the two is different. This means that the importance of the material’s own parameters in relation to the number of wrinkles is no longer significant in the case of compression wrinkling.
3.2.5. Influence of Punch Speed
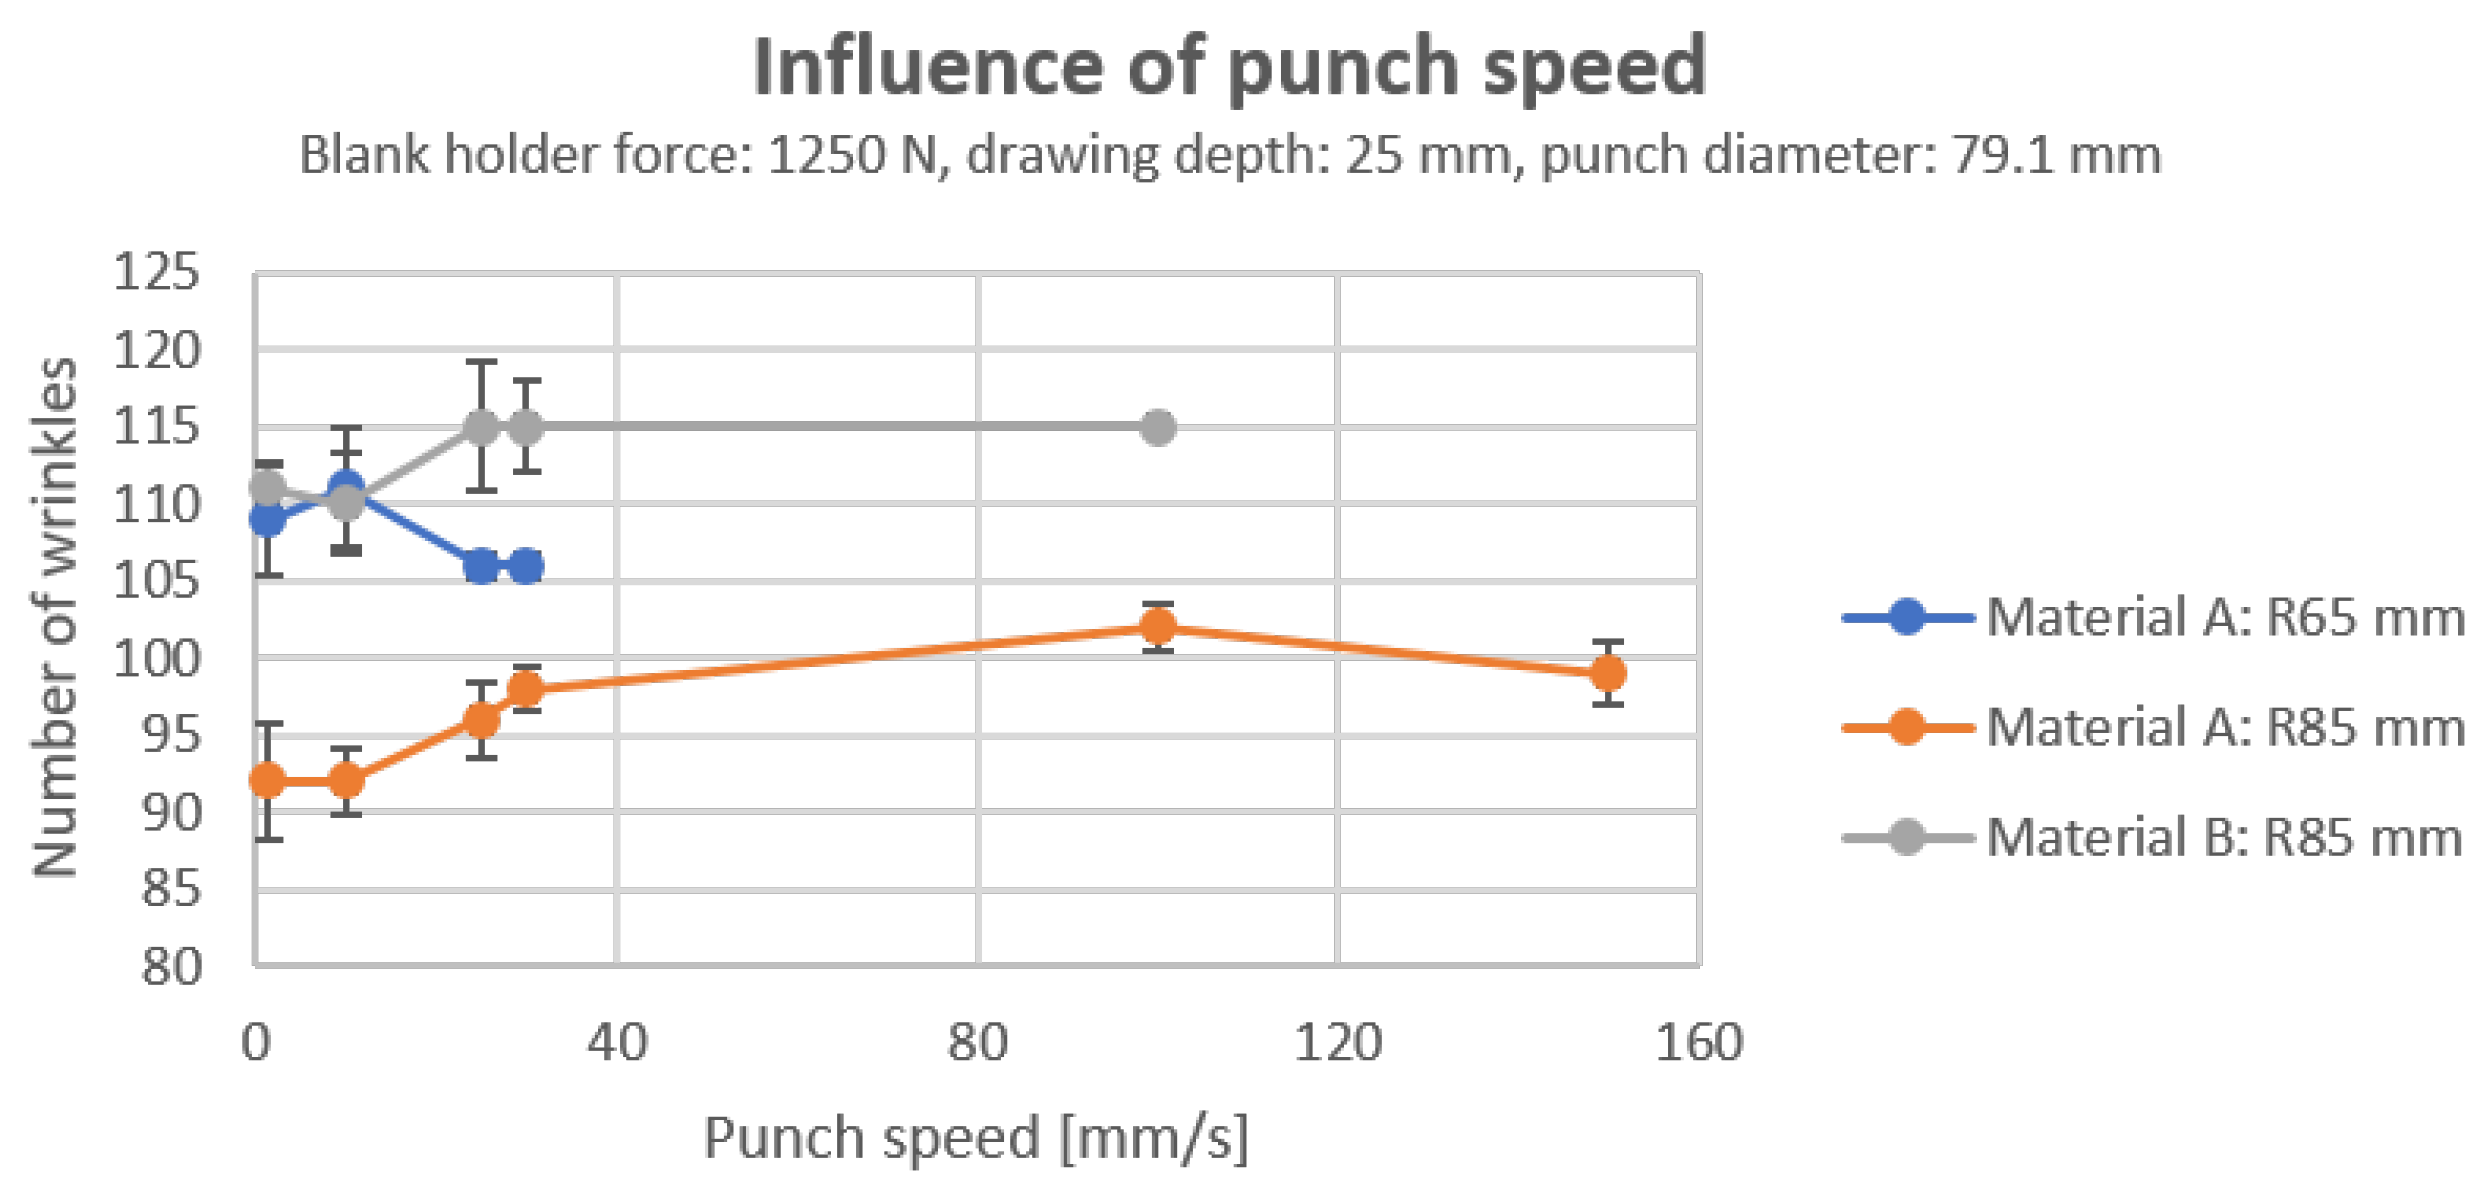
The correlation between the number of wrinkles and speed was not statistically significant under the condition of non-heated tools, although a range of speeds is tested, including both very small and very large values, such as 1.33 and 150
, respectively, as shown in
Figure 18. This means that the time-dependent material deformation component does not seem to be significant in the corresponding period in room-temperature forming. Fluctuations in the formation of wrinkles can be attributed to inhomogeneities in the material itself as well.
4. Conclusions
In conclusion, this paper has successfully applied image analysis techniques to collect wrinkle data for deep-drawn paper products in a time and cost efficient manner. The construction of a darkroom platform ensured uniform light intensity, and an automated wrinkle detection program is developed, resulting in significant advances in the accurate detection of wrinkles, not only in number but also in geometry. Furthermore, the program’s precision is improved by correcting the ellipticity of cup-shaped deep-drawn products, which are prone to a significant springback effect. The experimental results demonstrated that both material properties and drawing clearance exert a significant influence on wrinkle distribution and number. Furthermore, it is observed that increasing the blank holder force during the deep drawing process results in an increased number of wrinkles. This procedure can enhance the efficiency of evaluating product quality and optimizing process parameters. It is important to note that the adjustment of the parameters in the program is also dependent on experience and is influenced by light conditions and materials. Therefore, there is a need for further research into the selection and adjustment of the parameters to ensure a more robust approach.
Author Contributions
Conceptualization, Y.L. and C.S.; methodology, Y.L. and C.S.; software, T.Q.; validation, Y.L., C.S. and T.Q.; formal analysis, Y.L., C.S. and T.Q.; investigation, Y.L., C.S. and T.Q.; resources, P.G., M.H. and J.M.; data curation, Y.L. and C.S.; writing—original draft preparation,Y.L. and C.S.; writing—review and editing, Y.L., C.S., P.G. and M.H.; visualization, Y.L., C.S. and T.Q.; supervision, P.G., M.H. and J.M.; project administration, Y.L. and C.S.; funding acquisition, P.G. and M.H. All authors have read and agreed to the published version of the manuscript.
Funding
This research was funded by German Research Foundation grant number 415796511.
Conflicts of Interest
The authors declare no conflicts of interest.
References
- Hauptmann M, Wallmeier M, Erhard K, et al. The role of material composition, fiber properties and deformation mechanisms in the deep drawing of paperboard. Cellulose 2015, 22, 3377–3395. [Google Scholar] [CrossRef]
- Hauptmann M, Majschak J P. New quality level of packaging components from paperboard through technology improvement in 3D forming. Packaging Technology and Science 2011, 24(7), 419–432. [Google Scholar] [CrossRef]
- Kakinoki R, Segawa Y, Marumo Y, et al. Evaluation of wrinkling states using in-process ultrasonic examination during sheet metal forming. Materials Transactions 2018, 59, 799–804. [CrossRef]
- Ma T, Li Y, Zhou Z, et al. Wrinkle detection in carbon fiber-reinforced polymers using linear phase fir-filtered ultrasonic array data. Aerospace 2023, 10, 181. [CrossRef]
- Gupta K, Körber M, Djavadifar A, et al. Wrinkle and boundary detection of fiber products in robotic composites manufacturing. Assembly Automation 2020, 40(2), 283–291. [Google Scholar]
- Gupta, K.; Körber, M.; Krebs, F.; Najjaran, H. ision-based deformation and wrinkle detection for semi-finished fiber products on curved surfaces. In 14th International Conference on Automation Science and Engineering (CASE), Munich, Germany, 2018, 618–623.
- Wallmeier M, Hauptmann M, Majschak J P. New methods for quality analysis of deep-drawn packaging components from paperboard. Packaging Technology and Science, 2015; 28, 91–100.
- Müller T, Lenske A, Hauptmann M, et al. Method for fast quality evaluation of deep-drawn paperboard packaging components. Packaging Technology and Science, 2017; 30, 703–710.
- Müller T, Meyer M, Lenske A, et al. Optical inline quality assessment of deep-drawn paperboard containers. Journal of Materials Processing Technology 2018, 262, 615–621. [Google Scholar] [CrossRef]
- Müller T, Lenske A, Barbier C, et al. Geometry-invariant wrinkle detection in sealing rims of paperboard containers. BioResources 2019, 14, 2536–2549. [Google Scholar] [CrossRef]
- Hauptmann M, Weyhe J, Majschak J P. Optimisation of deep drawn paperboard structures by adaptation of the blank holder force trajectory. Journal of Materials Processing Technology 2016, 232, 142–152. [Google Scholar] [CrossRef]
Figure 1.
Photograph platform for image capture
Figure 1.
Photograph platform for image capture
Figure 2.
Flowchart of wrinkle detection program
Figure 2.
Flowchart of wrinkle detection program
Figure 3.
Detection process of wrinkles on the sample with flange (Blank holder force: 1050N, draw depth: 25 mm, drawing clearance: 0.45 mm, punch speed 25 mm/s)
Figure 3.
Detection process of wrinkles on the sample with flange (Blank holder force: 1050N, draw depth: 25 mm, drawing clearance: 0.45 mm, punch speed 25 mm/s)
Figure 4.
Detection process of wrinkles on the sample without flange (Blank holder force: 1050N, draw depth: 25 mm, drawing clearance: 0.45 mm, punch speed 25 mm/s)
Figure 4.
Detection process of wrinkles on the sample without flange (Blank holder force: 1050N, draw depth: 25 mm, drawing clearance: 0.45 mm, punch speed 25 mm/s)
Figure 5.
Image enhancement with CLAHE
Figure 5.
Image enhancement with CLAHE
Figure 6.
Adaptive threshold segmentation with different offsets
Figure 6.
Adaptive threshold segmentation with different offsets
Figure 7.
Minimum limit of threshold value
Figure 7.
Minimum limit of threshold value
Figure 8.
4 cases of blank holder force trajectories to produce finer wrinkles
Figure 8.
4 cases of blank holder force trajectories to produce finer wrinkles
Figure 9.
Wrinkle detection of material A and the sum of wrinkles (in the middle of results picture)
Figure 9.
Wrinkle detection of material A and the sum of wrinkles (in the middle of results picture)
Figure 10.
Wrinkle detection of material B and the sum of wrinkles (in the middle of results picture)
Figure 10.
Wrinkle detection of material B and the sum of wrinkles (in the middle of results picture)
Figure 11.
Examples of errors in wrinkle detection
Figure 11.
Examples of errors in wrinkle detection
Figure 12.
Comparison of stress-strain curves of basis materials and wrinkle distribution for materials A and B with the same process parameter in
Figure 8: case 1
Figure 12.
Comparison of stress-strain curves of basis materials and wrinkle distribution for materials A and B with the same process parameter in
Figure 8: case 1
Figure 13.
Influence of blank holder force on the number of wrinkles in deep drawing
Figure 13.
Influence of blank holder force on the number of wrinkles in deep drawing
Figure 14.
Trends in the change of wrinkles with increasing blank holder force of materials A and B
Figure 14.
Trends in the change of wrinkles with increasing blank holder force of materials A and B
Figure 15.
Influence of drawing depth on number of wrinkles in deep drawing
Figure 15.
Influence of drawing depth on number of wrinkles in deep drawing
Figure 16.
Wrinkle formation in the deep drawing process with different drawing depth
Figure 16.
Wrinkle formation in the deep drawing process with different drawing depth
Figure 17.
Influence of drawing clearance on number of wrinkles in deep drawing
Figure 17.
Influence of drawing clearance on number of wrinkles in deep drawing
Figure 18.
Influence of punch speed on number of wrinkles in deep drawing
Figure 18.
Influence of punch speed on number of wrinkles in deep drawing
Table 1.
Parameter variations in deep drawing of paper and paperboard: 23 °C, 50% RH
Table 1.
Parameter variations in deep drawing of paper and paperboard: 23 °C, 50% RH
| Blank holder force [N] |
650; 850; 1050; 1250; linear decrease or user-defined 1
|
| Drawing depth [mm] |
20; 25; 30; 35; 40 |
| Drawing clearance [mm] |
0.35; 0.45; 0.6; 1.75 |
| Punch speed [mm/s] |
1.33; 10; 25; 30; 100; 150 |
Table 2.
Evaluation of the wrinkle detection results
Table 2.
Evaluation of the wrinkle detection results
| Evaluation parameters |
With flange |
Without flange |
| Accuracy |
97.90% |
99.61% |
| Standard deviation |
0.40 |
0.49 |
| Non-detection rate |
6.48% |
14.51% |
| False-detection rate |
4.00% |
14.12% |
|
Disclaimer/Publisher’s Note: The statements, opinions and data contained in all publications are solely those of the individual author(s) and contributor(s) and not of MDPI and/or the editor(s). MDPI and/or the editor(s) disclaim responsibility for any injury to people or property resulting from any ideas, methods, instructions or products referred to in the content. |
© 2024 by the authors. Licensee MDPI, Basel, Switzerland. This article is an open access article distributed under the terms and conditions of the Creative Commons Attribution (CC BY) license (http://creativecommons.org/licenses/by/4.0/).
