Preprint
Article

Optically Stimulated Luminescence (OSL) Dating of Alluvial Deposits from the Cahuachi Archaeological Site (South Peru)

Altmetrics

Downloads

59

Views

88

Comments

0

A peer-reviewed article of this preprint also exists.

Submitted:

10 October 2024

Posted:

11 October 2024

You are already at the latest version

Alerts
Abstract
Cahuachi (Nazca River Valley, South Peru) was the major ceremonial center of the Nasca civilization. According to previous studies, it was struck and destroyed by three El Niño-Southern Oscillation events, which would have occurred around 100 BCE, 600 CE and 1000 CE, respectively. At the end of the series of events, the ceremonial center would have been buried by a cap of conglomerates. Despite this hypothesis raised well-founded doubts regarding its geochronological and paleoenvironmental implications, it is uncritically used as a reference in geoarchaeological research. In the present study, optically stimulated luminescence (OSL) dating results of some samples taken from alluvial deposits at Cahuachi are reported, with the aim to evaluate the literature’s hypothesis. Since the obtained ages are older than the Holocene epoch, such a hypothesis must be rejected. A number of field evidences corroborate this result. Finally, the advancement in fluvial geomorphology knowledge of the Nazca River Valley is briefly discussed.
Keywords: 
Subject: Environmental and Earth Sciences  -   Geophysics and Geology

1. Introduction

Cahuachi (Nazca River Valley, Pampa of Nazca, South Peru) was the major ceremonial center of the Nasca Culture. Such a civilization, which arose around 200 Before Common Era (BCE), spread its dominance over southern Peru under the influence of a theocratic elite. Cahuachi became a place of pilgrimage, preserving this function at least until 450 Common Era (CE) (Orefici, 2012, 2016) [1,2]. This monumental site is spread over 150 ha and consists of a number of smoothed mounds forming the core of pyramids and temples made of adobe (Delle Rose, 2016) [3].
As a result of a geoarchaeological investigation, Grodzicki (1990, 1992, 1994) [4,5,6] claimed that the Pampa of Nazca, including Cahuachi area, was struck by three catastrophic El Niño-Southern Oscillation (ENSO) events, which occurred around 100 BCE, 600 CE and 1000 CE, respectively. According to the author, the second event caused severe damage to buildings and the destruction of the Nasca Culture; furthermore, the third event would have caused the burial of the site under a cap of conglomerates [6]. Grodzicki’s reconstruction raised doubts regarding its geochronological and paleoenvironmental implications (see, e.g., Silverman and Proulx, 2002; Eitel et al., 2005 [7,8]). On the other hand, possible evidence of hydrogeological disasters ascribable to ENSO events are reported, with different confidence levels, for many Pre-Hispanic Peruvian sites (Delle Rose, 2022) [9]. Some of these evidence are quite controversial and caused contrasting opinions. Thus, exploring the reliability of the literature hypotheses is a decisive issue in both the geoarchaeological and paleoclimatic perspectives. As highlighted by previous authors “more geological work is necessary in Nazca and full publication data is crucial” [7].
Some years ago, an archeological excavation inside Cahuachi allowed us to study the lithostratigraphy of the bedrock underlying pyramids and temples (Delle Rose et al., 2019 [10]). The main finding was to refer the examined layers to the top of the Tertiary regional succession rather than Holocene ENSO-related deposits. A research target planned by the authors of ref. [10] was the dating of alluvial sediments investigated by Grodzicki by means of Optically Stimulated Luminescence (OSL) methods. In the present study, OSL dating results of some samples taken at Cahuachi in April 2019 are reported (Section 3) with the aim to evaluate the catastrophe hypothesis of Grodzicki (Section 4.1). Finally, the advancement in fluvial geomorphology knowledge of the study area is briefly discussed (Section 4.2).

2. Materials, Methods and Sample Descriptions

2.1. Study Area

The study area is placed at the northern margin of the Atacama desert [3]. From a morpho-structural point of view, it belongs to the Cuenca Pisco Unit (a sub-domain of the Andean forearc) and shows the typical flat landscape of the pampas (Leon et al., 2008) [11]. Early lithostratigraphic studies on the Tertiary regional succession were published during the 80s (Sebrier and Machare (1980); Machare (1987)) [12,13]. They defined two major lithostratigraphic units at the top of the succession, named Changuillo Fm (upper Pliocene) and Canete Fm (upper Pliocene-lower Pleistocene), respectively, without providing suitable information regarding criteria to define their lithostratigraphic boundary.
Since the end of 90s, a stratigraphic revision of the Tertiary regional succession has been underway by the Ministerio de Energía y Minas (Leon et al., 2008) [11]. Thus, it has been established that the top of the succession is made up by interstratified sandstones, siltstones, mudstones, volcaniclastic layers, conglomerates and breccias, and shows a marine to continental transition from the bottom to the top (the depositional environment changes from shallow marine water to shoreface to alluvial fan) [10]. The stratigraphic revision also provided first information on the boundary between Changuillo and Canete Fms [11,14,15], which was almost completely unknown before Grodzicki’s studies (see Appendix A).
Throughout the Early–Middle Pleistocene, south–west Peru emerged from the sea to be shaped by geomorphological processes under different climate conditions. The uplift of the Andes led to abundant supplies of clasts that formed large alluvial fans, while the river basins evolved through cycles of erosion and sedimentation. During the late Middle Pleistocene, a series of planation surfaces and fluvial terraces developed (Hall et al., 2008) [16]. For the Andean forearc of the southern Peru, a regional-scale fluvial response to climate and tectonic forcings has been recently highlighted [17]. Since the beginning of the Upper Pleistocene, moisture transport changes led to repeated transition from grassland to desert, and vice versa (Machtle et al., 2010) [18]. The last glacial cycle was characterized by phases with enhanced precipitation [19,20] which influenced, in turn, the fluvial dynamics before the deglaciation [17].
The modern ENSO atmospheric conditions were established at the beginning of the late Holocene. They determined precipitation decreasing and desert expansion (Machtle et al., 2006; Eitel and Machtle, 2009) [21,22]. Over the last few millennia, the final shaping of the smoothed mounds of the Cahuachi area was characterized by periods of drought interspersed with rainfall events. Such conditions allowed the last phase of formation of a widespread desert pavement, lag deposits, eolian and colluvium layers along the sides of the mounds, and debris flows inside small ephemeral watercourses [3]. These deposits completely cover the bedrock and have thicknesses ranging from a few decimeters to a few meters.
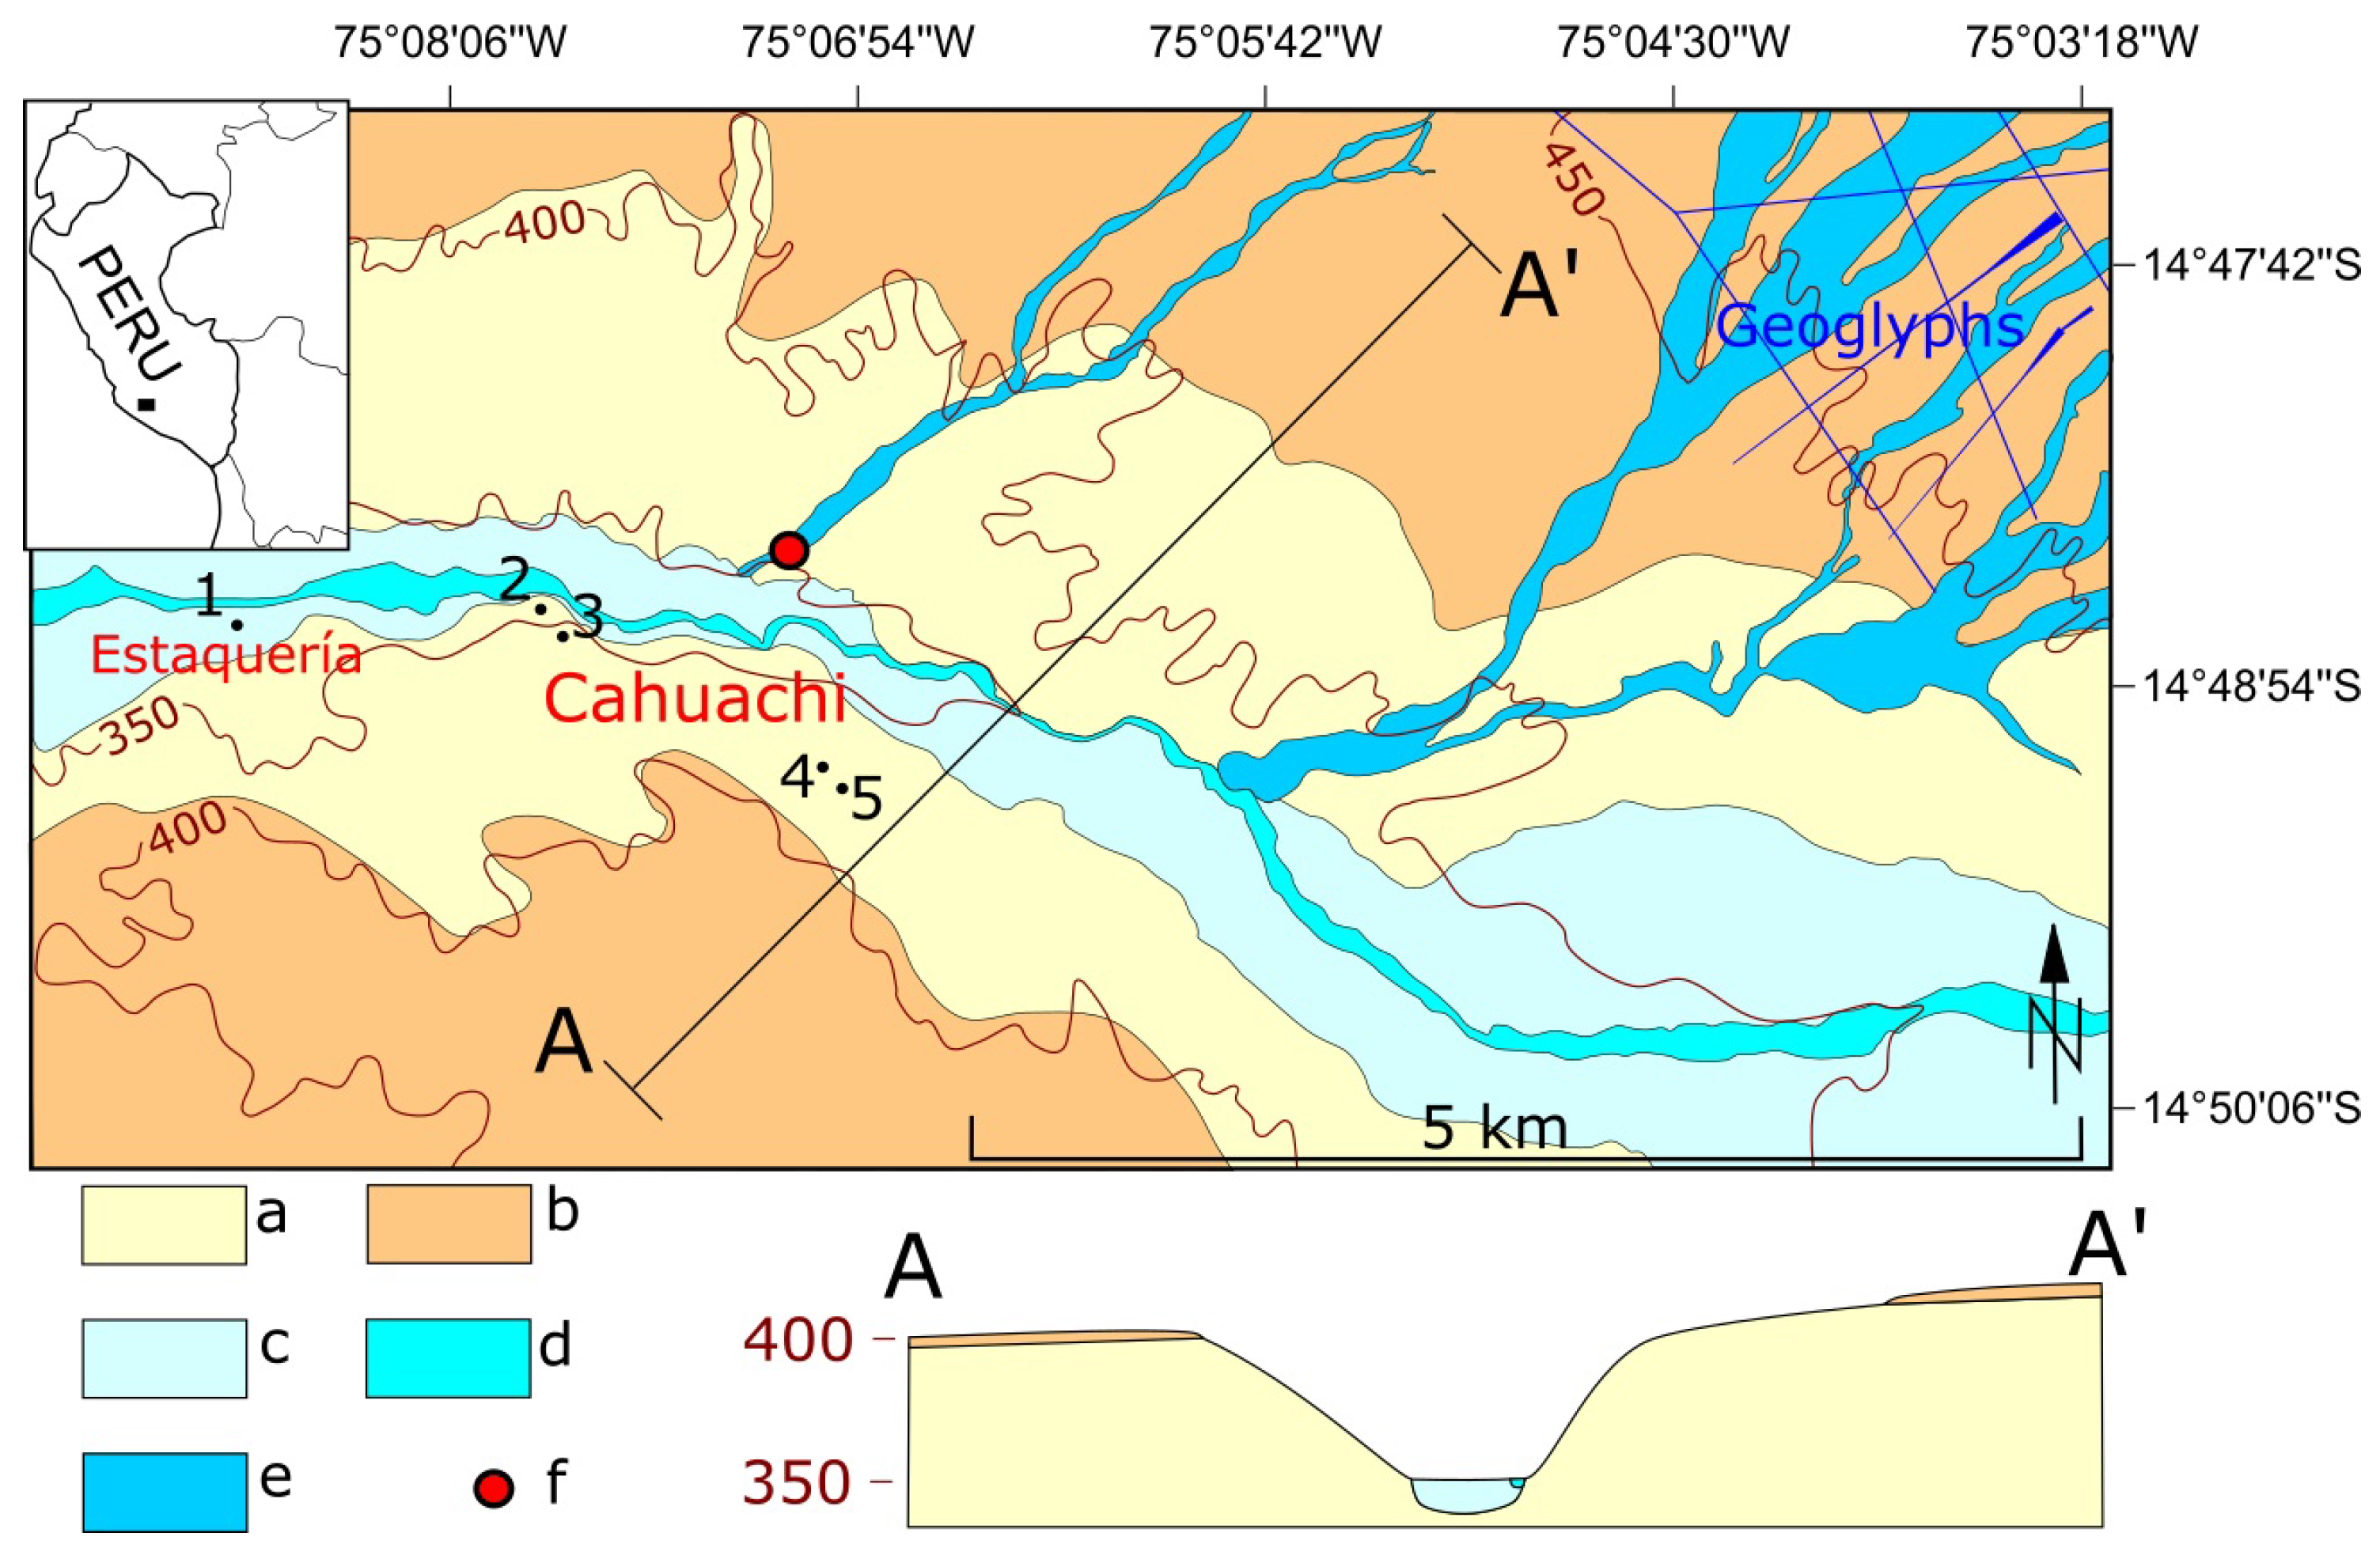
Figure 1 displays bedrock formations and major fluvial bodies, including active alluvial-slope systems, of Cahuachi and surrounding areas. The valley floor deposits of the Nazca River are distinguished in floodplain deposits and sediments of the present riverbed.

2.2. Sediment Sampling

During April 2019, a geological survey was carried out at Cahuachi and the surrounding areas with the main goal to collect samples of sandy sediments suitable for OSL analyses. In the meantime, field observations on Tertiary regional succession, Quaternary alluvial deposits, and bedrock covering were performed (see Appendix A).
To summarily characterize the main sedimentological features of the sampled alluvial deposits, the facies classification codes of Miall (1978, 2006) have been used [23,24]. These codes are composed by two or three letters. A first capital letter indicates dominant grain size (G = gravel; S = sand), while subsequent lowercase letters indicate texture and sedimentary structures (c = clast-supported; h = horizontal bedding, imbrication; i = inverse grading; l = low-angle cross-bedding; m = massive).
Figure 1. Geological map of Cahuachi and surrounding areas. Legend; (a) Changuillo Fm; (b) Canete Fm; (c) Floodplain deposits; (d) Sediments of the present riverbed; (e) Active alluvial-slope systems; (f) Reference section of Grodzicki [5]; A-A’, trace of section; 1-5, sampling point for OSL analysis. Contour lines (in m a.s.l.) are reported. From [25], modified (see text).
Preprints 120842 g001
For OSL dating, samples were collected by hammering, horizontally, 22.5 cm-long and 4.5 cm-wide aluminum-based alloy cylindrical tubes into the sand levels to prevent exposure of the sediments to the sunlight. Only the central parts of the sandy samples contained in the tubes were then used for OSL dating (Section 2.4.1), thus minimizing the possibility to analyse the last centimetres of sands of both the ends of the tubes, which could have had the chance to be exposed to sunlight during the sampling before closing them with thick caps not filtering the sunlights. The same sandy levels for OSL analyses were also sampled in separate plastic bags to perform grain-size and minero-petrographic analyses by thin sections (Section 2.3).
Regarding the selected sample for radiocarbon dating (Section 2.4.2) by means of an accelerator mass spectrometer (AMS) charcoals were wrapped in aluminum foil (to avoid contact with organic material during transport).
Five sampling points were selected for the aim of this study (Figure 1). They are described below from the lowest to the highest in elevation to form a composite profile (Table 1). These samplings were carried out without affecting or involving structures and other archaeological remains.

2.2.1. Sampling Point 1

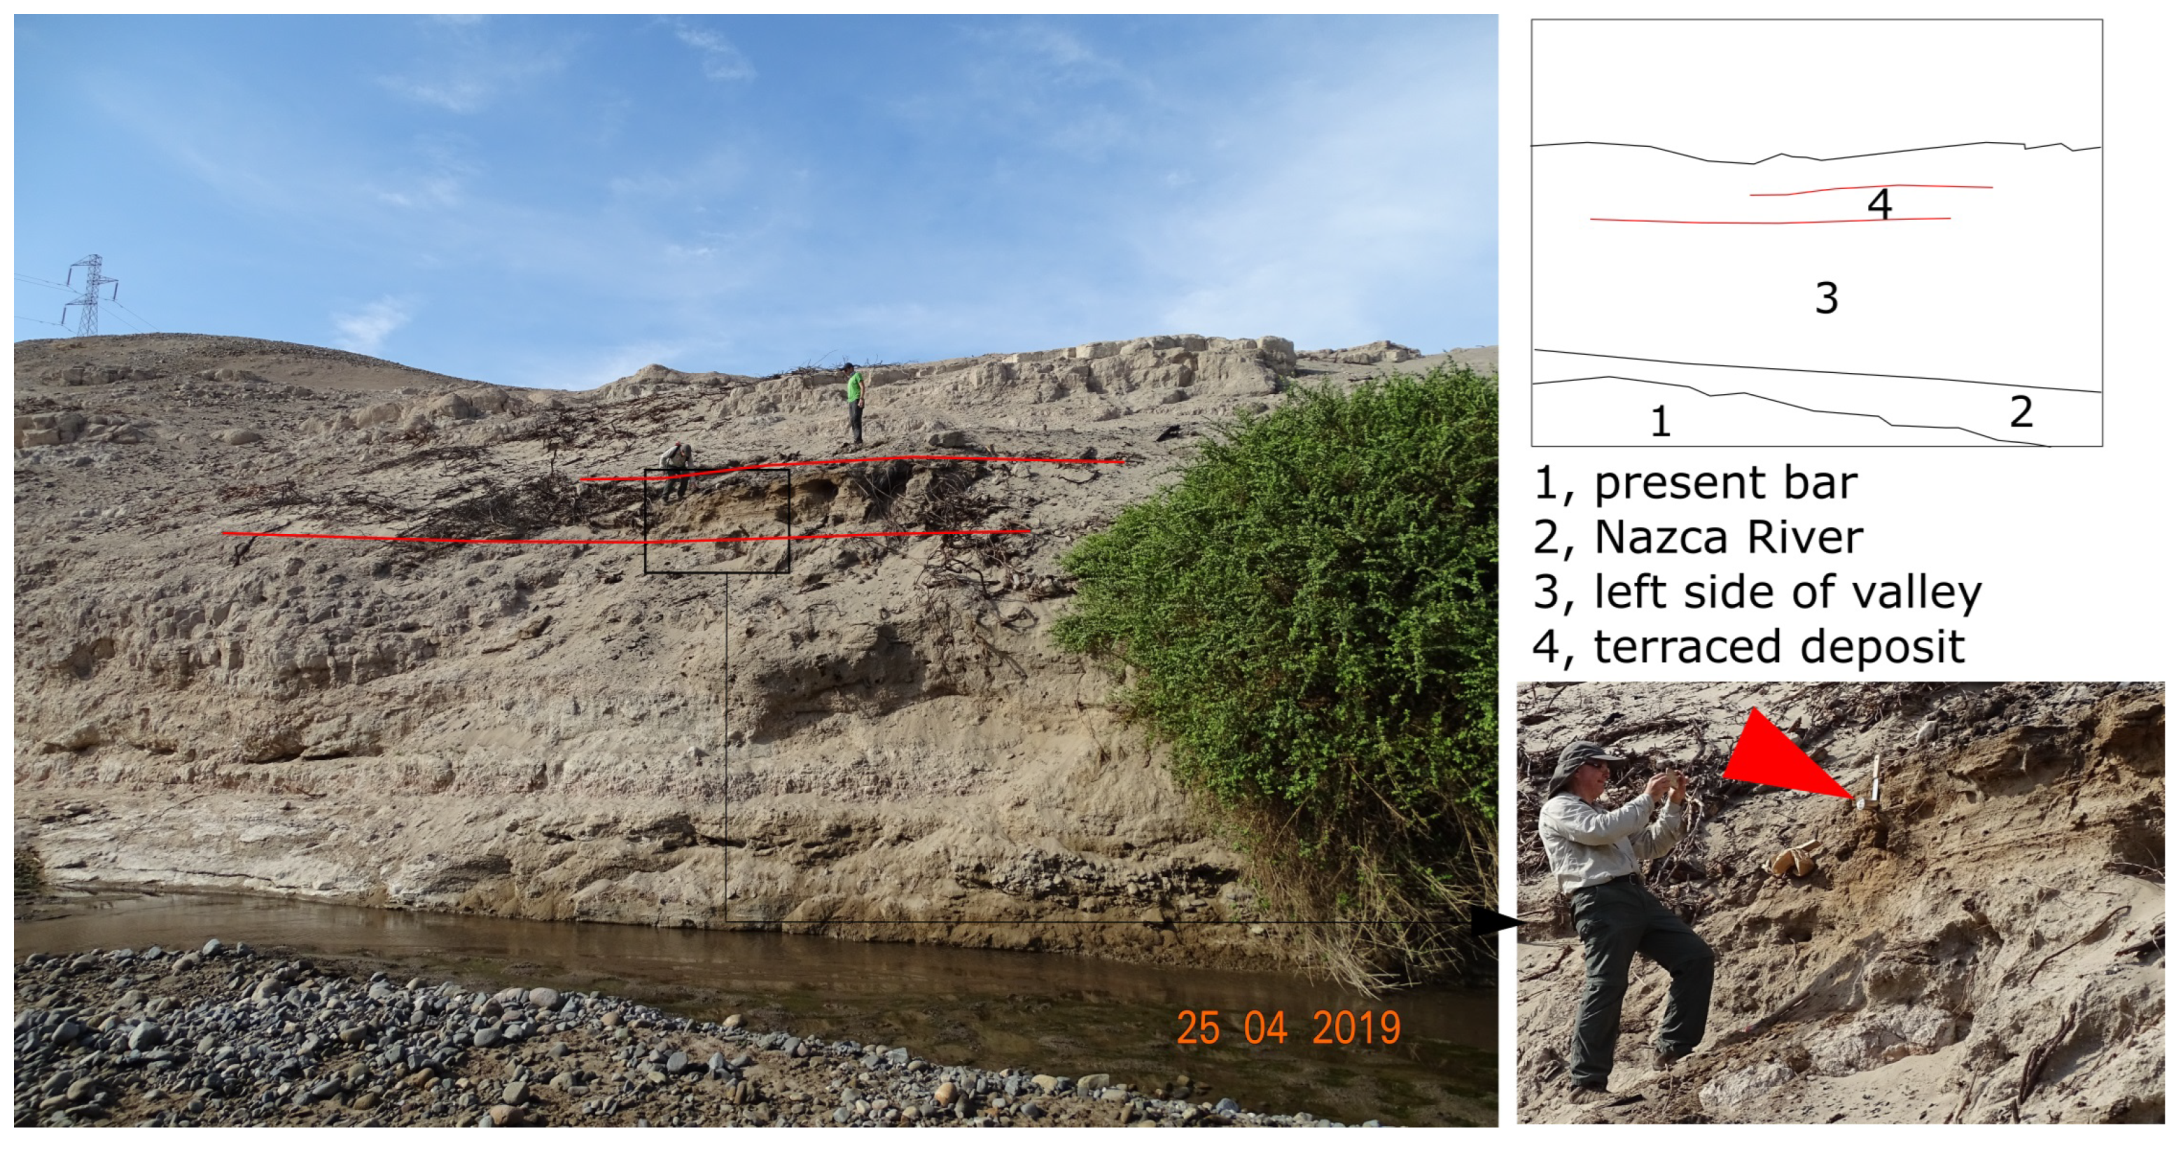
The sampling point 1 is placed inside Estaquería (Figure 1), the archaeological site that was the only one to remain active after the decline of Cahuachi (Orefici, 2016b) [26]. On the wall of an illegal excavation (Figure 2; for the looting problem see Lasaponara and Masini, 2016 [27]), the top of the floodplain deposits is exposed (estimated elevation above the valley floor about 15 m). From the bottom to the top of this stratigraphic exposure, massive sand (Sm facies) and clast-supported bedded gravel (Gh facies) occur in succession. The NZ16 sample (Table 1) was extracted from the Sm facies.

2.2.2. Sampling Point 2

The sampling point 2 coincides with a terraced deposit remnant (Figure 3). Its estimated elevation above the valley floor is about 7.5 m. This deposit is made up by laminated sand (Sh facies) containing scattered pebbles. Two sandy samples (NZ7 and NZ8, see Table 1) were gathered in vertical profile from this sedimentary body.

2.2.3. Sampling Point 3

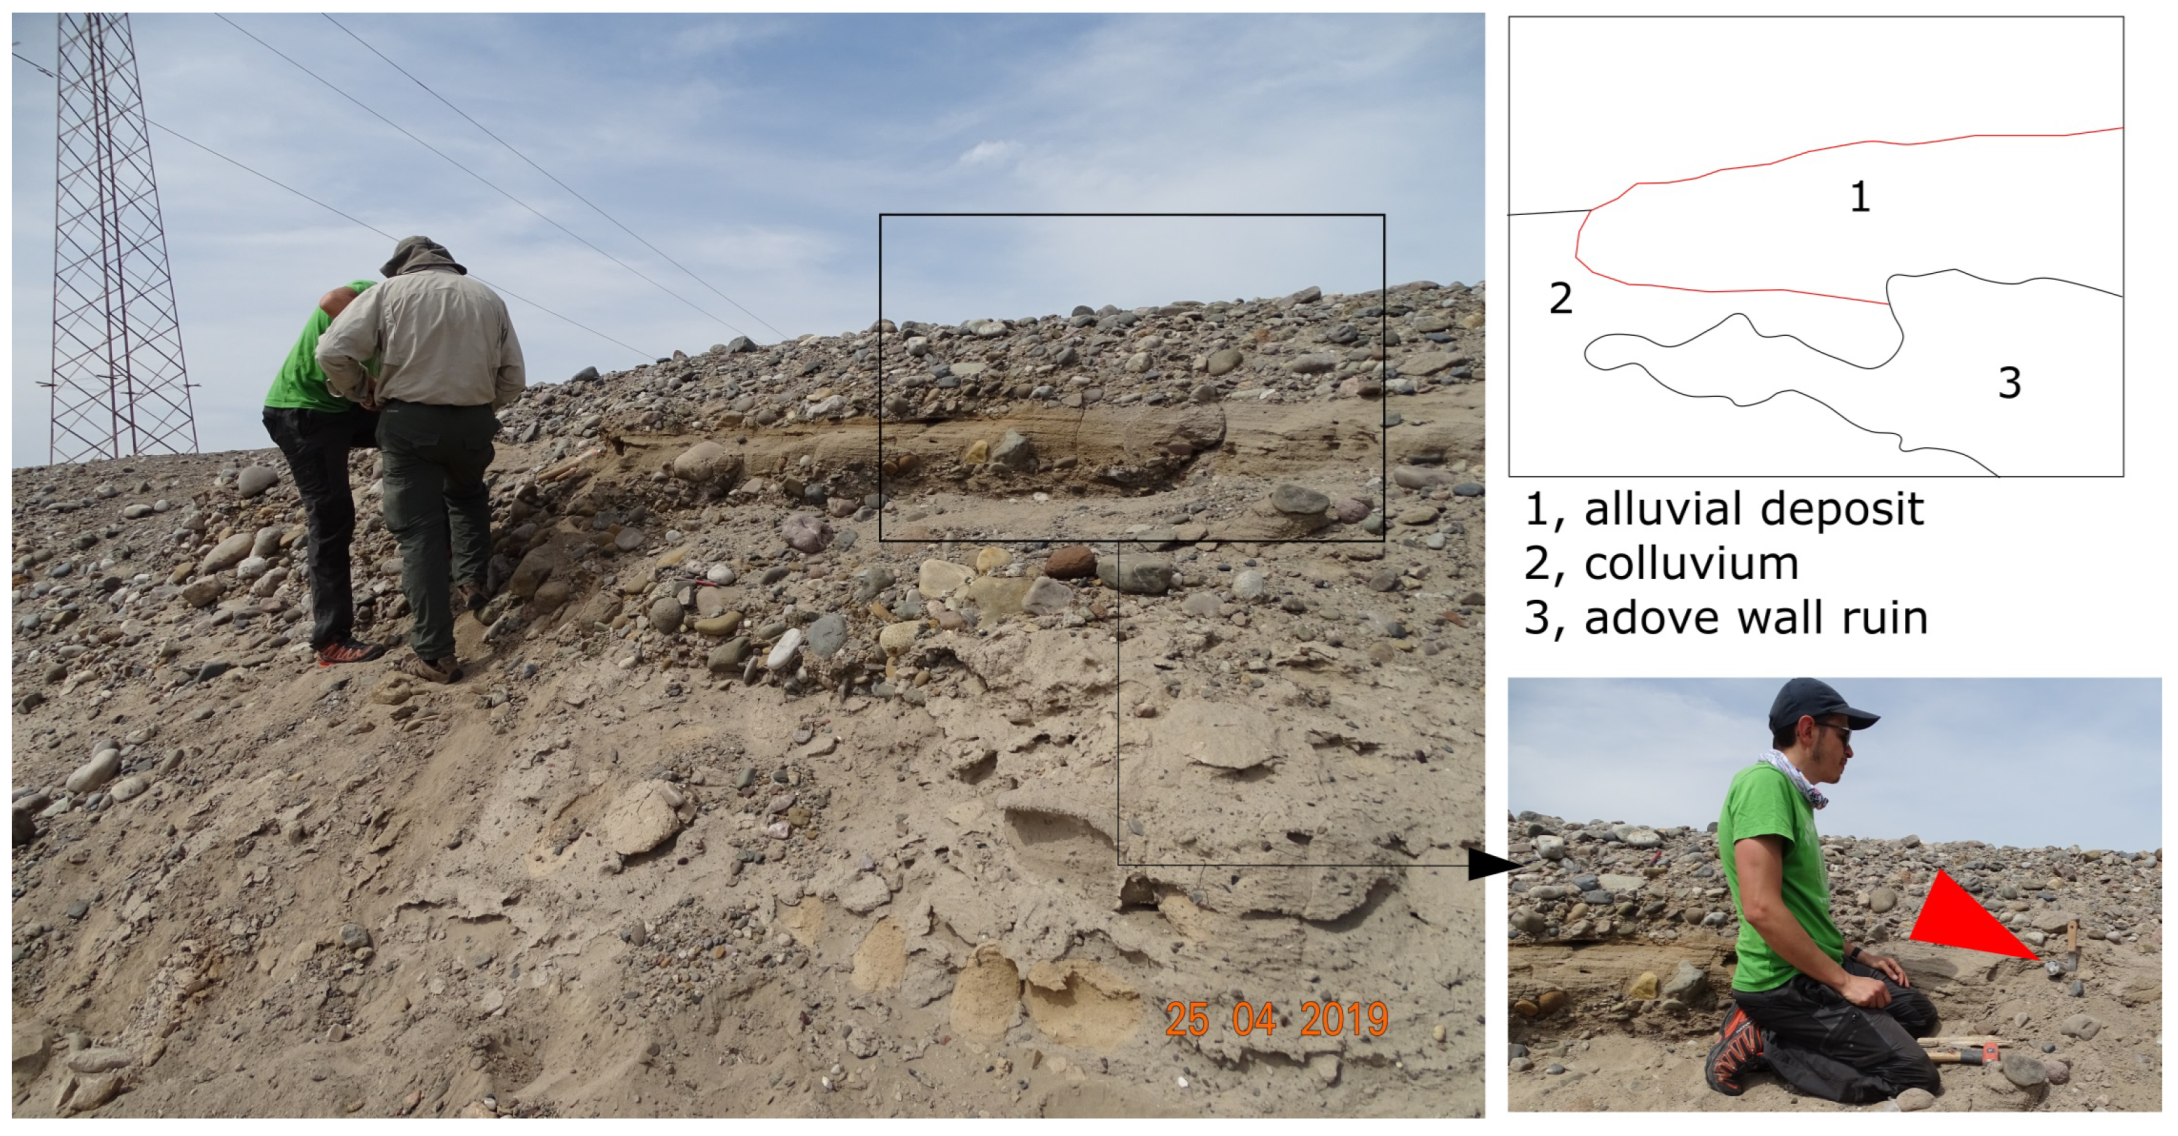
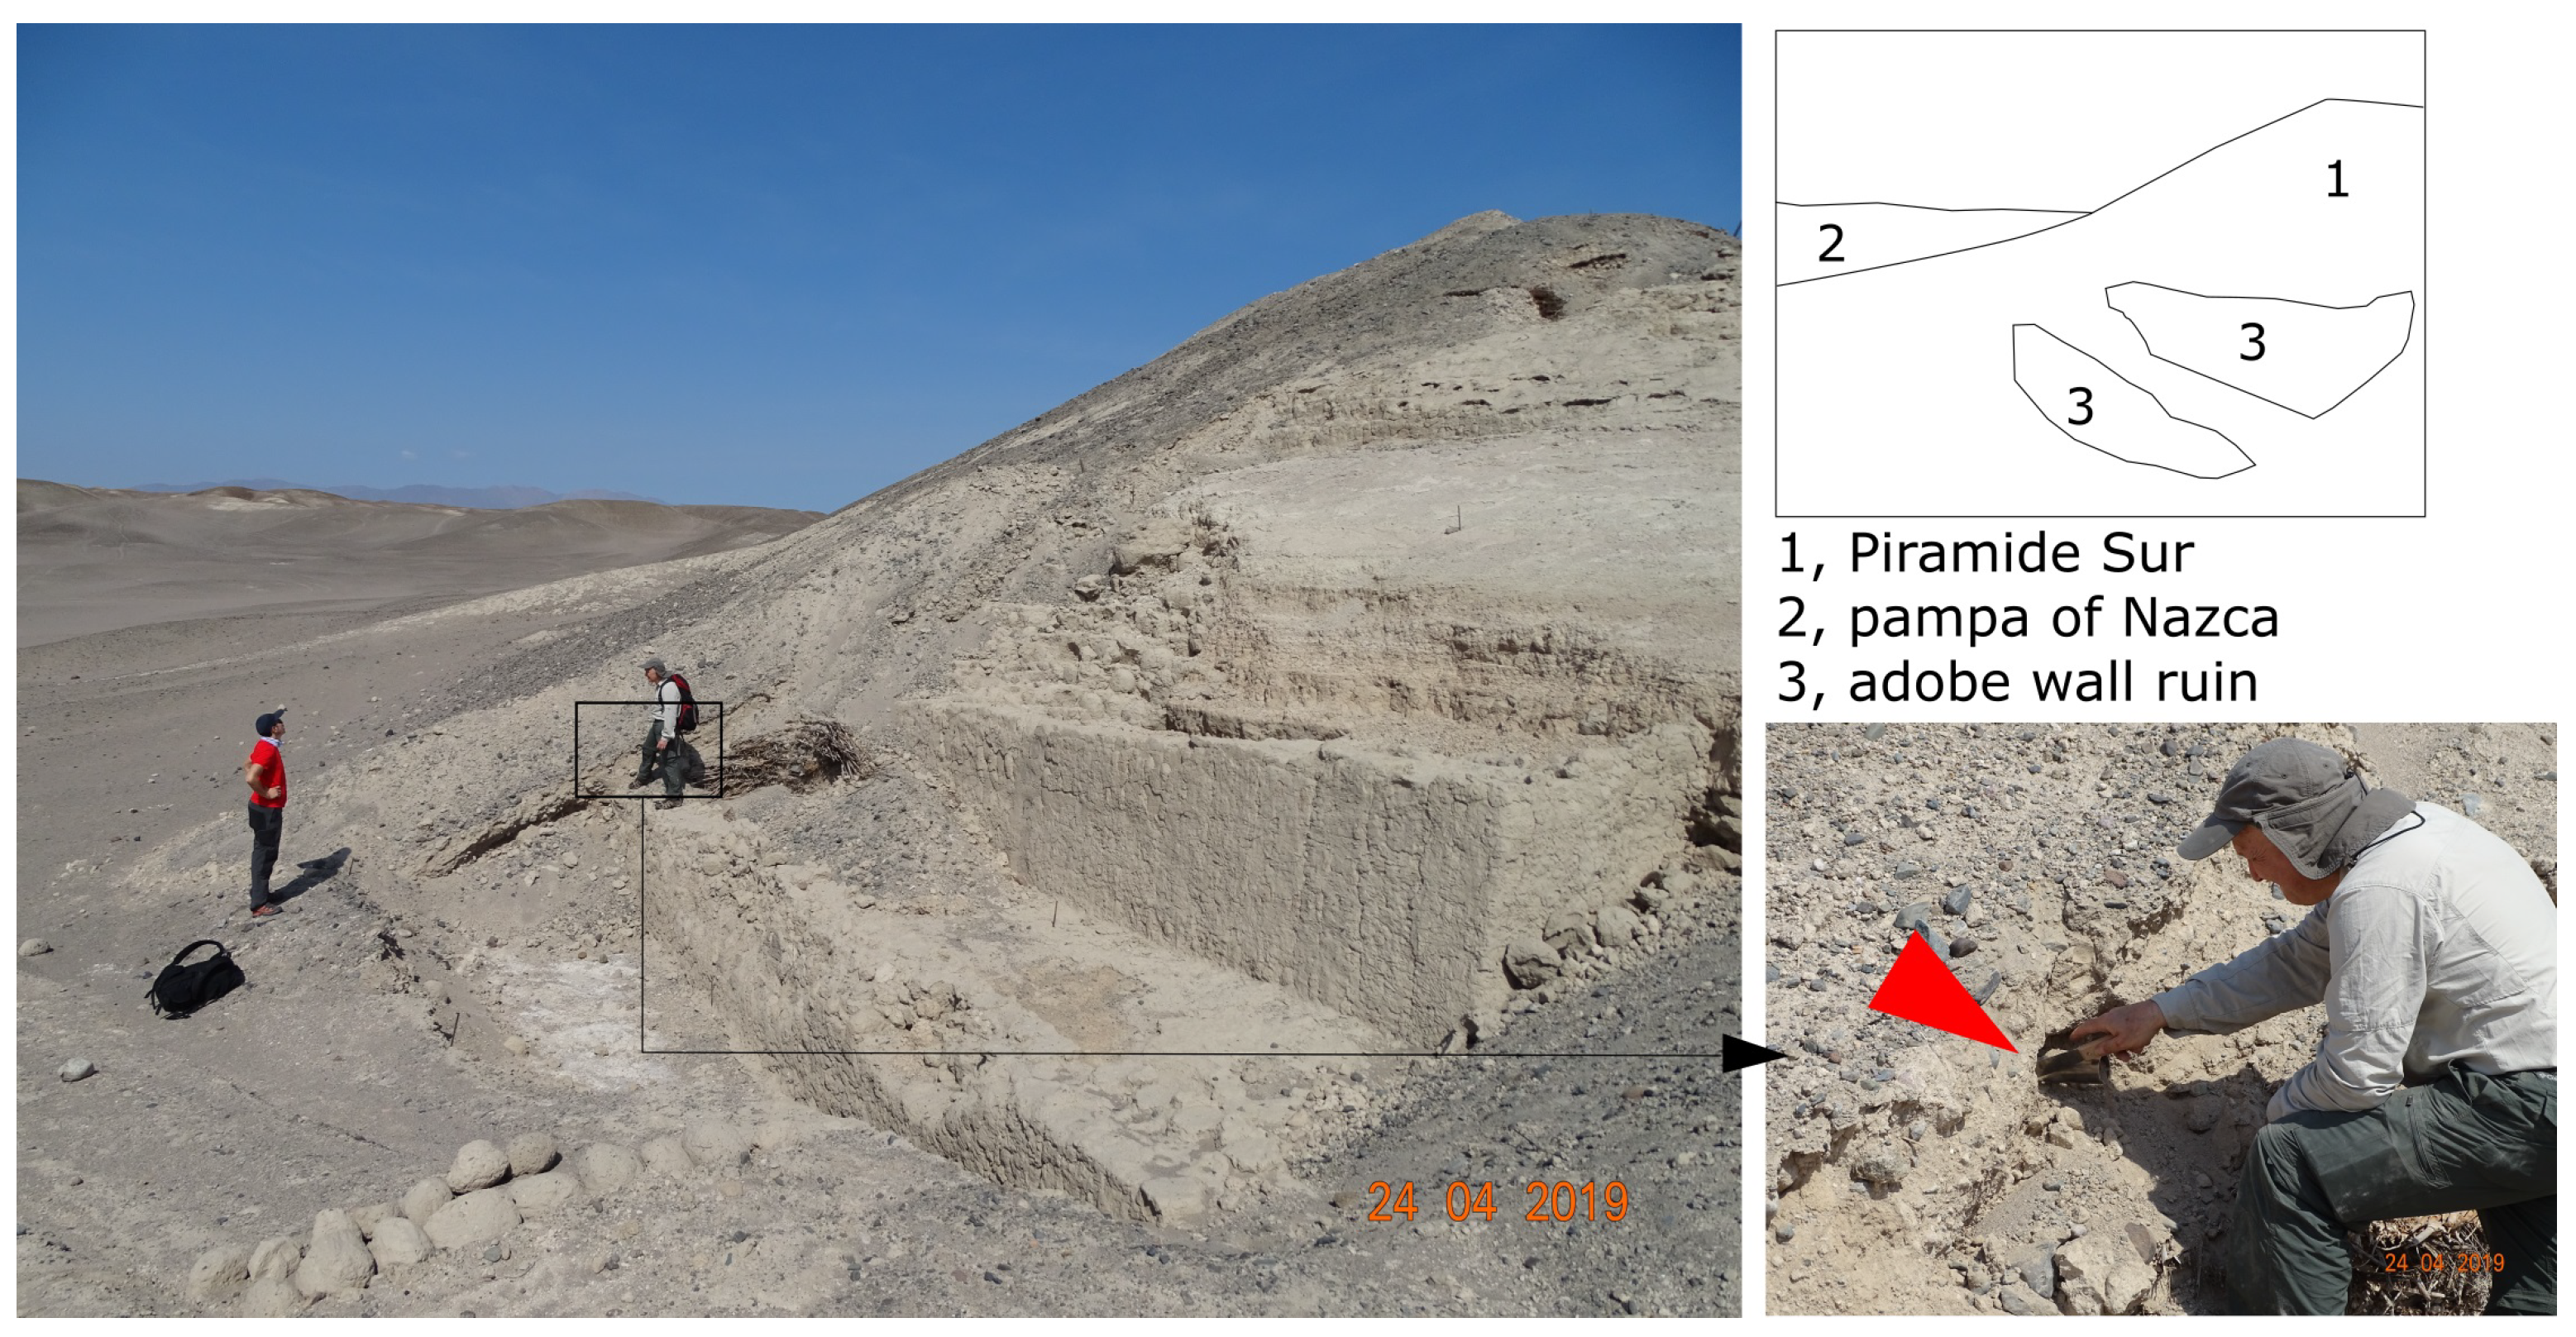
The section of the sampling point 3 coincides with the upper part of the composite section reconstructed in Figure 8 of Grodzicki (1990) [4]. According to this author, the top of this exposure is made up by the sediments produced during the 600 CE ENSO event. It is of particular importance for this study. The estimated elevation above the valley floor is about 17.5 m. From the bottom to the top, clast-supported gravel with inverse grading (Gci facies), cross-bedded sand (Sl facies), and clast-supported bedded imbricated gravel (Gh facies) occur in succession. The upper conglomerate layer determines the flat shape of the top of the mound. Next to the slope edge, above the alluvial deposit, the foundation of a weathered adobe wall is placed (Figure 4). The NZ11 sample (Table 1) was extracted from the Sl facies.

2.2.4. Sampling Point 4

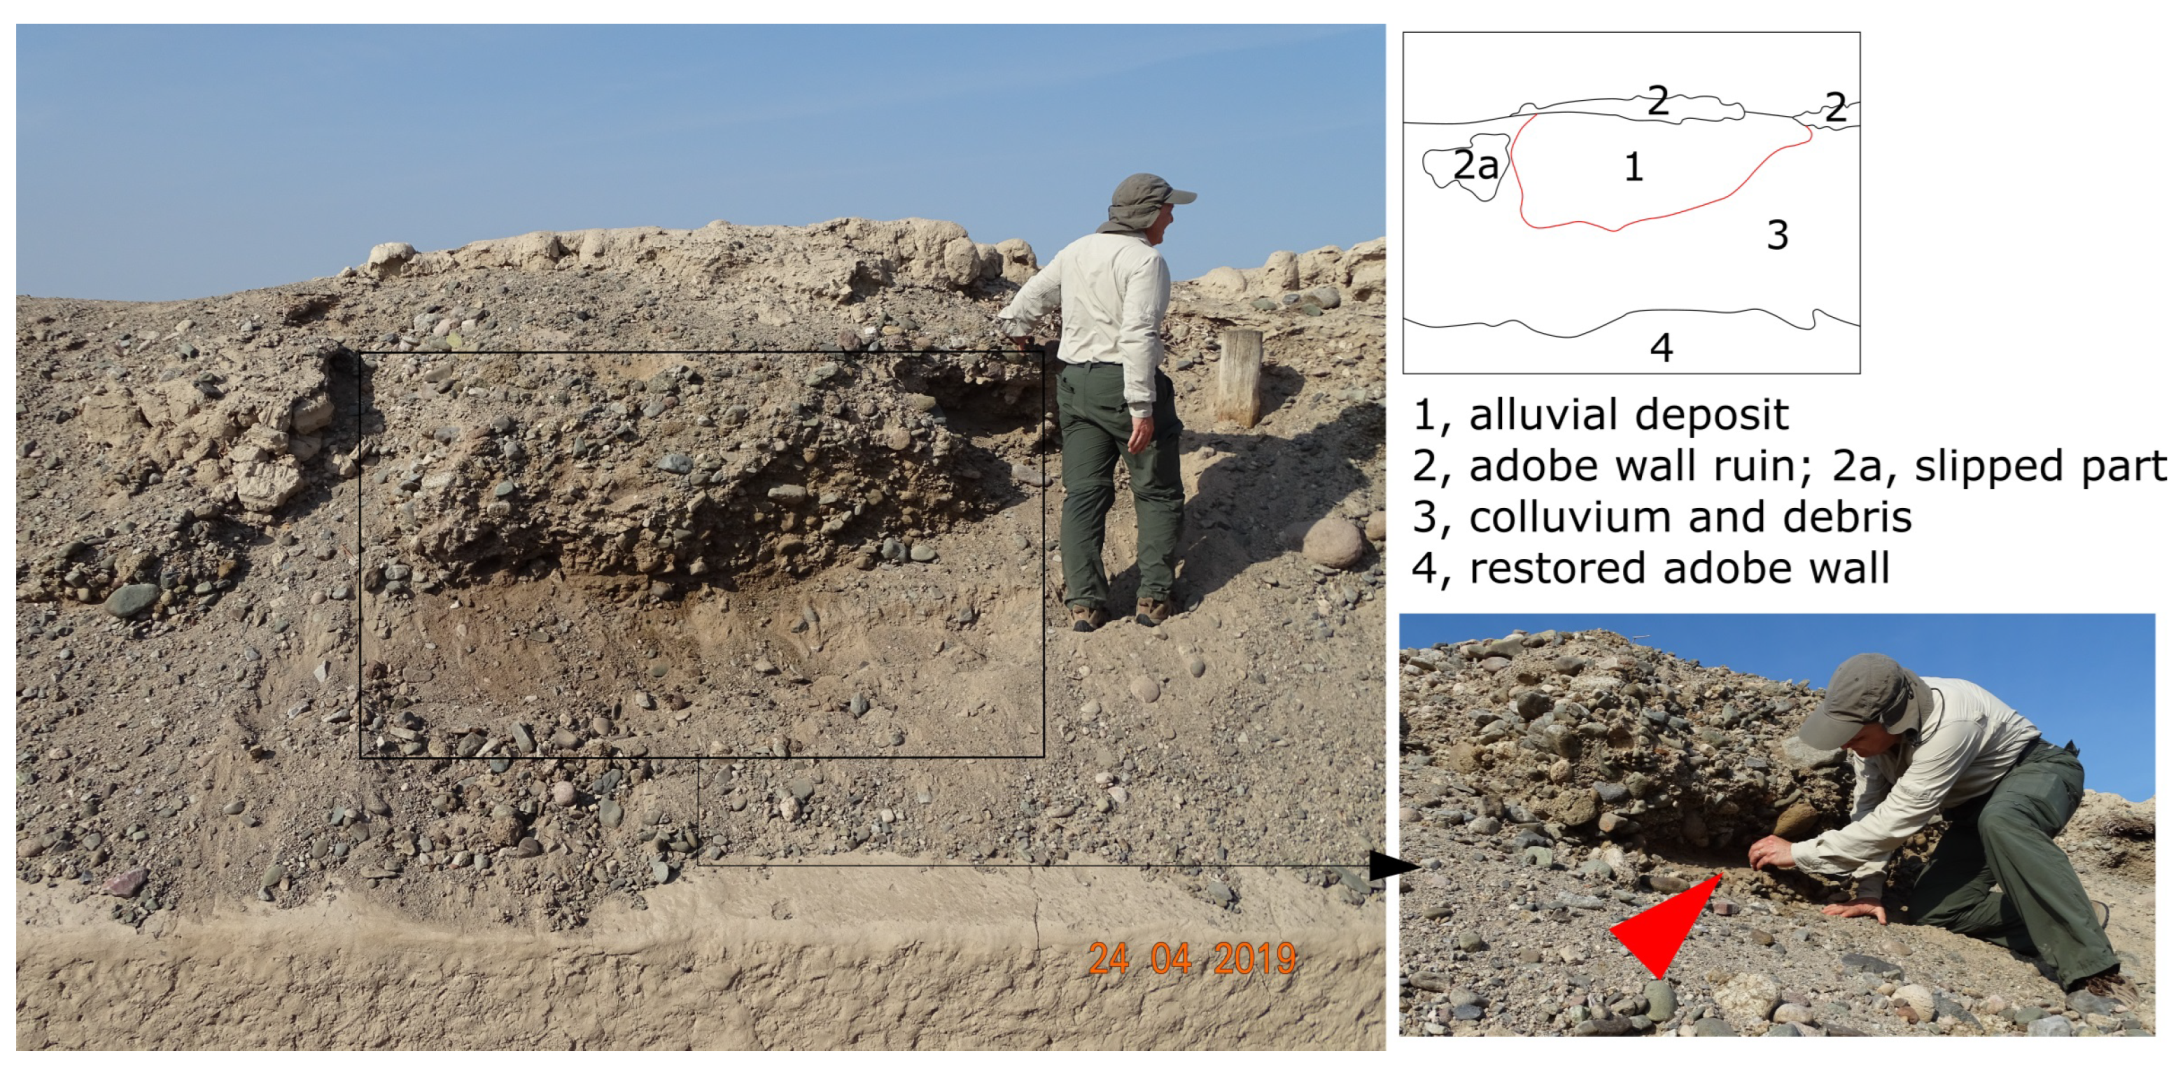
The exposure of the sampling point 4 coincides with the one described in Figure 5 of Grodzicki (1992) [5]. Its importance is crucial for this study because the author states that the deposition of the uppermost layer was caused by the 1000 CE ENSO event. The estimated elevation above the valley floor is about 40 m. From the bottom to the top of this section, faint laminated sand (Sm facies) and a tabular bed (about 1.2 m thick) of structureless poorly sorted clast-supported gravel (Gcm facies) occur in succession. The conglomerate apparently shaped the flat top surface of Gran Piramide temple. Its depositional characteristics are similar to the ones of analogous bodies observed inside the floodplain deposits (see Appendix A, Figure A3a). Above the tabular conglomerate, the foundation of a weathered adobe wall is placed (Figure 5); a small part of this wall (at the left in the figure) has slipped on the ground surface. The NZ1a sample (Table 1) was extracted from the Sm facies.
It must be noted that the alluvial bodies of the points 2, 3, and 4 are too small to be drawn in Figure 1 and, however, their mapping is beyond the scope of this work (see Section 1, Section 4.2).

2.2.5. Sampling Point 5

At the sampling point 5 (Figure 6), a finer-grained colluvium level containing charcoal fragments has been sampled (NZ3 sample, Table 1). The level is part of a layered colluvium and is covered by the youngest, coarse-grained colluvium at the top. In addition to the NZ3 sample for OSL dating, several charcoal fragments were gathered for radiocarbon dating. The sampled level has no visible relation to the adobe walls of Figure 6 (that belong to the "Piramide Sur" temple [28]), and was taken for comparison with the alluvial samples.
Summarizing the sampling collection for OSL dating, the samples NZ1a and NZ11 come from alluvial deposits ascribed to ENSO events by Grodzicki, while the samples NZ3, NZ7-8, and NZ16 were taken for comparison. For each sampling points, latitude, longitude, and an approximated value of altitude extracted from Google Earth are reported in Table 1.

2.3. Grain-Size and Mineralogical Features
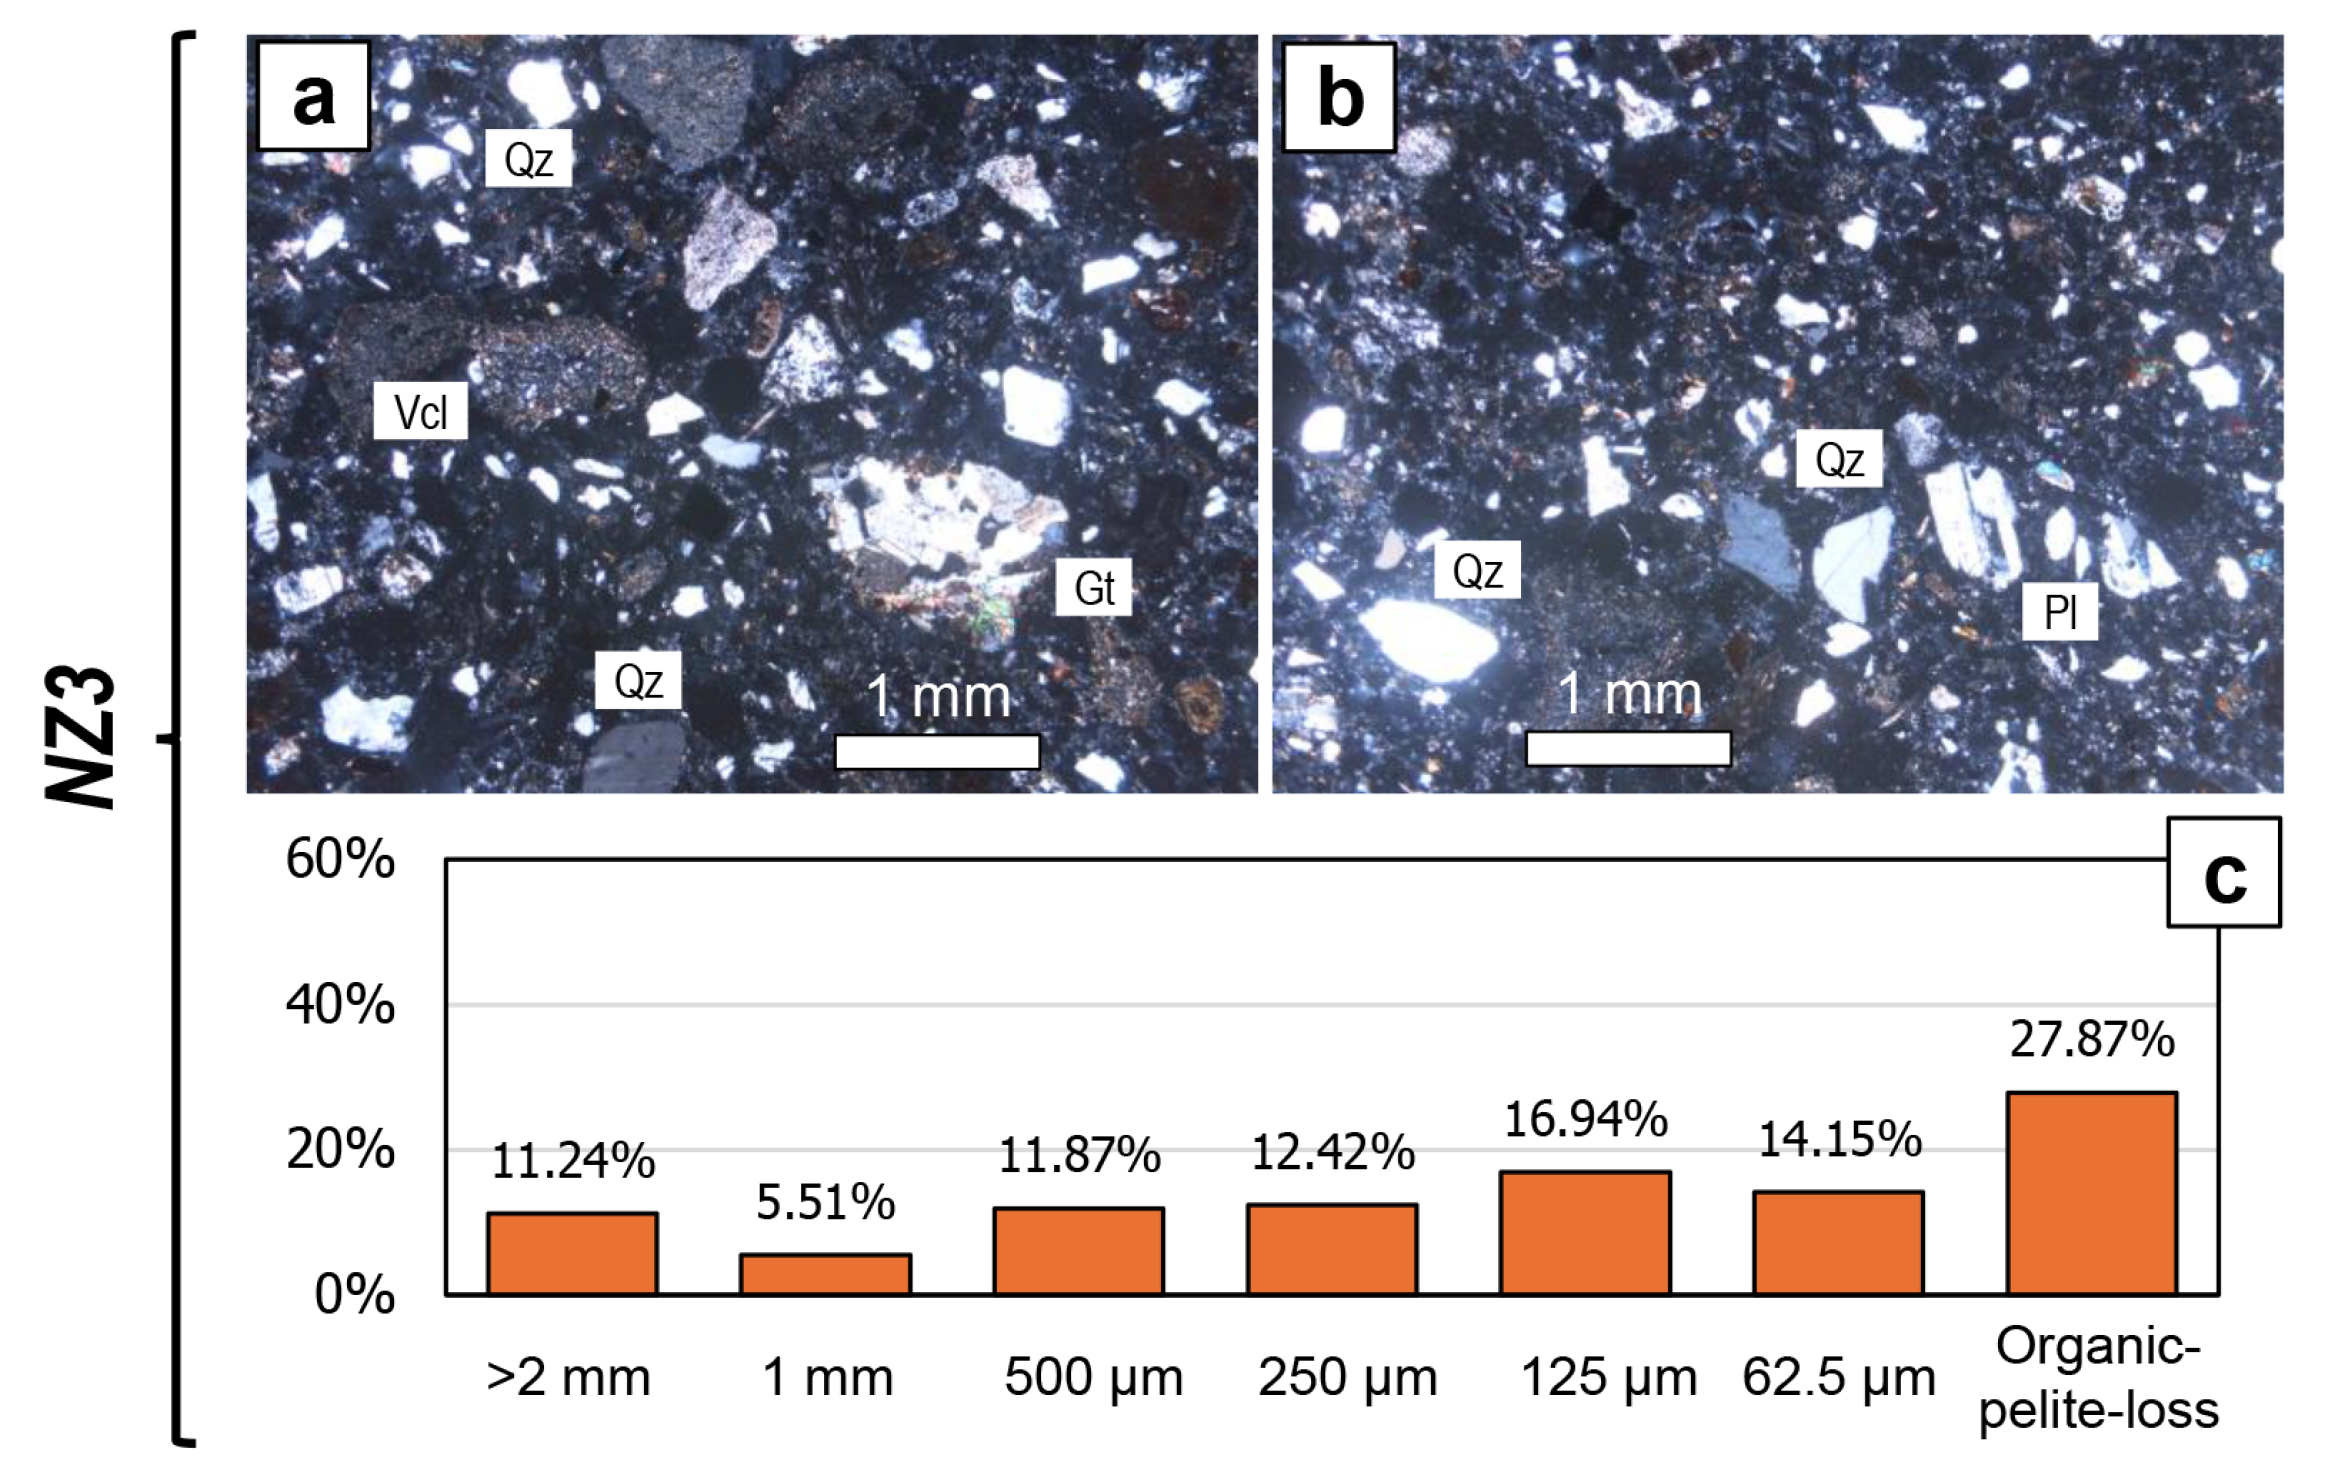
The grain-size of the sediment samples for OSL dating was determined through dry sieving at 2 – 1 – 0.5 – 0.250 – 0.125 and 0.625 mm. Organic fractions were eliminated as much as possible, the remaining amount of the organic components were however considered as a sum with pelite-loss. Thin section mineralogy and texture were determined though a polarized light optical microscope (one polarizer only and crossed nicols). They are medium- to fine-grained sands whose grainsize variations are shown below.
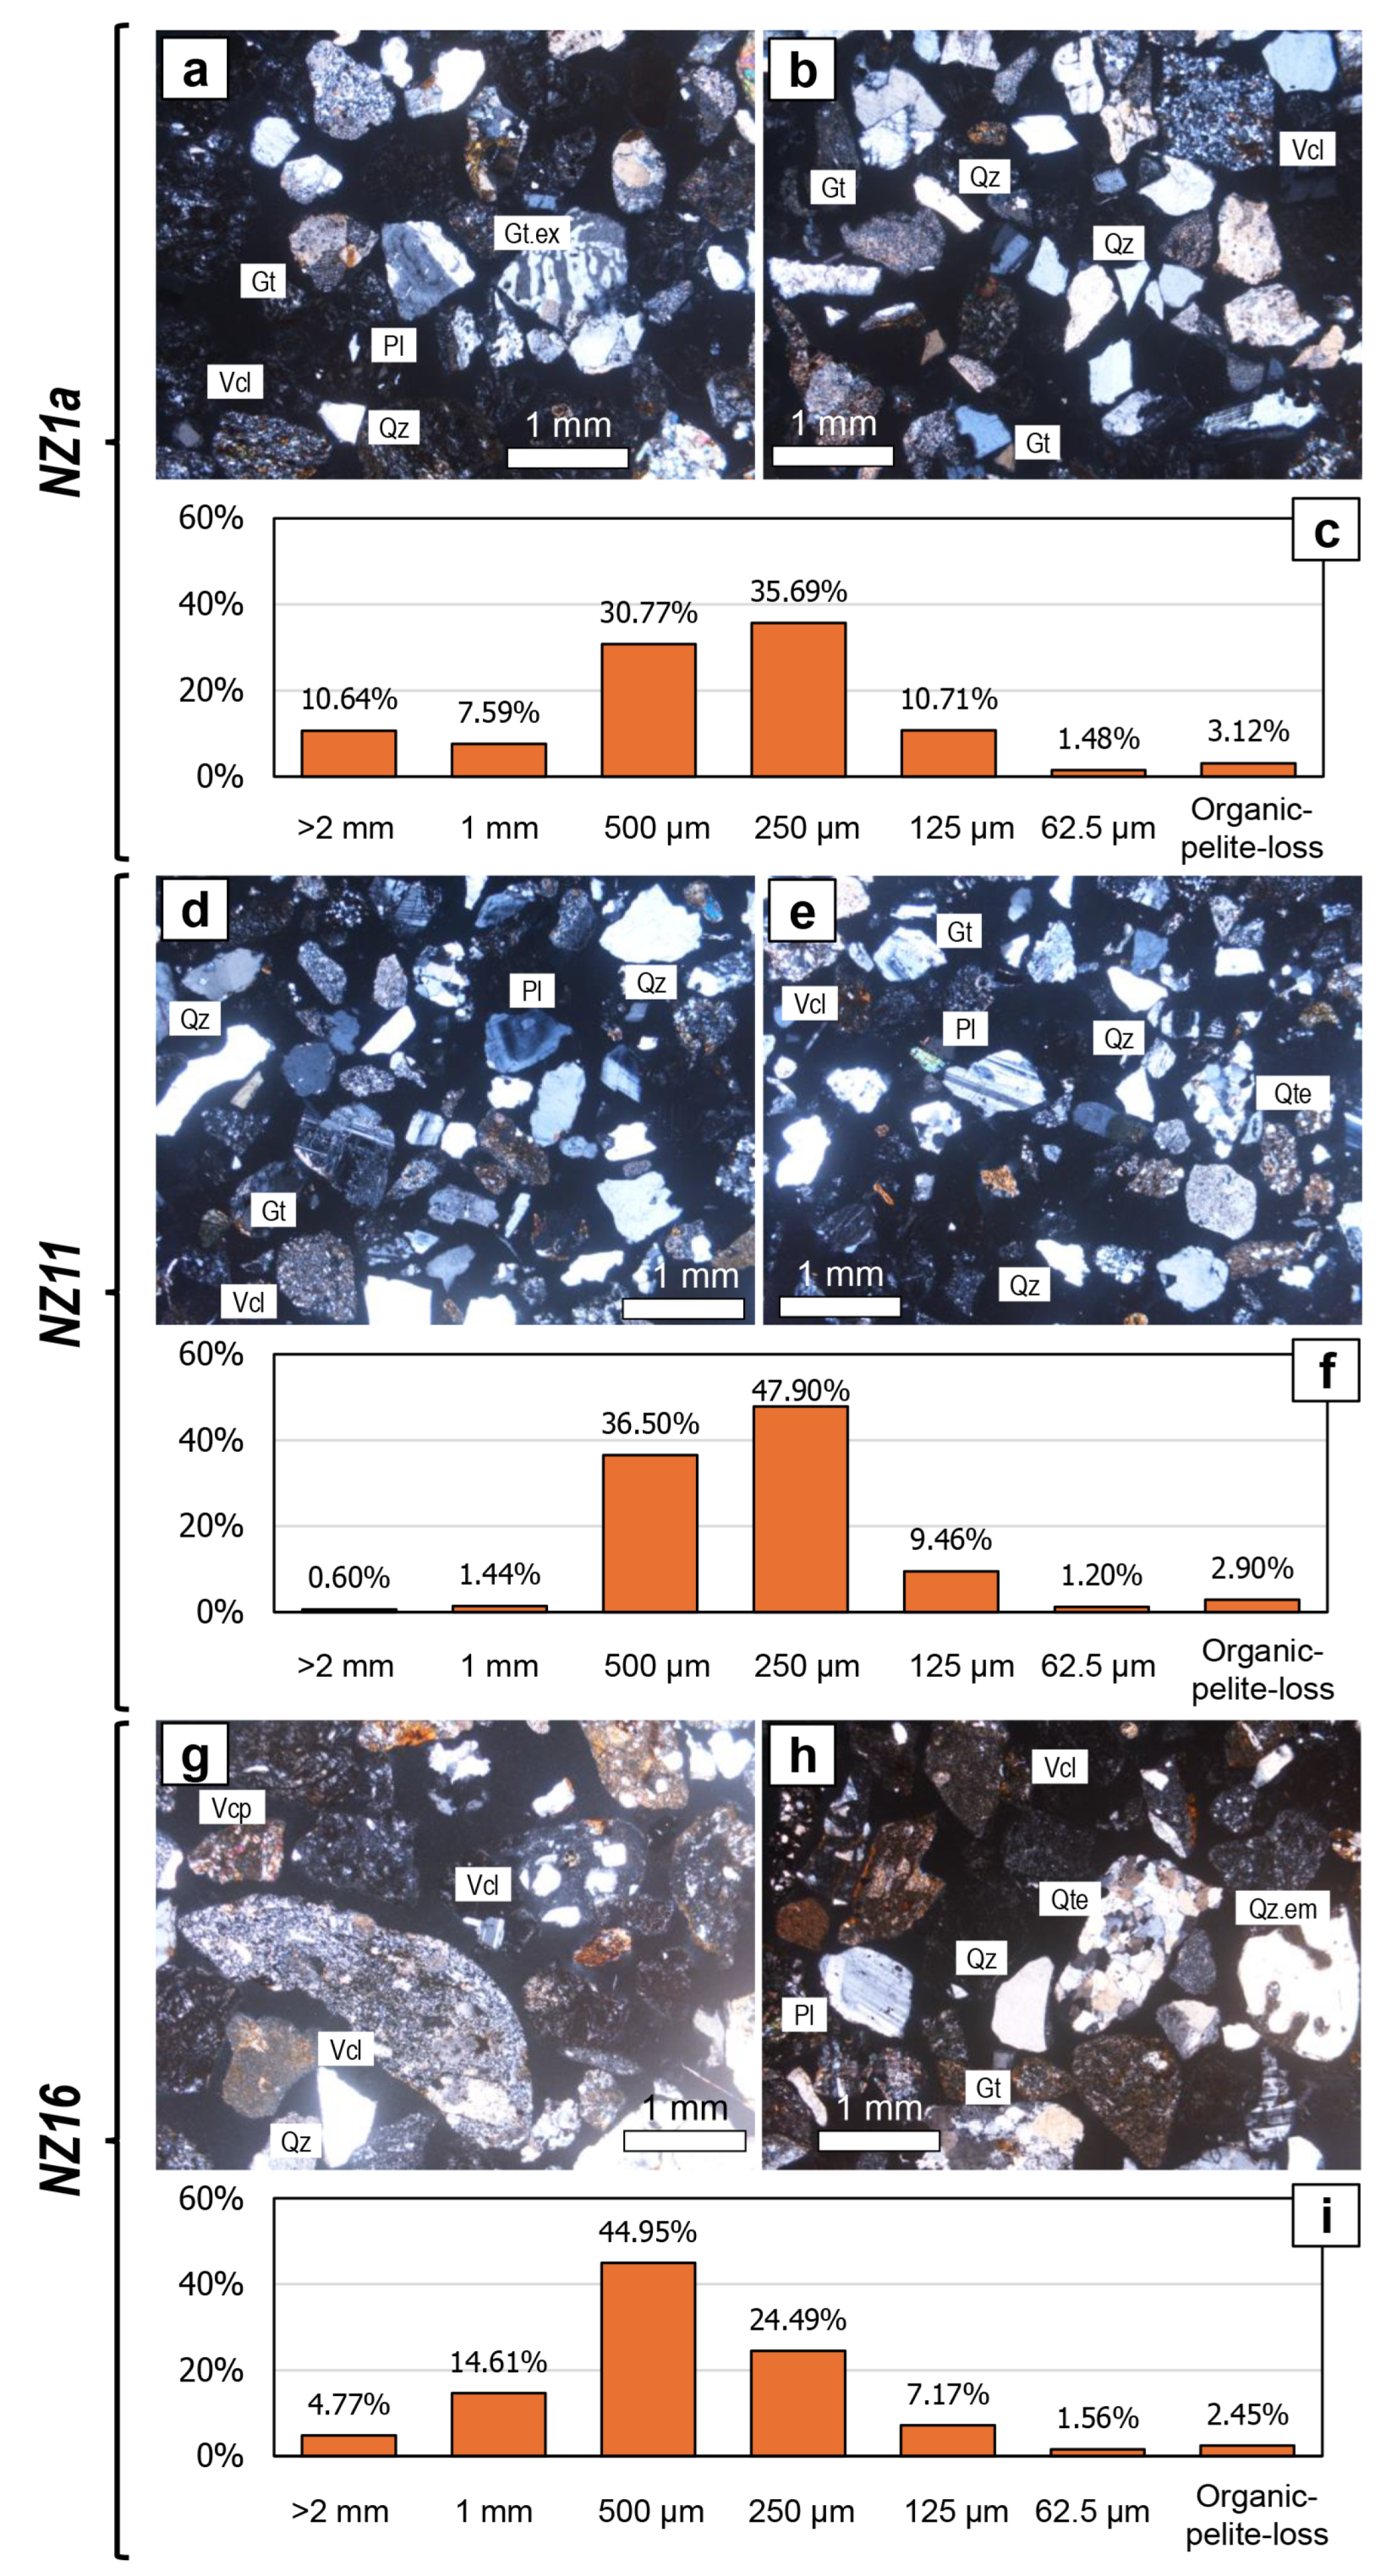
NZ1a, NZ11 and NZ16 samples are mostly unimodal medium-grained sands with the grains interval component <2 mm - 125 microns comprised between 84.8 and 95.3 wt.%. The modes of these samples are represented by <500 - 250 microns (NZ1a: 35.7 wt.%; NZ11: 47.9 wt.%) or <1 mm - 500 microns (NZ16: 44.9 wt.%). Thin section observation of these three samples highlighted quartz, plagioclase and k-feldspar crystals in decreasing order of abundance. Mafic minerals (pyroxene, amphibole and micas) are rare. Among the lithic component both intrusive (mostly granitoid rocks often with subsolidus exsolution textures such as perthite/antiperthite/mirmechyte) and extrusives (mostly rhyolites/dacites lavas and pyroclastics and subordinate andesites) are well represented (Figure 7) with both micro-cryptocrystalline to glassy groundmass. Due to devitrification processes, spherulitic texture are common among the volcanic lithotype grains. Metamorphic lithologies mainly consist of grains of quartzites and feldspathic quartzites (often with triple junction equilibrium texture among the quartz grains) and subordinate schists. Arenites and siltites represent the main sedimentary lithotypes. Most of the crystals and lithics of these three samples are sub-angular to slightly rounded thus emphasizing a low to medium degree of textural maturity.
Mineralogy of the sample NZ3 is very similar to that of the three samples described above, both concerning crystals and lithics (Figure 8) as well as their roundness. However, this sample is characterized by a finer sandy grainsize. The wt.% fractions are uniformly distributed among the sandy components (comprised between 5.5 wt.% for >1 - 2 mm and 14.1 wt.% for >62.5 - 125 microns), with no distinct modes. The most abundant fraction is represented by the organic and pelite-loss (27.9 wt.%) and the component >2mm is 11.2 wt.%.
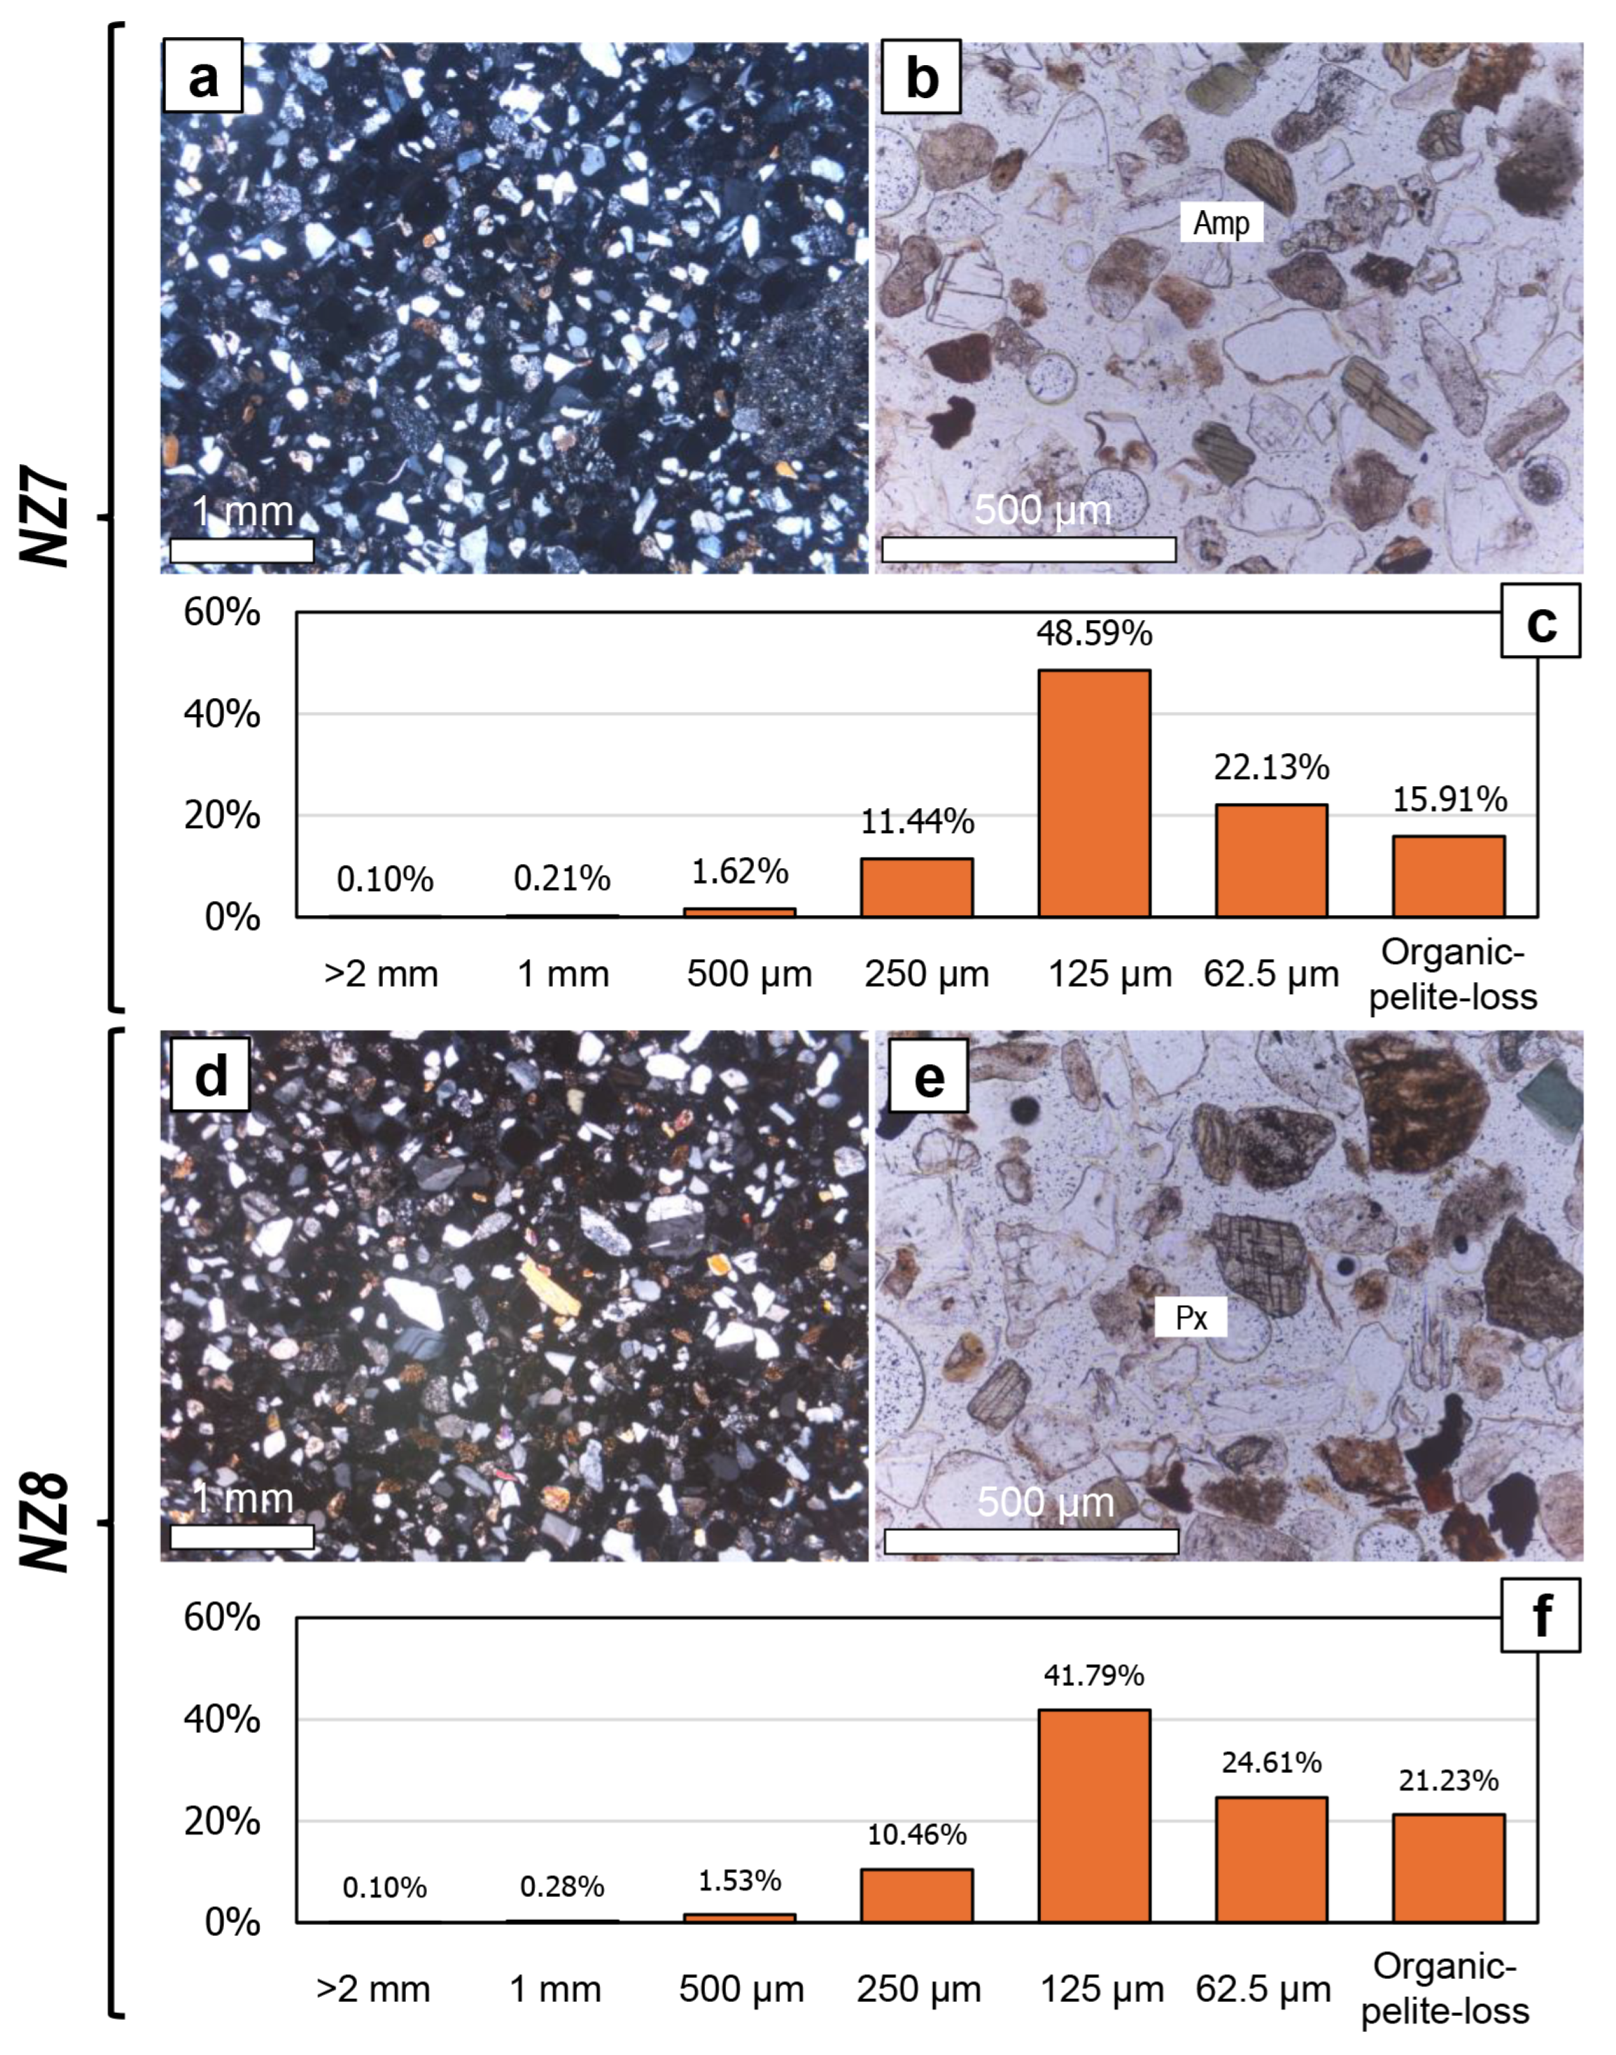
NZ7 and NZ8 sediments are unimodal fine-grained sands, with the grains interval component <500 - 62.5 microns comprised between 76.9 and 82.2 wt.% (Figure 9). The fractions < 62.5 microns are comprised between 15.9 wt.% (NZ7) and 21.2 (NZ8). Also these two finer grained sediments show the same crystal phases and lithic lithologies distribution already described for NZ1a-NZ11-NZ16 and the same degree of textural maturity, however with a clear enrichment in the mafic components, mainly pyroxenes and amphiboles (cf. Figure 7).
Figure 8. Thin section photos (Crossed Nicols, a, b) and grainsize distribution in weight % (c) of NZ3 sample. Abbreviations of minerals and lithothype grains: Qz = quartz; Pl = plagioclase; Vcl = volcanic (mainly lavas); Gt = granite lithotype grain.
Preprints 120842 g008
Figure 9. Thin section photos (Crossed Nicols: a, d; one polarizer light: b, e) and grainsize distribution in weight % (c, f) of NZ7 and NZ8 samples. Abbreviations of minerals: Amp = amphibole; Px = pyroxene.
Preprints 120842 g009

2.4. Analysis Methods Description

2.4.1. OSL Dating

OSL can estimate the time elapsed since buried sediment was last exposed to daylight (Huntley et al., 1985; Aitken, 1998) [29,30]. It is based on the measurement of the charges trapped in mineral grains like quartz and feldspars since the time of the sediment deposition, as a consequence of the irradiation due to the natural radioactivity field. The burial age is estimated by dividing the equivalent dose ( D e , a measure of the radiation energy absorbed by grains during their period of burial) by the environmental dose rate (the rate of supply of ionizing radiation to the grains over the same period). One of the most widely adopted procedures for measuring D e values from quartz OSL signals is the single-aliquot regenerative dose (SAR) procedure (Galbraith et al., 1999; Murray and Wintle, 2000; Wintle and Murray, 2006 [31,32,33]).
The alluvial sediment samples were dated with OSL at the Lambda laboratory (Laboratory of Milano Bicocca University for Dating and Archaeology, Department of Materials Science) [34]. In laboratory, sediments from the middle of the sampling tubes were used for OSL measurements to avoid the light-exposed ends that instead were used for the determination of dose rates. Sample preparation and OSL measurements were carried out under subdued red-light conditions. Quartz grains of 180–250 μ m were obtained from each sediment sample using routine preparation procedures, including treatment with 37% HCl and H 2 O 2 solutions overnight, followed by dry sieving and etching in 40% HF to remove any feldspar contamination and the alpha-irradiated outer layer of each grain [30]. The etched grains were rinsed in HCl acid to remove precipitated fluorides, sieved again, and then mounted on stainless-steel discs using silicon oil. The purity of the quartz samples was checked by stimulating the aliquots with IR light after laboratory dosing (OSL IR depletion ratio test; Duller, 2003 [35]). The D e were calculated using the arithmetic mean for the samples showing a Gaussian distribution of the D e estimated on the individual aliquots analyzed, indicating complete bleaching of the sample before burial.
If the bleaching is incomplete, the age will be overestimated, and the dose distribution will be different from a normal distribution. Small aliquots were prepared because it has been demonstrated that in poorly bleached samples, a small aliquot performs as well as single grains for obtaining a model age (Faershtein et al. 2016; Medialdea et al. 2014) [36,37], allowing the use of Minimum Age Model (MAM) or Finite Mixture Model (FMM) on the data [31].
The minimum age limit for luminescence dating is influenced by the OSL sensitivity and the detection limit of the OSL signal in relation to the background. The upper age limit is controlled by saturation of the luminescence signal, with the saturation level differing between samples.
OSL measurements and D e determinations were made using the SAR procedure and were performed with a Risø TL/OSL DA20 reader. Quartz luminescence were stimulated by blue LEDS (470 ± 30 nm, 54 mW/cm2) and the emitted photons were detected with an EMI 9235QB photomultiplier coupled with a UV filter (7.5 mm Hoya U-340). Samples were stimulated for 40 s at 125°C and the pre-heat value was experimentally derived on the basis of the results of a dose recovery pre-heat plateau test. The first 0.6 s of OSL decay was used for D e determination and the mean count recorded over the last 10 s was subtracted as background. Irradiations were made using 90Sr/90Y beta sources (5.50 GBq, dose rate: 0.11 Gy/s for 180-250 μ m grains).
In order to calculate the annual dose, the Th and U concentrations of the sediments were measured with total alpha counting using Zn scintillator discs [38], assuming a concentration ratio Th/U equal to 3.40 K content was deduced from the total concentration of K measured with flame photometry.
Attenuation of the beta dose was taken into account [39]. In calculating the dose-rates, it was assumed that the average water content over the entire burial period was about 30% of the content at saturation due to the relatively dry condition of the site.

2.4.2. Radiocarbon Dating

A charcoal sample (Laboratory Code LTL21547) taken at the sampling point 5 (Section 2.2), was submitted to radiocarbon dating by AMS (Accelerator Mass Spectrometry) at the Centre of Applied Physics, Dating and Diagnostics (CEDAD)-Department of Mathematics and Physics, University of Salento, Lecce, Italy [40]. The sample underwent a chemical processing consisting of alternate Acid-Alkali-Acid (AAA) attacks in order to remove any source of contamination. Purified sample material was then sealed in evacuated quartz tube together with copper oxide and silver wool and combusted to carbon dioxide at 900°C for 8 hours.
Extracted carbon dioxide was then cryogenically purified and catalytically reduced to graphite by using H 2 as reducing agent and iron powder as catalyst [41]. The obtained graphite (∼1 mg) was then pressed into an aluminum sample holder of the AMS system where the 14C/12C isotopic ratio was measured. The conventional radiocarbon age was then calculated from the 14C decay law after correction for isotopic fractionation and machine and processing blank [42]. The measured radiocarbon age was finally calibrated to calendar one by using the last internationally accepted calibration curve (INTCAL20) and the OxCAl ver. 4.3 Calibration software.

3. Results

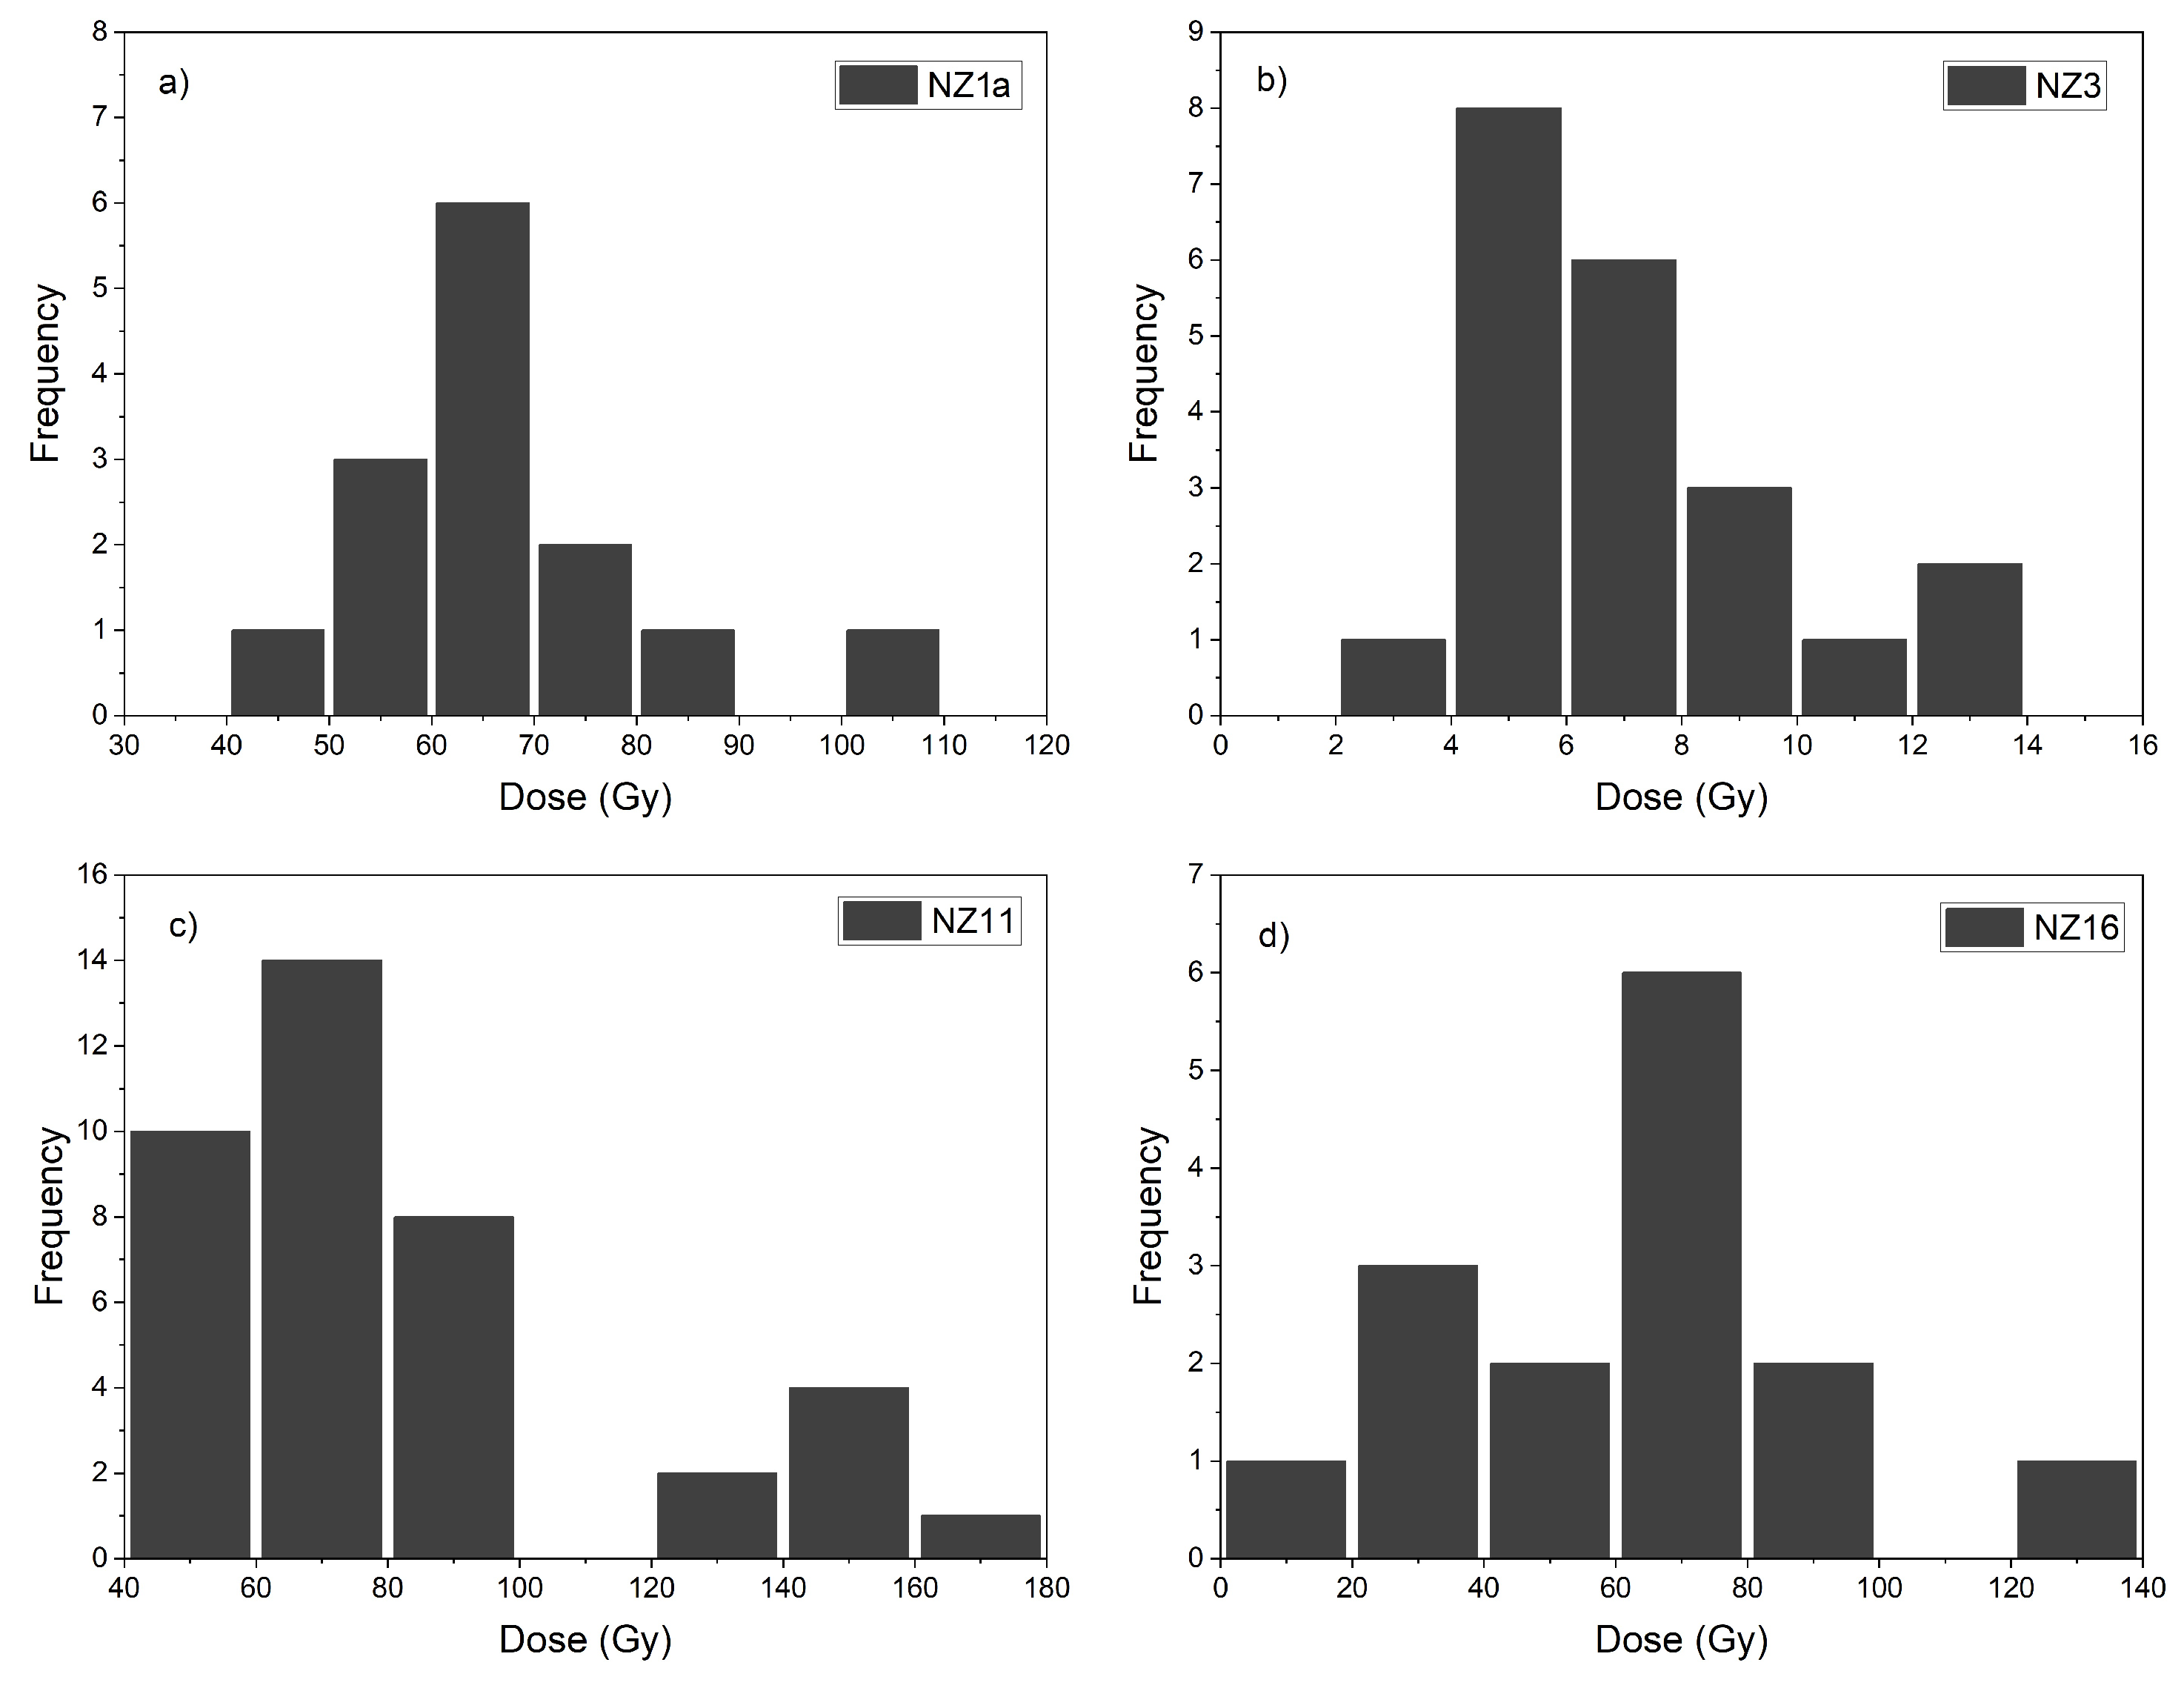
The OSL dating results are reported in Table 2. In Figure 10 the D e distributions obtained on the sediments are shown.
The D e of NZ1a sample was near to saturation; therefore the age obtained on this sample can only be considered a minimum age. The OSL signals of the NZ7 and NZ8 samples, however, are very low, at the limit of the minimum detection limit of the instrument. For this reason it was not possible to determine their D e and therefore their ages. D e distribution of sample NZ11 instead shows a double distribution (Figure 1c). Most likely its luminescence was not completely erased before deposition or older sediments were incorporated by post-depositional mixing. In this case the D e was calculated using the FMM statistical models using a two components fitting. Two possible dates were calculated.
Despite the above problems, the estimated dates for the sampled alluvial deposits (column Age in Table 2) appear to be substantially consistent with the sampling profile (Table 1). The age of NZ16 sample (taken at the top of the floodplain deposits; see sampling point 1) is around 19 ky BP and predates those estimated for both the NZ11 and NZ1a samples. NZ11 sample (taken 17.5 m above the valley floor; see sampling point 3) gives two possible age of 23–26 and 47–59 ky, respectively. The dating of NZ1a sample (taken about 40 m above the valley floor; see sampling point 4) results in a minimum age of 23–27 ky BP.
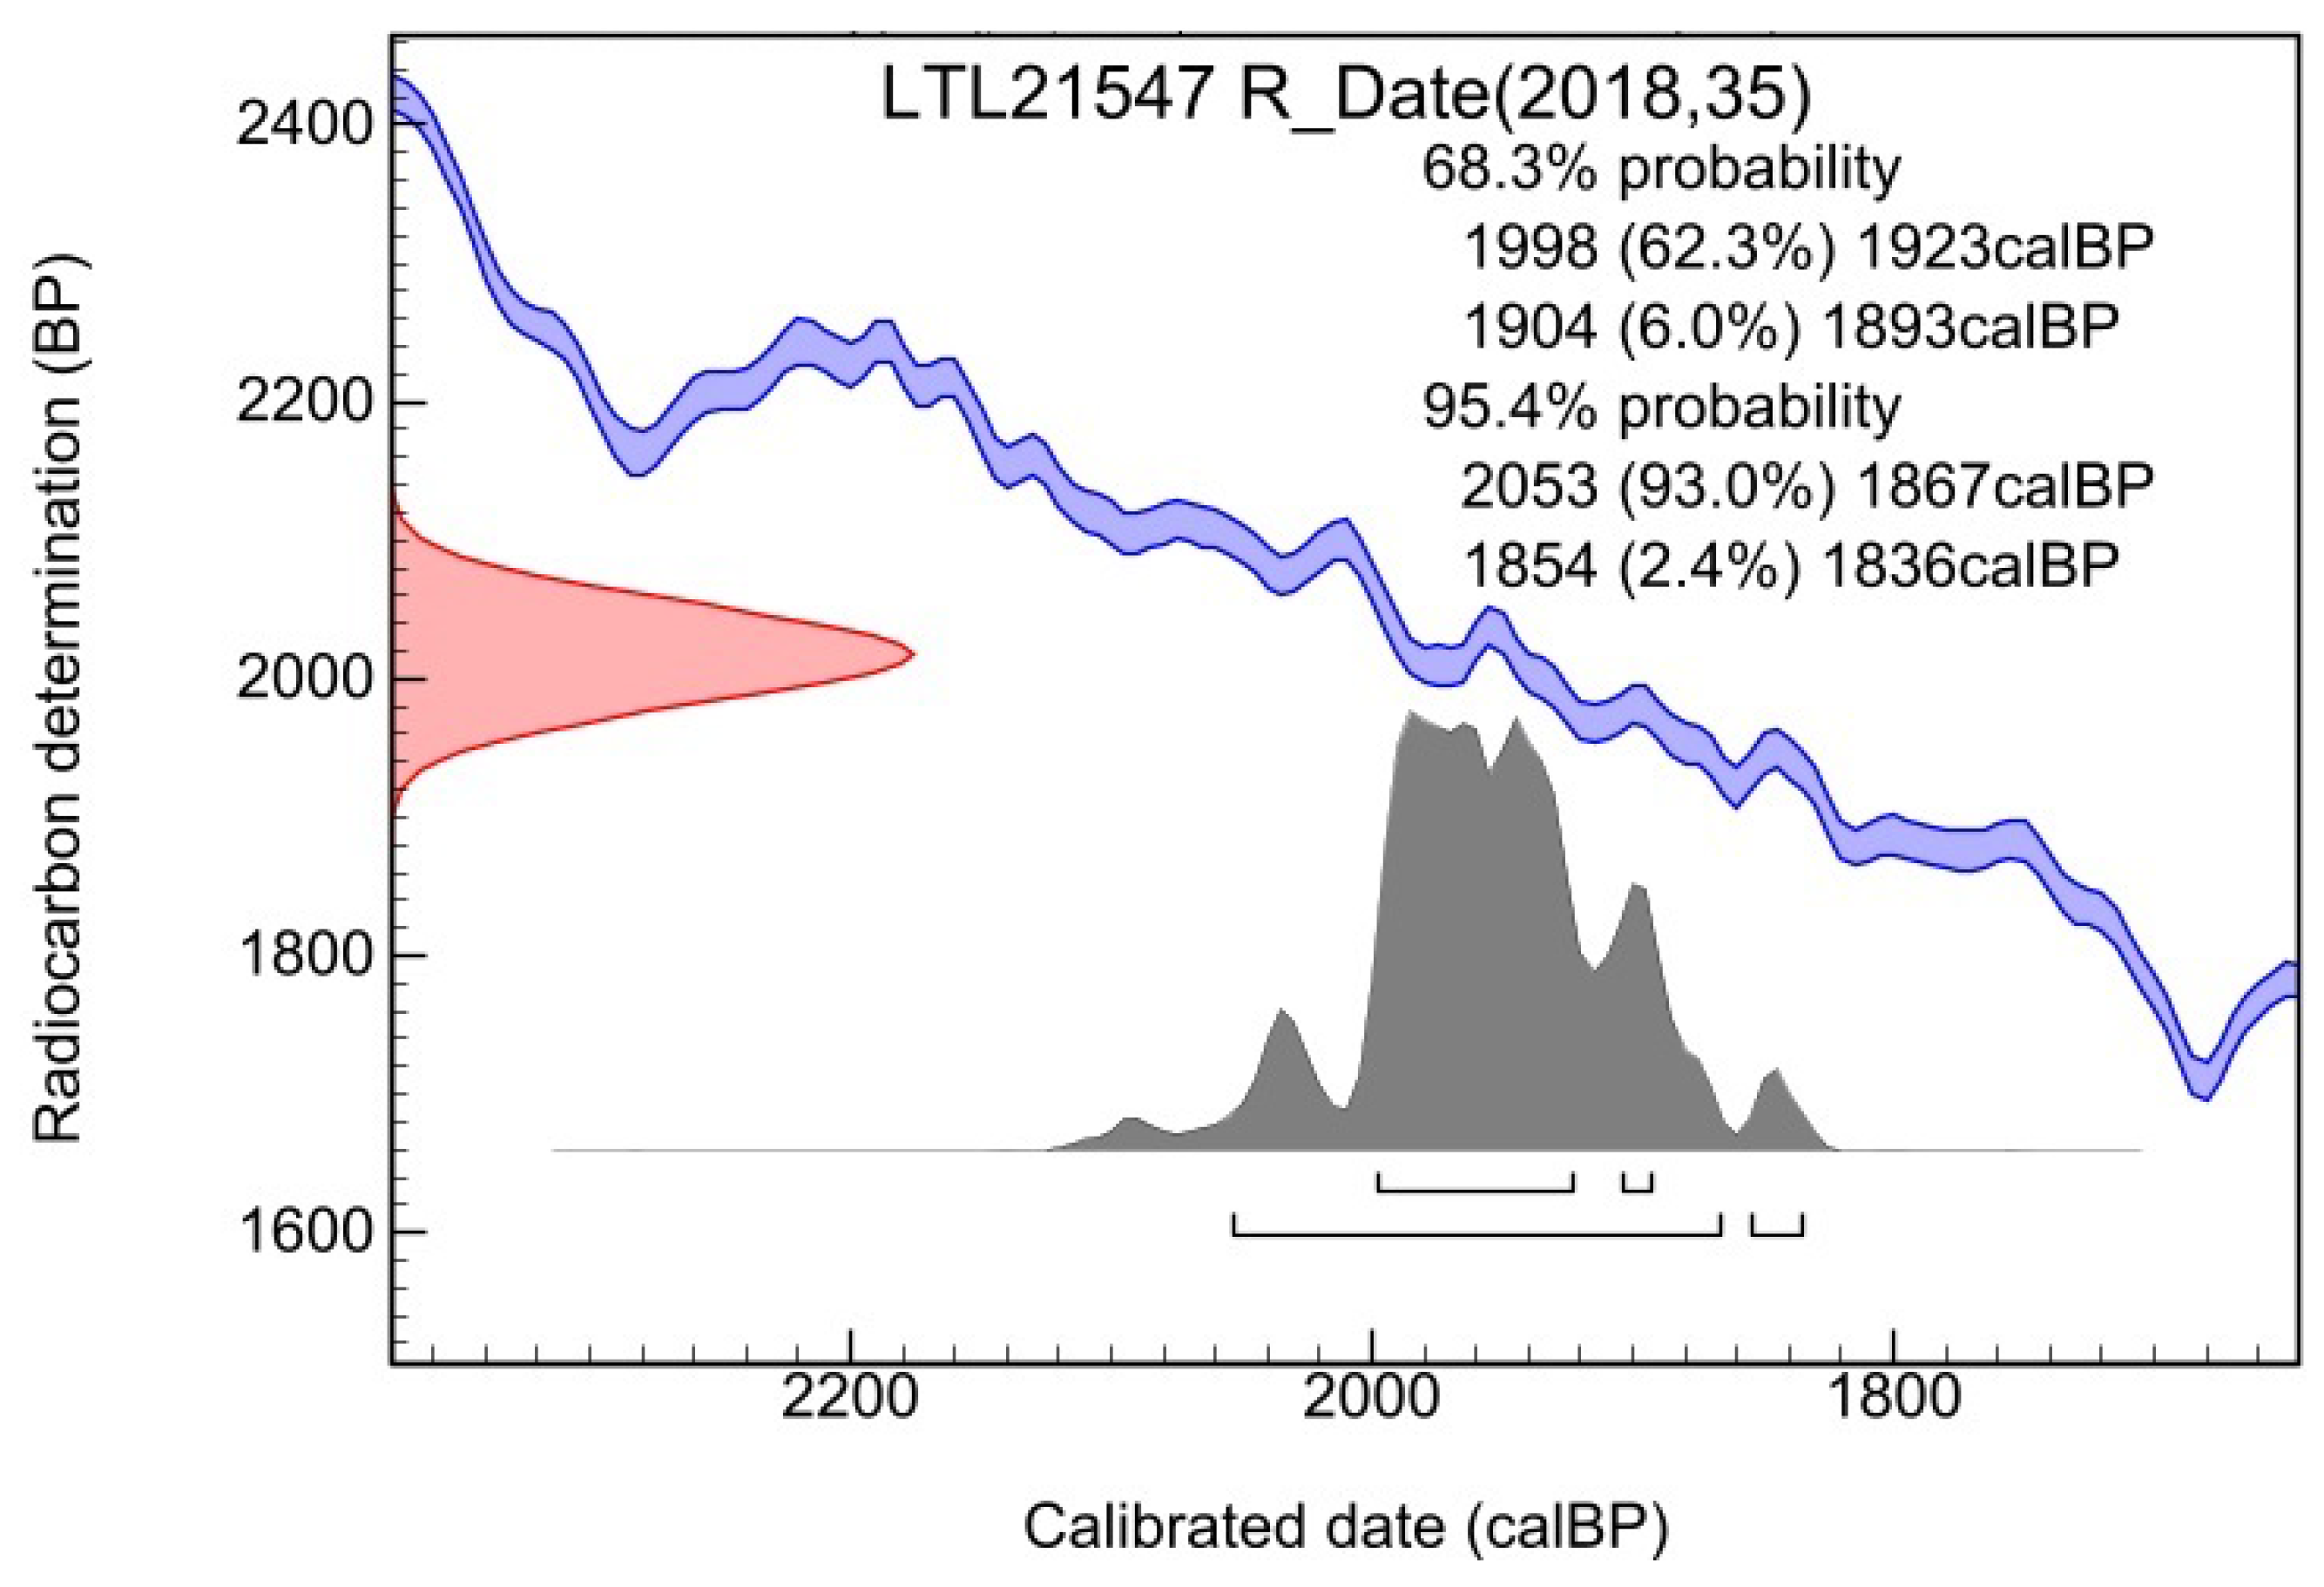
The OSL age obtained on NZ3 sample (natural colluvium; sampling point 5) is around 2.3 ky BP (Table 2). This dating matches the calibrated radiocarbon age of 1960 ± 93 BP (before the present: 1950 CE; conventional radiocarbon age: 2018 ± 35 years BP; see Figure 11) of the examined charcoal sample (Section 2.4.2), which was determined with a confidence level of two standard deviation.

4. Discussion

Luminescence dating in Peru faces methodological challenges, particularly with the OSL signal from quartz. Studies show that this signal can be unreliable for coastal fluvial sediments due to a thermally unstable medium component of the OSL signal [43] that caused the underestimation of the OSL ages. This fact leads the researchers to prefer post Infrared-Infrared Stimulated Luminescence (pIR-IRSL) dating of K-feldspar [44,45,46]. While some studies report reliable quartz OSL ages in the Andes and Amazon [47,48], inconsistencies exist, prompting the use of K-feldspar in problematic cases. Furthermore, challenges in effectively bleaching sediments complicate K-feldspar dating due to daylight exposure issues and an unbleachable component.
In our case study, to check the stability of the medium OSL quartz component, the D e (t) plots of the samples [49,50] were obtained. While for ideal sample D e should not depend on signal integration interval, a falling D e value towards the later intervals may indicate an unstable medium component [51]. Samples NZ1a, NZ11 and NZ16 show a trend of the D e that does not vary with the increase of the integration interval used for the D e calculation (see Figure A5a in Appendix B), indicating that the medium OSL component is thermally stable. Their OSL ages are indeed reliable. Only sample NZ3 shows a decreasing D e (t) (Figure A5b) but the date obtained with OSL is in agreement with that obtained with radiocarbon (Section 3). This excludes that the presence of an unstable medium OSL component could lead to an underestimation of the age for this sample, as reported in some cases in literature [43,46].

4.1. Evaluation of the Catastrophe Hypothesis of Grodzicki

Grodzicki [4,5,6] reconstructs three catastrophic river floods and heavy rains around 100 BCE, 600 CE, and 1000 CE, respectively, which the author claims to be the result of as many ENSO events. These events, would cause the deposition of widespread thick conglomerates made up by debris flows and alluvial deposits. The first conglomerate would be the base of the Holocene succession (cf. Figure A1d and Figure A3d) and would not have affected archaeological structures ([6], pp. 95–96). Differently from the former, Grodzicki states the second event severely damaged the adobe constructions of Cahuachi, abruptly changed the surrounding landscape features, and finally caused the abandonment of the ceremonial center and the end of the Nasca theocracy ([6], pp. 96–97). But that time Cahuachi, as noted by Silverman and Proulx [7] "had ceased to function as the great early Nasca ceremonial center". Again, considering “the good state of preservation of geoglyphs, even where they cross valleys or erosion rills”, also Eitel et al., 2005 [8] "disagree with ideas that catastrophic El Niño events destroyed the Nasca Civilization".
The disagreement of the above authors appears even more justified considering the landscape impact which would have caused the third hypothetical catastrophe. According to Grodzicki, around 1000 CE "the largest cataclysm that occurred on the Nazca plateau at the end of the Holocene" ([6], p. 98) would have produced such a quantity of sediments as to "cover the entire area of the ceremonial center [...] burying the monuments of the same, of which some ruins have remained. This effect is seen, in particular, in the Gran Piramide, which dominates the river valley" [5], p. 122. However, in coastal Peru adobe buildings deteriorate within a few decades because of the scarce rain and moisture, and their conservation is a crucial issue in pre-Columbian sites for cultural tourism [52]. If the adobe buildings of Cahuachi had been hit by such a catastrophe, they would have been lost. Differently, they are usually preserved under thin layers of colluvium [3].
A crucial point of the catastrophe hypothesis of Grodzicki, is a supposed younger age of the geoglyphs in comparison with the one of the Cahuachi temples [5]. However, several studies have shown that the Nazca Lines were constructed up to 650 CE, that was near the end of the Nasca Civilization ([53,54,55,56]). Although Grodzicki’s reconstruction is based on this biased chronology and considered inconsistent by the above-mentioned authors [7,8], it is uncritically used as a reference in geoarchaeological research (cf. e.g. [57,58,59,60,61]).
A further issue regarding the reliability of Grodzicki’s hypothesis arose during the geological survey for sediment sampling (Section 2.2). At both the sampling points 3 and 4, it was evident that the adobe walls were built on the investigated alluvial deposits (Figure 4 and Figure 5). To confirm this gathered relationship between deposits and walls, targeted geoarchaeological excavations are suggested. However, since the age obtained by OSL on the samples NZ11 (sampling point 3) and NZ1a (sampling point 4) are older than the Holocene epoch (Table 2), the present study adds new evidence against Grodzicki’s reconstruction. In fact, these samples were taken from the two alluvial deposits ascribed by this author to ENSO events occurred around 600 and 1000 CE, respectively [4,5,6]. Even considering possible inaccuracies in dating, the obtained result implies that the discussed hypothesis must be rejected.

4.2. Advancement in Fluvial Geomorphology Knowledge

The failure of the Grodzicki’s reconstruction has been mainly caused by the lack in knowledge about the geomorphology and geochronology of the alluvial deposits present in the study area. To the best of our knowledge, this is the first study that reports chronological and morpho-sedimentological data on the late Quaternary alluvial deposits of Nazca River Basin. In the study area, we identified three alluvial deposits arranged at different heights above the valley floor (Section 2.2, Table 1). Each of these could belong to a different fluvial terrace, the oldest at the top and the youngest at the bottom. However, since this study has another purpose (see Section 1 and Section 4.1), these findings are incomplete and must be carefully verified.
The literature on fluvial geomorphology of the south Peru has expanded considerably in recent years (see e.g. [16,17,43,62,63]). Considering these works, the herein studied alluvial deposits can be interpreted as fluvial terraces resulting from the interplay between tectonic uplift and climate changes. This working hypothesis needs to be tested by specific research to achieve an advancement in fluvial geomorphology knowledge. First, detailed mapping is mandatory to define the complete fluvial terrace sequence of the Nazca River Basin. As an example, to establish the average height of the fluvial terraces above the current river course, detailed field topographic survey and high resolution DEM processing have to be performed (cf. e.g. [16,17]).
Establishing the formation age of fluvial terraces is an intriguing challenge in geomorphology. For reliable dating of terrace formation, several terrace profiles must be methodically sampled and analyzed [64]. Frequently, a single age is assigned to a terrace (e.g. the one of the sediments atop the terrace strath), but this could be not reflect the actual geomorphological process [65,66]. To obtain more accurate results, series of samples should be collected from different fluvial facies belonging to a single terrace [64]. Finally, to establish confident timing of the late Quaternary fluvial evolution in Peru, the pIR-IRSL method is recommended [17,44].

5. Conclusions

Possible evidence of meteo-hydrogeological disasters ascribed to ENSO events are reported for many Pre-Hispanic Peruvian sites. A catastrophe hypothesis regarding the ceremonial center of Cahuachi had already raised criticism from some researchers and made further geological work in Nazca River Basin and the publication of geochronological data necessary. With this study we have addressed such a requirement (Section 1, Section 2).
OSL dating does not reconcile with the ENSO-related catastrophic events emphasized by previous studies. The conglomeratic bodies in Cahuachi ascribed by Grodzicki to the first millennium CE have a late Pleistocene age (Section 3, Section 4.1). They belong to a fluvial terrace system identified and briefly described in this work (Section 2.2, Section 4.2). Other conglomeratic bodies found in the surrounding of Cahuachi belong to the upper part of the Tertiary regional succession (Appendix A). Nevertheless, specific studies are needed to deepen our knowledge of the fluvial geomorphology of the Nazca River Basin.
To date, the main evidence of damage due to meteo-hydrogeological phenomena at Cahuachi is that caused by heavy rains towards the end of the 4th century CE. They partially destroyed the roof and walls of the "Piramide Sur" [28].

Author Contributions

Conceptualization and methodology, M.D.R., G.O. and A.R.; field investigation, M.D.R., M.T. and A.R.; grain-size and mineralogical investigation, M.T. and A.R.; OSL dating and data analysis, A.G. and L.P.; AMS radiocarbon dating, calibration and data analysis, G.Q. and L.C.; General discussion and interpretation, all authors; writing—original draft preparation, M.D.R.; writing—review and editing, all authors; funding acquisition, A.R. All authors have read and agreed to the published version of the manuscript.

Funding

This research was partially founded by the DiSPeA project "The contribution of Earth Sciences in defining the disappearance of the Nasca civilization: the geoarchaeological case study of the abandonment of the ceremonial site of Cahuachi (Peru)" (University of Urbino; fund manager: A.R.).

Institutional Review Board Statement

Not applicable.

Informed Consent Statement

Not applicable.

Data Availability Statement

Not applicable.

Conflicts of Interest

The authors declare no conflicts of interest.

Appendix A. Geological Survey and Inferences Drawn from it
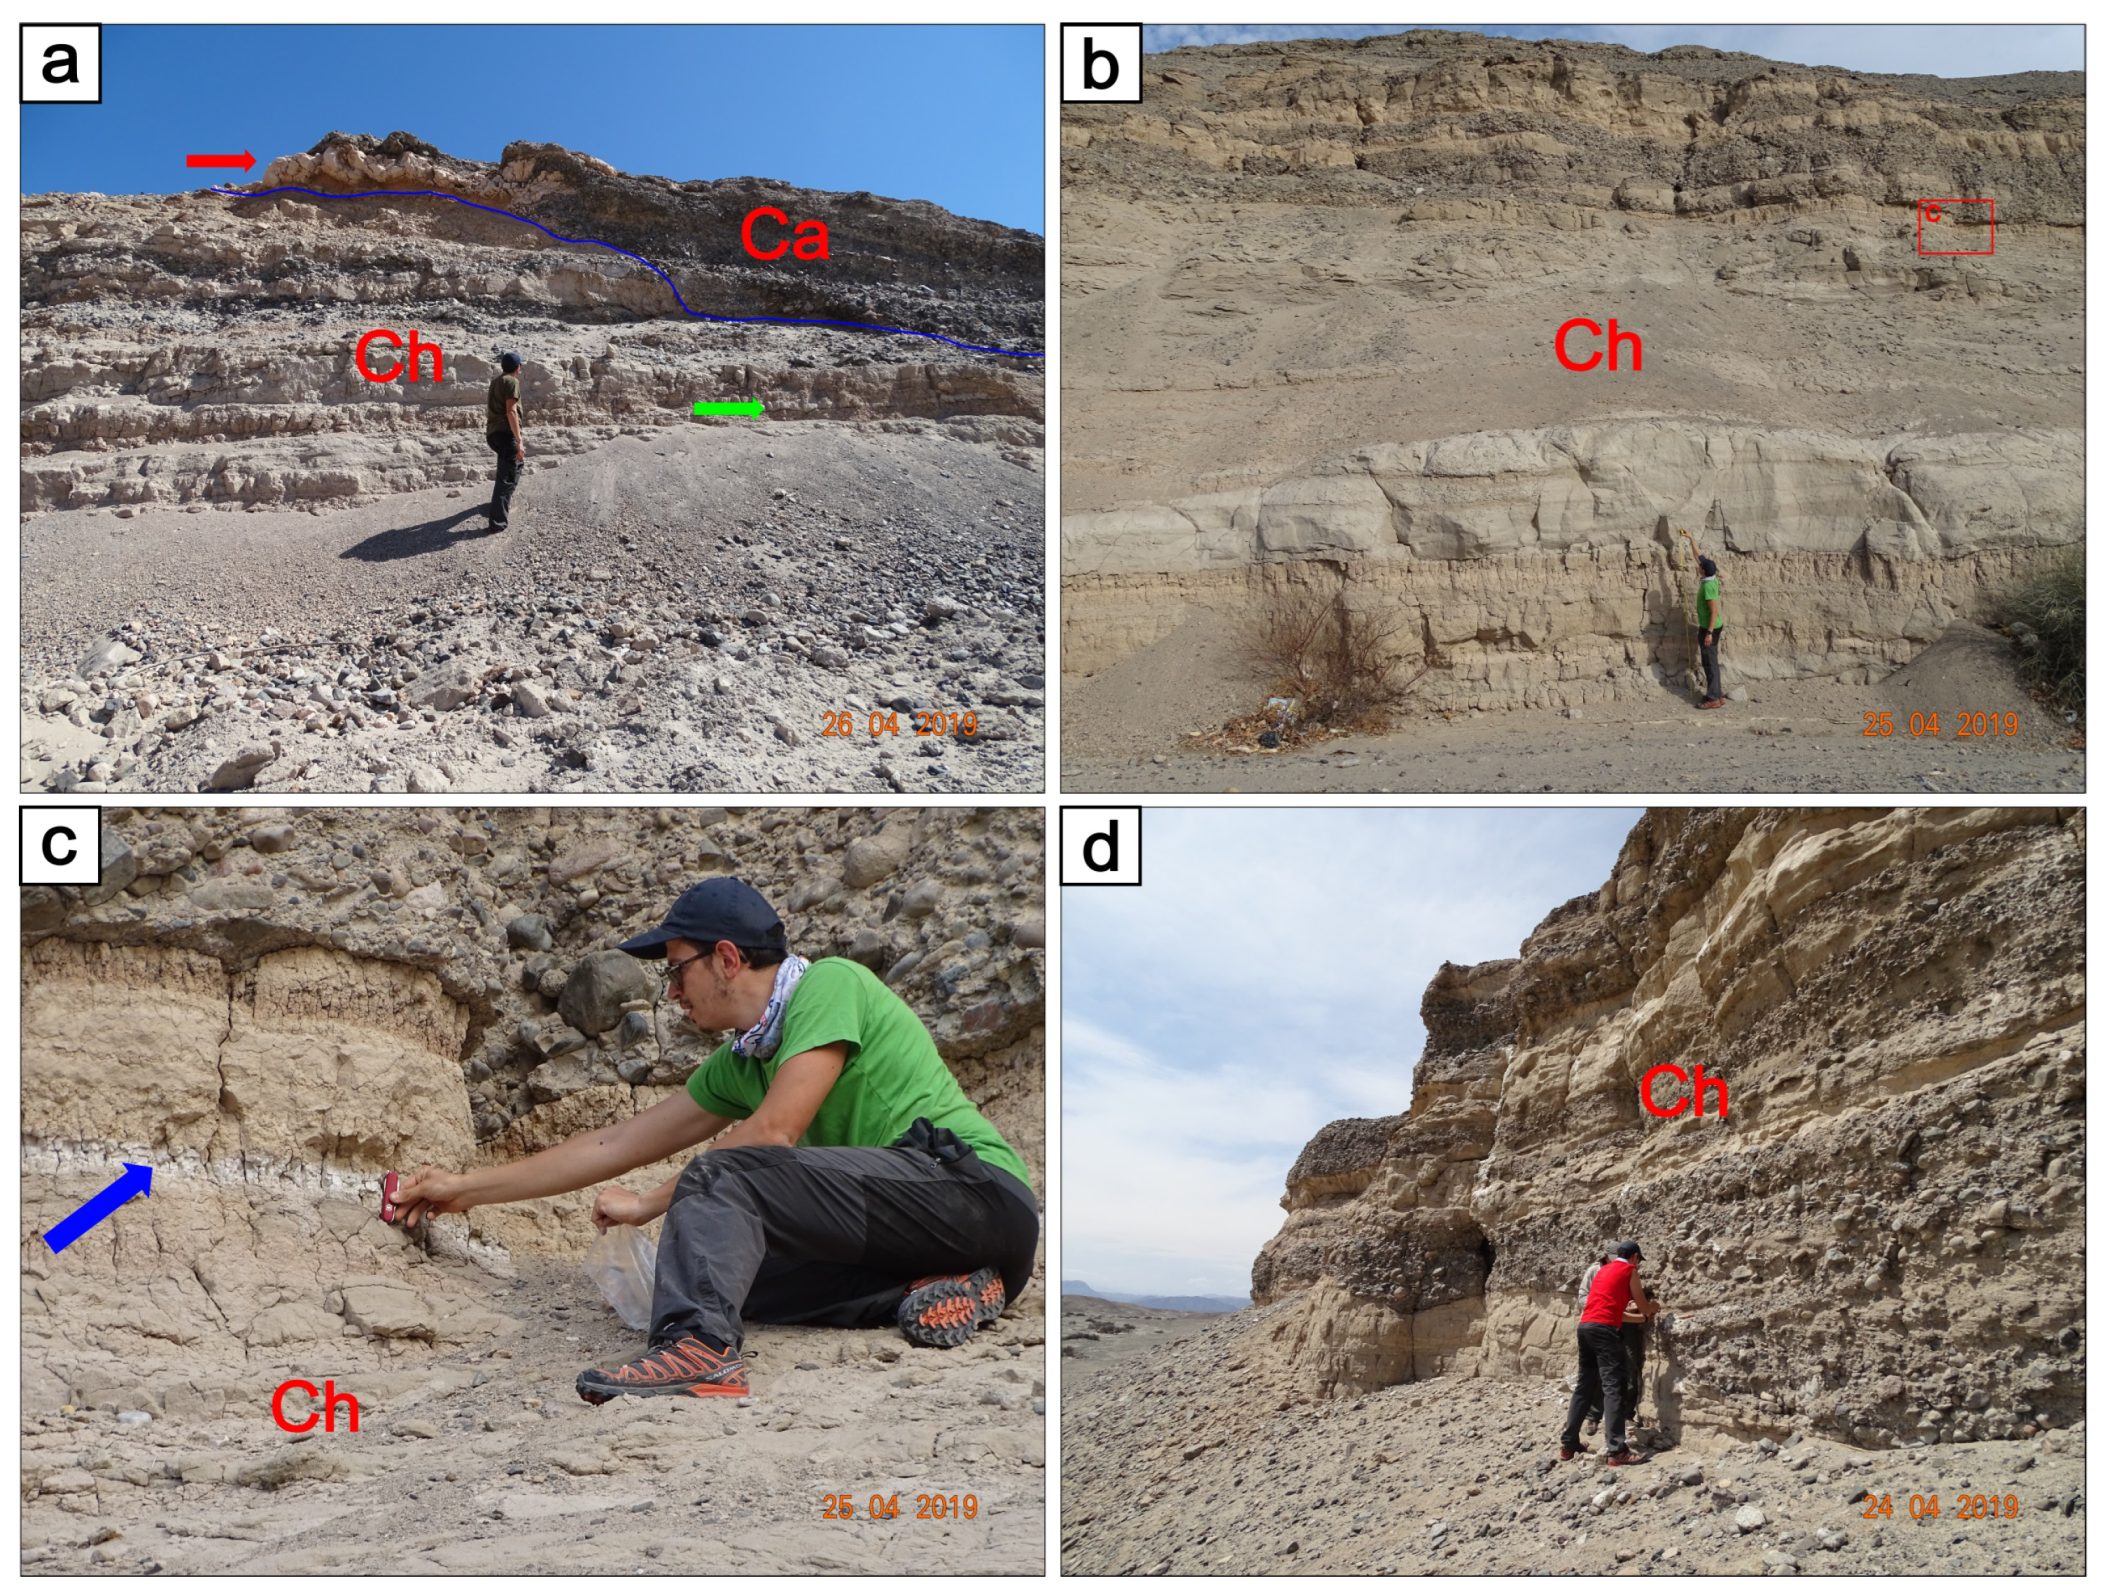
Field observations on Tertiary regional succession, Quaternary alluvial deposits, and bedrock covering were performed in April 2019 together with the sandy sediment sampling (Section 2.2). Following the recommendation of Leon et al (2008) [11], the stratigraphic boundary between Changuillo and Canete Fms was examined at km 415 of the Panamericana Sur road. At this exposure, it is characterized by slump folds and gentle angular unconformity (highlighted by red arrow and blue line, respectively, in Figure A1a). The Changuillo Fm forms about 20 m of the section, while the Canete Fm forms the uppermost few meters. The former is made up by sandstones, siltstones, mudstones, volcaniclastic layers, conglomerates and breccias, while the latter exclusively by conglomerates.
Figure A1. Stratigraphic features of the Tertiary regional succession. (a) Reference section for the boundary between Changuillo and Canete Fms; km 415 of the Panamericana Sur road (cf. [11]); (b) the best exposition of the upper part of the succession in the study area; (c) detail of Figure A1b (see text); (d) the "reference section for the Holocene" according to [5,6]. Ch = Changuillo Fm; Ca = Canete Fm.
Preprints 120842 g0a1
In the study area, the Changuillo Fm is the bedrock outcropping along the Nazca River valley (Figure 1). The upper part of this unit (Figure A1b) is magnificently exposed along the slopes bordering the active alluvial-slope system located north of Cahuachi (see Figure 1 for location). The Canete Fm forms the upper part of the mounds.
Volcaniclastic layers are typical of the upper part of the Changuillo Fm [10]. This has been confirmed by our field observations (Figure A1a,b,c). Their whitish color makes these thin layers clearly visible even from a considerable distance. In the stratigraphic succession they are just below the first conglomeratic layer. Along the hundreds of meters long exposure (Figure A1b), the layers of the Changuillo Fm, including the conglomerates (Figure A1c), are concordant or slightly discordant.
According to Grodzicki [5] p. 121, “the typical sequence of the Holocene deposits” would be placed north to the confluence of the above mentioned alluvial-slope system and the Nazca River (see f in Figure 1). This bedrock section was observed in the field (Figure A1d). Given its stratigraphic and sedimentological features [11,14,15] we concluded that it belongs to the upper part of the Changuillo Fm. This section shows some channeled conglomerates as a peculiar feature.
During the geological survey, particular attention was paid to the volcaniclastic levels that characterized the upper part of the Changuillo Fm [10]. Given their stratigraphic relevance, some samples were taken to optical thin section observations (Figure A2).
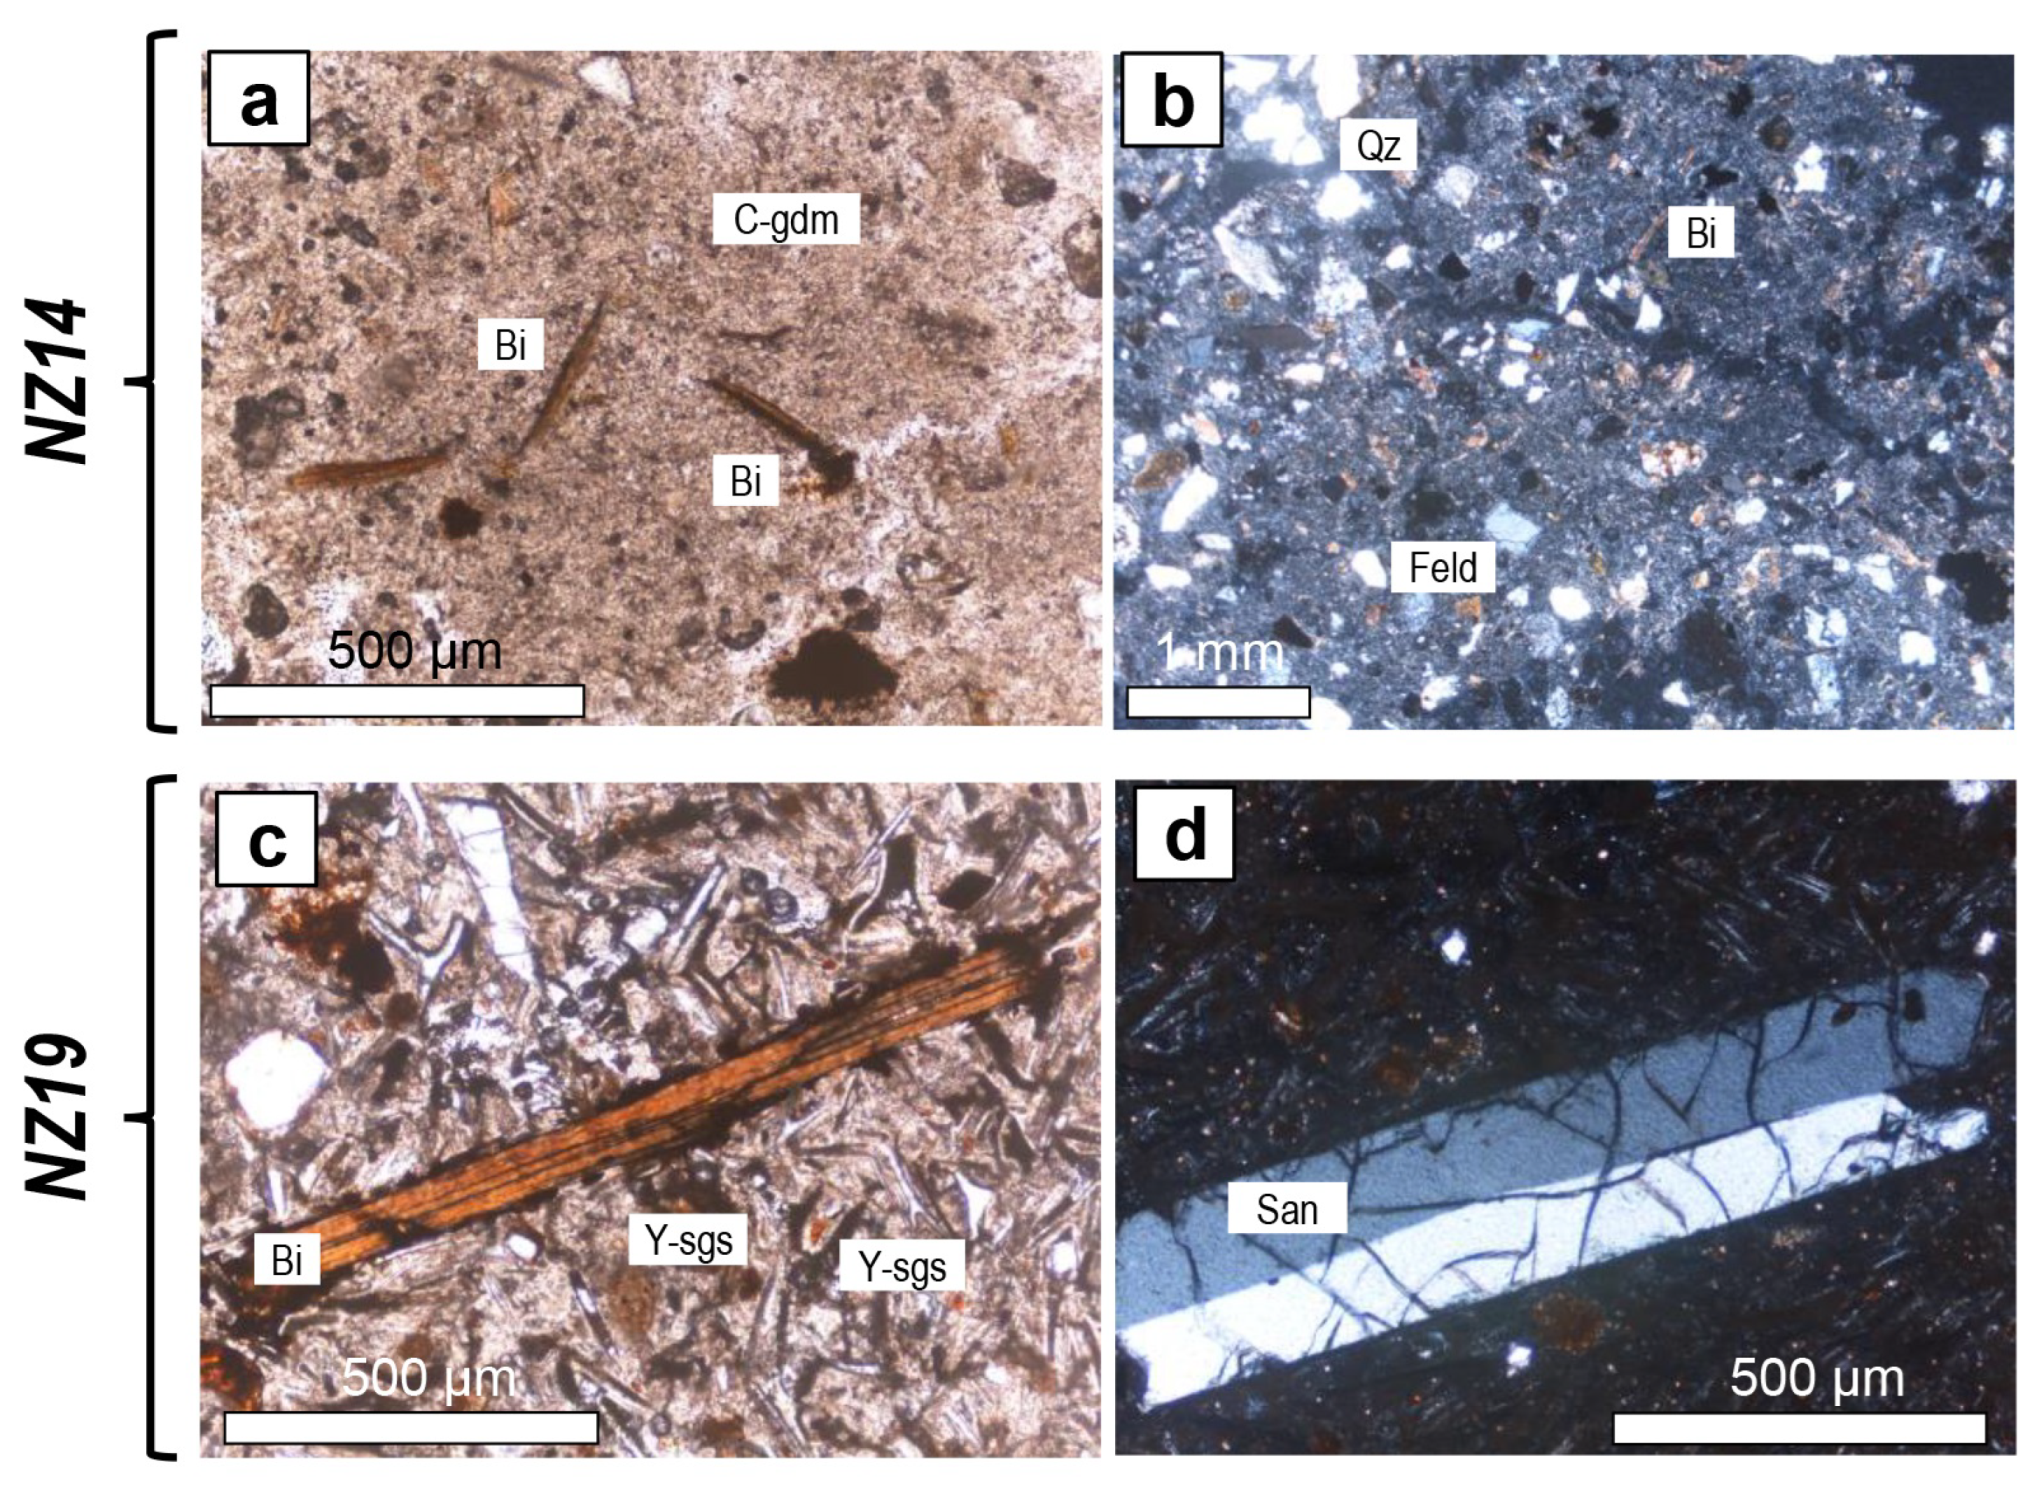
Figure A2. Thin section photos (One polarizer light: a, c; Crossed Nicols: b, d) of NZ14 and NZ19 samples. Abbreviations of minerals and textural features: Qz = quartz; Feld = feldspar; Bi = biotite; San = sanidine; C-gdm = glassy groundmass mostly altered to clay; Y-sgs = Y-shape glass shards.
Preprints 120842 g0a2
The volcaniclastic level in Figure A1c (shown by a blue arrow) is 7–8 centimeters thick and is represented by a clayey, crystal- to vitric tuff. Thin section observations of a sample taken from this level (NZ14, Figure A2a,b) highlight quartz (Qz) and feldspars (Feld) among the sialic crystals and pyroxenes and thin elongated biotites (Bi) among the mafic ones, within a glassy groundmass mostly altered to clay (C-gdm).
From the layer highlighted by a green arrow (Figure A1a) the sample NZ19 was taken. Thin section observations (Figure A2c,d) emphasize a crystal- to vitric-tuff extremely rich in Y-shape glass shards (Y-sgs) although the glass is partly oxidized and/or altered to secondary minerals or even with only the Y-shape preserved. Sialic crystals are represented by quartz, plagioclase, sanidine (San) whereas the mafic phases mostly consist of pyroxenes and biotites (Bi). Lithics of various lithologies, up to few millimeters, also occur. These levels could be a regional marker [10]; however, specific research must be carried out.
Given the target of this work (Section 1), several alluvial deposits and landforms have been investigated during the geological survey at Cahuachi and in the surrounding area. The most significant ones are briefly described below.
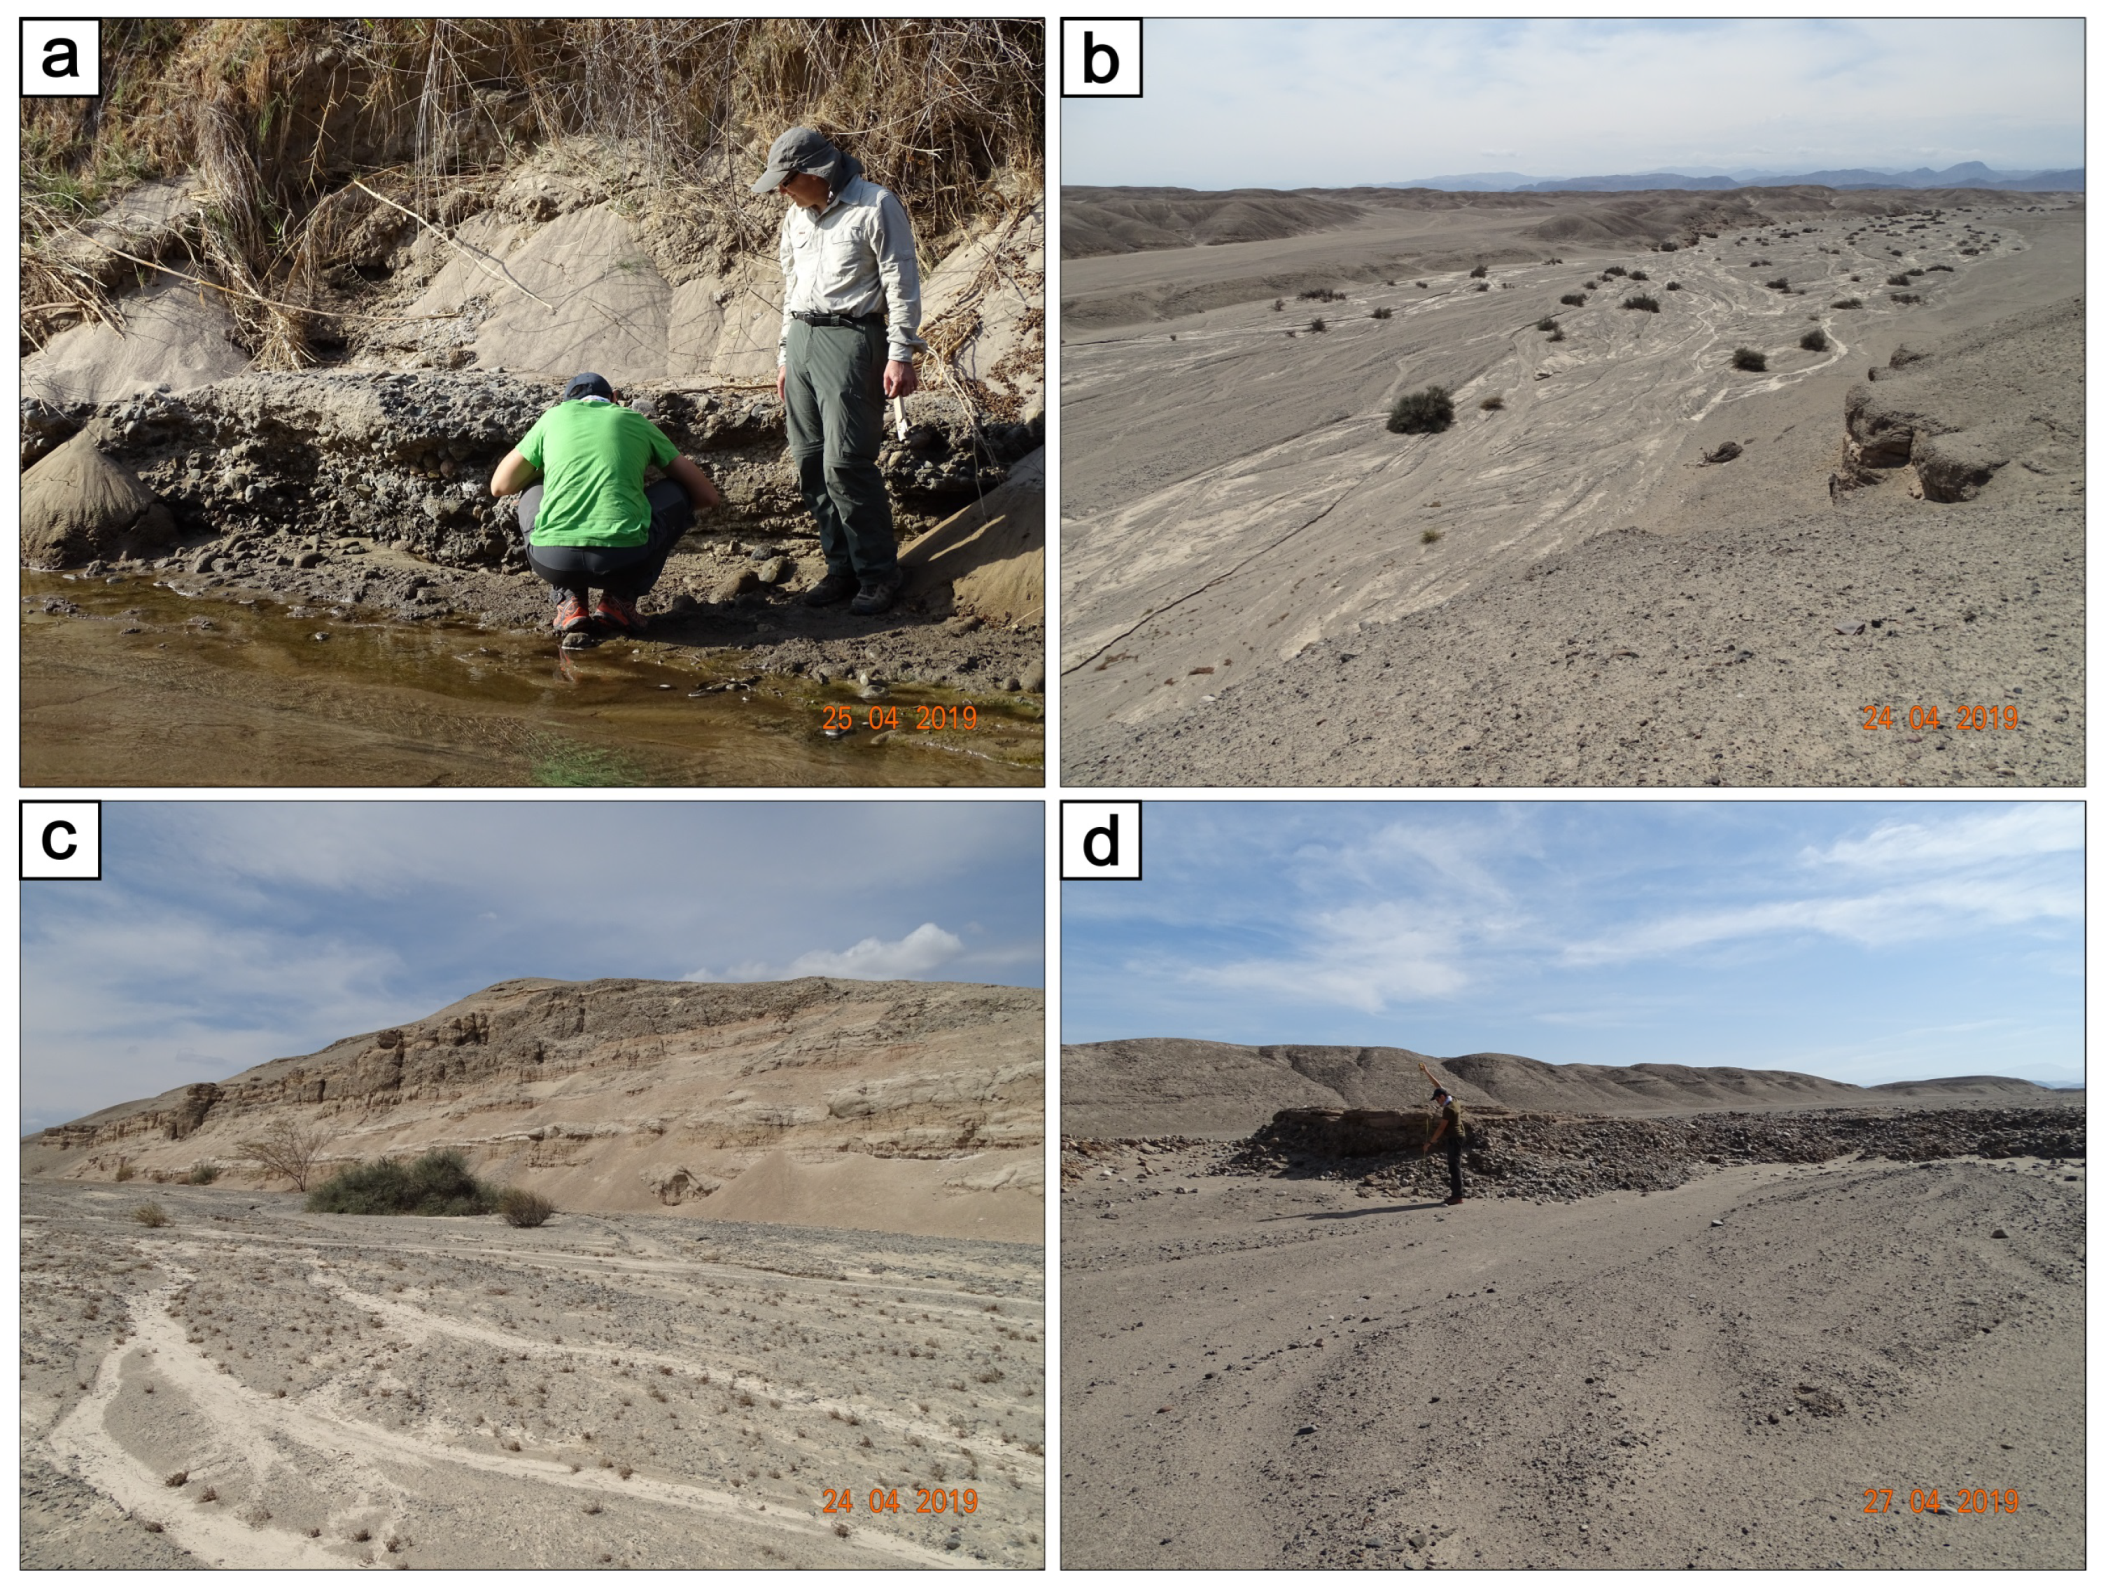
A tabular bed of structureless poorly sorted clast-supported gravel (Gcm facies) was found just above the present riverbed (Figure A3a) and some meters below the sampling point 2 (Section 2.2, Figure 3). Its depositional features (fabric, texture, gravel shape, and maximum gran-size) are very similar to the ones of the alluvial deposit of the sampling point 4 (Figure 5). The positions of these bodies have a difference in height of approximately 40 m.
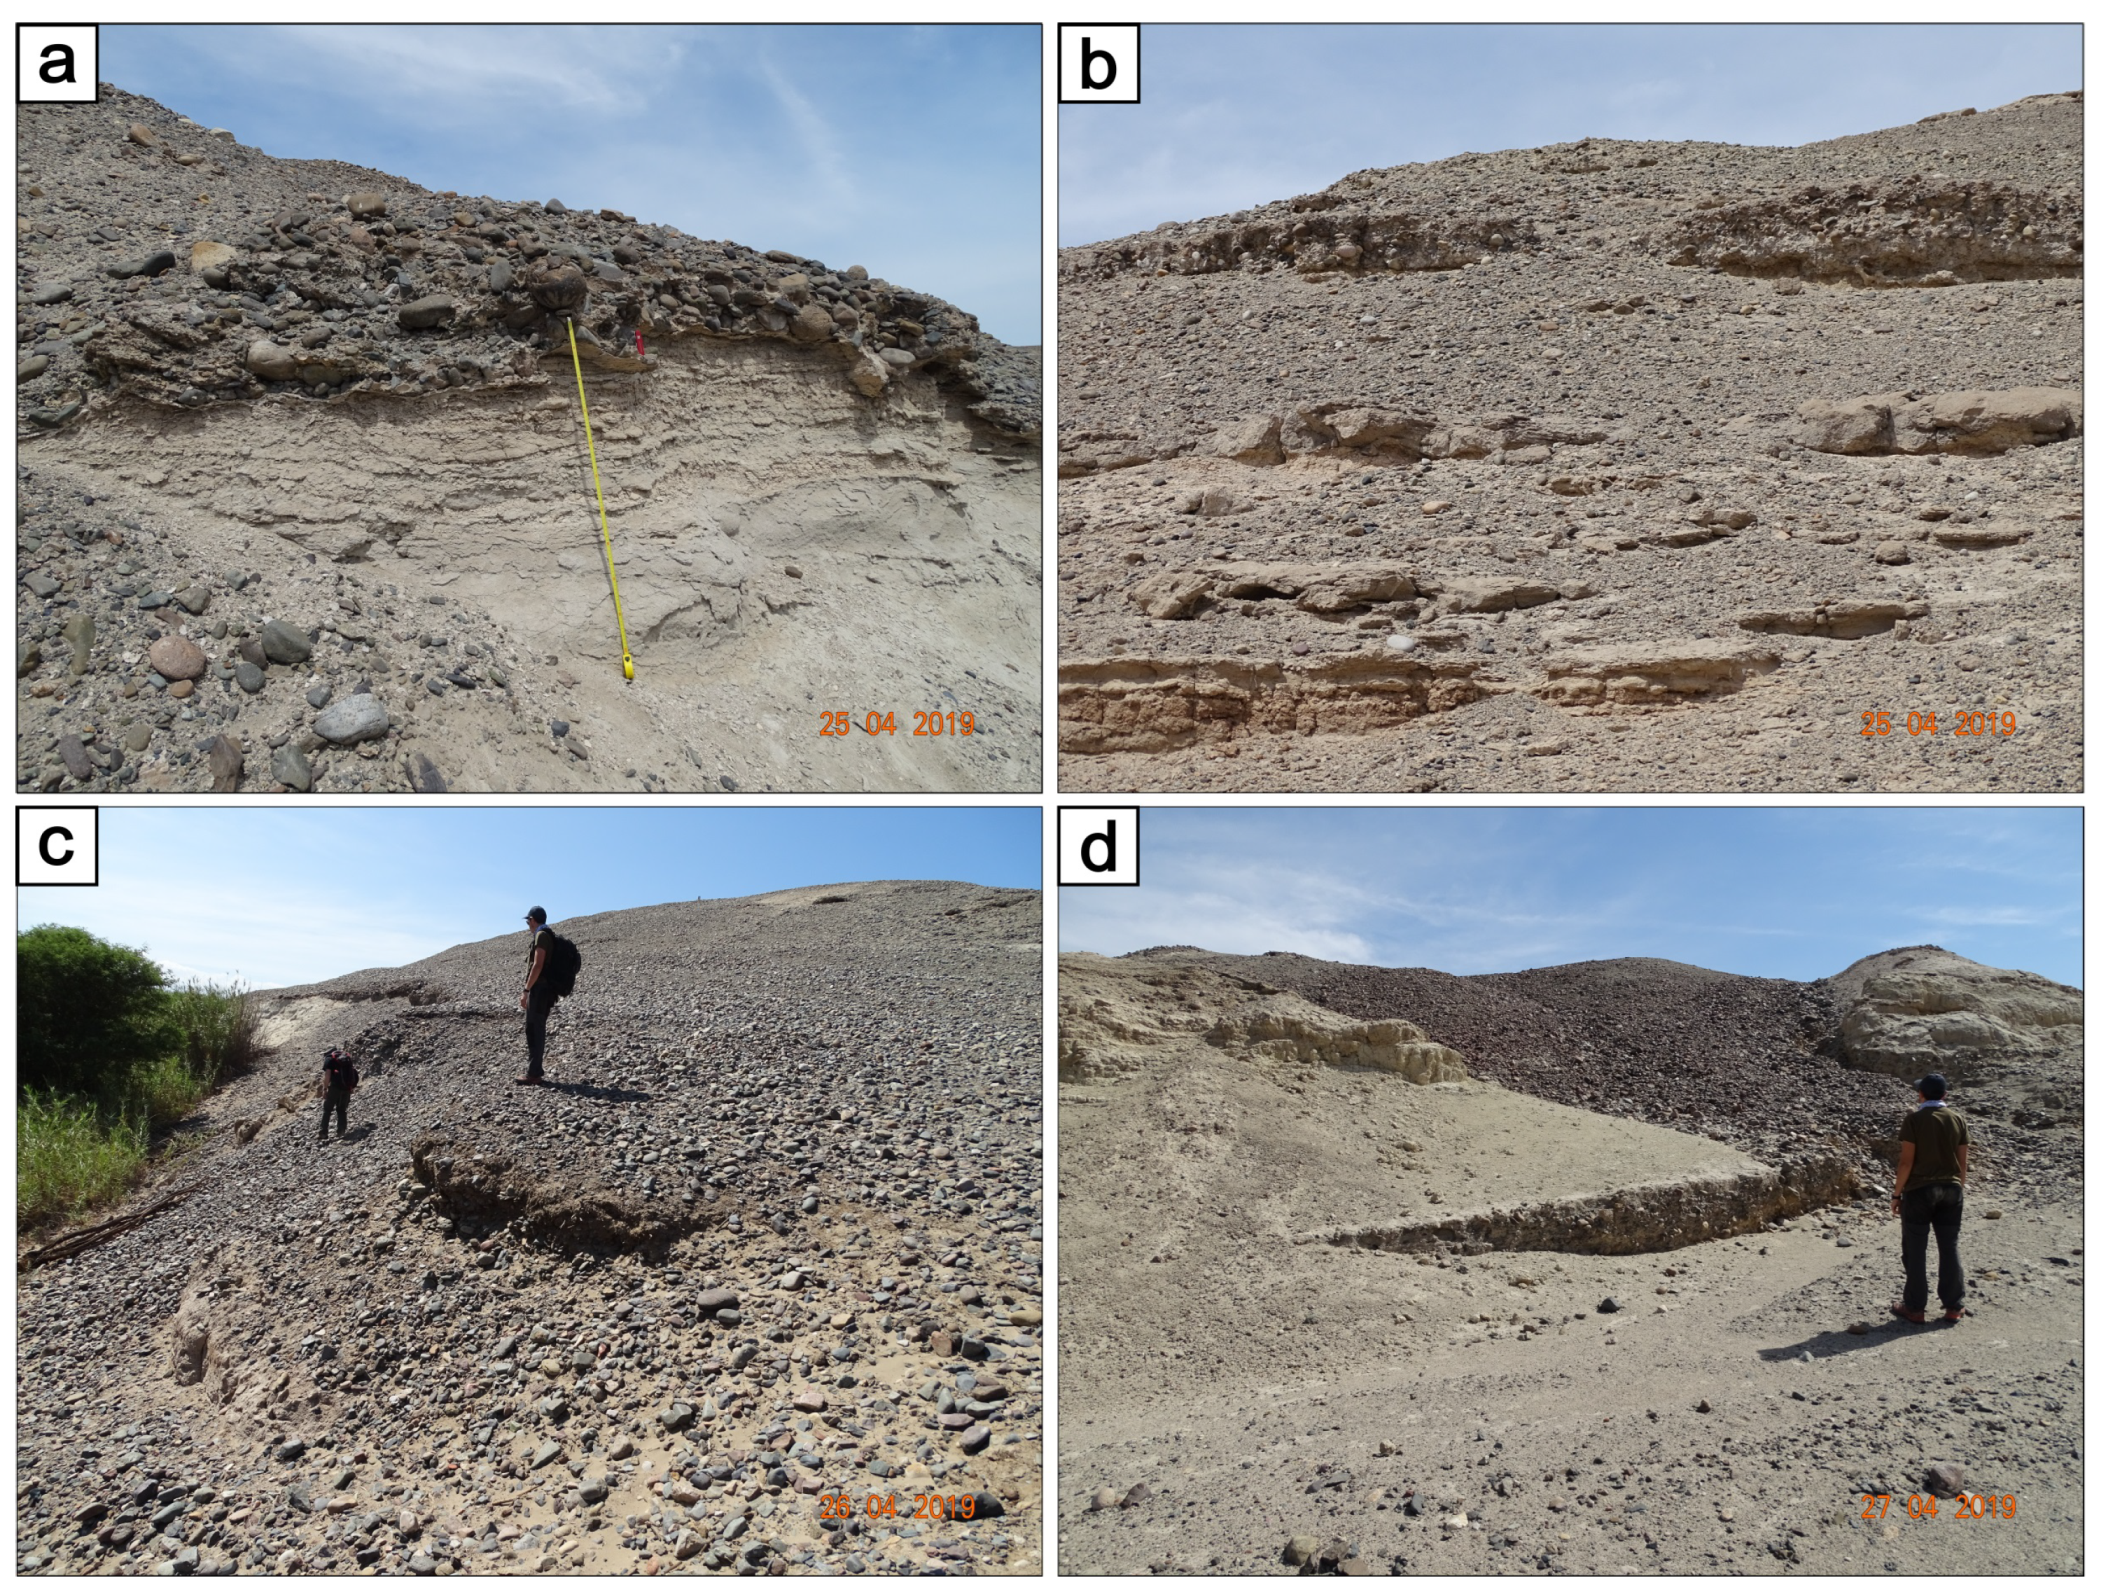
Alluvial slope systems characterized the sides of the Nazca River Valley, especially the right one (Figure 1). Some of these systems are apparently active (Figure A3b,c), while some others are abandoned (Figure A3d). Likely, alluvial slopes shaped the sides of the valley throughout the middle-late Pleistocene, eroding, selecting and transporting the clastic materials from Changuillo and Canete Fms.
Figure A3. Field characteristics of alluvial deposits and landforms. (a) clast-supported gravel (Gcm facies) above the present riverbed; (b) active alluvial slope (see Figure 1); (c) ephemeral braided channels of the active alluvial slope; (d) abandoned alluvial slope; in the center of the photo, a loose conglomerate interpreted by Grodzicki as an ENSO-related deposit.
Preprints 120842 g0a3
The layer of gravel in Figure A3d was interpreted y Grodzicki ([4], pp. 69–70, [6], pp. 28–29 and pp. 95–96) as a result of a catastrophic ENSO-related event occurred around 100 BCE. Instead, our field investigation suggests that it can be interpreted as a common fluvial bar. This can be a starting point for in-depth sedimentological studies.
According to Grodzicki, the bedrock of the investigated area is almost completely covered by conglomerates, which would be the result of catastrophic El Niño events ([4] pp. 67–97, [5] pp. 121–124, [6] pp. 25–48). We found that a large part of the investigated area is indeed covered by gravels. However, our opinion on their formation processes completely differs from that of the aforementioned author.
We found that at Cahuachi and surrounding area, gravels form a number of different conglomerate deposits more or less reworked by geomorphological phenomena, especially grain-size selective erosion and gravitational slope processes. As a result, many conglomerates belonging to Changuillo and Canete Fms, as well as middle-late Pleistocene alluvial systems, show changes in depositional characteristics, such as the spatial relation between the gravels and bounding surfaces. One of the best examples is reported in Figure A4a, that shows a conglomerate with a convex shape and an irregular base. Differently from the other observed conglomerates, it has been cemented by (likely post-depositional) carbonate precipitation. Considering literature and our field observation, it can be interpreted as a fan or alluvial deposit from which matrix was removed by a variety of processes including surface runoff, rain infiltration, and wind blowing (cf. e.g. [67,68,69]). Wetting-drying cycles, and dissolution and carbonate precipitation also occurred [70,71]. Other observed gravel accumulations along both the sides of the Nazca River valley are not cemented, and result from selective erosion and gravitational processes (Figure A4b,c). In some case, they show the typical features of debris flows (Figure A4d). The result of the geomorphological processes mentioned above on the surface of the Pampa of Nazca, is the characteristic desert pavement that made the creation of the geoglyphs possible.
Figure A4. Some features of the conglomerates covering the bedrock of the study area. (a) a cemented conglomerate observed about 4 km west of Cahuachi; (b) loose gravel covering the Changuillo Fm (1.5 km north-east of Cahuachi); (c) loose gravel covering the floodplain deposits (2 km west of Cahuachi); (d) a channelized debris flow mad up of gravel (1.2 km north-east of Cahuachi).
Preprints 120842 g0a4
The lack in knowledge on fluvial geomorphology of the studied area was partially overcame by the reported field survey. Such a survey was important for contextualizing the studied alluvial deposits and for evaluating Grodzicki’s reconstruction (see main text). Given their observational nature, the inferences in this appendix on other geological targets must be considered as mere starting points for further research.

Appendix B. Supplementary OSL Data

The following diagram supports the discussion on the reliability of the obtained OSL ages (Section 4).
Figure A5. D e (t) plot of an aliquot of samples NZ1a, NZ11 and NZ16 (a), and NZ3 (b).
Preprints 120842 g0a5

References

  1. Orefici, G. Cahuachi. Capital Teocrática Nasca; Fundo Editorial Universidad SMP: Lima, Peru, 2012. (In Spanish).
  2. Orefici, G. Nasca historical and cultural analysis. In Ancient Nasca World. New Insights from Science and Archaeology; Lasaponara, R., Masini, N., Orefici, G., Eds.; Springer: Basel, Switzerland, 2016; pp. 65–86.
  3. Delle Rose, M. The geology of Cahuachi. In Ancient Nasca World. New Insights from Science and Archaeology; Lasaponara, R., Masini, N., Orefici, G., Eds.; Springer: Basel, Switzerland, 2016; pp. 47–64.
  4. Grodzicki, J. Las catástrofes ecológicas en la Pampa de Nazca a fines del Holoceno y el fenómeno El Niño. In Proceedings of th El Fenómeno El Niño: A Través de las Fuentes Arqueológicas y Geológicas, Warsaw, Poland, 18–19 May 1990; pp. 64–102. (In Spanish).
  5. Grodzicki, J. Los geoglifos de Nazca segun algunos datos geologicos. In Paleo ENSO Records; Ortlieb, L., Machare, J., Eds.; Orstom-Concytec: Lima, Peru, 1992; pp. 119–130. (In Spanish).
  6. Grodzicki, J. Nasca: Los Sintomas Geológicos del Fenómeno El Niño y Sus Aspectos Arquelógicos; Warsaw University: Warsaw, Poland, 1994. (In Spanish).
  7. Silverman, H.; Proulx, D.A. The Nasca; Blackwell Publishers: Malden, MA, USA, 2002.
  8. Eitel, B.; Hecht, S.; Mächtle, B.; Schukraft, G.; Kadereit, A.; Wagner, G.A.; Kromer, B.; Unkel, I.; Reindel, M. Geoarchaeological evidence from desert loess in the Nazca–Palpa region, Southern Peru: Palaeoenvironmental changes and their impact on Pre-Columbian cultures. Archaeometry 2005, 47, 137–158. [CrossRef]
  9. Delle Rose, M. Landscape Modifications Ascribed to El Niño Events in Late Pre-Hispanic Coastal Peru. Land 2022, 11, 2207. [CrossRef]
  10. Delle Rose, M.; Mattioli, M.; Capuano, N.; Renzulli, A. Stratigraphy, Petrography and Grain-Size Distribution of Sedimentary Lithologies at Cahuachi (South Peru): ENSO-Related Deposits or a Common Regional Succession? Geosciences 2019, 9, 80. [CrossRef]
  11. Leon, W.; Aleman, A.; Torres, V.; Rosell, W.; De La Cruz, O. Estratigrafía, sedimentología y Evolución de la Cuenca Pisco Oriental Boletín serie D, n. 27; INGEMMET: Lima, Peru, 2008. (In Spanish).
  12. Sebrier, M.; Macharé, J. Observaciones acerca del Cuaternario de la Costa del Perù Central. Bull. Inst. Fr. Études Andines 1980, 9, 9–52. (In Spanish). [CrossRef]
  13. Machare, J. La marge continentale du Pérou: Régimes tectoniques et sédimentaires cénozoïques de l’avant-arc des Andes centrales. Thèse Doct. Sc., Université Paris XI, Orsay, France, 1987. (In French).
  14. De La Cruz, J.; De La Cruz, O. Memoria descriptiva de la revision y actualizacion del cuadrangulo de Nasca (30-n); INGEMMET: Lima, Peru, 2003. (In Spanish).
  15. Leon, W.; Torres, V. Memoria descriptiva de la revisión y actualización del cuadrángulos de Punta Grande (29-k), Ica (29-l), Lomitas (30-l), Palpa (30-m), San Juan (31-m), Acari (31-n), y Yauca (32-n); INGEMMET: Lima, Peru, 2003. (In Spanish).
  16. Hall, S.R.; Farber, D.L.; Audin, L.; Finkel, R.C.; Meriaux, A.S. Geochronology of pediment surfaces in southern Peru: Implications for Quaternary deformation of the Andean Forearc. Tectonophysics 2008, 459, 186–205. [CrossRef]
  17. Viveen, W.; Sanjurjo-Sanchez, J.; Rosas, M.A.; Vanacker, V.; Villegas-Lanza, J.C. Heinrich events and tectonic uplift as possible drivers for late Quaternary fluvial dynamics in the western Peruvian Andes. Glob. Planet. Change 2022, 218, 103972. [CrossRef]
  18. Machtle, B.; Unkel, I.; Eitel, B.; Kromer, B.; Schiegl, S. Molluscs as evidence for a Late Pleistocene and Early Holocene humid period in the northern Atacama desert, southern Peru (14.5 S). Quat. Res. 2010, 73, 39–47. [CrossRef]
  19. Bromley, G.R.M.; Schaefer, J.M.; Winckler, W.; Hall, B.L.; Todd, C.E.; Rademaker, K.M. Relative timing of last glacial maximum and late-glacial events in the central tropical Andes. Quat. Sci. Rev. 2009, 28, 2514–2526.
  20. Rodbell, D.T.; Hatfield, R.G.; Abbott, M.B.; Chen, C.Y.; Woods, A.; Stoker, J.S. et al. 700,000 years of tropical Andean glaciation. Nature 2022, 607, 301–306.
  21. Machtle, B.; Eitel, B.; Kadereit, A.; Unkel, I. Holocene environmental changes in the northern Atacama desert, southern Peru and their impact on the rise and fall of Pre-Columbian cultures. Z. Geomorphol. Suppl. 2006, 142, 47–62.
  22. Eitel, B.; Machtle, B. Man and Environment in the Eastern Atacama Desert (Southern Peru): Holocene Climate Changes and Their Impact on Pre-Columbian Cultures. In New Technologies for Archaeology; Reindel, M., Wagner, G.A., Eds.; Springer: Berlin/Heidelberg, Germany, 2009; pp. 17–37.
  23. Miall, A.D. Lithofacies types and vertical profile models in braided river deposits: a summary. In Fluvial Sedimentology; Miall, A.D., Ed.; Canadian Petroleum Geology Society: Calgary, Canada, 1978; pp. 597–604.
  24. Miall, A.D. Methods of architectural-element analysis. In The geology of fluvial deposits; Miall, A.D., Ed.; Springer: Berlin, Heidelberg, Germany, 2006; pp. 75–98.
  25. INGEMMET. Mapa Geologico del Cuadrangulo de Palpa, 2nd ed.; Ministerio de Energía y Minas: Lima, Peru, 2001.
  26. Orefici, G. The decline of Cahuachi and the end of the Nasca theocracy. In Ancient Nasca World. New Insights from Science and Archaeology; Lasaponara, R., Masini, N., Orefici, G., Eds.; Springer: Basel, Switzerland, 2016; pp. 449–468.
  27. Lasaponara, R.; Masini, N. Combating illegal excavations in Cahuachi: ancient problems and modern technologies. In Ancient Nasca World. New Insights from Science and Archaeology; Lasaponara, R., Masini, N., Orefici, G., Eds.; Springer: Basel, Switzerland, 2016; pp. 605–633.
  28. Orefici, G. Recent discoveries in Cahuachi: The Templo Sur. In Ancient Nasca World. New Insights from Science and Archaeology; Lasaponara, R., Masini, N., Orefici, G., Eds.; Springer: Basel, Switzerland, 2016; pp. 363–374.
  29. Huntley, D.; Godfrey-Smith, D.; Thewalt, M. Optical dating of sediments. Nature 1985, 313, 105–107.
  30. Aitken, M.J. An Introduction to Optical Dating: The Dating of Quaternary Sediments by the Use of Photon-stimulated Luminescence, 1st ed.; Oxford University Press: Oxford, UK, 1998; 280 pp.
  31. Galbraith, R.F.; Roberts, R.G.; Laslett, G.M.; Yoshida, H.; Olley, J.M. Optical dating of single and multiple grains of quartz from Jinmium rock shelter, northern Australia: part I, experimental design and statistical models. Archaeometry 1999, 41, 339–364.
  32. Murray, A.S.; Wintle, A.G. Luminescence Dating of Quartz Using an Improved Single Aliquot Regenerative-Dose Protocol. Radiat. Meas. 2000, 32, 57–73.
  33. Wintle, A.G.; Murray, A.S. A review of quartz optically stimulated luminescence characteristics and their relevance in single-aliquot regeneration dating protocol. Radiat. Meas. 2006, 41, 369–391.
  34. Panzeri, L.; Galli, A.; Maspero, F.; Saleh, M.; Martini, M. The activities of the LAMBDA (Laboratory of Milano Bicocca university for Dating and Archaeometry): What’s new? J. Phys. Conf. Ser. 2022, 2204, 012047.
  35. Duller, G.A.T. Distinguishing quartz and feldspar in single grain luminescence measurements. Radiat. Meas. 2003, 37, 161–165.
  36. Faershtein, G.; Porat, N.; Avni, Y.; Matmon, A. Aggradation-incision Transition in Arid Environments at the End of the Pleistocene: an Example from the Negev Highlands, Southern Israel. Geomorphology 2016, 253, 289–304.
  37. A Medialdea, KJ Thomsen, AS Murray, G Benito. Reliability of equivalent-dose determination and age-models in the OSL dating of historical and modern palaeoflood sediments. Quat. Geochronol. 2014, 22, 11–24.
  38. Aitken, M.J. Thermoluminescence Dating, 1st ed.; Academic Press: London, Uk, 1985; 153 pp.
  39. Bell, W.T. Attenuation Factors for the Absorbed Radiation Dose in Quartz Inclusions for Thermoluminescence Dating. Ancient TL 1979, 8, 2–13.
  40. Calcagnile, L.; Maruccio, L.; Scrimieri, L.; Delle Side, D.; Braione, E.; D’Elia, M.; Quarta, G. Development and application of facilities at the Centre for Applied Physics, Dating and Diagnostics (CEDAD) at the University of Salento during the last 15 years. Nucl. Instrum. Methods Phys. Res., B 2019, 456, 252–256.
  41. D’Elia, M.; Calcagnile, L.; Quarta, G.; Rizzo, A.; Sanapo, C.; Laudisa, M.; Toma, U.; Rizzo, A. Sample preparation and blank values at the AMS radiocarbon facility of the University of Lecce. Nucl. Instrum. Methods Phys. Res., B 2004, 223–224, 278–283.
  42. Hajdas, I.; Ascough, P.; Garnett, M.H.; Fallon, S.J.; Pearson, C.L.; Quarta, G.; Spalding, K.L.; Yamaguchi, H.; Yoneda, M. Radiocarbon Dating. Nat. Rev. Methods Prim. 2021, 1, 62.
  43. Steffen, D.; Schlunegger, F.; Preusser, F. Drainage basin response to climate change in the Pisco valley, Peru. Geology 2009, 37, 491–494.
  44. Viveen, W.; Baby, P.; Sanjurjo-Sanchez, J.; Hurtado-Enríquez, C. Fluvial terraces as quantitative markers of late Quaternary detachment folding and creeping thrust faulting in the Peruvian Huallaga basin. Geomorphology 2020, 367, 1–23.
  45. Baby, P.; Viveen, W.; Sanjurjo-Sanchez, ´ J.; Bigot, J.-Y.; Dosseto, A., Villegas-Lanza, J.C.; Apa´estegui, J.; Guyot, J.-L.; First record of OSL-dated fluvial sands in a tropical Andean cave reveals rapid late Quaternary tectonic uplift. Terra Nova 2021, 33, 262–273.
  46. Sanjurjo-Sanchez, J.; Viveen, W.; Vega-Centeno Sara-Lafosse, R. Testing the accuracy of OSL and pIR IRSL dating of young geoarchaeological sediments in coastal Peru. Quat. Geochronol. 2022, 73, 101382.
  47. Viveen, W., Zevallos-Valdivia, L., Sanjurjo-Sanchez, J. The influence of centennial-scale variations in the South American summer monsoon and base-level fall on Holocene fluvial systems in the Peruvian Andes. Global Planet. Change 2019, 176, 1–22.
  48. Viveen, W., Sanjurjo-Sanchez, J., Baby, P., Gonz´ alez-Moradas, M.d.A. An assessment of competing factors for fluvial incision: an example of the late Quaternary exorheic Moyobamba basin. Peruvian Subandes. Global Planet. Change 2021, 200, 1–24, 103476.
  49. Bailey, R.M. The interpretation of quartz optically stimulated luminescence equivalent dose versus time plots. Radiat. Meas. 2000, 32, 129–140.
  50. Bailey, R.M. Paper II: The interpretation of measurement-time-dependent single-aliquot equivalent-dose estimates using predictions from a simple empirical model. Radiat. Meas. 2003, 37, 685–691.
  51. Li, B., Li, S.-H. Comparison of De estimates using the fast component and the medium component of quartz OSL. Radiat. Meas. 2006, 41, 125–136.
  52. Magnini, L.; Pozzi-Escot, D.; Oshiro, J.; Angeles, R.; Apa, M.I.P.; Ventura, G. Effects of the Architectural Layout of the Sanctuary of Pachacamac (2nd–16th Century CE, Peru) on the Exposure to Rain, Wind, and Solar Radiation from the Morphometric Analysis of Digital Surface Models. Remote Sens. 2024, 16, 1848.
  53. Silverman, H.; Browne, D. New Evidence for the Date of the Nazca Lines. Antiquity 1991, 65, 208–220.
  54. Bray, W. Under the skin of Nazca. Nature 1992, 358, 19.
  55. Rink, W.J.; Bartoll, J. Dating the geometric Nasca lines in the Peruvian desert. Antiquity 2005, 79, 390–401.
  56. Unkel, I.; Kromer, B.; Reindel, M.; Wacker, L.; Wagner, G.A. A Chronology of the Pre-Columbian Paracas and Nasca Cultures in South Peru Based on AMS 14C Dating. Radiocarbon 2007, 49, 551–564.
  57. Mogrovejo, J.D.; Makowski, C.M. Cajamarquilla y los Mega Niños del Pasado prehispánico. Íconos: revista peruana de conservación, arte y arqueología 1999, 1, 46–57. (In Spanish).
  58. Contreras, D.A. Landscape and environment: insights from the Prehispanic central Andes. J. Archaeol. Res. 2010, 18, 241–288.
  59. Valdez, R.; Jacay, J. Cronología, indicadores paleoclimáticos, aluviones y fenómenos de El Niño en la costa central del Perù. Arqueológicas 2012, 29, 71–86. (In Spanish).
  60. Ghezzi, I.; Guadalupe, E. Fenómenos geológicos que afectaron las edificaciones de Chankillo. Revista del Instituto de Investigación 2014, 17, 45–51. (In Spanish).
  61. Cornejo, M.A. Adaptación tecnológica a los cambios climáticos en los Andes peruanos. Revista de Arqueologia Americana 2015, 33, 115–151. (In Spanish).
  62. Steffen, D.; Schlunegger, F.; Preusser, F. Late Pleistocene fans and terraces in the Majes valley, southern Peru, and their relation to climatic variations. Int J. Earth Sci. (Geol. Rundsch.) 2010, 99, 1975–1989.
  63. Viveen, W.; Sanjurjo-Sanchez, J.; Bravo-Lembcke, G.; Uribe-Ventura, R. A 121-ka record of Western Andean fluvial response to suborbital climate cycles recorded by rhythmic grain size variations of the Lima fluvial fan. Earth Surf. Process. Landforms 2024, 49, 2326–2347.
  64. Zhang, J.-F.; Qiu, W.-L.; Hu, G.; Zhou, L.-P. Determining the Age of Terrace Formation Using Luminescence Dating—A Case of the Yellow River Terraces in the Baode Area, China. Methods Protoc. 2020, 3, 17.
  65. Hancock, G.S.; Anderson, R.S. Numerical modeling of fluvial strath-terrace formations in response to oscillating climate. Geol. Soc. Am. Bull. 2002, 114, 1131–142.
  66. Foster, M.A.; Anderson, R.S.; Gray, H.J.; Mahan, S.A. Dating of river terraces along Lefthand Creek, western High Plains, Colorado, reveals punctuated incision. Geomorphology 2017, 295, 176–190.
  67. Parsons, A.J.; Abrahams, A.D.; Simanton, J.R. Microtopography and soil surface materials on semi-arid piedmont hillslopes, southern Arizona. J. Arid. Environ. 1992, 22, 107–115.
  68. Williams S.H.; Zimbelman, J.R. Desert pavement evolution: an example of the role of sheetflood. J. Geol. 1994, 102, 243–248.
  69. Dixon, Lag deposits. In Encyclopedia of Planetary Landforms; Hargitai, H., Kereszturi, A. Eds.; Springer: New York, USA, 2015: 6 pp.
  70. Haff, P.K.; Werner, B.T. Dynamic processes on desert pavements and the healing of surficial disturbances. Quat. Res. 1996, 45, 38–46.
  71. Pelletier, J.D.; Cline, M.; DeLong, S.B. Desert pavement dynamics: numerical modeling and field-based calibration. Earth Surf. Process. Landforms 2007, 32, 1913–1927.
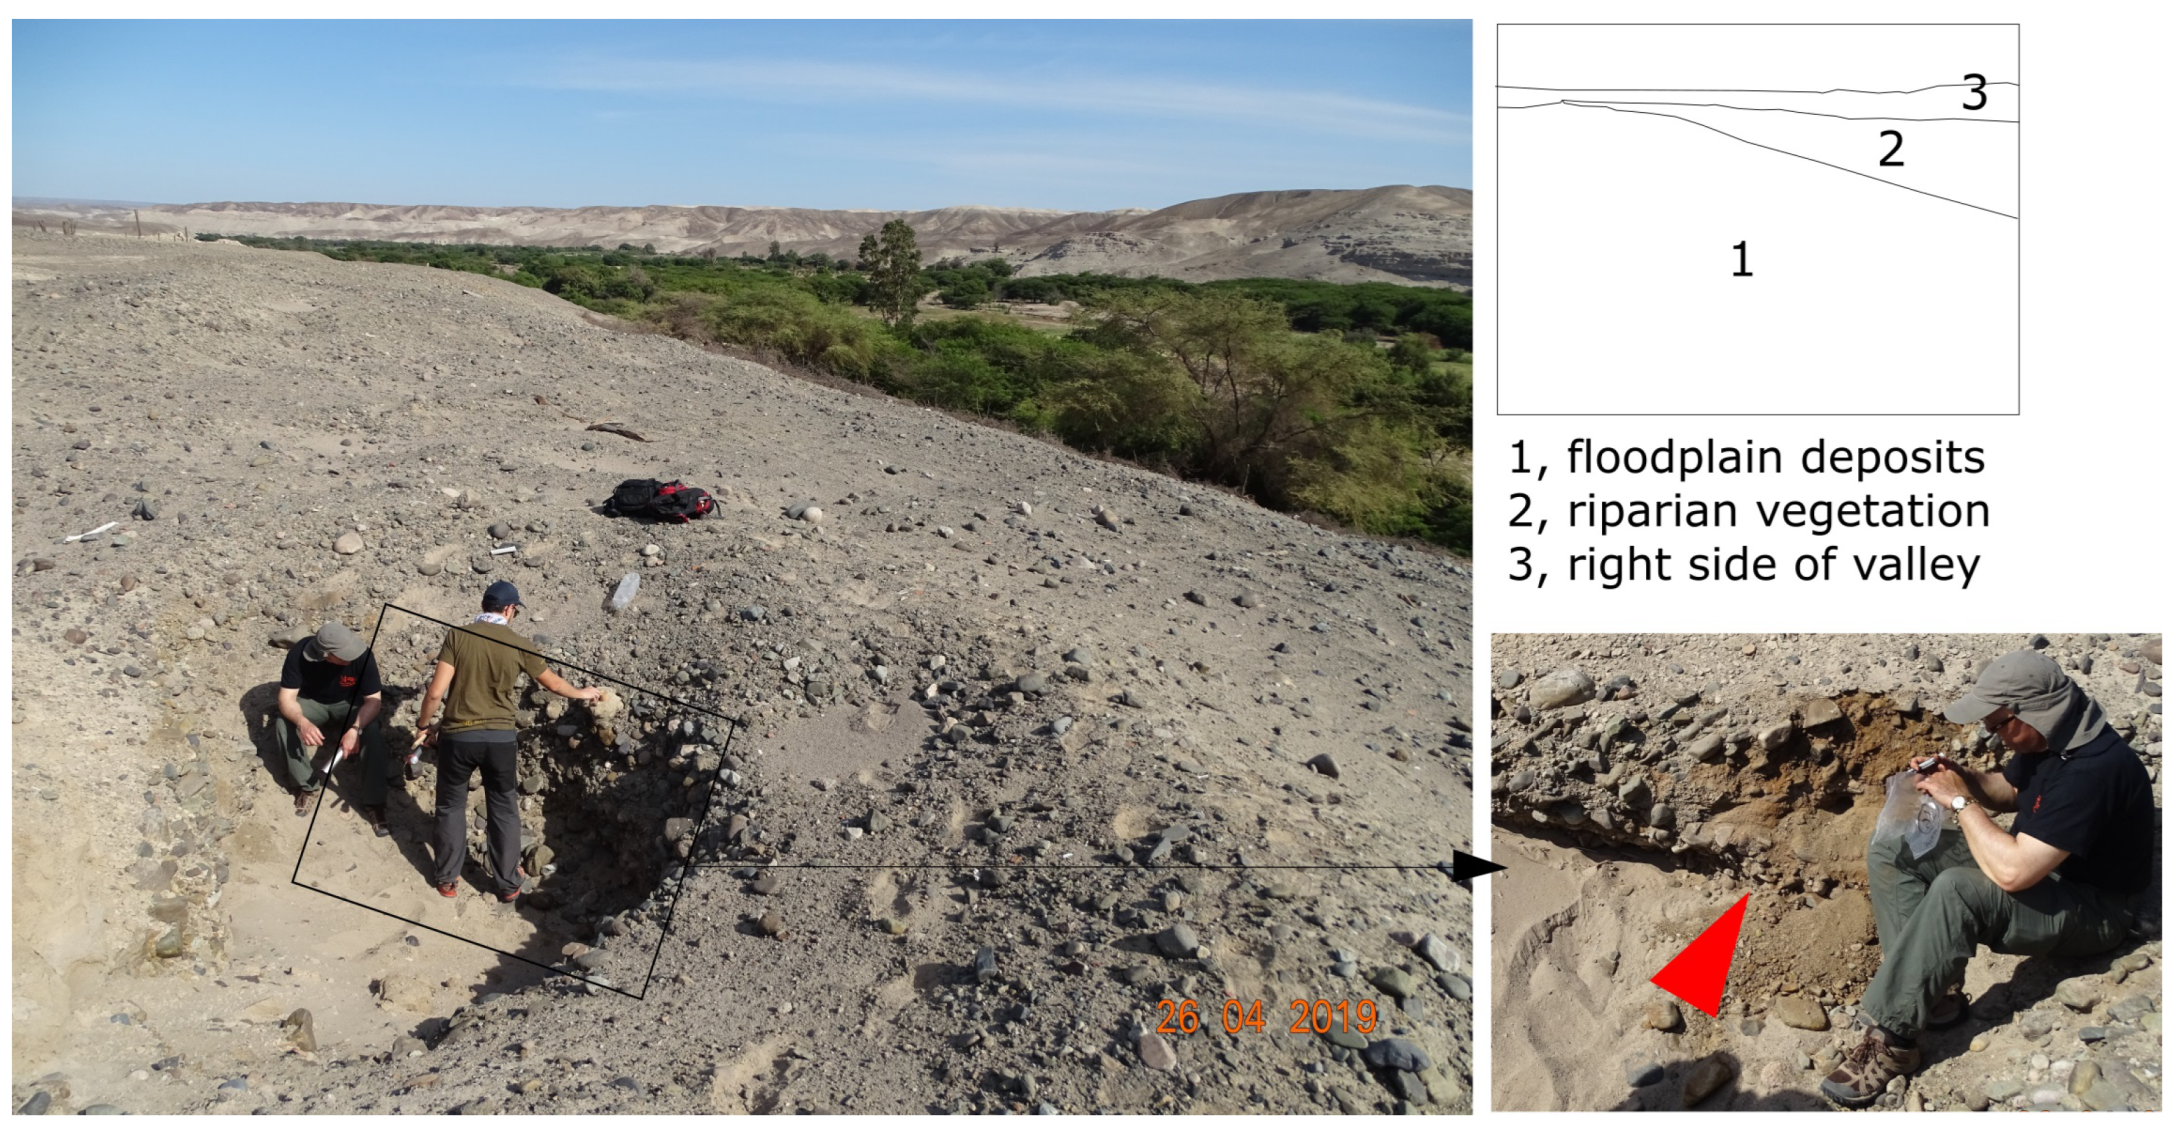
Figure 2. Sampling point 1. In the bottom right inset, the red arrow indicates the point from which NZ16 sample was extracted.
Preprints 120842 g002
Figure 3. Sampling point 2. In the bottom right inset, the red arrow indicates the point from which NZ8 sample was extracted. NZ7 sample was extracted about 0.2 m below.
Preprints 120842 g003
Figure 4. Sampling point 3. In the bottom right inset, the red arrow indicates the point from which NZ11 sample was extracted.
Preprints 120842 g004
Figure 5. Sampling point 4. In the bottom right inset, the red arrow indicates the point from which NZ1a sample was extracted.
Preprints 120842 g005
Figure 6. Sampling point 5. In the bottom right inset, the red arrow indicates the point from which NZ3 sample was extracted.
Preprints 120842 g006
Figure 7. Thin section photos (Crossed Nicols, a, b, d, e, g, h) and grainsize distribution in weight % (c, f, i) of NZ1a, NZ11 and NZ16 samples. Abbreviations of minerals and lithothype grains: Qz = quartz (Qz.em represents the embayed variety); Pl = plagioclase; Vcl = volcanic (mainly lavas) lithotype grain (Vcp represent the pyroclastic variety); Gt = granite lithotype grain (Gt.ex: represent the variety with subsolidus exolutions); Qte = quartzite lithotype grain.
Preprints 120842 g007
Figure 10. D e distributions obtained on Cahuachi samples. (a) NZ1a; (b) NZ3; (c) NZ11; (d) NZ16.
Preprints 120842 g010
Figure 11. Calibration of the conventional radiocarbon age (field sample: NZ3; Laboratory Code: LTL21547) by using the INCATL20 calibration curve for atmospheric data and the OxCal software.
Preprints 120842 g011
Table 1. Sampling profile and information on the sampling points.
Sampling point Samples Latitude* Longitude* Altitude**
1 NZ16 14°48’41.58”S 75°08’43.66”W 335
2 NZ7-8 14°48’38.45”S 75°07’49.86”W 345
3 NZ11 14°48’40.26”S 75°07’46.96”W 355
4 NZ1a 14°49’07.94”S 75°07’00.38”W 390
5 NZ3 14°49’10.53”S 75°06’57.05”W 390
* values extracted from Google Earth Pro; ** approximated values extracted from Google Earth Pro [m a.s.l.].
Table 2. Saturation water content (W), U, Th and K 2 O contents, dose rates, D e and ages obtained on Cahuachi samples.
Sample W ppm U (± 5%) ppm Th (± 5%) K2O (± 3%) Dose rate (mGy/a) D e (Gy) Age
NZ1a 0.22 2.32 7.33 1.73 2.65 ± 0.13 67 ± 4 > 25280 ± 1970
NZ3 0.21 2.96 9.36 1.89 3.08 ± 0.15 7.0 ± 0.7 2270 ± 250
NZ7 0.20 2.31 7.31 1.7 2.64 ± 0.13 nd
NZ8 0.20 2.99 9.45 1.75 2.98 ± 0.15 nd
NZ11 1 0.30 3.05 9.63 1.51 2.70 ± 0.13 66 ± 3 24440 ± 1650
143 ± 15 52960 ± 6140
NZ16 0.23 3.21 10.13 2.04 3.29 ± 0.16 63 ± 9 19150 ± 3100
1 D e calculated with FMM with two components. The lower component as a relative proportion of 81% and the upper 19%.
Disclaimer/Publisher’s Note: The statements, opinions and data contained in all publications are solely those of the individual author(s) and contributor(s) and not of MDPI and/or the editor(s). MDPI and/or the editor(s) disclaim responsibility for any injury to people or property resulting from any ideas, methods, instructions or products referred to in the content.
Copyright: This open access article is published under a Creative Commons CC BY 4.0 license, which permit the free download, distribution, and reuse, provided that the author and preprint are cited in any reuse.
Prerpints.org logo

Preprints.org is a free preprint server supported by MDPI in Basel, Switzerland.

Subscribe

© 2024 MDPI (Basel, Switzerland) unless otherwise stated