Submitted:
10 October 2024
Posted:
11 October 2024
You are already at the latest version
Abstract
Keywords:
1. Introduction
2. Materials And Methods
2.1. Area of Interest Description
2.2. Landscape Structure Analysis
| Country | All | Arable land | VVineyeVards | Permanent grass | Fallow land | Grass on field | |
|---|---|---|---|---|---|---|---|
| Total area (ha) | CZ | 144 579.1 | 129 187.5 | 5 132.3 | 7 981.0 | 682.4 | 703.8 |
| AT | 155 922.7 | 126 257.7 | 8 145.2 | 4 245.6 | 7 139.8 | 8 890.6 | |
| Proportion of landscape (%) | CZ | 100.0 | 89.4 | 3.6 | 5.5 | 0.5 | 0.5 |
| AT | 100.0 | 81.0 | 5.2 | 2.7 | 4.6 | 5.7 | |
| Number of patches | CZ | 13 172.0 | 7 036.0 | 1 478.0 | 3 086.0 | 601.0 | 447.0 |
| AT | 66 788.0 | 18 998.0 | 4 835.0 | 5 027.0 | 13 593.0 | 6 465.0 | |
| Patch density | CZ | 9.1 | 4.9 | 1.0 | 2.1 | 0.4 | 0.3 |
| AT | 42.8 | 12.2 | 3.1 | 3.2 | 8.7 | 4.1 | |
| Largest patch index | CZ | 0.37 | 0.37 | 0.04 | 0.06 | 0.02 | 0.02 |
| AT | 0.11 | 0.11 | 0.03 | 0.03 | 0.02 | 0.02 | |
| Total edge (m) | CZ | 1 551 290.0 | 1 480 348.0 | 196 248.0 | 463 950.0 | 698 246.0 | 153 428.0 |
| AT | 9 175 832.0 | 7 109 228.0 | 1 712 832.0 | 947 618.0 | 3 976 782.0 | 2 732 080.0 | |
| Edge density | CZ | 10.7 | 10.2 | 1.4 | 3.2 | 4.8 | 1.1 |
| AT | 58.8 | 45.6 | 11.0 | 6.1 | 25.5 | 17.5 | |
| Area mean (ha) | CZ | 11.0 | 18.4 | 3.5 | 2.6 | 1.1 | 1.6 |
| AT | 2.3 | 6.6 | 1.7 | 0.8 | 0.5 | 1.4 | |
| Area weighted mean (ha) | CZ | 57.3 | 62.7 | 13.8 | 11.1 | 8.6 | 9.4 |
| AT | 17.5 | 20.6 | 7.0 | 3.9 | 1.5 | 4.2 | |
| Area median (ha) | CZ | 2.26 | 7.43 | 1.16 | 1.12 | 0.36 | 0.41 |
| AT | 0.38 | 2.97 | 0.67 | 0.38 | 0.32 | 0.69 | |
| Area range (ha) | CZ | 531.7 | 531.7 | 52.2 | 92.0 | 27.5 | 35.0 |
| AT | 164.3 | 164.3 | 46.8 | 40.5 | 23.9 | 27.2 | |
| Area std. deviation (ha) | CZ | 22.6 | 28.5 | 6.0 | 4.7 | 2.9 | 3.5 |
| AT | 5.9 | 9.6 | 3.0 | 1.6 | 0.7 | 2.0 | |
| Area coef. of variation (ha) | CZ | 205.5 | 155.5 | 172.3 | 181.1 | 256.9 | 222.4 |
| AT | 254.8 | 144.9 | 177.0 | 188.8 | 139.1 | 143.4 |
2.3. Weather Data
2.4. Satellite Data Processing
2.5. Statistical Analysis
3. Results
3.1. Landscape Structure
3.2. Energy Fluxes
4. Discussion
5. Conclusions
Author Contributions
Funding
Data Availability Statement
Conflicts of Interest
Appendix A
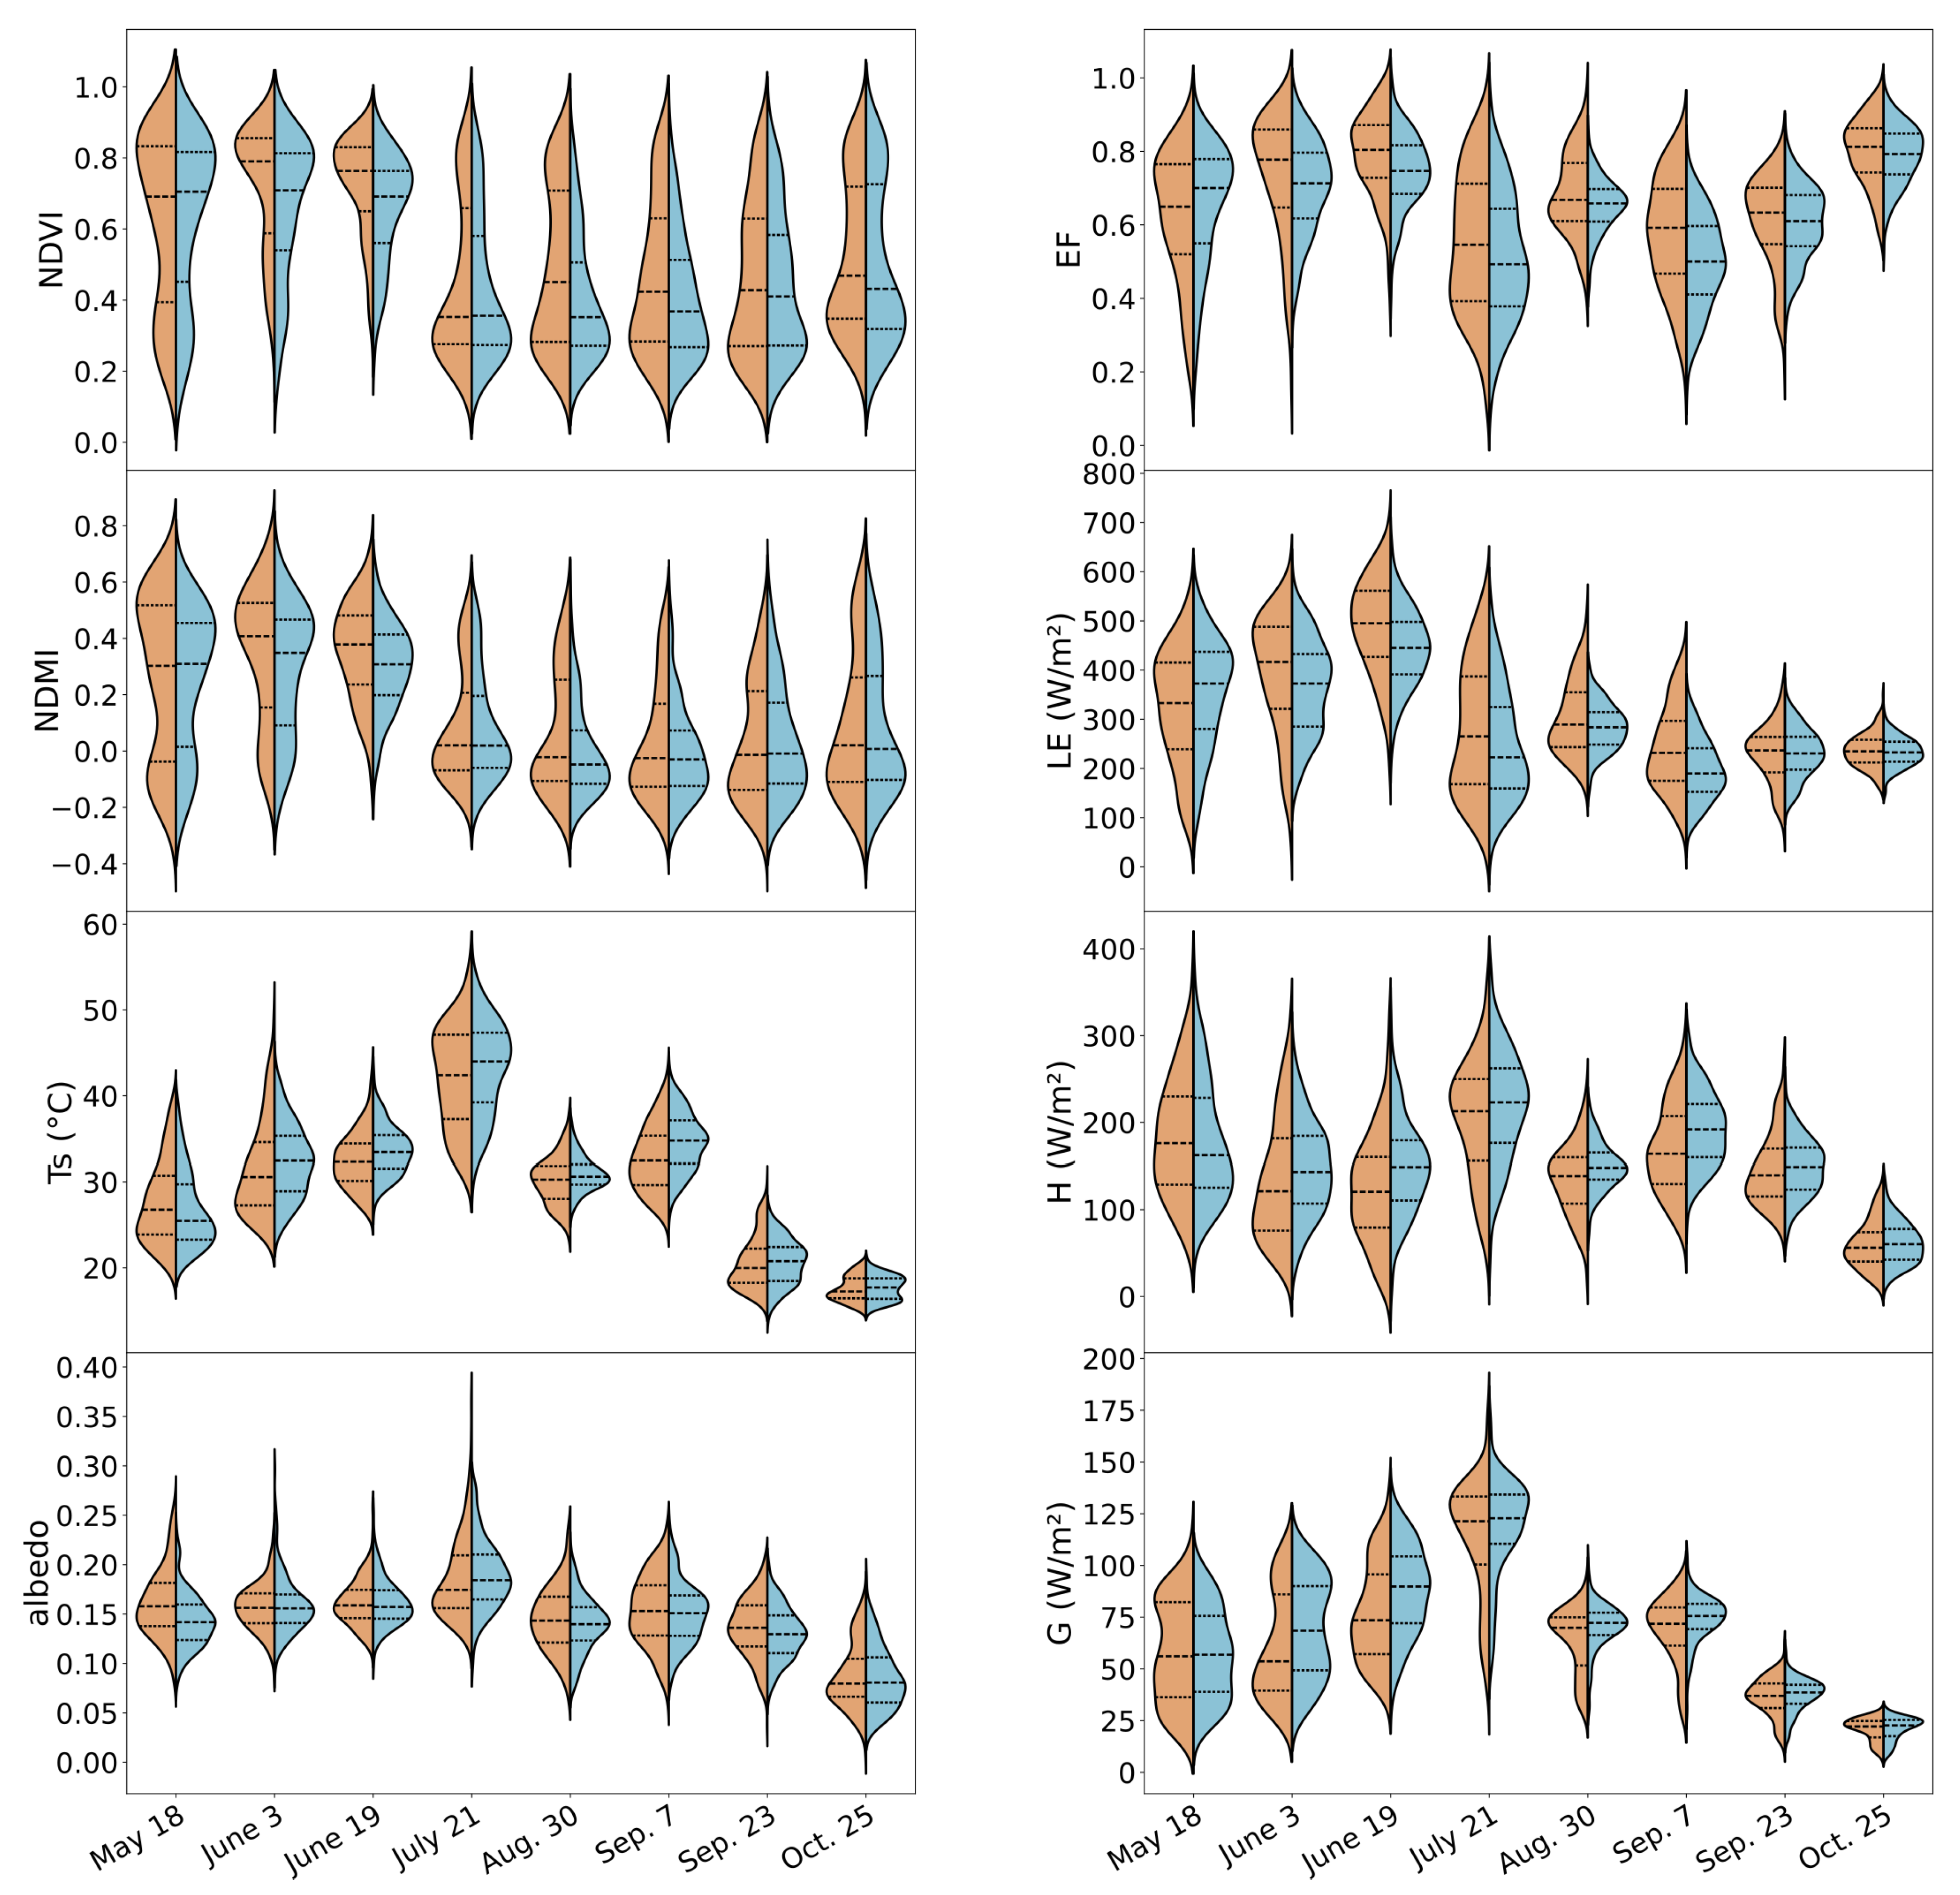
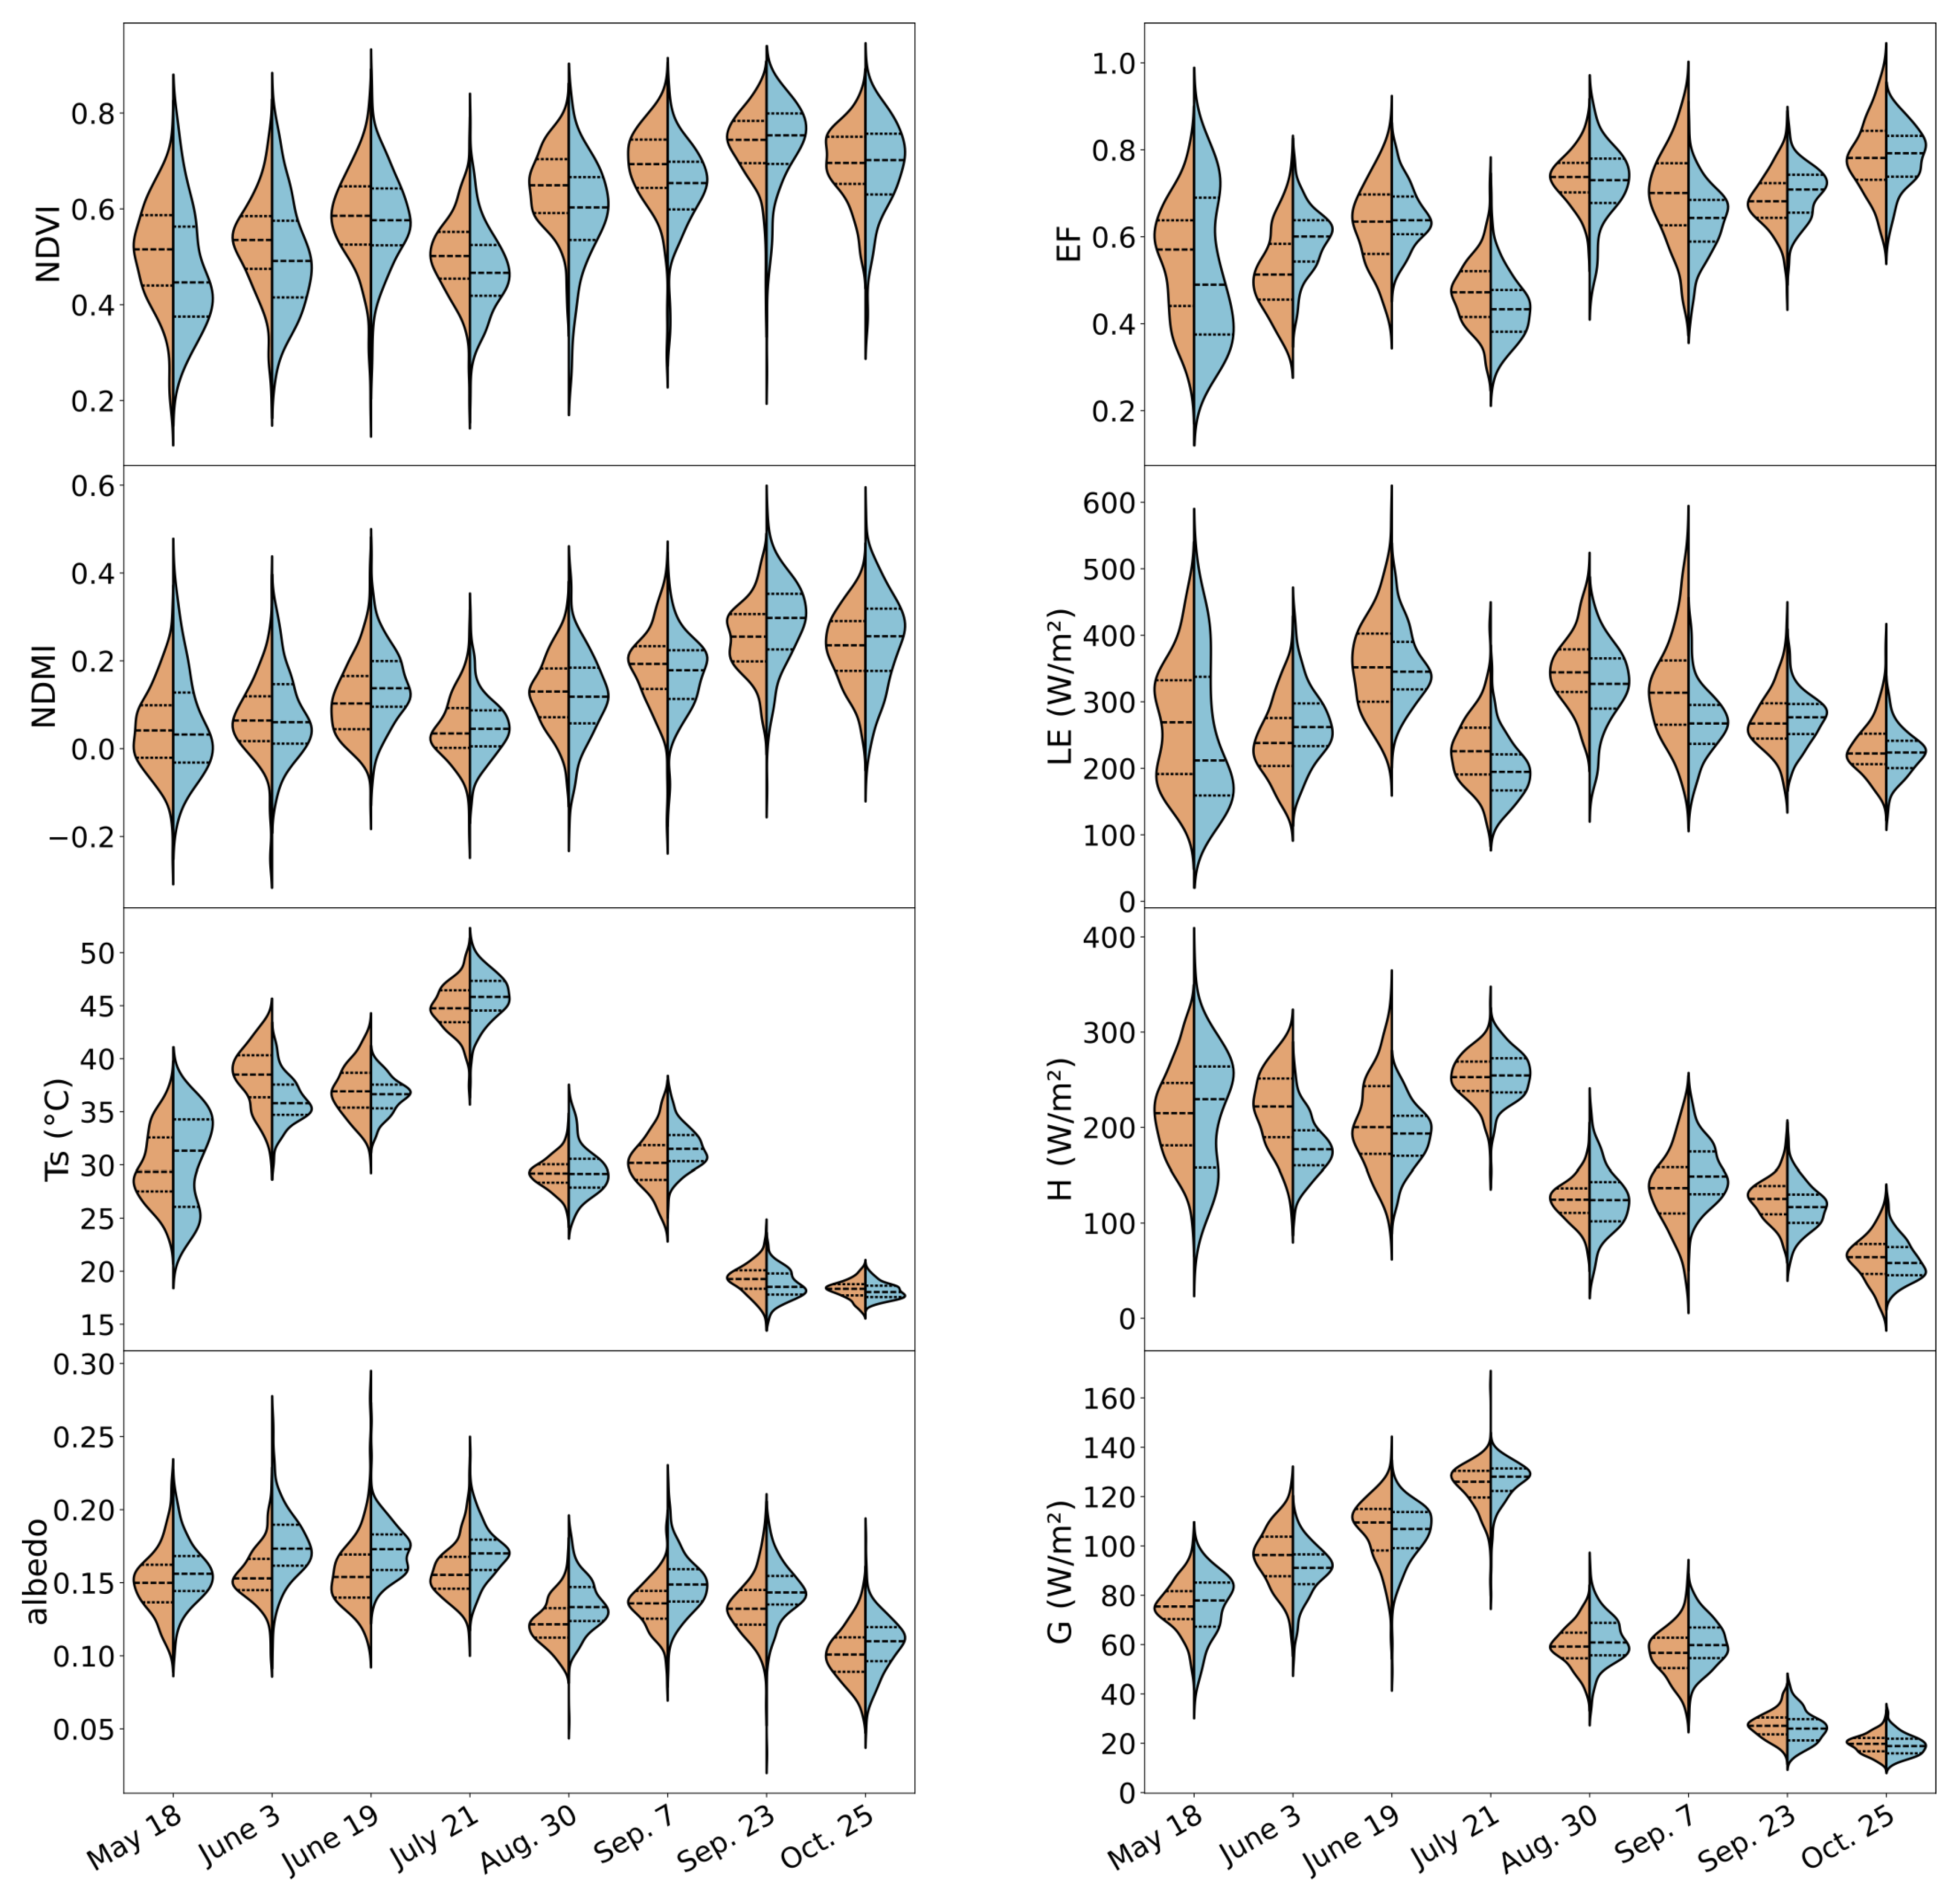
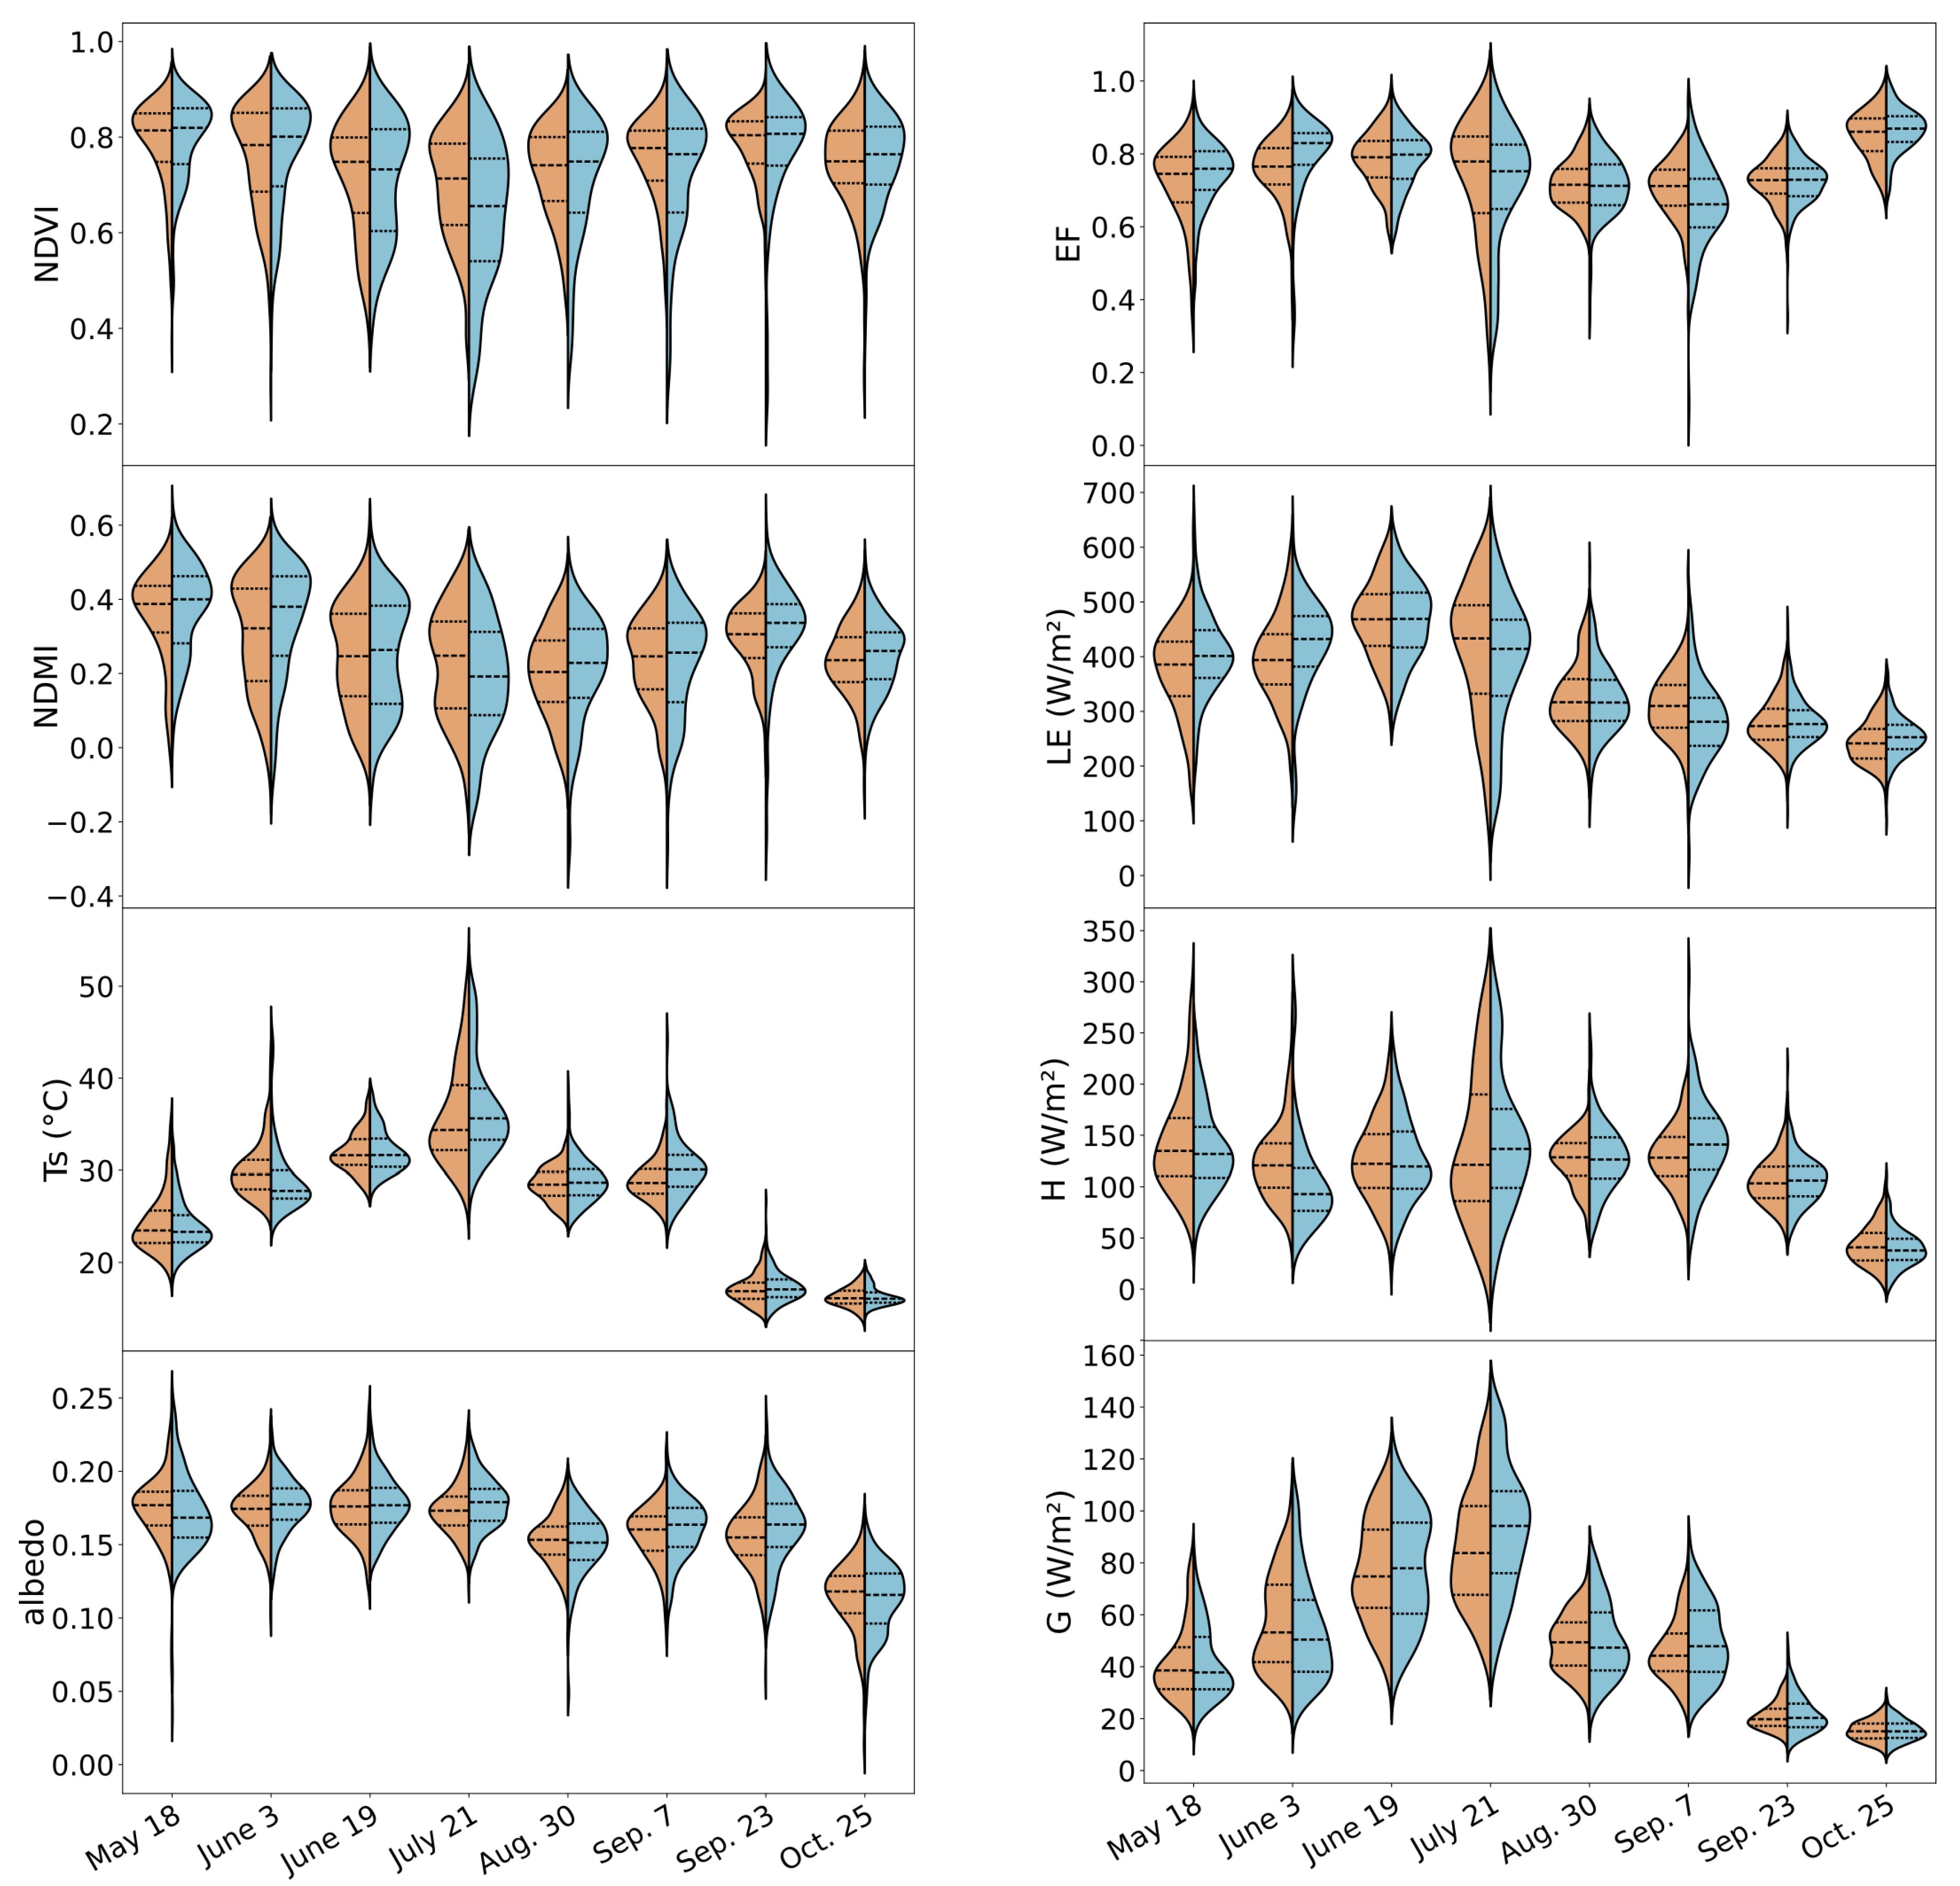
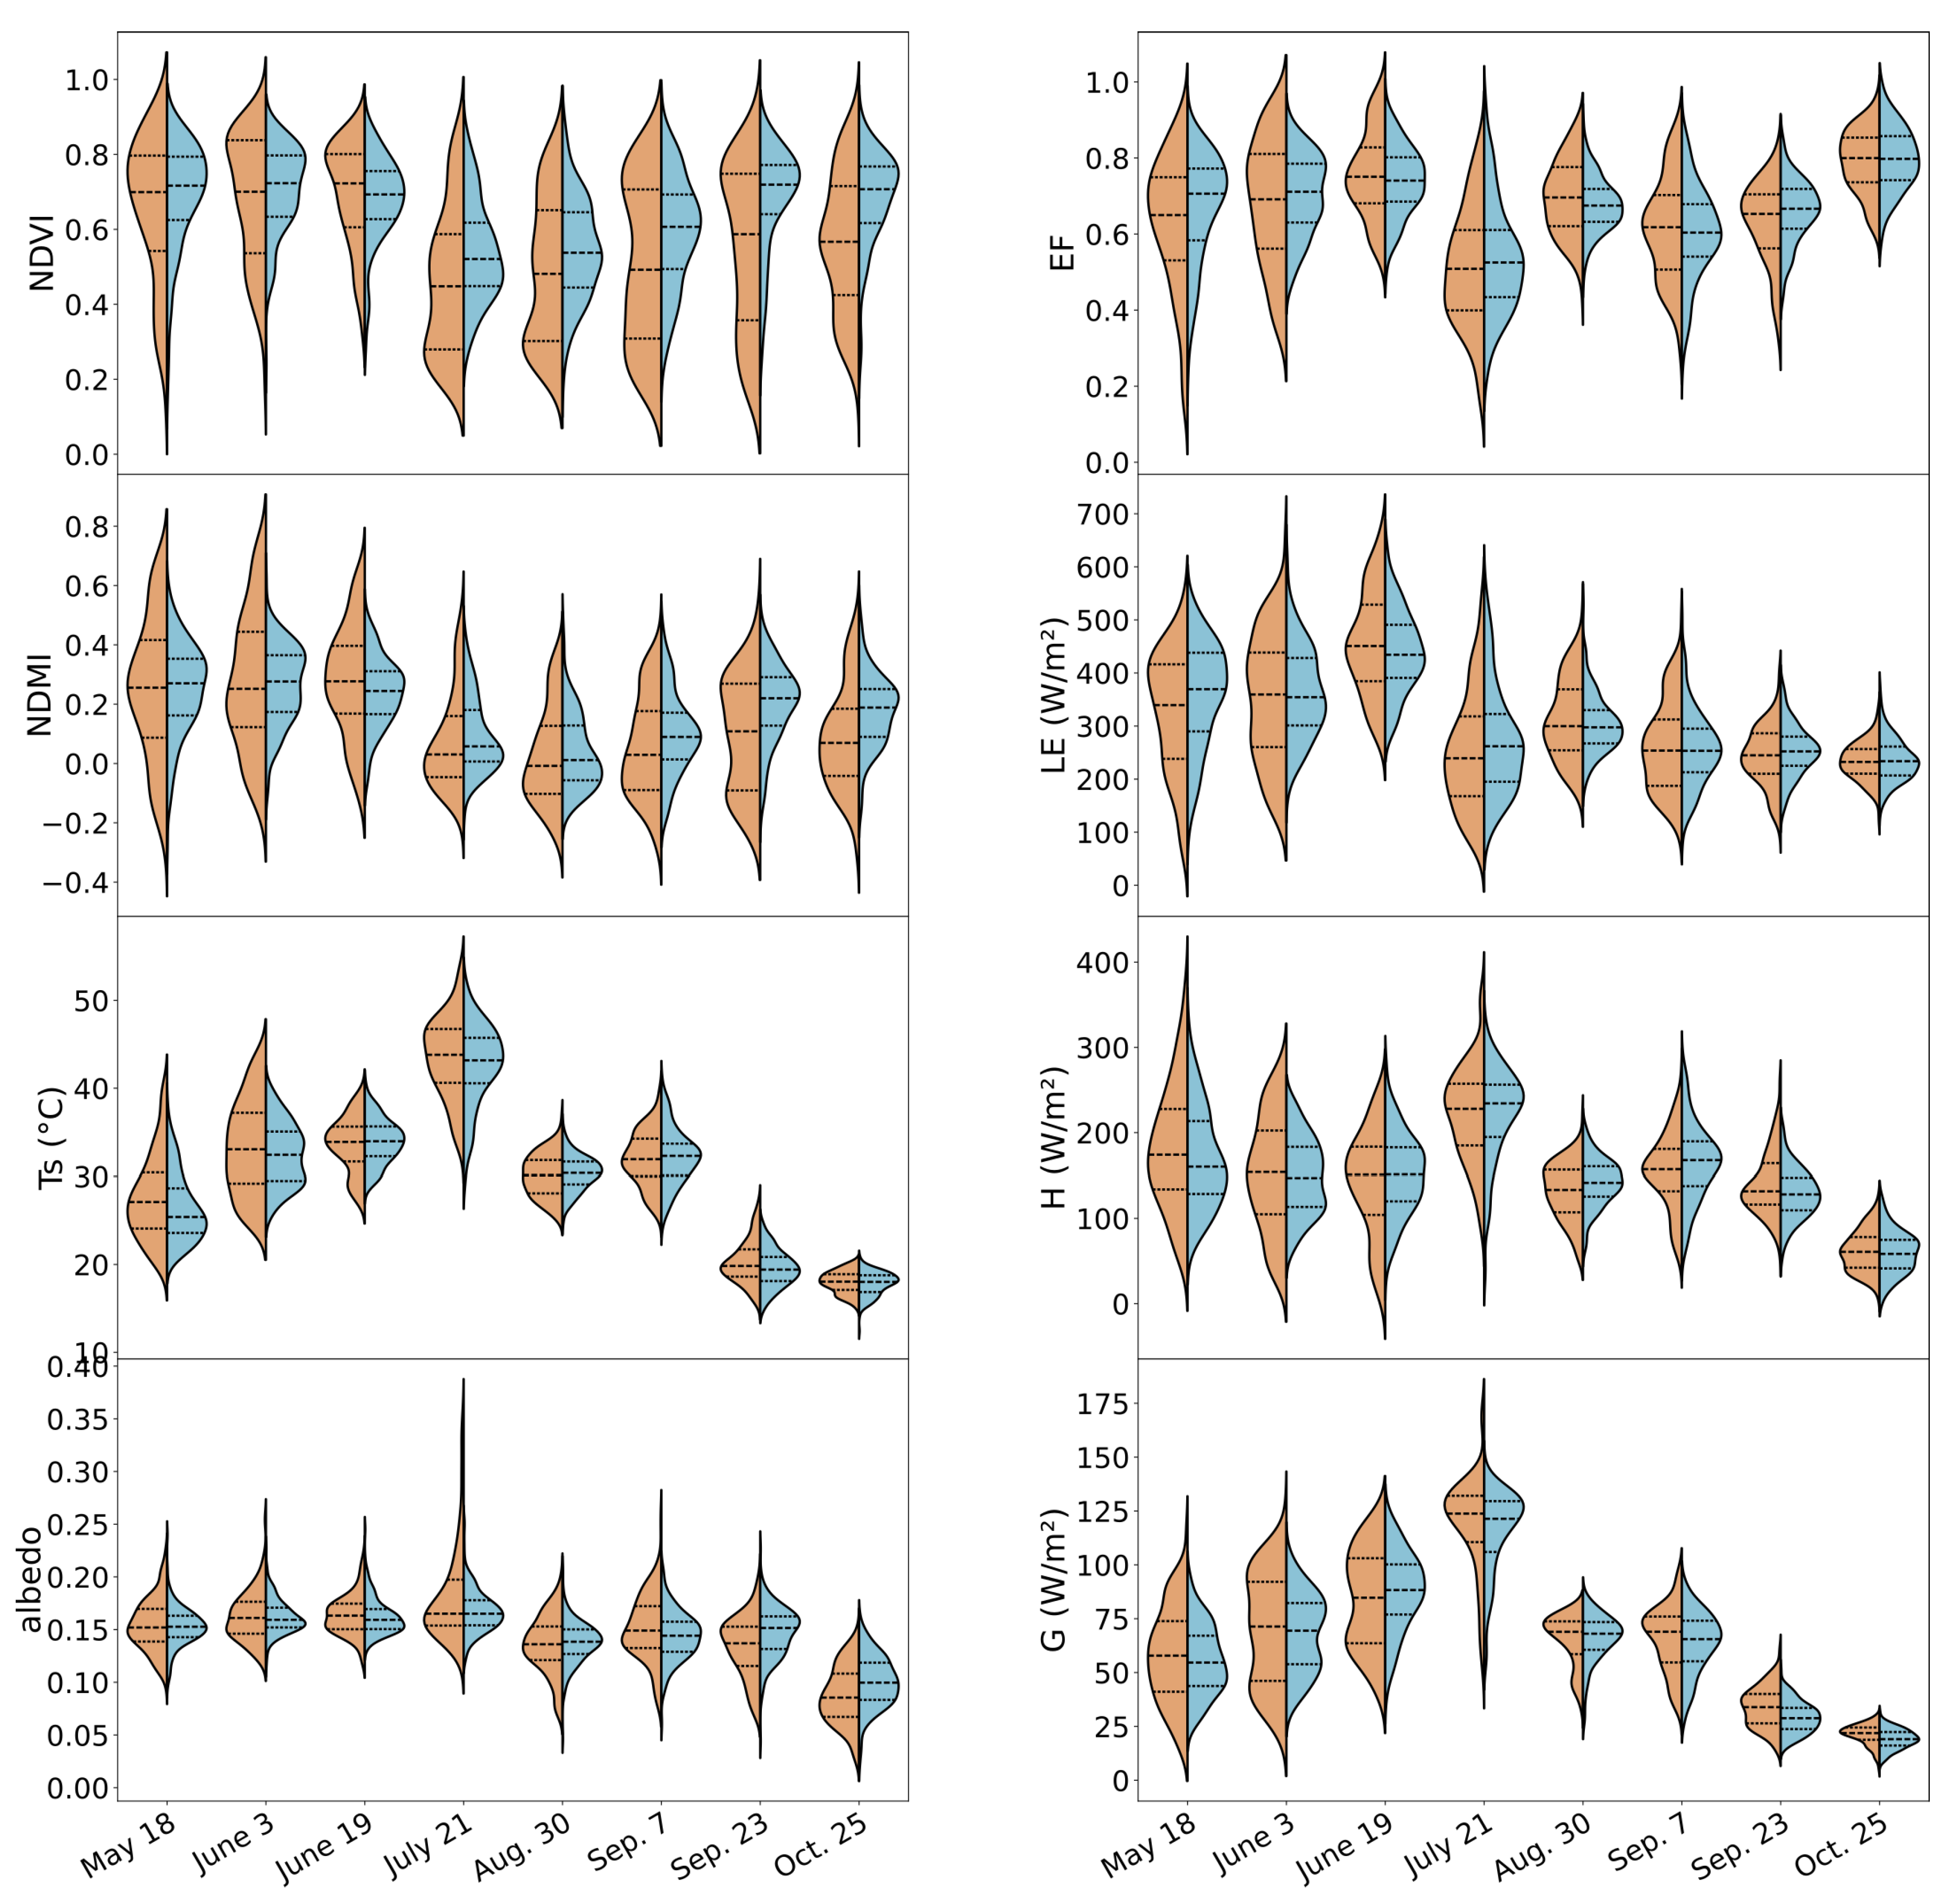
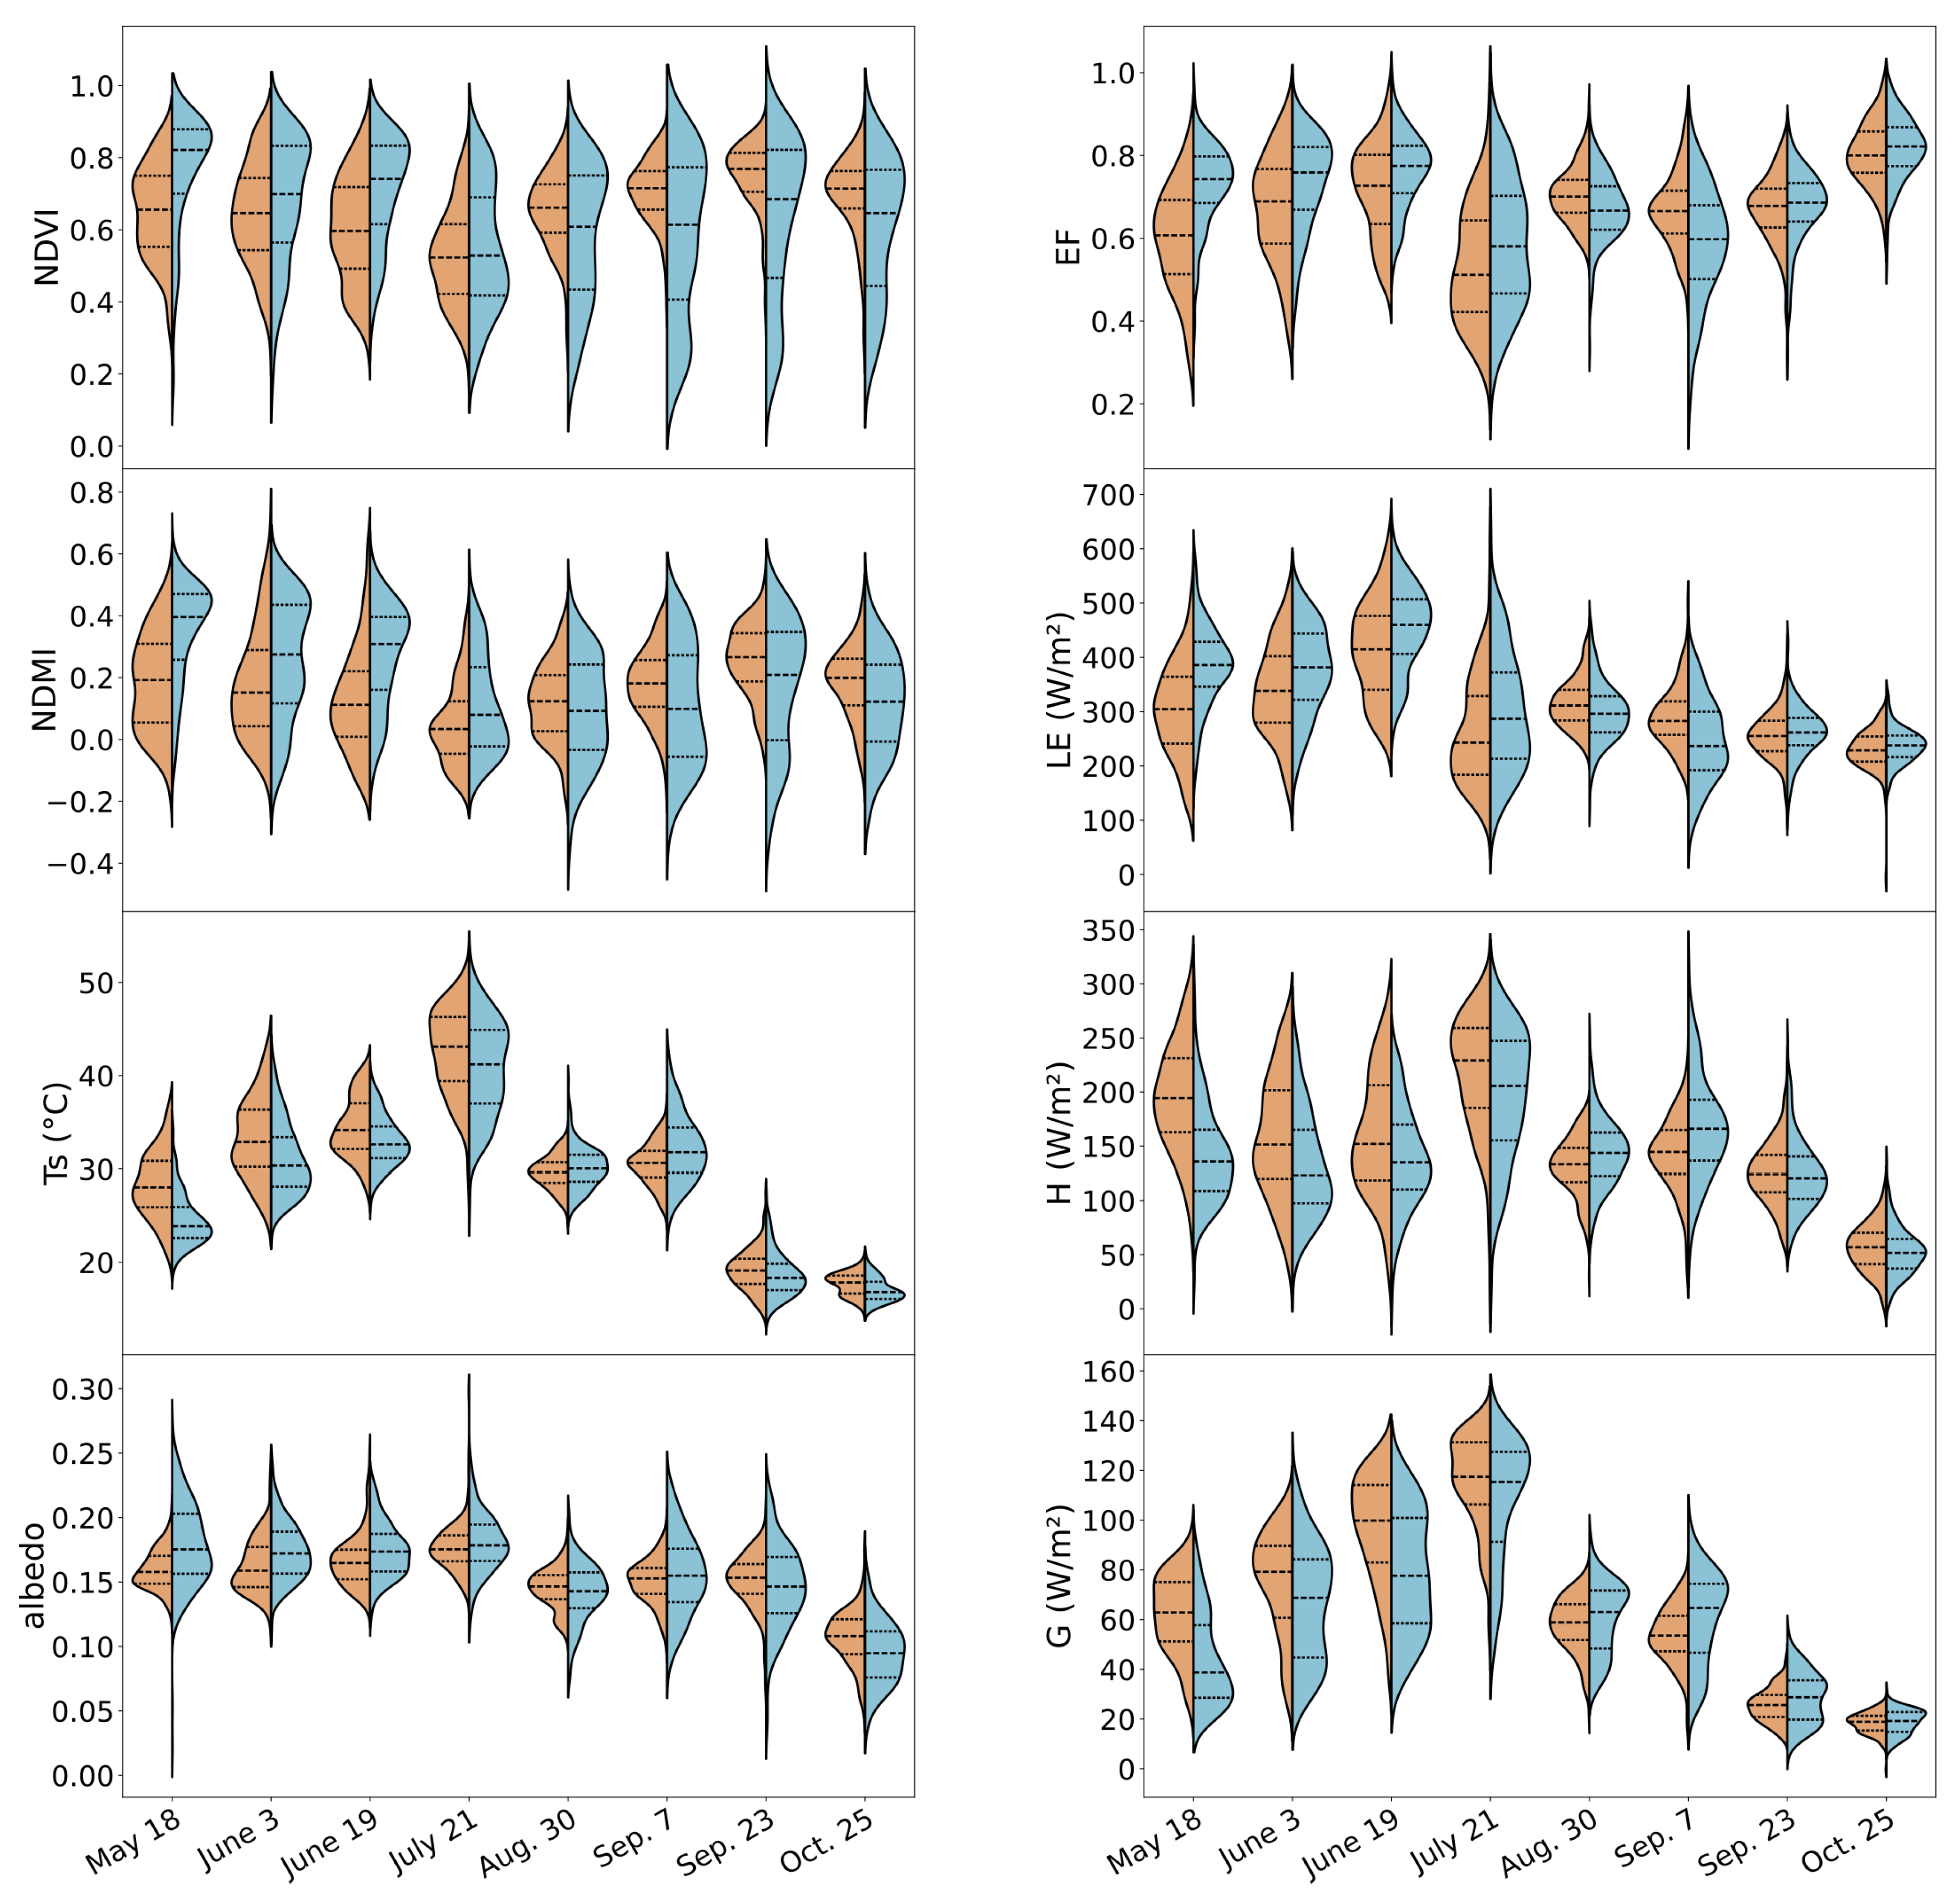
References
- Oliver, T.H.; Isaac, N.J.B.; August, T.A.; Woodcock, B.A.; Roy, D.B.; Bullock, J.M. Declining resilience of ecosystem functions under biodiversity loss. Nature Communications 2015, 6, 10122. [Google Scholar] [CrossRef] [PubMed]
- Bowles, T.M.; Mooshammer, M.; Socolar, Y.; Calderón, F.; Cavigelli, M.A.; Culman, S.W.; Deen, W.; Drury, C.F.; Garcia Y Garcia, A.; Gaudin, A.C.; Harkcom, W.S.; Lehman, R.M.; Osborne, S.L.; Robertson, G.P.; Salerno, J.; Schmer, M.R.; Strock, J.; Grandy, A.S. Long-Term Evidence Shows that Crop-Rotation Diversification Increases Agricultural Resilience to Adverse Growing Conditions in North America. One Earth 2020, 2, 284–293. [Google Scholar] [CrossRef]
- Shah, K.K.; Modi, B.; Pandey, H.P.; Subedi, A.; Aryal, G.; Pandey, M.; Shrestha, J. Diversified Crop Rotation: An Approach for Sustainable Agriculture Production. Advances in Agriculture 2021, 2021, 1–9. [Google Scholar] [CrossRef]
- Boesing, A.L.; Nichols, E.; Metzger, J.P. Effects of landscape structure on avian-mediated insect pest control services: A review. Landscape Ecology 2017, 32, 931–944. [Google Scholar] [CrossRef]
- Thies, C.; Tscharntke, T. Landscape Structure and Biological Control in Agroecosystems. Science 1999, 285, 893–895. [Google Scholar] [CrossRef]
- Smets, T.; Poesen, J.; Bochet, E. Impact of plot length on the effectiveness of different soil-surface covers in reducing runoff and soil loss by water. Progress in Physical Geography: Earth and Environment 2008, 32, 654–677. [Google Scholar] [CrossRef]
- Devátý, J.; Dostál, T.; Hösl, R.; Krása, J.; Strauss, P. Effects of historical land use and land pattern changes on soil erosion – Case studies from Lower Austria and Central Bohemia. Land Use Policy 2019, 82, 674–685. [Google Scholar] [CrossRef]
- Zuazo, V.H.D.; Pleguezuelo, C.R.R. Soil-Erosion and Runoff Prevention by Plant Covers: A Review. In Sustainable Agriculture; Lichtfouse, E., Navarrete, M., Debaeke, P., Véronique, S., Alberola, C., Eds.; Springer Netherlands: Dordrecht, 2009; pp. 785–811. [Google Scholar] [CrossRef]
- Tlapáková, L.; Žaloudík, J.; Kolejka, J. Thematic survey of subsurface drainage systems in the Czech Republic. Journal of Maps 2017, 13, 55–65. [Google Scholar] [CrossRef]
- Watson, A.J.; Lovelock, J.E. Biological homeostasis of the global environment: The parable of Daisyworld. Tellus B 1983, 35B, 284–289. [Google Scholar] [CrossRef]
- Shukla, J.; Mintz, Y. Influence of Land-Surface Evapotranspiration on the Earth’s Climate. Science 1982, 215, 1498–1501. [Google Scholar] [CrossRef]
- Segal, M.; Avissar, R.; McCumber, M.C.; Pielke, R.A. Evaluation of Vegetation Effects on the Generation and Modification of Mesoscale Circulations. Journal of the Atmospheric Sciences 1988, 45, 2268–2293. [Google Scholar] [CrossRef]
- Pielke, R.A.; Avissar, R. Influence of landscape structure on local and regional climate. Landscape Ecology 1990, 4, 133–155. [Google Scholar] [CrossRef]
- Hayden, B.P. Ecosystem feedbacks on climate at the landscape scale. Philosophical Transactions of the Royal Society B: Biological Sciences 1998, 353, 5–18. [Google Scholar] [CrossRef]
- Pielke, R.A.; Marland, G.; Betts, R.A.; Chase, T.N.; Eastman, J.L.; Niles, J.O.; Niyogi, D.d.S.; Running, S.W. The influence of land-use change and landscape dynamics on the climate system: Relevance to climate-change policy beyond the radiative effect of greenhouse gases. Philosophical Transactions of the Royal Society A: Mathematical, Physical and Engineering Sciences 2002, 360, 1705–1719. [Google Scholar] [CrossRef]
- Nippgen, F.; McGlynn, B.L.; Marshall, L.A.; Emanuel, R.E. Landscape structure and climate influences on hydrologic response. Water Resources Research 2011, 47, 2011WR011161. [Google Scholar] [CrossRef]
- Mackey, C.W.; Lee, X.; Smith, R.B. Remotely sensing the cooling effects of city scale efforts to reduce urban heat island. Building and Environment 2012, 49, 348–358. [Google Scholar] [CrossRef]
- Favretto, A. Urban Heat Island analysis with Remote Sensing and GIS methods: An application in the Trieste area (North-East of Italy). Bollettino della Società Geografica Italiana 2018, 1, 215–229. [Google Scholar] [CrossRef]
- Stewart, I.D.; Oke, T.R. Local Climate Zones for Urban Temperature Studies. Bulletin of the American Meteorological Society 2012, 93, 1879–1900. [Google Scholar] [CrossRef]
- Debbage, N.; Shepherd, J.M. The urban heat island effect and city contiguity. Computers, Environment and Urban Systems 2015, 54, 181–194. [Google Scholar] [CrossRef]
- Hesslerová, P.; Pokorný, J.; Huryna, H.; Seják, J.; Jirka, V. The impacts of greenery on urban climate and the options for use of thermal data in urban areas. Progress in Planning 2022, 159, 100545. [Google Scholar] [CrossRef]
- Du, S.; Xiong, Z.; Wang, Y.C.; Guo, L. Quantifying the multilevel effects of landscape composition and configuration on land surface temperature. Remote Sensing of Environment 2016, 178, 84–92. [Google Scholar] [CrossRef]
- Connors, J.P.; Galletti, C.S.; Chow, W.T.L. Landscape configuration and urban heat island effects: Assessing the relationship between landscape characteristics and land surface temperature in Phoenix, Arizona. Landscape Ecology 2013, 28, 271–283. [Google Scholar] [CrossRef]
- Harlan, S.L.; Brazel, A.J.; Prashad, L.; Stefanov, W.L.; Larsen, L. Neighborhood microclimates and vulnerability to heat stress. Social Science & Medicine 2006, 63, 2847–2863. [Google Scholar] [CrossRef]
- Zelinka, V.; Zacharová, J.; Skaloš, J. Analysis of spatiotemporal changes of agricultural land after the Second World War in Czechia. Scientific Reports 2021, 11, 12655. [Google Scholar] [CrossRef]
- Bičík, I.; Kupková, L.; Jeleček, L.; Kabrda, J.; Štych, P.; Janoušek, Z.; Winklerová, J. Land use changes in the Czech Republic 1845–2010: socio-economic driving forces; Springer Geography, Springer: Cham, 2015. [Google Scholar]
- Sklenička, P.; Šímová, P.; Hrdinová, K.; Šálek, M. Changing rural landscapes along the border of Austria and the Czech Republic between 1952 and 2009: Roles of political, socioeconomic and environmental factors. Applied Geography 2014, 47, 89–98. [Google Scholar] [CrossRef]
- Rašín, R.; Chromỳ, P. Land use and land cover development along the Czech-Austrian boundary. In Land use/cover changes in selected regions in the World; Bičík, I., Himiyama, Y., Feranec, J., Eds.; Institute of Geography, Hokkaido University of Education: Asahikawa, 2010. [Google Scholar]
- Grešlová, P.; Gingrich, S.; Krausmann, F.; Chromý, P.; Jančák, V. Social metabolism of Czech agriculture in the period 1830–2010. AUC GEOGRAPHICA 2015, 50, 23–35. [Google Scholar] [CrossRef]
- Kupková, L.; Bičík, I.; Najman, J. Land cover changes along the iron curtain 1990–2006. Geografie 2013, 118, 95–115. [Google Scholar] [CrossRef]
- Belda, M.; Holtanová, E.; Halenka, T.; Kalvová, J. Climate classification revisited: From Köppen to Trewartha. Climate Research 2014, 59, 1–13. [Google Scholar] [CrossRef]
- Czech Hydrometeorological Institute. Portál ČHMÚ: Historická data: Počasí: Základní informace (Czech Hydrometeorological Institute Portal: Historical data: Weather: Basic Information). https://www.chmi.cz/historicka-data/pocasi/zakladni-informace, accessed on 2024-09-27.
- INSPIRE. INSPIRE Geoportal Österreich. https://geometadatensuche.inspire.gv.at/metadatensuche/inspire/eng/catalog.search#/home, accessed on 2024-09-27.
- Ministry of Agriculture of the Czech Republic. Veřejný export dat LPIS. https://mze.gov.cz/public/portal/mze/farmar/LPIS/uzivatelske-prirucky/prirucky-pro-verejny-lpis/export-dat-lpis, accessed on 2024-09-27.
- Bosch, M. PyLandStats: An open-source Pythonic library to compute landscape metrics. PLOS ONE 2019, 14, e0225734. [Google Scholar] [CrossRef]
- McGarigal, K.; Cushman, S.; Ene, E. FRAGSTATS v4: Spatial Pattern Analysis Program for Categorical Maps. Computer software program produced by the authors. https://www.fragstats.org/, accessed on 2024-09-27.
- Meteostat. The Meteostat JSON API. https://rapidapi.com/meteostat/api/meteostat, accessed on 2024-09-27.
- Hofierka, J.; Suri, M. ; others. The solar radiation model for Open source GIS: Implementation and applications. Proceedings of the Open source GIS-GRASS users conference, 2002, Vol. 2002, pp. 51–70.
- Caha, J. QGIS algorithm - r.sun.incidout — grass_r_sun_incidout. https://jancaha.github.io/r_package_qgis/reference/grass_r_sun_incidout.html, accessed on 2024-09-27.
- Earth Resources Observation and Science (EROS) Center. Landsat 8-9 Operational Land Imager / Thermal Infrared Sensor Level-2, Collection 2, 2013. [CrossRef]
- Farr, T.G.; Rosen, P.A.; Caro, E.; Crippen, R.; Duren, R.; Hensley, S.; Kobrick, M.; Paller, M.; Rodriguez, E.; Roth, L.; Seal, D.; Shaffer, S.; Shimada, J.; Umland, J.; Werner, M.; Oskin, M.; Burbank, D.; Alsdorf, D. The Shuttle Radar Topography Mission. Reviews of Geophysics 2007, 45, 2005RG000183. [Google Scholar] [CrossRef]
- Qiu, S.; Zhu, Z.; He, B. Fmask 4.0: Improved cloud and cloud shadow detection in Landsats 4–8 and Sentinel-2 imagery. Remote Sensing of Environment 2019, 231, 111205. [Google Scholar] [CrossRef]
- Zhu, Z.; Wang, S.; Woodcock, C.E. Improvement and expansion of the Fmask algorithm: Cloud, cloud shadow, and snow detection for Landsats 4–7, 8, and Sentinel 2 images. Remote Sensing of Environment 2015, 159, 269–277. [Google Scholar] [CrossRef]
- Tucker, C.J. Red and photographic infrared linear combinations for monitoring vegetation. Remote Sensing of Environment 1979, 8, 127–150. [Google Scholar] [CrossRef]
- Swoish, M.; Da Cunha Leme Filho, J.F.; Reiter, M.S.; Campbell, J.B.; Thomason, W.E. Comparing satellites and vegetation indices for cover crop biomass estimation. Computers and Electronics in Agriculture 2022, 196, 106900. [Google Scholar] [CrossRef]
- Gitelson, A.A. Wide Dynamic Range Vegetation Index for Remote Quantification of Biophysical Characteristics of Vegetation. Journal of Plant Physiology 2004, 161, 165–173. [Google Scholar] [CrossRef]
- Jin, S.; Sader, S. Comparison of time series tasseled cap wetness and the normalized difference moisture index in detecting forest disturbances. Remote Sensing of Environment 2005, 94, 364–372. [Google Scholar] [CrossRef]
- Liang, S. Narrowband to broadband conversions of land surface albedo I. Remote Sensing of Environment 2001, 76, 213–238. [Google Scholar] [CrossRef]
- Liang, S.; Shuey, C.J.; Russ, A.L.; Fang, H.; Chen, M.; Walthall, C.L.; Daughtry, C.S.; Hunt, R. Narrowband to broadband conversions of land surface albedo: II. Validation. Remote Sensing of Environment 2003, 84, 25–41. [Google Scholar] [CrossRef]
- Tasumi, M.; Allen, R.G.; Trezza, R. At-Surface Reflectance and Albedo from Satellite for Operational Calculation of Land Surface Energy Balance. Journal of Hydrologic Engineering 2008, 13, 51–63. [Google Scholar] [CrossRef]
- Olmedo, G.F.; Ortega-Farías, S.; de la Fuente-Sáiz, D.; Fonseca-Luego, D.; Fuentes-Peñailillo, F. water: Tools and Functions to Estimate Actual Evapotranspiration Using Land Surface Energy Balance Models in R. The R Journal 2016, 8, 352–369. [Google Scholar] [CrossRef]
- Bowen, I. The Ratio of Heat Losses by Conduction and by Evaporation from any Water Surface. Physical Review 1926, 27, 779–787. [Google Scholar] [CrossRef]
- Suleiman, A.; Crago, R. Hourly and Daytime Evapotranspiration from Grassland Using Radiometric Surface Temperatures. Agronomy Journal 2004, 96, 384–390. [Google Scholar] [CrossRef]
- Pokorný, J.; Brom, J.; Čermák, J.; Hesslerová, P.; Huryna, H.; Nadezhdina, N.; Rejšková, A. Solar energy dissipation and temperature control by water and plants. International Journal of Water 2010, 5, 311–336. [Google Scholar] [CrossRef]
- Brom, J. SEBCS for QGIS - Module for calculation of energy balance features and vegetation water stress indices; University of South Bohemia in České Budějovice, 2021.
- Bastiaanssen, W.; Menenti, M.; Feddes, R.; Holtslag, A. A remote sensing surface energy balance algorithm for land (SEBAL). 1. Formulation. Journal of Hydrology 1998, 212-213, 198–212. [Google Scholar] [CrossRef]
- Klug, H.; Gottsmann, F.; Heredia, M. Transboundary landscape structure to determine the environmental situation of traditional land-use activities in Austria and Czech Republic. 10th international conference on information & communication technologies (ICT) in urban planning and spatial development and impacts of ICT on physical space, 2005, pp. 201–206.
- EUROSTAT. Farms and farmlands in the European Union - statistics; Statistics Explained 2022, pp.1–9.
- Ministry of Agriculture of the Czech Republic. Facts and Data. https://mze.gov.cz/public/portal/en/mze/about-ministry/facts-and-data, accessed on 2024-09-27.
- Kowalski, A.; Wigier, M. ; Instytut Ekonomiki Rolnictwa i Gospodarki Żywnościowej., Eds. The common agricultural policy of the European Union: The present and the future: EU member states point of view: Proceedings of the International Scientific Conference "The Common Agricultural Policy of the European Union - the present and the future", 5-7 December 2017, Stare Jabłonki, Poland; Number 73.1 in Monographs of Multi-Annual Programme, Dział Wydawnictw Instytutu Ekonomiki Rolnictwa i Gospodarki Żywnościowej - Państwowego Instytutu Badawczego: Warszawa, 2018. [Google Scholar]
- IS StaR. Average size of a section of the arable land block | IS StaR Portal. https://www.sdg-data.cz/en/cr-2030/odolne-ekosystemy/average-size-of-a-section-of-the-arable-land-block, accessed on 2024-09-27.
- Peyr, S. FarmStructureSurvey2020:Agriculturalandforestryholdingsincreasedinsize. STATISTICS AUSTRIA, Correctedpressrelease:12.853-151/22 2022, pp.1–2.
- Al-Amin, A.K.M.A.; Lowenberg-DeBoer, J.; Franklin, K.; Behrendt, K. Economics of field size and shape for autonomous crop machines. Precision Agriculture 2023, 24, 1738–1765. [Google Scholar] [CrossRef]
- Brunotte, J.; Fröba, N. Schlaggestaltung - kostensenkend und bodenschonend; Number 460 in KTBL-Schrift, KTBL, Kuratorium für Technik und Bauwesen in der Landwirtschaft: Darmstadt, 2007. [Google Scholar]
- Ševčík, R.; Krivopalova, A.; Cukor, J. Přímý vliv struktury zemědělské krajiny na výměru domovských okrsků zajíce polního: Předběžné výsledky z České republiky. Zprávy lesnického výzkumu 2023, 68. [Google Scholar] [CrossRef]
- Schai-Braun, S.C.; Ruf, T.; Klansek, E.; Arnold, W.; Hackländer, K. Positive effects of set-asides on European hare (Lepus europaeus) populations: Leverets benefit from an enhanced survival rate. Biological Conservation 2020, 244, 108518. [Google Scholar] [CrossRef]
- Smith, R.K.; Vaughan Jennings, N.; Harris, S. A quantitative analysis of the abundance and demography of European hares Lepus europaeus in relation to habitat type, intensity of agriculture and climate. Mammal Review 2005, 35, 1–24. [Google Scholar] [CrossRef]
- Reif, J.; Gamero, A.; Hološková, A.; Aunins, A.; Chodkiewicz, T.; Hristov, I.; Kurlavičius, P.; Leivits, M.; Szép, T.; Voříšek, P. Accelerated farmland bird population declines in European countries after their recent EU accession. Science of The Total Environment 2024, 946, 174281. [Google Scholar] [CrossRef]
- Šálek, M.; Kalinová, K.; Daňková, R.; Grill, S.; Żmihorski, M. Reduced diversity of farmland birds in homogenized agricultural landscape: A cross-border comparison over the former Iron Curtain. Agriculture, Ecosystems & Environment 2021, 321, 107628. [Google Scholar] [CrossRef]
- Huryna, H.; Pokorný, J. The role of water and vegetation in the distribution of solar energy and local climate: A review. Folia Geobotanica 2016, 51, 191–208. [Google Scholar] [CrossRef]
- Ripl, W.; Eiseltová, M. Sustainable land management by restoration of short water cycles and prevention of irreversible matter losses from topsoils. Plant Soil and Environment 2009, 55, 404–410. [Google Scholar] [CrossRef]
- Pokorný, J. Dissipation of solar energy in landscape—controlled by management of water and vegetation. Renewable Energy 2001, 24, 641–645. [Google Scholar] [CrossRef]
- STATISTICS AUSTRIA. Arable land, permanent grassland. https://www.statistik.at/en/statistics/agriculture-and-forestry/crop-production-and-farming/arable-land-permanent-grassland, accessed on 2024-09-27.
- Czech Statistical Office. Agriculture. https://csu.gov.cz/agriculture, accessed on 2024-09-27.
- Zahradníček, P.; Brázdil, R.; Štěpánek, P.; Trnka, M. Reflections of global warming in trends of temperature characteristics in the Czech Republic, 1961–2019. International Journal of Climatology 2021, 41, 1211–1229. [Google Scholar] [CrossRef]
- Mužíková, B.; Vlček, V.; Středa, T.; others. Tendencies of climatic extremes occurrence in different Moravian regions and landscape types. Acta Universitatis Agriculturae et Silviculturae Mendelianae Brunensis 2011, 59, 169–178. [Google Scholar] [CrossRef]
- Potop, V.; Türkott, L.; Kožnarová, V.; Možný, M. Drought episodes in the Czech Republic and their potential effects in agriculture. Theoretical and Applied Climatology 2010, 99, 373–388. [Google Scholar] [CrossRef]
- Brázdil, R.; Trnka, M.; Dobrovolný, P.; Chromá, K.; Hlavinka, P.; Žalud, Z. Variability of droughts in the Czech Republic, 1881–2006. Theoretical and Applied Climatology 2009, 97, 297–315. [Google Scholar] [CrossRef]
- Kiprotich, P.; Wei, X.; Zhang, Z.; Ngigi, T.; Qiu, F.; Wang, L. Assessing the Impact of Land Use and Climate Change on Surface Runoff Response Using Gridded Observations and SWAT+. Hydrology 2021, 8, 48. [Google Scholar] [CrossRef]

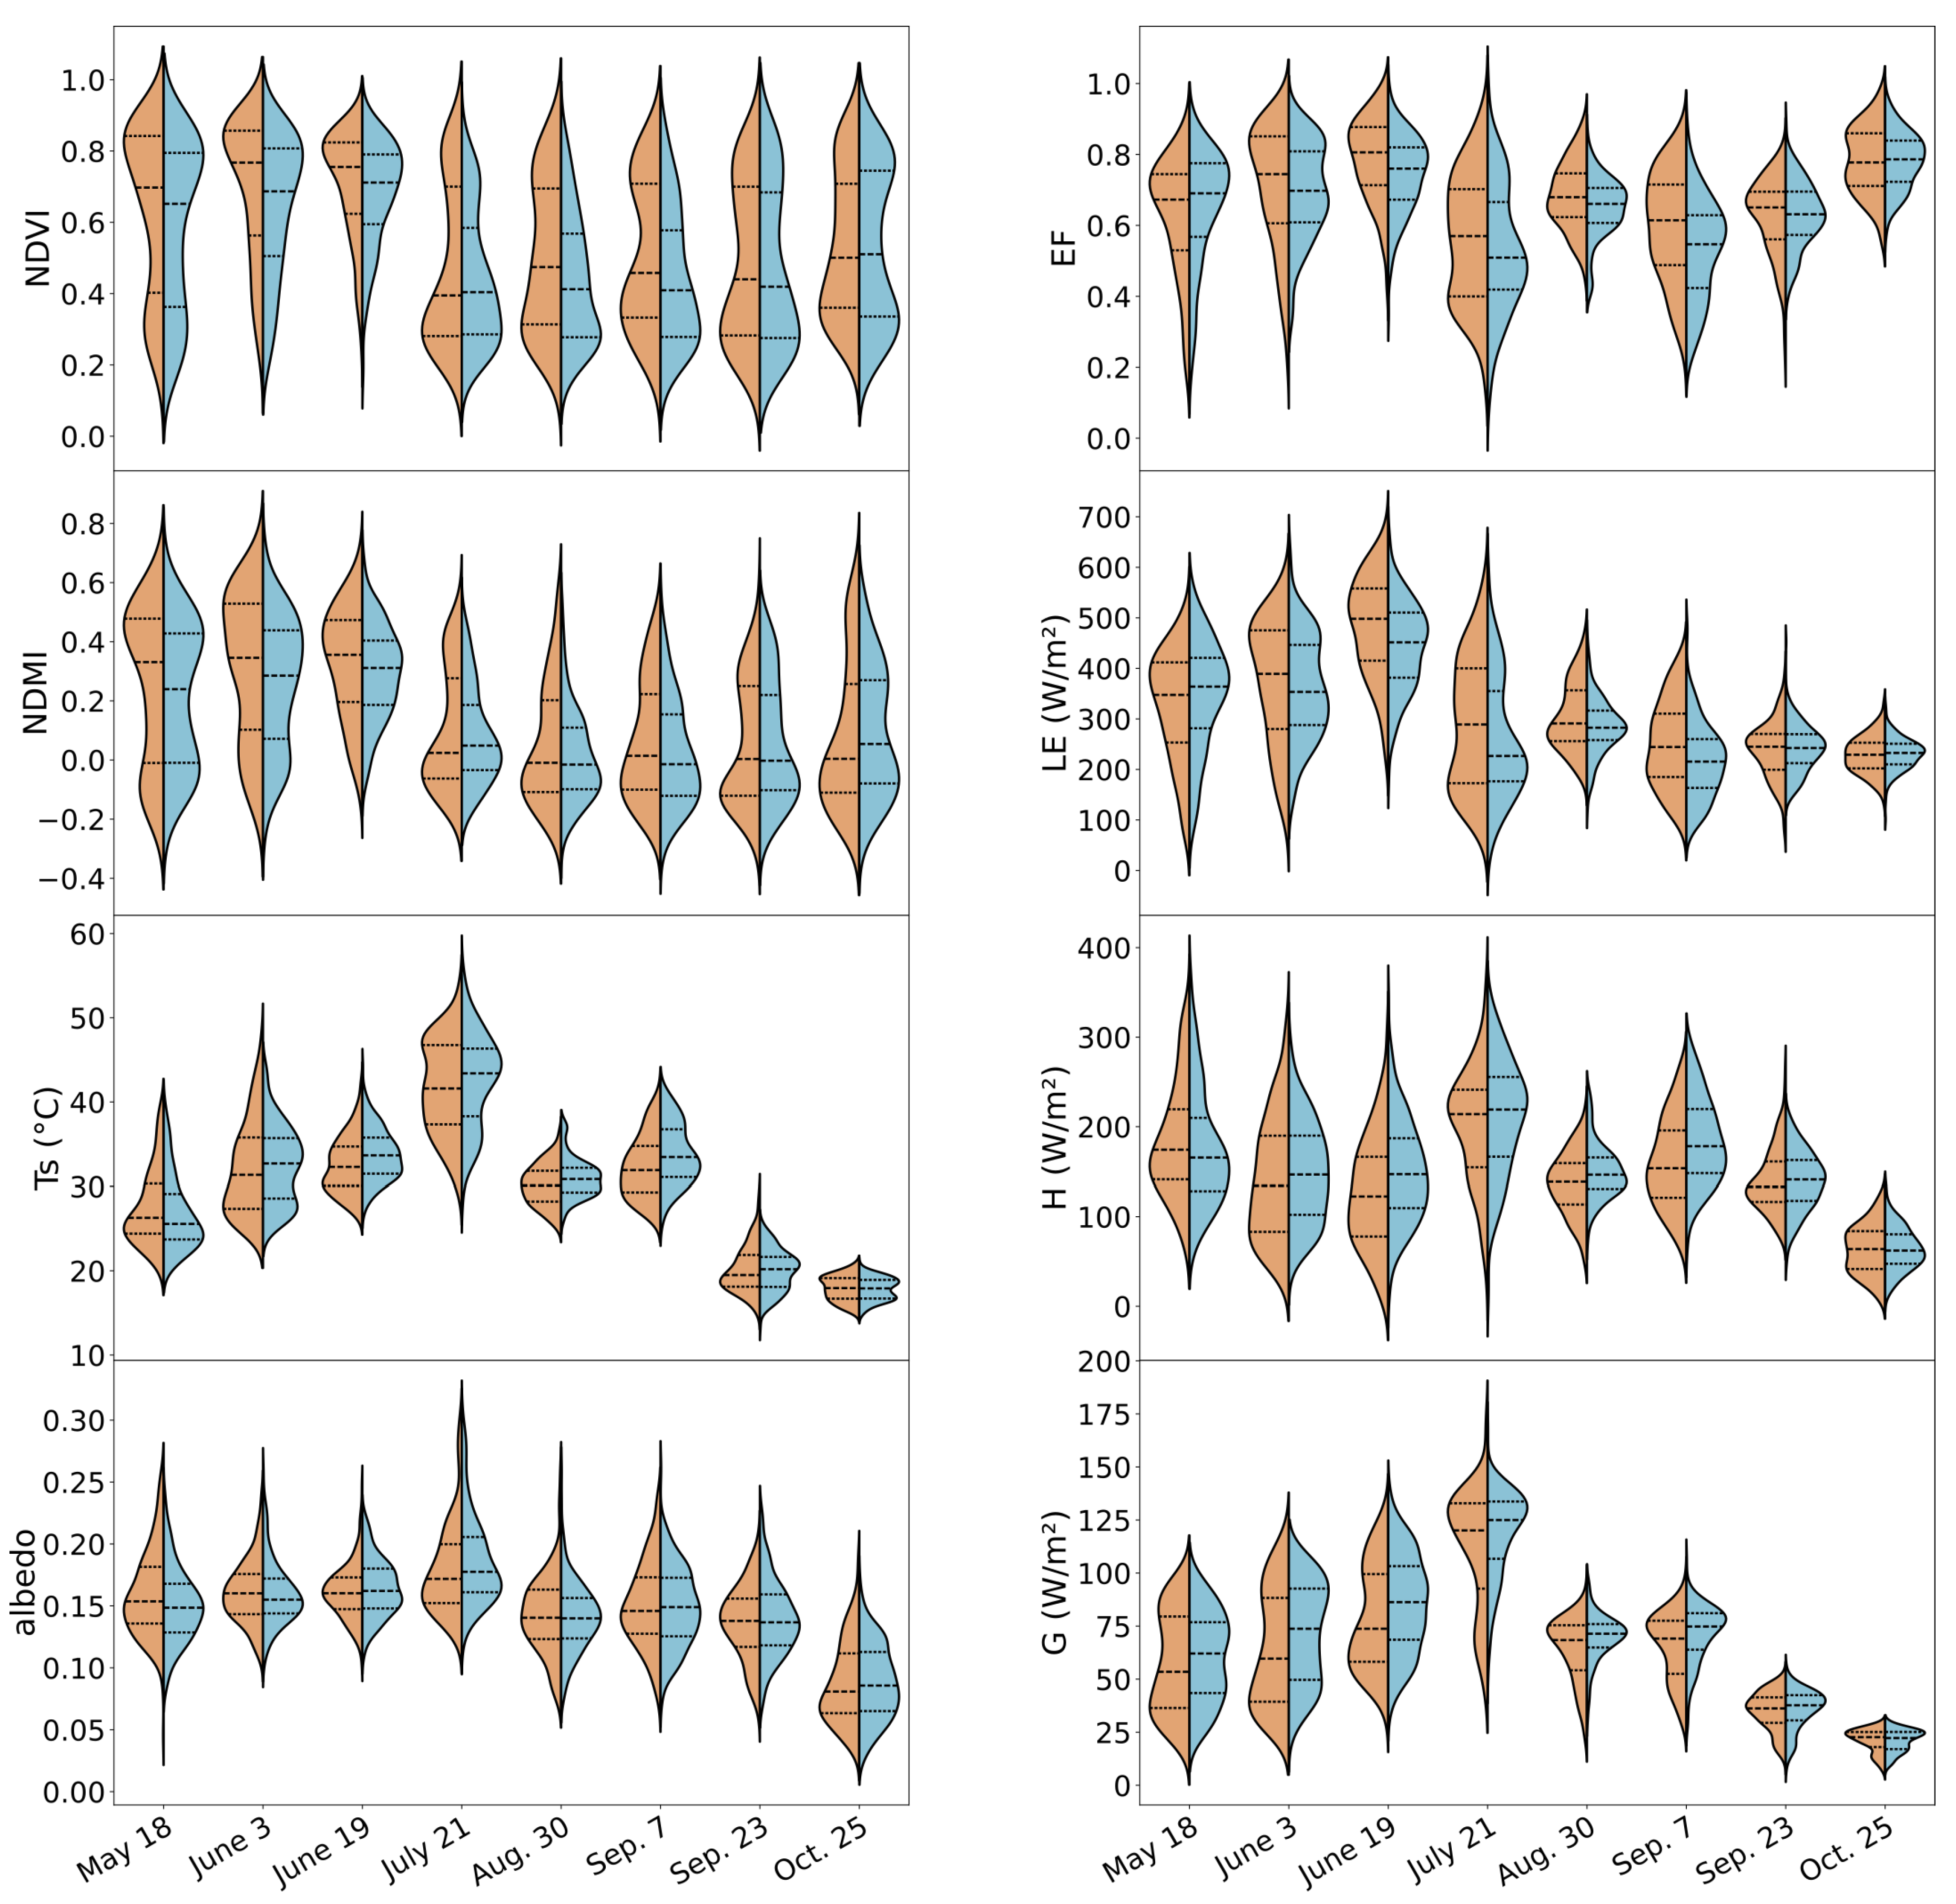
Disclaimer/Publisher’s Note: The statements, opinions and data contained in all publications are solely those of the individual author(s) and contributor(s) and not of MDPI and/or the editor(s). MDPI and/or the editor(s) disclaim responsibility for any injury to people or property resulting from any ideas, methods, instructions or products referred to in the content. |
© 2024 by the authors. Licensee MDPI, Basel, Switzerland. This article is an open access article distributed under the terms and conditions of the Creative Commons Attribution (CC BY) license (http://creativecommons.org/licenses/by/4.0/).


