1. Introduction
Soil microbes modulate the cycling of carbon and nutrients through decomposing plant debris and activating soil mineral nutrients with the function of various environmental factors like climate conditions, plant diversity, and soil physicochemical properties in forest ecosystems [
1,
2,
3]. In the long−term processes of development, succession, and evolution of local forest ecosystems, soil microbial communities undergo a dynamic adaptation process to these environmental conditions by changing their own community composition [
4,
5,
6]. Consequently, different forest ecosystems exhibit uniquely characterized soil microbial communities, each harboring a distinct array of soil microbes that collectively contribute to the ecological dynamics of their respective habitats [
7,
8,
9]. It is documented that optimal soil temperature and moisture conditions, appropriate soil pH level and mineral nutrient supply, massive forest litter input, abundant organic matter accumulation, weak solar radiation, and low air temperature can promote soil microbial activity; conversely, a disruption in the composition of these environmental factors can serve as a significant impediment to the growth and reproductive capabilities of soil microbes [
10,
11,
12]. In the boreal coniferous forest ecosystem, extremely low soil temperature, a small amount of mineral nutrients, single plant species composition, and low plant primary production are the limited environmental factors to inhibit the growth and reproduction of soil microbes [
13,
14,
15]. In the temperate deciduous broad–leave forest, seasonal fluctuation of soil moisture and temperature, plant composition and phenology, soil parent material, and soil mineral nutrients are the predominant environmental factors governing soil microbial biomass dynamics [
16,
17,
18]. In the tropical/subtropical evergreen broad–leave forest, soil physicochemical properties , plant diversity and primary production, solar radiation, and air temperature become the critical determinants to control soil microbes [
12,
19,
20]. In the system of plant−soil−soil microbes, plant individuals compete soil nutrients with soil microbes; simultaneously, plant roots provide organic nutrients and carbohydrates through root exudates to soil microbes [
10,
11]. Plant litterfall also can release organic carbon and nutrients to soil microbes. How does soil microbial biomass change along with the production of forest litterfall and plant roots within the cycling of carbon and nutrients? It still remains controversial in various forest ecosystems.
Global climate change does not only precipitate a cascade of extreme local climatic phenomena, such as record−breaking temperatures, severe droughts, heavy rain– and ice–storms, and frequent hurricanes or typhoons, but also induces alterations to the normative climatic conditions and patterns [
21,
22,
23,
24,
25]. In southeastern Asian, the protraction and severity of drought conditions have been exacerbated during dry season; the duration of the rainy season has been truncated, and frequency of intense rainstorms has been apparently increased [
21]. Severe seasonal droughts exert a multifaceted adverse impact on plant physiology and phenology, forest litterfall deposition, and floor mass decomposition processes. Moreover, they induce significant alterations to soil physicochemical properties and modulate soil microbial activity, leading to a pronounced stagnation in forest carbon and nutrient cycling [
26,
27,
28]. Usually, tree individuals grow and reproduce during wet season, facilitated by the ample soil moisture required for photosynthesis; subsequently, following the abscission of leaves in dry season, these individuals enter a state of dormancy as a protective mechanism against the harsh environmental conditions. Soil microbial activity are significantly repressed during dry season due to soil water stress, and is suppressed as a consequence of intense competition for soil nutrients, which is intensified by the extensive plant root systems during wet season. Theoretically, soil microbial activity can reach the maximum during the phase characterized by an optimal balance of soil moisture and temperature, adequate soil organic carbon accumulation and mineral nutrient availability, and a cessation of competition from plant roots. Ruan et al. observed a discernible lag of one month between the peak in soil microbial biomass and the subsequent litterfall [
10]. This temporal discrepancy can be attributed to the reduced uptake of soil mineral nutrients by plant roots, facilitating the redistribution of organic nutrients and carbohydrates from leaf tissues to stems and plant roots. Furthermore, it is frequently documented that severe seasonal droughts significantly inhibit soil microbial activity across various forest ecosystems [
29,
30,
31]. In the context of recurrent seasonal droughts, the influence of forest litterfall and plant roots on soil microbial biomass remains an underexplored area.
Disentangling the complex effects of seasonal drought, forest litter, and plant roots on soil microbial biomass is critical to further understand the cycling of carbon and nutrients under the background of global climate change. We established two 1−ha field research plots (control plot vs. watered plot). Within each plot, we set up four nested subplots, encompassing all possible combinations of plant roots and forest litter. We hypothesized that the independent variables of seasonal drought, floor mass, and plant roots would interactively regulate soil microbial biomass, because seasonal drought inhibits soil microbial biomass due to severe water stress, floor mass could be decomposed and release plenty organic carbon and nutrients to soil microbes, and plant roots compete soil carbon and nutrients with soil microbes [
10,
11,
32,
33]. Our objective was to (1) investigate the fluctuation patterns and amplitudes of soil microbial biomass as well as environmental variables including soil moisture, floor mass, and plant roots; (2) analyze whether seasonal drought, floor mass, plant roots, and their interactions could apparently influence soil microbial biomass.
2. Materials and Methods
2.1. Study Sites
This study was carried out in a montane subtropical moist evergreen broad−leaved forest of southwestern China (24°20′40″N, 102°33′50″E; 1740 m a.s.l. at the center of forest), which was located at the peak of the campus of Yuxi Normal University [
21]. This forest was strictly protected without intense human disturbances by the Forestry and Grassland Bureau of Yuxi City and the Logistics Management Department of Yuxi Normal University since 1978 [
21]. This region was mainly dominated by the humidity and dry air flow from the Indian Ocean and the Beibu Gulf, resulting in regular wet season from May to October and dry season from November to next April [
21,
34]. Annual precipitation was 787.8–1000 mm, with about 85% occurred in wet season and the rest 15% occurred in dry season [
21,
35]. Annual mean temperature was 15.4–24.2℃, with the highest temperature 32.6℃ in May and the lowest –5.5℃ in December [
21,
34,
35]. This forest was dominated by the canopy tree species
Schima wallichii (DC.) Choisy,
Quercus franchetii Skan,
Lithocarpus confinis Huang,
Quercus acutissima Carruth., and
Pinus yunnanensis Franch.; understory shrub species mainly include
Photinia serratifolia (Desfontaines) Kalkman,
Pyracantha fortuneana (Maxim.) Li,
Buddleja officinalis Maxim., and
Serissa japonica (Thumb.) Thunb.; herbaceous species mainly include
Nephrolepis cordifolia (L.) C. Presl,
Cyclosorus interruptus (Willd.) H. Ito,
Arthraxon hispidus (Trin.) Makino, and
Ageratina adenophora (Spreng.) R.M. King et H.Rob [
21]. Soil was typically red sandy loam developed from argillaceous rocks and carbonate rocks with the apparent characteristics of weak acid (pH=5.3–5.8), low organic matter (53.46–73.25 g/kg), few soil microbes (0.51–0.58 g/kg for soil microbial biomass carbon and 0.08–0.12 g/kg for soil microbial biomass nitrogen) and low soil mineral nutrient contents (0.197–0.245% for soil total nitrogen, 0.039–0.048% for soil total phosphorus, 1.74–2.25% for soil total potassium, 0.173–0.222% for soil calcium, 0.192–0.227% for soil magnesium, 0.004–0.006 % for soil sulphur) in soil samples of 0–10cm depth [
21].
2.2. Experimental Design
We established two 1−ha (200 m × 50 m) filed research plots at the center of the forest ecosystem in May 2019. The closest distance between the two field research plots and the minimum distance from the perimeter of each research plot to the forest boundary were both > 30 m, ensuring a spatial separation that mitigated potential confounding factors. We kept one 1−ha field research plot (i.e., control plot) as its natural state throughout the entire year; preserved another plot (i.e, watered plot) as its natural state during wet season, and weekly irrigated it with rainfall during dry season. We saved the rainfall in a reservoir at the peak of the Longma Hills during wet season and employed for the irrigation of the field research plot during dry season
To disentangle the complex effects of seasonal drought, floor mass, and plant roots on soil microbial biomass, we implemented a crossed design to establish filed research plots and subplots in May 2019 (
Figure 1) [
21,
36]. Three investigation blocks, as three experimental replications with the scale of 20 m × 20 m for each, were respectively established in control and watered plots, and four subplots with the scale of 1 m × 1 m for each were respectively set up in each block. The allocation of each subplot was executed with an absolute randomness in the experimental block, ensuring a statistically rigorous and unbiased distribution. Four experimental treatments included: (1) plant roots and floor mass included (R+F+, leaving plant roots and floor mass in the subplot as their natural state), (2) plant roots included but floor mass excluded (R+F−, leaving plant roots in the subplot as their natural state, and sweeping away floor mass), (3) plant roots excluded but floor mass included (R−F+, leaving floor mass in the subplot as their natural state, and cutting and removing plant roots), and (4) plant roots and floor mass excluded (R−F−, cutting and removing plant roots and sweeping away floor mass). In the R+F− and R−F−subplots, we constructed the plastic−framed structures (1 m × 1 m × 1 m) with 2 cm diameter PVC tubes and 1 mm mesh fiberglass screens to cover the subplots, and weekly cleaned up the litterfall on the screen. In the R−F+ and R−F− subplots, we vertically excavated down to the soil parent material and insulated subplot soils from outside by galvanized steel sheets that were 1 mm thick, all plant roots along the perimeter of the soil profiles with diameters of > 1 cm were removed.
2.3. Field Sampling and Laboratory Processing
We monthly collected floor mass and soil samples from June 2019 to May 2023. A square white porcelain tray with the scale of 20 cm × 20 cm was randomly placed in the subplot, floor mass covered under the tray was cut by secateurs and collected. Three volumetric soil cores were collected to a depth of 10 cm and mixed together to form a composite sample.
The samples of floor mass and soil were sent to the laboratory. Floor mass samples were oven–dried at 75℃ to constant weight. Soil samples were homogenized thoroughly; rocks, plant roots and debris were removed. Plant roots were washed with tap water, oven–dried at 75℃ to constant weight.
Soil MBC and MBN were determined by the modified Jenkinson and Powlson’s fumigation–incubation method [
36,
37,
38,
39,
40,
41,
42]. For each soil sample, two copies of 30 g fresh soil sample were prepared, one for the fumigation and incubation processing, and another for the control sample. Soil MBC was calculated by the difference of CO
2 released from the control and fumigated soil samples within 10 d incubation using the following equation:
where B
C was soil MBC (g/kg); F
C was the difference of CO
2 released from the two copies of soil sample; and K
C = 0.45, which was the rate of the biomass carbon mineralization during the fumigation–incubation process.
Soil MBN was calculated by the difference of soil mineral nitrogen released from the control and fumigated soil samples within 10 d incubation using the following equation:
where B
N was soil MBN (g/kg); F
N was the difference of soil mineral nitrogen released from the two copies of soil sample; and K
N = 0.57, which was the rate of the biomass nitrogen mineralization during the fumigation–incubation process.
We fitted the lines between soil moisture, floor mass, and plant roots with soil MBC and MBN in each subplot by following equation:
where Y(y) was soil MBC and MBN in control (watered) plot (g/kg); X(x) was, respectively, soil moisture (%), floor mass (kg/m
2), and plant roots (g/m
2) ; A(a) was the coefficient that indicated soil MBC and MBN increase or decrease rate with the increase of soil moisture, floor mass, and plant roots; B(b) was the coefficient that indicated soil MBC and MBN when soil moisture, floor mass, and plant roots disappeared.
2.4. Data Analyses
To understand how the four treatments and two plots were related to the two dependent variables, we fitted linear mixed effects models with fixed effects for treatment, plot, and the variables’ interaction, and a nested plot–treatment random intercept term (1|treatments/plot) in R (V 3.0.1, R Development Core Team 2017) [
43,
44].
We constructed
Figure 1,
Figure 2,
Figure 3,
Figure 4,
Figure 5,
Figure 6,
Figure 7,
Figure 8,
Figure 9 and
Figure 10 using SigmaPlot 12.5 (Systat Software, Richmond, CA, USA).
Figure 2,
Figure 3,
Figure 4,
Figure 5 and
Figure 6 were constructed by the Multiple Line & Scatter–Error Bars program;
Figure 7,
Figure 8 and
Figure 9 were constructed by the Multiple–Scatter program; and
Figure 10 was constructed using a 3D mesh plot [
12,
45,
46].
We conducted the multiple linear regression analysis between soil MBC and MBN and environmental factors including soil moisture, floor mass, plant roots, and sampling time (i.e., month), using SPSS 21.0 (Statistical Package for the Social Sciences 21.0, SPSS 21.0, IBM Corporation, Chicago, IL, USA). All data were tested and confirmed to meet the assumptions of linearity (scatter plots [
47]), normality (Kolmogorov– Smirnov test [
48]), and homoscedasticity of variance (Goldfeld–Quandt test [
49]). Significance level was set at
p < 0.05.
3. Results
3.1. Soil Moisture
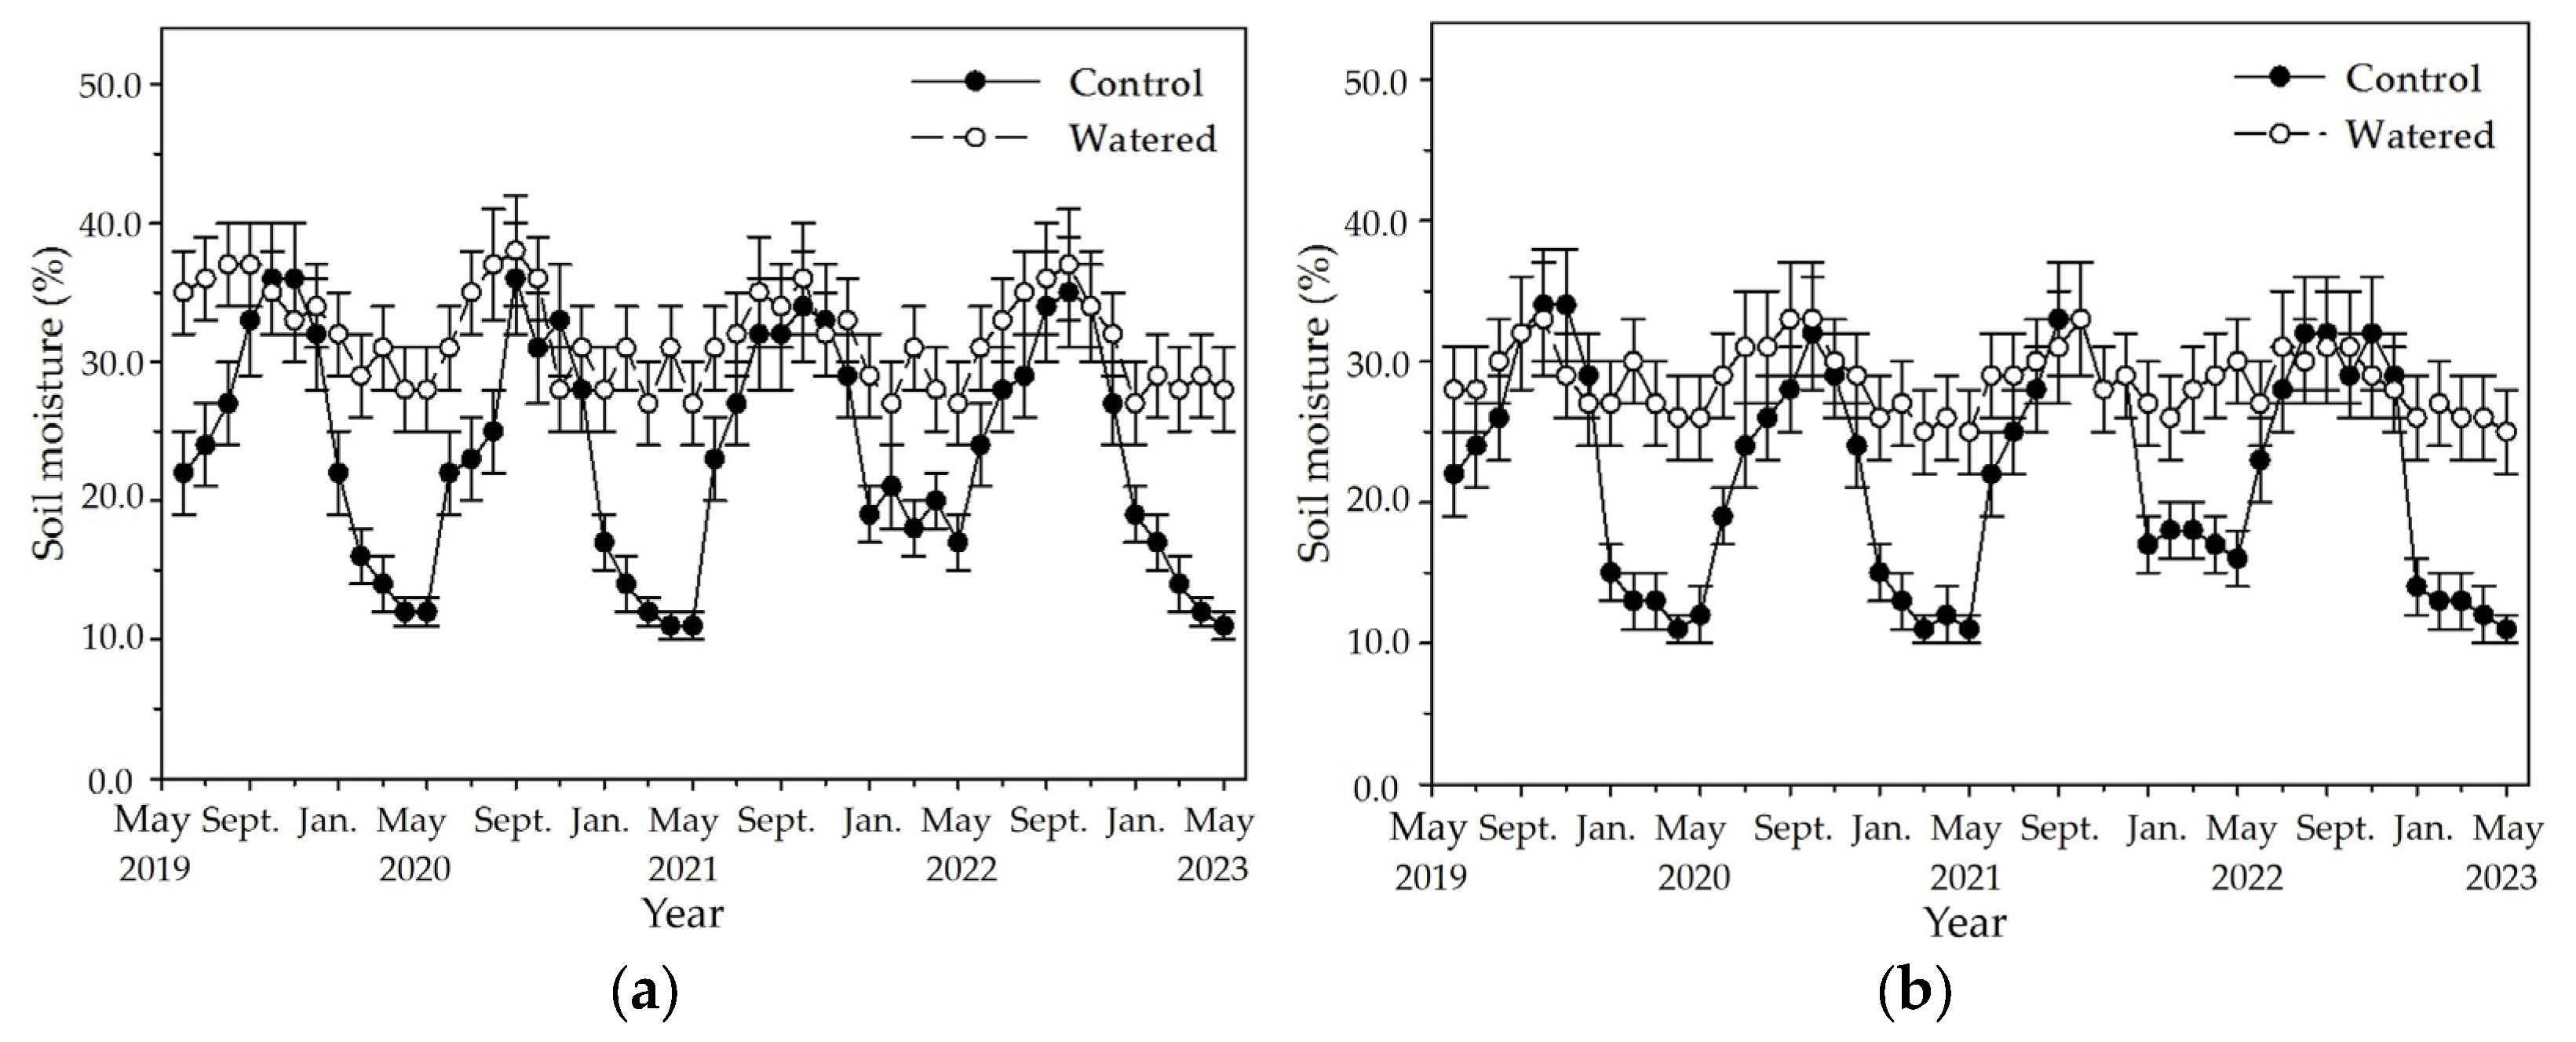
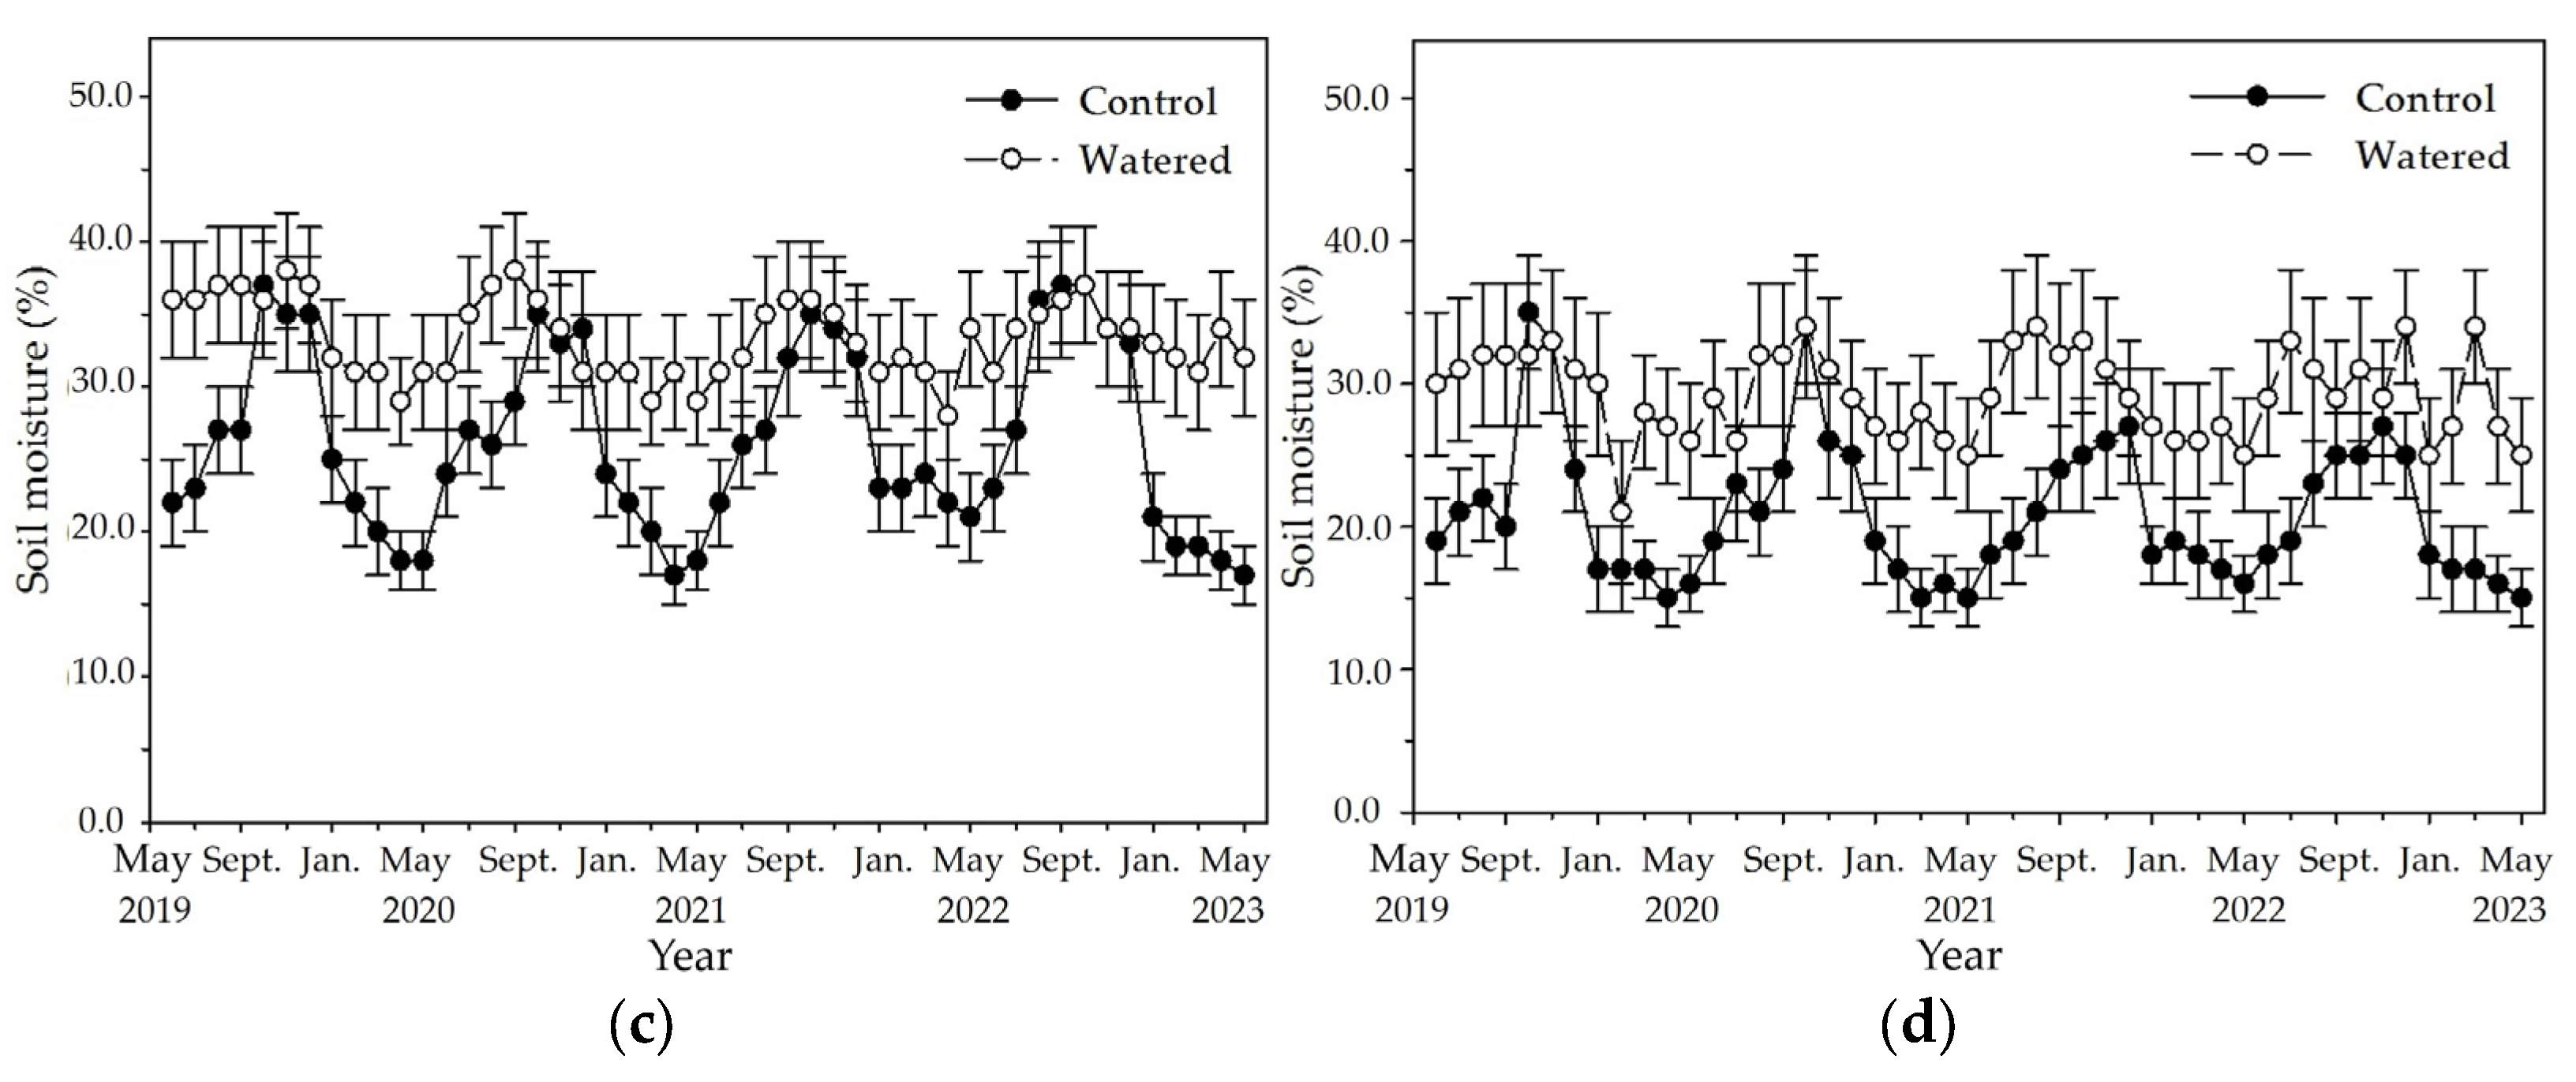
An apparent fluctuation of monthly soil moisture occurred in the four subplots of control plot with a pronounced peak in October and a nadir in May (
Figure 2). The highest soil moisture was around 37%, and the lowest was around 11% in the R+F+ subplot of control plot. Although the similar fluctuation of monthly soil moisture also occurred in the four subplots of watered plot, fluctuation amplitude between the highest and lowest values in the four subplots was apparently less than those of control plot. The highest soil moisture was around 38% in the R+F+ subplot, and the lowest was around 21% in the R−F− subplot of watered plot. Although the highest soil moisture in control plot was not different with that in watered plot, the soil moisture during dry season in control plot was apparent lower than that in watered plot.
The fluctuation amplitude of monthly soil moisture between the highest and lowest values was apparently different among four subplots of control plot (
Figure 2). The difference between the highest and lowest values in the four subplots of control plot, respectively, was 26% in the R+F+ subplot, 23% in R+F− the subplot, and 20% in the R−F+ and R−F− subplots. Inter–annual fluctuation of monthly soil moisture was apparent in the four subplots of control plot (
Figure 2). Soil moisture from January to May in 2022, respectively, was around 20% in the R+F+ subplot, around 17% in the R+F− subplot, around 23% in the R−F+ subplot, and around 18% in the R−F− subplot; correspondingly, they were higher than those from January to May in 2019, 2020 and 2023.
3.2. Floor Mass
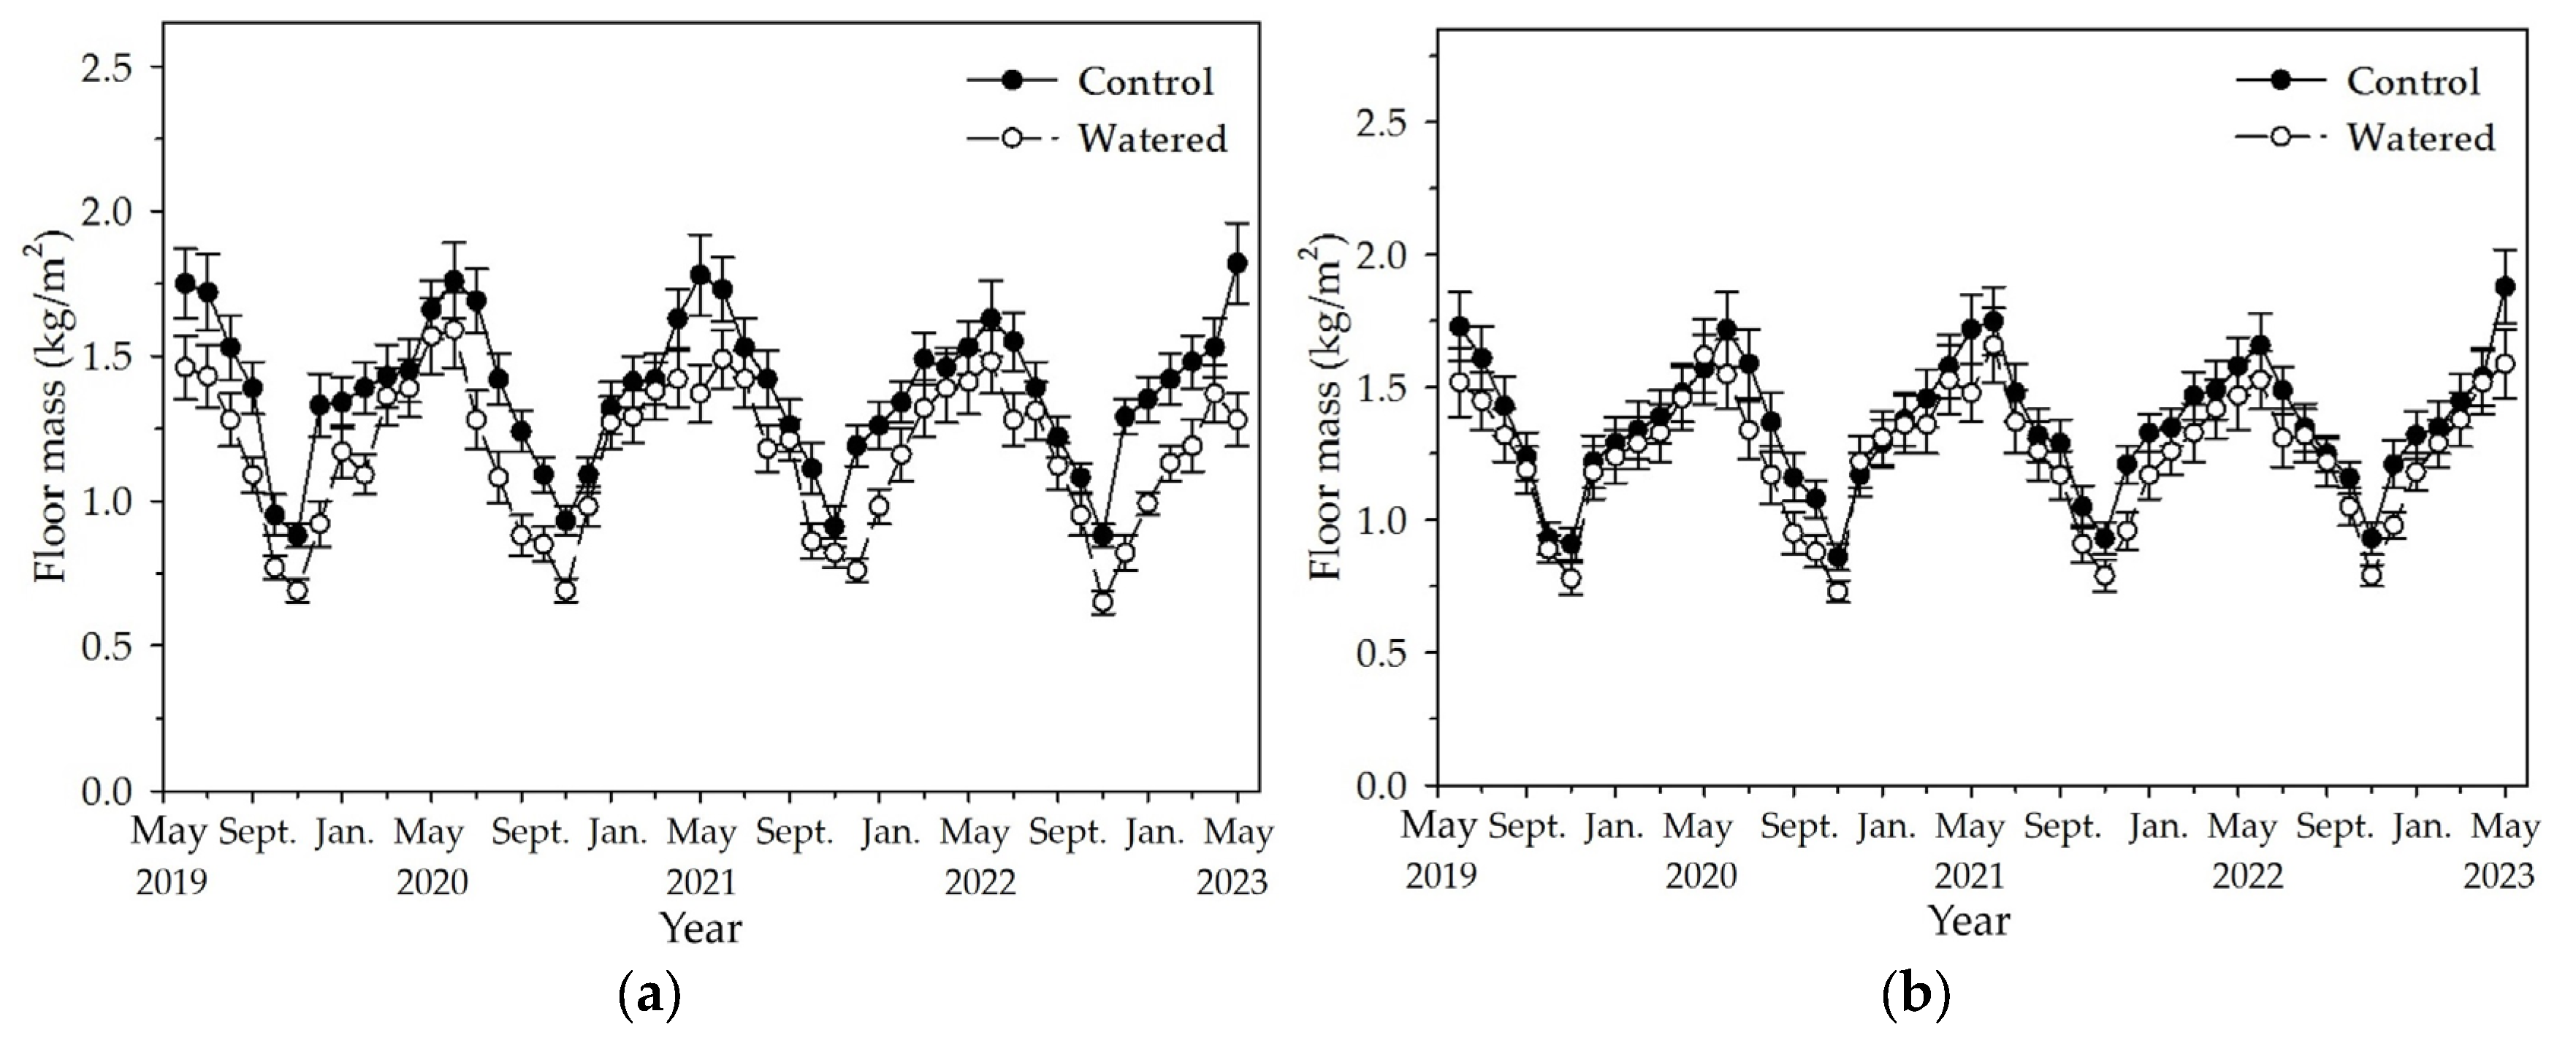
Floor mass in the R+F+ and R−F+ subplots peaked in May or June and reached to the lowest value around November (
Figure 3). Although floor mass in a certain month changed among different years, its variation pattern was no changed, with one peak and one nadir during one year. Mostly, floor mass in watered plot was apparently less than those in control plot. The least floor mass was in November 2022 with 0.65 (±0.04) kg/m
2 in the R+F+ subplot of control plot, and the floor mass in the same month in the R+F+ subplot of control plot was 0.88 (±0.04) kg/m
2. The most floor mass was in May 2023 with 1.88 (±0.14) kg/m
2 in the R−F+ subplot of watered plot, and the floor mass in the same month in the R−F+ subplot of watered plot was 1.59 (±0.13) kg/m
2.
3.3. Plant Roots
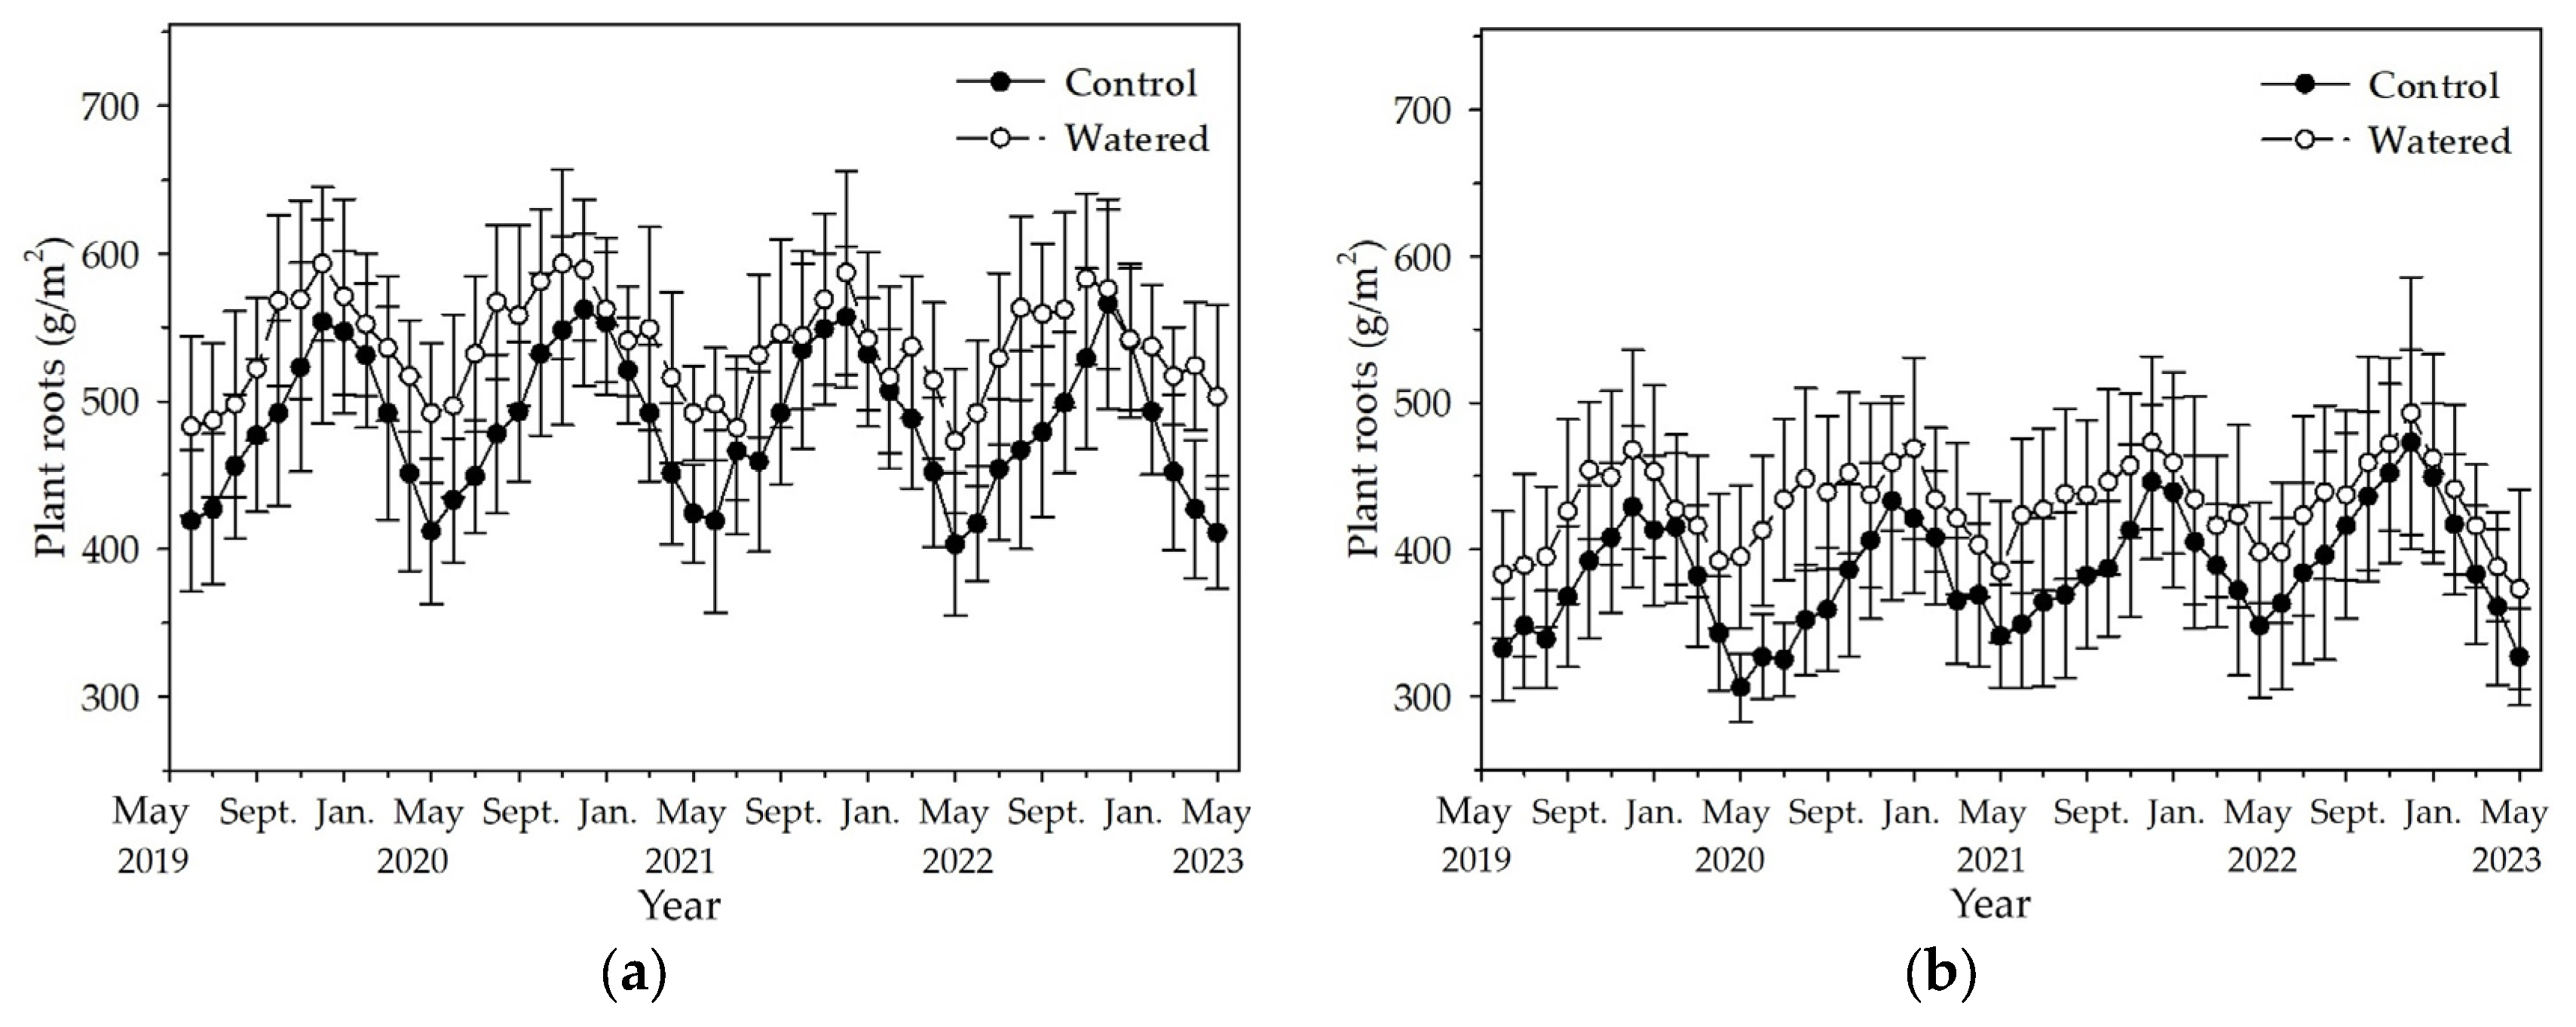
Plant roots reached the maximum in December and decreased to the minimum in May in the R+F+ and R+F− subplots (
Figure 4). Compared to the dynamics of plant roots in the R+F+ and R+F− subplots of control plot, the synchronicity of dynamics of plant roots in the R+F+ and R+F− subplots of watered plot was relatively greater. Contrary to the patterns of floor mass mentioned above, plant roots in watered plot was apparently more than those in control plot. The most plant roots was in November 2020 with 593 (±64) g/m
2 in the R+F+ subplot of watered plot, and the plant roots in the same month in the R+F+ subplot of watered plot was 548 (±64) g/m
2. The least plant roots was in May 2020 with 306 (±23) g/m
2 in the R+F− subplot of control plot, and the plant roots in the same month in the R+F− subplot of watered plot was 395 (±49) g/m
2. Plant roots in the R+F+ subplot were apparently more than those in the R+F− subplot. The most and least plant roots in the R+F+ subplot of control and watered plots, respectively, were 566 (±71) g/m
2 and 403 (±48) g/m
2, 593 (±64) g/m
2 and 473 (±49) g/m
2; while, the most and least plant roots in the R+F− subplot of control and watered plots, respectively, were 473 (±63) g/m
2 and 306 (±23) g/m
2, 493 (±93) g/m
2 and 373 (±68) g/m
2.
3.4. Soil MBC and MBN
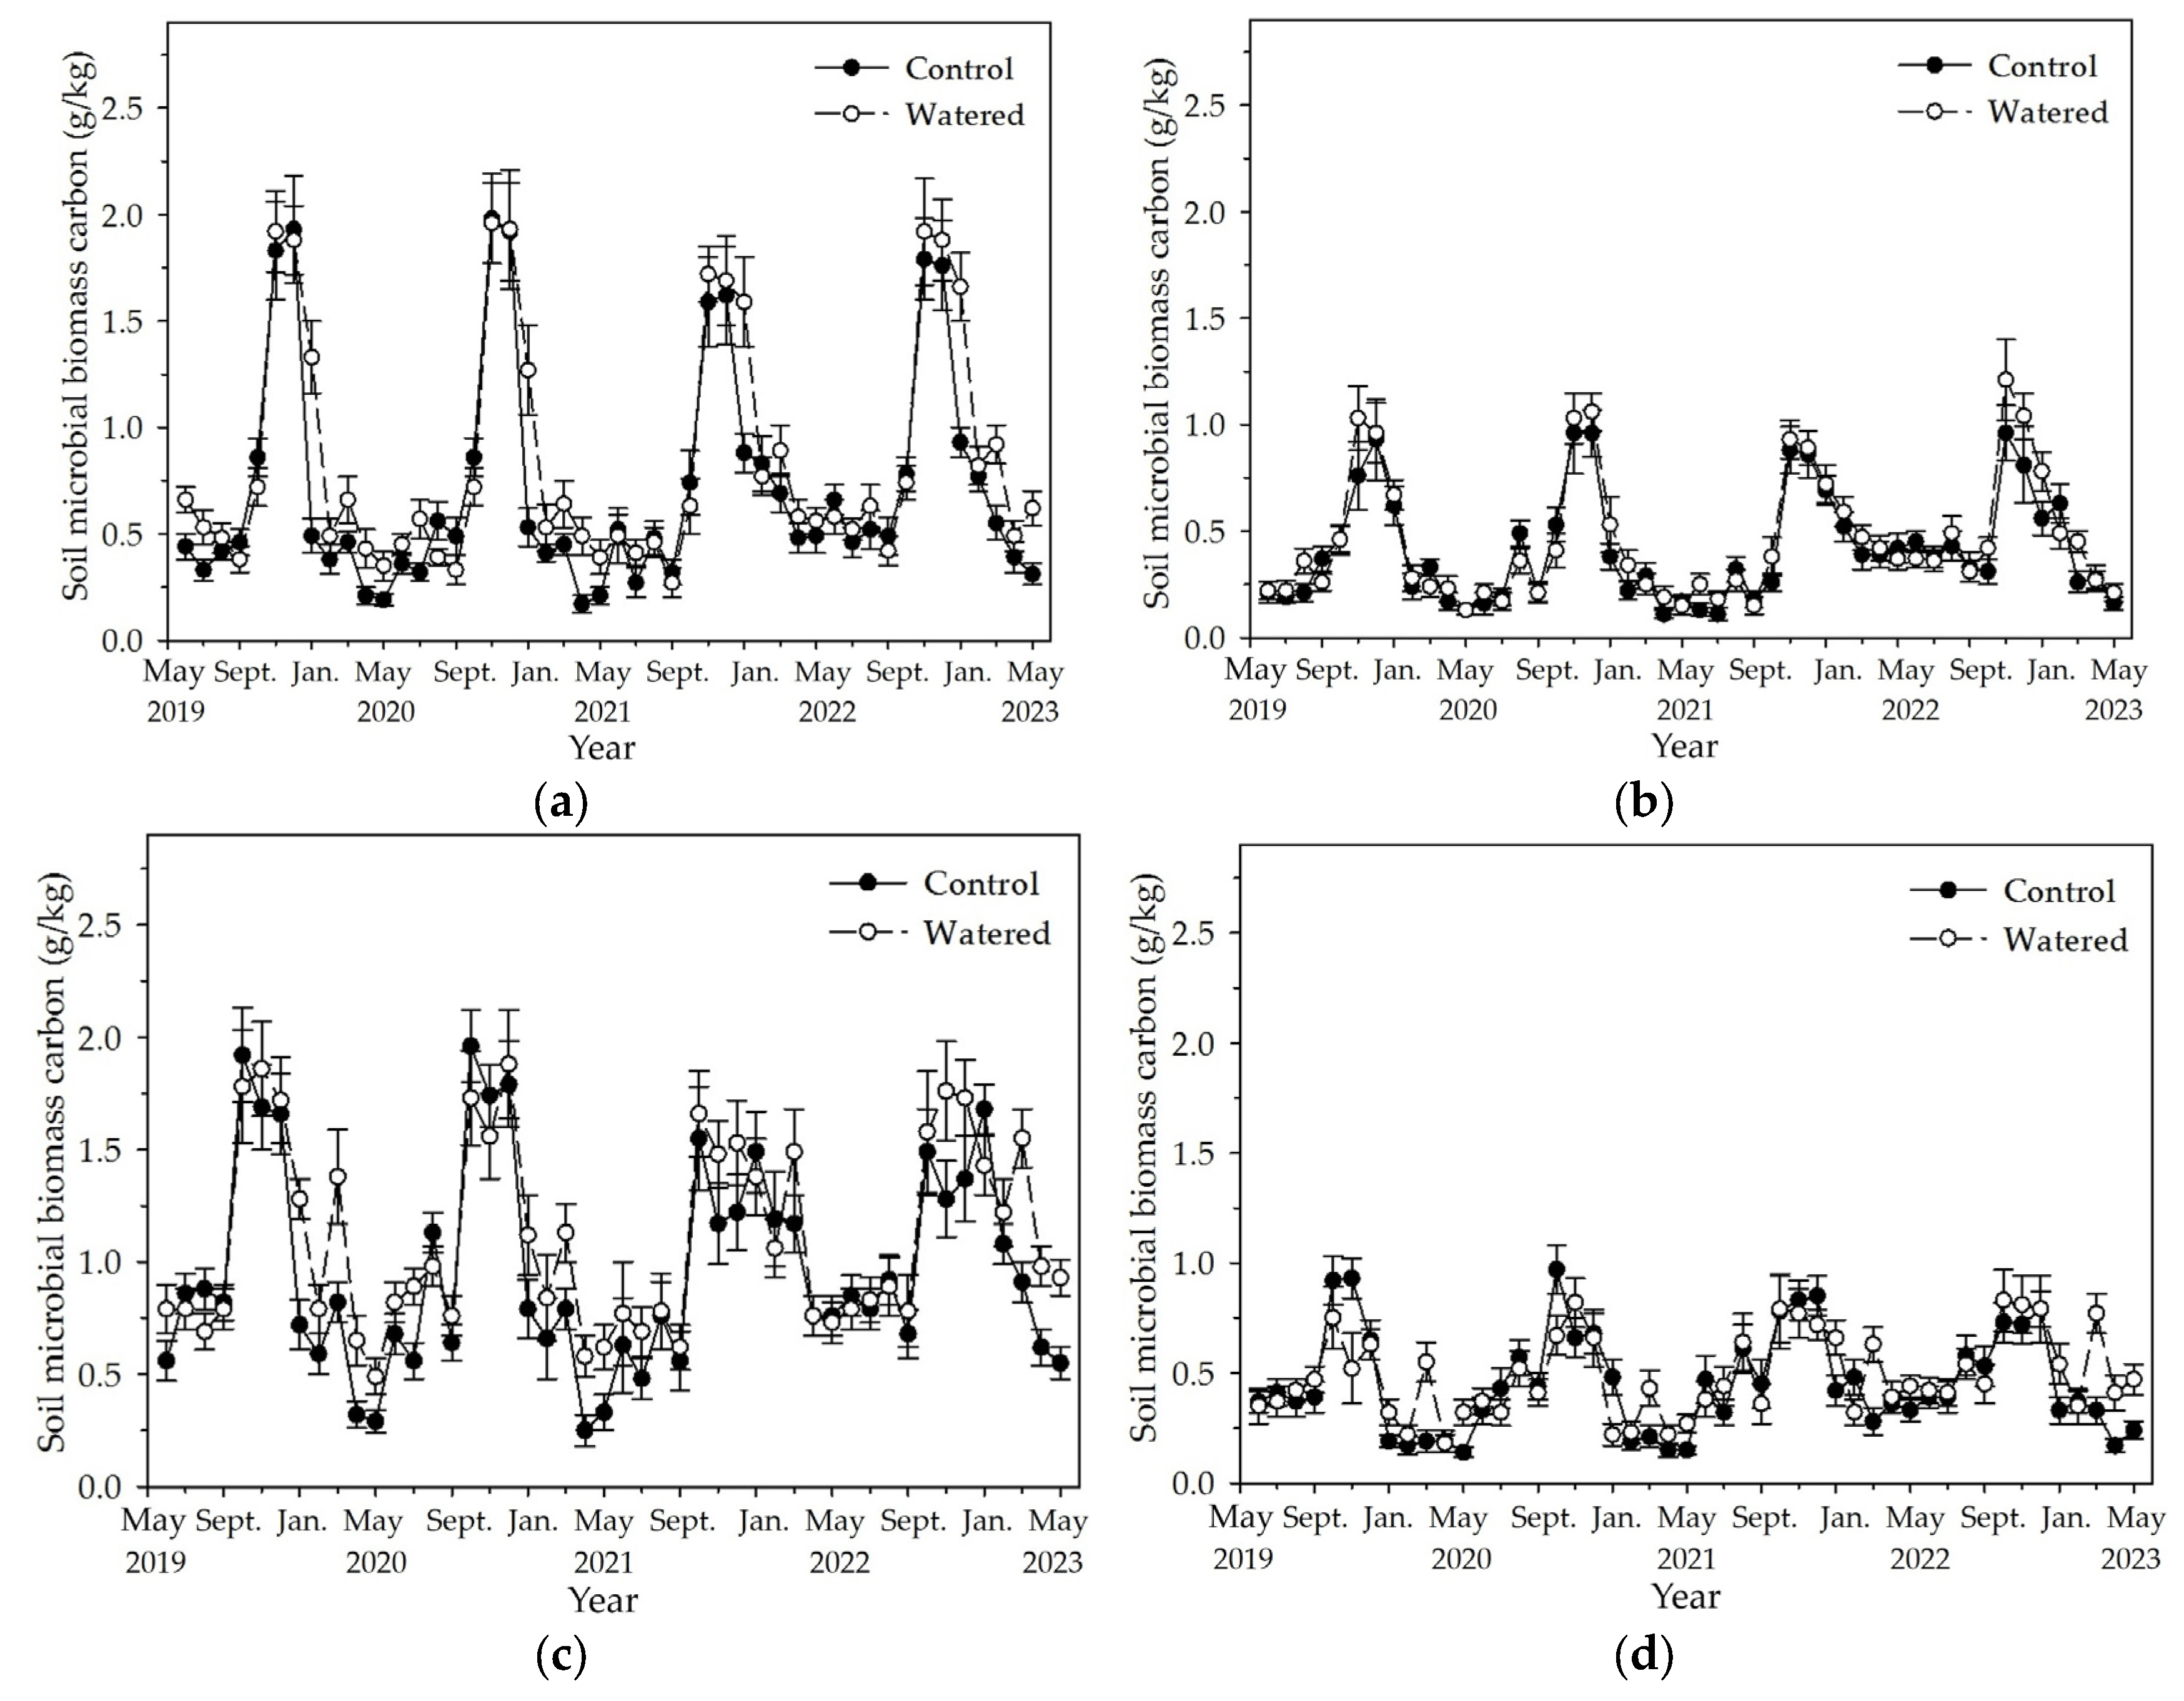
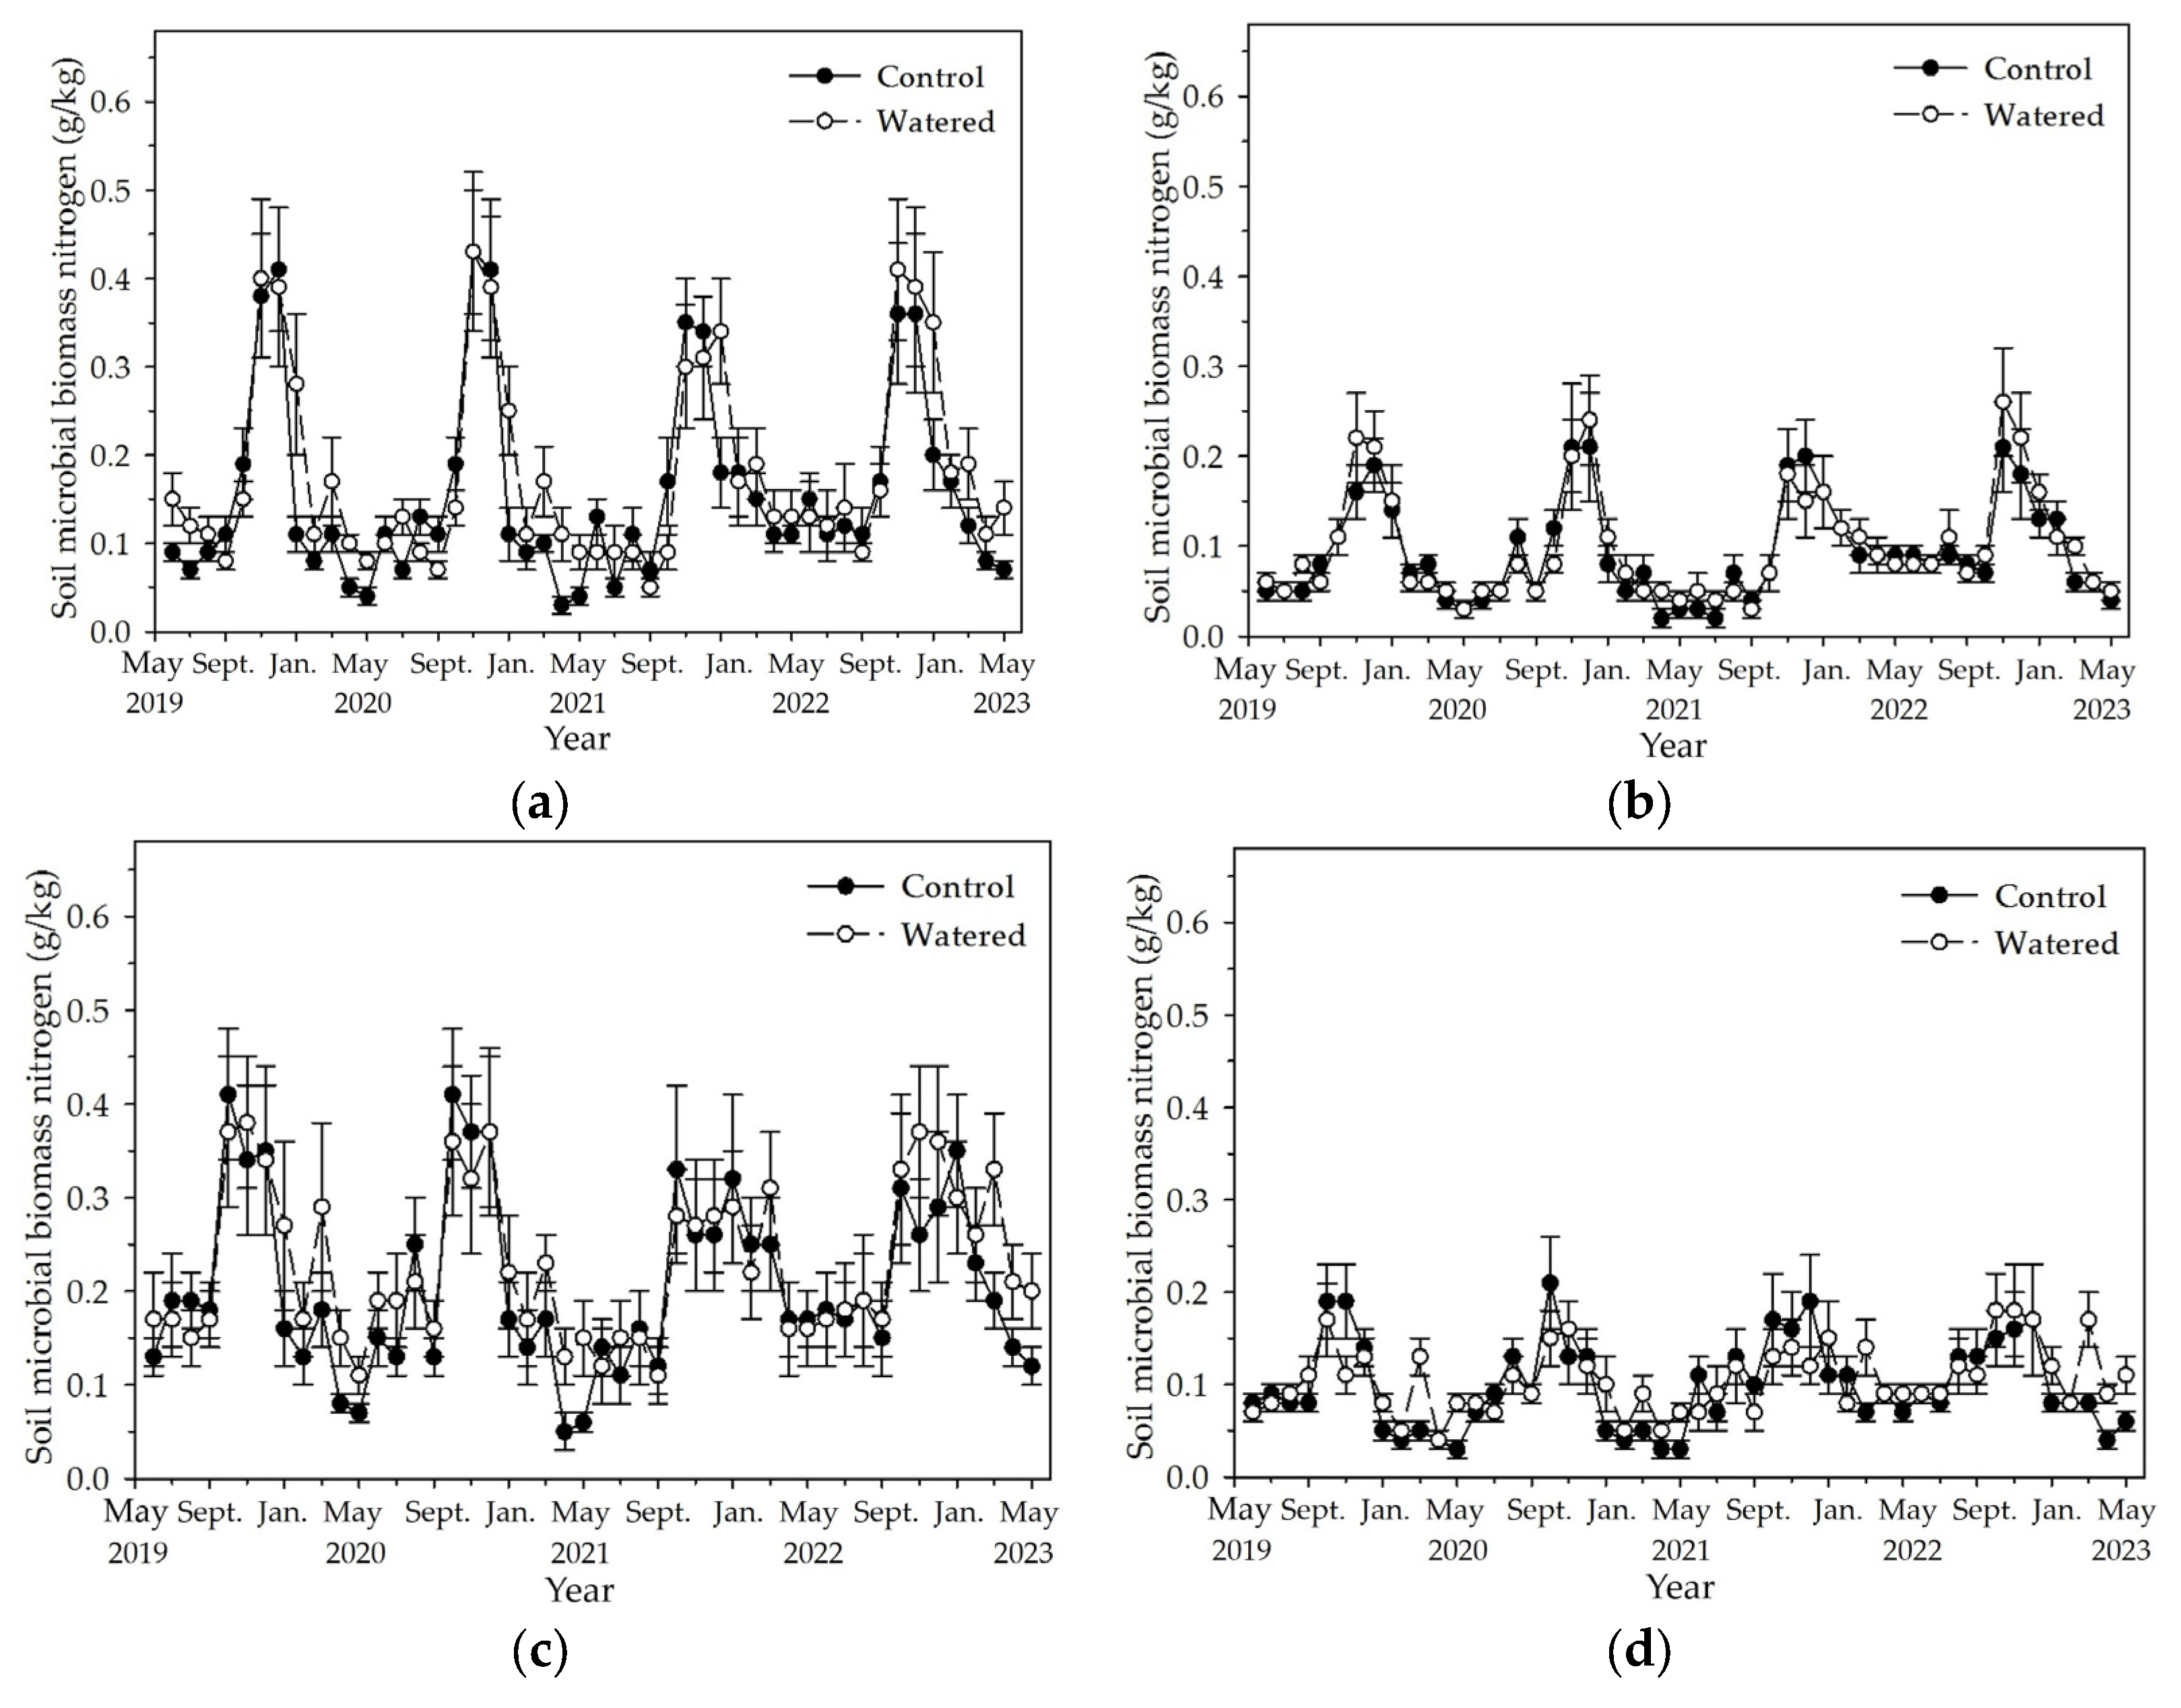
Soil MBC and MBN in the four subplots reached the peak in November and December, and decreased to the least in May (
Figure 5 and
Figure 6). Fluctuation amplitude of soil MBC and MBN was most in the R+F+ subplot, followed by R−F+, R+F−, and R−F−. In each subplot, the maximum soil MBC and MBN in the end of wet season had no apparent difference, while the least soil MBC and MBN during dry season in watered plot mostly was statistically more than that in control plot. Mean soil MBC and MBN during dry season in 2022 was apparently more than that during dry season of the other three years.
3.5. Data Analyses
Individual and combined effects of the variables manipulated, i.e., seasonal drought, floor mass, plant roots, sampling time, and their interactions except the interaction of floor mass and plant roots, were statistically analyzed to determine their effects on soil MBC and MBN (
Table 1). The response of soil MBC and MBN to each tested variables as well as their interactions seems to be significant.
Results of the multiple linear regression analysis also showed that soil MBC and MBN statistically correlated with soil moisture, floor mass, plant roots, and sampling time (
Table 2).
4. Discussion
4.1. Effects of Seasonal Drought on Soil Microbial Biomass
The results of previous studies investigated the impacts of seasonal drought on soil microbial biomass are controversial [
50,
51,
52,
53,
54,
55,
56,
57]. Singh et al. and Raghubanshi reported that soil microbial biomass was most in dry season and least in rainy season in monsoon forests of India, because massive litterfall and abundantly degradable compounds accumulated on the ground and released massive carbon and nutrients to soil microbes, while simultaneously most tree individuals were in the dormant state during dry season resulting in weak competitiveness with soil microbes for nutrients [
50,
51]. Barbhuiya et al. and Bargali et al. found that soil MBC was higher in winter (relatively drier and colder) than that in rainy season (relatively wetter and hotter) in the disturbed tropical wet–evergreen forest in Arunachal Pradesh of northeastern India and three forest types (Banj–oak forest, Chir–pine forest, and Mixed oak–pine forest) in Central Himalaya of India, because dense plant individuals grew slowly or stopped to grow in winter, resulting in low nutrient demand for plant growth and high nutrient retention in soil for microbial growth and reproduction [
52,
53]. However, Basu el al. and Manral et al. reported that soil microbial biomass was most in rainy season and least in winter season in Indian deciduous forests and a temperate mixed oak–pine forest of Central Himalaya in India due to higher immobilization of nutrients from decomposing litter by microbes as the decomposition rate of litter and microbial activity are at their peak during the rainy period [
54,
55]. In rain forests of Brazil and China, soil microbial biomass in the rainy season was also significantly higher than that in the dry season, because the relative dry condition and associated environmental factors such as stronger solar radiation and higher air temperature in dry season apparently decreased floor mass decomposition and nutrient release to soil microbes [
56,
57].
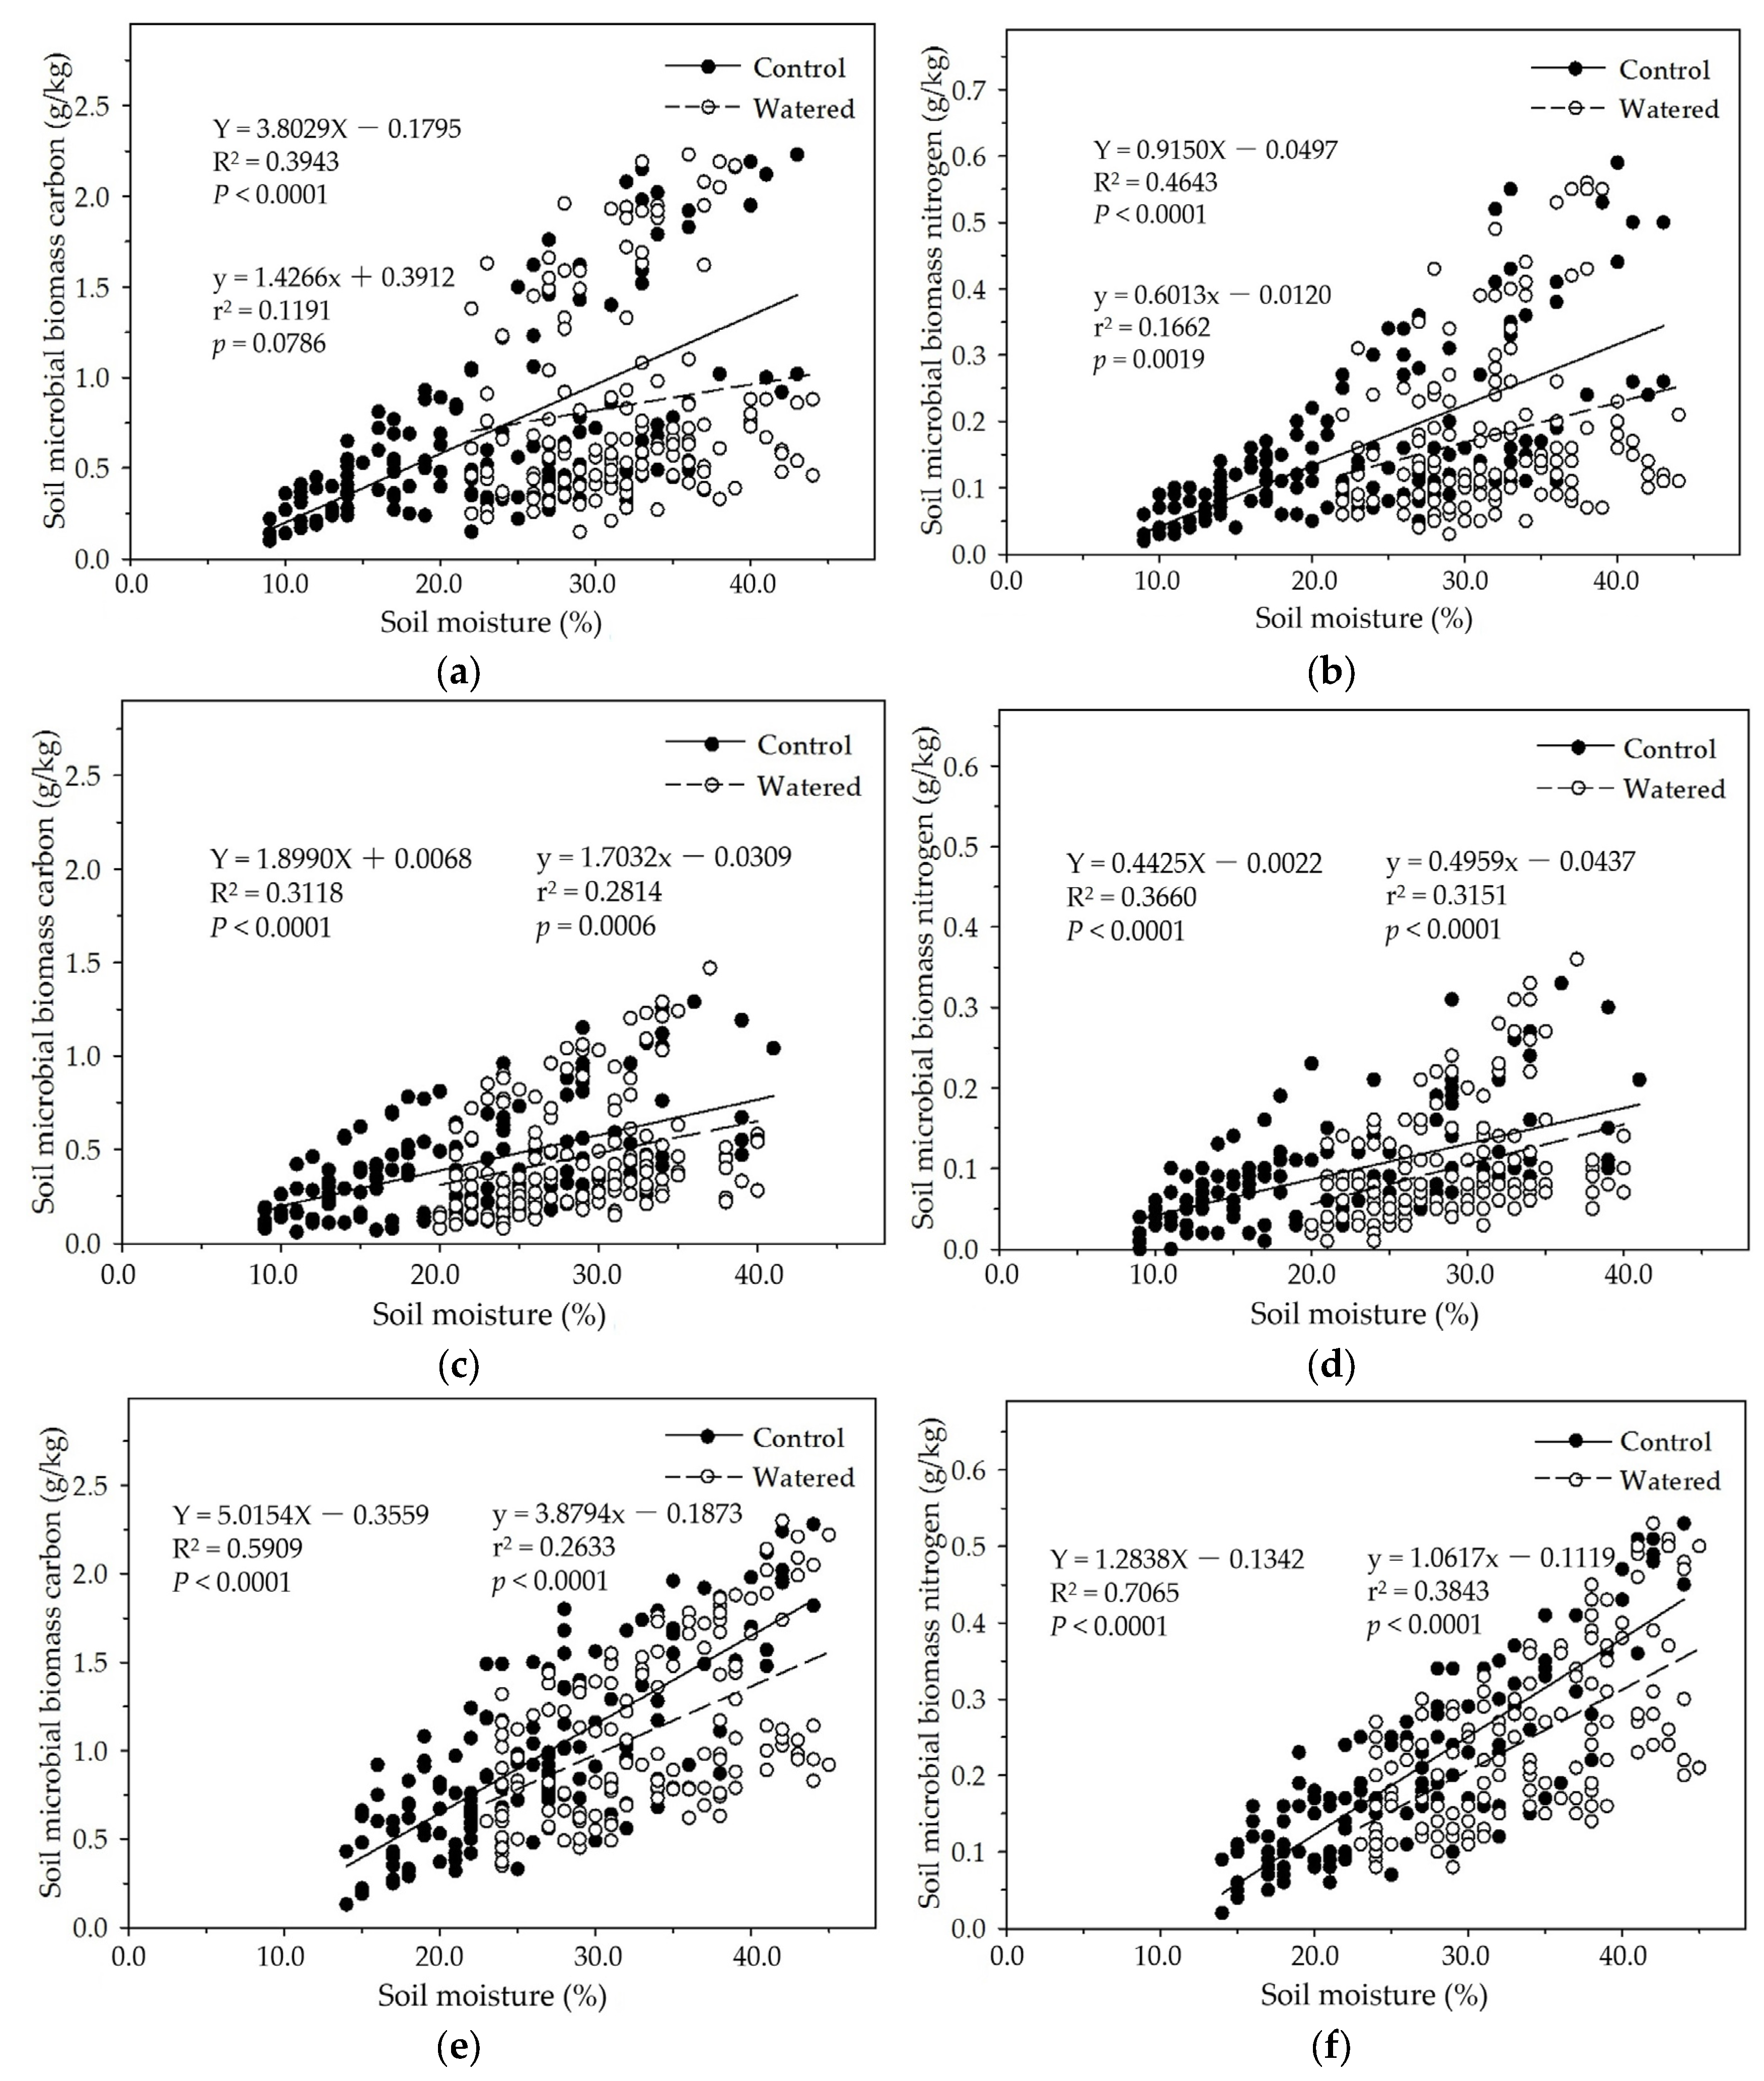
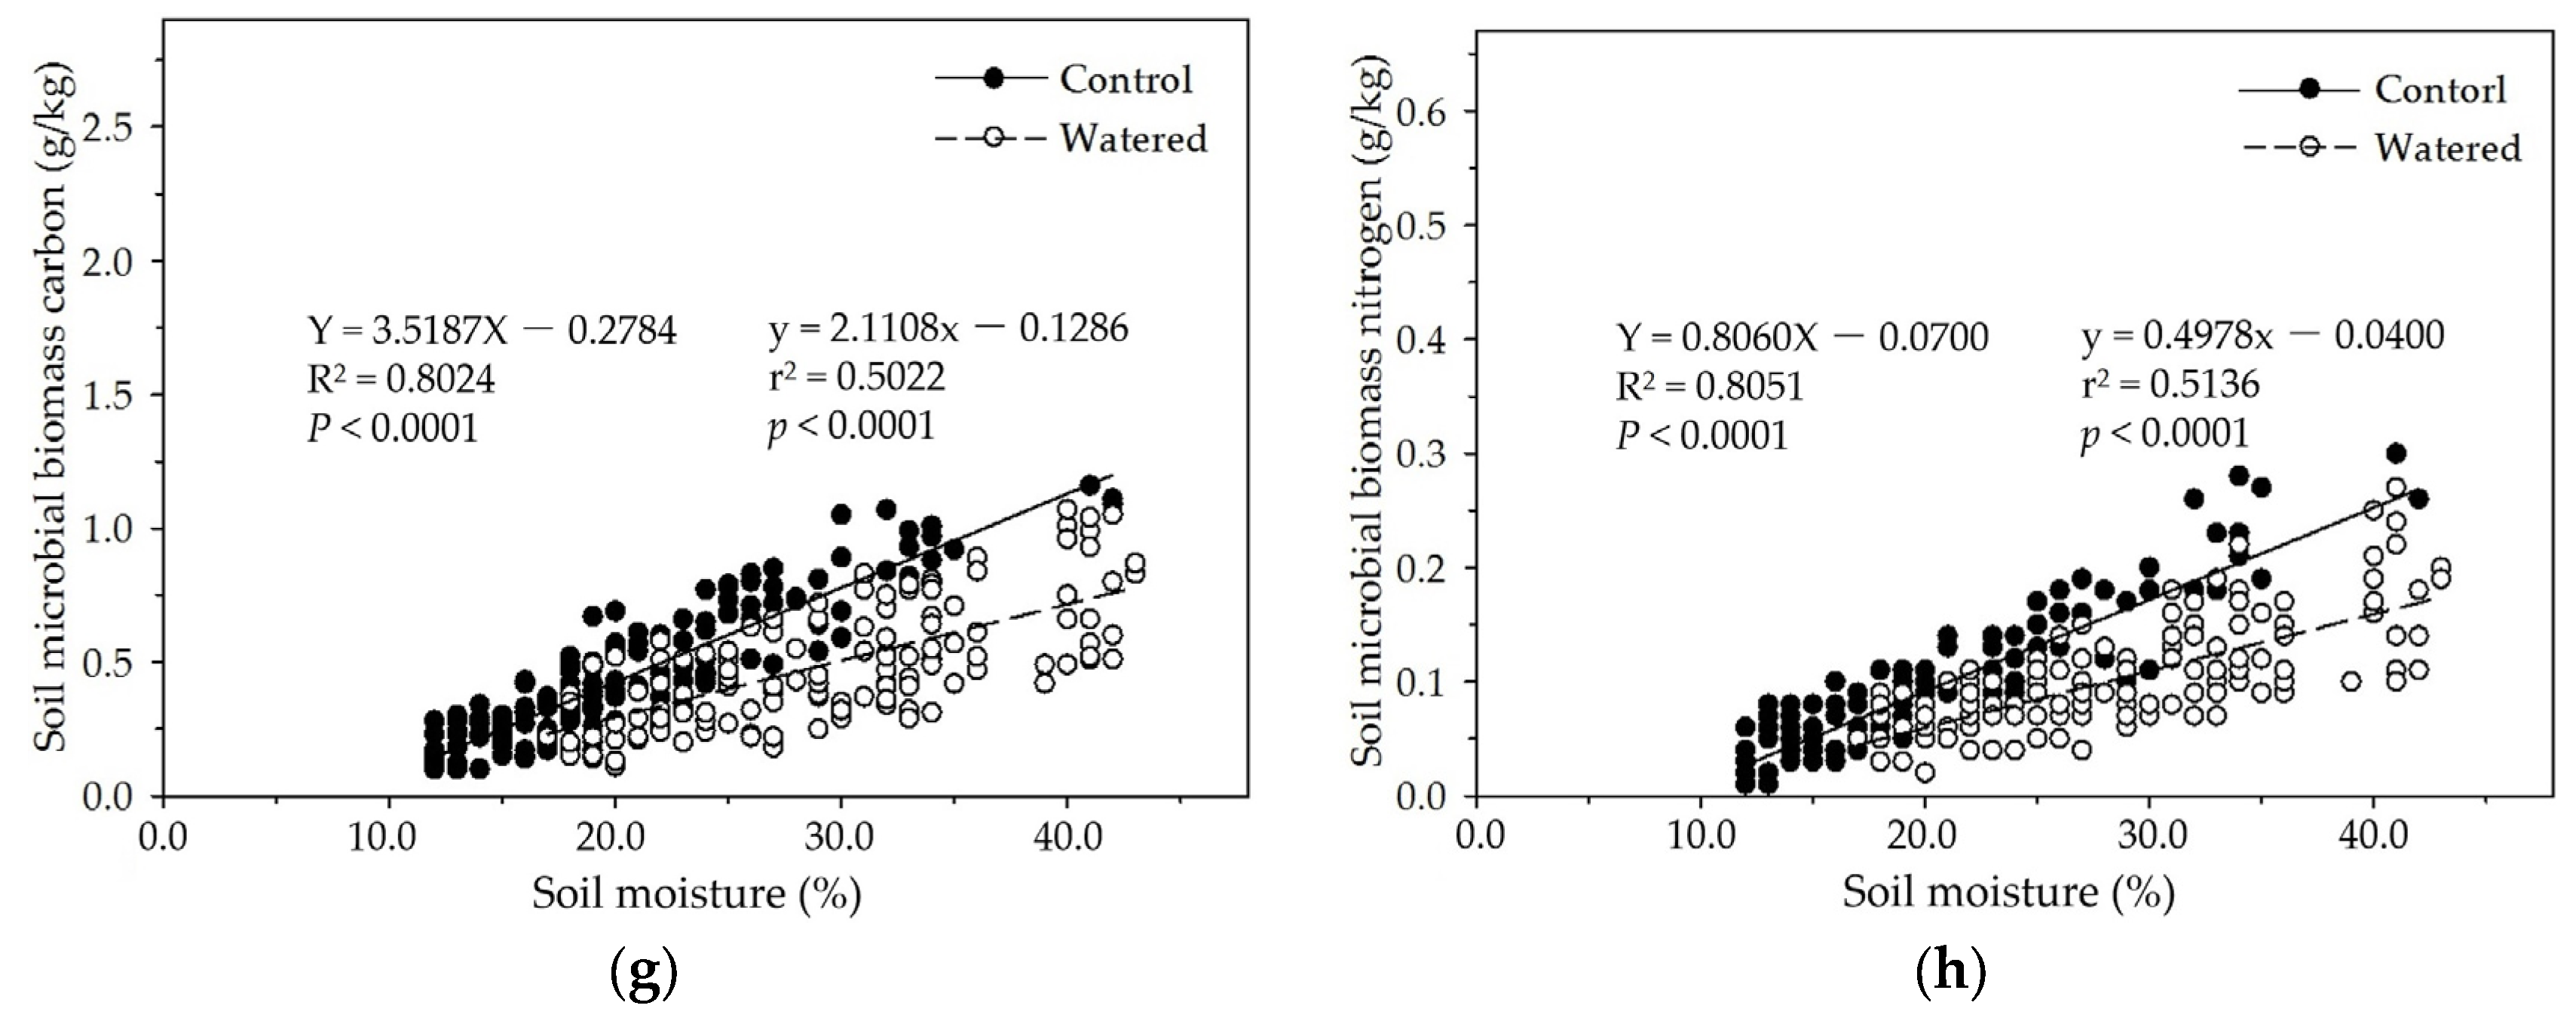
In the four subplots of control and watered plots in our study, soil MBC and MBN were apparently influenced by seasonal drought, and linearly increased with soil moisture except that in the R+F+ subplot of watered plot in which
p = 0.0786 (
Figure 7). In the R+F+ and R−F+ subplots of control plot, dry air, strong solar radiation, frequent winds, and high temperature reduced litterfall decomposition rate and accumulated massive floor mass on the ground during dry season, resulting in low soil moisture, infertile soil circumstance, and less soil microbes; and heavy precipitation, wet air, dense forest crown, and low temperature accelerated litterfall decomposition rate and nutrient release speed to soil microbes during wet season, resulting in high soil moisture, fertile soil circumstance, and more soil microbes. In the R+F− and R−F− subplots of control plot, dry air, strong solar radiation, frequent winds, and high temperature dried soil surface and eliminated most soil microbes without the protection and buffering effect of floor mass, resulting in extremely low soil microbes during dry season; and heavy precipitation, wet air, dense forest crown, low temperature, and frequent throughfall from forest crown and trunk during wet season provided abundant water to soil microbes, resulting in more soil microbes than that in dry season. Moreover, we weekly checked and managed field investigation plot and could not keep soil moisture in a same level, resulting in a weak fluctuation of soil moisture in the all subplots of watered plot. This could change the rate of floor mass decomposition rate and nutrient release to soil, resulting in the variation of soil microbial biomass in watered plot.
4.2. Effects of Floor Mass on Soil Microbial Biomass
Accumulation of floor mass is co–decided by litterfall deposition and floor mass decomposition in forests. Massive litterfall deposition and low floor mass decomposition rate because of drought stress and plant phenology during dry season can accumulate massive dry floor mass on the ground, resulting in most carbon and organic nutrients are blocked in the plant organs instead of releasing to soil and soil microbes [
57,
58,
59,
60]. A small amount of litterfall deposition and high floor mass decomposition rate because of plenty precipitation and plant phenology during wet season can accelerate extremely floor mass decomposition and release organic carbon and nutrients of plant organs to soil and soil microbes fast [
57,
58,
59,
60]. Anaya et al. found that carbon concentration of floor mass was most in early–dry season and least in rainy season, and water–soluble organic carbon and nitrogen concentrations were most during the early– and late–dry season and represented up to 4.1 and 5.9% of the total carbon and nitrogen respectively in a tropical dry forest ecosystem of Mexico [
58]. Liu et al. found that soil MBC was significantly more in wet season than that in dry season across all three experimental forests, namely, old–growth forest, mixed–forest, and pine forest in the Dinghushan Biosphere Reserve of Guangdong province in southern China because of significantly higher decomposition rates of forest litter during wet season than dry season [
59]. Turner et al. found that concentrations of carbon, nitrogen, and phosphorus in soil organic matter as well as soil microbial biomass declined markedly during dry season, and then recovered rapidly during the following wet season, because drought conditions in dry season inhibited litterfall decomposition [
60]. However, there are also some studies showed that soil microbial biomass was not directly correlated with litterfall in forests [
10,
61]. Asynchronous fluctuation of soil microbial biomass and plant litterfall was found in a tropical wet forest of Puerto Rico, because most tree individuals reduced plant nutrient uptake and redistributed nutrients and carbohydrates from leaves to stems and plant roots before their leaves senescence and abscission, resulting in high soil microbial biomass one month prior to leaves senescence and abscission [
10].
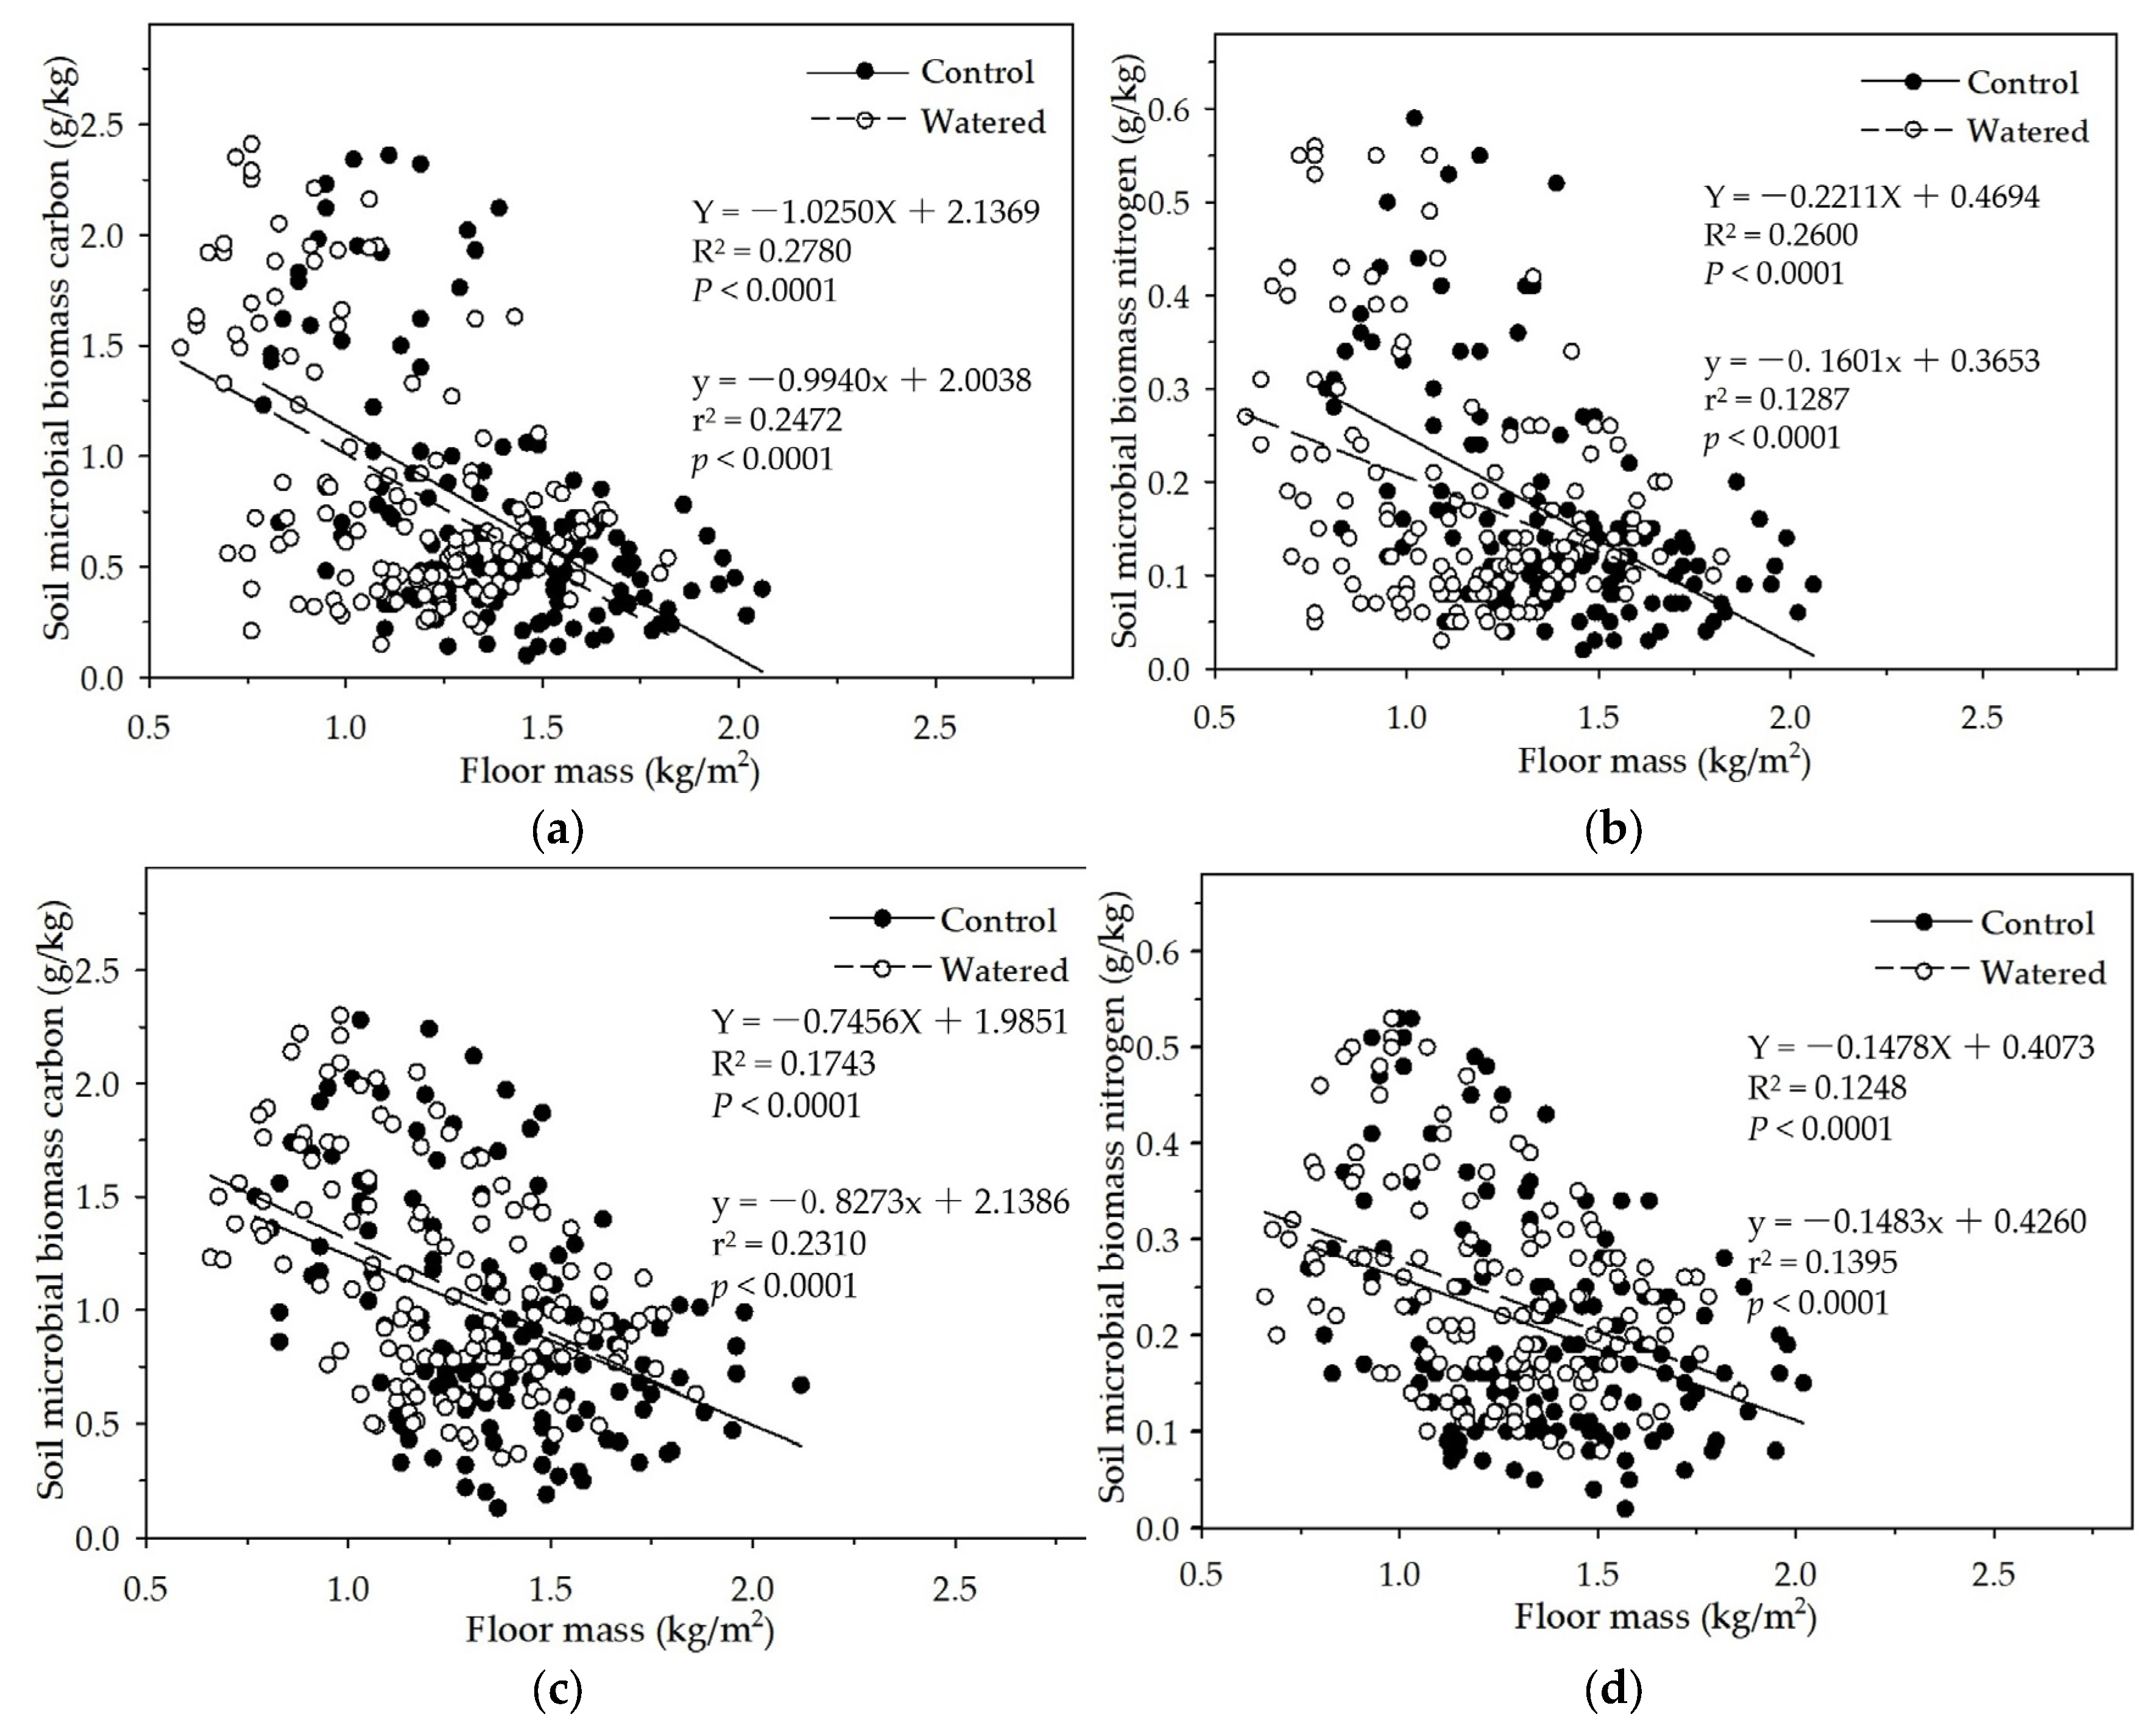
In the R+F+ and R−F+ subplots of control and watered plots, soil MBC and MBN linearly decreased with the floor mass increase (
Figure 8). This is consistent with the data analyses results of the mixed linear model in R (V 3.0.1) and the multiple linear regression analysis in SPSS 21.0, which both showed that floor mass could statistically influence soil MBC and MBN. This negatively linear correlation between floor mass and soil microbial biomass could be explained as the interaction between seasonal drought and floor mass. With the severity increase of seasonal drought, plant individuals released more litterfall on the ground, simultaneously soil microbial biomass and activity also gradually decreased, resulting in that massive litterfall accumulated on the ground during dry season; with the arrival of wet season, thick floor mass started to decompose and release organic carbon and nutrients, which process precisely met plant growth, resulting in that most organic carbon and nutrients were absorbed by plant roots rather than soil microbes. Soil microbes are often at a disadvantage in the nutrient competition with plant roots in wet season [
62,
63,
64]. This suppressed state of soil microbes could continue to the end of wet season, i.e., most tree individuals start to be senescent and fall leaves. Before most tree individuals enter dormancy, they reduce nutrient uptake and redistribute organic nutrients and carbohydrates of plant organs from leaves to stems and plant roots, resulting in more root exudates release to soil and soil microbes, like sugar, organic acid, and amino acid, which could boost soil microbial biomass and activity [
65,
66,
67]. This is the reason why soil MBC and MBN abruptly increase in November and December in which most leaves start to defoliate.
4.3. Effects of Plant Roots on Soil Microbial Biomass
A complex relationship between plant roots and soil microbes occurs that includes competition for organic carbon and mineral nutrients and promotion for mutual growth and metabolism [
10,
11,
68,
69,
70,
71,
72,
73]. Primary production and plant diversity of many forest ecosystems were reported to be inhibited by soil mineral nutrients, such as nitrogen, phosphorus, and potassium [
61,
72,
73]. Soil calcium and magnesium were also found to be correlated with forest aboveground net primary production and heterogeneity of soil microbes in mixed hardwood stands of the Manistee National Forest in the lower peninsula of Michigan, USA and in a long–term nutrient addition experiment of lowland tropical rain forest in central Panama [
74,
75]. Plant individuals take most available soil mineral nutrients to suppress soil microbial activity during growing season, and release organic carbon and nutrients to microbes through floor mass decomposition when they enter dormancy, resulting in carbon allocation trade–off between plants and soil microbial communities [
1,
2]. In the short term, plant individuals maintain their competitiveness mainly through establishing mycorrhizal fungi associations which help them acquire organic and inorganic forms of nitrogen and root exudation of extracellular enzymes that decompose rhizosphere soil organic matter [
11,
68,
69,
70]. In the long term, plant species directly interact with special soil microbes in the rhizosphere by feeding on (or infecting) plant roots, by forming symbiotic relationships such as mycorrhizae, or by promoting plant growth through phyto–homorme production or reducing plant stress signaling; or plant species form asynchronous fluctuation between primary production and soil microbes though seasonality of environmental factors and plant phenology [
10,
11,
71]. Certainly, relationships between plant roots and soil microbes, i.e., competition, mutualistic symbiosis, or changes with seasons and plant phenology, depends on multiple factors, such as soil nutrient content and composition, local climate conditions, plant phenology, and soil microbial community [
3,
10,
11,
76].
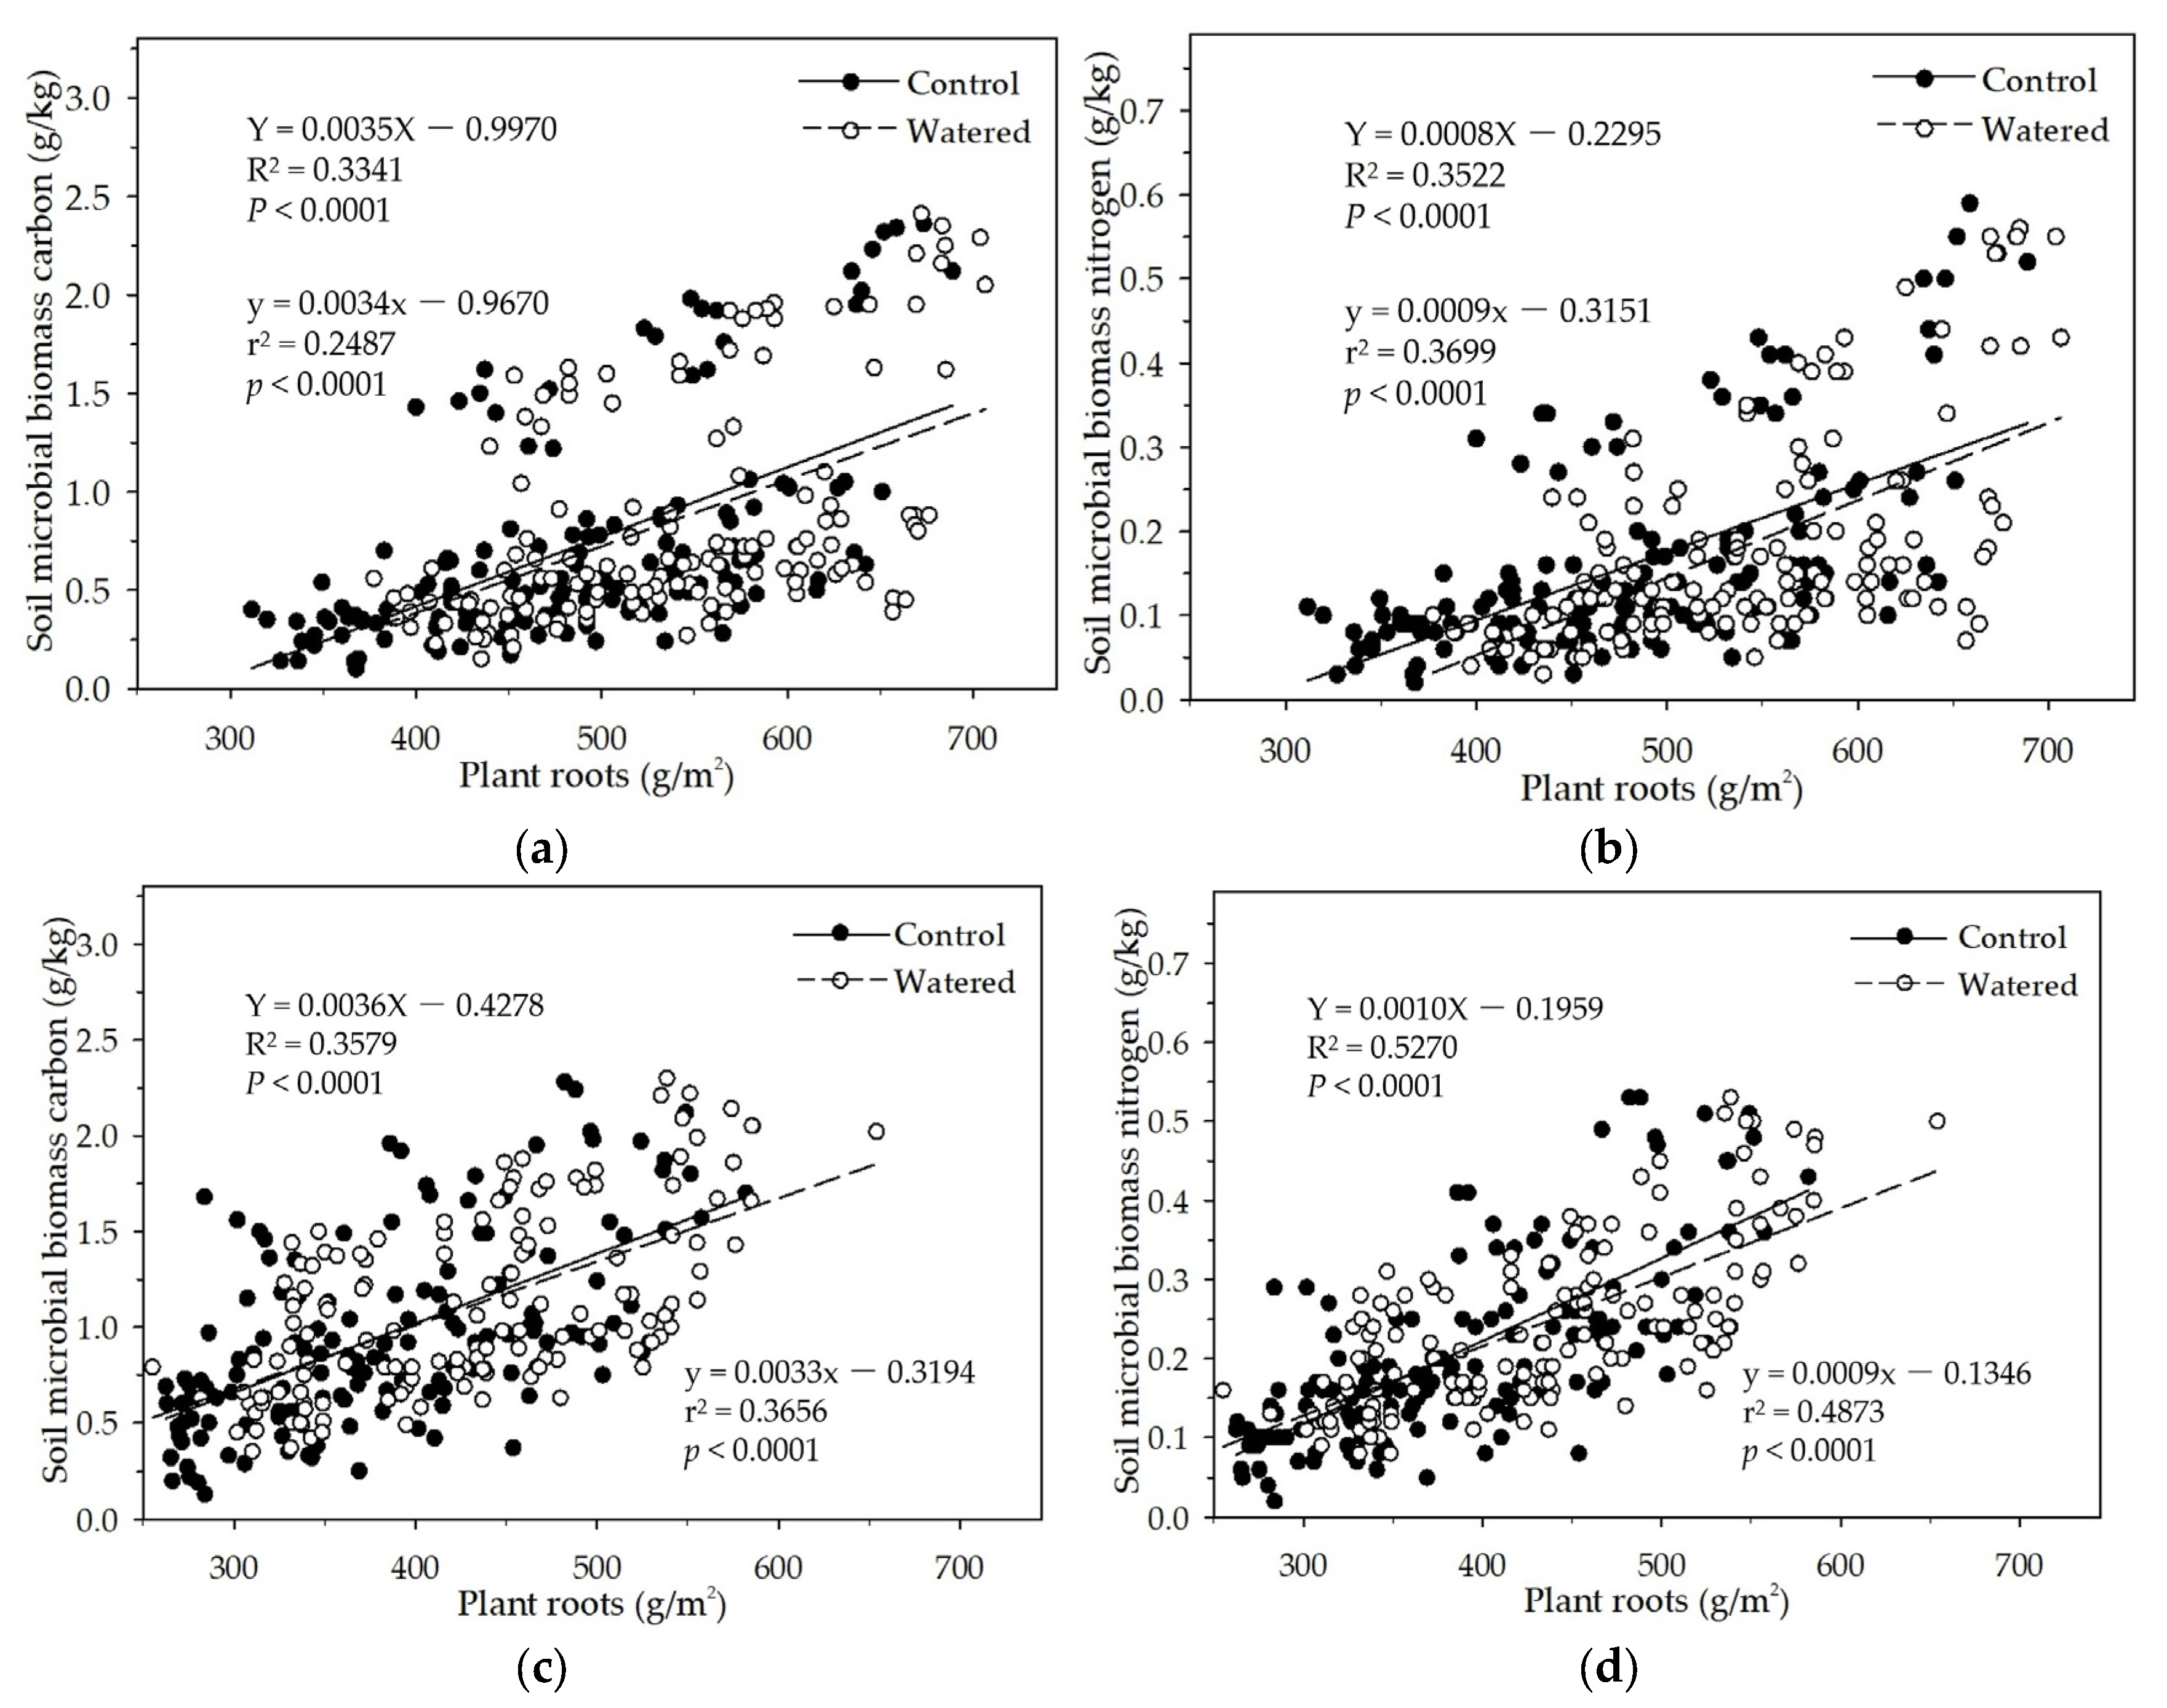
In the R+F+ and R+F− subplots in this study, soil MBC and MBN linearly increased with the plant roots increase (
Figure 9). This is consistent with the data analyses results of the mixed linear model in R (V 3.0.1) and the multiple linear regression analysis in SPSS 21.0, which both showed that plant roots could influence soil MBC and MBN. This positively linear correlation between plant roots and soil microbial biomass could be explained as the interaction between seasonal drought and plant roots. During dry season, plant roots and soil microbes both were suppressed due to high soil temperature and low soil moisture, resulting in plant roots withered and soil microbes decreased. With wet season coming, soil moisture and the availability of soil nutrients increased; plant roots and soil microbes entered growing season. Although competition for organic carbon and soil nutrients between plant roots and soil microbes occurred, plant roots grew rapidly, and soil microbes also grew and reproduced with a small amount with the help of less organic carbon and soil minerals as well as the symbiosis with plant roots. The co−development relationship continually processed till the end of growing season in which soil moisture decreased drastically, plant roots stored most nutrients and carbohydrates redistributed from aboveground organs and released more root exudates to soil microbes as well as most fine roots in the surface soil then started to withered away. Soil microbes reached the peak and then decreased drastically synchronous with plant fine roots.
4.4. Complex Effects of Seasonal Drought, Floor Mass and Plant Roots on Soil Microbial Biomass
Interactions of plant–soil–soil microbes in collaboration with global climate change are crucial for carbon and nutrients cycling as well as forest structure and plant composition in forest ecosystems [
11,
67,
77]. Naturally, plant individuals assimilate CO
2 through photosynthesis to form carbohydrates as well as itself organs and tissues in collaboration with all kinds mineral nutrients from soil like leaves and branches; leaves and twigs return to soil after senescence and abscission and release organic carbon and nutrients to soil. One part carbon and nutrients are fixed in soil microbes, and another part is saved in soil to be absorbed by plant roots. Global climate change like drought, high temperature, and heavy storms could change the rate and speed of this carbon and nutrients cycling without altering the pattern [
78,
79,
80]. During this process, soil physicochemical properties like moisture, texture, pH, nutrients content and composition influence plant growth and reproduction as well as soil microbial activity. Forest structure and plant composition regulate soil physicochemical properties as well as soil microbial activity through litterfall and root exudates; soil microbes improve soil physicochemical properties and promote plant growth and reproduction through decomposing litterfall and symbiosis with plant roots [
2,
3,
10,
11,
76]. Severe seasonal drought along with high air and soil temperature and strong solar radiation resulted from global climate change could lead to severe drought stress and inhibit plant growth and succession and soil microbial activity, leading to massive plant withered away and inhibiting carbon and nutrients cycling in forest ecosystems [
80,
81,
82]. Moreover, unpredictability of climate conditions driven by global climate change increases the complexity of dynamics of soil microbial activity.
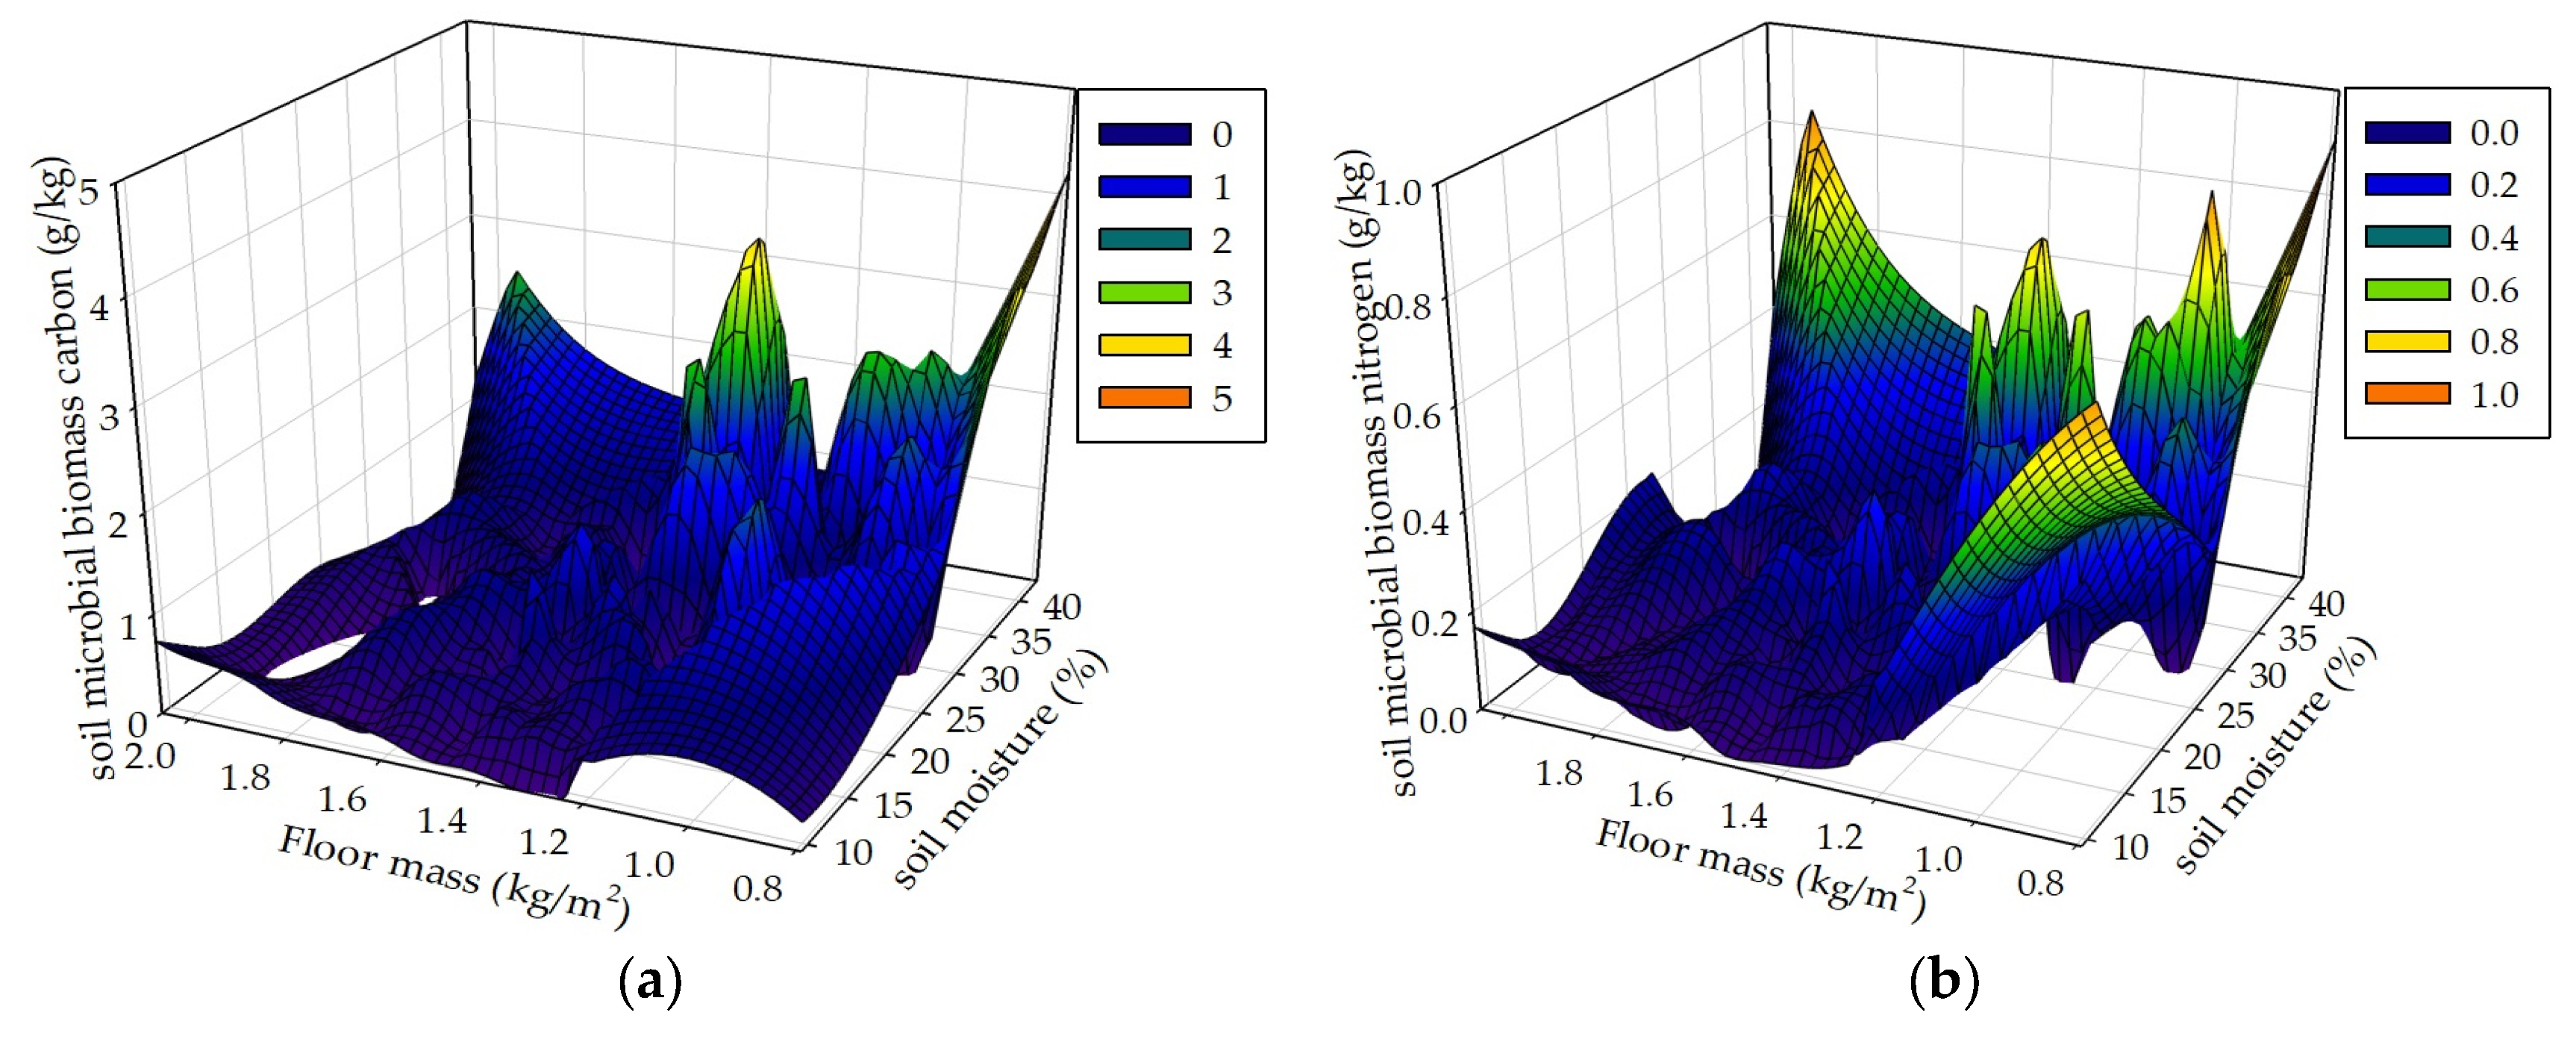
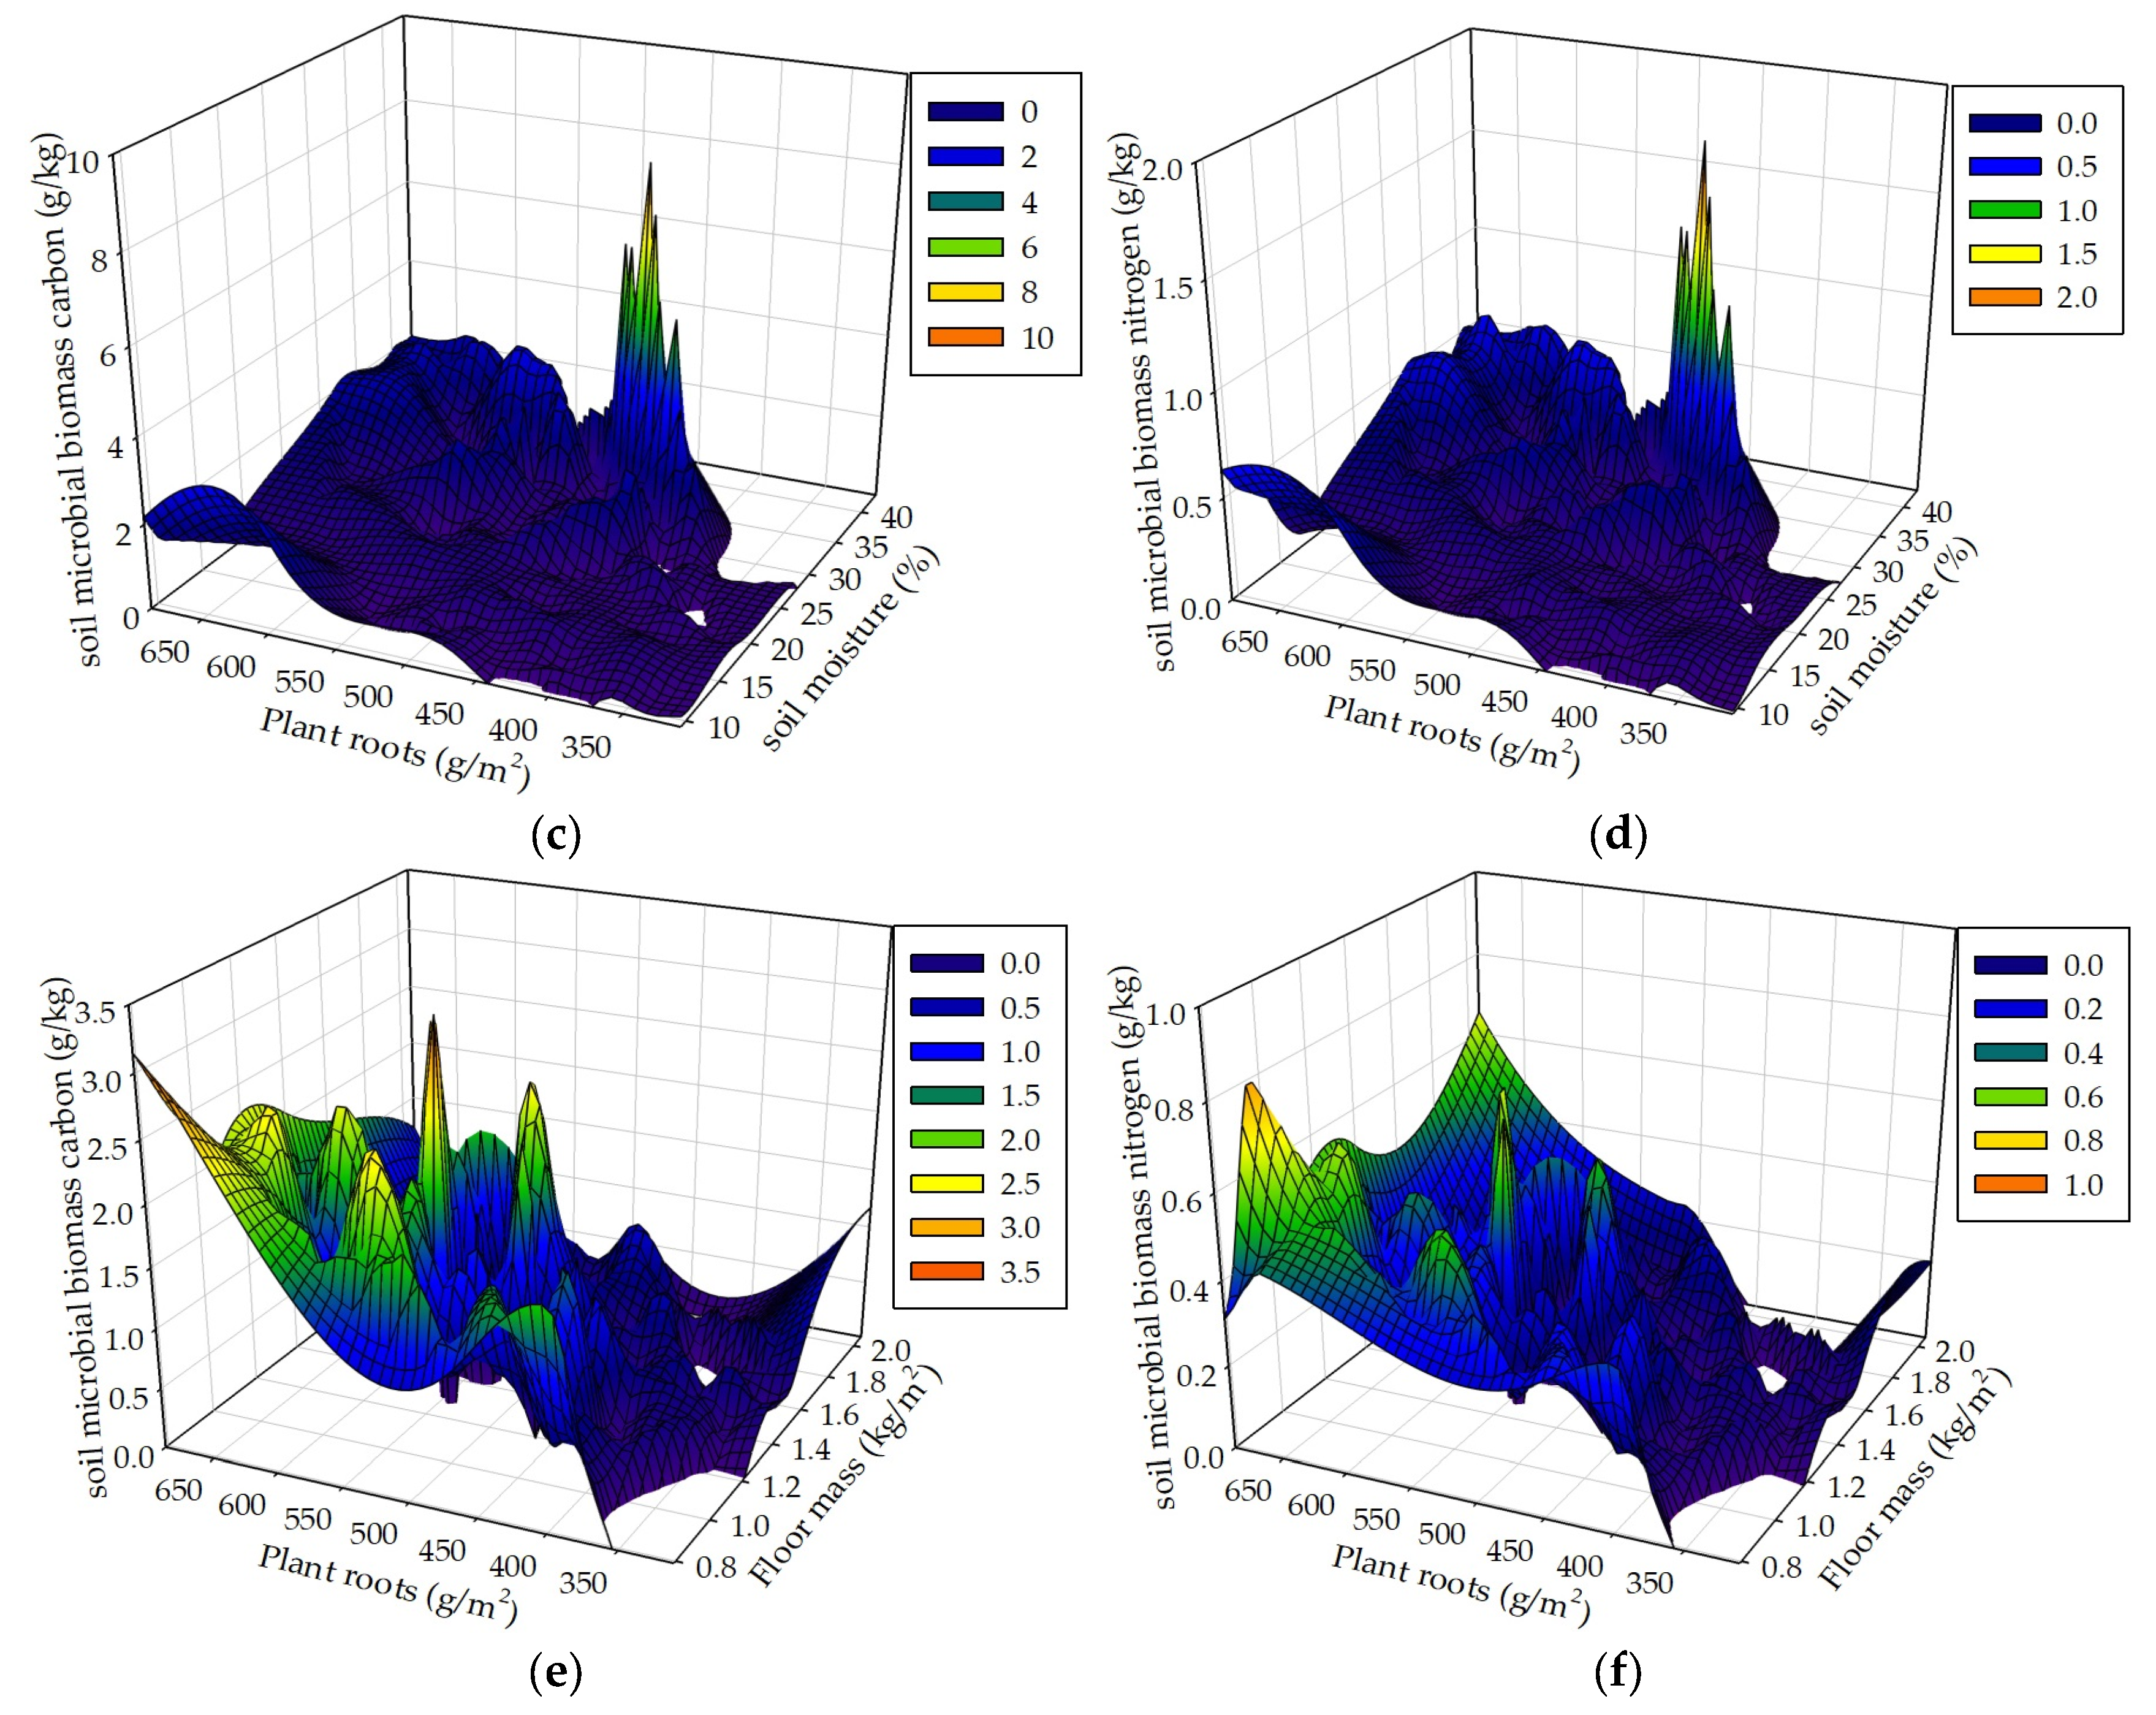
Seasonal drought, floor mass, plant roots and associated environmental factors result in complex and interacting effects on soil MBC and MBN. We hypothesized that seasonal drought, floor mass, and plant roots as well as sampling time interactively influence soil MBC and MBN. The data analyses results of the mixed linear model in R (V 3.0.1) and the multiple linear regression analysis in SPSS 21.0 both showed that these controlled variables could interactively influence soil MBC and MBN. The results of the 3D mesh plot in SPSS 21.0 of soil moisture, floor mass, and plant roots in the R+F+ subplot of control plot showed that the combinations of high soil moisture and less floor mass, high soil moisture and intermediate plant roots, and more plant roots and less floor mass could be beneficial to soil microbial biomass (
Figure 10). The combination of high soil moisture and less floor mass indicates that this situation occurs in the end of wet season, in which soil microbes have enough water to decompose floor mass, most floor mass has already been decomposed to release organic carbon and nutrients to soil microbes, most plant individuals reduce nutrient uptake from soil, plentiful nutrients and carbohydrates redistribute from leaves to stem and plant roots, and abundant plant root exudates release to soil microbes, resulting in a large amount of soil microbes. The combination of high soil moisture and intermediate plant roots indicates that this situation occurs in the middle of wet season , in which soil microbes have enough water to grow and reproduce, massive floor mass has already been decomposed and a large amount of organic carbon and nutrients have already been released to soil, plant roots have already been in the process of growth without reaching the maximum, resulting in enough nutrients to soil microbes. The combination of more plant roots and less floor mass indicates that this situation occurs in the end of wet season, in which most floor mass has already been decomposed and massive organic carbon and nutrients have already been released to soil, and a large amount of plant roots have already stopped to grow and start to release nutrients and carbohydrates to soil, resulting in plentiful carbon and nutrients to soil microbes.
5. Conclusions
This study demonstrated that (1) soil microbial biomass as well as soil moisture, floor mass, and plant roots showed an apparent single–hump modal within one year; (2) fluctuation amplitude of soil microbial biomass in the four subplots was different with each other; and (3) seasonal drought, floor mass, plant roots, and their interactions could apparently influence soil microbial biomass. The results support our original hypothesis. Although the maximum soil microbial biomass was inter–annually similar, the minimum was apparently different among years, indicating that (1) the maximum soil microbial biomass might also be the soil carrying capacity of microbial biomass, (2) the effects of seasonal drought on soil microbial biomass during dry season were different among years with varying drought severity, and (3) no legacy effects of varying drought severity on the maximum soil microbial biomass occurred. This reflects that soil microbes are sensitive to the recovery of various environmental variables and could recover fast to the maximum level. We explain the abrupt increase of soil microbial biomass in November and December as the reduction in plant nutrient uptake and retranslocation of nutrients and carbohydrates from leaves to stems and plant roots in the end ofwet season, which need experimental data to prove in the further study.
Author Contributions
Conceptualization, validation, and methodology, Y.Y. and X.L.; formal analysis, investigation, and writing–original draft preparation, Y.Y., X.L. T.L. and J.G.; resources, supervision, project administration, and funding acquisition, J.G. and Y.L.; data curation and visualization, X.L. and C.W.; writing–review and editing, Y.Y., X.L., T.L., J.G., Y.L. and C.W. All authors have read and agreed to the published version of the manuscript.
Funding
This research was funded by National Natural Science Foundation of China (Regional Program), grant number was 42165009; and it was co−funded by The Young and Middle−aged Academic and Technical Leaders Reserve Talents Program in Yunnan Province (grant number: 202305AC160090) and The Special Basic Cooperative Research Programs of Yunnan Provincial Undergraduate Universities’ Association (grant number: 202301BA070001−087).
Data Availability Statement
The data used to support the findings of this study are available from the first author and the corresponding author upon request.
Conflicts of Interest
The authors declare no conflict of interest.
References
- Wang, X.C.; Pan, J.; Chen, H.Y.; Jiao, Z.; Liu, S.; Wang, C.K. Seasonal asynchrony in above– and below–ground phenology in a temperate forest: carbon allocation trade–off and plant–microbe interactions. Plant and Soil 2023, 473, 1–14. [Google Scholar] [CrossRef]
- Garcia, M.O.; Templer, P.H.; Sorensen, P.O.; Sanders–Demott, R.; Groffman, P.M.; Bhatnagar, J.M. Soil microbes trade–off biogeochemical cycling for stress tolerance traits in response to year–round climate change. Frontiers in Microbiology 2020, 11, 616. [Google Scholar] [CrossRef] [PubMed]
- Rutto, L.K.; Ren, S.X.; Wynn, H.C.; Chamberlain, J.L. Soil and microbe interactions in two populations of Appalachian back cohosh (Actaea racemosa L.). The Journal of the Torrey Botanical Society 2021, 148, 117–131. [Google Scholar] [CrossRef]
- Yang, J.; Lan, L.Y.; Jin, Y.; Yu, N.; Wang, D.; Wang, E.T. Mechanisms underlying legume–rhizobium symbioses. Journal of Integrative Plant Biology 2022, 64, 244–267. [Google Scholar] [CrossRef]
- Wang, X.L.; Feng, H.; Wang, Y.Y.; Wang, M.X.; Xie, X.G.; Chang, H.Z.; Wang, L.K.; Qu, J.C.; Sun, K.; He, W.; Wang, C.Y.; Dai, C.C.; et al. Mycorrhizal symbiosis modulates the rhizosphere microbiota to promote rhizobia–legume symbiosis. Molecular Plant 2021, 14, 503–516. [Google Scholar] [CrossRef]
- Burghardt, L.T.; DiCenzo, G.C. The evolutionary ecology of rhizobia: multiple facets of competition before, during, and after symbiosis with legumes. Current Opinion in Microbiology 2023, 72, 102281. [Google Scholar] [CrossRef]
- Du, Z.Q.; Liu, X.J.; Wu, Z.T.; Zhang, H.; Zhao, J. Responses of forest net primary productivity to climatic factors in China during 1982–2015. Plants 2022, 11, 2932. [Google Scholar] [CrossRef]
- Lin, Y.; Cong, N.; Xiao, J.T.; Kou, Y.P.; Li, Y.Y.; Yu, X.R.; Qi, G.; Gou, C.L.; Bai, Y.P.; Ren, P. Projecting future aboveground carbon sequestration rate of alpine forest on the eastern Tibetan Plateau in response to climate change. Frontiers in Plant Science 2023, 14, 1212406. [Google Scholar] [CrossRef]
- Lv, K.T.; Zhou, M.L.; Ding, Y.; Zang, R.G.; Yao, J.; Luo, Y.S.; Yan, D.F. Regeneration characteristics and influencing factors of woody plant on natural evergreen secondary broad−leaved forests in the subtropical, China. Global Ecology and Conservation 2023, 42, e02394. [Google Scholar] [CrossRef]
- Ruan, H.H.; Zou, X.M.; Scatena, F.N.; Zimmerman, J.K. Asynchronous fluctuation of soil microbial biomass and plant litterfall in a tropical wet forest. Plant and Soil 2004, 260, 147–154. [Google Scholar] [CrossRef]
- De Vries, F.T.; Griffiths, R.I.; Knight, C.G.; Nicolitch, O.; Williams, A. Harnessing rhizosphere microbiomes for drought– resilient crop production. Science 2020, 368, 270–274. [Google Scholar] [CrossRef] [PubMed]
- Liu, X.B.; Zeng, X.C.; Zou, X.M.; Lodge, D.J.; Stankavich, S.; González, G.; Cantrell, S.A. Responses of soil labile organic carbon to a simulated hurricane disturbance in a tropical wet forest. Forests 2018, 9, 420. [Google Scholar] [CrossRef]
- Zhao, L.Q.; Santalahti, M.; Köster, K.; Berninger, F.; Pumpanen, J.; Heinonsalo, J.; Sun, H. Soil fungal community structure in boreal pine forests: from southern to subarctic areas of Finland. Frontiers in Microbiology 2021, 12, 653896. [Google Scholar]
- Zhao, L.Q.; Li, X.L.; Ge, Y.; Palviainen, M.; Zhou, X.; Heinonsalo, J.; Berninger, F.; Pumpanen, J.; Köster, K.; Sun, H. The impact of biochar on wood−inhabiting bacterial community and its function in a boreal pine forest. Environmental Microbiome 2022, 17, 1–15. [Google Scholar]
- Rao, G.; Yan, S.Z.; Song, W.L.; Lin, D.; Chen, Y.J.; Chen, S.L. Distribution, assembly, and interactions of soil microorganisms in the bright coniferous forest area of China’s cold temperate zone. Science of The Total Environment 2023, 897, 165429. [Google Scholar] [CrossRef]
- Wang, N.; Fu, Q.; Zhou, Z.Y.; Shao, Y.Z.; Wang, J.; Li, W.; Ye, Y.Z.; Chen, Y.; Yuan, Z.L. Humus microhabitat affects distributions of soil fungi and bacteria in a temperate mountain forest. Ecology and Evolution 2021, 11, 9148–9158. [Google Scholar] [CrossRef]
- Yan, K.; Dong, Y.F.; Gong, Y.B.; Zhu, Q.L.; Wang, Y.P. Climatic and edaphic factors affecting soil bacterial community biodiversity in different forests of China. CATENA 2021, 207, 105675. [Google Scholar] [CrossRef]
- Amolikondori, A.; Vajari, K.A.; Feizian, M. Assessing soil organic carbon, N and P stocks and its relation to soil properties in artificial canopy gaps in a managed oriental beech (Fagus orientalis L.) forest. Journal of Plant Nutrition and Soil Science 2022, 185, 243–250. [Google Scholar] [CrossRef]
- Cui, J.Y.; Yuan, X.C.; Zhang, Q.F.; Zhou, J.C.; Lin, K.M.; Xu, J.G.; Zeng, Y.Z.; Wu, Y.; Cheng, L.; Zeng, Q.X.; Mei, K.C.; Chen, Y.M.; et al. Nutrient availability is a dominant predictor of soil bacterial and fungal community composition after nitrogen addition in subtropical acidic forests. PLoS One 2021, 16, e0246263. [Google Scholar] [CrossRef]
- Matsumoto, K.; Terasawa, K.; Taniguchi, S.; Ohashi, M.; Katayama, A.; Kume, T.; Takashima, A. Spatial and seasonal variations in soil respiration in a subtropical forest in Okinawa, Japan. Ecological Research 2023, 38, 479–490. [Google Scholar] [CrossRef]
- Liu, X.B.; Li, Y.; Kong, L.Q.; Lodge, D.J.; Hogan, J.A.; Wang, C. Root, litter, and seasonal drought together inhibit plant growth in the herbaceous layer in a subtropical moist forest of southwestern China. Forests 2023, 14, 712. [Google Scholar] [CrossRef]
- Sindall, R.; Mecrow, T.; Queiroga, A.C.; Boyer, C.; Koon, W.; Peden, A.E. Drowning risk and climate change: a state−of−the−art review. Injury prevention 2022, 28, 185–191. [Google Scholar] [CrossRef] [PubMed]
- Alimonti, G.; Mariani, L.; Prodi, F.; Ricci, R.A. A critical assessment of extreme events trends in times of global warming. The European Physical Journal Plus 2022, 137, 112. [Google Scholar] [CrossRef]
- Robinson, W.A. Climate change and extreme weather: A review focusing on the continental United States. Journal of the Air& Waste Management Association 2021, 71, 1186–1209. [Google Scholar]
- Kim, J.B.; So, J.M.; Bae, D.H. Global warming impacts on severe drought characteristics in Asia monsoon region. Water 2020, 12, 1360. [Google Scholar] [CrossRef]
- Burdon, R.D. Shoot phenology as a driver or modulator of stem diameter growth and wood properties, with special reference to Pinus radiata. Forests 2023, 14, 570. [Google Scholar] [CrossRef]
- Li, W.T.; Pacheco–Labrador, J.; Migliavacca, M.; Miralles, D.; Van Dijke, A.H.; Reichstein, M.; Forkel, M.; Zhang, W.J.; Frankenberg, C.; et al. Widespread and complex drought effects on vegetation physiology inferred from space. Nature Communications 2023, 14, 4640. [Google Scholar] [CrossRef]
- Miller, D.L.; Alonzo, M.; Meerdink, S.K.; Allen, M.A.; Tague, C.L.; Roberts, D.A.; McFadden, J.P. Seasonal and interannual drought responses of vegetation in a California urbanized area measured using complementary remote sensing indices. ISPRS Journal of Photogrammetry and Remote Sensing 2022, 183, 178–195. [Google Scholar] [CrossRef]
- Asensio, D.; Zuccarini, P.; Ogaya, R.; Marañón−Jiménez, S.; Sardans, J.; Peñuelas, J. Simulated climate change and seasonal drought increase carbon and phosphorus demand in Mediterranean forest soils. Soil Biology and Biochemistry 2021, 163, 108424. [Google Scholar] [CrossRef]
- Marañón−Jiménez, S.; Asensio, D.; Sardans, J.; Zuccarini, P.; Ogaya, R.; Mattana, S.; Peñuelas, J. Seasonal drought in Mediterranean soils mainly changes microbial C and N contents whereas chronic drought mainly impairs the capacity of microbes to retain P. Soil Biology and Biochemistry 2022, 165, 108515. [Google Scholar] [CrossRef]
- Krüger, M.; Potthast, K.; Michalzik, B.; Tischer, A.; Küsel, K.; Deckner, F.F.K.; Herrmann, M. Drought and rewetting events enhance nitrate leaching and seepage−mediated translocation of microbes from beech forest soils. Soil Biology and Biochemistry 2021, 154, 108153. [Google Scholar] [CrossRef]
- Del Arroyo, O.G.; Silver, W.L. Disentangling the long–term effects of disturbance on soil biogeochemistry in a wet tropical forest ecosystem. Global Change Biology 2018, 24, 1673–1684. [Google Scholar] [CrossRef]
- Ge, X.G.; Wang, C.W.; Wang, L.L.; Zhou, B.Z.; Cao, Y.H.; Xiao, W.F.; Li, M.H. Drought changes litter quantity and quality, and soil microbial activities to affect soil nutrients in moso bamboo forest. Science of the Total Environment 2022, 838, 156351. [Google Scholar] [CrossRef] [PubMed]
- Lin, C.; Wang, K.; Chen, R.; Zhang, J.; Zhang, B.; Lu, J.Z. Characteristics of erosive rainfall in Jianshan River Watershed of Yuxi City. Bulletin of Soil and Water Conservation 2018, 38, 235–240. [Google Scholar]
- He, P.; Shu, P.J. An analysis on characteristics of regional precipitation and influence of urbanization in Yuxi city. Journal of Chuxiong Normal University (Natural Sciences) 2020, 35, 132–137. [Google Scholar]
- Falade, A.A.; Lagoke, S.T.O.; Adigun, J.A.; Pitan, O.R.; Osunleti, O.O. Growth and yield of maize (Zea mays L.) as influenced by cropping pattern and weed control treatments in the forest−savanna agro−ecological zone of southwest Nigeria. Acta Fytotechnica et Zootechnica 2023, 26, 155–162. [Google Scholar] [CrossRef]
- Xu, C.; Ruan, H.H.; Wu, X.Q.; Xie, Y.C.; Yang, Y. Progresses in drought stress on the accumulation and turnover of soil organic carbon in forests. Journal of Nanjing Forestry University (Natural Sciences Edition) 2022, 46, 195–206. [Google Scholar]
- Canarini, A.; Schmidt, H.; Fuchslueger, L.; Martin, V.; Herbold, C.W.; Zezula, D.; Gündler, P.; Hasibeder, R.; Jecmenica, M.; Bahn, M.; Richter, A. Ecological memory of recurrent drought modifies soil processes via changes in soil microbial community. Nature Communications 2021, 12, 5308. [Google Scholar] [CrossRef]
- Jenkinson, D.; Plowlson, D.S. The effects of biocidal treatments on metabolism in soil–V: A method for method for measuring soil biomass. Soil Biology and Biochemistry 1976, 8, 209–213. [Google Scholar] [CrossRef]
- Paliaga, S.; Laudicina, V.A.; Badalucco, L. Lysis of soil microbial cells by CO2 or N2 high pressurization compared with chloroform fumigation. Biology and Fertility of Soils 2023, 59, 609–618. [Google Scholar] [CrossRef]
- Brookes, P.C.; Landman, A.; Pruden, G.; Jenkinson, D.S. Chloroform fumigation and the release of soil nitrogen: a rapid direct extraction method to measure microbial biomass nitrogen in soil. Soil Biology and Biochemistry 1985, 17, 837–842. [Google Scholar] [CrossRef]
- Aoyama, M.; Nozawa, T. Microbial biomass nitrogen and mineralization–immobilization processes of nitrogen in soils incubated with various organic materials. Soil Science and Plant Nutrition 1993, 39, 23–32. [Google Scholar] [CrossRef]
- Cola, V.D.; Broennimann, O.; Petipierre, B.; Breiner, F.T.; D’Amen, M.; Randin, C.; Engler, R.; Pottier, J.; Pio, D.; Dubuis,, Al; et al. Ecospat: An R package to support spatial analyses and modeling of species niches and distributions. Ecography 2017, 40, 774–787. [Google Scholar] [CrossRef]
- González−Fernández, A.; Arroyo−Rodríguez, V.; Ramírez−Corona, F.; Manjarrez, J.; Aguilera−Hernández, A.; Sunny, A. Local and landscape drivers of the number of individuals and genetic diversity of a microendemic and critically endangered salamander. Landscape Ecology 2019, 34, 1989–2000. [Google Scholar] [CrossRef]
- Hua, G.; Zhang, Q.; Zhang, R.; Abdullah, A.M.; Linser, P.J.; Adang, M.J. AgCad2 cadherin in Anopheles gambiae larvae is a putative receptor of Cry11Ba toxin of Bacillus thuringiensis subsp. jegathesan. Insect Biochemistry and Molecular Biology 2013, 43, 153–161. [Google Scholar] [CrossRef] [PubMed]
- McKee, K.K.; Yurchenco, P.D. Amelioration of muscle and nerve pathology of Lama2–related dystrophy by AAV9–laminin– αLN linker protein. JCI Insight 2022, 7, e158397. [Google Scholar] [CrossRef]
- Dphil, R.J.C.; Farmer, L.D.M. Understanding and checking the assumptions of linear regression: a primer for medical researchers. Clinical and Experimental Ophthalmology 2014, 42, 590–596. [Google Scholar]
- Drezner, Z.; Turel, O. Normalizing variables with too–frequent values using a Kolmogorov–Smirnov test: a practical approach. Computers & Industrial Engineering 2011, 61, 1240–1244. [Google Scholar]
- Uyanto, S.S. Monte Carlo power comparison of seven most commonly used heteroscedasticity tests. Communications in Statistics–Simulation and Computation 2022, 51, 2065–2082. [Google Scholar] [CrossRef]
- Singh, J.S.; Raghubanshi, A.S.; Singh, R.S.; Srivastava, S.C. Microbial biomass acts as a source of plant nutrients in dry tropical forest and savanna. Nature 1989, 399, 499–500. [Google Scholar] [CrossRef]
- Raghubanshi, A.S. Dynamics of soil biomass C, N, and P in a dry tropical forest in India. Biology and Fertility of Soils 1991, 12, 55–59. [Google Scholar] [CrossRef]
- Barbhuiya, A.R.; Arunachalam, A.; Pandey, H.N.; Arunachalam, K.; Khan, M.L.; Nath, P.C. Dynamics of soil microbial biomass C, N and P in disturbed and undisturbed stands of a tropical wet–evergreen forest. European Journal of Soil Biology 2004, 40, 113–121. [Google Scholar] [CrossRef]
- Bargali, K.; Manral, V.; Padalia, K.; Bargali, S.S.; Upadhyay, V.P. Effect of vegetation type and season on microbial biomass carbon in central Himalayan forest soils, India. CATENA 2018, 171, 125–135. [Google Scholar] [CrossRef]
- Basu, S.; Joshi, S.K.; Pati, D.P.; Behera, N. Soil respiration in relation to microbial biomass in a tropical deciduous forest floor from India. Journal of Soil Ecology and Biology 1991, 28, 377–386. [Google Scholar]
- Manral, V.; Bargali, K.; Bargali, S.S.; Karki, H.; Chaturvedi, R.K. Seasonal dynamics of soil microbial biomass C, N and P along an altitudinal gradient in Central Himalaya, India. Sustainability 2023, 15, 1651. [Google Scholar] [CrossRef]
- Luizão, F.J.; Proctor, J.; Thompson, J.; Luizão, R.C.; Marrs, R.H.; Scott, D.A.; Viana, V. Rain forest on Maracá Island, Roraima, Brazil: soil and litter process response to artificial gaps. Forest Ecology and Management 1998, 102, 291–303. [Google Scholar] [CrossRef]
- Yang, J.C.; Insam, H. Microbial biomass and relative contributions of bacteria and fungi in beneath tropical rain forest, Hainan Island, China. Journal of Tropical Ecology 1991, 7, 385–395. [Google Scholar] [CrossRef]
- Anaya, C.A.; García–Oliva, F.; Jaramillo, V.J. Rainfall and labile carbon availability control litter nitrogen dynamics in a tropical dry forest. Oecologia 2007, 150, 602–610. [Google Scholar] [CrossRef]
- Liu, L.; Gundersen, P.; Zhang, T.; Mo, J.M. Effects of phosphorus addition on soil microbial biomass and community composition in three forest types in tropical China. Soil Biology & Biochemistry 2012, 44, 31–38. [Google Scholar]
- Turner, B.L.; Yavitt, J.B.; Harms, K.E.; Garcia, M.N.; Wright, S.J. Seasonal changes in soil organic matter after a decade of nutrient addition in a lowland tropical forest. Biogeochemistry 2015, 123, 221–235. [Google Scholar] [CrossRef]
- Huang, J.S.; Hu, B.; Qi, K.B.; Chen, W.J.; Pang, X.Y.; Bao, W.K.; Tian, G.L. Effects of phosphorus addition on soil microbial biomass and community composition in a subalpine spruce plantation. European Journal of Soil Biology 2016, 72, 35–41. [Google Scholar] [CrossRef]
- Sun, L.J.; Ataka, M.; Han, M.G.; Han, Y.F.; Gan, D.Y.; Xu, T.L.; Guo, Y.P.; Zhu, B. Root exudation as a major competitive fine–root functional trait of 18 coexisting species in a subtropical forest. New Phytologist 2021, 229, 259–271. [Google Scholar] [CrossRef] [PubMed]
- Li, S.Y.; Xie, D.; Ge, X.G.; Dong, W.; Luan, J.W. Altered diversity and functioning of soil and root–associated microbiomes by an invasive native plant. Plant and Soil 2022, 472, 235–249. [Google Scholar] [CrossRef]
- Liu, B.T.; Han, F.; Ning, P.; Li, H.B.; Rengel, Z. Root traits and soil nutrient and carbon availability drive soil microbial diversity and composition in a northern temperate fores. Plant and Soil 2022, 479, 281–299. [Google Scholar] [CrossRef]
- Chari, N.R.; Taylor, B.N. Soil organic matter formation and loss are mediated by root exudates in a temperate fores. Nature Geoscience 2022, 15, 1011–1016. [Google Scholar] [CrossRef]
- Jiang, Z.; Fu, Y.L.; Zhou, L.Y.; He, Y.H.; Zhou, G.Y.; Dietrich, P.; Long, J.L.; Wang, X.X.; Jia, S.X.; Ji, Y.H.; Jia, Z.; Song, B.Q.; Liu, R.Q.; Zhou, X.H. Plant growth strategy determines the magnitude and direction of drought–induced changes in root exudates in subtropical forests. Global Change Biology 2023, 29, 3476–3488. [Google Scholar] [CrossRef]
- Maurer, D.; Malique, F.; Alfarraj, S.; Albasher, G.; Horn, M.A.; Butterbach–Bahl, K.; Dannenmann, M.; Rennenberg, H. Interactive regulation of root exudation and rhizosphere denitrification by plant metabolite content and soil properties. Plant and Soil 2021, 467, 107–127. [Google Scholar] [CrossRef]
- Zhu, Q.; Riley, W.J.; Tang, J.; Koven, C.D. Multiple soil nutrient competition between plants, microbes, and mineral surfaces: model development, parameterization, and example applications in several tropical forests. Biogeosciences 2016, 13, 341–363. [Google Scholar] [CrossRef]
- Hodge, A.; Fitter, A.H. Substantial nitrogen acquisition by arbuscular mycorrhizal fungi from organic material has implications for N cycling. Proceedings of the National Academy of Sciences of the United States of America 2010, 107, 13754–13759. [Google Scholar] [CrossRef]
- Phillips, R.P.; Finzi, A.C.; Bernhardt, E.S. Enhanced root exudation induces microbial feedbacks to N cycling in a pine forest under long–term CO2 fumigation. Ecological Letters 2011, 14, 187–194. [Google Scholar] [CrossRef]
- Berendsen, R.L.; Pieterse, C.M.J.; Bakker, P.A.H.M. The rhizoshpere microbiome and plant health. Trends in Plant Science 2012, 17, 478–486. [Google Scholar] [CrossRef] [PubMed]
- LeBauer, D.S.; Treseder, K.K. Nitrogen limitation of net primary productivity in terrestrial ecosystems is globally distributed. Ecology 2008, 89, 371–379. [Google Scholar] [CrossRef] [PubMed]
- Kotowska, M.M.; Leuschner, C.; Triadiati, T.; Hertel, D. Conversion of tropical lowland forest reduces nutrient return through litterfall, and alters nutrient use efficiency and seasonality of net primary production. Oecologia 2016, 180, 601–618. [Google Scholar] [CrossRef]
- Baribault, T.W.; Kobe, R.K.; Rothstein, D.E. Soil calcium, nitrogen, and water are correlated with aboveground net primary production in northern hardwood forests. Forest Ecology and Management 2010, 260, 723–733. [Google Scholar] [CrossRef]
- Turner, B.L.; Wright, S.J. The response of microbial biomass and hydrolytic enzymes to a decade of nitrogen, phosphorus, and potassium addition in a lowland tropical rain forest. Biogeochemistry 2014, 117, 115–130. [Google Scholar] [CrossRef]
- Wang, J.Q.; Shi, X.Z.; Lucas–Borja, M.E.; Lam, S.K.; Wang, Z.Y.; Huang, Z.Q. Plants, soil properties and microbes directly and positively drive ecosystem multifuntionality in a plantation chronosequence. Land Degradation and Development 2022, 33, 3049–3057. [Google Scholar] [CrossRef]
- Hu, X.; Shu, Q.; Guo, W.; Shang, Z.A.; Qi, L.H. Secondary succession altered the diversity and co–occurrence networks of the soil bacterial communities in tropical lowland rainforest. Plants 2022, 11, 1344. [Google Scholar] [CrossRef] [PubMed]
- Chen, H.; Ju, P.J.; Zhu, Q.; Xu, X.L.; Wu, N.; Gao, Y.H.; Feng, X.J.; Tian, J.Q.; Niu, S.L.; Zhang, Y.J.; Peng, C.H.; Wang, Y.F. Carbon and nitrogen cycling on the Qinghai–Tibetan plateau. Nature Reviews Earth & Environment 2022, 3, 701–716. [Google Scholar]
- Xia, L.L.; Lam, S.K.; Kiese, R.; Chen, D.L.; Luo, Y.Q.; Van Groenigen, K.J.; Ainsworth, E.A.; Chen, J.; Liu, S.W.; Ma, L.; et al. Elevated CO2 negates O3 impacts on terrestrial carbon and nitrogen cycles. One Earth 2021, 4, 1752–1763. [Google Scholar] [CrossRef]
- Meena, M.; Yadav, G.; Sonigra, P.; Nagda, A.; Mehta, T.; Swapnil, P.; Marwal, H.A.; Kumar, S. Multifarious responses of forest soil microbial community toward climate change. Soil Microbiology 2023, 86, 49–74. [Google Scholar] [CrossRef]
- Baldrian, P.; López−Mondéjar, R.; Kohout, P. Forest microbiome and global change. Nature Reviews Microbiology 2023, 21, 487–501. [Google Scholar] [CrossRef] [PubMed]
- Peguero, G.; Folch, E.; Liu, L.; Ogaya, R.; Peñuelas, J. Divergent effects of drought and nitrogen deposition on microbial and arthropod soil communities in a Mediterranean forest. European Journal of Soil Biology 2021, 103, 103275. [Google Scholar] [CrossRef]
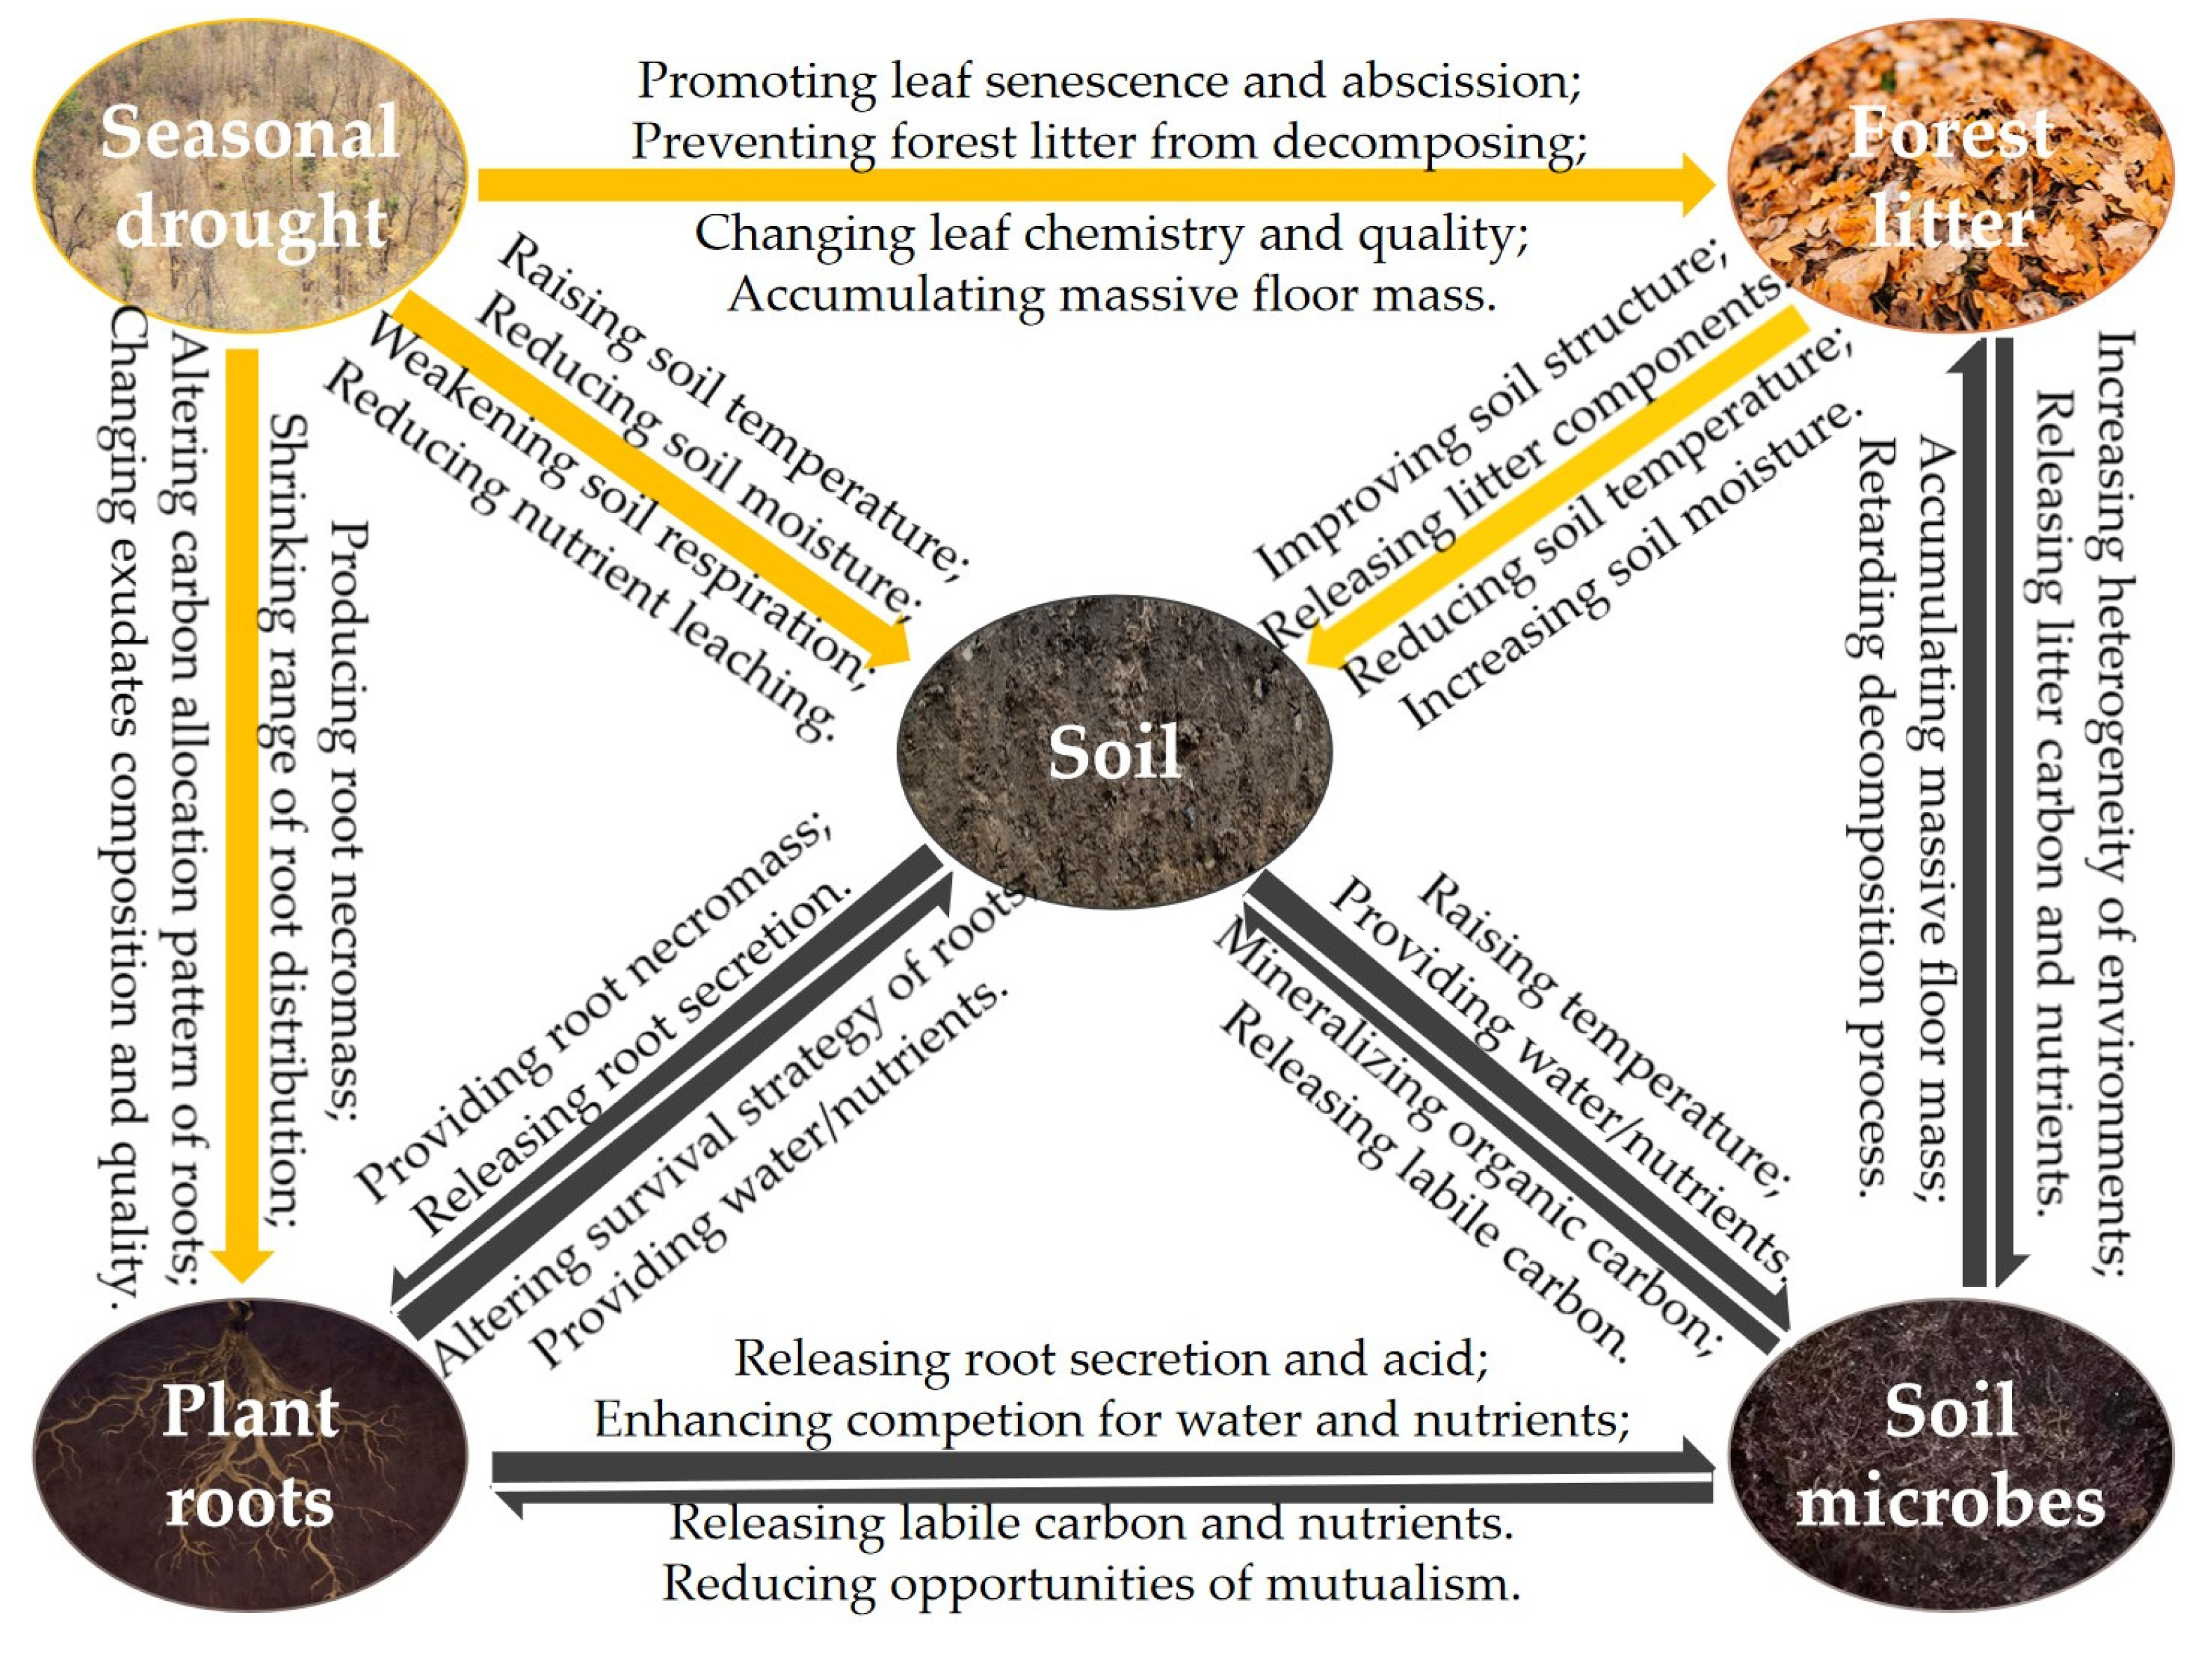
Figure 1.
The conceptual diagram of the relationships among seasonal drought, forest litter, soil, plant roots, and soil microbes in forest ecosystems [
10,
11,
32,
33,
37,
38]. Note: the yellow arrow signifies a unidirectional influence, denoting a single flow of action, whereas the black arrow indicates a bidirectional exchange, depicting a reciprocal and interactive process.
Figure 2.
The monthly dynamics of soil moisture in four experimental subplots of the two field plots (control vs. watered): (a) R+F+ subplot, (b) R+F– subplot, (c) R–F+ subplot, and (d) R–F– subplot. Note: the bar represents ±SE.
Figure 2.
The monthly dynamics of soil moisture in four experimental subplots of the two field plots (control vs. watered): (a) R+F+ subplot, (b) R+F– subplot, (c) R–F+ subplot, and (d) R–F– subplot. Note: the bar represents ±SE.
Figure 3.
The monthly dynamics of floor mass in two experimental subplots of the two field plots (control vs. watered): (a) R+F+ subplot, and (b) R–F+ subplot. Note: the bar represents ±SE.
Figure 3.
The monthly dynamics of floor mass in two experimental subplots of the two field plots (control vs. watered): (a) R+F+ subplot, and (b) R–F+ subplot. Note: the bar represents ±SE.
Figure 4.
The monthly dynamics of plant roots in two experimental subplots of the two field plots (control vs. watered): (a) R+F+ subplot, and (b) R+F– subplot. Note: the bar represents ±SE.
Figure 4.
The monthly dynamics of plant roots in two experimental subplots of the two field plots (control vs. watered): (a) R+F+ subplot, and (b) R+F– subplot. Note: the bar represents ±SE.
Figure 5.
The monthly dynamics of soil MBC in four experimental subplots of the two field plots (control vs. watered): (a) R+F+ subplot, (b) R+F– subplot, (c) R–F+ subplot, and (d) R–F– subplot. Note: the bar represents ±SE.
Figure 5.
The monthly dynamics of soil MBC in four experimental subplots of the two field plots (control vs. watered): (a) R+F+ subplot, (b) R+F– subplot, (c) R–F+ subplot, and (d) R–F– subplot. Note: the bar represents ±SE.
Figure 6.
The monthly dynamics of soil MBN in four experimental subplots of the two field plots (control vs. watered): (a) R+F+ subplot, (b) R+F– subplot, (c) R–F+ subplot, and (d) R–F– subplot. Note: the bar represents ±SE.
Figure 6.
The monthly dynamics of soil MBN in four experimental subplots of the two field plots (control vs. watered): (a) R+F+ subplot, (b) R+F– subplot, (c) R–F+ subplot, and (d) R–F– subplot. Note: the bar represents ±SE.
Figure 7.
The linear relationships of soil moisture with soil MBC and MBN in four experimental subplots of the two field plots (control vs. watered): soil MBC (a) and soil MBN (b) in the R+F+ subplot; soil MBC (c) and soil MBN (d) in the R+F– subplot; soil MBC (e) and soil MBN (f) in the R–F+ subplot; and soil MBC (g) and soil MBN (h) in the R–F– subplot.
Figure 8.
The linear relationships of floor mass with soil MBC and MBN in two experimental subplots of the two field plots (control vs. watered): soil MBC (a) and soil MBN (b) in the R+F+ subplot; and soil MBC (c) and soil MBN (d) in the R–F+ subplot.
Figure 8.
The linear relationships of floor mass with soil MBC and MBN in two experimental subplots of the two field plots (control vs. watered): soil MBC (a) and soil MBN (b) in the R+F+ subplot; and soil MBC (c) and soil MBN (d) in the R–F+ subplot.
Figure 9.
The linear relationships of plant roots with soil MBC and MBN in two experimental subplots of the two field plots (control vs. watered): soil MBC (a) and soil MBN (b) in the R+F+ subplot; and soil MBC (c) and soil MBN (d) in the R+F– subplot.
Figure 9.
The linear relationships of plant roots with soil MBC and MBN in two experimental subplots of the two field plots (control vs. watered): soil MBC (a) and soil MBN (b) in the R+F+ subplot; and soil MBC (c) and soil MBN (d) in the R+F– subplot.
Figure 10.
Soil MBC and MBN respectively in correspondence to soil moisture and floor mass (a, b), soil moisture and plant roots (c, d), and floor mass and plant roots (e, f) in the R+F+ subplot of the control plot.
Figure 10.
Soil MBC and MBN respectively in correspondence to soil moisture and floor mass (a, b), soil moisture and plant roots (c, d), and floor mass and plant roots (e, f) in the R+F+ subplot of the control plot.
Table 1.
Results of the mixed linear model in R (V 3.0.1) that tested how the four experimental treatments (i.e., R+F+, R–F+, R+F–, and R–F–) and sampling time (i.e., month) in control and watered plots affect soil MBC and MBN.
Table 1.
Results of the mixed linear model in R (V 3.0.1) that tested how the four experimental treatments (i.e., R+F+, R–F+, R+F–, and R–F–) and sampling time (i.e., month) in control and watered plots affect soil MBC and MBN.
| Treatment |
Soil MBC |
Soil MBN |
| Sampling time |
2.79 ** |
0.59 ** |
| Water |
1.95 * |
0.22 * |
| Floor mass |
−2.61 ** |
−0.58 ** |
| Plant roots |
1.34 * |
0.41 * |
| Sampling time + Water |
1.65 * |
0.32 * |
| Sampling time + Floor mass |
−3.82 ** |
−0.84 ** |
| Sampling time + Plant roots |
1.39 * |
0.34 * |
| Water + Floor mass |
−3.39 ** |
−0.74 ** |
| Water + Plant roots |
2.75 * |
0.58 * |
| Floor mass + Plant roots |
−1.98 |
−0.43 |
| Sampling time + Water + Floor mass |
−3.71 * |
−0.74 * |
| Sampling time + Water + Plant roots |
2.72 ** |
0.52 ** |
| Sampling time + Floor mass + Plant roots |
−3.40 * |
−0.66 * |
| Water + Floor mass + Plant roots |
−1.97 ** |
−0.40 ** |
| Sampling time + Water + Floor mass + Plant roots |
−4.65 *** |
−0.96 *** |
Table 2.
Linear correlations of soil MBC and MBN with soil moisture, floor mass, plant roots, and sampling time in the four subplots (i.e., R+F+, R–F+, R+F–, and R–F–) of control and watered plots.
Table 2.
Linear correlations of soil MBC and MBN with soil moisture, floor mass, plant roots, and sampling time in the four subplots (i.e., R+F+, R–F+, R+F–, and R–F–) of control and watered plots.
| Source |
Control plot |
Watered plot |
| Regression coefficient |
Correlation coefficient |
Regression coefficient |
Correlation coefficient |
|
Soil
microbial biomass carbon
|
| Soil moisture |
4.55 *** |
0.69 *** |
1.08 * |
0.26 * |
| Floor mass |
−1.13 ** |
−0.46 ** |
−1.02 ** |
−0.48 ** |
| Plant roots |
0.03 * |
0.16 * |
0.01 * |
0.22 * |
| Sampling time |
0.08 * |
0.09 * |
0.01 * |
0.02 * |
| Constant |
1.58 * |
|
0.97 * |
|
|
Soil
microbial biomass nitrogen
|
| Soil moisture |
0.67 *** |
0.71 *** |
0.58 * |
0.31 * |
| Floor mass |
−0.07 ** |
−0.47 ** |
−0.15 *** |
−0.61 *** |
| Plant roots |
0.21 *** |
0.17 *** |
0.16 * |
0.91 *** |
| Sampling time |
0.01 * |
0.09 * |
0.03 * |
0.09 * |
| Constant |
0.29 * |
|
0.18 * |
|
|
Disclaimer/Publisher’s Note: The statements, opinions and data contained in all publications are solely those of the individual author(s) and contributor(s) and not of MDPI and/or the editor(s). MDPI and/or the editor(s) disclaim responsibility for any injury to people or property resulting from any ideas, methods, instructions or products referred to in the content. |
© 2024 by the authors. Licensee MDPI, Basel, Switzerland. This article is an open access article distributed under the terms and conditions of the Creative Commons Attribution (CC BY) license (http://creativecommons.org/licenses/by/4.0/).
