1. Introduction
Internet and its applications are constantly developing and are an essential element of every person’s daily. Due to the overwhelming need, research expanded beyond just connecting computers to the Internet. Indeed the Internet of Things (IoT) allows Machine-to-Machine (M2M) interactions to coexist with Human-to-Human (H2H) interactions over the same network communication. IoT is a disruptive technology that has the potential to alter both the physical and digital aspects of our lives. This technology describes a specific kind of network that links M2M objects and gadgets to the Internet in order to facilitate information sharing and smart recognition [
1]. The total number of IoT connections grow from 6 billion in 2015 to 27 billion in 2025 [
2]. GSMA Intelligence forecasts IoT connections to reach more than 38 billion by 2030, with the enterprise segment accounting for more than 60% of the total [
3]. After a slowdown in enterprise progress caused by the pandemic and chip shortages, growth is returning to previous levels. In 2030, smart buildings and smart home will be the largest verticals for IoT connections, while smart manufacturing is forecast to grow at a Compound Annual Growth Rate (CAGR) of 20% between 2023 and 2030 [
3].
Long Term Evolution for Machines (LTE-M) is a type of cellular network specifically designed for IoT and M2M devices with a limited bandwidth of 1.4 MHz. M2M devices transmit compact data packets at varying intervals.
However, these devices differ from traditional Human-to-Human (H2H) communications in terms of their distinctiveness and functionality. M2M devices transmit their data payloads in synchronized bursts, creating a phenomenon like coordinated storms [
4].
The synchronization behavior described above has led to various issues, particularly in light of the increasing prevalence of M2M devices. These issues encompass network saturation, access baring, resource depletion, and inefficient utilization of the bandwidth. Consequently, these challenges have prompted extensive research efforts within the academic community to develop potential solutions. In addition to natural and human-induced catastrophes such as tsunamis, acts of terrorism, and wars, there is a significant challenge posed by the simultaneous transmission of alerts from various devices. This situation has a detrimental impact on both H2H and M2M communication traffic. Distributed Denial of Service (DDoS) attacks have been one of the most security gaps that threatens services, applications and information access. According to Forbes, there are about 1.09 billion websites on the internet in 2024 [
6]. Additionally, a diverse range of online applications have been integrated with various web services, encompassing domains such as e-commerce, online banking, online shopping, online education, e-healthcare, and Industrial Control Systems (ICS) for critical infrastructure, among others [
7]. Botnets are a set of devices infected by malicious codes with the aim of overwhelming a certain website or service. Botnets refer to overlay networks that consist of compromised mobile devices owned by users. Botnets of this nature are managed by individuals known as Botmasters, who are cybercriminals responsible for the creation and dissemination of these Botnets. Email attachments are a prevalent method of infecting devices. These attachments are commonly associated with Trojan viruses. Once the machine is infected by the malware, it establishes a connection with a designated central server referred to as Command Control (CC), or alternatively, with a peer-to-peer network that constitutes the botnet [
7]. Given the limited processing and memory resources for IoT devices, it becomes impossible for users to install anti-virus software on it. In addition, the large number of IoT devices makes it a desirable target for attackers to enslave IoT devices in their Botnet malicious networks [
8].
If we know that DDoS attacks can target any type of network or device that is connected to the Internet, including LTE-M networks, many research questions might arise regarding the impact of DDOS attacks over LTE-M networks:
How may we detect and predict the occurrence of DDoS attacks?
How we can analyze the behavior of the network during a DDoS attack?
What are the impacts of a DDoS attack over the M2M traffic?
2. Literature Review
Before delving into the core of the paper, let us review the proposed strategies and approaches regarding DDoS attacks in terms of prediction, detections or mitigation.
To anticipate DDoS attacks, the authors of [
9] utilized two machine learning models: Support Vector Machine (SVM) and Random Forest (RF). Principal Component Analysis (PCA) and Recursive Feature Elimination (RFE), two techniques for reducing the number of dimensions, are tested during the preparation of the data. Performance of models is assessed using the mean cross-validation accuracy. In the same study, they discovered that the performance of SVM is more accurate and stable than that of Logistic Regression (LR). As a result and contrary to SVM, LR fails to predict the PortMap assaults [
8]. Another study [
10] proposes an approach that focuses on the anticipation of future attacks, with the objective of offering timely alerts to network administrators. This proactive strategy enables administrators to promptly implement containment measures or isolate affected hosts. The approach used by the researchers is founded upon the utilization of a Markov chain model to represent the sequence of Botnet infections. The primary aim of this model is to discern patterns of behavior that are indicative of potential attacks. The findings of the study indicate that this particular method exhibits considerable potential in generating timely alerts for detecting attacks. The accuracy rate for predicting attacks was found to be over 98%, while the maximum rate of false alarms was observed to be under 2%. In [
11], the authors presented an innovative architectural framework that combines DDoS attack prediction with botnet identification. The architectural design was based on the principle that the sooner a system detects signs of an oncoming DDoS attack and identifies the related bots, the more efficiently it can respond to neutralize the attack. The prediction process entails recognizing early signs of a network assault before it escalates to more advanced phases. The performance evaluations employed the CTU-13
1 and CAIDA
2 (Center for Applied Internet Data Analysis). The evaluations effectively detected the existence of bots in the dataset, attaining an accuracy rate of 99.9%. The authors of [
12] developed a framework for classifying and predicting DDoS attacks using machine learning techniques. The framework involves selecting a dataset, choosing appropriate tools, pre-processing data, extracting features, encoding data, and dividing data into training and testing sets. The model undergoes optimization, including kernel scaling and hyper-parameter tuning, resulting in an average accuracy of 90%. Comparatively, the model’s precision of defect identification improved to 85% and 79%, respectively. The authors in [
13] introduced ShieldRNN, a novel methodology for training and prediction in Recurrent Neural Networks/Long Short-Term Memory models, to protect IoT devices from attacks. Their solution consists of an IoT node detector and a server detector. The researchers evaluated ShieldRNN on the CIC-IDS2017
3 dataset and established benchmark outcomes for identifying DDoS attacks on the CIC-IoT2022 dataset
4. The authors in [
14] propose a cost-effective method for real-time detection of M2M traffic using the Markov chain’s recurrence property. They present a DDoS attack targeting Machine Type Communications (MTC) devices, aiming to congest Fourth Generation (4G)/5G networks. The 3rd Generation Partnership Project (3GPP) traffic Markov-based modeling demonstrates the impact of these attacks on mobile network elements, highlighting their detrimental effects on signaling load. The proposed detection framework can detect active intrusions in around 380 seconds with a 91% detection accuracy. In [
15], the authors provide a comprehensive analysis of DDoS attacks and their impact on cyber security. They present a hierarchical framework and analyze studies in academic journals. They discuss strategies to improve intrusion detection systems and emphasize different types of intrusion detection systems. The authors explain the core principles of cyber security, including DDoS attacks, data anomalies, and intrusion detection. They also highlight the introduction of fuzzy logic solutions to address DDoS attacks. The survey’s findings offer benefits for businesses and governments seeking business sustainability. In [
16], the authors proposed a security system consisting of two parts. In the first part, the authors explained how to compromise the network by infecting some IoT devices, and through them, the infection can be spread to the entire network. Second, the authors provided a set of methods that includes filtration, abnormal traffic created by IoT devices identification, screening, and publishing the abnormal traffic patterns to the other home routers on the network. The proposed system blocks the connection received from malicious nodes for a certain period of time without causing any delay for normal traffic.
The authors in [
17] evaluates the effectiveness of DDoS detection through multiple experimental scenarios. It analyzes traffic flow in transmission sessions, including regular and retransmission scenarios. The study’s main contribution is its ability to predict DDoS attacks by analyzing transmission behavior variability. Sensor nodes can transmit signals simultaneously, and the study uses a tablet computer as the primary communication hub. The optimal transmission interval is 23 milliseconds. The study highlights the correlation between transmission session saturation and DDoS attack success.
Based on the previous literature review, and by analyzing a diverse range of sources, this section has highlighted the evolution of concepts, methodologies, and key findings for the use of predictive tools to analyze the behavior of a network especially in IoT domain. However, two questions arise: What are the impacts of a DDoS attack over M2M traffic? Are LTE-M networks resilient towards such type of attacks? To answer these questions, we study, hereinafter, the impact of DDoS attacks over LTE-M networks.
3. DDoS Attack Impact over LTE-M
LTE-M is a standardized technology launched in the 13th release by the 3GPP organization to enhance the performance of Low Power Wide Area Networks (LPWAN). The objective of M2M communication is to achieve cost-effectiveness, energy efficiency, simplicity, and broad geographical reach [
18]. LTE-M networks are limited in terms of bandwidth network to 1.4 Mbps. In September 2016, a spree of massive DDoS attacks temporarily crippled Krebs organization to enhance the performance of LPWAN. The initial attack exceeded 600 Gbps in volume and it was among the largest ones [
19]. Additionally, In April 26, 2017 Persirai Botnet
5 was discovered on 64% of the IP cameras Trend Micro was monitoring, which is more than twice as many as Mirai
6 [
20]. Now, with a LTE-M limited bandwidth along with a huge attack speed, can LTE-M networks scale to afford a huge amount of data generated by DDoS attacks? To answer this question, we study and evaluate the LTE-M data-rate.
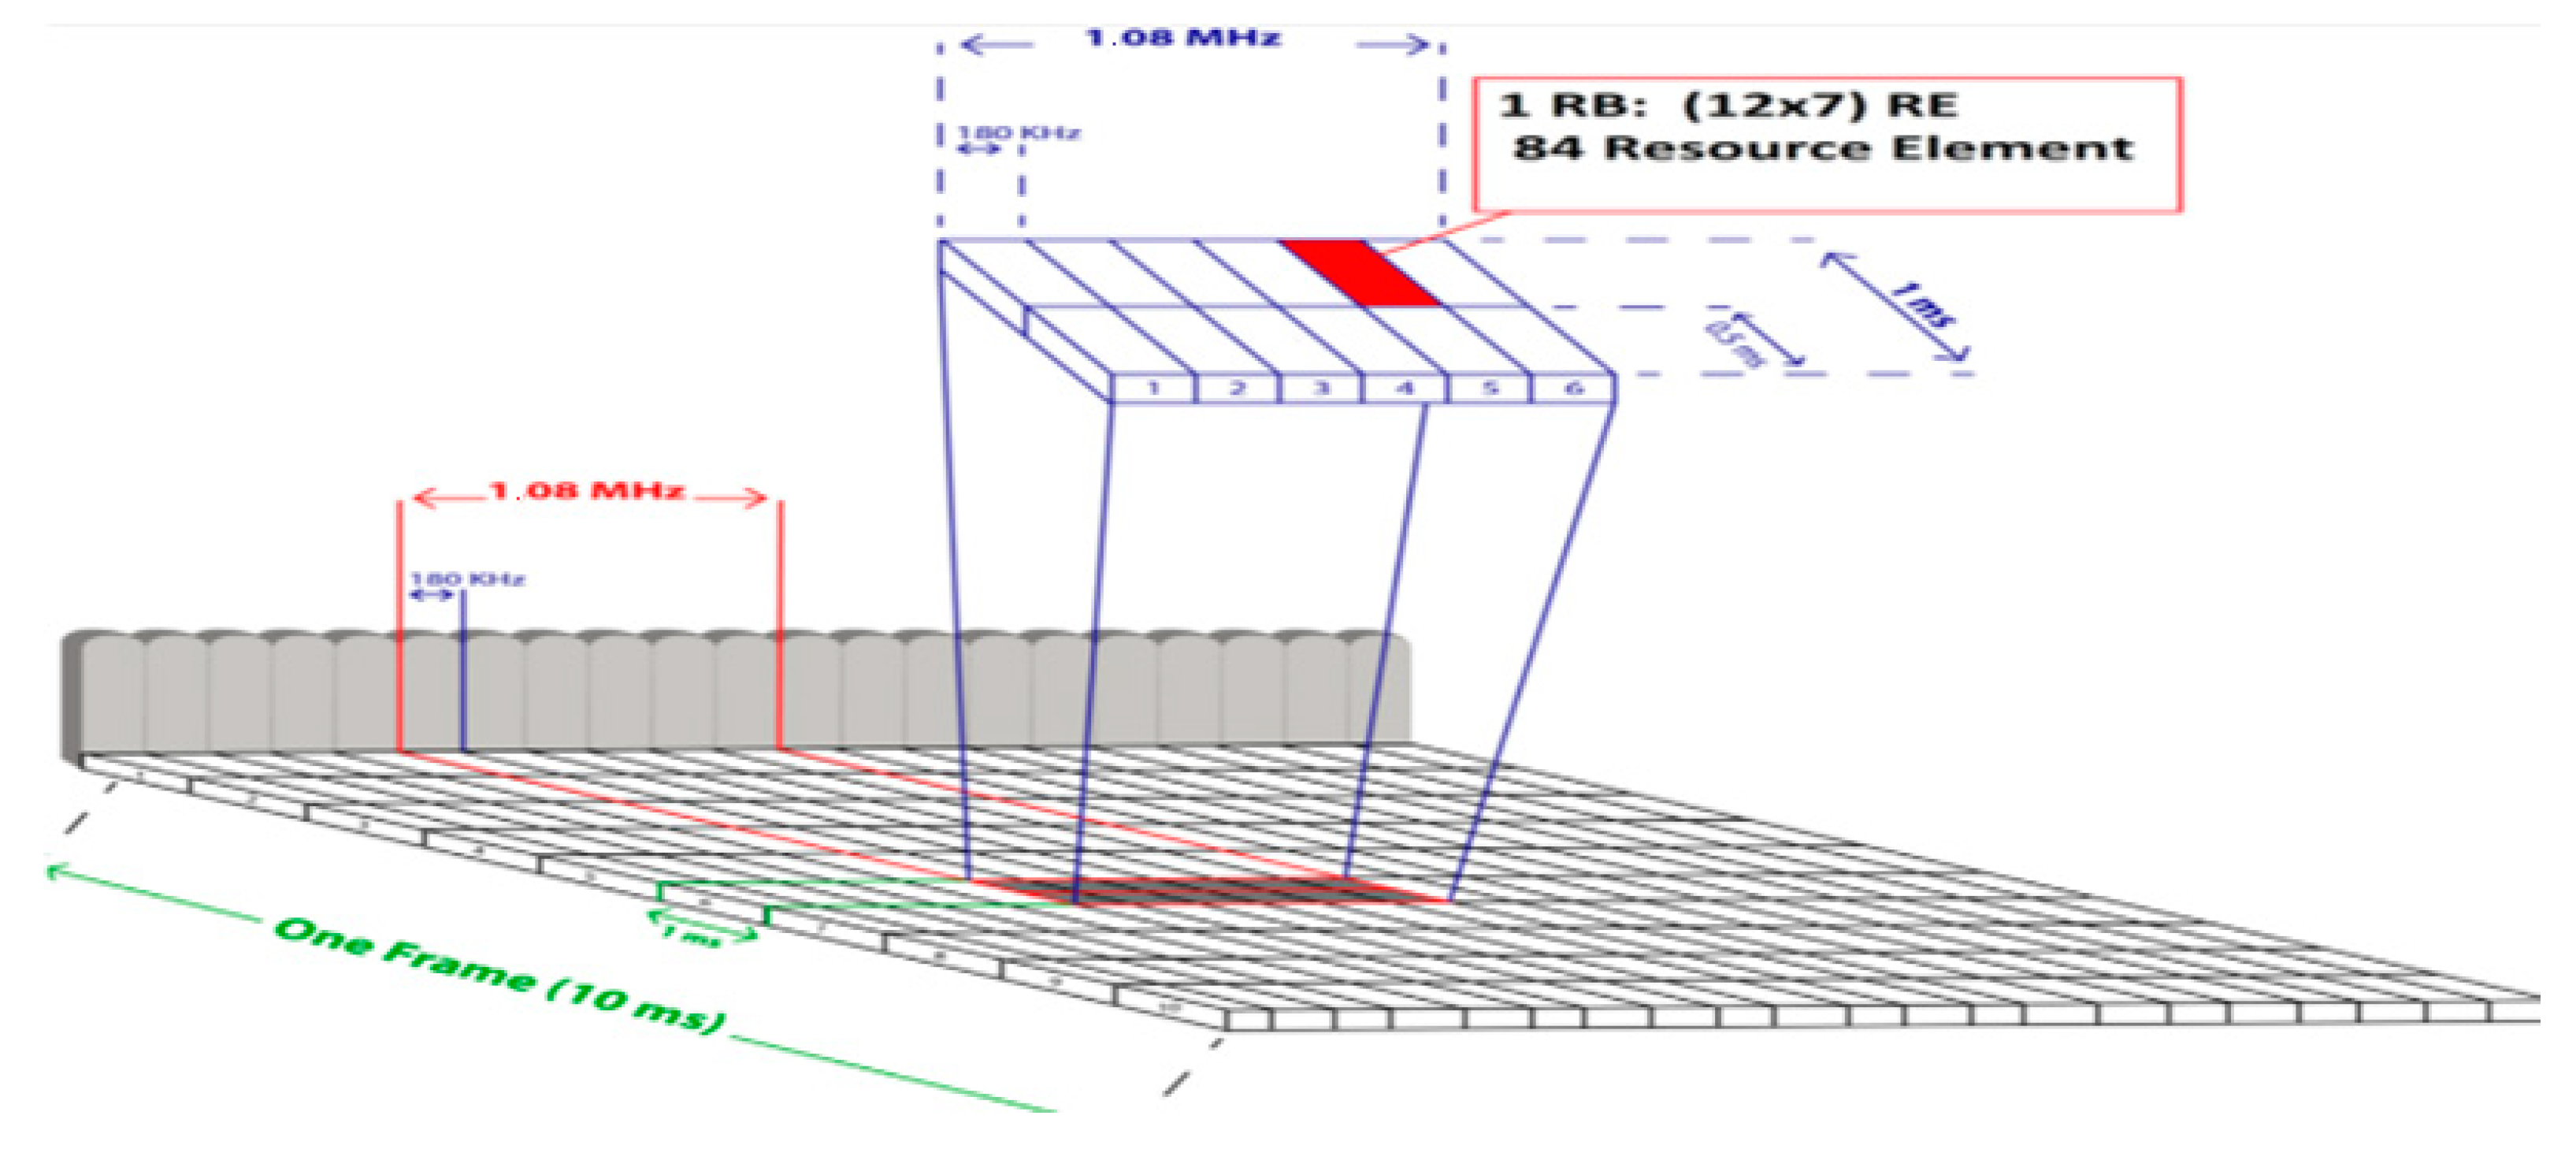
In order to explore the bandwidths and constraints of Long Term Evolution- Advanced (LTE-A is a 4G standard) and LTE-M, we analyze the time-frequency resources and their relationship with data rates for M2M communication. In LTE, time-frequency resources are subdivided, as shown in
Figure 1.
In LTE, the most significant temporal unit is the radio frame with a duration of 10 milliseconds (ms). This radio frame is further divided into ten equal sub-frames. Each sub-frame consists of two slots, and each slot has a duration of 0.5 ms. Each time slot consists of seven Orthogonal Frequency Division Multiple Access (OFDMA) symbols [
4].
A Resource Element (RE) refers to a narrow channel with a spacing of 15 KHz in frequency domain and 0.5/7 ms in the time domain.
A Resource Block (RB) consists of 15 KHz x 12 sub-carriers = 180 KHz in frequency domain and 0.5 ms in the time domain.
A Physical Resource Block (PRB) is the smallest allocation block that could be assigned to a single User Equipment (UE) for scheduling purposes. It consists of 15 KHz x 12 sub-carriers = 180 KHz in frequency domain and 0.5 ms x 2 = 1 ms in the time domain.
By employing a basic mathematical computation:
Since there are separate channels designated for upload and download in the LTE-M network due to its half-duplex nature, the bandwidth is determined to be 1 Mbps for upload stream and 1 Mbps for download stream.
Finally, to recall, LTE-M use a limited bandwidth (1.4 MHz) with a low data rate of 1 Mbps, and it is expected that DDoS attacks will flood the network with huge data (for example Krebs attack speed is about 600 Gbps). So, it is expected that LTE-M networks will be overloaded in a split second when facing a DDoS attack.
4. Markov Detection and Prediction (MDP) Model
In the rapidly evolving landscape of technology, IoT has emerged as a pivotal factor, revolutionizing the way we gather, transmit, and process data. IoT devices have become ubiquitous, seamlessly integrating into our lives and environments, allowing us to remotely monitor and control various systems. One of the fundamental aspects of IoT is the transmission of data, which is achieved through a diverse array of communication methods, including communication towers.
Markov Chain is a probabilistic model that characterizes a series of potential occurrences, where the likelihood of each event is solely determined by the state achieved in the preceding event. One approach to represent a system is modelling the system, wherein the system is characterized by its states and transitions. These transitions are determined by the probabilities associated with transitioning between two states.
4.1. Authentic, Suspicious and Malicious Requests
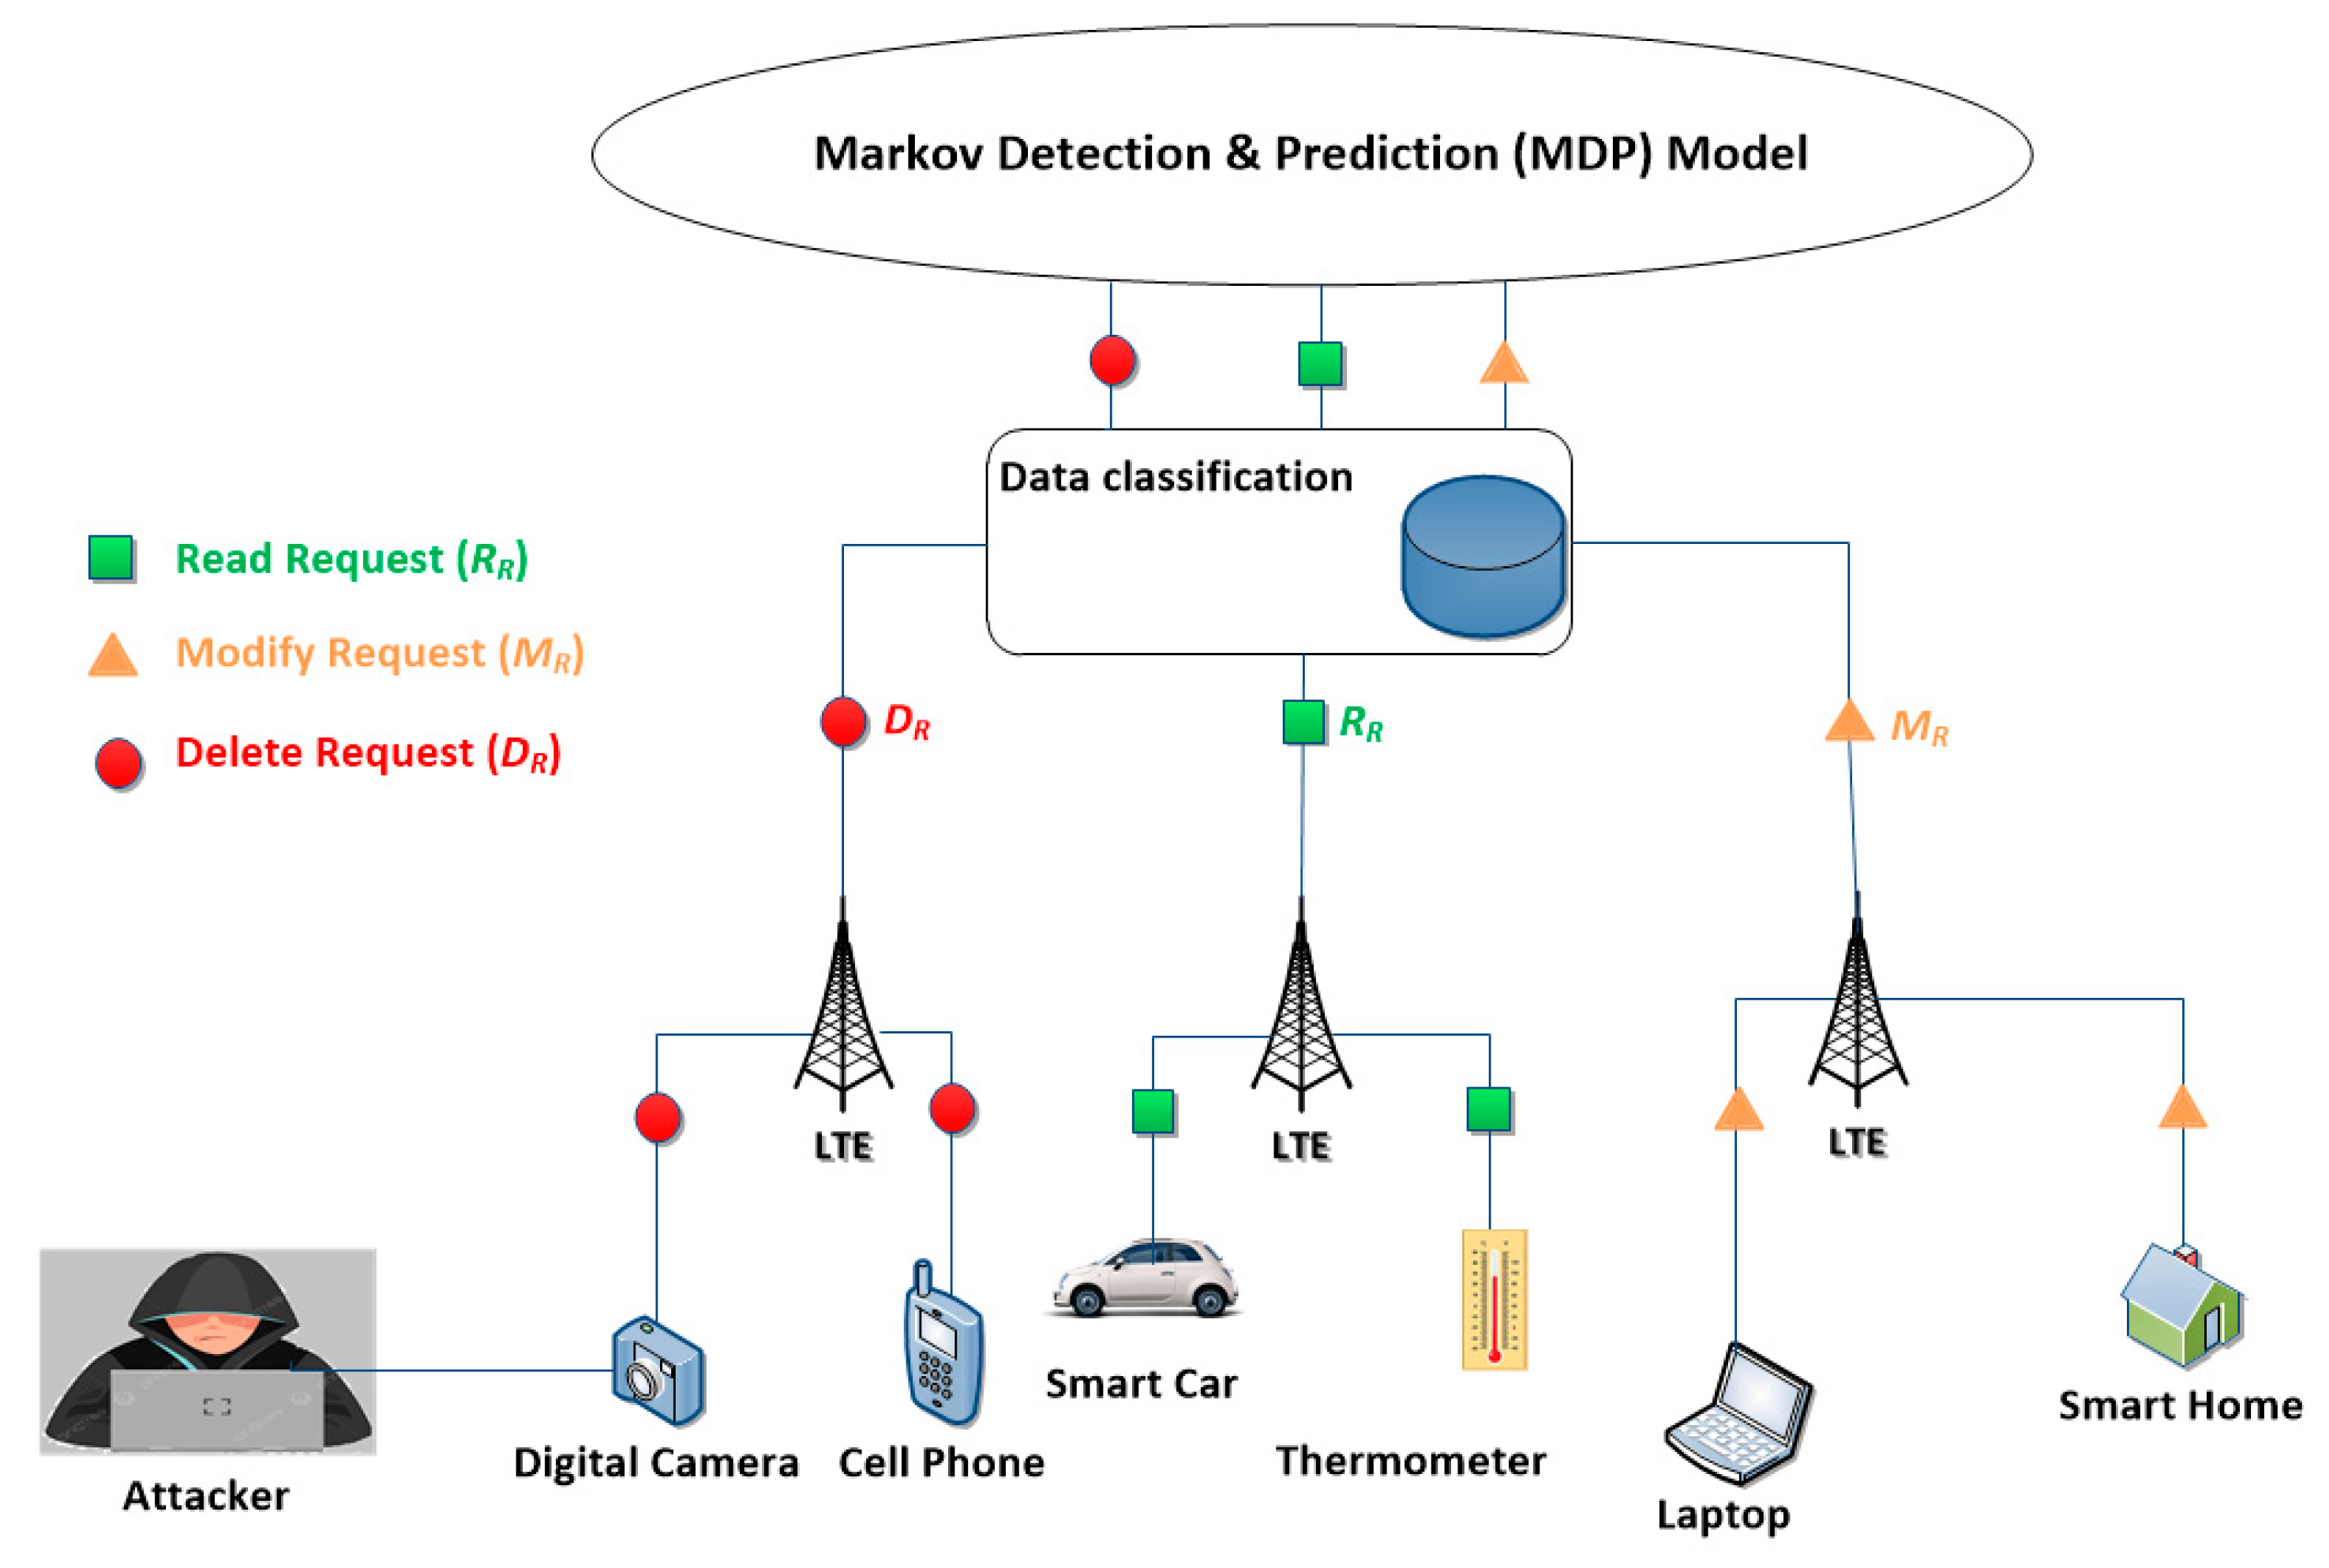
With a huge data generated by IoT devices, effective classification is essential to extract meaningful insights and facilitate predictive analysis. To streamline this process, a classification framework is proposed, categorizing IoT generated data into three distinct types of requests:
Authentic requests: refers to accurate, reliable, and trustworthy information that has not been manipulated, fabricated, or altered in any way. This type of data reflects the true state of actions without bias or distortion for example a sensor that sends 8 messages per day.
Suspicious requests refers to the type of information that raises doubts about its accuracy, reliability, or legitimacy due to inconsistencies, anomalies, or unusual patterns. It may indicate potential errors, manipulation, or deceptive practices for example a sensor that exceeds its normal data-rate by sending more than 8 messages per day.
Malicious requests refers to intentionally crafted or manipulated information designed with harmful intent, with the aim to cause damage, compromise security, or deceive individuals or systems (e.g., a hacker trying to delete some data or a sensor that sends massive data while exceeding a certain threshold).
These three types of requests are shown in
Figure 2.
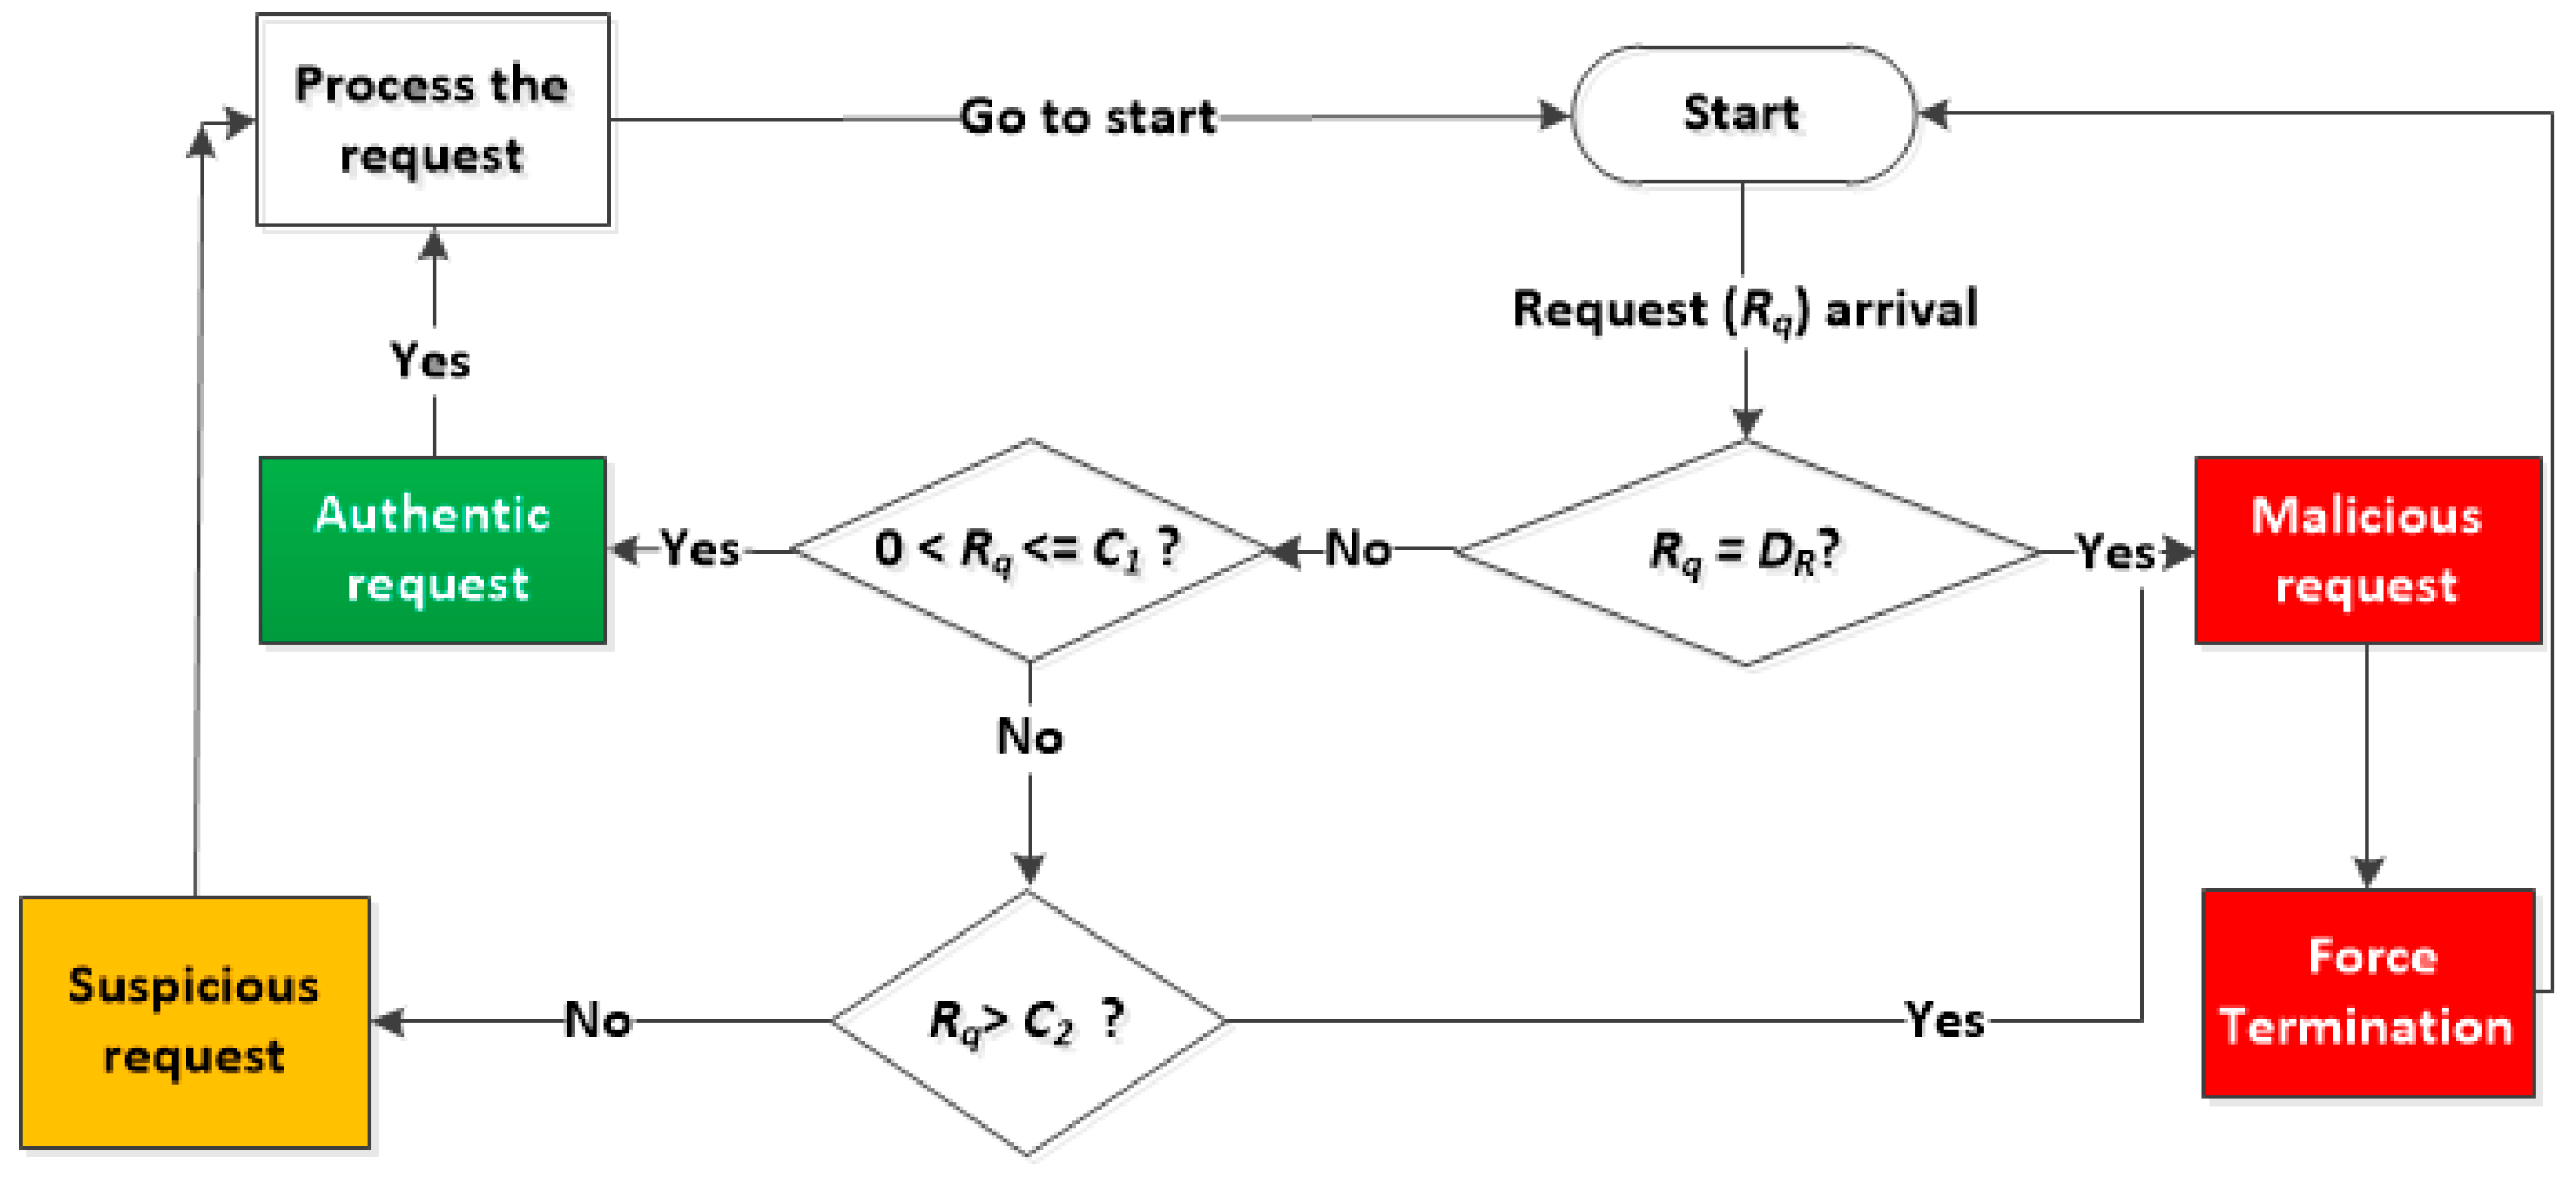
The MDP flowchart depicted in
Figure 3 shows the system behavior when it receives Authentic or Suspicious or Malicious requests.
4.2. MDP Model
The MDP model is designed to proactively identify and mitigate DDoS attacks within LTE-M networks in an IoT environment. In an era where IoT connectivity plays an essential role, MDP model emerges as a vital safeguard, leveraging advanced predictive analytics to detect and preemptively thwart malicious activities. This model promises to enhance the security and reliability of LTE-M networks, ensuring uninterrupted IoT operations and safeguarding critical data and services against the ever-evolving security threat landscape. In this section, we introduce the MDP model, exploring its architecture, functionality, and real-world applications.
The proposed MDP system delves into the intriguing realm of data transmission through IoT devices and communication towers, while proposing a comprehensive classification framework that aids in detecting the DDoS attacks and predicting the system behavior. The MDP system involves three steps:
Defining states using Markov chains.
Generating equilibrium equations.
Solving the linear system.
4.2.1. Defining States Using Markov Chains
As the MDP involves three steps; therefore in the first step, we use the Markov chain to define the sequence of possible events for different requests (Authentic, Suspicious and Malicious requests) by turning any possible incident into different states and probabilities that identify this incident.
The MDP model is designed to support M2M traffic. The MDP model is characterized by the following properties:
Transition Probabilities: For each pair of states, there is a probability of transitioning from one state to another in one time step.
Balance equations, also known as the equilibrium equations or steady-state equations. These equations are based on the principle that the inflow of probabilities into a state is equal to the outflow of probabilities from that state in the steady-state. In other words, the probabilities do not accumulate or deplete over time in equilibrium states.
In a MDP model, any request is classified by its nature and categorized in one of the three types:
Read Request () denoted by the variable ().
Modify Request () denoted by the variable ().
Delete Request () denoted by ().
The two traffic streams and are characterized by two average arrival rates (,) respectively, which are assumed to conform to a Poisson distribution. While, the two service rates (,) are assumed to follow an exponential distribution.
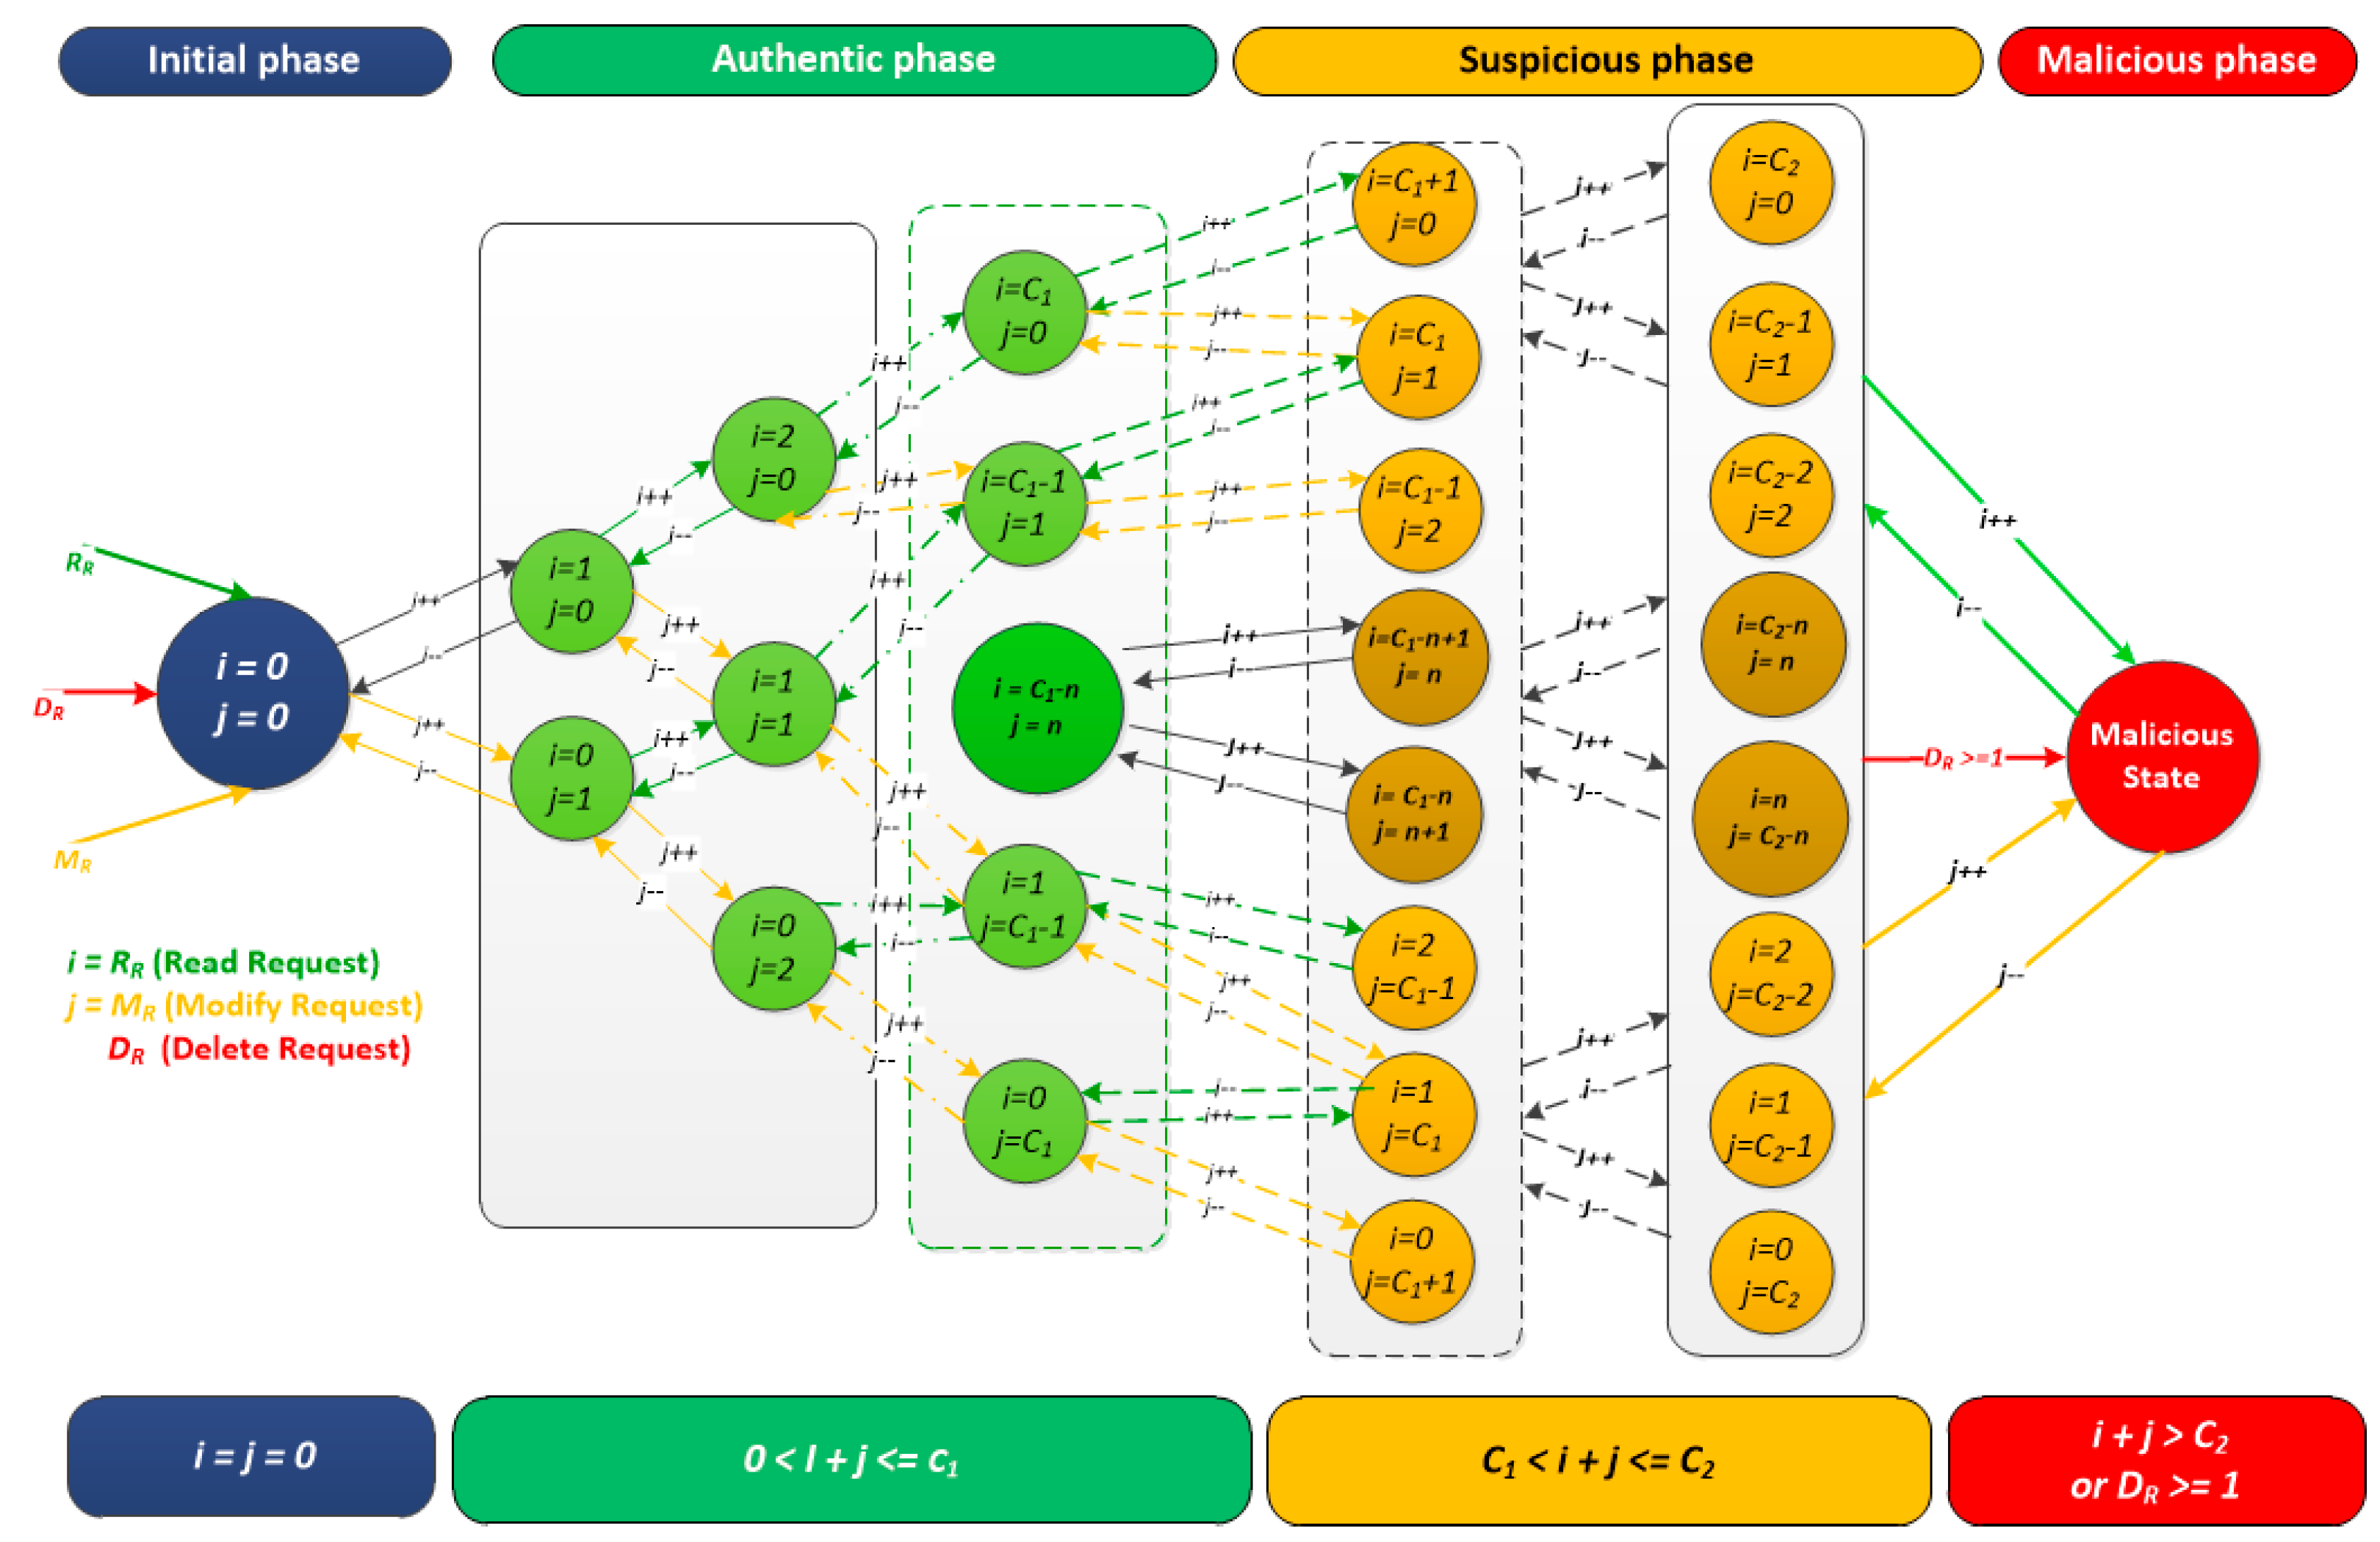
The transition between states in the system is possible upon the occurrence of an event, (increase or decrease of
or
). The Initial phase represent the start of our system (
), while in the Authentic phase represents the normal cycle of our system (
) where c1 is the threshold of Authentic phase. As for the Suspicious phase, it represents doubtful requests where (
) where
is the threshold of Suspicious phase. Finally, in the Malicious phase, there is a clear evidence of harmful intents or actions (e.g., delete requests (
) or a huge and unusual traffic that exceeds the threshold
(
), as shown in
Figure 4.
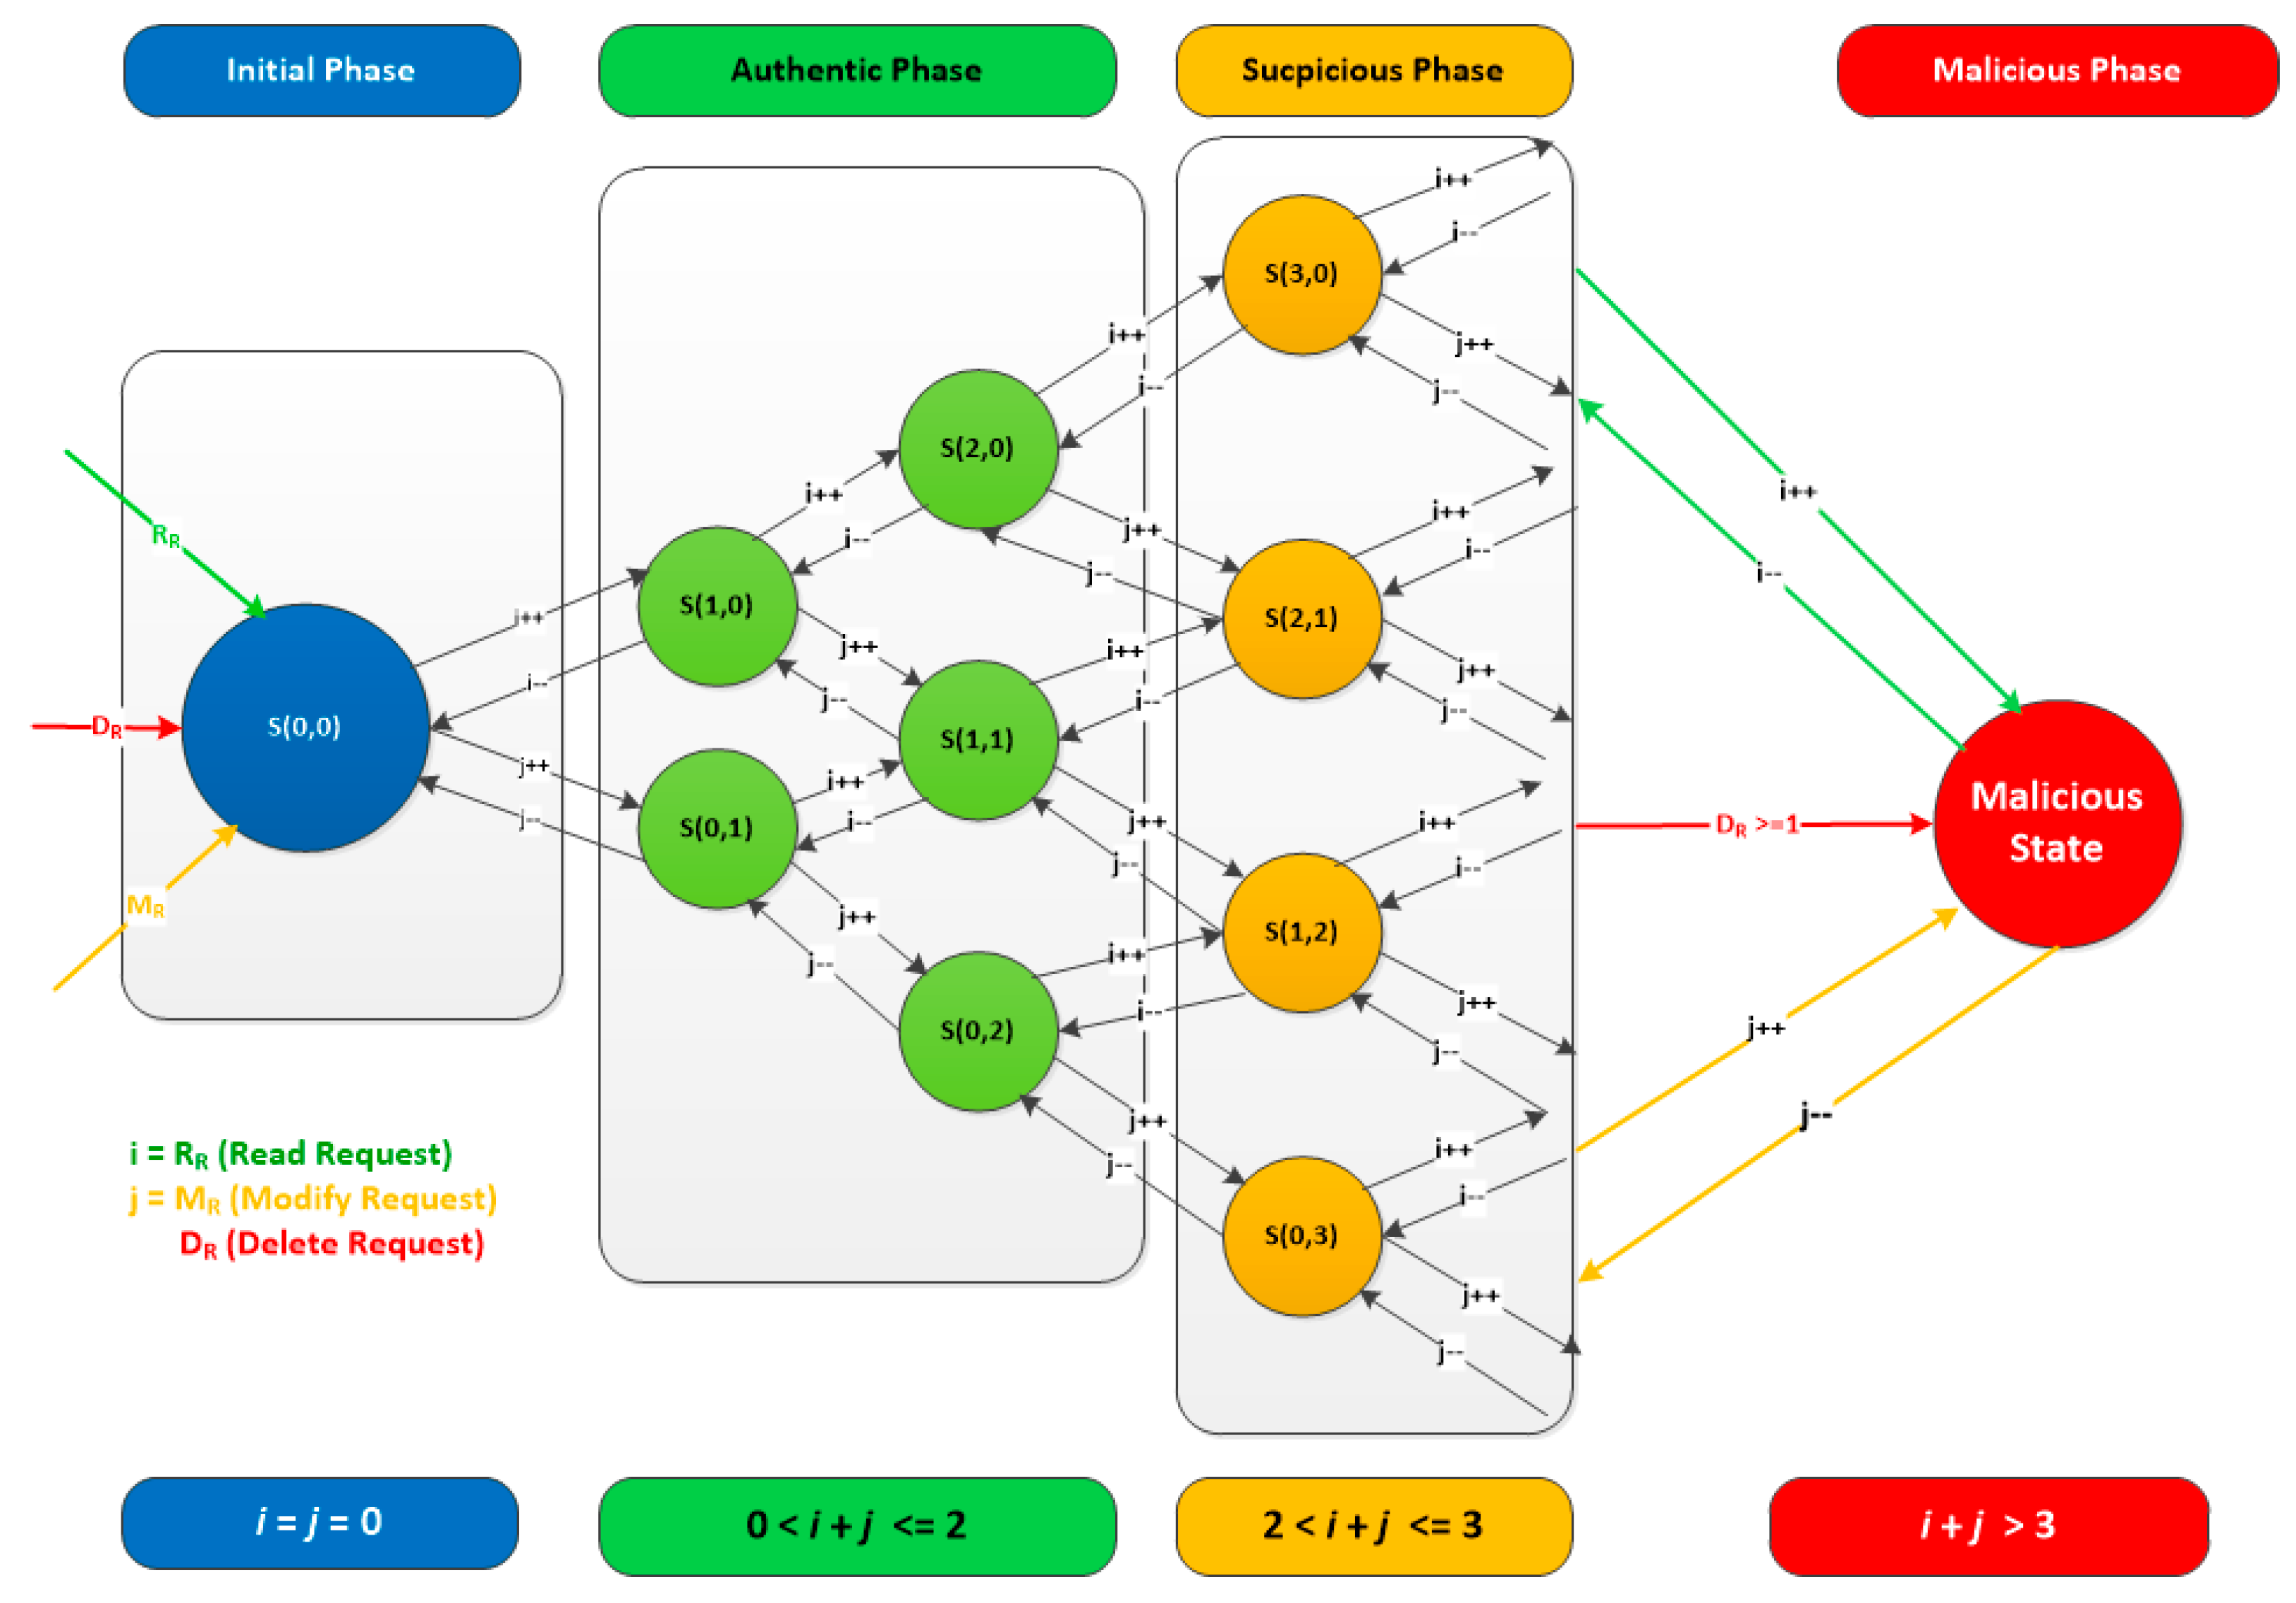
Assuming that
and
,
Figure 5 illustrates the MDP model with four phases: Initial, Authentic, Suspicious, and Malicious phases.
4.2.2. Generating the Equilibrium Equations
Since we have many notations in the following equations, we summarize them in
Table 1:
We will generate the equilibrium equations, by considering new arrival events with an arrival rate “” and a service rate “”.
In this paper, we assume that the time intervals for observation are sufficiently brief so that only one transition (++, --, ++, --) may occur during each period.
Based on this assumption, the system might fall into one of the four following phases:
- 1)
Initial phase, where
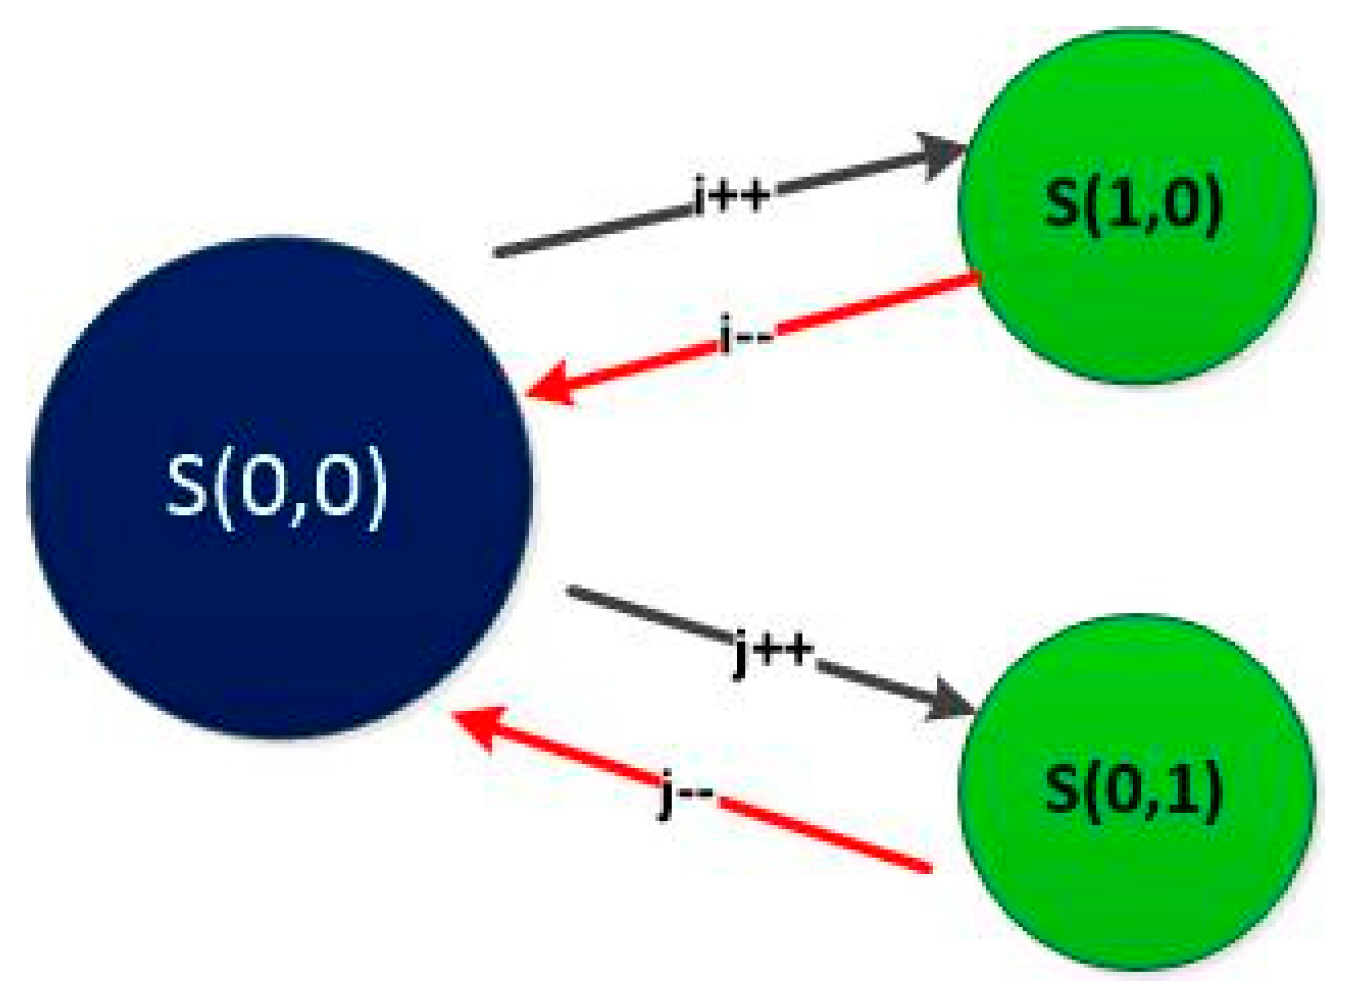
, includes one state S(0,0) as shown in
Figure 6:
S(0,0) can be represented with the following equilibrium equation:
- 2)
Authentic phase: where
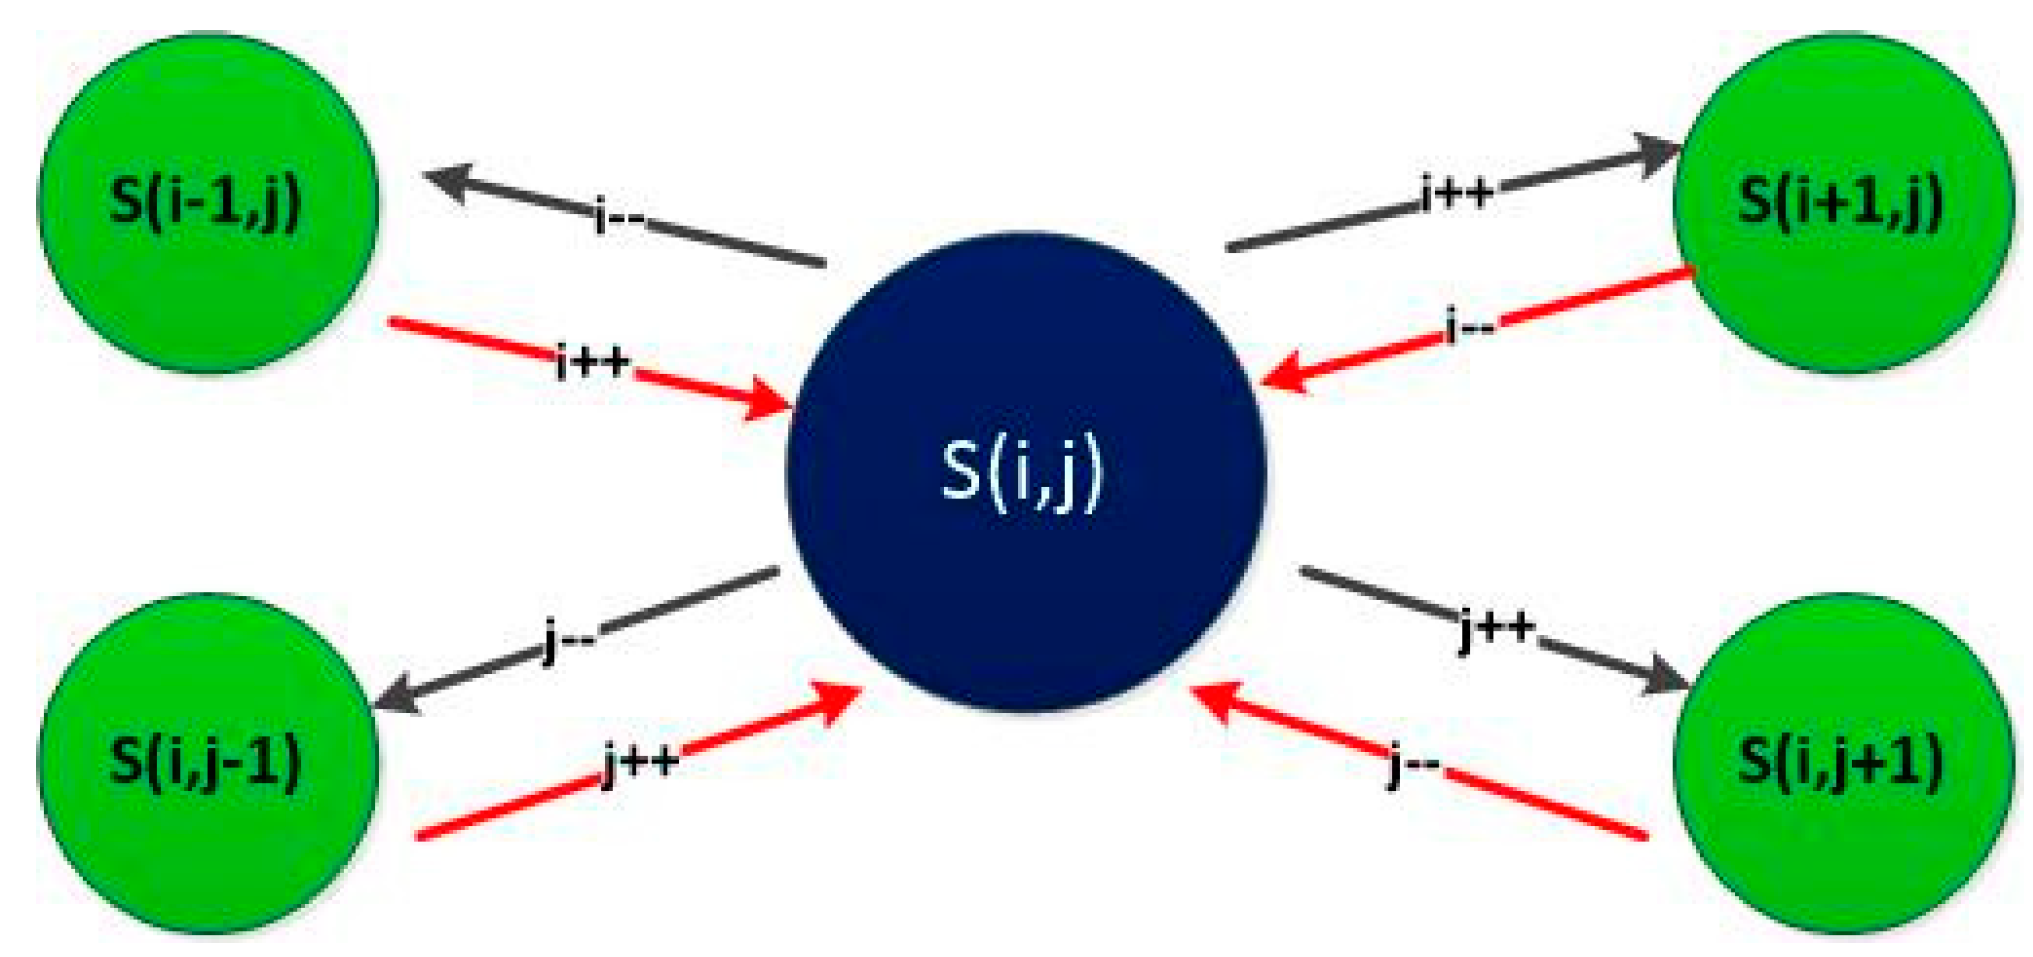
, as show in
Figure 7:
This phase can be represented with the following equilibrium equation:
- 3)
Suspicious phases: where
, as show in
Figure 7.
This phase can be represented with the equilibrium equation (2).
- 4)
Malicious phase: where
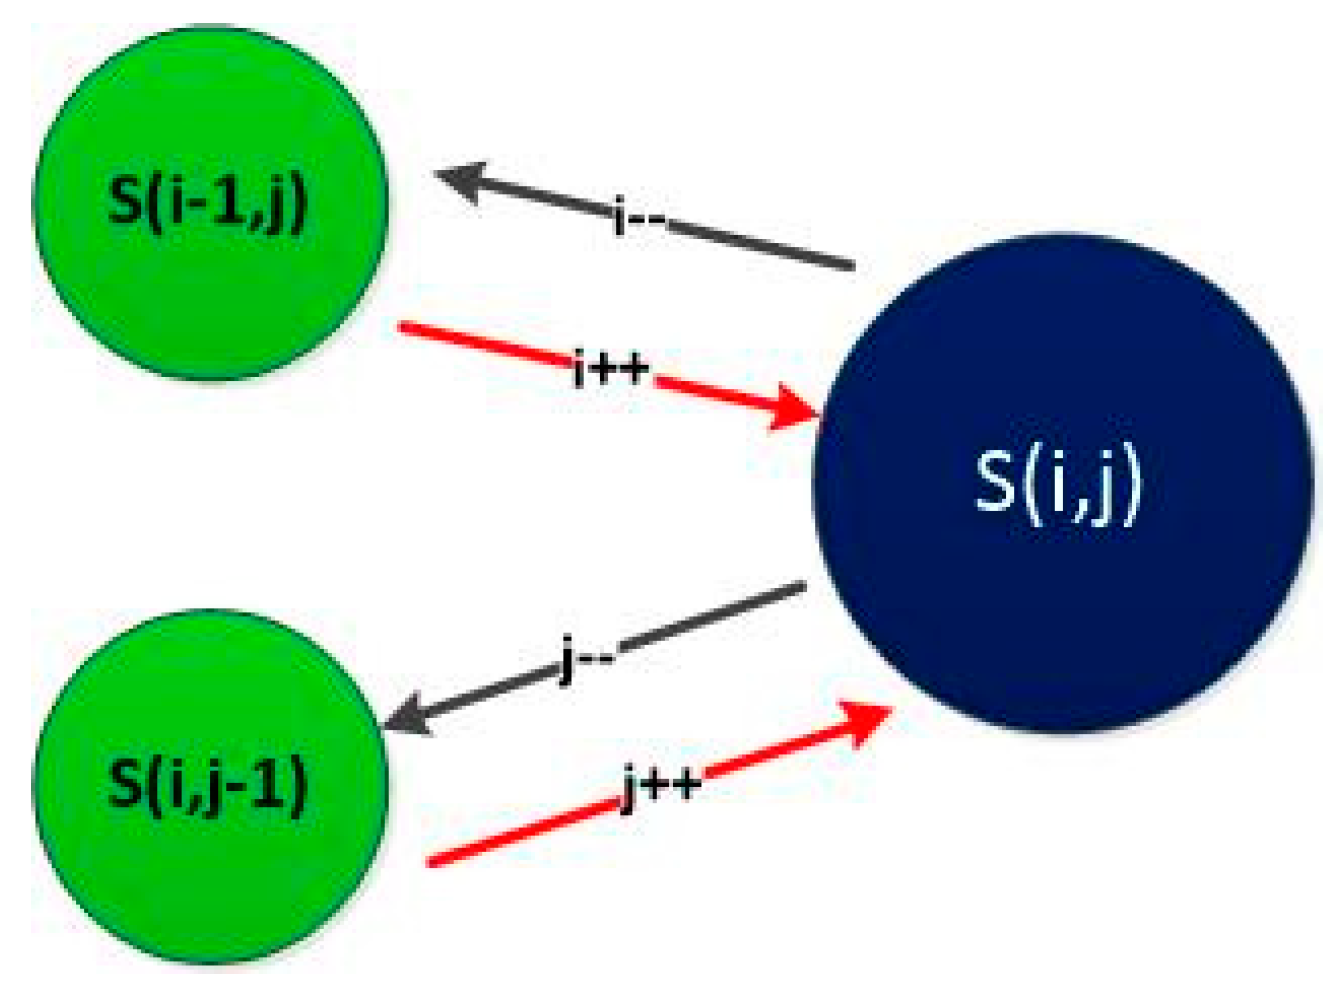
, as show in
Figure 8:
The Malicious phase can be represented with the following equilibrium equation:
Assuming that and , and based on the generic balance equations (1), (2) and (3), we can generate ten balance equations that rules ten states:
- 1-
Balance equation (1) for S(0,0) in the “Initial phase”; where
:
- 2-
Balance equation (2) for S(1,0) in the “Authentic phase”; where
:
- 3-
Balance equation(3) for S(0,1) in the “Authentic phase” ”; where
:
- 4-
Balance equation(4) for S(2,0) in the “Authentic phase”; where
:
- 5-
Balance equation(5) for S(0,2) in the “Authentic phase”; where
:
- 6-
Balance equation(6) for S(1,1) in the “Authentic phase”; where
:
- 7-
Balance equation(7) for S(1,2) in the “Suspicious phase”; where
:
- 8-
Balance equation(8) for S(2,1) in the “Suspicious Phase”; where
:
- 9-
Balance equation(9) for S(0,3) in the “Suspicious Phase”; where
:
- 10-
Balance equation(10) for S(3,0) in the “Suspicious Phase”; where
:
4.2.3. Solving the Linear System
Based on the above equations with the variables , we can build our linear system.
To recall, the system moves from one state to another, when a service is accomplished or a new request arrives (by increasing or decreasing
i or
j) with a steady-state probability
that should respect the following two constraints:
The ten equilibrium equations can be written in a matrix form: A
. Where the square matrix A represents the coefficients of a linear system, and Π represents the steady-state probability vector:
Where A is a (10 × 10) rank-deficient matrix. By replacing the first row of the matrix A by the coefficients of (14), we obtain the following modified system:
Where B becomes a full-rank (10 × 10) matrix
5. Simulations, Results and Result Discussions
In this section, we develop a simulation model that has been constructed using MATrix LABoratory (MATLAB) [30] to solve the linear system. The model is capable of generating several types of traffic, including and , with a high degree of flexibility. The obtained findings from the simulation are thoroughly examined and analyzed.
5.1. Normal-Cycle Scenario:
This scenario represents the normal cycle (no attack is detected) in which the system receives low requests such as in rural areas.
We consider the following parameters:
A LTE system with 3 PRB ().
An average arrival rate of (= 1).
An average arrival rate of (= 1).
A service rate of (μ1 = 3).
A service rate of (μ2 = 3).
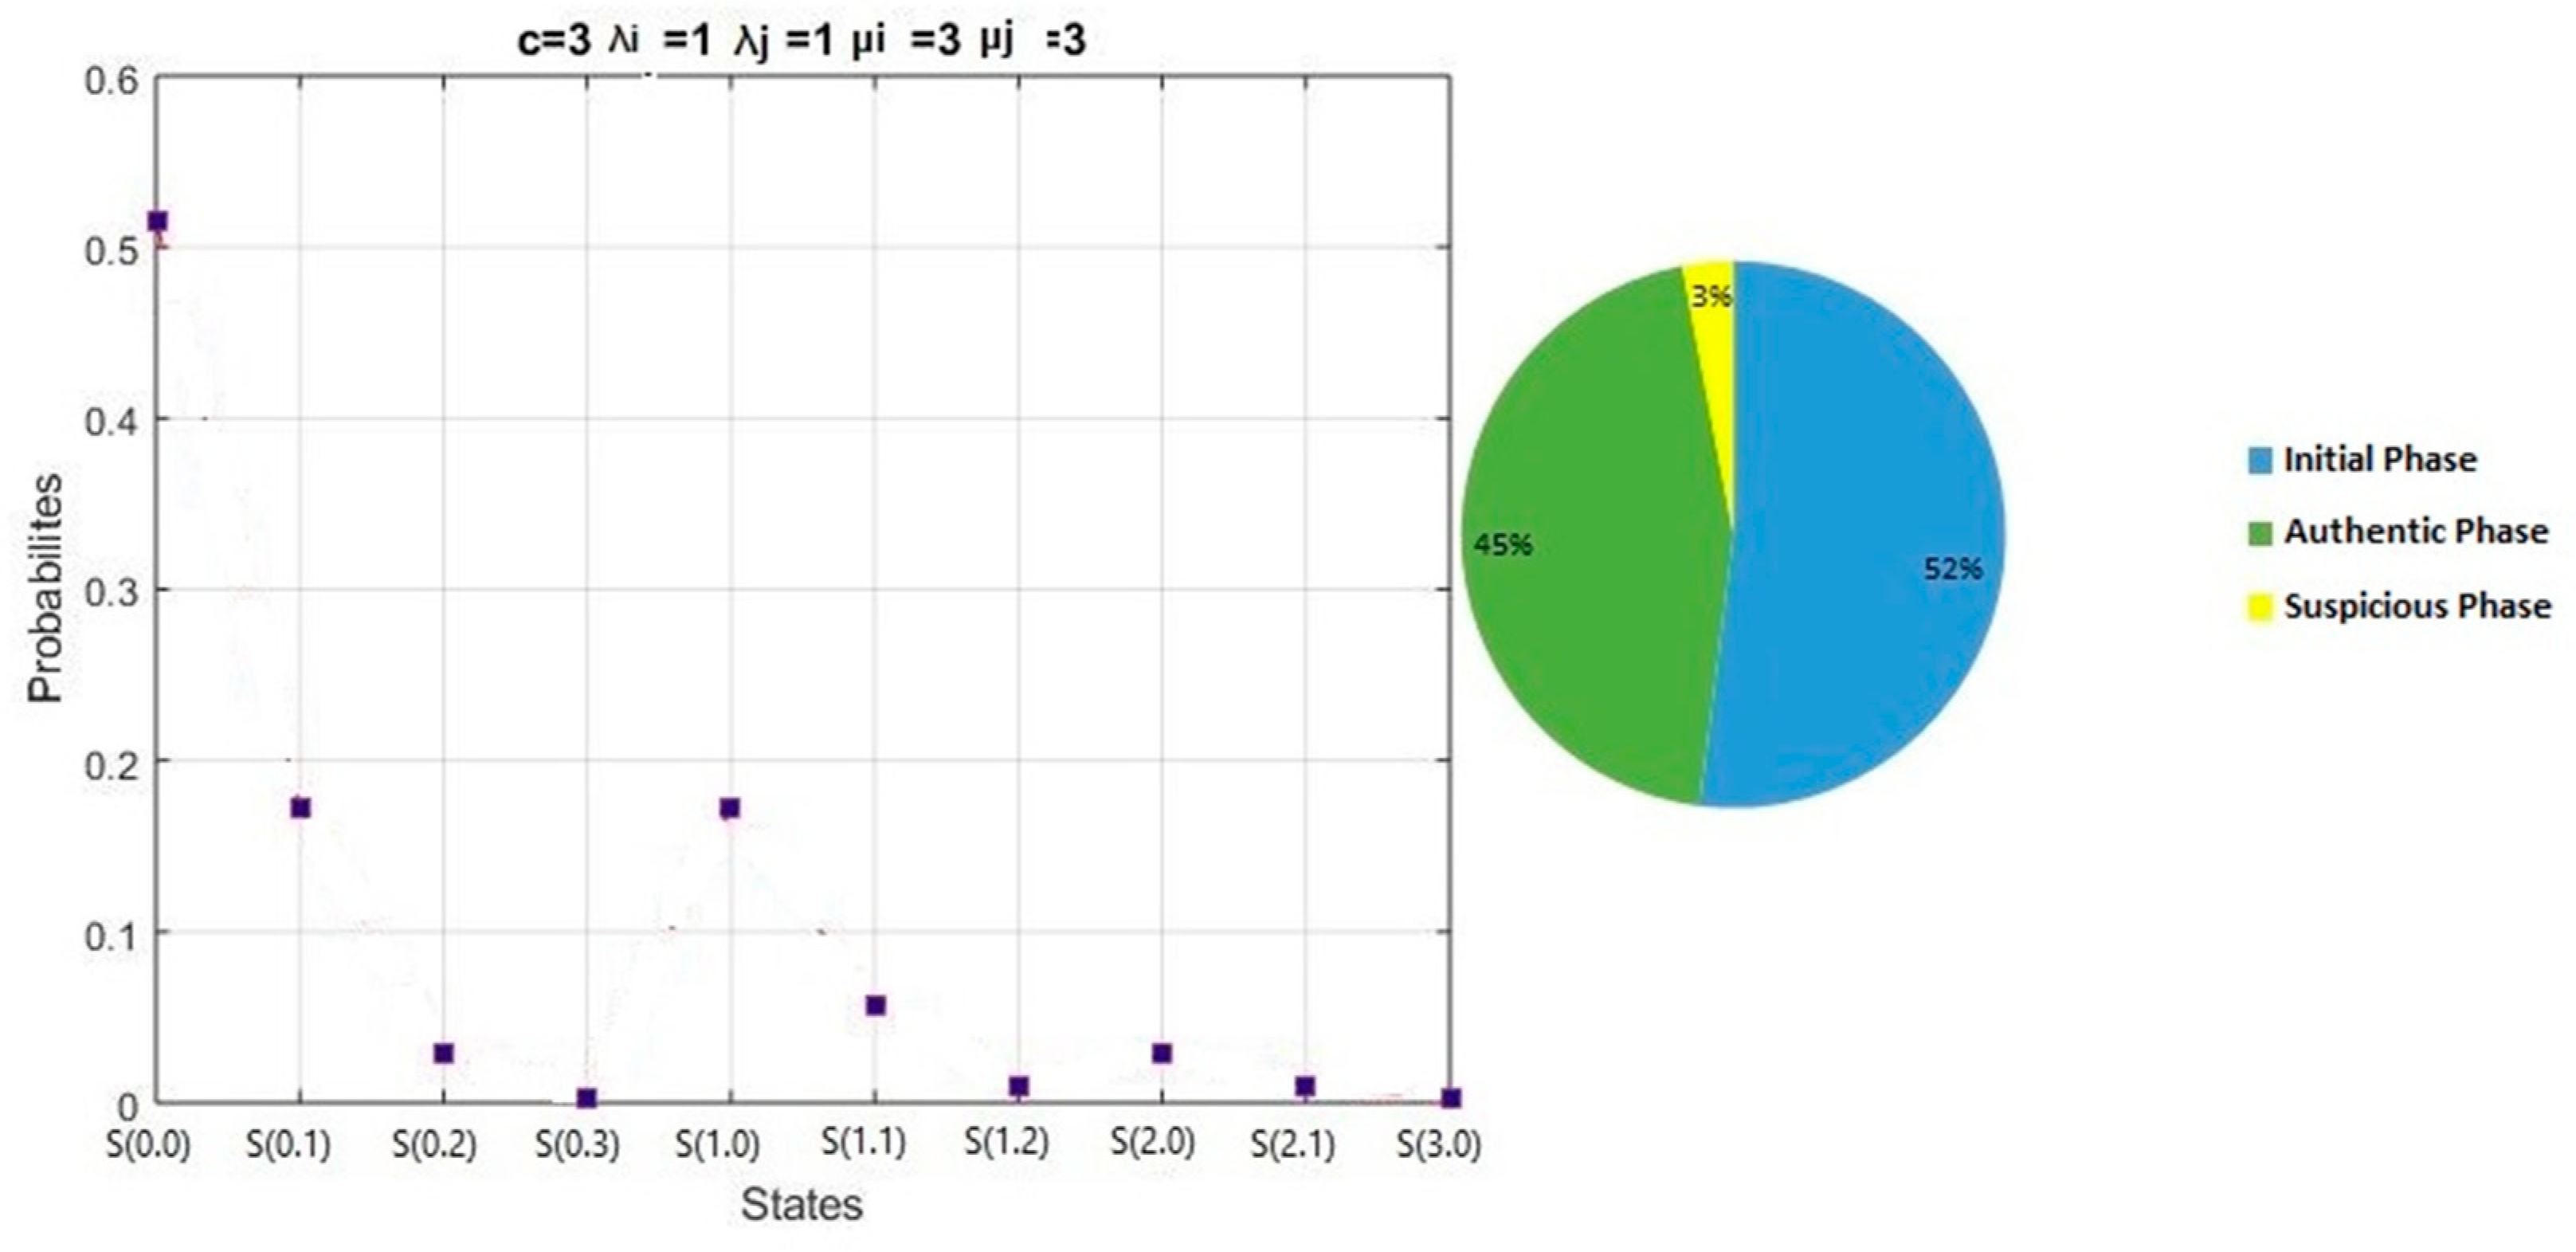
The results of the Normal-cycle scenario are shown in
Table 2:
In
Figure 9, the results and percentages of different phases for the Normal-cycle scenario:
Initial phase probability = π(0,0) = 52%
Authentic phase probability = π(0,1) + π(1,0) + π(0,2) + π(1,1) + π(2,0) = 45 %
Suspicious phase probability = π(0,3) + π(1,2) + π(2,1) + π(3,0) = 3%
5.2. Suspicious Scenario:
This scenario represents a high average arrival rate the might be either normal (e.g., dense areas) or suspicious (e.g., the launching of an attack).
In this scenario:
We keep using the same resources for the LTE system ().
We increase the average arrival rate of to be (= 2).
We also increase the average arrival rate of to be (= 2).
We decrease the service rate of to be (μ1 = 2).
We also decrease the service rate of to be (μ2 = 2).
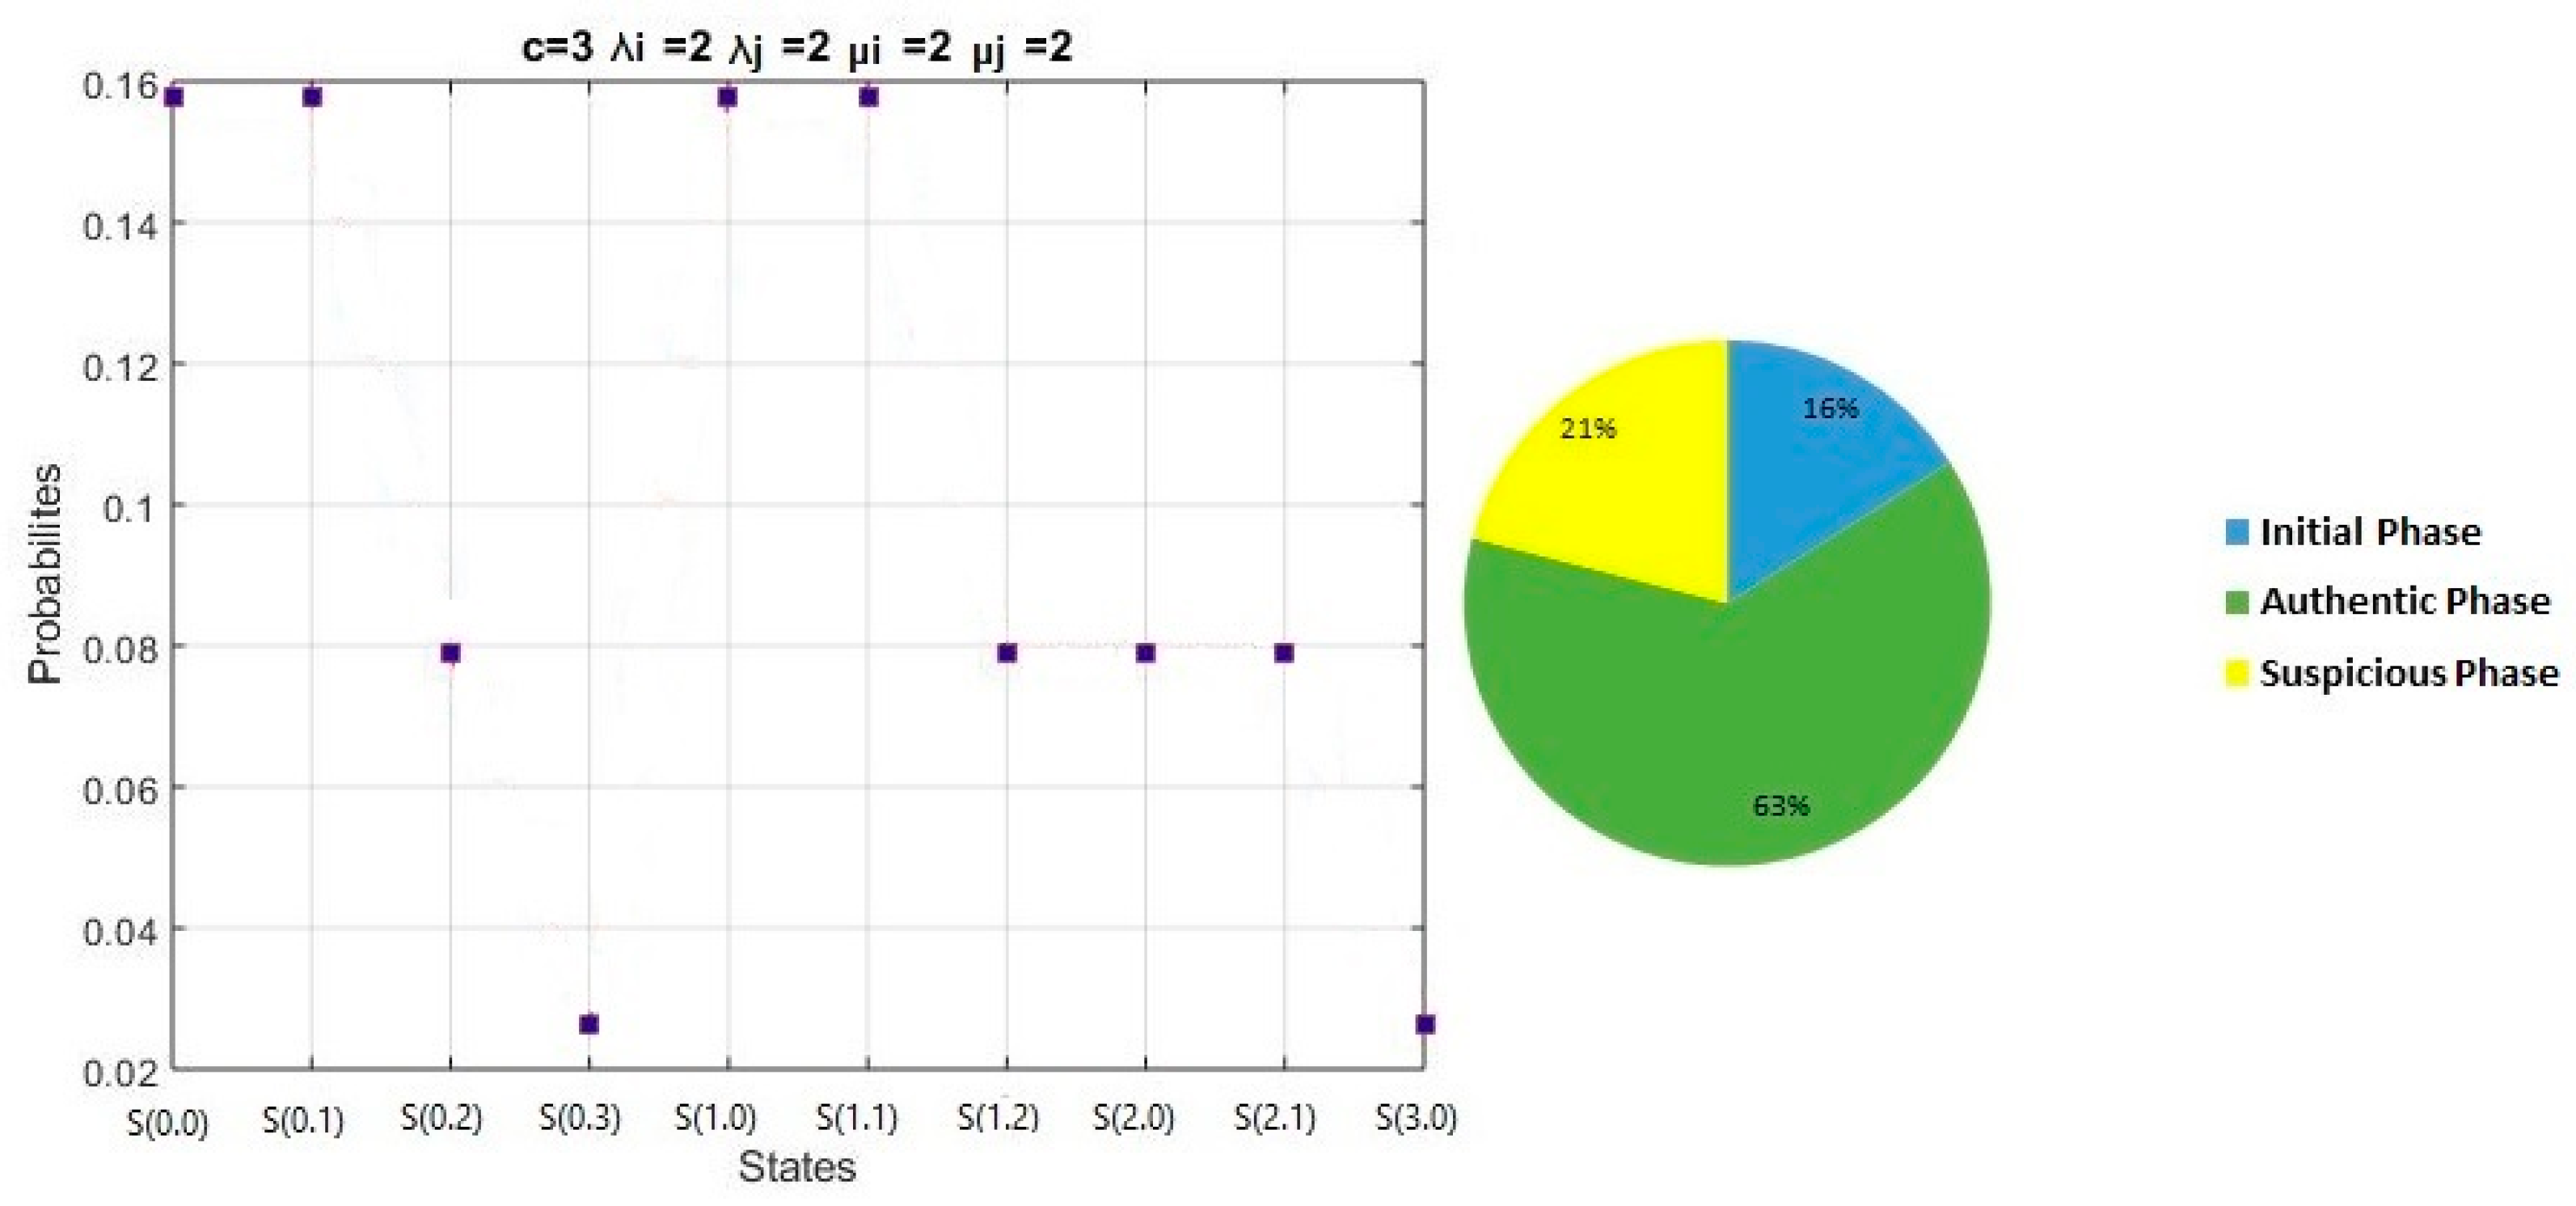
The results of the Suspicious scenario are shown in
Table 3:
Figure 10 shows the results and percentages of different phases in the Suspicious scenario:
Initial phase probability = π(0,0) = 16%.
Authentic phase probability = π(0,1) + π(1,0) + π(0,2) + π(1,1) + π(2,0) = 63 %
Suspicious phase probability = π(0,3) + π(1,2) + π(2,1) + π(3,0) = 21%
5.3. Attack Scenario:
In this scenario, we assume receiving an excessive data rate as a result of an attack.
In this scenario:
We fixed the resources used in the LTE system with 3 PRB ().
We increase the average arrival rate of to be (= 3).
We keep using the same average arrival rate of (= 2).
We decrease the service rate of to be (μ1=1).
In addition, we decrease the service rate of to be (μ2=1).
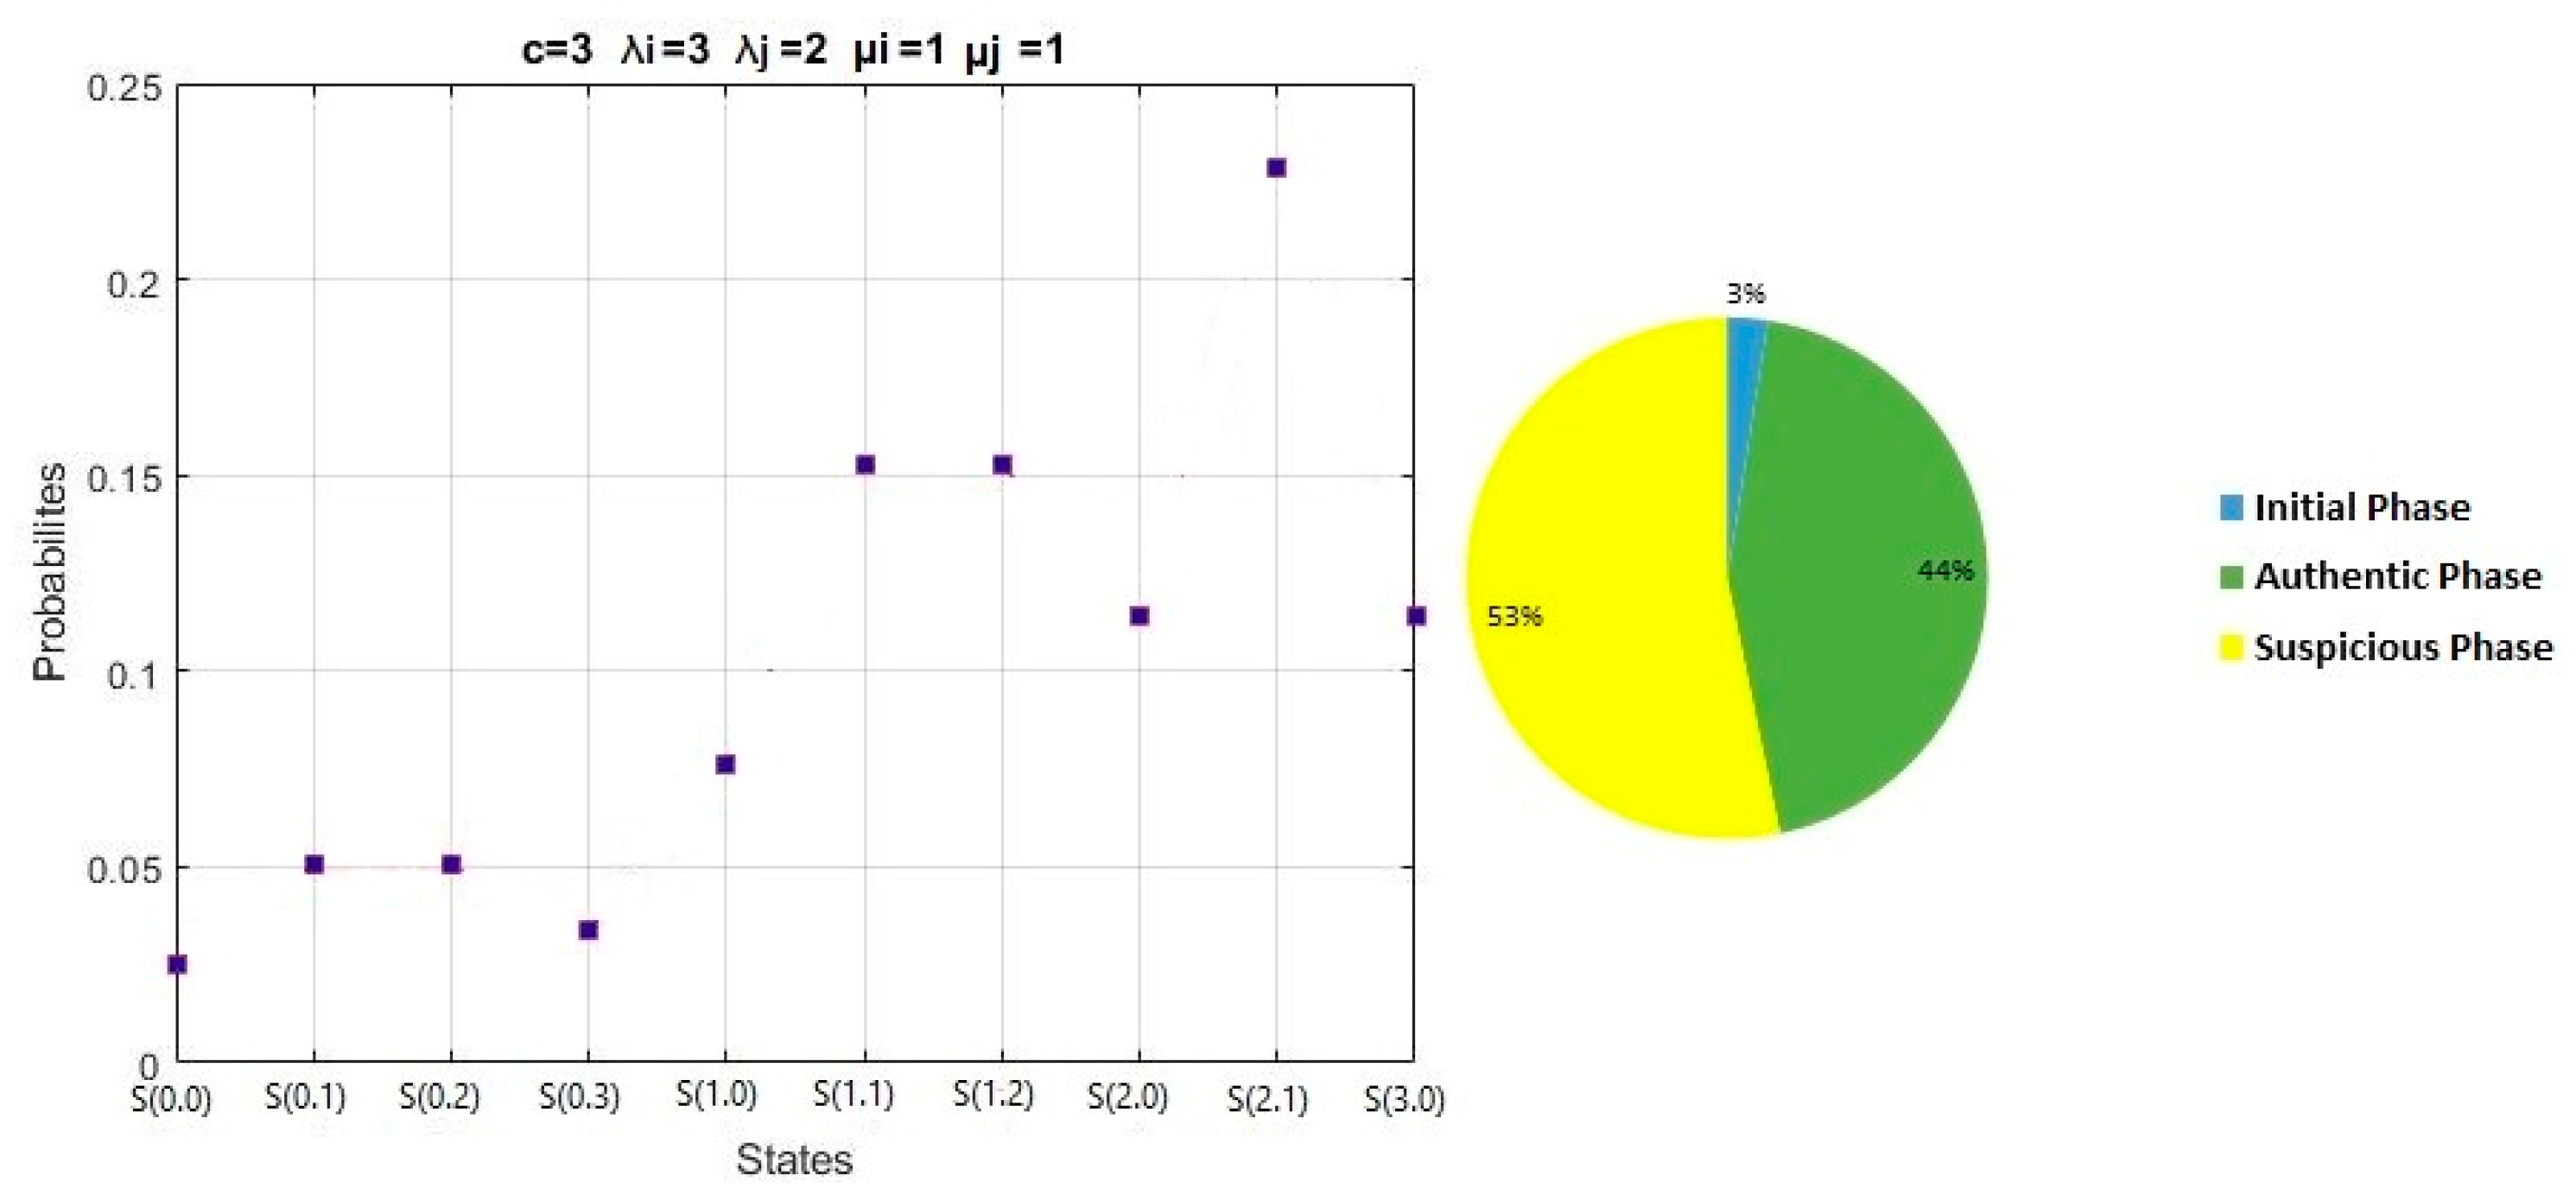
The results of the Attack scenario are shown in
Table 4:
Figure 11 shows the results and percentages of different phases the Attack scenario:
Initial phase probability = π(0,0) = 3%
Authentic phase probability = π(0,1) + π(1,0) + π(0,2) + π(1,1) + π(2,0) = 44 %
Suspicious phase probability = π(0,3) + π(1,2) + π(2,1) + π(3,0) = 53%
6. Conclusions
Our study starts with an approach analysis for the impact of DDoS attacks on LTE-M networks named MDP model. A first congestion is expected on LTE-M network due to the huge number of requests attempting to concurrently link to the network as a result of a DDoS attack, which eventually cause an overload issue. In this paper, a survey was provided for the main literature approaches to address this issue. In our work, we begin to research LTE-M network infrastructure and IoT devices technological features in order to differentiate among Authentic, Suspicious or Malicious requests. By modelling the system, we end up with promising results regarding the effect of DDoS attacks on M2M and the bottlenecks that occur due to these attacks on LTE-M networks. We realize that LTE-M networks can be affected by the increase number of Read, Modify or Delete Requests. Under different scenarios, we analyze the data traffic and predict the system state to determine the behavior of the system and its probability to be under attack.
Author Contributions
Conceptualization, A.H.E.F., M.H.M., and A.M.; methodology, A.H.E.F., M.H.M., and A.M.; software, A.H.E.F. and M.H.M.; validation, A.H.E.F., M.H.M., and A.M.; formal analysis, A.H.E.F., M.H.M., and A.M.; investigation, A.H.E.F., M.H.M., A.N., and A.M.; resources, A.H.E.F. and M.H.M.; data curation, A.H.E.F., M.H.M., A.N., and A.M.; writing—original draft preparation, A.H.E.F. and M.H.M.; writing—review and editing, A.H.E.F., M.H.M., A.N., A.M.; visualization, A.H.E.F., M.H.M., A.N., and A.M.; supervision, A.M.; project administration, A.M.; funding acquisition, A.H.E.F. All authors have read and agreed to the published version of the manuscript.
Funding
This research received no external funding.
Data Availability Statement
Data are contained within the article.
Conflicts of Interest
The authors declare no conflicts of interest.
| 1 |
|
| 2 |
Center for Applied Internet Data Analysis (CAIDA) conducts network research and builds research infrastructure to support large-scale data collection, curation, and data distribution to the scientific research community https://www.caida.org/about/
|
| 3 |
|
| 4 |
|
| 5 |
|
| 6 |
|
Abbreviations
| Abbreviation |
Description |
| 3GPP |
3rd Generation Partnership Project |
| 4G |
Fourth Generation |
| CAIDA |
Center for Applied Internet Data Analysis |
| CC |
Command Control |
| CIC |
Canadian Institute for Cybersecurity |
| DDoS |
Distributed Denial of Service |
| H2H |
Human-to-Human |
| ICS |
Industrial Control Systems |
| IoT |
Internet of Things |
| LPWAN |
Low Power Wide Area Networks |
| LR |
Logistic Regression |
| LTE-A |
Long Term Evolution- Advanced |
| LTE-M |
Long Term Evolution for Machines |
| M2M |
Machine-to-Machine |
| MDP |
Markov Detection and Prediction |
| MTC |
Machine Type Communications |
| OFDMA |
Orthogonal Frequency Division Multiple Access |
| PCA |
Principal Component Analysis |
| PRB |
Physical Resource Block |
| RB |
Resource Block |
| RE |
Resource Element |
| RF |
Random Forest |
| RFE |
Recursive Feature Elimination |
| SVM |
Support Vector Machine |
| UE |
User Equipment |
References
- H. Pourrahmani, A. Yavarinasab, "The applications of internet of things in the automotive industry: A review of the batteries, fuel cells, and Engines". Internet of Things 2022, 19, 100579. [CrossRef]
- Gartner (August 03, 2016)" Press Release: Global Internet of Things Market To 27 Billion devices, Generating usd3 Trillion Revenue in 2025" [Online]. Available online: https://machinaresearch.com/news/press-release-global-internet-of-things-market-to-grow-to-27-billion-devices-generating-usd3-trillion-revenue-in-2025.
- Gartner (Dec 2023) “IoT Connections Forecast to 2030” [Online]. Available online: https://data.gsmaintelligence.com/research/research/research-2023/iot-connections-forecast-to-2030.
- A.H. El Fawal, A. Mansour, "LTE-M Adaptive eNodeB for Emergency Scenarios", International Conference on Information and Communication Technology Convergence (ICTC), Jeju, Korea (South), October 2017.
- Forbes Advisor, " Top Website Statistics For 2024" (Accessed October 10,2024) [Online]. Available online: https://www.forbes.com/advisor/business/software/website-statistics/.
- S. Ahmed, Z. A. Khan, S. M. Mohsin, S. Latif, S. Aslam, H. Mujlid, M. Adil and Z. Najam, "Effective and Efficient DDoS Attack Detection Using Deep Learning Algorithm, Multi-Layer Perceptron". Journals Future Internet 2023, 15, 76. [CrossRef]
- S. Zinno, G. S. Zinno, G. Di Stasi, S. Avallone and G. Ventre, "A Load Balancing Algorithm against DDoS attacks in beyond 3G wireless networks," In Proceedings of the 2014 Euro Med Telco Conference (EMTC), Naples, Italy, 2014; pp. 1–6. [CrossRef]
- S. H. Lee, Y. L. Shiue, C. H. Cheng, Y. H. Li and Y. F. Huang, "Detection and Prevention of DDoS Attacks on the IoT", Applied Sciences 2022, 12.
- Z. Liu, L. Z. Liu, L. Qian, S. Tang, "The prediction of DDoS attack by machine learning", Proc. SPIE 12167, Third International Conference on Electronics and Communication; Network and Computer Technology (ECNCT2021), Harbin, China (); 7 March. [CrossRef]
- Z. Abaid, D. Z. Abaid, D. Sarkar, M. Kaafar, S. Jha, " The Early Bird gets the botnet: A Markov chain based Early Warning System for botnet attacks", In Proceedings of the 2016 IEEE 41st Conference on Local Computer Networks (LCN), Dubai, United Arab Emirates, 2016; pp. 61–68. [CrossRef]
- B.M. Rahal, A. Santos and M. Nogueira, "A Distributed Architecture for DDoS Prediction and Bot Detection," IEEE Access. 2020, 8, 159756–159772. [CrossRef]
- Ismail, "A Machine Learning-Based Classification and Prediction Technique for DDoS Attacks," IEEE Access 2022, 10, 21443–21454. [CrossRef]
- F. Alasmary, S. Alraddadi, S. Al-Ahmadi and J. Al-Muhtadi, "ShieldRNN: A Distributed Flow-Based DDoS Detection Solution for IoT Using Sequence Majority Voting,". IEEE Ac 2022, 10, 88263–88275. [CrossRef]
- R. Ettiane, A. R. Ettiane, A. Chaoub and R. Elkouch, "Robust detection of signaling DDoS threats for more secure machine type communications in next generation mobile networks," In Proceedings of the 2018 19th IEEE Mediterranean Electrotechnical Conference (MELECON), Marrakech, Morocco, 2018; pp. 62–67. [CrossRef]
- D.Javaheri, S. Gorgin, J. Lee, M. Masdari, " Fuzzy logic-based DDoS attacks and network traffic anomaly detection methods: Classification, Overview, and future perspectives", Information Sciences 2023, 626, 315–338. [CrossRef]
- S.Hameed, F. I. Khan and B. Hameed, "Understanding Security Requirements and Challenges in Internet of Things (IoT): A Review". Journal of Computer Networks and Communications 2019, 2019, 1–14.
- M.A. Al-Naeem, "Prediction of Re-Occurrences of Spoofed ACK Packets Sent to Deflate a Target Wireless Sensor Network Node by DDOS,". IEEE Access 2021, 9, 87070–87078. [CrossRef]
- Gartner (september 03, 2023) " The objective of Machine-to-Machine (M2M) communication is to achieve cost-effectiveness, energy efficiency, simplicity, and broad geographical reach.
- Gartner, " New Mirai Variant Targeting Network Security Devices" (Accessed April 19,2023) [Online]. Available online: https://unit42.paloaltonetworks.com/mirai-variant-iot-vulnerabilities.
- Gartner, "The Persirai Botnet" (Accessed August 3, 2023) [Online]. Available online: https://westoahu.hawaii.edu/cyber/regional/gce-us-news/the-persirai-botnet.
Figure 1.
Limited Bandwidth of LTE-M carrier in LTE-A carrier; Where Resource Element (RE) and Resource Block (RB).
Figure 1.
Limited Bandwidth of LTE-M carrier in LTE-A carrier; Where Resource Element (RE) and Resource Block (RB).
Figure 2.
Authentic, Suspicious and Malicious requests.
Figure 2.
Authentic, Suspicious and Malicious requests.
Figure 3.
MDP flow chart upon the arrival of Authentic or Suspicious or Malicious requests; Where “” is the threshold of authentic phase, “” is the threshold of suspicious phase, “” is the number of ongoing Malicious for Delete Request.
Figure 3.
MDP flow chart upon the arrival of Authentic or Suspicious or Malicious requests; Where “” is the threshold of authentic phase, “” is the threshold of suspicious phase, “” is the number of ongoing Malicious for Delete Request.
Figure 4.
Representing MDP model as a set of generic states; Where “" represents the number of ongoing services for Read Request (), “” is the number of ongoing services for Modify Request (), “” is the threshold of authentic phase, “” is the threshold of suspicious phase, “” is the number of ongoing Malicious for Delete Request.
Figure 5.
Representing MDP model as a set of states ( and ); Where “S(i,j)” the state with certain & requests, “" represents the number of ongoing services for Read Request (), “” is the number of ongoing services for Modify Request (), “” is the threshold of authentic phase, “” is the threshold of suspicious phase, “” is the number of ongoing Malicious for Delete Request.
Figure 6.
Transitioning from S(0,0) in the “Initial phase” to different states in the “Authentic phase”; “S(i,j)” represents different states; where “” is the number of ongoing services for Read Request () and “” is the number of ongoing services for Modify Request ().
Figure 6.
Transitioning from S(0,0) in the “Initial phase” to different states in the “Authentic phase”; “S(i,j)” represents different states; where “” is the number of ongoing services for Read Request () and “” is the number of ongoing services for Modify Request ().
Figure 7.
Transitioning from the “Authentic phase” to the “Initial phase” or the “Suspicious phase”; “S(i,j)” represents different states; where “” is the number of ongoing services for Read Request () and “” is the number of ongoing services for Modify Request ().
Figure 7.
Transitioning from the “Authentic phase” to the “Initial phase” or the “Suspicious phase”; “S(i,j)” represents different states; where “” is the number of ongoing services for Read Request () and “” is the number of ongoing services for Modify Request ().
Figure 8.
Transitioning from the “Malicious phase” to the “Suspicious phase”; “S(i,j)” represents different states; where “” is the number of ongoing services for Read Request () and “” is the number of ongoing services for Modify Request ().
Figure 8.
Transitioning from the “Malicious phase” to the “Suspicious phase”; “S(i,j)” represents different states; where “” is the number of ongoing services for Read Request () and “” is the number of ongoing services for Modify Request ().
Figure 9.
The probability values for each state S(i,j) in the Normal-cycle; Where “S(i,j)” represents different states, π(i,j) is the Steady-state probability, “i” is the number of ongoing services for Read Request () and “j” is the number of ongoing services for Modify Request ().
Figure 9.
The probability values for each state S(i,j) in the Normal-cycle; Where “S(i,j)” represents different states, π(i,j) is the Steady-state probability, “i” is the number of ongoing services for Read Request () and “j” is the number of ongoing services for Modify Request ().
Figure 10.
The probability values for each state S(i,j) in the Suspicious scenario; Where “S(i,j)” represents different states, π(i,j) is the Steady-state probability, “i” is the number of ongoing services for Read Request () and “j” is the number of ongoing services for Modify Request ().
Figure 10.
The probability values for each state S(i,j) in the Suspicious scenario; Where “S(i,j)” represents different states, π(i,j) is the Steady-state probability, “i” is the number of ongoing services for Read Request () and “j” is the number of ongoing services for Modify Request ().
Figure 11.
The probability values for each state S(i,j) in the Attack scenario; Where “S(i,j)” represents different states, π(i,j) is the Steady-state probability, “i” is the number of ongoing services for Read Request () and “j” is the number of ongoing services for Modify Request ().
Figure 11.
The probability values for each state S(i,j) in the Attack scenario; Where “S(i,j)” represents different states, π(i,j) is the Steady-state probability, “i” is the number of ongoing services for Read Request () and “j” is the number of ongoing services for Modify Request ().
Table 1.
Symbols, values and descriptions.
Table 1.
Symbols, values and descriptions.
| Symbol |
Description |
|
The threshold of authentic phase |
|
The threshold of suspicious phase |
|
number of ongoing services for Read Request () |
|
number of ongoing services for Modify Request () |
|
average arrival rate for (++) |
|
average arrival rate for (++) |
|
completed service rate for (--) |
|
completed service rate for (--) |
| S(i,j) |
The state with certain &j requests |
| π(i,j)
|
Steady-state probability |
|
Steady-state probability vector |
|
number of ongoing Malicious for Delete Request () |
Table 2.
The probability values for each state S(i,j) in the Normal-cycle; Where “S(i,j)” represents different states, π(i,j) is the Steady-state probability, “i” is the number of ongoing services for Read Request () and “j” is the number of ongoing services for Modify Request ().
Table 2.
The probability values for each state S(i,j) in the Normal-cycle; Where “S(i,j)” represents different states, π(i,j) is the Steady-state probability, “i” is the number of ongoing services for Read Request () and “j” is the number of ongoing services for Modify Request ().
| State |
Steady-state probability |
Probability Value |
Phase |
| S(0,0) |
π(0,0) |
162/314 = 51.6% |
Initial |
| S(0,1) |
π(0,1) |
54/314 =17.2% |
Authentic |
| S(0,2) |
π(0,2) |
9/314 = 2.86% |
Authentic |
| S(0,3) |
π(0,3) |
1/314 = 0.3% |
Suspicious |
| S(1,0) |
π(1,0) |
54/314 = 17.2% |
Authentic |
| S(1,1) |
π(1,1) |
18/314 = 5.73% |
Authentic |
| S(1,2) |
π(1,2) |
3/314 = 0.95% |
Suspicious |
| S(2,0) |
π(2,0) |
9/314 = 2.86% |
Authentic |
| S(2,1) |
π(2,1) |
3/314 = 0.95% |
Suspicious |
| S(3,0) |
π(3,0) |
1/314 = 0.3% |
Suspicious |
Table 3.
The probability values for each state S(i,j) in the Suspicious scenario; Where “S(i,j)” represents different states, π(i,j) is the Steady-state probability, “i” is the number of ongoing services for Read Request () and “j” is the number of ongoing services for Modify Request ().
Table 3.
The probability values for each state S(i,j) in the Suspicious scenario; Where “S(i,j)” represents different states, π(i,j) is the Steady-state probability, “i” is the number of ongoing services for Read Request () and “j” is the number of ongoing services for Modify Request ().
| State |
Steady-state probability |
Probability Value |
Phase |
| S(0,0) |
π(0,0) |
6/38 = 15.78% |
Initial |
| S(0,1) |
π(0,1) |
6/38 = 15.78% |
Authentic |
| S(0,2) |
π(0,2) |
3/38 = 7.9% |
Authentic |
| S(0,3) |
π(0,3) |
1/38 = 2.63% |
Suspicious |
| S(1,0) |
π(1,0) |
6/38 = 15.78% |
Authentic |
| S(1,1) |
π(1,1) |
6/38 = 15.78% |
Authentic |
| S(1,2) |
π(1,2) |
3/38 = 7.9% |
Suspicious |
| S(2,0) |
π(2,0) |
3/38 = 7.9% |
Authentic |
| S(2,1) |
π(2,1) |
3/38 = 7.9% |
Suspicious |
| S(3,0) |
π(3,0) |
1/38 = 2.63% |
Suspicious |
Table 4.
The probability values for each state S(i,j) in the Attack scenario; Where “S(i,j)” represents different states, π(i,j) is the Steady-state probability, “i” is the number of ongoing services for Read Request () and “j” is the number of ongoing services for Modify Request ().
Table 4.
The probability values for each state S(i,j) in the Attack scenario; Where “S(i,j)” represents different states, π(i,j) is the Steady-state probability, “i” is the number of ongoing services for Read Request () and “j” is the number of ongoing services for Modify Request ().
| State |
Steady-state probability |
Probability Value |
Phase |
| S(0,0) |
π(0,0) |
6/236 = 2.54% |
Initial |
| S(0,1) |
π(0,1) |
12/236 = 5.08% |
Authentic |
| S(0,2) |
π(0,2) |
12/236 = 5.08% |
Authentic |
| S(0,3) |
π(0,3) |
8/236 = 3.4% |
Suspicious |
| S(1,0) |
π(1,0) |
18/236 = 7.62% |
Authentic |
| S(1,1) |
π(1,1) |
36/236 = 15.25% |
Authentic |
| S(1,2) |
π(1,2) |
36/236 = 15.25% |
Suspicious |
| S(2,0) |
π(2,0) |
27/236 = 11.44% |
Authentic |
| S(2,1) |
π(2,1) |
54/236 = 22.88% |
Suspicious |
| S(3,0) |
π(3,0) |
27/236 = 11.44% |
Suspicious |
|
Disclaimer/Publisher’s Note: The statements, opinions and data contained in all publications are solely those of the individual author(s) and contributor(s) and not of MDPI and/or the editor(s). MDPI and/or the editor(s) disclaim responsibility for any injury to people or property resulting from any ideas, methods, instructions or products referred to in the content. |
© 2024 by the authors. Licensee MDPI, Basel, Switzerland. This article is an open access article distributed under the terms and conditions of the Creative Commons Attribution (CC BY) license (http://creativecommons.org/licenses/by/4.0/).
