1. Introduction
Air pollutants are emitted into the environment through natural phenomena or anthropogenic activities and can negatively impact human health and the environment. While many natural activities (volcanoes, fires, etc.) can release air pollutants into the environment, anthropogenic activities are the primary source of air pollutant emissions. In particular, PM
2.5 is a major environmental health risk globally. PM
2.5 is known to cause adverse health effects, including acute and chronic respiratory diseases such as pneumonia and chronic bronchitis, and cardiovascular diseases such as coronary heart disease, congestive heart failure, and premature death [
1,
2,
3,
4]. For this reason, many studies have been conducted to analyze how airborne PM
2.5 concentrations affect human health.
In many past studies, human health impacts have been estimated by considering PM
2.5 concentrations alongside population density and distribution. Many studies have used PM
2.5 concentrations measured at air pollution monitoring stations [
5,
6,
7]. While these measurements have the advantage of capturing the temporal variability of concentrations, they are limited by their inability to account for spatial variability. This means that assumptions must be made to estimate human health impacts in areas distant from the monitoring stations, which could result in incorrect estimations. As an alternative to solve the disadvantages of such spatial variability, a method of estimating concentrations using a chemical transport model (CTM) is widely used [
8,
9,
10]. This method has the advantage of being able to examine the entire modeled area, rather than considering only the concentrations representing the area around the monitoring stations in assessing human health risks.
In this study, we used a CTM to analyze the human health impacts of future air quality changes in Korea. In order to predict future air quality changes, several future emission scenarios were created based on the energy and air quality policy plans established in Korea. The changes in emissions for each scenario were estimated using The GHGs and air pollutants Unified Information Design system for Environment (GUIDE) [
11], one of the Integrated Assessment Models (IAMs). In a previously published study [
12], the effects of policies were analyzed by examining projected emission changes up to 2030, with 2015 as the baseline year. The estimated emissions for each scenario were used as input values for the CTM in this study. In this study, future changes in PM
2.5 concentrations for each scenario were estimated to analyze the corresponding human health impacts.
Other important variables in this study are the population density and age distribution. Population density determines the affected area and the number of people at risk, while age distribution reflects how pollutants affect different age groups. As previously reported in other studies investigating the link between air pollution and health effects, the elderly have been identified as a particularly sensitive group to air pollutants [
13,
14,
15,
16,
17]. This is a crucial factor that should be considered when estimating human health impacts under future scenarios. Many developed countries are entering an aging society, and incorporating this aspect into analyses is essential for properly estimating the extent of human health impacts. This is also the case for Korea, the subject of this study.
According to the future population projections by Statistics Korea (released in December 2023, KOrean Statistical Information Service (KOSIS)), the proportion of people aged 65 and over in Korea is expected to increase from 17.4% in 2022 to 20.3% in 2025, 30.9% in 2036, and exceed 40% in 2050, as a result of increased life expectancy and declining birth rates. According to UN standards, a population where 7% or more are aged 65 or over is classified as an aging society, 14% or more as an aged society, and 20% or more as a super-aged society [
18]. Korea is projected to become a super-aged society by 2025. Therefore, as Korea becomes a super-aged society, when establishing future health and environmental policies, the impact of environmental pollution on the elderly must be accurately assessed.
Therefore, in this study, PM
2.5 concentration predictions and health impacts analyses were performed according to future emission scenarios. In the process of analyzing health impacts, we compared cases with and without consideration of future aging in order to examine how the results differ depending on whether population aging was taken into account.
Section 2, Future Population in Korea, summarizes the results of a survey on future population changes in Korea, and
Section 3 describes the method and results for predicting future PM
2.5 concentrations.
Section 4 summarizes the methodology and results for estimating future health impacts, and finally,
Section 5 discusses the findings from this study.
2. Future Population in South Korea
Population data is used to identify the size and distribution characteristics of the target population exposed to air pollutants, categorized by region, age, and gender. When estimating the health benefits that can be obtained through air pollution reduction policies, it is reasonable to estimate the benefits while reflecting the characteristics of the target population at the point in time targeted by the policy. However, when conducting research targeting several decades into the future, it is advisable to consider population changes in estimating health benefits, as there may be significant changes in the population distribution of the region.
In this study, the base year was set as 2015, and the target analysis years were 2020, 2025, and 2030. Population data for these target years was obtained from the population statistics provided by Statistics Korea [
19]. This data provides population statistics by region and age. The populations for 2020, 2025, and 2030 are projections based on the total population census of the base year, reflecting recent trends in population change factors (birth, death, and population migration) by province, and assuming future changes. Population data was collected from 17 municipalities in Korea, and regional populations from 2015 to 2025 are summarized in
Table A1. Although Korea’s total population is projected to increase until 2030, recent research results [
20] indicate that it will start to decline after 2035.
First, the regional population distribution in the base year of 2015 is as follows.
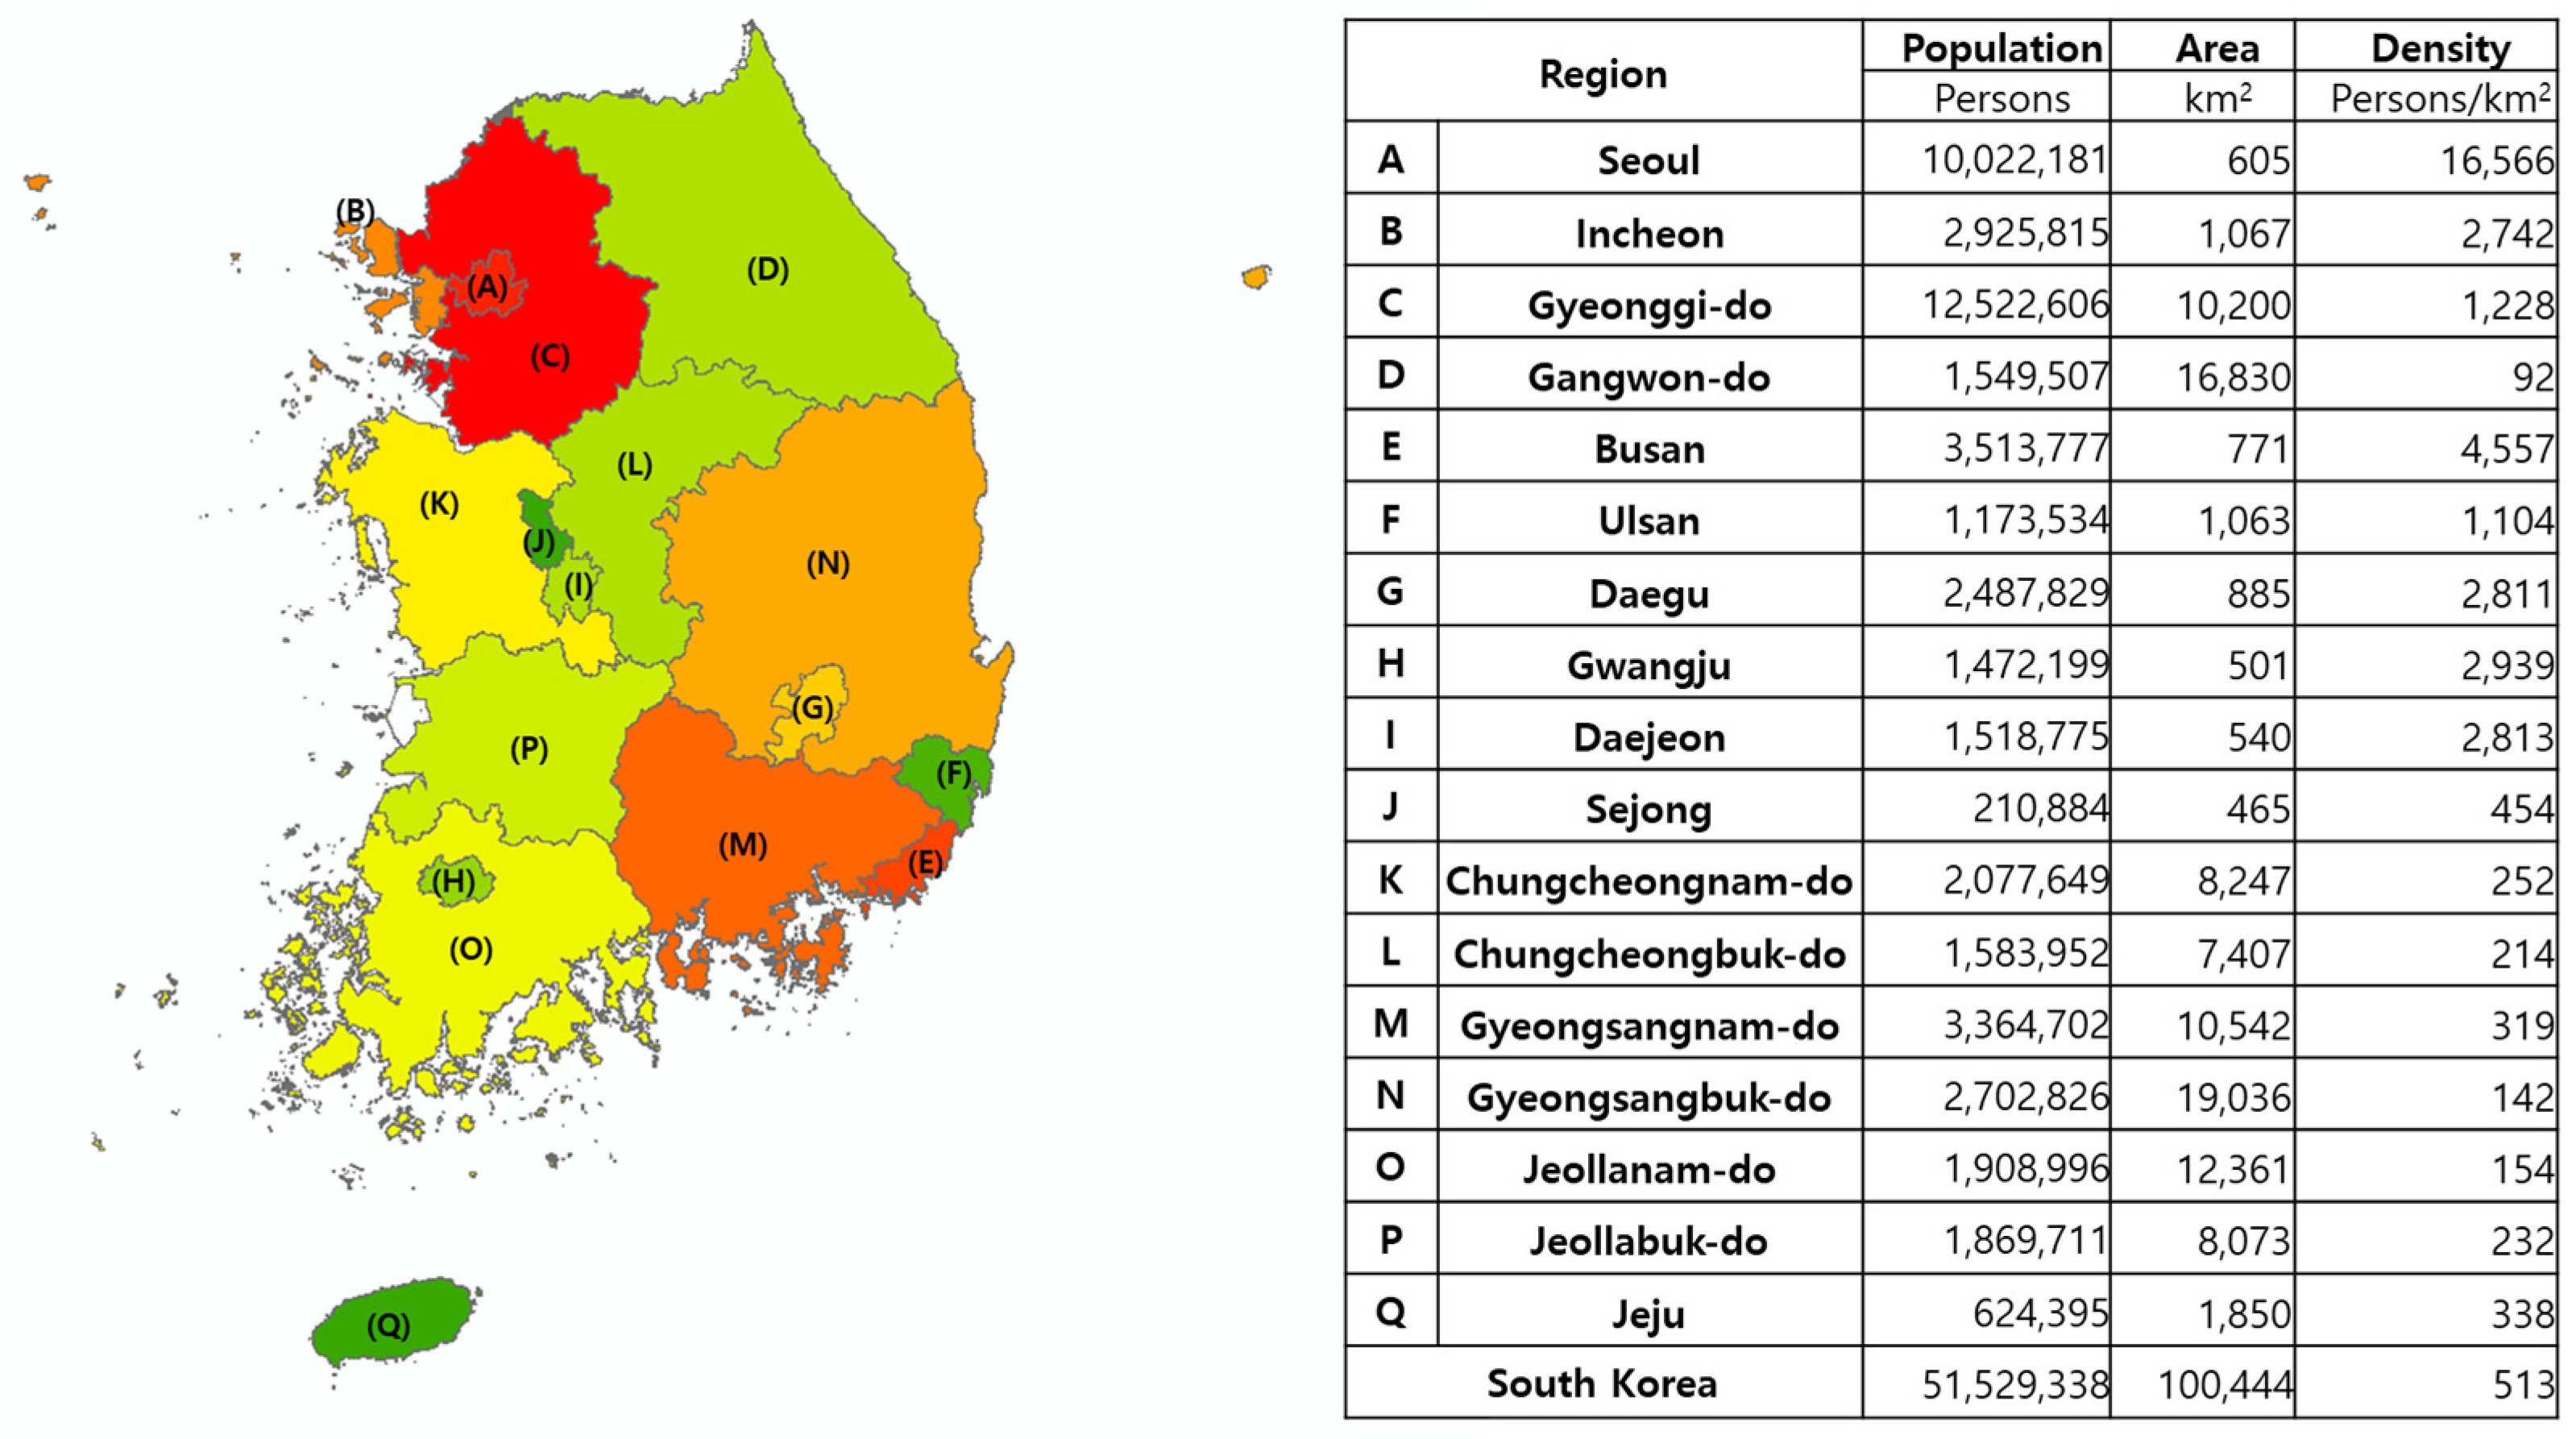
Figure 1 illustrates the population distribution across the 17 municipalities. As shown in the figure, approximately 49% of Korea’s population resides in the metropolitan area, which includes regions A, B, and C. In addition, the southern region, E (Busan), Korea’s second-largest city, has the highest population outside the metropolitan area (about 8%). These densely populated areas are likely to have higher emissions of air pollutants, leading to increased risks of human health impacts. This overall regional population distribution is not expected to change significantly by 2030, although there are variations in the growth rates by region.
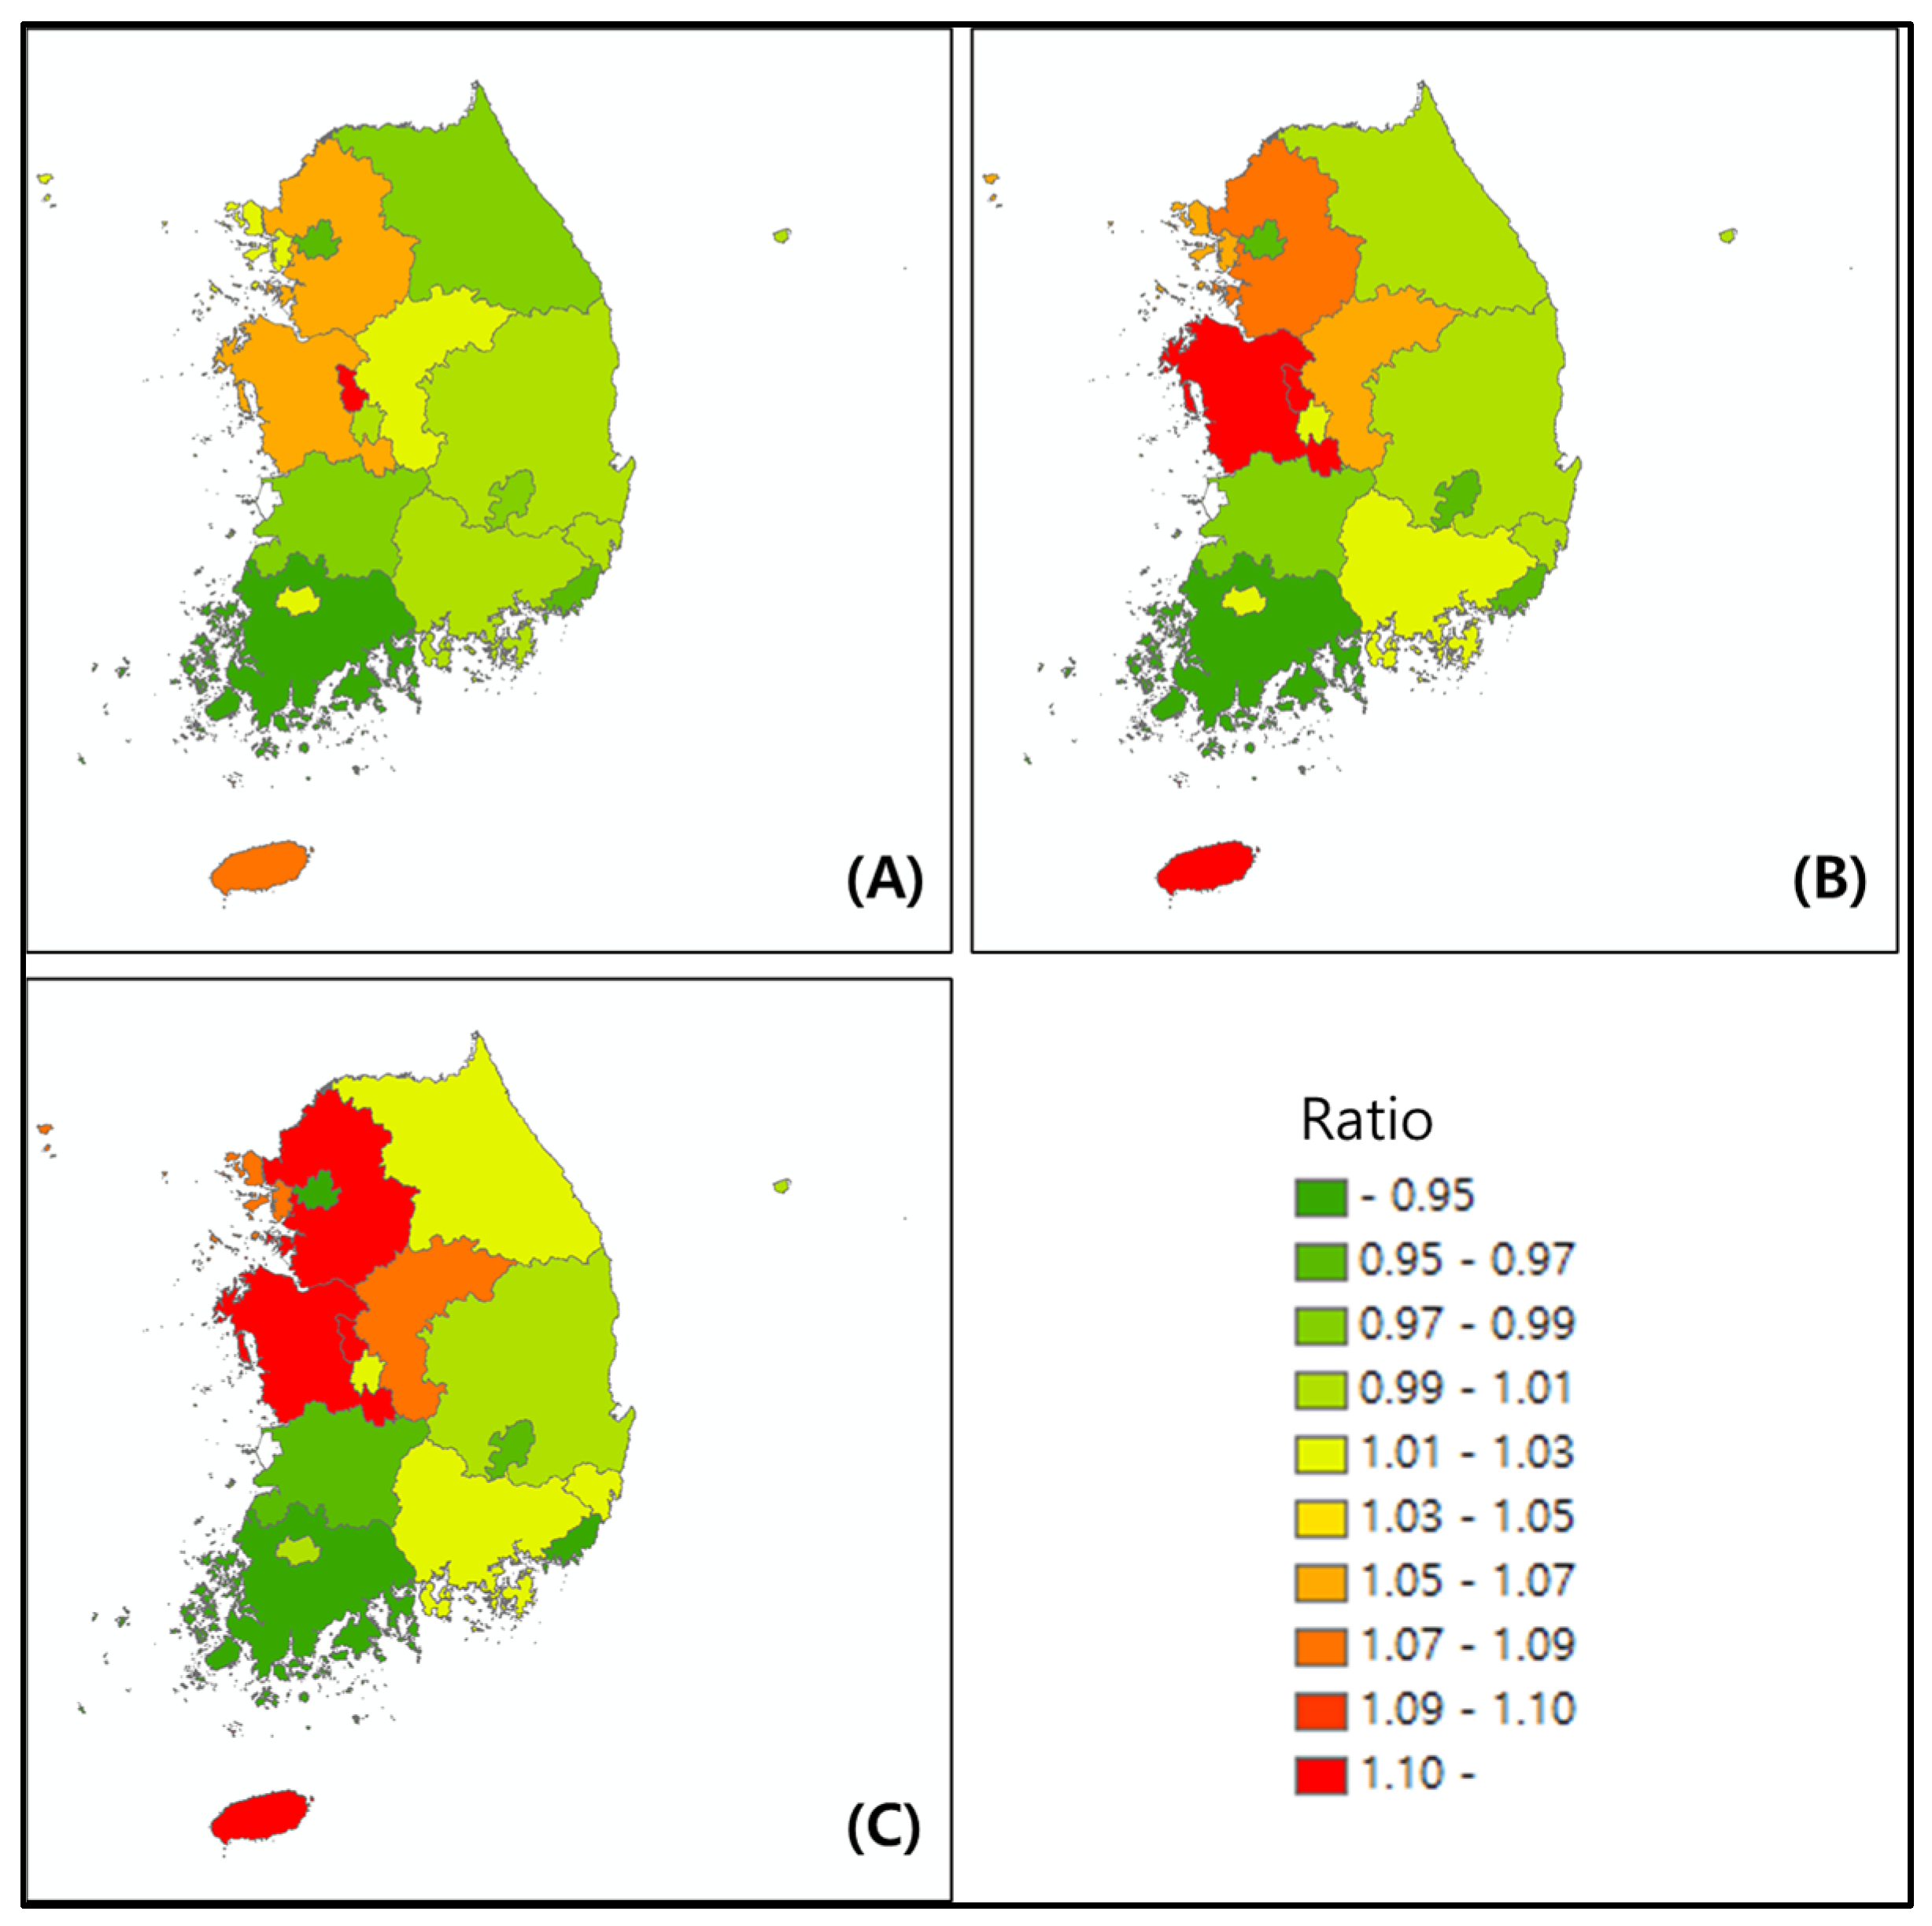
While Korea’s total population is projected to increase by 2.7% in 2030 compared to 2015, a closer look at each region reveals that Seoul, Busan, Daegu, Gyeongsangbuk-do, Jeollanam-do, and Jeollabuk-do are expected to decrease by 5.9%, 6.6%, 4.9%, 0.3%, 6.4%, and 3.2%, respectively. In contrast, regions like Incheon, Gyeonggi-do, Gangwon-do, Ulsan, Gwangju, Daejeon, Chungcheongnam-do, Chungcheongbuk-do, and Gyeongsangnam-do are expected to increase by 7.7%, 11%, 1.3%, 1.2%, 0.5%, 2.5%, 13.7%, 7.9%, and 1.8%, respectively. Notably, Sejong, which had a relatively small population in the base year, is projected to experience a population increase of about 124.3%. (Refer to
Table A1,
Figure A1).
Next, the changes in the age groups of the Korean population were analyzed.
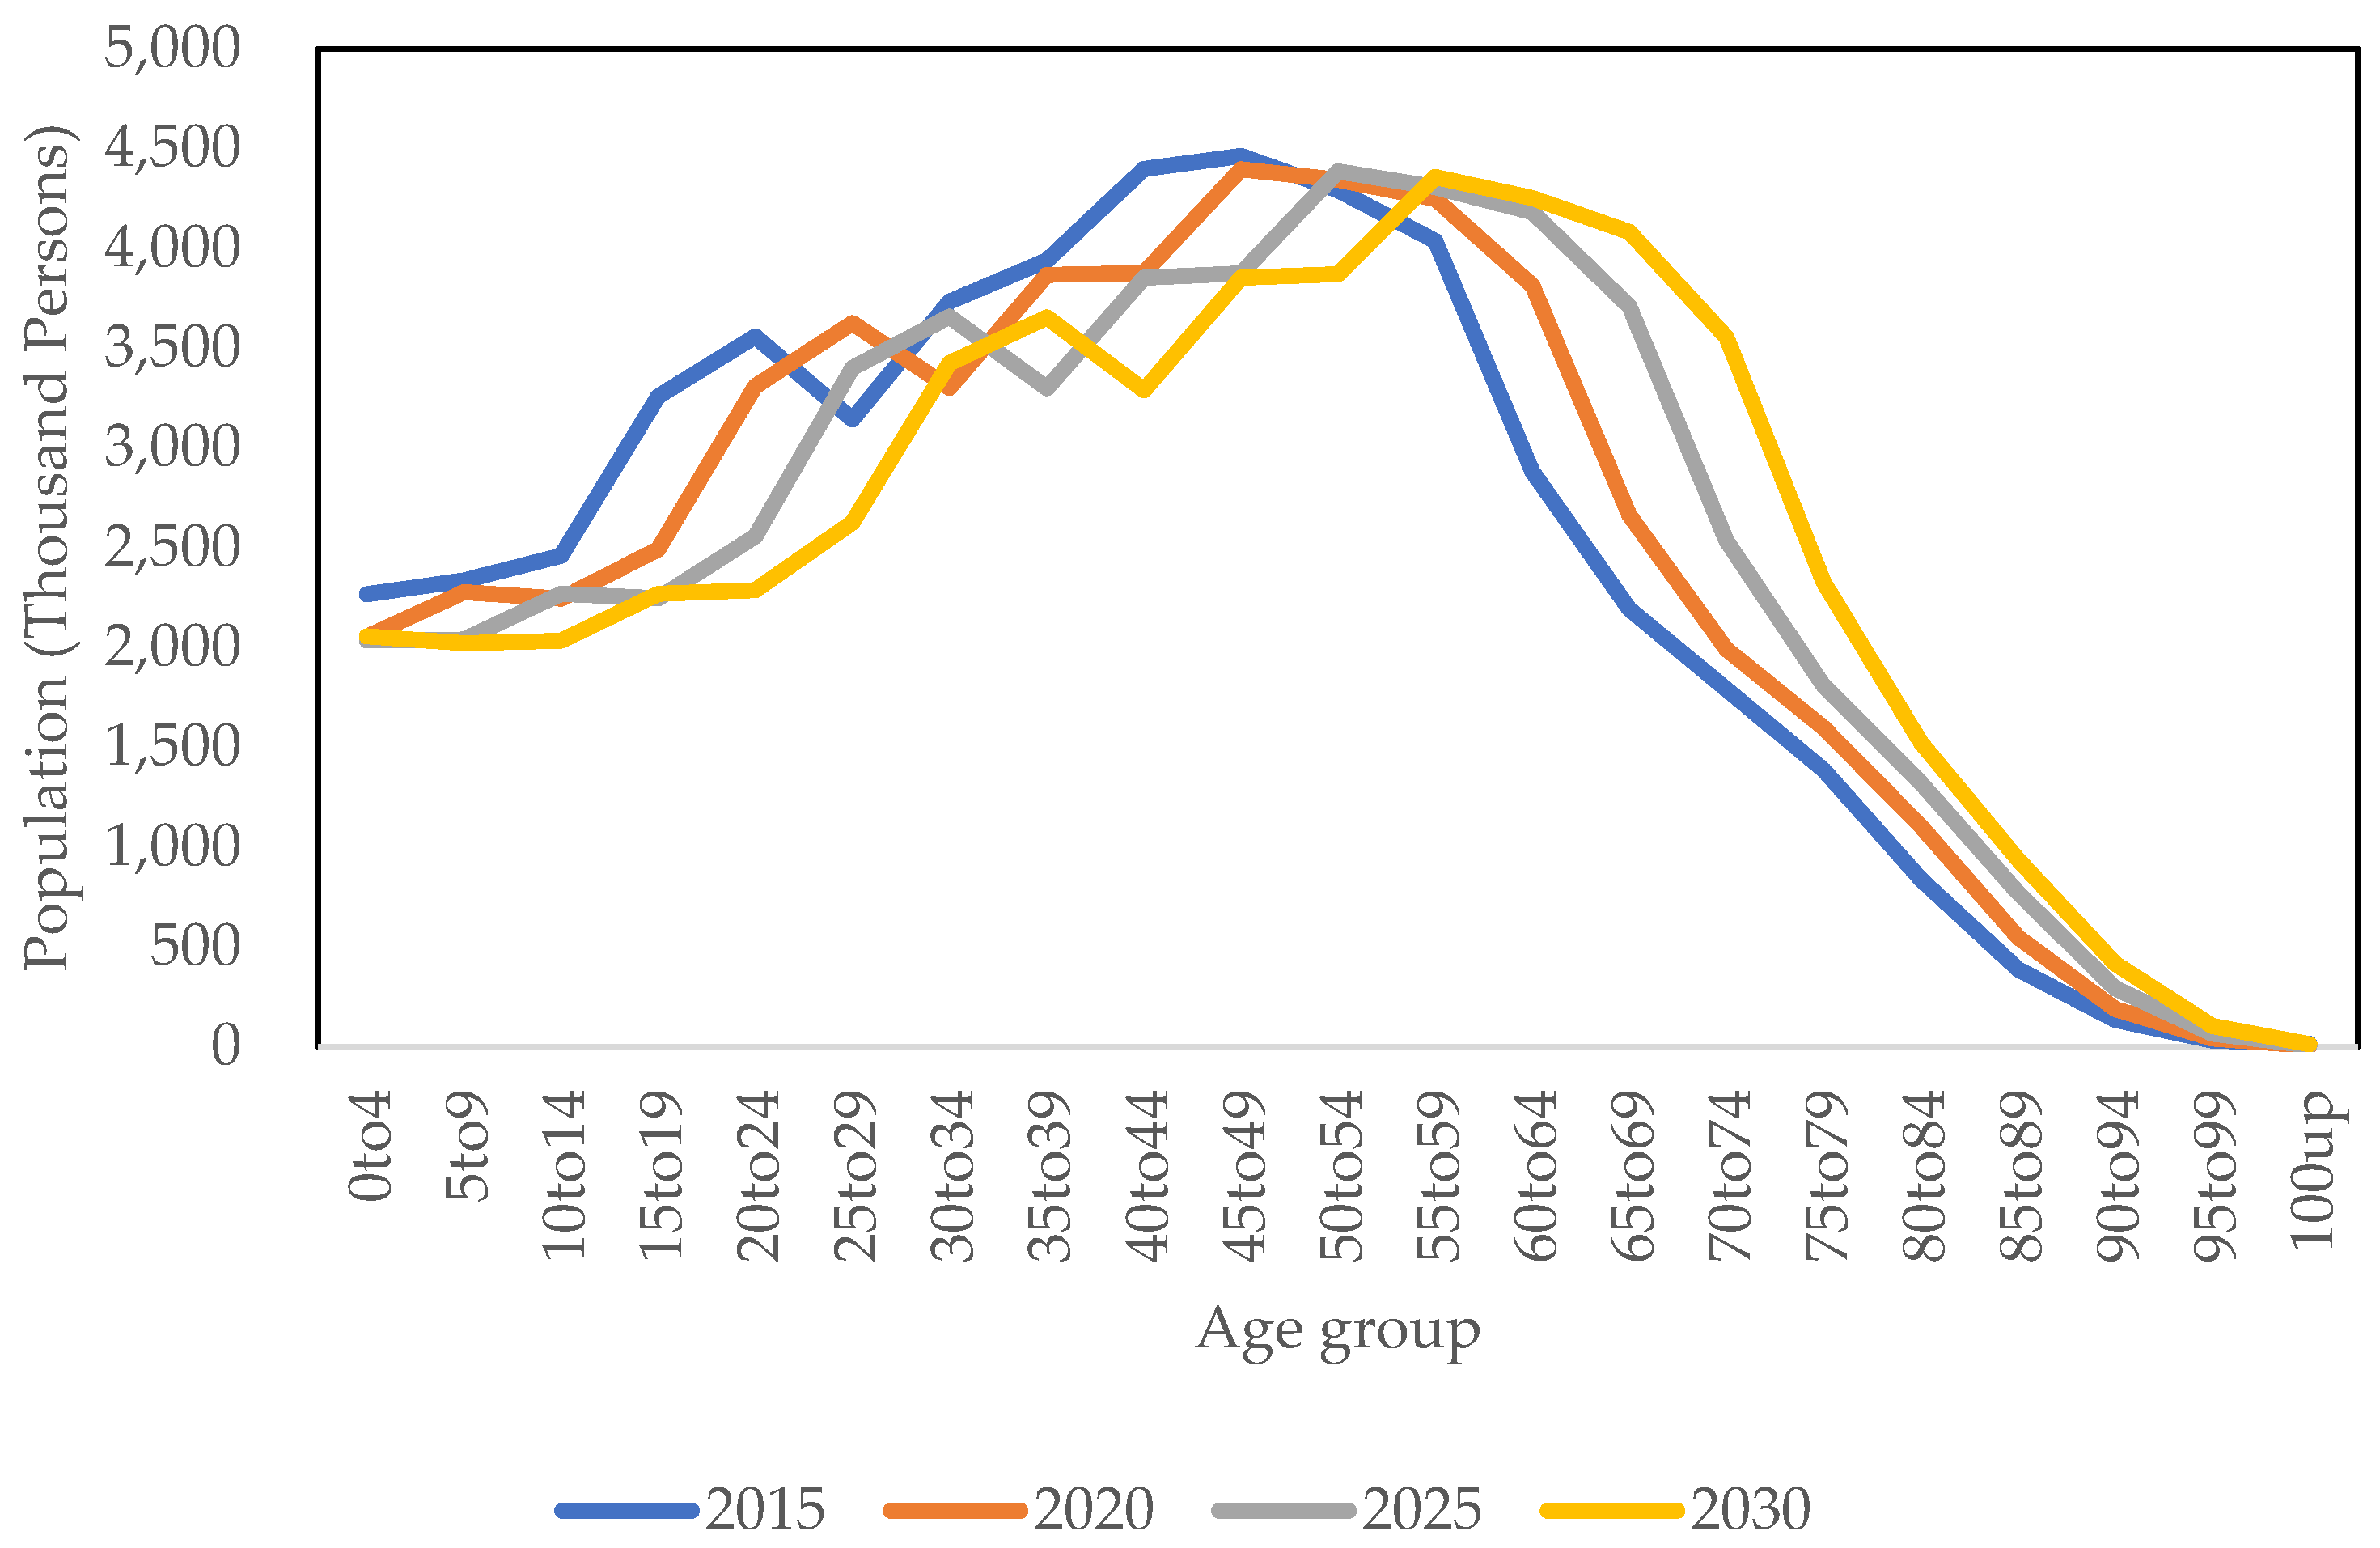
Figure 2 is a graph that shows the population of Korea divided into different age groups. It can be observed that Korea’s population distribution shifts to the right as time progresses, meaning the age group with the highest proportion of the total population is shifting to older ages. While the age group with the largest population in 2015 was 45–49 years old, the age group with the largest population in 2030 is expected to be 55–59 years old. This indicates that, in the future, as the proportion of the elderly population increases, the population in age groups that are more sensitive to the effects of air pollutants will also increase.
3. Future PM2.5 Concentrations
3.1. Future Air Quality Prediction Procedure in South Korea
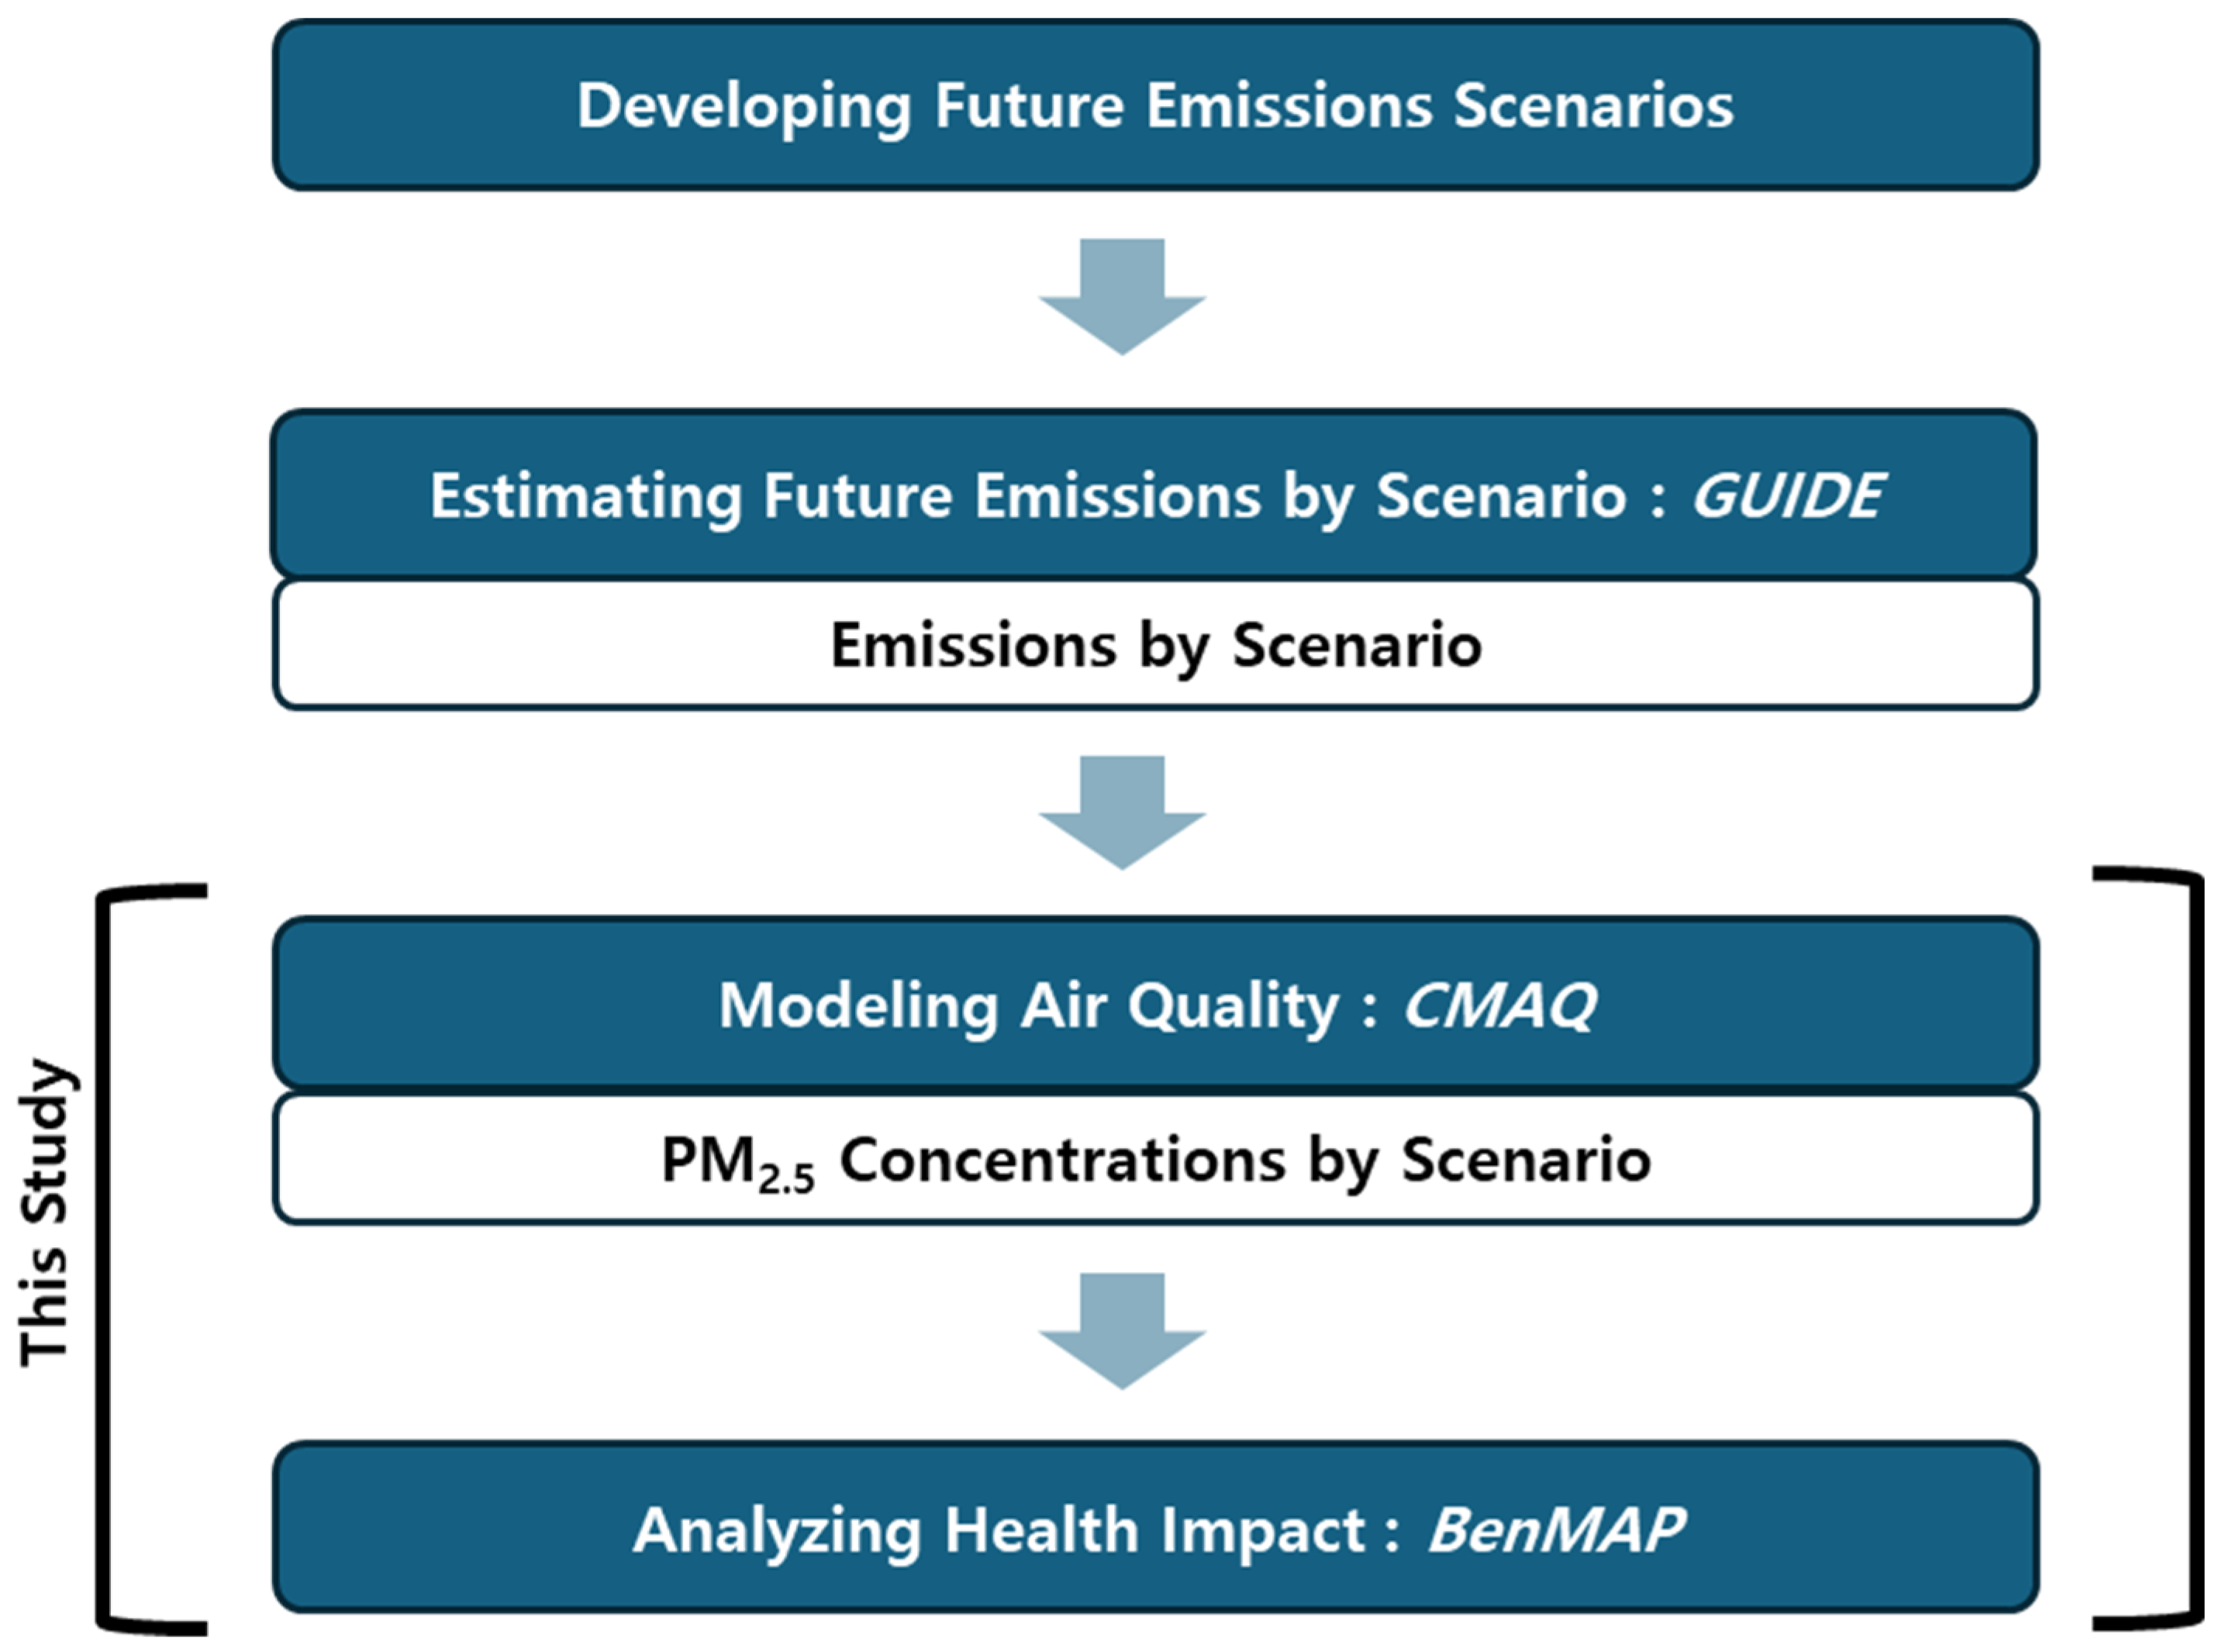
Figure 3 provides a brief outline of the procedure used in this study to predict future air quality in Korea. First, future emission scenarios were developed by investigating Korea’s energy and air quality mitigation policy plans. Second, the emissions of air pollutants in each future scenario were estimated using GUIDE. Next, the air quality concentrations for each future scenario were predicted, and finally, the health impacts resulting from exposure to PM
2.5 among air pollutants were analyzed.
The construction of scenarios and the estimated future emissions were based on the research results of Jang et al., 2024. In this study, the estimated emissions of air pollutants for each scenario were used as input data for the Community Multiscale Air Quality (CMAQ), a CTM, to estimate the ambient PM
2.5 concentrations. The study was conducted by dividing the scenarios into a Base Scenario and a Control Scenario. A detailed description of the scenarios is provided in
Section 3.2.1. The PM
2.5 concentrations predicted for each scenario were averaged at the level of 17 regions. These regionally averaged PM
2.5 concentrations, along with the regional population data, were used to estimate the changes in health impacts for each scenario.
3.2. Prediction of Future Emissions
3.2.1. Future Emission Scenarios
To develop the scenarios, as shown in
Figure 4, air quality policies and energy pathways were classified, and scenarios were constructed by combining these two pathways. Air quality policies were divided into two pathways: No Further Control (NFC) and Current Legislation (CLE). The NFC scenario maintains only the air pollution reduction policies implemented in the base year into the future, while the CLE scenario foresees the implementation of additional air pollution reduction policies planned for the future.
The energy pathways were set as the Current Policies Scenario (CPS) and the New Policies Scenario (NPS). The CPS scenario is based on current energy demand and policies, while the NPS scenario considers not only ongoing energy policies and actions but also official targets (such as the Nationally Determined Contributions, NDC, proposed for the implementation of the Paris Climate Agreement) and energy technologies (including those close to application).
In this study, two future emission scenarios, the Base scenario and the Control scenario, were developed for analysis. The Base scenario is the NFC-CPS scenario, using 2015 as the base year and applying a medium socioeconomic outlook. It assumes that only the policies implemented in the base year will be applied in the future, without additional energy or air pollution reduction policies. The Control scenario is the CLE-NPS scenario, in which additional energy and air quality policies are applied to the Base scenario. The energy policy applied is the Nationally Determined Contributions (NDC) announced in 2018, and the air quality policy is Korea’s "The Master Plan for Air Quality Management by Region" [
21]. The Control scenario was designed to achieve greater reductions in air pollutants in the future compared to the Base scenario.
3.2.2. Future Emissions Prediction Results by Scenario
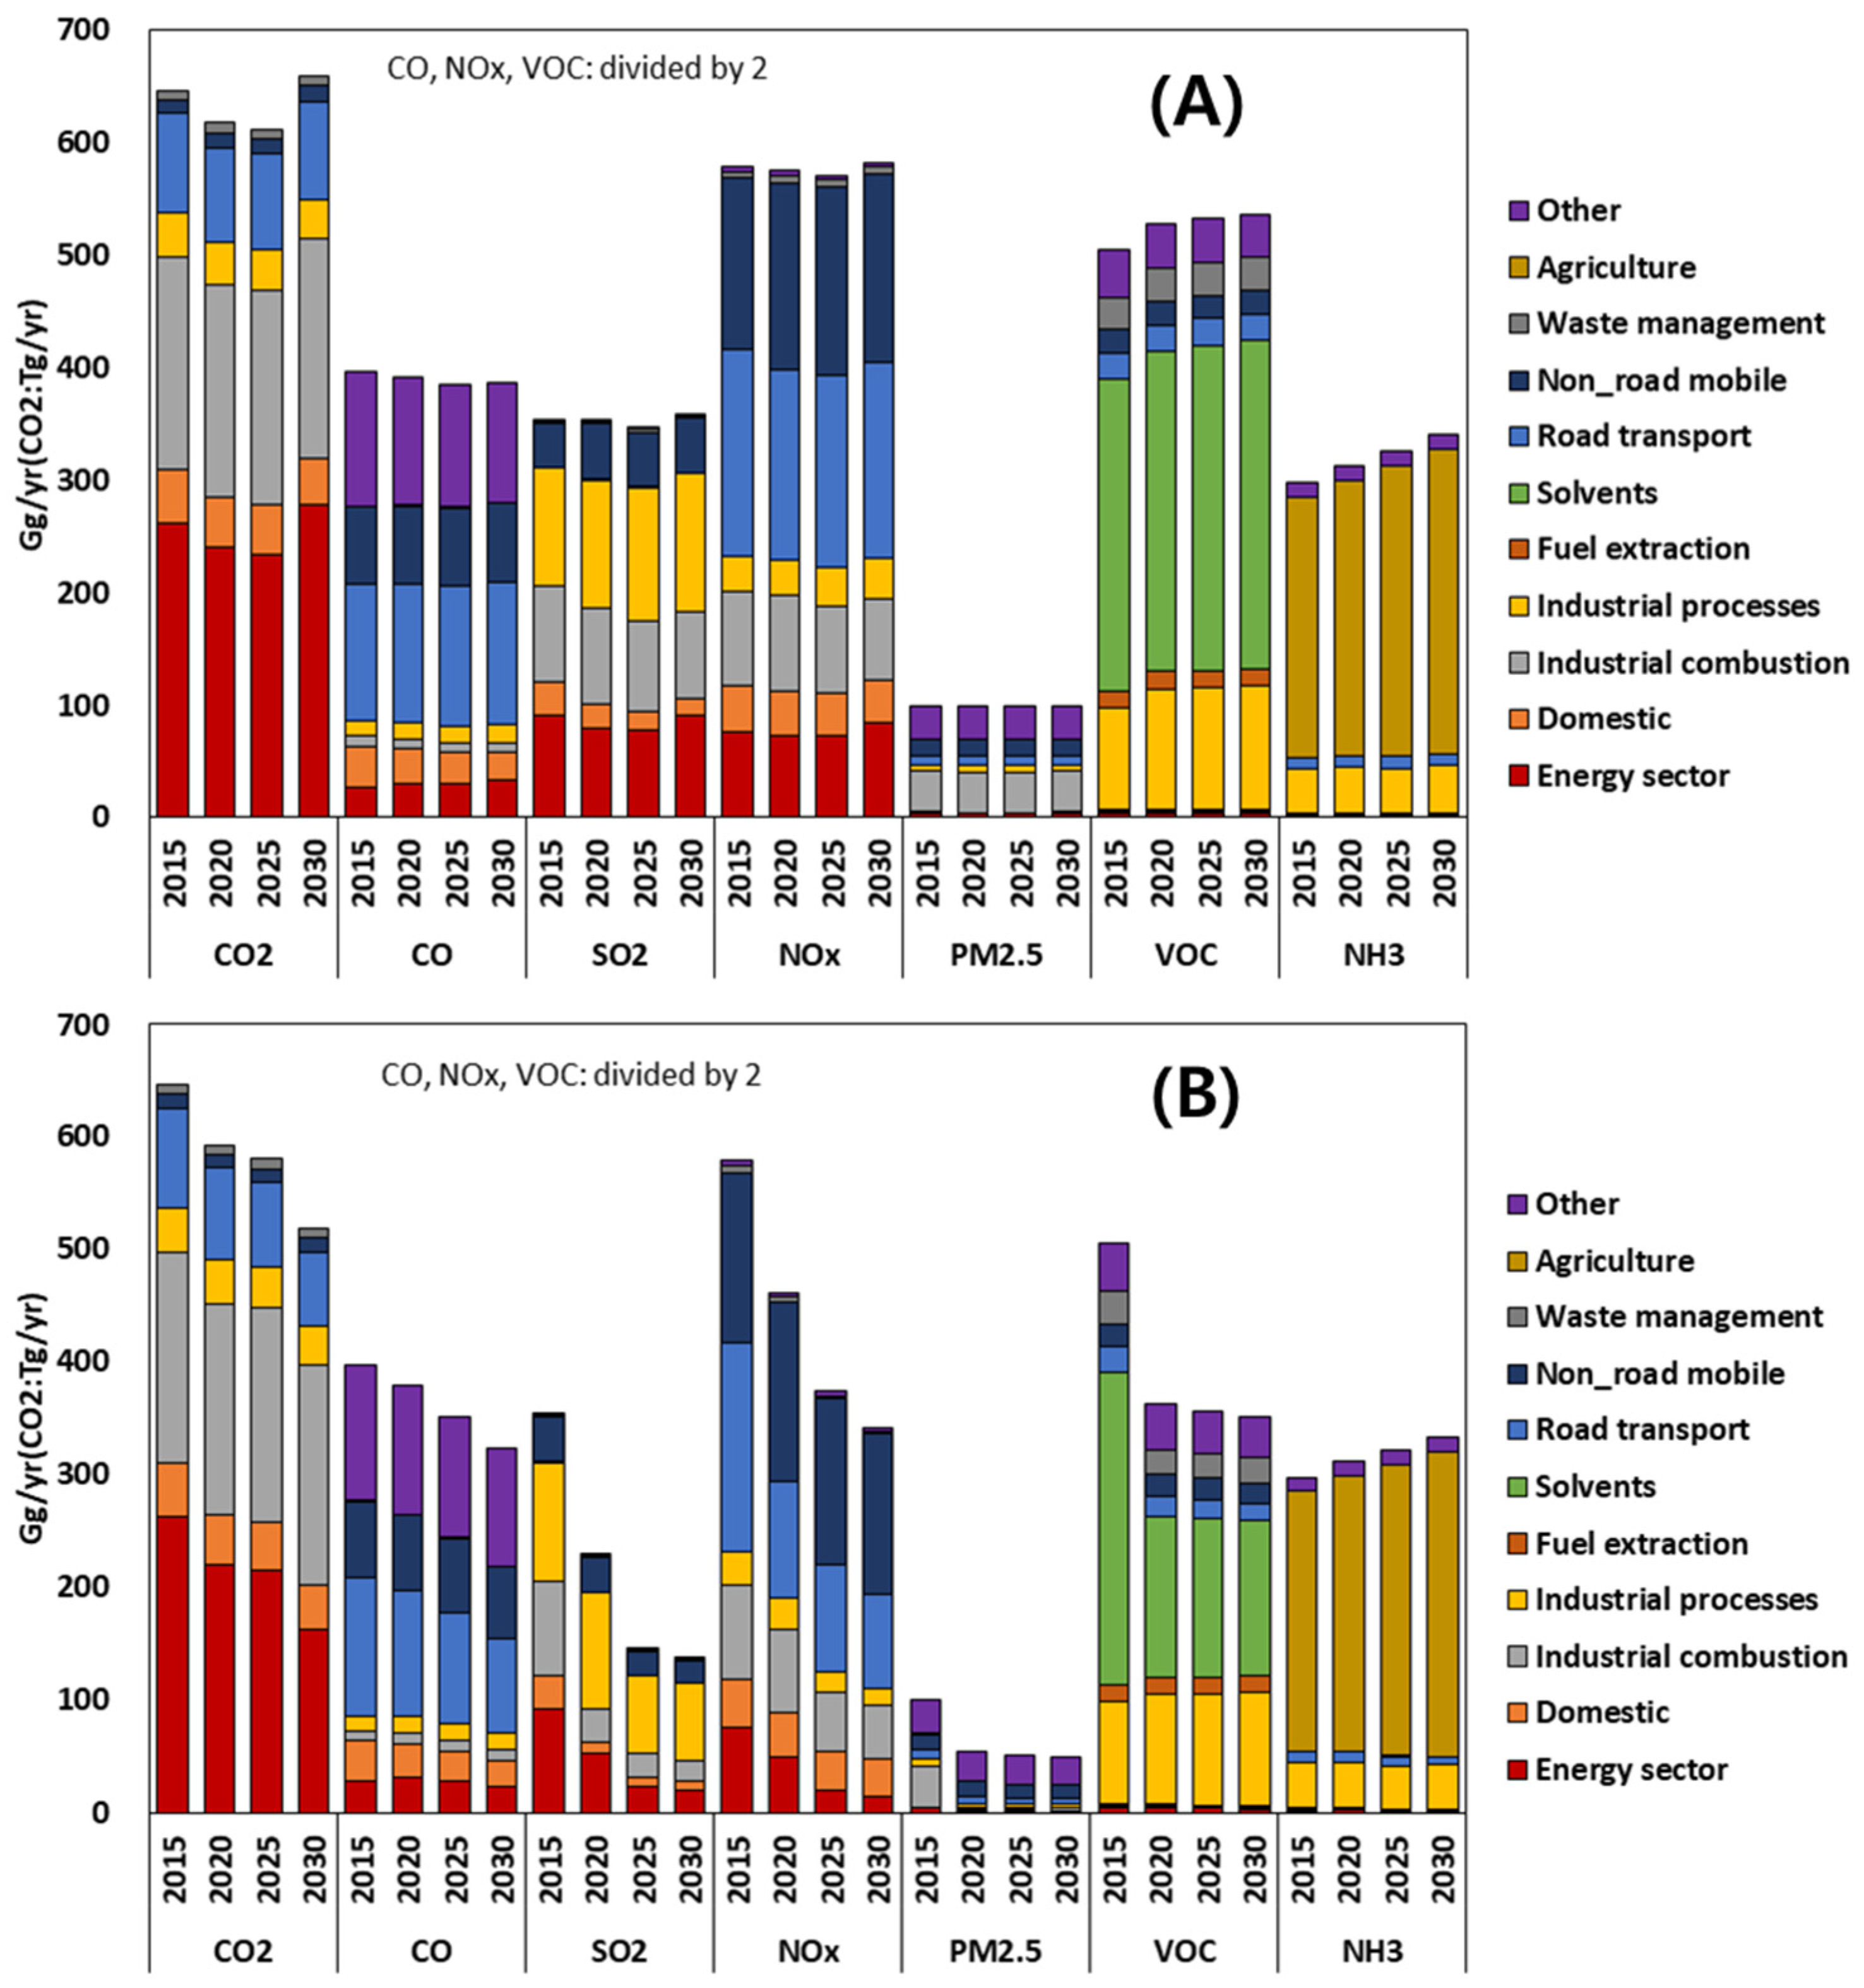
The regional, pollutant, and sector-specific emission estimates for the NFC-CPS and CLE-NPS scenarios, estimated using GUIDE in Jang et al., 2024, were used as input data for CMAQ. Here, the trends in emissions of air pollutants by sector for each scenario were examined. As shown in
Figure 5A, the NFC-CPS scenario shows a decrease in CO
2, CO, SO
2, NOx, and PM
2.5 emissions until 2025, followed by an increasing trend. In the case of VOC and NH
3, there is a steady increase in emissions. As shown in
Figure 5B, the CLE-NPS scenario indicates a decreasing trend in CO
2, CO, SO
2, NOx, PM
2.5, and VOC emissions, while NH
3 emissions show a continuous increasing trend.
When comparing
Figure 5A and
Figure 5B, it can be observed that the future emissions of air pollutants in the CLE-NPS scenario are lower than those in the NFC-CPS scenario. This reduction is because of the emission reduction policies in the CLE-NPS scenario, such as strengthening emission standards in the industrial combustion sector, converting anthracite coal to cleaner fuels, and strengthening solid fuel standards for industrial sites. As a result, the emissions of NOx, SO
2 (precursors of PM
2.5), and primary PM
2.5 are analyzed to decrease. Consequently, the simulation of future air quality in Korea is expected to show that the PM
2.5 concentration in the CLE-NPS scenario will be lower than that in the NFC-CPS scenario.
3.3. Modeling of Future Air Quality
3.3.1. Air Quality Modeling Method
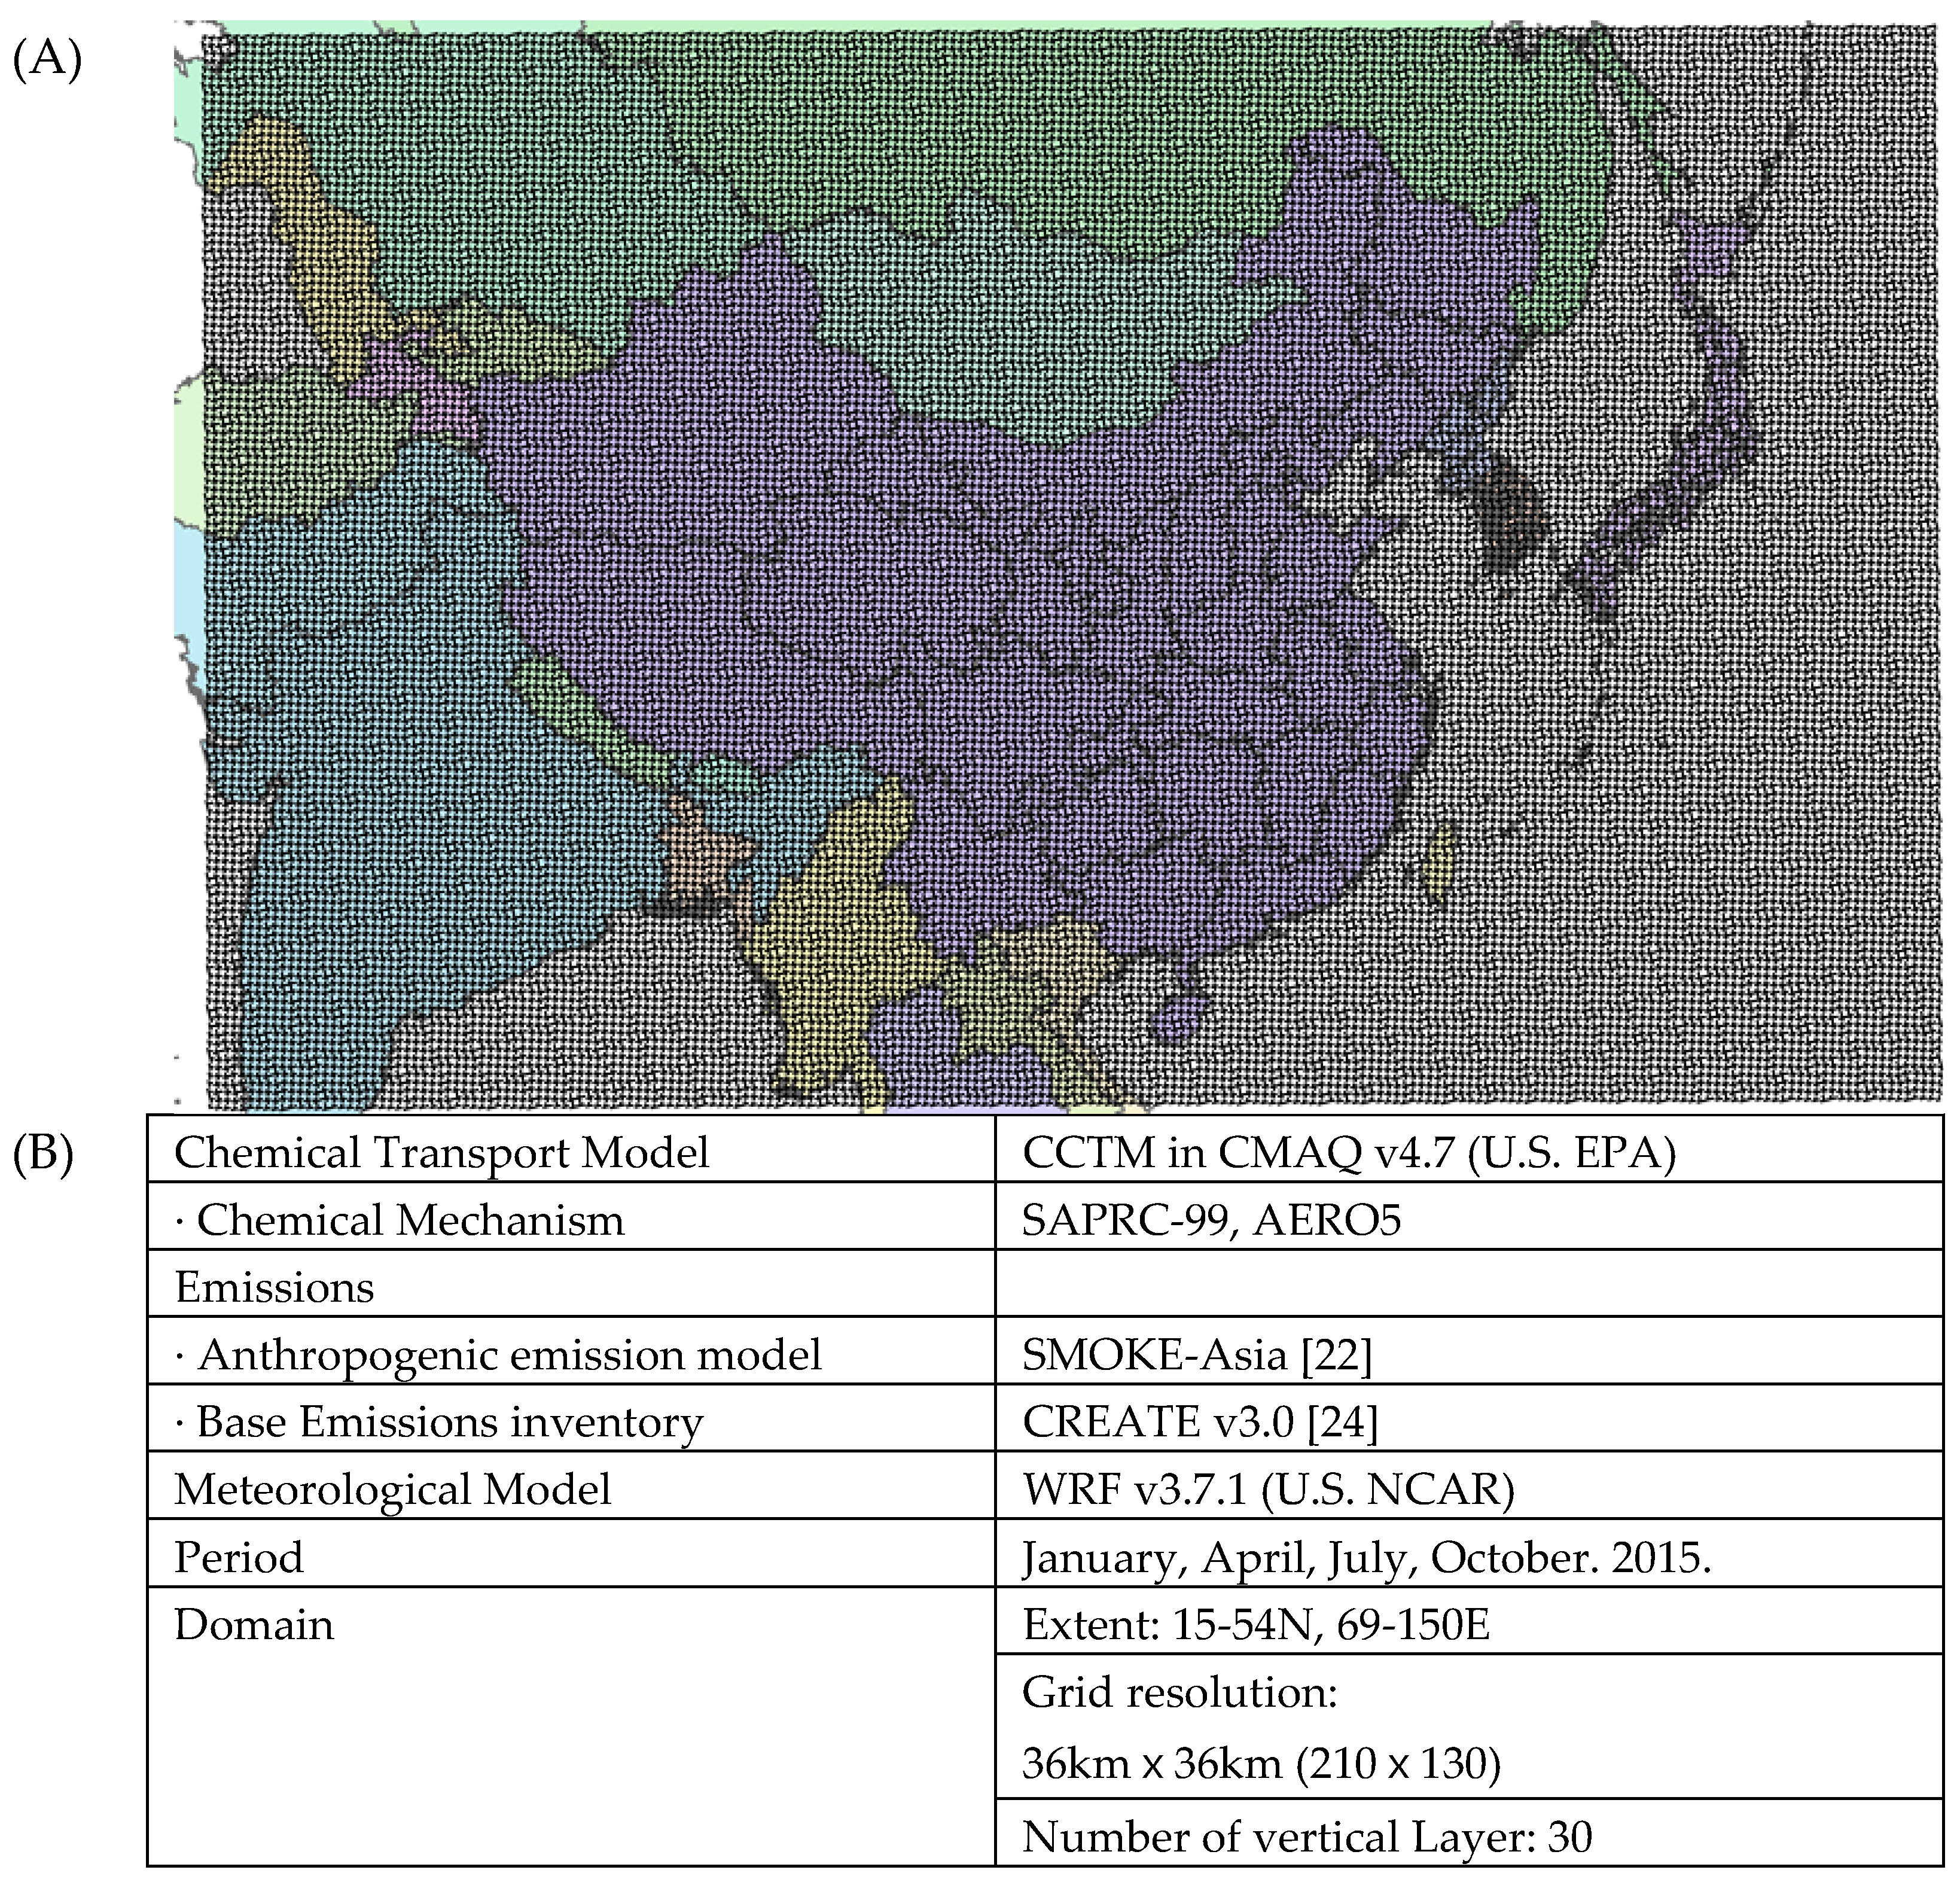
To estimate the air quality concentrations in Korea in response to changes in emissions, it is necessary to consider the geographical influence of China, which is located upwind of Korea. Therefore, modeling was conducted using a 3D-CTM and a meteorological model over the domain shown in
Figure 6A. The domain covers the East Asian region (15-54N, 69-150E) and is set with a horizontal grid resolution of 36ⅹ36 km², including a total of 210ⅹ130 grids within the entire domain.
The modeling framework for this domain is illustrated in
Figure 6B. Emission processing was conducted using SMOKE-Asia, an adaptation of the Sparse Matrix Operator Kernel Emissions (SMOKE; U.S EPA) model developed for Asia [
22]. To estimate air quality concentrations, CMAQ was utilized. To utilize CMAQ, the previously written emissions (
Section 3.2.2) were converted into modeling emissions using the latest study’s spatiotemporal allocation data and chemical speciation data [
23]. The simulation periods were selected to represent winter, spring, summer, and autumn, with January, April, July, and October chosen as the representative months. The concentrations were simulated at hourly intervals.
3.3.2. PM2.5 Concentration Estimation Results for South Korea by Scenario
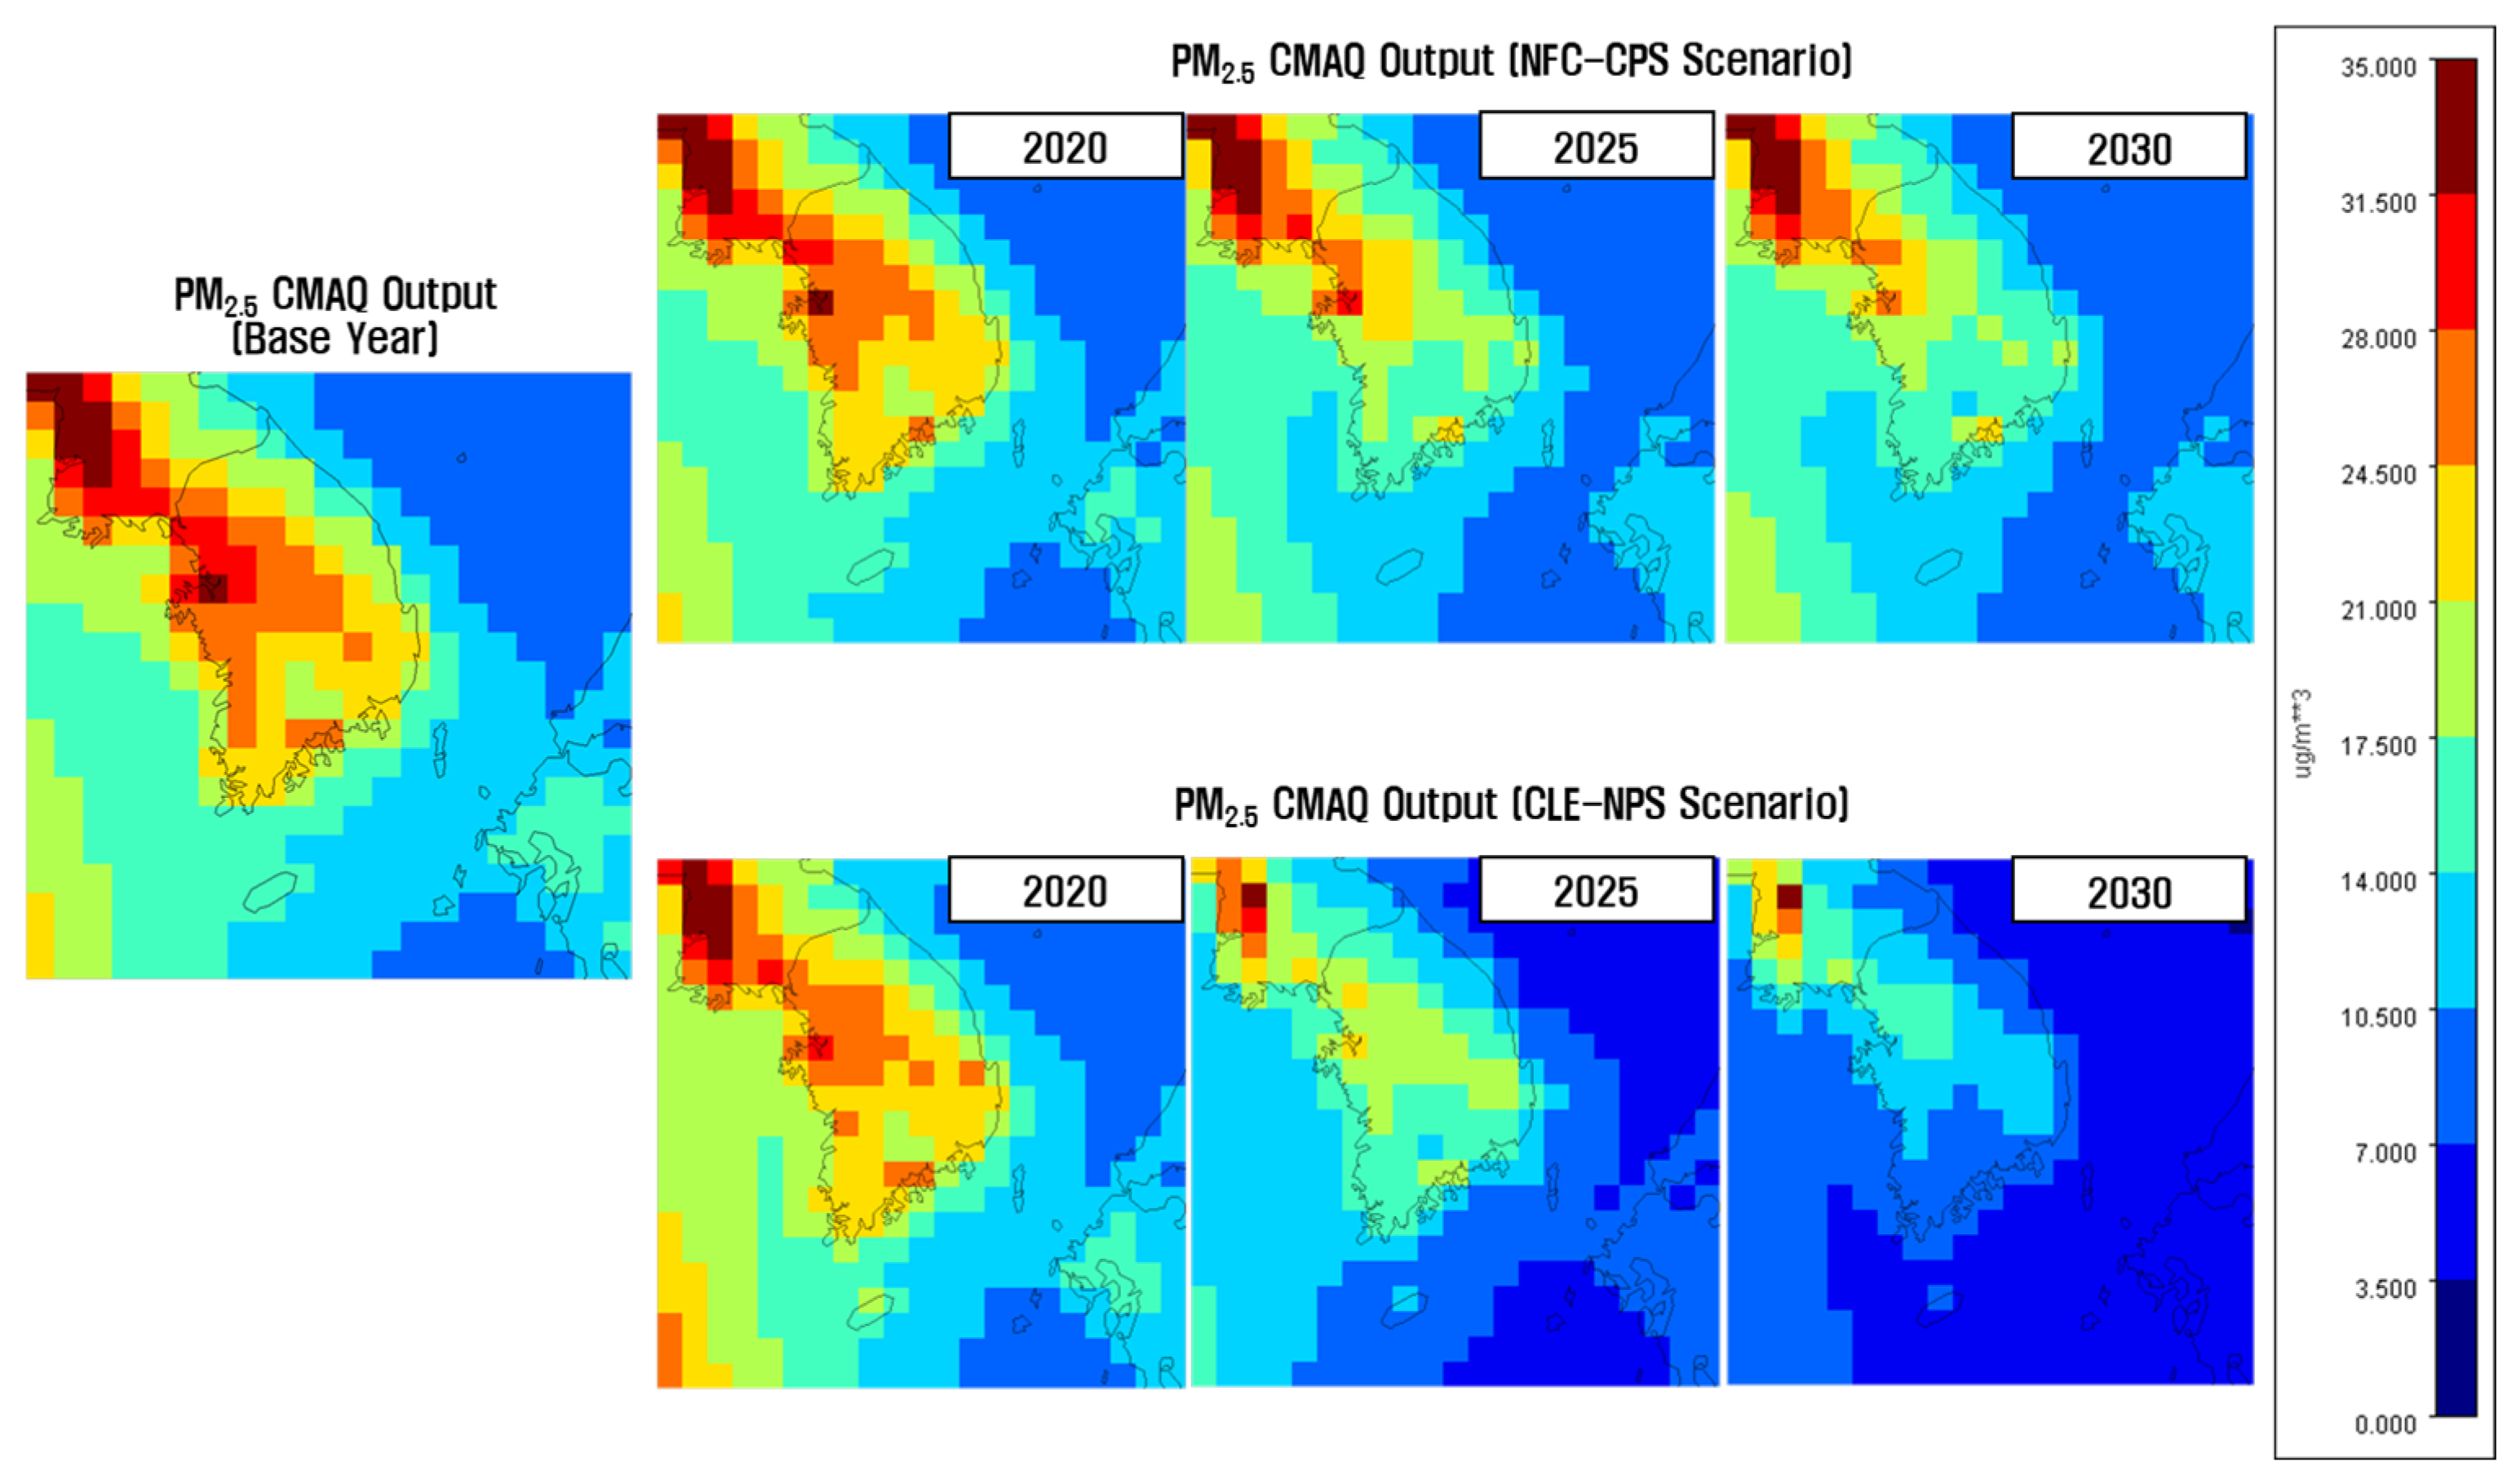
Figure 7 shows the PM
2.5 concentration simulation results for the base year (2015) and for the years 2020, 2025, and 2030 under different scenarios. As policies are implemented, differences between the two scenarios can be observed; however, in both the NFC-CPS and CLE-NPS scenarios, PM
2.5 concentrations in Korea are expected to decrease by 2030. The CLE-NPS scenario, with relatively stronger policies, shows more significant improvements in PM
2.5 concentrations. The average PM
2.5 concentration in Korea for the base year is 22.6 µg/m³. In the NFC-CPS scenario, concentrations are projected to decrease to 21.9 µg/m³ in 2020, 18.0 µg/m³ in 2025, and 17.0 µg/m³ in 2030. In contrast, the CLE-NPS scenario shows concentrations decreasing more rapidly, with projections of 21.3 µg/m³ in 2020, 16.4 µg/m³ in 2025, and 11.6 µg/m³ in 2030. This indicates a more pronounced reduction in PM
2.5 concentrations under the CLE-NPS scenario compared to the NFC-CPS scenario. The more rapid decrease in the CLE-NPS scenario is consistent with the reductions in NOx, SO
2, and primary PM
2.5 emissions explained in the emission changes discussed in
Section 3.2.2.
Using the grid-based future concentration estimation results by scenario, the average values for Korea as a whole and for the 17 regions were calculated, as summarized in
Table 1. Changes in PM
2.5 concentrations compared to the base year were calculated for the 17 regions and are presented in the table in
Table A2. The average concentration for Korea in the base year is 22.6 µg/m³. By 2030, under the NFC-CPS scenario, it was projected to decrease to 17.0 µg/m³, about 75% of the base year value. In contrast, the CLE-NPS scenario shows a reduction to 11.6 µg/m³, about 51% of the base year value.
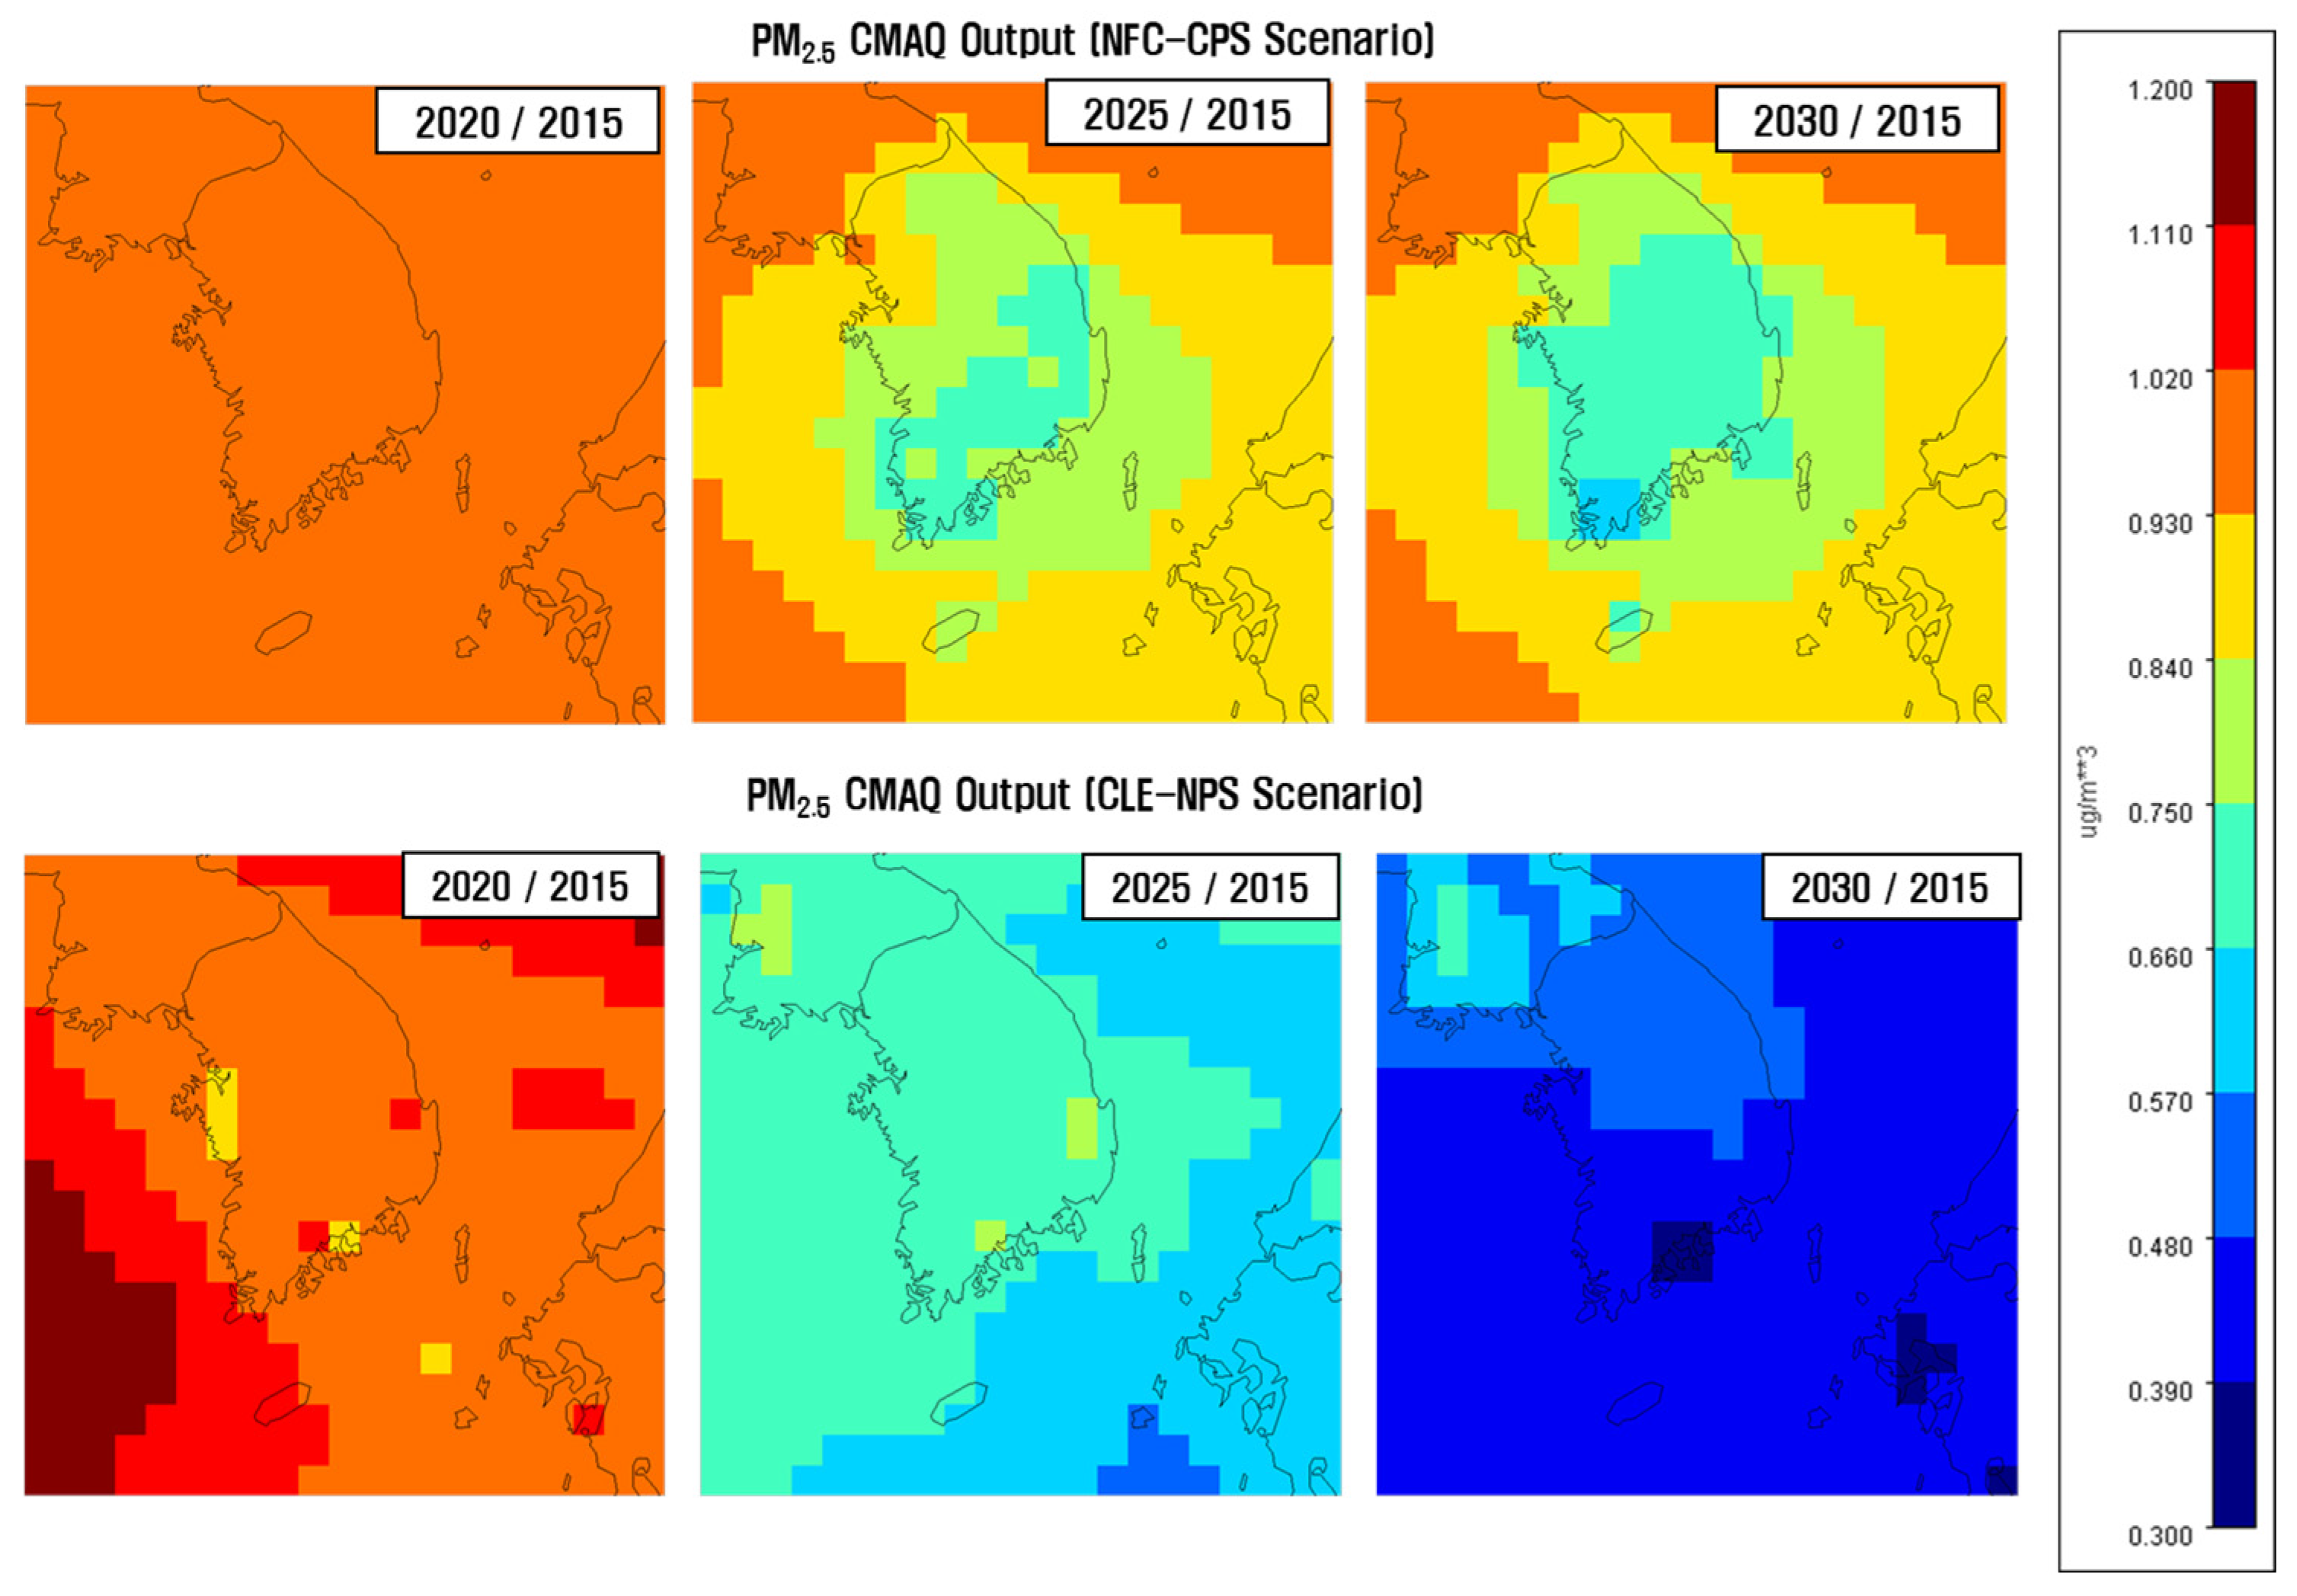
Under the NFC-CPS scenario, the concentrations in all regions were reduced to 67% to 88% of the base year by 2030, indicating a relatively modest decrease. However, under the CLE-NPS scenario, all regions were projected to have PM
2.5 concentration reduced to 38% to 61% of the base year, indicating a much more significant reduction. This can be visually confirmed in the figure in
Figure A2.
4. Future Health Impact
4.1. Health Impact Analysis Method
4.1.1. BenMAP Equation
The PM
2.5 concentration data calculated for each scenario were used to quantify regional health impacts using the Environmental Benefits Mapping and Analysis Program (BenMAP) formula [
25]. BenMAP formula is as follows:
ΔƳ: Change in the health effect
Y0: Baseline incidence rates for specific health endpoint per unit population
Incidence: Baseline incidence rates
Population: Exposed population
β: C-R Function coefficient value
ΔX: Concentration
Here, Incidence refers to the mortality or morbidity rate of specific health effects in the base year, Population refers to the number of people exposed, and β represents the concentration-response (C-R) function coefficient. ΔX denotes the level of air pollution concentration, and ΔY signifies the change in health impacts due to this pollution. Ultimately, ΔY represents the number of premature deaths and cases of illness attributable to air pollution [
26]. Since health benefit estimation is based on the target population, the data used for estimating health benefits in this study are presented in
Table 2.
Among the important factors in the health impact function are Incidence and Population, which are significantly influenced by changes due to population aging and are proportionally related to the health impact function. Therefore, when analyzing the impact of concentration changes resulting from future emission projections, these factors are crucial and were investigated and applied using Korean official data. ΔX represents the level of change in PM2.5 concentration, which was estimated and applied based on the CMAQ results for each scenario.
4.1.2. Incidence
The health impact function estimates the percent change in health impacts resulting from changes in pollutant concentration. To estimate the absolute change in the number of cases using this function, data on incidence or prevalence rates for the given health impact endpoint is needed. Incidence rate refers to the number of health impacts (such as deaths or diseases) occurring per unit of population over a specified period, while prevalence rate refers to the proportion of individuals in a population experiencing a specific chronic condition.
In this study, the Korea Health Insurance Corporation’s big data was used for prevalence and incidence rates. Mortality data was obtained from the Statistics Korea’s 2015 mortality statistics, categorized by cause of death and age group (Health Insurance Review & Assessment Service, 2015, Health and Medical Big Data Open System,
Table A3).
4.1.3. Population
When quantifying health impacts, changes in the future age distribution of Korea were considered to analyze the effects of aging on future health outcomes. In South Korea, where aging is currently progressing, failing to account for this could lead to inaccurate predictions of health impacts due to future changes in concentration. Additionally, the population is densely concentrated in large cities, and it has been observed that air quality concentrations are higher in more urbanized areas. Therefore, establishing a future population database at the municipal level to estimate domestic health impacts is crucial. Consequently, this study considered both municipal-level population distribution and the effects of aging in its analysis.
4.1.4. C-R Function Coefficient Value
The health impact function calculates changes in health impacts due to variations in air pollution concentrations and is determined by the estimation method of the Concentration-Response Function (C-R Function), which represents the correlation between pollutant concentration (X) and health impacts on the target population (Y). Unless the health impact function is directly calculated for a specific research purpose, it typically uses results from existing epidemiological studies on air pollution (KEITI, 2020). Related research includes the 2020 GUIDE development study for Korea, which used the C-R values summarized in KEITI, 2020. These values are detailed in
Table 3.
4.2. Analysis of Health Impact Due to PM2.5 in South Korea by Scenario
Using the method described above, the number of premature deaths by region and year for each scenario was estimated. The results without considering aging are shown in
Table 4, and the results considering aging are shown in
Table 5.
First, as shown in
Table 4, for the results without considering aging, the total number of premature deaths due to cardiovascular diseases and all other causes from PM
2.5 in the base year is 18,413. Among these, 14,442 deaths are due to cardiovascular diseases, accounting for approximately 80% of all premature deaths. The future scenarios show a gradual decrease in the projected number of premature deaths. In contrast,
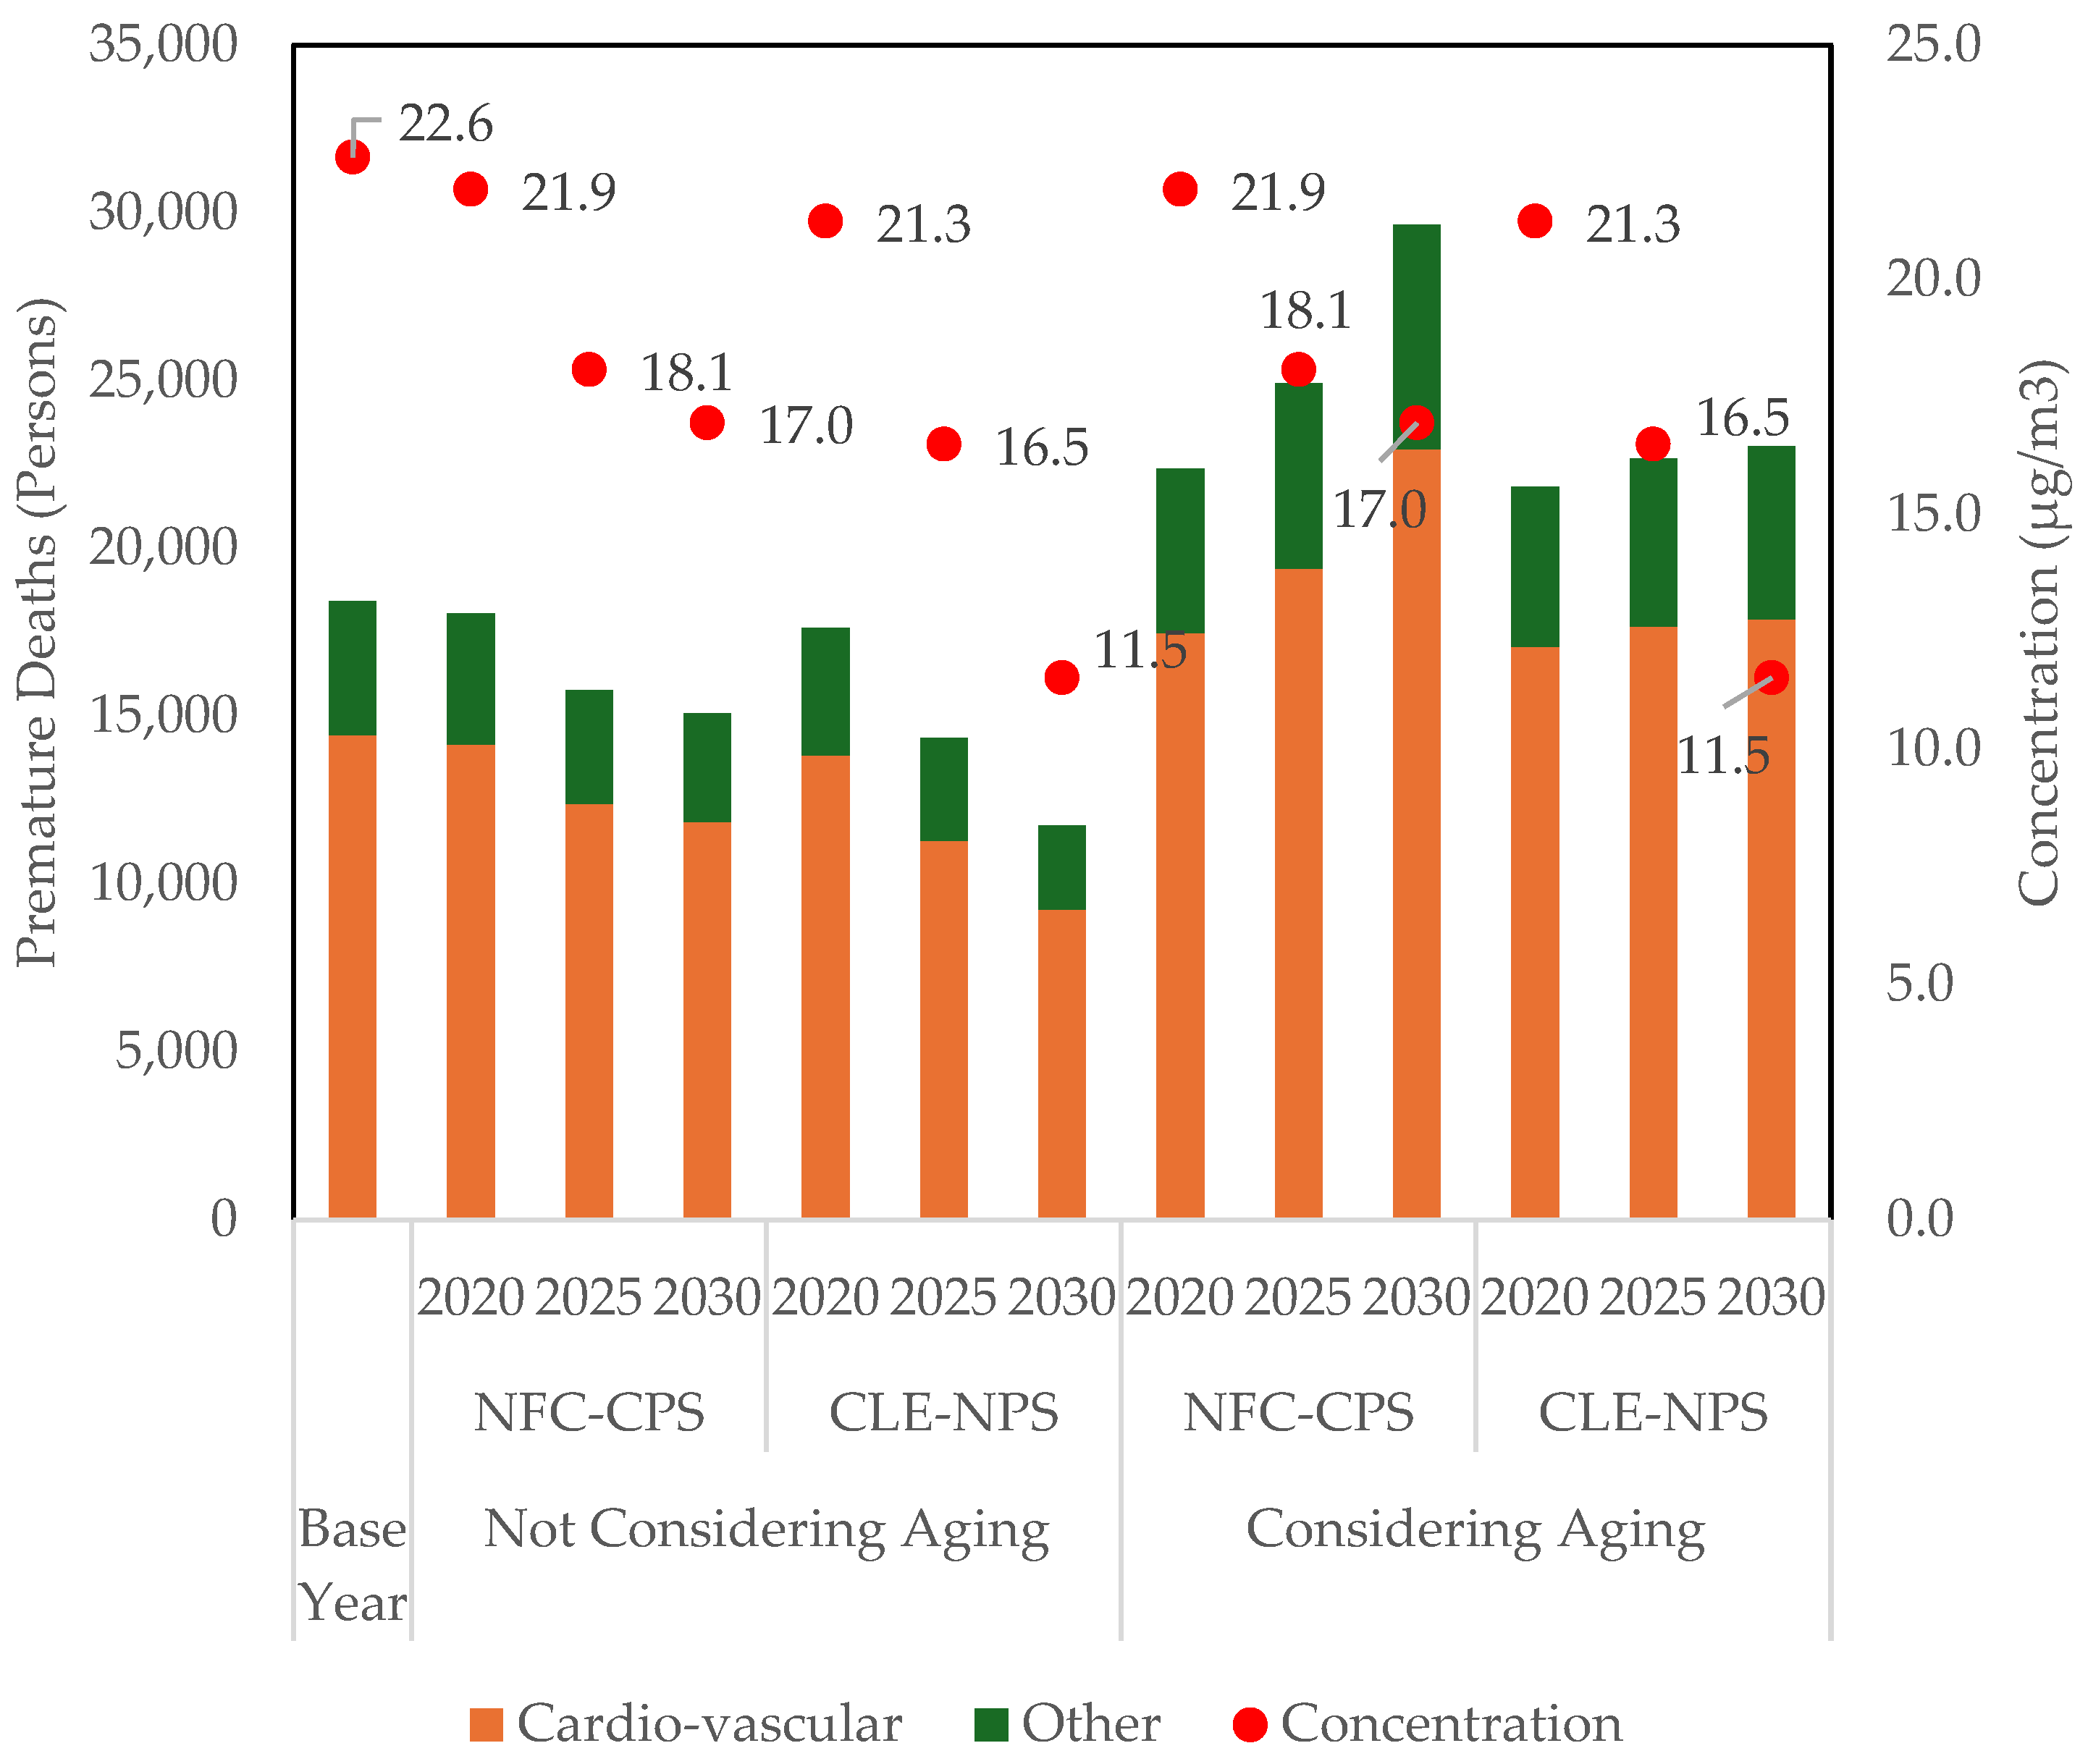
Table 5 shows the results when the impact of aging is considered. For the NFC-CPS scenario in 2030, the number of premature deaths due to cardiovascular diseases is 11,853 without considering aging, but with aging considered, the number increases to 22,962, nearly double. Similarly, for the CLE-NPS scenario, the number of premature deaths due to cardiovascular diseases in 2030 is 9,250 without considering aging and 17,894 when aging is considered. This demonstrates that while the health impacts are estimated based on the same concentration changes, the results vary significantly depending on whether aging rates are reflected.
Figure 8 shows the predicted number of premature deaths based on changes in the average PM
2.5 concentration in Korea by scenario and year, with and without considering the impact of aging. The graph displays results on the left without considering the aging pattern and on the right with the aging pattern considered. On the left side, it can be observed that in both NFC-CPS and CLE-NPS scenarios, the numbers of premature deaths decrease as PM
2.5 concentrations decrease. Moreover, in the CLE-NPS scenario, where more stringent reduction policies are applied, the number of premature deaths decreases more significantly due to the more rapid improvement in concentration. This suggests that air quality policies have been effective in reducing health impacts.
However, the right side of the graph, which considers the effects of aging, shows that despite the same decrease in concentration, the number of premature deaths increases. It is observed that in the CLE-NPS scenario, where stronger air quality policies are applied, the increase in premature deaths is less when aging is considered. This indicates that in the future, with an increasing elderly population that is more sensitive to air quality impacts, air quality policies need to be more stringent to achieve the expected reduction in health impacts.
5. Conclusions
In this study, to estimate the health impacts of future air pollutants in Korea, annual average PM2.5 concentrations were calculated to quantify long-term exposure impacts. For this purpose, future air pollutant emission scenarios for Korea were created and used to run the CMAQ model, which was then employed to simulate future PM2.5 concentrations. Based on the estimated concentrations, the BenMAP formula was used to quantify health impacts.
Two future emission scenarios were established: the base scenario (NFC-CPS), which maintains existing policies, and the control scenario (CLE-NPS), which includes additional reduction policies. Even in the base scenario, where policies are maintained until 2030, a reduction in emissions and PM2.5 concentrations was predicted. In the control scenario, where additional reduction policies for primary PM2.5 and its precursors are implemented, a greater reduction in emissions and PM2.5 concentrations was predicted.
In the baseline year, Korea’s PM2.5 concentration was 22.6 µg/m³. Under the NFC-CPS scenario, which maintains current emission reduction efforts, future air quality is expected to improve to a PM2.5 concentration of 17.0 µg/m³ by 2030. However, with the additional implementation of planned policies as in the CLE-NPS scenario, the PM2.5 concentration is projected to be 11.5 µg/m³ by 2030, representing an improvement of approximately 5.5 µg/m³. This air quality improvement was analyzed for its health impact on the Korean population.
To assess the importance of accounting for future population aging, two scenarios were analyzed: one without considering aging and one with aging considered. The analysis revealed significant differences in health impact results between the two scenarios. When using the current population’s age pattern, the reduction in PM2.5 concentrations due to changes in air quality from the NFC-CPS and CLE-NPS scenarios resulted in a decrease in premature deaths. However, when considering future age patterns (aging), even with improved air quality, the health impacts were found to increase. Although PM2.5 concentrations decreased, the aging population, which is more susceptible to health effects, led to a higher number of premature deaths.
These results suggest that when studying the health impacts of future air quality improvements, it is essential to consider changes in the population age pattern. Specifically, for advanced countries like South Korea, where future aging is predicted, it is crucial to account for changes in age patterns when researching future health impacts. Additionally, as the aging population, which is more sensitive to air quality impacts, increases in the future, air quality policies will need to be more robust to achieve the expected reductions in health impacts. It implies that policy planning should recognize the potential need for more substantial reductions than merely aiming for emission reductions.
The estimates derived using the BenMAP formula can vary in reliability depending on the accuracy and relevance of the data used. The input data includes air pollutant concentrations, baseline incidence rates, and estimated population. Although this study aimed to use the most reliable input data available, uncertainties in each data set can affect the final estimate of mortality changes. Additionally, uncertainties may arise from the construction, formulation, and inputs of the air quality model, which can affect the modeled concentrations of air pollutants (Yang et al., 2019). Despite these uncertainties, the significance of this study lies in its clear demonstration that analyzing the impact of future air quality on public health requires considering both PM2.5 concentrations and population aging. The results of this study provide meaningful information for air quality management and public health protection.
Author Contributions
Conceptualization, Jinseok Kim and Jung-Hun Woo; Data curation, Jae-Bum Lee, Seung-Hee Eun, Sung-Chul Hong and Hyungah Jin; Formal analysis, Jinseok Kim and Bomi Kim; Funding acquisition, Jae-Bum Lee, Seung-Hee Eun, Sung-Chul Hong, Hyungah Jin and Jung-Hun Woo; Investigation, Jinseok Kim, Hyejung Hu and Bomi Kim; Methodology, Jinseok Kim, Youjung Jang, Seung-Jick Yoo and Jung-Hun Woo; Project administration, Jung-Hun Woo; Resources, Jung-Hun Woo; Supervision, Jung-Hun Woo; Validation, Jinseok Kim, Youjung Jang and Younha Kim; Visualization, Jinseok Kim, Youjung Jang and Bomi Kim; Writing – original draft, Jinseok Kim and Youjung Jang; Writing – review & editing, Jinseok Kim, Hyejung Hu and Jung-Hun Woo.
Funding
“This work was supported by the Korea Environment Industry & Technology Institute(KEITI) through Project for developing an observation-based GHG emissions geospatial information map, funded by Korea Ministry of Environment(MOE)(RS-2023-00232066)”, “This work was supported by Korea Environmental Industry & Technology Institute(KEITI) through Climate Change R&D Project for New Climate Regime., funded by Korea Ministry of Environment(MOE)(RS-2022-KE002096)” and “This work was supported by a grant from the National Institute of Environmental Research (NIER), funded by the Ministry of Environment (MOE) of the Republic of Korea (NIER-2024-01-02-033).”
Institutional Review Board Statement
Not applicable.
Informed Consent Statement
Not applicable.
Data Availability Statement
The original contributions presented in the study are included in the article/supplementary material, further inquiries can be directed to the corresponding author/s.
Conflicts of Interest
The authors declare no conflicts of interest.
Appendix A
Table A1.
Population in 2015 and projected population in 2020, 2025 and 2030 (KOSIS, 2017) (Unit: Persons).
Table A1.
Population in 2015 and projected population in 2020, 2025 and 2030 (KOSIS, 2017) (Unit: Persons).
| Region |
NFC-CPS |
CLE-NPS |
NFC-CPS |
CLE-NPS |
| South Korea |
51,529,338 |
51,973,817 |
52,609,988 |
52,941,342 |
| A |
Seoul |
10,022,181 |
9,635,114 |
9,545,279 |
9,428,800 |
| B |
Incheon |
2,925,815 |
2,978,706 |
3,079,506 |
3,151,654 |
| C |
Gyeonggi-do |
12,522,606 |
13,220,552 |
13,644,535 |
13,900,568 |
| D |
Gangwon-do |
1,549,507 |
1,531,889 |
1,549,909 |
1,569,101 |
| E |
Busan |
3,513,777 |
3,396,020 |
3,341,609 |
3,281,203 |
| F |
Ulsan |
1,173,534 |
1,172,306 |
1,185,090 |
1,188,098 |
| G |
Daegu |
2,487,829 |
2,446,239 |
2,408,834 |
2,366,938 |
| H |
Gwangju |
1,472,199 |
1,496,093 |
1,491,177 |
1,478,923 |
| I |
Daejeon |
1,518,775 |
1,521,598 |
1,541,362 |
1,556,008 |
| J |
Sejong |
210,884 |
377,391 |
428,161 |
472,914 |
| K |
Chungcheongnam-do |
2,077,649 |
2,203,891 |
2,291,157 |
2,363,022 |
| L |
Chungcheongbuk-do |
1,583,952 |
1,629,704 |
1,672,870 |
1,709,661 |
| M |
Gyeongsangnam-do |
3,364,702 |
3,385,992 |
3,414,375 |
3,424,536 |
| N |
Gyeongsangbuk-do |
2,702,826 |
2,684,814 |
2,690,815 |
2,693,747 |
| O |
Jeollanam-do |
1,908,996 |
1,793,547 |
1,787,283 |
1,787,400 |
| P |
Jeollabuk-do |
1,869,711 |
1,823,507 |
1,815,361 |
1,809,662 |
| Q |
Jeju |
624,395 |
676,454 |
722,665 |
759,107 |
Figure A1.
Population change rate by region compared to 2015 (A: 2020, B: 2025, C: 2030).
Figure A1.
Population change rate by region compared to 2015 (A: 2020, B: 2025, C: 2030).
Table A2.
Change in PM2.5 Concentration by region, year, and scenario (Unit: Ratio).
Table A2.
Change in PM2.5 Concentration by region, year, and scenario (Unit: Ratio).
| Year |
2015 |
2020 |
2025 |
2030 |
| Scenario |
Base
(µg/m3)
|
NFC-CPS |
CLE-NPS |
NFC-CPS |
CLE-NPS |
NFC-CPS |
CLE-NPS |
| South Korea |
22.61 |
0.97 |
0.94 |
0.80 |
0.73 |
0.75 |
0.51 |
| Seoul |
27.74 |
0.98 |
0.97 |
0.91 |
0.85 |
0.87 |
0.56 |
| Incheon |
22.03 |
0.98 |
0.95 |
0.90 |
0.83 |
0.88 |
0.55 |
| Gyeonggi-do |
27.04 |
0.98 |
0.95 |
0.87 |
0.72 |
0.82 |
0.55 |
| Gangwon-do |
19.80 |
0.89 |
0.87 |
0.72 |
0.72 |
0.68 |
0.53 |
| Busan |
22.16 |
0.96 |
0.95 |
0.78 |
0.70 |
0.73 |
0.36 |
| Ulsan |
23.54 |
0.96 |
0.94 |
0.74 |
0.75 |
0.69 |
0.38 |
| Daegu |
24.26 |
0.95 |
0.94 |
0.71 |
0.69 |
0.67 |
0.48 |
| Gwangju |
25.52 |
0.97 |
0.96 |
0.78 |
0.71 |
0.72 |
0.38 |
| Daejeon |
25.96 |
0.97 |
0.95 |
0.79 |
0.70 |
0.73 |
0.45 |
| Sejong |
20.46 |
0.98 |
0.90 |
0.81 |
0.70 |
0.77 |
0.61 |
| Chungcheongnam-do |
23.63 |
0.97 |
0.92 |
0.80 |
0.71 |
0.76 |
0.49 |
| Chungcheongbuk-do |
25.69 |
0.98 |
0.93 |
0.78 |
0.73 |
0.72 |
0.52 |
| Gyeongsangnam-do |
20.46 |
0.96 |
0.92 |
0.76 |
0.70 |
0.72 |
0.44 |
| Gyeongsangbuk-do |
21.36 |
0.97 |
0.95 |
0.76 |
0.71 |
0.71 |
0.51 |
| Jeollanam-do |
18.37 |
0.96 |
0.95 |
0.78 |
0.71 |
0.76 |
0.47 |
| Jeollabuk-do |
22.04 |
0.96 |
0.94 |
0.75 |
0.69 |
0.71 |
0.45 |
| Jeju |
14.36 |
1.00 |
1.00 |
0.85 |
0.66 |
0.84 |
0.44 |
Figure A2.
PM2.5 Concentration changes by year and scenario.
Figure A2.
PM2.5 Concentration changes by year and scenario.
Table A3.
Number of deaths cause by age in 2015.
Table A3.
Number of deaths cause by age in 2015.
| Class |
Disease |
Age group |
Deaths |
Population by age |
Death rate |
| Mortality |
Circulatory Diseases |
0TO4 |
35 |
2,192,603 |
0.0016% |
| 5TO9 |
15 |
2,287,123 |
0.0007% |
| 10TO14 |
14 |
2,288,612 |
0.0006% |
| 15TO19 |
31 |
3,056,728 |
0.0010% |
| 20TO24 |
53 |
3,400,634 |
0.0016% |
| 25TO29 |
94 |
3,068,970 |
0.0031% |
| 30TO34 |
187 |
3,415,599 |
0.0055% |
| 35TO39 |
376 |
3,852,007 |
0.0098% |
| 40TO44 |
729 |
4,031,799 |
0.0181% |
| 45TO49 |
1,207 |
4,369,603 |
0.0276% |
| 50TO54 |
1,746 |
4,030,564 |
0.0433% |
| 55TO59 |
2,585 |
4,076,050 |
0.0634% |
| 60TO64 |
2,924 |
3,010,386 |
0.0971% |
| 65TO69 |
3,597 |
2,179,524 |
0.1650% |
| 70TO74 |
5,840 |
1,736,294 |
0.3363% |
| 75TO79 |
9,711 |
1,418,480 |
0.6846% |
| 80TO84 |
12,256 |
880,699 |
1.3916% |
| 85TO89 |
10,715 |
398,827 |
2.6866% |
| 90UP |
8,262 |
157,808 |
5.2355% |
| Respiratory Diseases |
0TO4 |
33 |
2,192,603 |
0.0015% |
| 5TO9 |
11 |
2,287,123 |
0.0005% |
| 10TO14 |
9 |
2,288,612 |
0.0004% |
| 15TO19 |
10 |
3,056,728 |
0.0003% |
| 20TO24 |
12 |
3,400,634 |
0.0004% |
| 25TO29 |
26 |
3,068,970 |
0.0008% |
| 30TO34 |
33 |
3,415,599 |
0.0010% |
| 35TO39 |
53 |
3,852,007 |
0.0014% |
| 40TO44 |
84 |
4,031,799 |
0.0021% |
| 45TO49 |
168 |
4,369,603 |
0.0038% |
| 50TO54 |
336 |
4,030,564 |
0.0083% |
| 55TO59 |
552 |
4,076,050 |
0.0135% |
| 60TO64 |
935 |
3,010,386 |
0.0311% |
| 65TO69 |
1,400 |
2,179,524 |
0.0642% |
| 70TO74 |
2,618 |
1,736,294 |
0.1508% |
| 75TO79 |
4,931 |
1,418,480 |
0.3476% |
| 80TO84 |
6,742 |
880,699 |
0.7655% |
| 85TO89 |
6,267 |
398,827 |
1.5714% |
| 90UP |
5,178 |
157,808 |
3.2812% |
References
- Miller, L.; Xu, X. Ambient PM2.5 Human Health Effects—Findings in China and Research Directions. Atmosphere 2018, 9, 424. [Google Scholar] [CrossRef]
- Pope Iii, C. A.; Burnett, R. T.; Thun, M. J.; Calle, E. E.; Krewski, D.; Ito, K.; Thurston, G. D. Lung cancer, cardiopulmonary mortality, and long-term exposure to fine particulate air pollution. Jama 2002, 287(9), 1132–1141. [Google Scholar] [CrossRef] [PubMed]
- Dominici, F.; Peng, R. D.; Bell, M. L.; Pham, L.; McDermott, A.; Zeger, S. L.; Samet, J. M. Fine particulate air pollution and hospital admission for cardiovascular and respiratory diseases. Jama 2006, 295(10), 1127–1134. [Google Scholar] [CrossRef] [PubMed]
- Li, P.; Xin, J.; Wang, Y.; Wang, S.; Li, G.; Pan, X.; Liu, Z.; Wang, L. The acute effects of fine particles on respiratory mortality and morbidity in Beijing, 2004–2009. Environmental Science and Pollution Research 2013, 20, 6433–6444. [Google Scholar] [CrossRef] [PubMed]
- Laden, F.; Schwartz, J.; Speizer, F. E.; Dockery, D. W. Reduction in fine particulate air pollution and mortality: extended follow-up of the Harvard Six Cities study. American journal of respiratory and critical care medicine 2006, 173(6), 667–672. [Google Scholar] [CrossRef] [PubMed]
- Zanobetti, A.; Schwartz, J. The effect of fine and coarse particulate air pollution on mortality: a national analysis. Environmental health perspectives 2009, 117, 898–903. [Google Scholar] [CrossRef] [PubMed]
- Pope III, C. A., Ezzati, M., & Dockery, D. W. Fine-particulate air pollution and life expectancy in the United States. New England Journal of Medicine 2009, 360, 376–386. [CrossRef] [PubMed]
- Baxter, L. K.; Dionisio, K. L.; Burke, J.; Ebelt Sarnat, S.; Sarnat, J. A.; Hodas, N.; Rich, D. Q.; Turpin, B. J.; Jones, R. R.; Mannshardt, E.; Kumar, N.; Beevers, S. D.; Özkaynak, H. Exposure prediction approaches used in air pollution epidemiology studies: key findings and future recommendations. Journal of exposure science & environmental epidemiology 2013, 23, 654–659. [Google Scholar]
- Shi, L. , Zanobetti, A., Kloog, I., Coull, B. A., Koutrakis, P., Melly, S. J., & Schwartz, J. D. (2016). Low-concentration PM2. 5 and mortality: estimating acute and chronic effects in a population-based study. Environmental health perspectives, 124(1), 46-52.
- Yang, P. , Zhang, Y., Wang, K., Doraiswamy, P., & Cho, S. H. (2019). Health impacts and cost-benefit analyses of surface O3 and PM2. 5 over the US under future climate and emission scenarios. Environmental research, 178, 108687. [CrossRef]
- Korea Environmental Industry and Technology Institute (KEITI). Final Report on GHG and Air Pollutant Integrated Management Decision Support System Development, 2020 Korea Environmental Industry and Technology Institute, 2020. Ministry of Environment.
- Jang, Y.; Hu, H.; Kim, B.; Kim, Y.; Yoo, S. J.; Jang, K.; Kim, Y. K.; Jin, H.; Woo, J. H. Assessing the impact of climate and air quality policies on future emissions in Korea through quantification of control and co-control effects. Atmospheric Pollution Research 2024, 15(1), 101952. [Google Scholar] [CrossRef]
- Gouveia, N. , & Fletcher, T. Time series analysis of air pollution and mortality: effects by cause, age and socioeconomic status. Journal of Epidemiology & Community Health 2000, 54(10), 750-755. [CrossRef]
- Fischer, P.; Hoek, G.; Brunekreef, B.; Verhoeff, A.; Van Wijnen, J. Air pollution and mortality in The Netherlands: are the elderly more at risk? European respiratory journal 2003, 21(40 suppl), 34s–38s. [Google Scholar] [CrossRef]
- Filleul, L.; Le Tertre, A.; Baldi, I.; Tessier, J. F. Difference in the relation between daily mortality and air pollution among elderly and all-ages populations in southwestern France. Environmental research 2004, 94(3), 249–253. [Google Scholar] [CrossRef] [PubMed]
- Medina-Ramon, M.; Schwartz, J. Who is more vulnerable to die from ozone air pollution? Epidemiology 2008, 19, 672–679. [Google Scholar] [CrossRef]
- Wang, C. , Tu, Y., Yu, Z., & Lu, R. (2015). PM2. 5 and cardiovascular diseases in the elderly: an overview. International journal of environmental research and public health, 12(7), 8187-8197.
- Department of Economic and Social Affairs, United Nations (UN DESA). World Population Prospects 2019: Highlights (ST/ESA/SER.A/423). United Nations New York, 2019.
- Korean Statistical Information Service (KOSIS). Future Population Projection: 2015-2045, 2017. Available online: https://kostat.go.kr/board.es?mid=a10301020600&bid=207&act=view&list_no=361108 (accessed on 15 Apr 2024).
- Korean Statistical Information Service (KOSIS). Future Population Projection: 2022-2052, 2024. Available online: https://kostat.go.kr/board.es?mid=a10301020600&bid=207&act=view&list_no=431113 (accessed on 15 Apr 2024).
- Ministry of Environment (ME). The Master Plan for Air Quality Management by Region, 2019.
- Woo, J. H.; Choi, K. C.; Kim, H. K.; Baek, B. H.; Jang, M.; Eum, J. H.; Song, C. H.; Ma, Y. I.; Young, S.; Chang, L. S.; Yoo, S. H. Development of an anthropogenic emissions processing system for Asia using SMOKE. Atmospheric Environment 2012, 58, 5–13. [Google Scholar] [CrossRef]
- National Institute of Environmental Research (NIER). Final Report on Application and development of the next generation air quality forecasting model (III). 2023.
-
National Institute of Environmental Research (NIER). Final Report on Comprehensive Regional Emissions inventory for Atmospheric Transport Experiment. 2020.
- The United States Environmental Protection Agency (U.S. EPA). BenMAP User’s Manual. 2015, Available online: http://www2.epa.gov/benmap/manual-and-appendices-benmap-ce.
- Carvour, M. L.; Hughes, A. E.; Fann, N.; Haley, R. W. Estimating the health and economic impacts of changes in local air quality. American journal of public health 2018, 108(S2), S151–S157. [Google Scholar] [CrossRef] [PubMed]
- Ha, J.; Choi, Y.; Song, J.; Jeong, O.; Yang, T. A Study on Health Risk Assessment for Environmental Policies in the Areas of Climate and Atmosphere: Focused on Concentration Response Functions, 2016, Ministry of Environment, Available online, 2016. [CrossRef]
- Hoek, G.; Krishnan, R. M.; Beelen, R.; Peters, A.; Ostro, B.; Brunekreef, B.; Kaufman, J. D. Long-term air pollution exposure and cardio-respiratory mortality: a review. Environmental health 2013, 12, 1–16. [Google Scholar] [CrossRef] [PubMed]
|
Disclaimer/Publisher’s Note: The statements, opinions and data contained in all publications are solely those of the individual author(s) and contributor(s) and not of MDPI and/or the editor(s). MDPI and/or the editor(s) disclaim responsibility for any injury to people or property resulting from any ideas, methods, instructions or products referred to in the content. |
© 2024 by the authors. Licensee MDPI, Basel, Switzerland. This article is an open access article distributed under the terms and conditions of the Creative Commons Attribution (CC BY) license (http://creativecommons.org/licenses/by/4.0/).
