1. Introduction
Reactive Oxygen Species (ROS) including various radicals and non-radicals, along with other reactive species such as Reactive Nitrogen Species (RNS), are generated in the human body from both intrinsic factors (cellular metabolism, time/aging, genetics) and extrinsic factors (visible/UV radiations, pollution, nutrition and life-style). At low levels, ROS play a role in cell signaling and survival. However, at elevated levels, these highly reactive species contribute to the accumulation of macromolecular damage - impacting lipids, proteins, and DNA- and are associated with an increased risk of developing chronic diseases [
1,
2,
3]. Human cells possess an antioxidant system capable of neutralizing oxidative species, thereby maintaining cellular homeostasis essential for physiological functions [
4]. Consequently, balancing oxidants and antioxidants within a constantly changing environment is critical for health. Both endogenous and exogenous antioxidants are important for the defense against excessive ROS production. Vitamins, carotenoids and polyphenolic compounds, which humans cannot synthesize, represent potent natural antioxidants. In certain circumstances, such as inadequate dietary intake, a demanding lifestyle or compromised defense mechanisms (during exercise, sun exposure, chronic diseases or aging), supplementation with micronutrient or essential cofactors involved in redox reactions (vitamins, metal ions, and trace elements) may be necessary.
Antioxidant molecules, also referred as reductants, function by donating electrons to oxidant compounds (electron acceptors) in redox reactions. However, the definition of “antioxidant” is broad. In chemistry, antioxidants are radical scavengers that interrupt radical chain reactions involving oxygen and other substrates, while in cell biology and medicine, antioxidants refer to enzymes or organic substances capable of counteracting the harmful effects of ROS and RNS on physiological processes. Dietary antioxidants can neutralize ROS/RNS and prevent the formation of reactive species, or act as metal chelators, oxidative enzyme inhibitors and cofactors for antioxidant enzymes. In response to oxidative stress, living cells have evolved and indirect antioxidant mechanisms, such as the Nrf2-keap1-ARE pathway, can enhance the cell’s antioxidant capacity through transcriptional induction of genes encoding antioxidant and cytoprotective enzymes [
5,
6,
7]. Therefore, antioxidant compounds engage in multiple biochemical reactions to maintain cell redox homeostasis. However, these effects are not measurable by traditional antioxidant assays (e.g., ORAC, DPPH) conducted in cell-free systems, as these tests target only two main categories of chemical reactions : hydrogen atom transfer (HAT) and electron transfer (ET)) [
8,
9,
10]. Despite extensive literature supporting these assays, their limitations have undermined the credibility of antioxidants, as biological activities could not be accurately determined in the test tubes. In 2012, the USDA removed the ORAC database from its website , citing “mountain evidence that the values indicating antioxidant capacity have no relevance to the effects of specific bioactive compounds, including polyphenols, on human health” (as cited in [
11]).
It is now essential to integrate standardized
in vitro cell-based assays to measure antioxidant activity and elucidate mechanisms of action at the cellular level, in a complex environment, to clarify the effects of antioxidants and characterize the bioactivity of specific supplement components. Natural botanical extracts and nutraceuticals typically contain multiple bioactive compounds. In many cases, data on individual bioactives are extrapolated to combined components of marketed nutraceuticals without testing the final formulation. Synergic effects from interacting bioactive molecules can be demonstrated using
in vitro cell-based assays [
12]. It is also important to note that excessive antioxidant supplementation can disturb redox signaling, inducing reductive stress or leading to ROS generation with prooxidant and cytotoxic effects. Thus,
in vitro cell-based assays enable precise dose - dependent evaluation of antioxidant activity and efficacy concentrations, providing a starting point for bioactivity assessments. These preclinical tests may inform
in vitro - in vivo correlation studies for robust clinical trials, increasing the probability of detecting physiological effects.
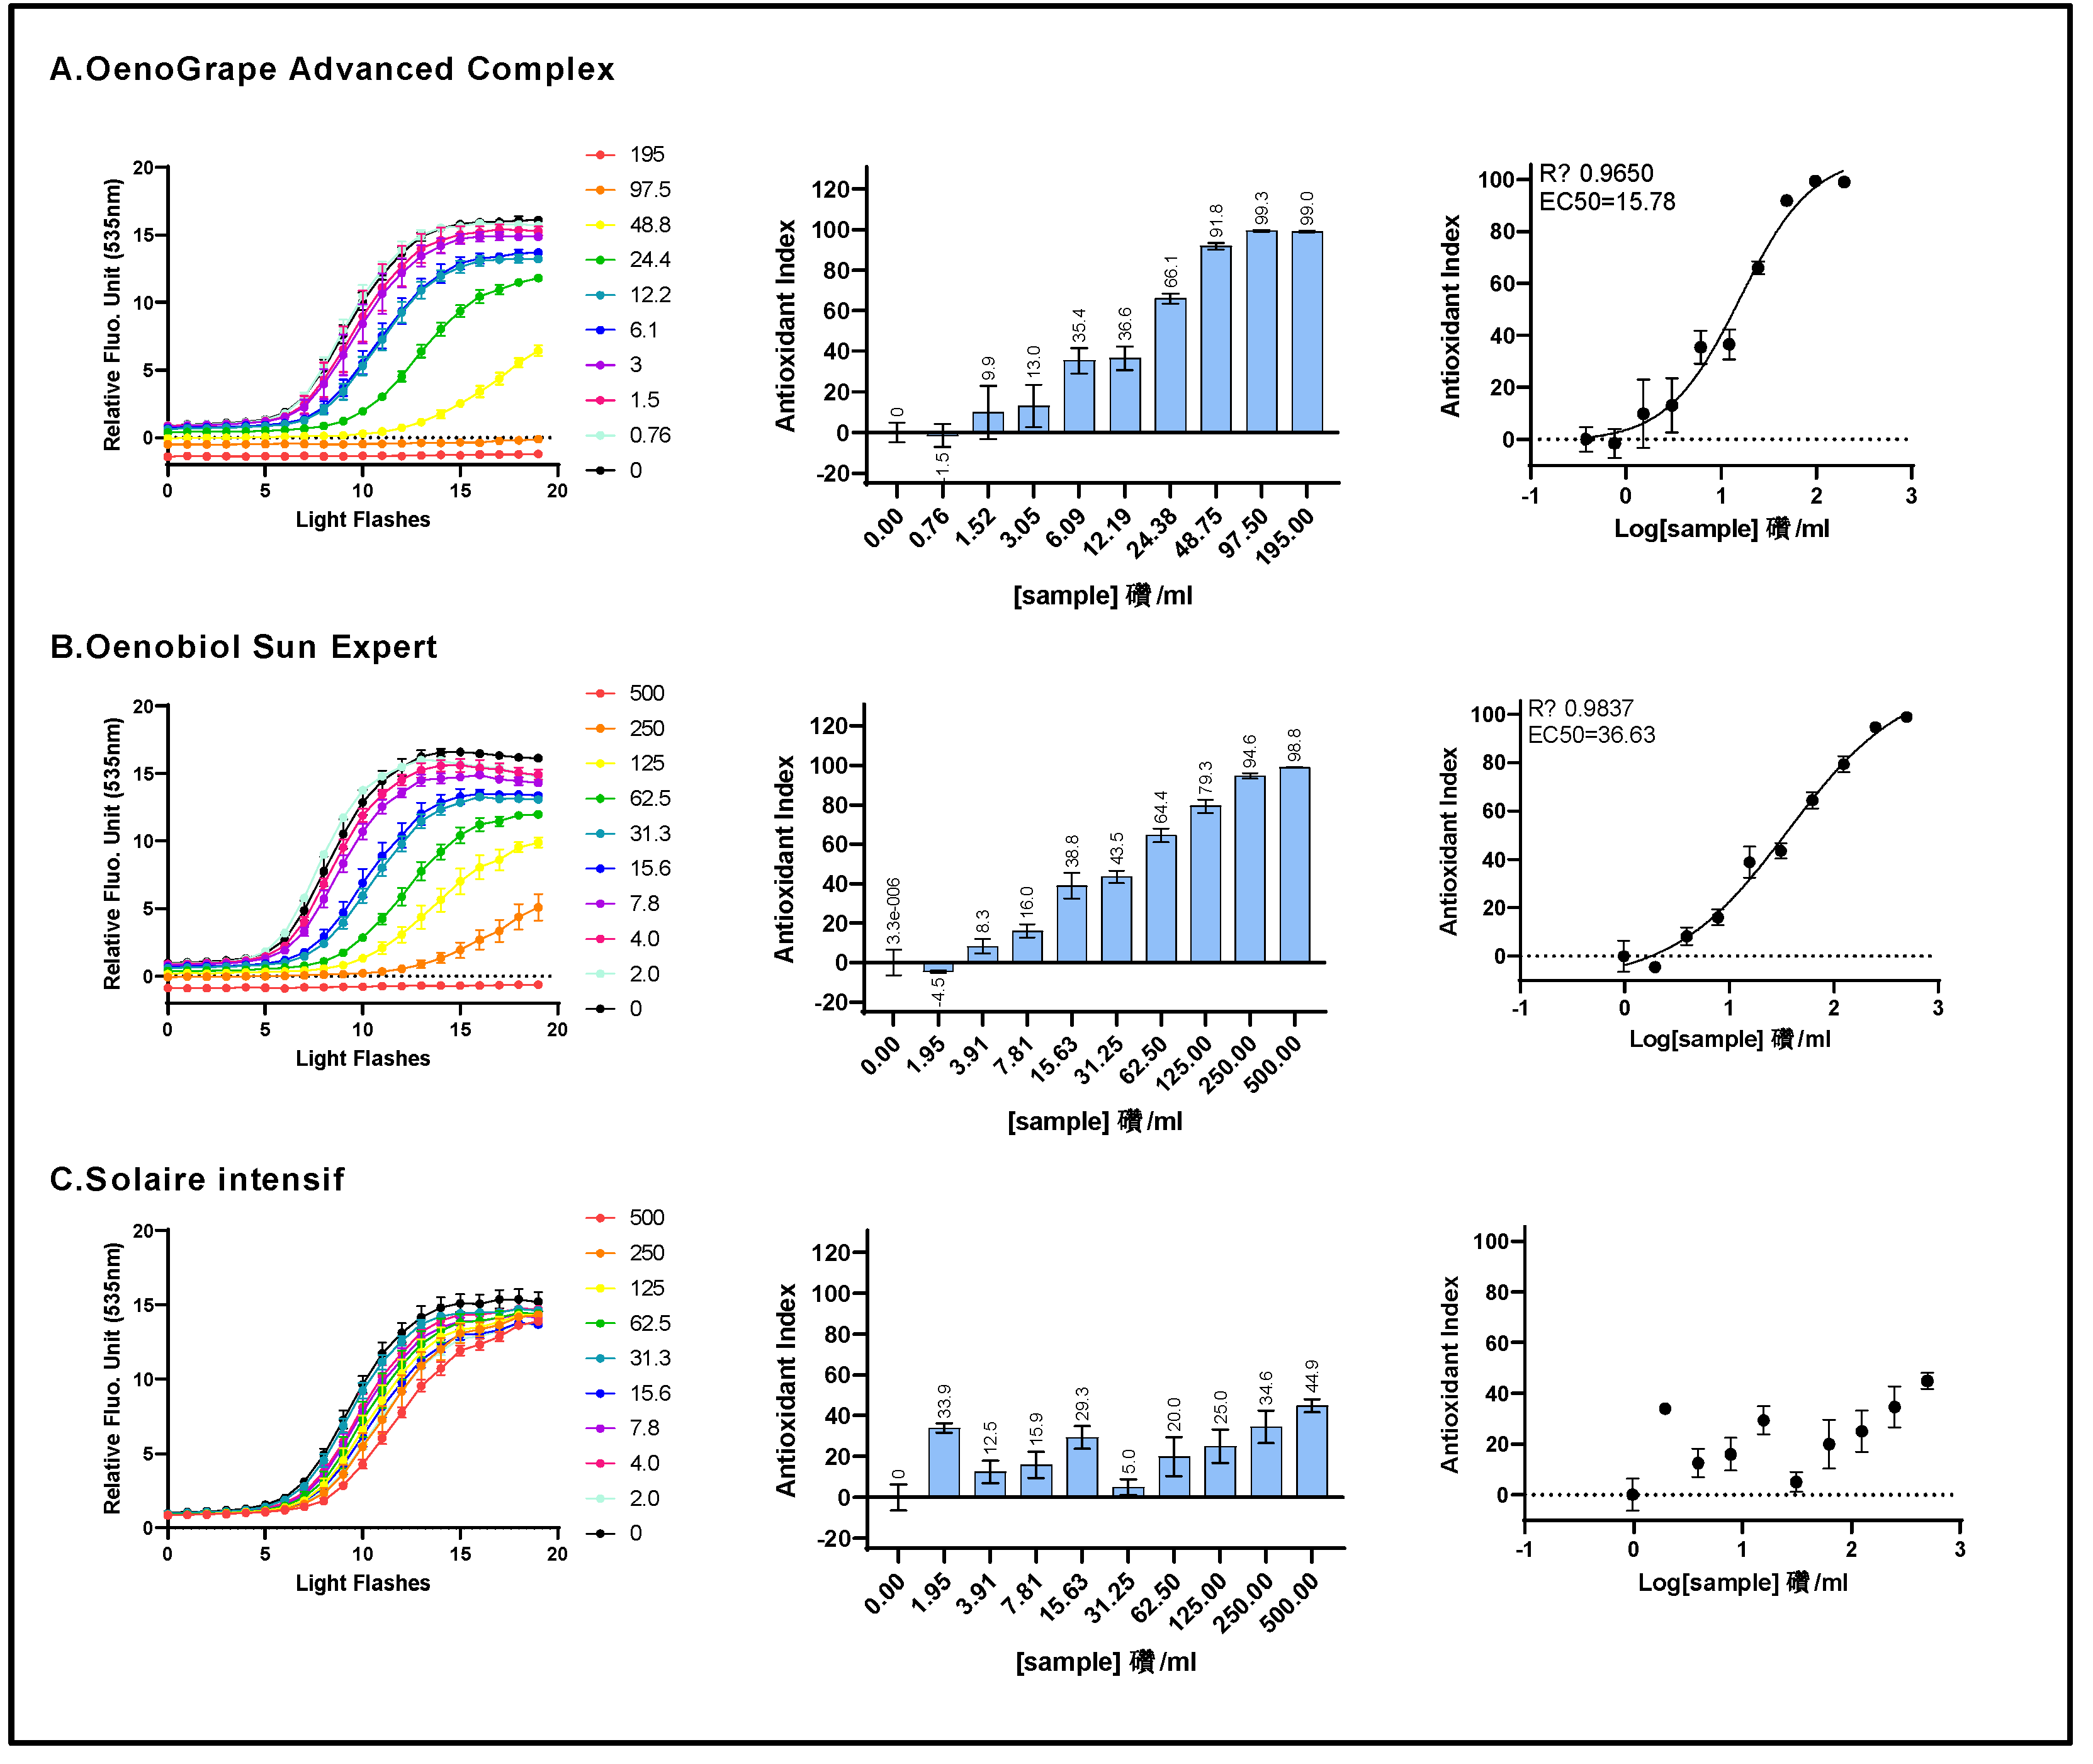
Oenobiol Sun Expert is a newly formulated version of Oenobiol Solaire Intensif, designed to enhance skin defenses against oxidative stress from sun exposure. The formulation comprises the OenoGrape Advanced Complex, which consists of grape pomace extract, an increased selenium content (30% higher) and 10% lycopene-rich tomato extract, due to their high antioxidant potential. To quantify these antioxidant properties, a set of in vitro cell-based assays was employed to assess both intracellular antioxidant mechanisms of action and antioxidant activity, intestinal absorption and the bioavailability, and antioxidant activity of transported compounds and/or metabolites on various target cells.
2. Materials and Methods
Chemicals and Cell Lines
Sulforaphane (SFN), thiazole orange (TO), 2,2-Azobis(2-methylpropionamidine) dihydrochloride (AAPH) and 2’,7’-Dichlorofluorescin diacetate (DCFH-DA) were obtained from Sigma-Aldrich (Saint-Quentin Fallavier, France). Gibco DMEM (high glucose, GlutaMAX supplement and pyruvate), fetal bovin serum (FBS) (HyClone), pen-strep solution (100X) (Gibco), 0.05 % Trypsin-EDTA (HyClone), Gibco Selective Antibiotic Geneticin (G418) (50mg/mL), Gibco DPBS without Calcium and Magnesium (1X) were procured from Thermo Fisher Scientific (Illkirch-Graffenstaden, France). Additionally, 12 mm Transwell permeable supports with 3 μm pore polycarbonate membrane inserts (3402, Corning) were purchased from Thermo Fisher Scientific (Illkirch-Graffenstaden, France). HepG2 cell line (catalogue number HB8065) was obtained from the American Type Cell Collection (ATCC) (LGC Standards, Molsheim, France), while the Caco-2 and HaCaT cell lines were kindly provided by Led Engineering Development (LED, Montauban, France). ARE Reporter - HepG2 Cell Line (catalogue number 60513) was acquired from BPS Bioscience (San Diego, CA, USA) and the ARE Reporter – HaCaT Cell Line was a generous gift from A. Natsch.
OenoGrape Advanced Complex, Oenobiol Sun Expert and Oenobiol Solaire Intensif formulations
The ingredients for the formulations were sourced from Cooper. The composition per capsule of the Oenobiol Solaire Intensif formulation is as follows: 115 mg of tomato extract (equivalent to 8 mg of lycopene), 0.050 mg of selenium, 10 mg of vitamin E, 5.25 mg of lutein, 0.95 mg of vitamin B2. The total capsule weight was 451 mg. The composition per capsule of the Oenobiol Sun Expert formulation is as follows: 100 mg of tomato extract (equivalent to 10 mg of lycopene), 60 mg of grape pomace extract, 0.065 mg of selenium, 10 mg of vitamin E (from a natural extract), 5.25 mg of lutein, 0.15 mg of cooper, and 0.7 mg of vitamin B2. The total capsule weight was 450 mg. The OenoGrape Advanced Complex was composed of the following: 100 mg of tomato extract (equivalent to 10 mg of lycopene), 60 mg of grape pomace extract and 0.065 mg of selenium (% (m/m) corresponded to 62.44% of tomato extract, 37.47% of grape pomace extract, 0.09% of anhydrous sodium selenite).
Preparations of ingredients and formulations for antioxidant cell-based assays
For the preparation of grape pomace extract and sodium selenite, DMEM culture medium without serum was added to the weighed powders to achieve final concentrations of 50 mg/ml. The preparations were vortexed thoroughly and centrifuged at 8700 rpm for 10 minutes. The supernatants were aliquoted and stored at -20°C for subsequent cell-based assays. For the preparation of the 10% lycopene-rich tomato extract, the sample was mixed with DMEM culture medium without serum and sonicated. Sample concentrations were determined based on the dry matter weight. The OenoGrape Advanced Complex was prepared according to the proportions described in the Oenobiol Sun Expert formulation, with DMEM culture medium without serum added to reach a final concentration of 50 mg/ml. The mixture was vortexed, centrifuged and the supernatant was aliquoted and stored at -20°C for use in cell-based assays. For the preparation of Oenobiol Sun Expert and Solaire Intensif formulations, ethanol was used as solvent to solubilize both formulations in DMEM without serum, also aiming for a final concentration of 50 mg/ml. The solutions were vortexed, centrifuged and the resulting supernatants were stored in aliquots at -20°C. For the dose-response studies, a series of decreasing concentration ranges (C1max to C9) were prepared from the stored aliquots using serial dilutions, allowing for a 3-log range evaluation. All concentrations and the use of organic solvents, if applicable, were indicated in the corresponding figures and legends.
Cell Culture Conditions
Human hepatocytes from the HepG2 cell line (passages 15 to 35) and human keratinocytes from the HaCaT cell line (passages 10 to 40) were cultured at 37 °C with 5% CO2 in GlutaMAX-supplemented DMEM medium, complemented with 10% FBS and 1X penicillin-streptomycin solution. ARE Reporter - HepG2 cells (passages 3 to 16) and ARE Reporter-HaCaT cells (passages 10 to 21) were cultured under the same conditions, with the addition of 0.6 mg/mL of Geneticin to the medium. Human enterocyte-like cells from the Caco2 cell line (passages 20 to 40) were cultured at 37°C with 5% CO2 in GlutaMAX DMEM medium, complemented with 20% FBS and 1X pen-strep. Once the cells reached 70–80% confluence, they were transferred into clear-bottom 96-well microplates for 24 hours: HepG2 cells were plated at 75,000 cells/well and HaCaT cells were plated at 40,000 cells/well (75μL/well). The Caco2 cells were transferred into 12-well microplates with transwell inserts at 760,000 cells/ transwell (500µL/transwell).
Intracellular ROS scavenging bioassay with AOP1 assay
The AOP1 bioassay (patented technology) measures the ability of compounds to scavenge intracellularly generated reactive species using a photosensitive biosensor [
13]. The antioxidant effect is assessed by monitoring the delay in the kinetic progression of biosensor fluorescence emission [
14]. Cells were incubated in fresh serum-free DMEM medium with a range of sample concentrations for 1 hour at 37 °C in 5% CO
2 environment. Two independent experiments were performed with the range of sample concentrations, with triplicate wells per concentration (triplicate measurements). Following the 1-hour incubation with the samples, cells were treated with the biosensor for an additional 1 hour at 37°C in 5% CO
2 using serum-free medium to avoid interactions with serum components. Relative Fluorescence Unit (RFU) was measured at 535 nm using a Varioskan Flash Spectral Scanning Multimode Reader (Thermo Fisher Scientific, Waltham, Mass., USA) following repeated 470 nm LED illuminations applied across the entire 96-well plate. Raw kinetic profiles were recorded during each illumination and fluorescence reading sequence (20 iterations).
The cellular antioxidant index (AI) was calculated from normalized kinetic profiles as follows: AI (%) = 100 – 100 (0∫20 RFUSC / 0∫20 RFUcontrol), where control is cell culture medium only or medium with solvent only. The Antioxidant Index (AI) was plotted against the logarithm of the sample concentration (Log) and fitted to a sigmoid model based on the equation: AI = AImin + (AImax - AImin)/(1 + 10^((Log(EC50/SC)*HS)), where SC represents the sample concentration, HS is the Hill slope (the tangent slope at the inflexion point) and EC50 is the concentration that achieves 50% of the maximal effect or half maximal effective concentration. Dose-response curves and the corresponding EC50, EC10 and EC90 were calculated using Prism8 software (GraphPad, San Diego, CA, USA). The best-fit EC50 values were determined with 95% confidence intervals using the asymmetrical likelihood method. Coefficients of determination (R2) were greater than 0.97 for the calculation of EC values.
Cell membrane radical scavenging assay with AAPH/DCFH-DA (CAA assay)
The CAA assay [
15] is based on the cell uptake of the DCFH-DA probe (2’, 7’-dichlorofluorescein-diacetate) through the plasma membrane, facilitated by its diacetate group (DA). Once inside the cell, the DCFH-DA is hydrolysed to non-fluorescent DCFH, which becomes fluorescent upon its oxidation to DCF. In our assay, oxidation is initiated by the radical generator AAPH (2, 2’-azobis (2-amidinopropane) dihydro-chloride), which induces the production of peroxyl radicals at the plasma membrane, converting DCFH to its fluorescent product, DCF. The cells were incubated with concentration ranges of the sample preparations for 1 hour at 37 °C in 5% CO
2, in the presence of DCFH-DA (30 µM). Following incubation, the cells were washed three times and AAPH was added (600 µM) to initiate radical generation. Two independent experiments were conducted, with each sample concentration tested in triplicate in serum-free culture medium. Fluorescence (RFU) was measured every 5 minutes in kinetic mode, and readings continued for the necessary duration. Dose–response curves were calculated using the formula:
ARE-luciferase assay
The ability of the samples to activate the Nrf2 regulated - ARE pathway was assessed using a luciferase reporter gene assay, as previously described [
12,
16]. Stably transfected ARE-luc-HepG2 and ARE-luc-HaCaT cells were incubated for 17 hours at 37 °C in 5% CO
2 with ranges of sample concentrations. Following incubation, the cells were treated with a mixture of cell lysis buffer and luciferin (the substrate of luciferase) (BPS Bioscience, USA). Luminescence was measured using a Varioskan Flash Spectral Scanning Multimode Reader to determine Relative Luminescence Units (RLUs), reflecting luciferase gene expression via activation of the ARE sequence. Sulforaphane (SFN) was used as a positive control for the assay. Results were expressed as Fold Increase (FI) relative to the negative control at t=20 min, using the formula: FI = (RLU
sample /RLU
control). FI values were plotted against the logarithm of the sample concentration and fitted to a sigmoid model using the equation: FI = FI
min + (FI
max - FI
min)/(1 + 10
(Log(EC50-SC)*HS)) where SC is the sample concentration, HS is the Hill slope and EC
50 is the concentration at which 50% of the maximal effect is achieved. Dose-response curves were generated using Prism8 software (GraphPad, San Diego, CA, USA). Two independent experiments were performed, with each sample concentration tested in duplicate. Confidence intervals were calculated using the asymmetrical method, set at 95%. Coefficients of determination (R
2) were greater than 0.97 for the determination of EC values.
In vitro intestinal absorption assay
Caco2 cells were cultured at 37°C in a 5% CO2 atmosphere using GlutaMAX-supplemented DMEM medium, complemented with 20% FBS and 1X penicillin-streptomycin. Cells were grown until they reach 70%–80% confluence. For Transwell experiments, 1.52 x 10⁶ cells/ml were seeded onto 12-well Transwell inserts with polycarbonate membranes (12-well microplate, 12 mm diameter, 3 μm pore size, Corning 3402). Each well of the Transwell plate had two compartments separated by the membrane: an apical compartment representing the lumen of the small intestine and a basolateral compartment representing the sub-epithelial side. Cells were maintained for 21 days at 37°C in a 5% CO2 incubator, with medium changes in the apical (500 μl) and basolateral (1500 μl) compartments every other day. After 21 days of differentiation, Caco2 monolayers were ready for transepithelial transfer experiments, during which the medium in the apical compartments was replaced with sample preparations. Cells were maintained at 37°C in a 5% CO2 incubator during the transport experiments. Electric resistances (Ω) across the cell monolayers were measured using an ohmmeter (MERS00002 Millipore Voltmeter-Ohmmeter Millicell-ER), before the addition of the sample preparations at time 0. Transepithelial electric resistances (TEER) were calculated as: TEER = [Ω cell monolayer – Ω filter (cell-free)] * filter area, where the filter area was 1.131 cm2. TEER values above 300 Ω*cm2 were considered indicative of intact Caco2 monolayer integrity. The incubation times for grape pomace extract (at 25 and 6 mg/ml), OenoGrape Advanced Complex (2 mg/ml) and sodium selenite (0.01 and 0.02 mg/ml) were set at 1 hour, after which electrical resistance values were recorded. The change in resistance was expressed as a percentage of the baseline resistance, calculated using the following formula: % baseline resistance = ([resistance at exposure time] – [blank insert resistance]) / ([baseline resistance] – [blank insert resistance]) × 100, where baseline resistance refers to the resistance measured at time 0. Each sample condition was evaluated in duplicate using Transwell inserts. Caco2 cells incubated in vehicle (either cell culture medium or 4% ethanol) served as control conditions. Following the transport experiments, the media from basolateral compartments were collected, aliquoted and stored at -20°C until further analysis in antioxidant bioassays. The recovery of antioxidant activity, or transport efficiency, was calculated using the formula:
Transport % = [estimated concentration in the basolateral fraction] / [concentration in the apical fraction] x 100 x 3.
4. Discussion
In this study, we demonstrated that two components of the OenoGrape Advanced Complex, grape pomace extract and sodium selenite, exhibited effective and complementary intracellular antioxidant activities, while the 10% lycopene-rich tomato extract did not contribute to these antioxidant effects. Grape pomace extract showed high ROS scavenging activity, while sodium selenite functioned as a strong ARE pathway inducer, both contributing to enhanced cellular protection. The high ROS scavenging activity persisted in the final formulation of the food supplement. Furthermore, by assessing antioxidant activity following in vitro intestinal barrier transport of ingredients, grape pomace extract and selenite were shown to be bioavailable and capable of executing biological functions on two target cell models.
Lycopene-rich tomato extract. In our study, no dose-dependent antioxidant activity was observed for the 10% lycopene-rich tomato extract in any of the three cell-based antioxidant mechanisms examined (AOP1, CAA, ARE-luciferase assays). In the skin, carotenoids, including lycopene, accumulate primarily in the epidermis, where they serve as a protective barrier against environmental factors such as free radicals and UV radiation [
19,
20]. Carotenoids are known for their photoprotective effects through direct light absorption and antioxidant properties [
21]. Lycopene was shown to act by neutralization of radicals or singlet oxygen (
1O
2) in organic solvents and cell-free systems [
22,
23]. However, in complex cell systems, carotenoids appear to act differently. Using cell lines, Bosio et al [
24] demonstrated that intracellular β-carotene did not scavenge singlet oxygen (
1O
2). Other authors suggested that carotenoids might even act as pro-oxidants [
25,
26,
27]. In our study, no pro-oxidative nor scavenging antioxidative effects were observed for the 10% lycopene-rich tomato extract assessed in a dose-dependent manner. Additionally, the 10% lycopene-rich tomato extract did not activate the Nrf2-regulated ARE pathway. Carotenoids can act indirectly by modulation of stress-dependent signaling pathways [
28]. Ben-Dor et al [
29] reported that a lycopene ethanolic extract was able to induce a ARE transcription system in transiently transfected mammary cells. However, this extract contained hydrophilic derivatives and the authors concluded that some lycopene oxidation products were the active mediators in this activation [
30]. Indeed, Lian & Wang demonstrated that enzymatic metabolites of lycopene in mammalian tissues, called apo-10’-lycopenoids (lycopenals, lycopenols and lycopenoic acids), were responsible for the Nrf2 nuclear accumulation and antioxidant protein expression in human bronchial epithelial cells [
31].
Sodium selenite. Our results indicated that sodium selenite does not exert direct ROS scavenging activity. Selenium, ingested from human diet in a few chemical forms (inorganic forms as selenate and selenite, organic forms as mainly selenomethionine), plays a biological role as component of selenoproteins (selenocysteine being referred as to the “21
st” amino acid). In humans, 25 genes coding for selenoproteins have been identified [
32]. Many of these selenoproteins regulate oxidative stress and antioxidant defense (e.g. six glutathione peroxidases (GPxs) and three thioredoxin reductases (TrxR)) and other biological functions such as thyroid hormone metabolism, immune and inflammatory responses [
33,
34]. While selenium contributes to cellular antioxidant mechanisms through selenoproteins, it does not act as a direct ROS/RNS scavenger. In our AOP1 study, we clearly demonstrated that sodium selenite 1) had no direct ROS scavenging action and 2) that sodium selenite exhibited a pro-oxidative effect at high concentrations (24.4 μg/ml or higher selenite concentrations) (141 μM) after only 1 hour of exposition, whereas the lower concentrations (0.8 μg/ml - 12.2 μg/ml) remained without noticeable effects. Excessive selenium intake can result in toxicity, potentially generating oxidative stress, while selenium deficiencies from insufficiently low daily intake or intestinal absorption defects have also been described [
35,
36]. Administration of supra-physiological concentrations of sodium selenite for 24 hours on endothelial cells induced endoplasmic reticulum stress and increased ROS production, leading to endothelial dysfunction [
38]. Sodium selenite is reduced to selenide by glutathione-dependent reactions [
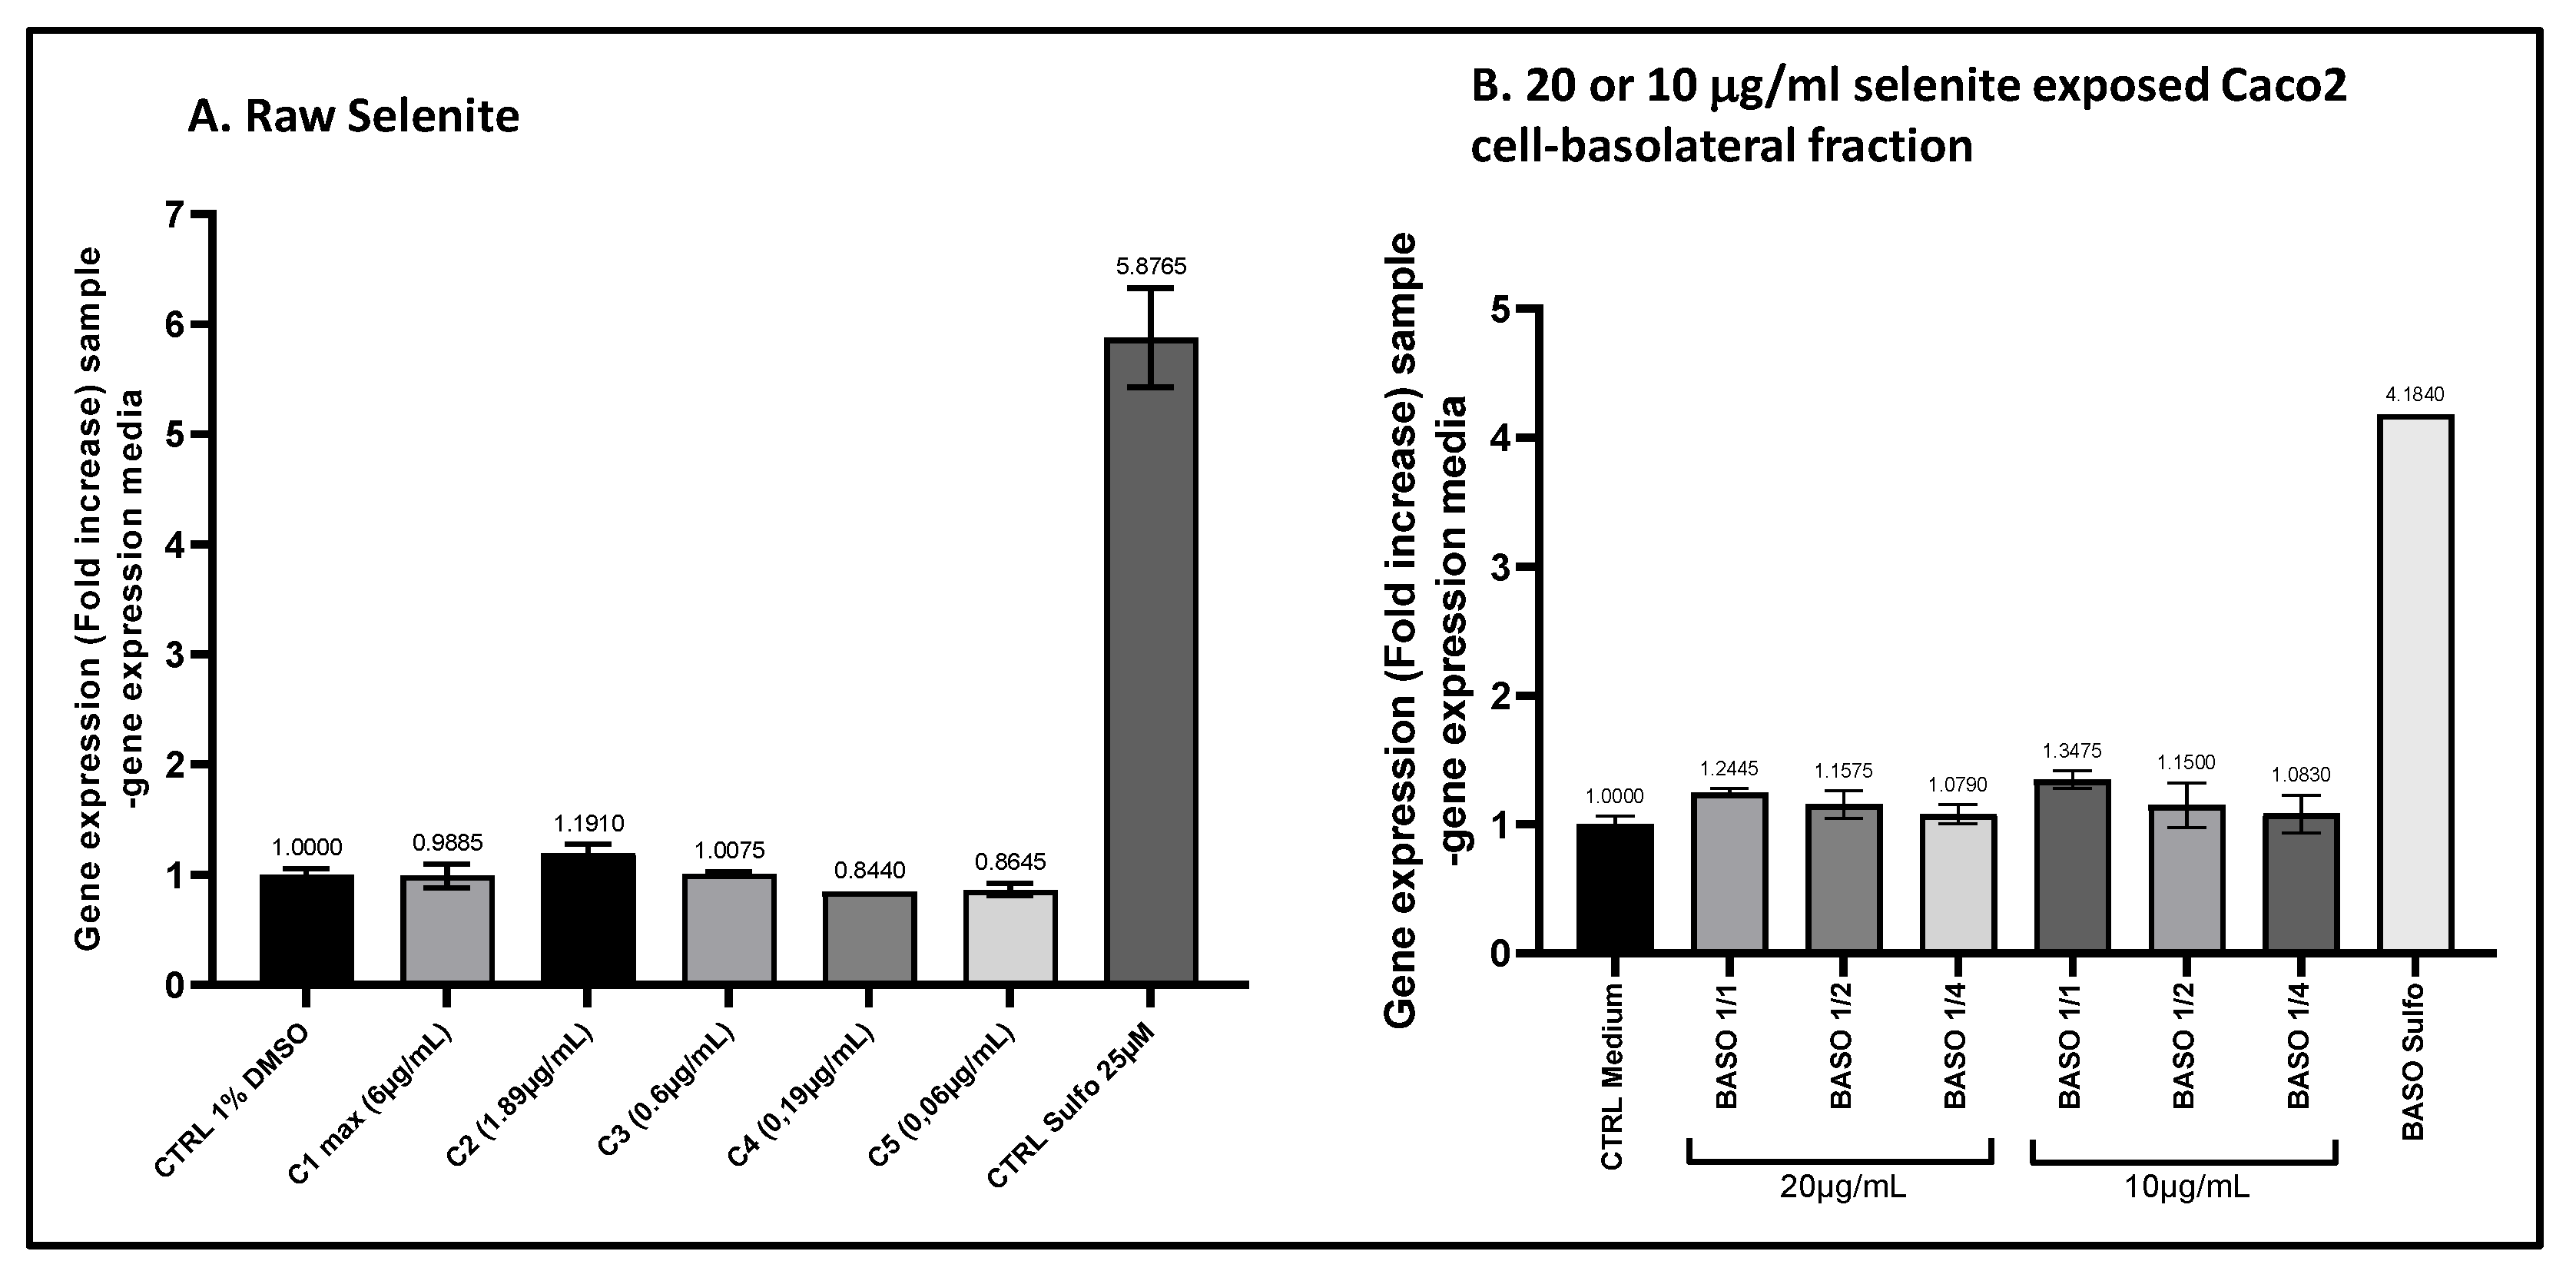
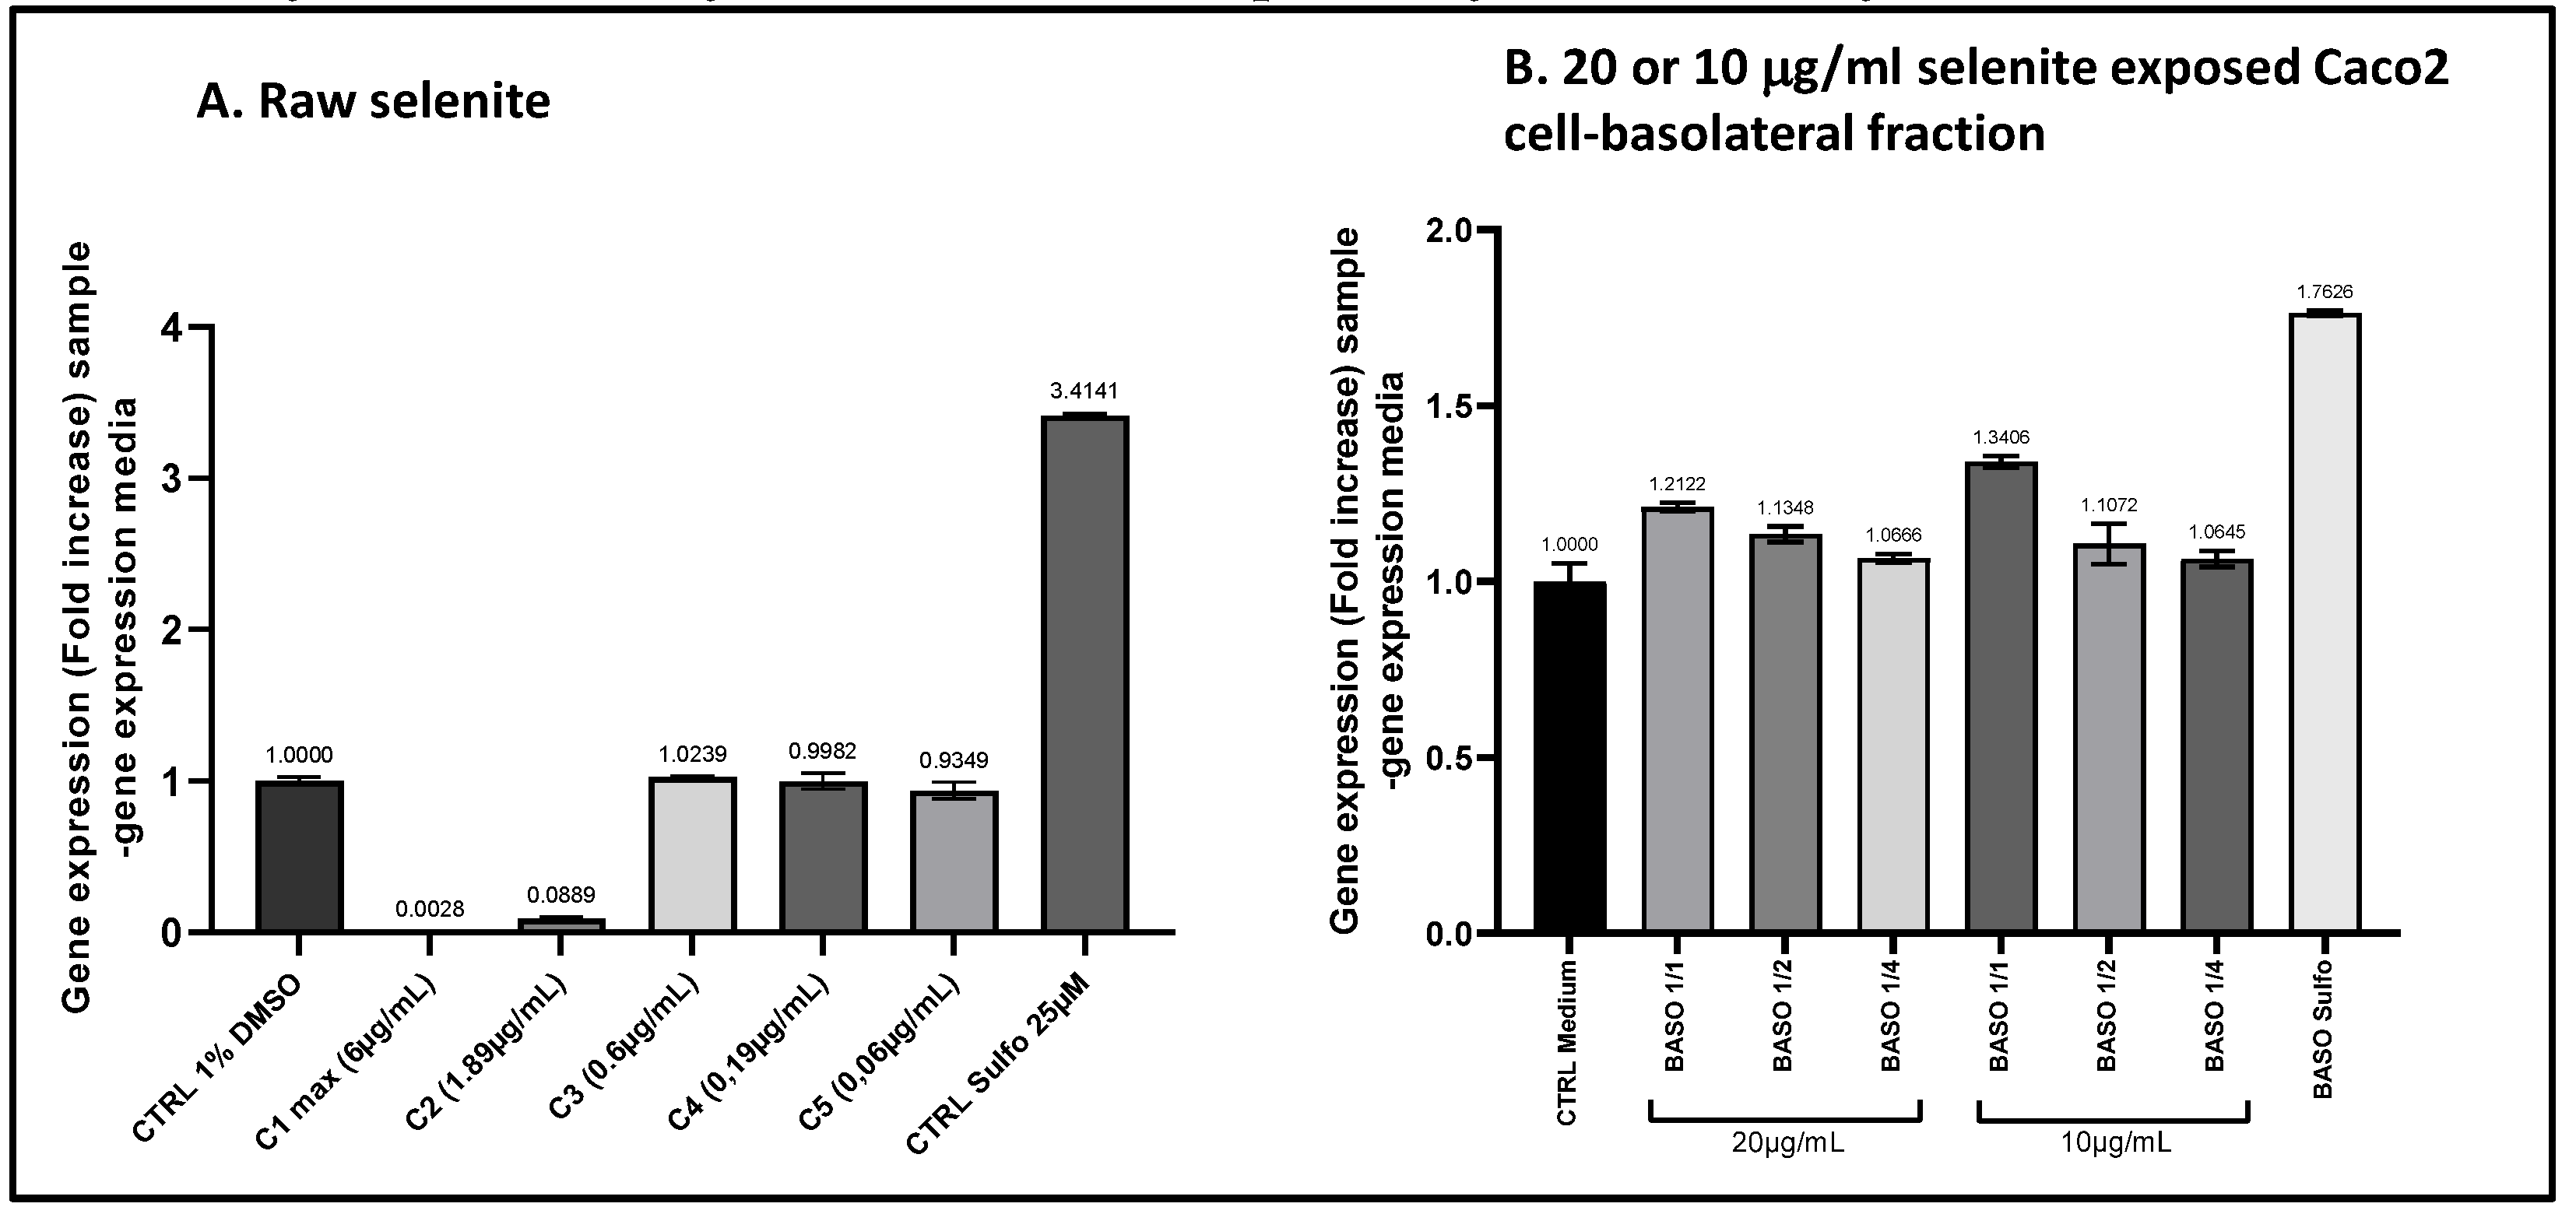
37] and subsequently, selenite may exert its toxicity through consumption of intracellular glutathione resulting in severe oxidative stress. In our study, we also demonstrated that sodium selenite was a strong ARE pathway inducer at sub-microgram/ml levels. The efficacy concentrations of ARE-inducing effect of selenite were determined (ARE EC
10 = 0.186 mg/ml, ARE EC
50 = 0.367 mg/ml, and ARE EC
90 = 0.722 mg/ml) and these values were compared to the optimal plasma concentration range for selenium, reported as 0.086 μg/ml to 0.258 μg/ml [
39]. Notably, the EC
10 value of sodium selenite, representing the minimal selenium concentration to act as an ARE inducer, was within the physiological range of selenium plasma concentrations. Recently, addition of a selenium-based supplementation to the culture medium of rat mesenchymal stem cells from bone marrow was shown to improve both the cytoprotection and stemness capacity (e.g. viability and differentiation potential) of these cells [
40]. Also, Ma et al [
41] demonstrated
in vivo and
in vitro that selenium reduced oxidative stress and release of pro-inflammatory cytokines, in rats and in vascular endothelial cells (HUVEC cells) exposed to toxic silver nanoparticles.
Furthermore, in our study, the ARE-inducing activity of selenite (and/or its metabolites) was detected both directly and after intestinal transepithelial transfer experiments. Intestinal absorption mechanisms differ depending on the chemical form of selenium. Selenite absorption was reported to occur by passive diffusion or utilizing amino acid transport systems (through formation of selenocysteine (SeCys) and selenoglutathione (SeGSH), transported across enterocytes by amino acid or peptide transporters). Some experiments of selenium uptake, performed on isolated brush border membrane vesicles (BBMVs) from rats fed with diets made with different selenium forms, indicated a very high accumulation of selenite in the rat BBMVs, even higher than the accumulations measured for SeMet and selenate [
42,
43]. For intestinal transport, Lu Wang & Fu [
31] evaluated the transport efficiency of sodium selenite in the Caco2 cell monolayer of about 2%, which was lower than the transport efficiency of SeMet (5%). Also, the selenium bioavailability from selenite-enriched lettuce was assessed in a vegetable biofortification study, in which an
in vitro simulated gastrointestinal digestion was followed by Caco2 cell experiments, and selenite transport was estimated to be about 18% [
44]. In summary, sodium selenite appeared to be absorbed efficiently, and our study suggested that selenite and /or its metabolites exerted ARE-inducing activity.
Grape pomace extract: Grape pomace is a by-product of the wine industry, and consists of skins, seeds and stem. It is particularly rich in antioxidant polyphenols, which includes flavonoids - such as anthocyanins, flavonols and flavanols - and non-flavonoids like stilbenes and phenolic acids [
45]. The anthocyanins present in grape pomace are glycosylated derivatives of cyanidin, malvidin, delphinidin and peonidin, while the flavonols include forms of quercetin, myricetin, rutin, and kaempferol. The flavanols are represented by (+)- catechin and (-)-epicatechin. The stilbenes, wellknown as being associated with grapes, are
trans-resverastrol and viniferins. Phenolic acids, including hydroxybenzoic acids (gallic acid) and hydroxycinnamic acids (ferulic, p-coumaric and caffeic acids) also contribute to the potent antioxidant properties of grape pomace. In our study, grape pomace confirmed important intracellular antioxidant properties, with this extract showing highly potent intracellular ROS scavenging activity (AOP1 EC
50 = 6.80 μg/ml), likely due to the synergistic action of its bioactive compounds. For a comparison with results obtained for pure polyphenolic compounds assessed with the AOP1 bioassay, Gironde et al [
14] reported AOP1 EC
50 values of 7.15 μg/ml for quercetin, 14.75 μg/ml for resveratrol, 161.3 μg/ml for catechin and 181.3 μg/ml for epicatechin in HepG2 hepatocytes. Similarly, Furger et al [
12] evaluated six grape extracts (seed, fruit pomace and leaf) in intestinal cells using the AOP1 assay, finding EC
50 values between 11.62 to 162.2 μg/ml, with the highest activities observed in seed extracts, followed by fruit pomace and leaf extracts. The OenoGrape Advanced Complex, composed of the grape pomace (skin, seed and stem) exhibited superior intracellular ROS scavenging efficacy compared to other grape extracts tested. Resveratrol, one of the key polyphenols in grapes, has been shown since the 1990s to function as an antioxidant, inhibiting free radical formation in a dose-dependent manner in TPA- treated HL-60 cells [
46] . Additionally, resverastrol activated the Nrf2-mediated ARE pathway by inducing phase II detoxification enzymes [
47]. In our study, the grape pomace extract activated ARE pathway with an EC
50 value of 231 μg/ml. Furger et al [
12] observed no Nrf2-regulated ARE activity in two grape seed extracts that displayed the highest AOP1 EC
50 values, whereas the grape leaf extract showed an ARE EC
50 of 661 μg/ml. Our previous studies in hepatocytes [
16] found that quercetin (EC
50 = 5.26 μg/ml) and caffeic acid (EC
50 = 46 μg/ml) were effective inducers of the Nrf2/ARE pathway, as was resverastrol (with EC
50 = 33.55 μg/ml, unpublished data). Moreover, Soeur et al [
48] demonstrated that resverastrol enhanced Nrf2 nuclear accumulation and induced the expression of ARE-regulated genes and proteins in primary human keratinocytes (NHKs). They further showed that resverastrol, at concentrations between 20 and 100 μM, could induce Nrf2 -ARE genes in a full-thickness reconstructed human skin model and increased cellular glutathione (GSH) levels. Kim et al [
49]reported that pretreatment of HaCaT cells with 625 μg/ml of grape peel extract provided protection against UV-induced cell damage by increasing cytoplasmic heme oxygenase-1 (HO-1) and nuclear Nrf2 protein levels. Additionally, oral supplementation with grape peel extract (1 or 2 g/kg body weight) or resverastrol (2, 10 or 50 mg/kg body weight) for six weeks before UVB exposure reduced wrinkle formation in murine skin. However, the mechanisms by which resverastrol accumulates in the dermis and its effective concentration for exerting antioxidant effects in the skin remain to be elucidated.
The bioavailability of polyphenols varies widely between classes, but in general, dietary polyphenols are poorly absorbed and extensively metabolized in enterocytes and then in liver trough phases I and II reactions. Furthermore, microbial metabolites generated in the colon significantly contribute to the biological effects of these compounds [
50,
51]. In our study, polyphenol metabolites from pomace grape extract, produced during
in vitro Caco2 cell transport, still exhibited direct ROS scavenging activity, adding complexity to the paradox of “low bioavailability, high bioactivity”.
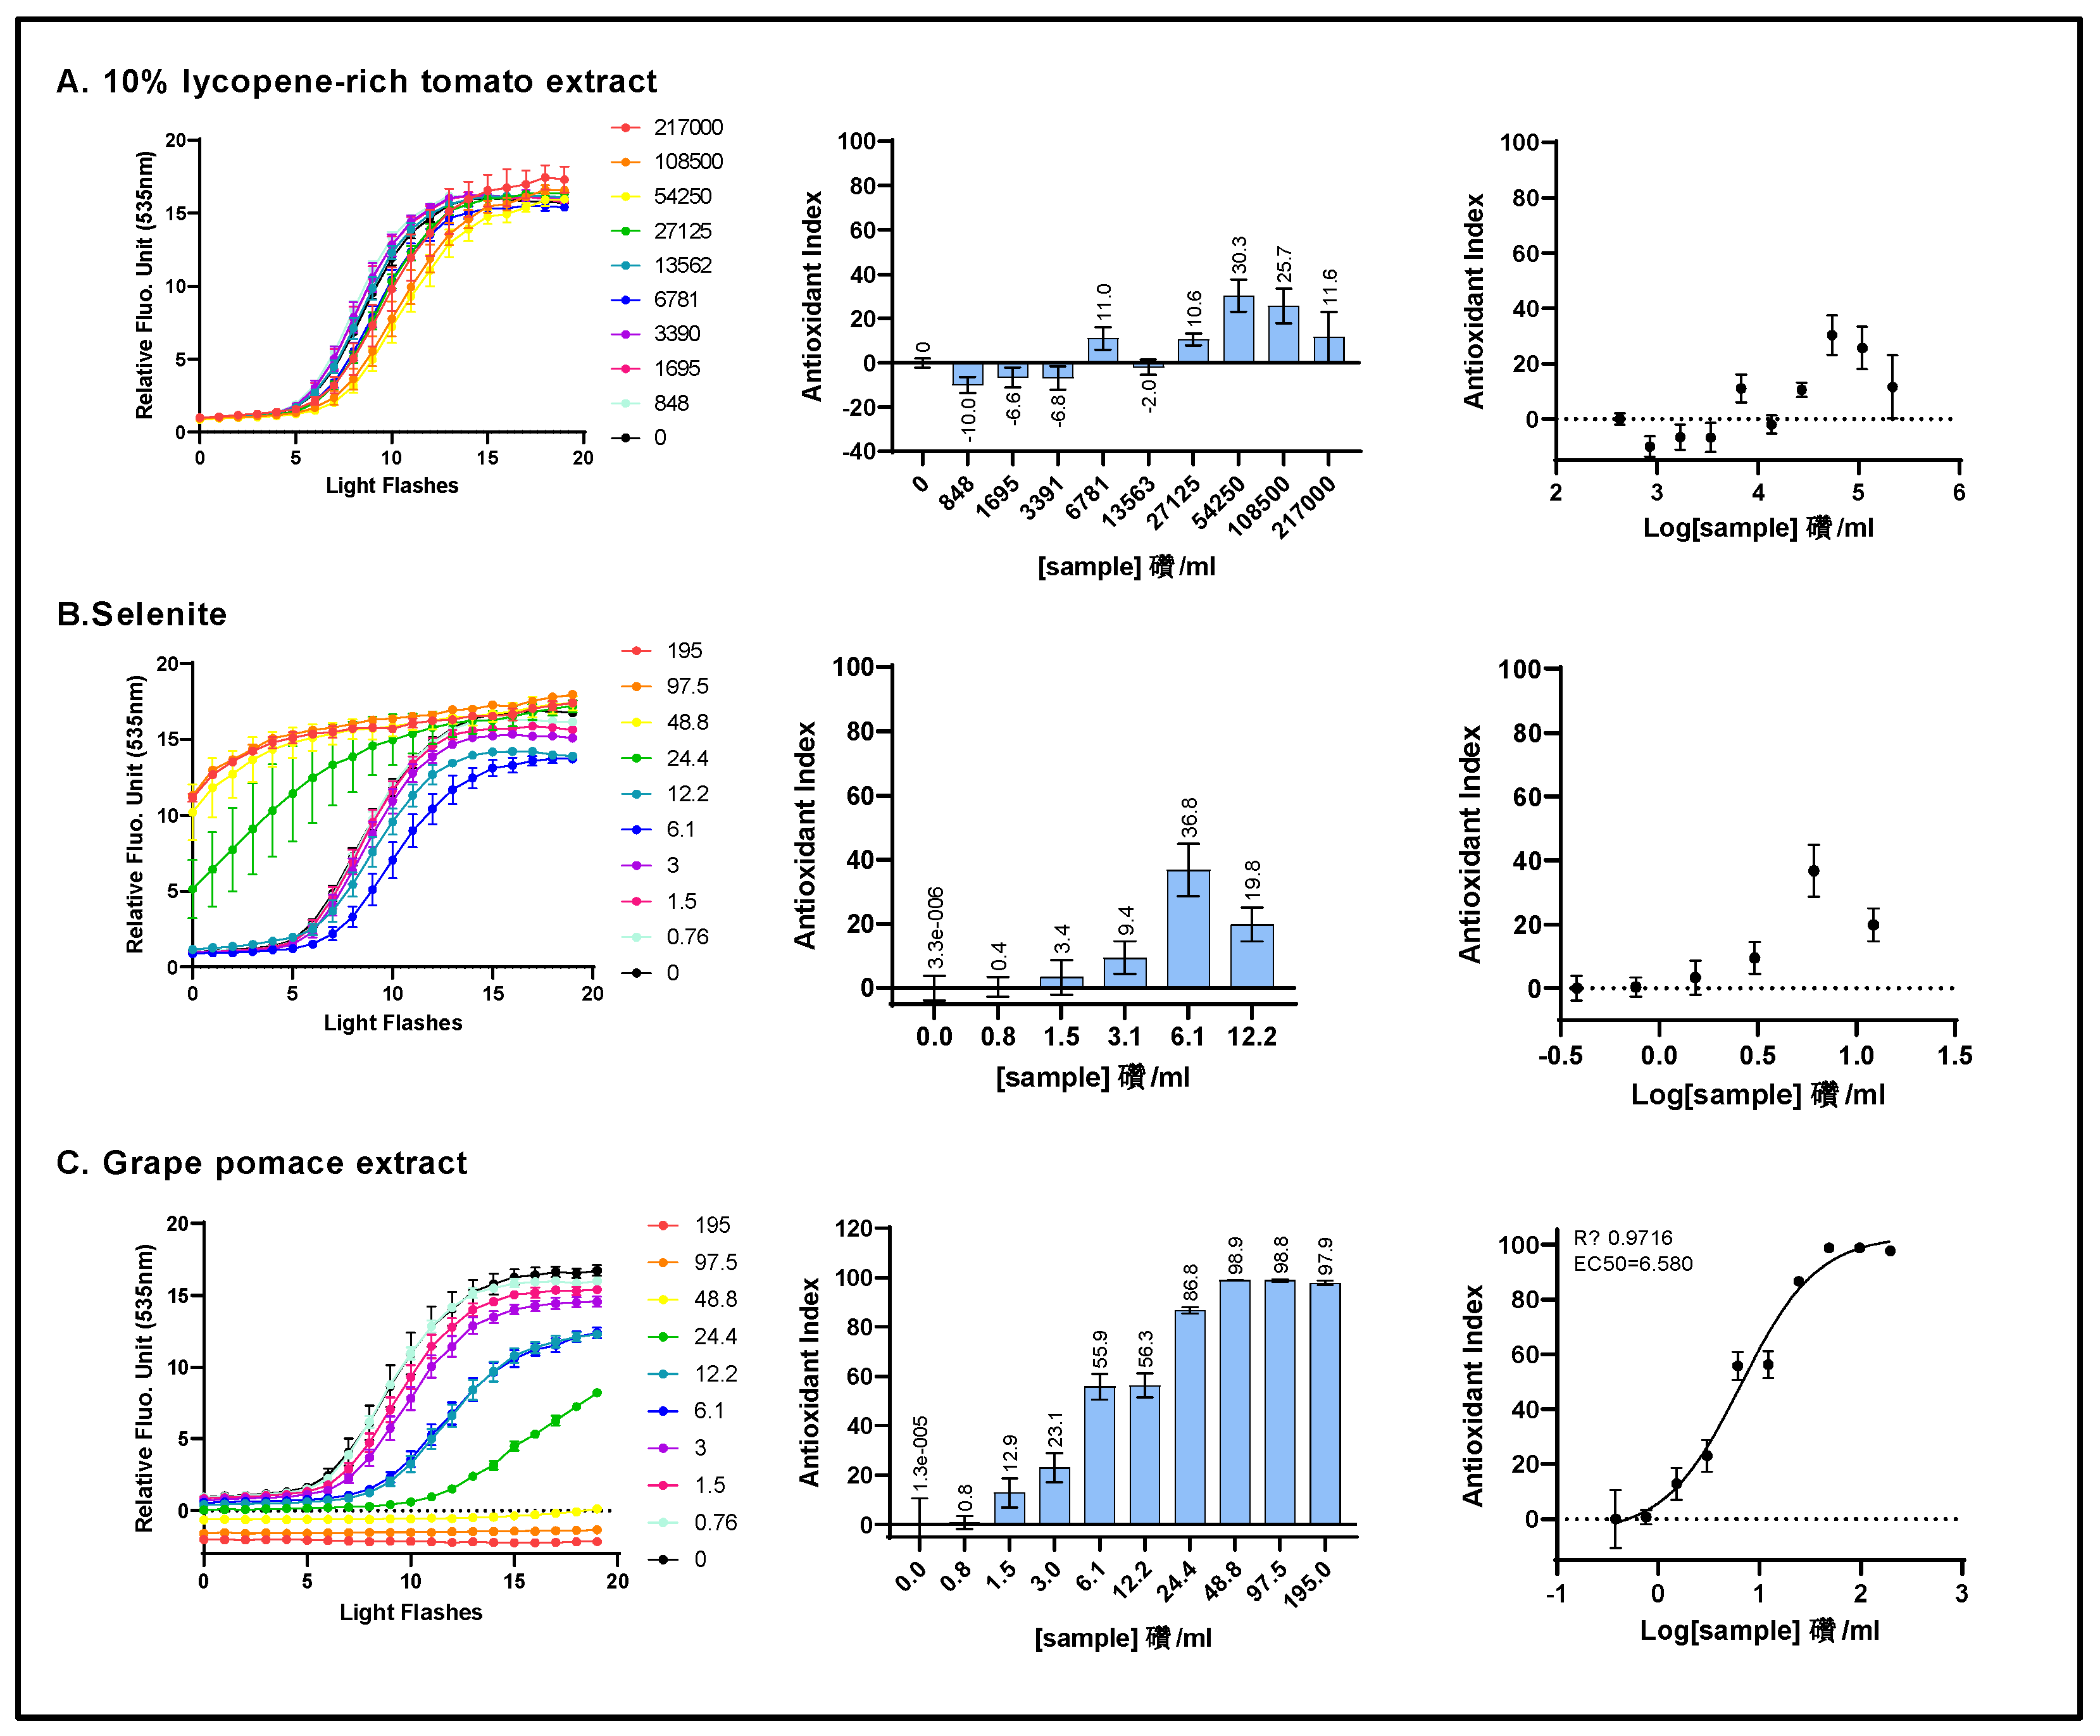
Figure 1.
The intracellular ROS scavenging activity of three individual ingredients was assessed on HepG2 cells using the AOP1 bioassay. HepG2 cells were incubated for 1h with increasing concentrations of a 10% lycopene-rich tomato extract (A), sodium selenite (B), and grape pomace extract (C). Left panel: kinetic fluorescence profiles where the x-axis represents the light flash number and the y-axis displays the Relative Fluorescence Unit (RFU) values for each sample concentration. Middle panel: Antioxidant Index (AI) values calculated for each concentration. Right panels: Dose-response curves with the log-transformed concentration on the x-axis and the AI on the y-axis. Data points: mean RFU value from triplicate wells; error bars: standard deviation (SD); EC50: efficacy concentration required to achieve 50% of the maximum effect; R2: coefficient of determination for the dose-response fit.
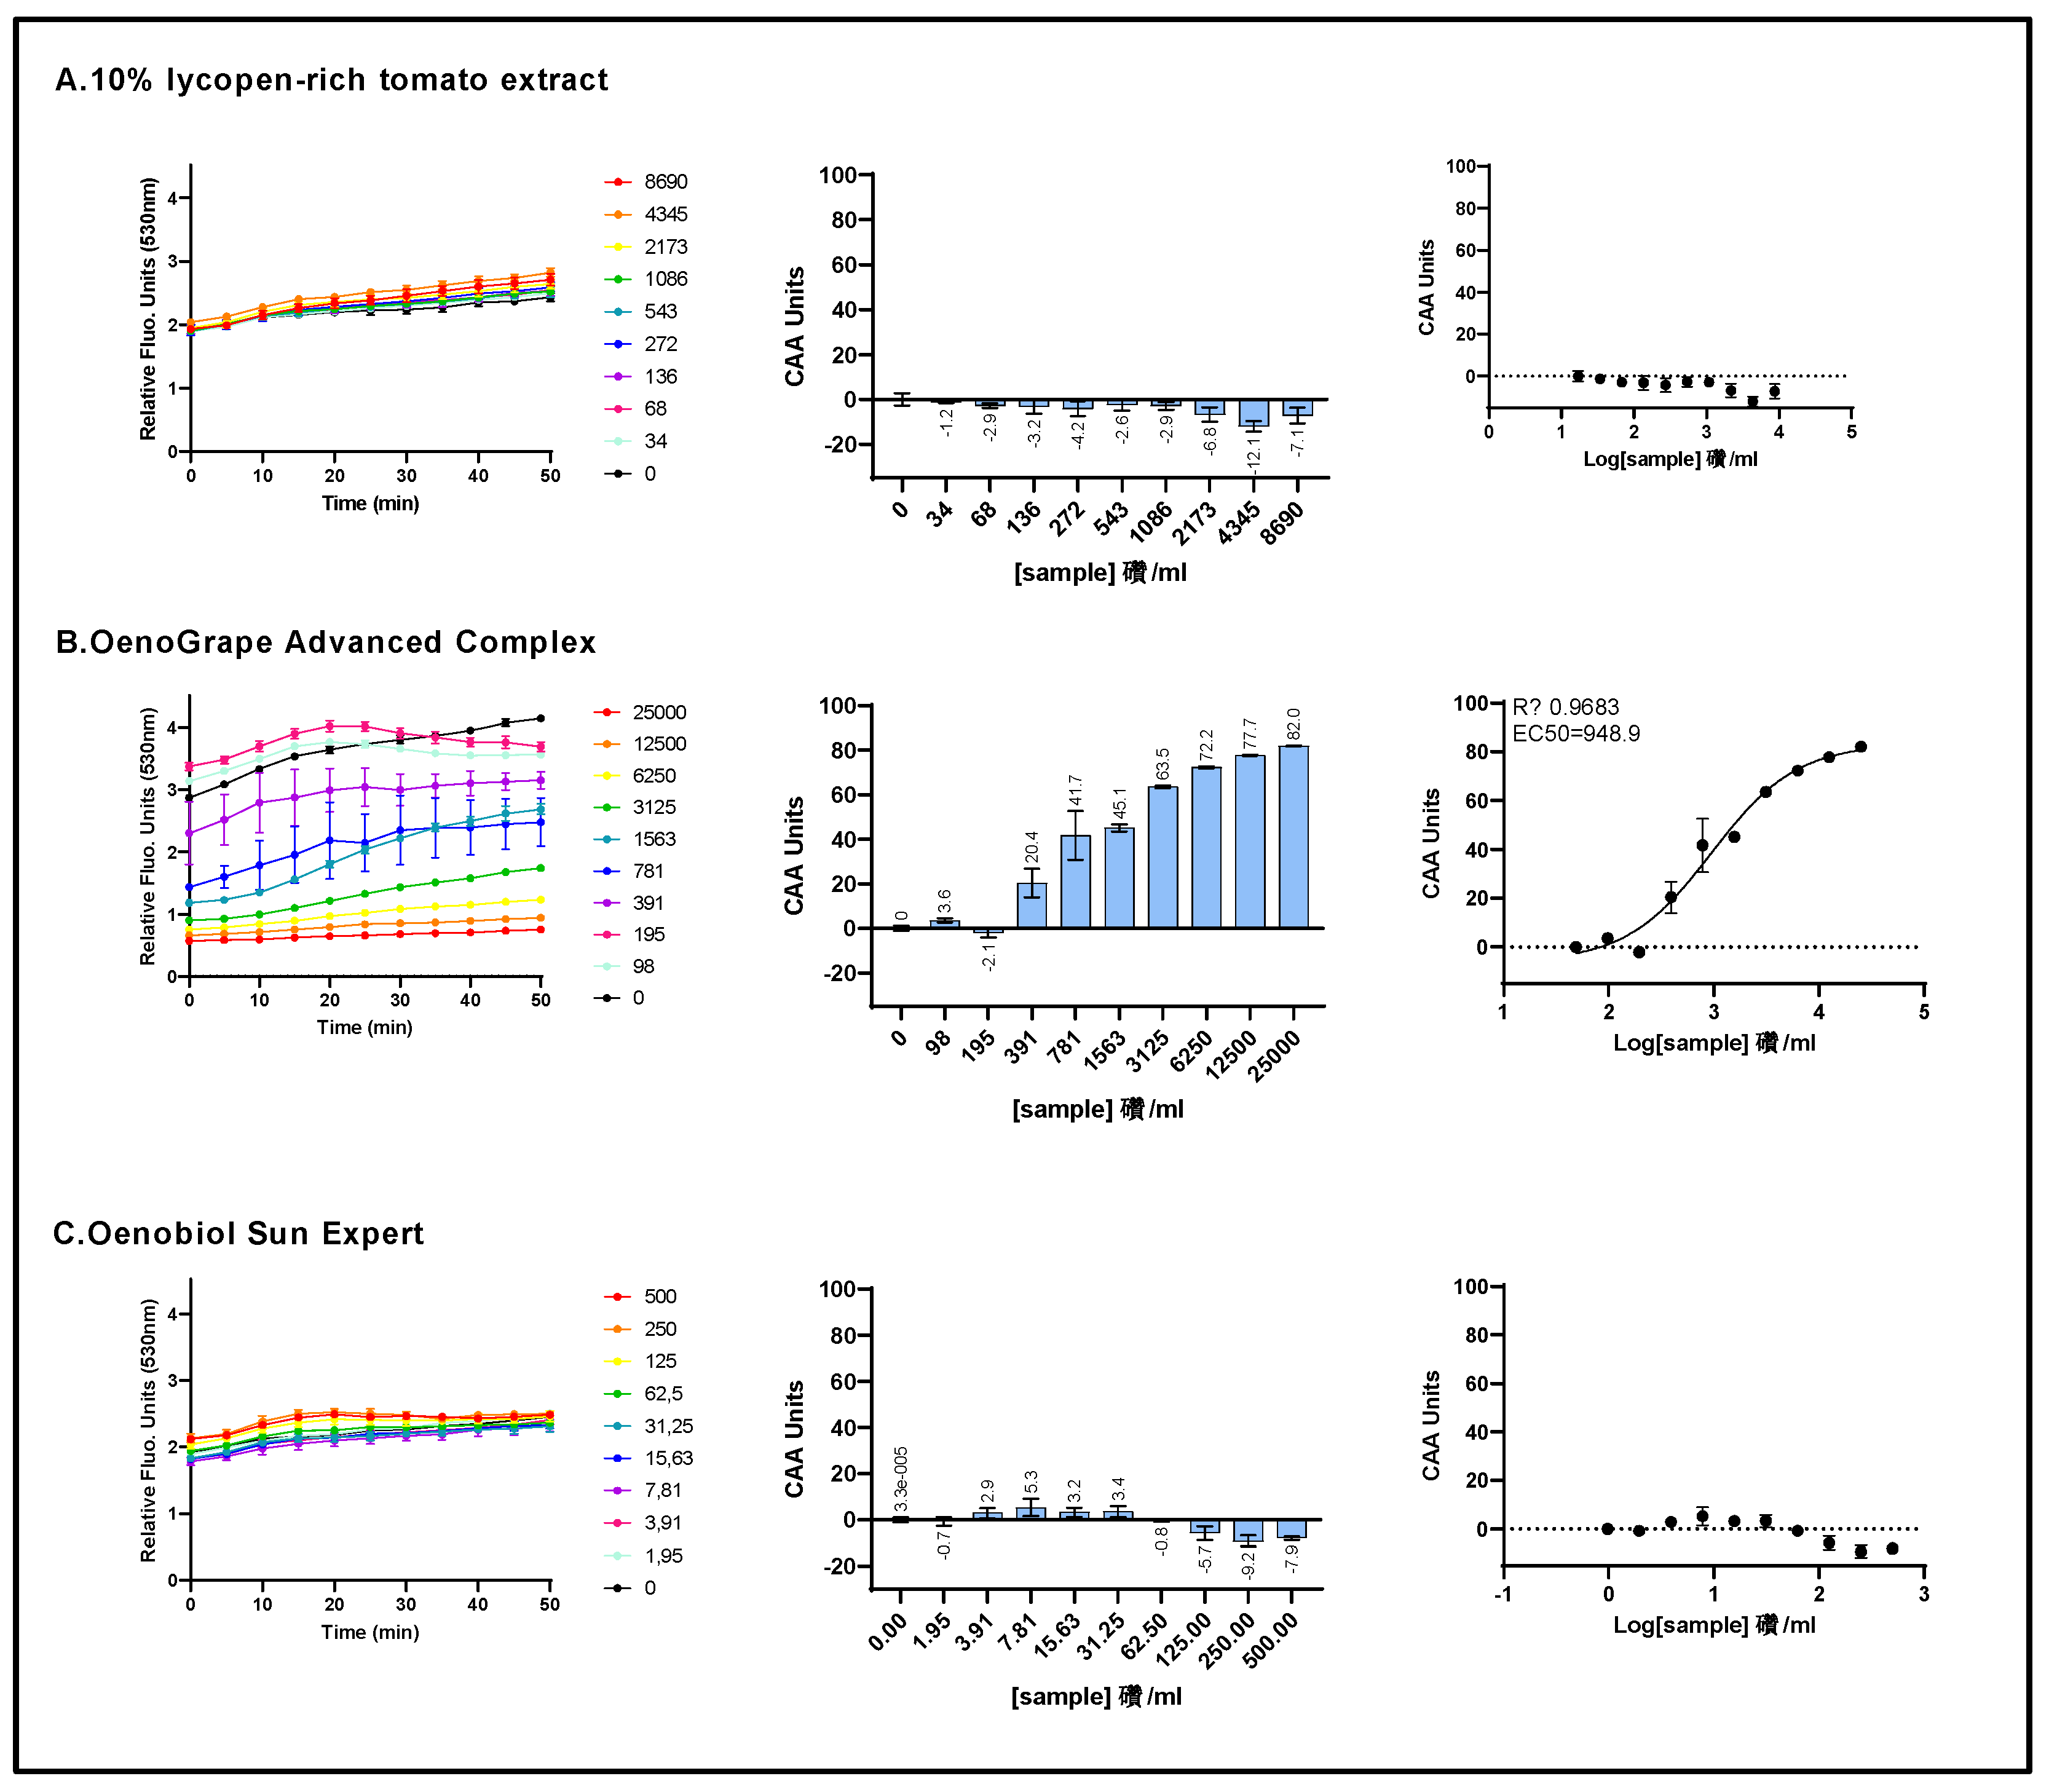
Figure 3.
The cell membrane radical scavenging activity of a 10% lycopene-rich extract, OenoGrape Advanced Complex, and Oenobiol Sun Expert formulation was evaluated in HepG2 cells using the CAA or AAPH/DCFH-DA assay. HepG2 cells were incubated for 4 hours with varying concentrations of the 10% lycopene - rich tomato extract (A), OenoGrape Advanced Complex (B) and Oenobiol Sun Expert formulation (C). Left panels: fluorescence emission kinetics of the DCFH probe; Middle panels: Antioxidant Index (AI) calculated for each concentration. Right panels: dose-response curves. Data points: mean RFUs of triplicate wells; error bars: SD; EC50: efficacy concentrations at which 50% of efficacity is observed and R2: coefficient of determination for the dose-response fit.
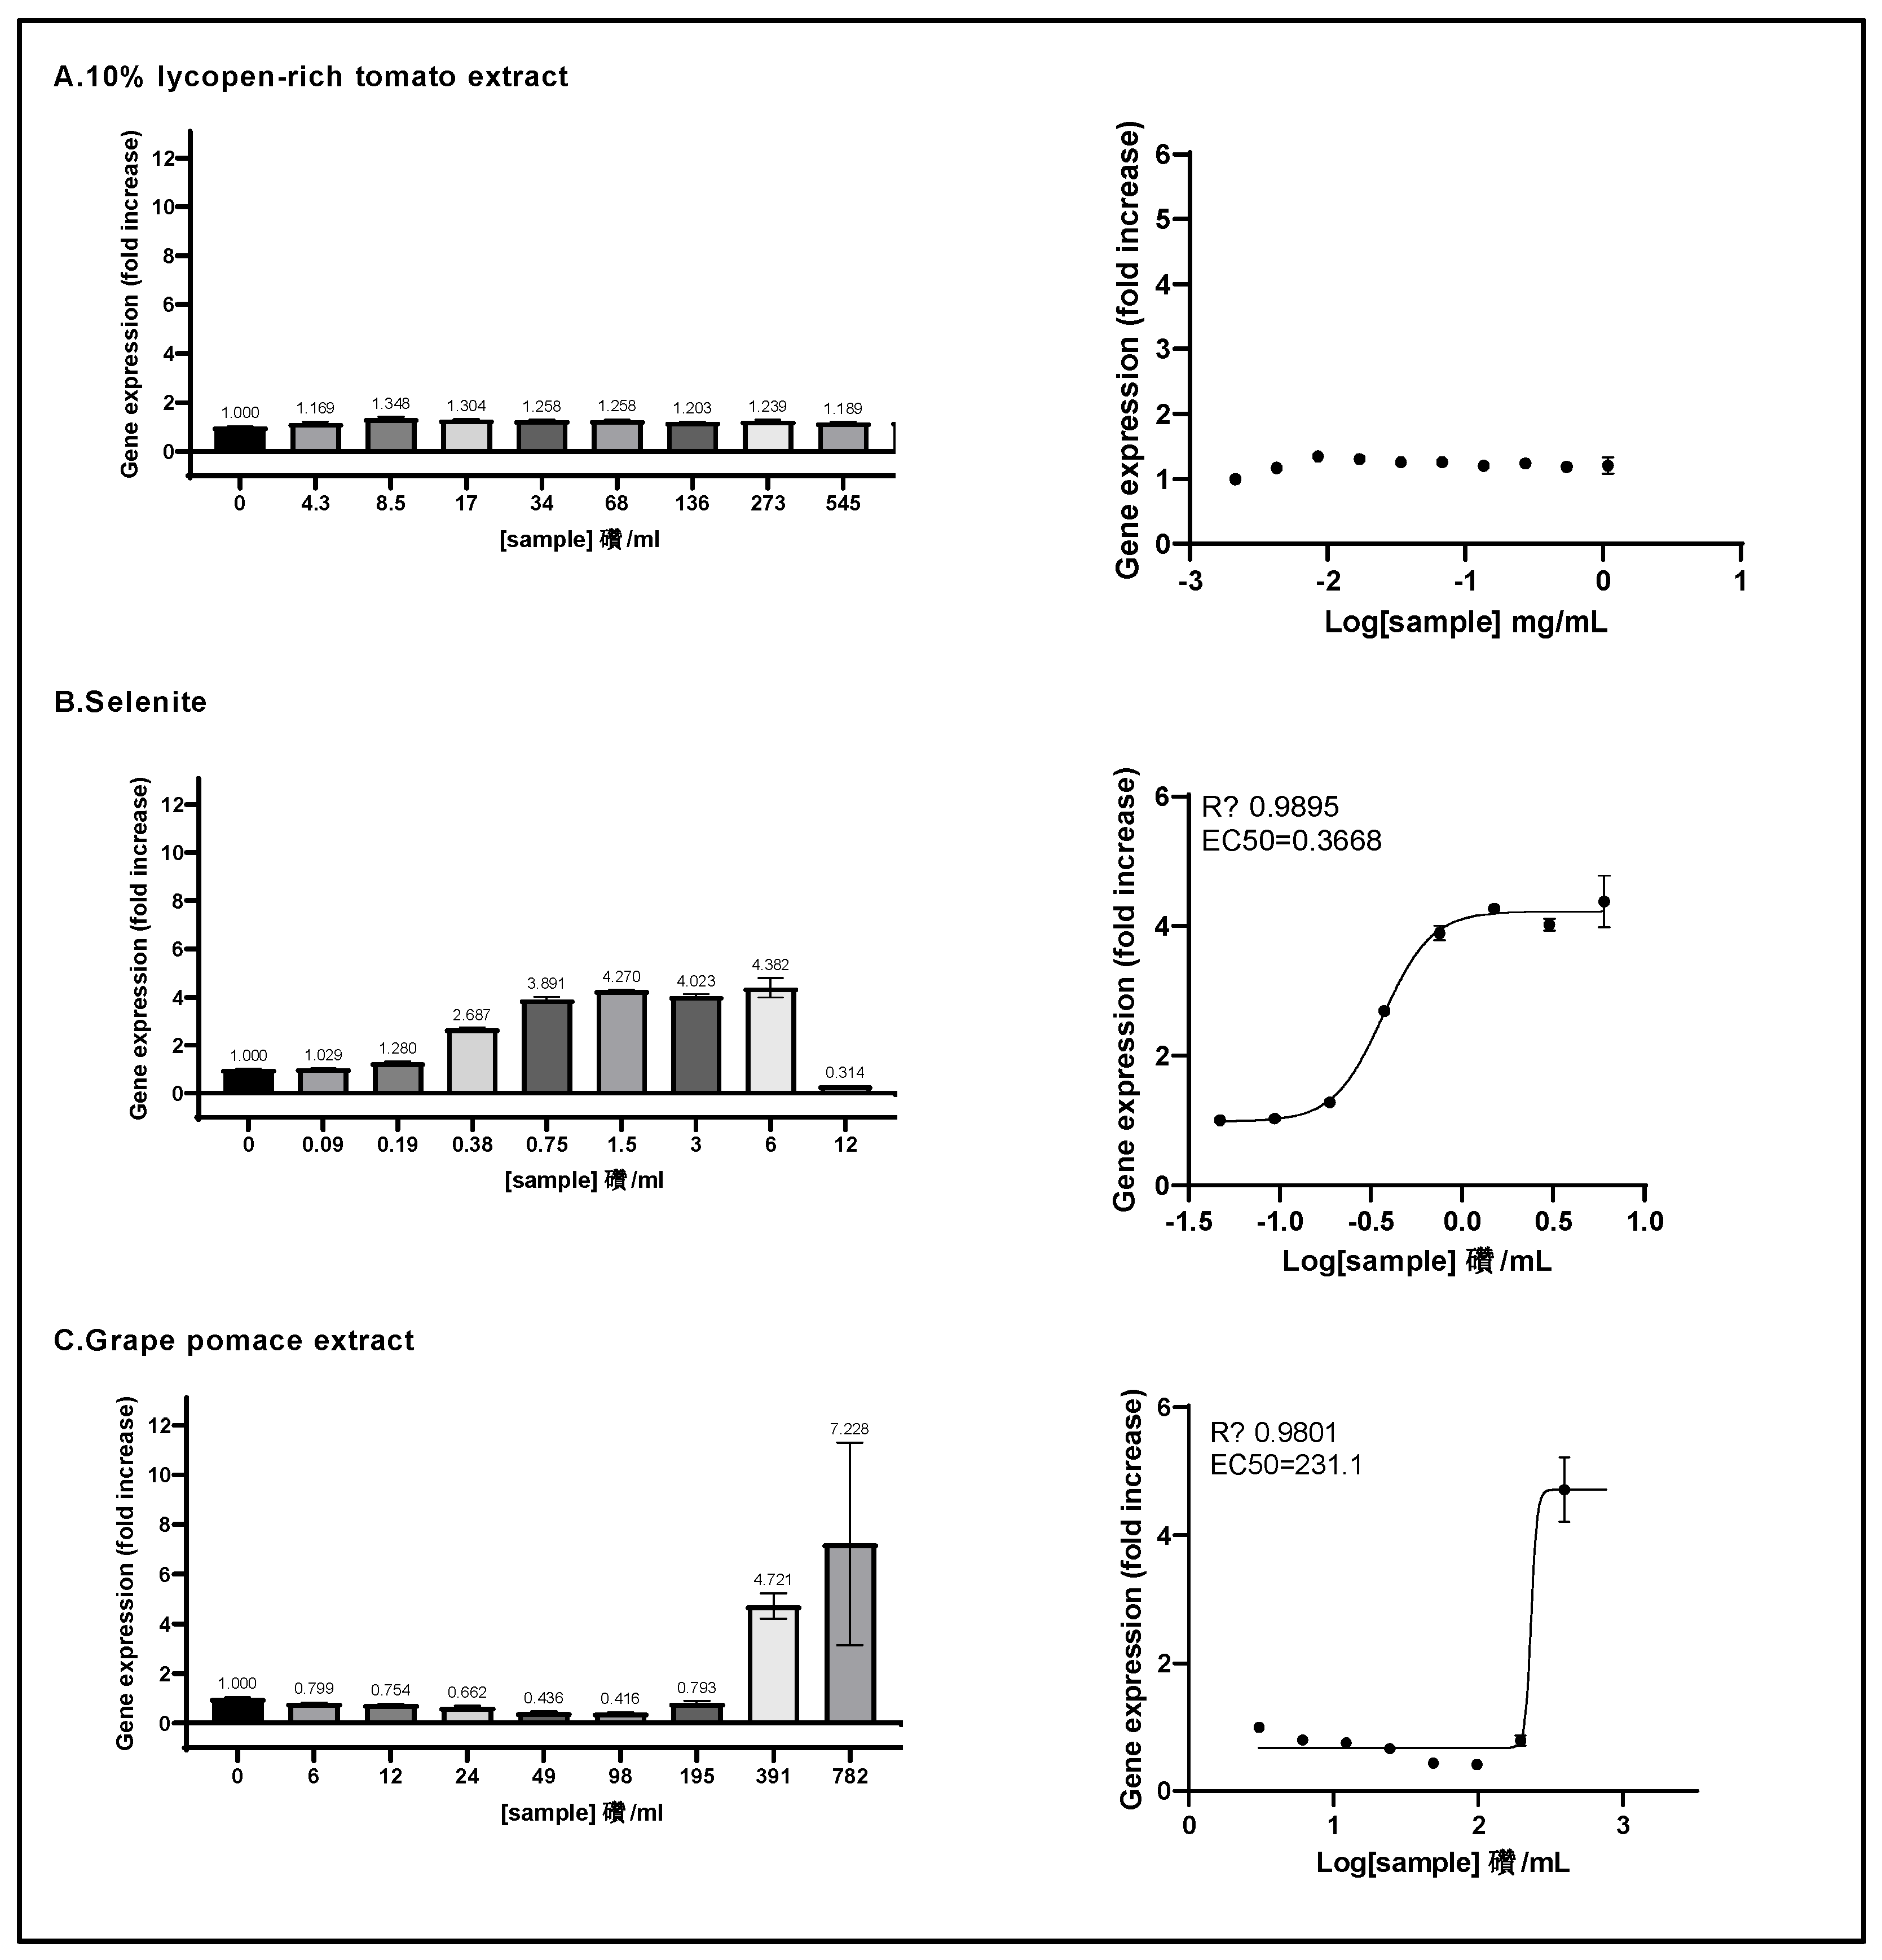
Figure 4.
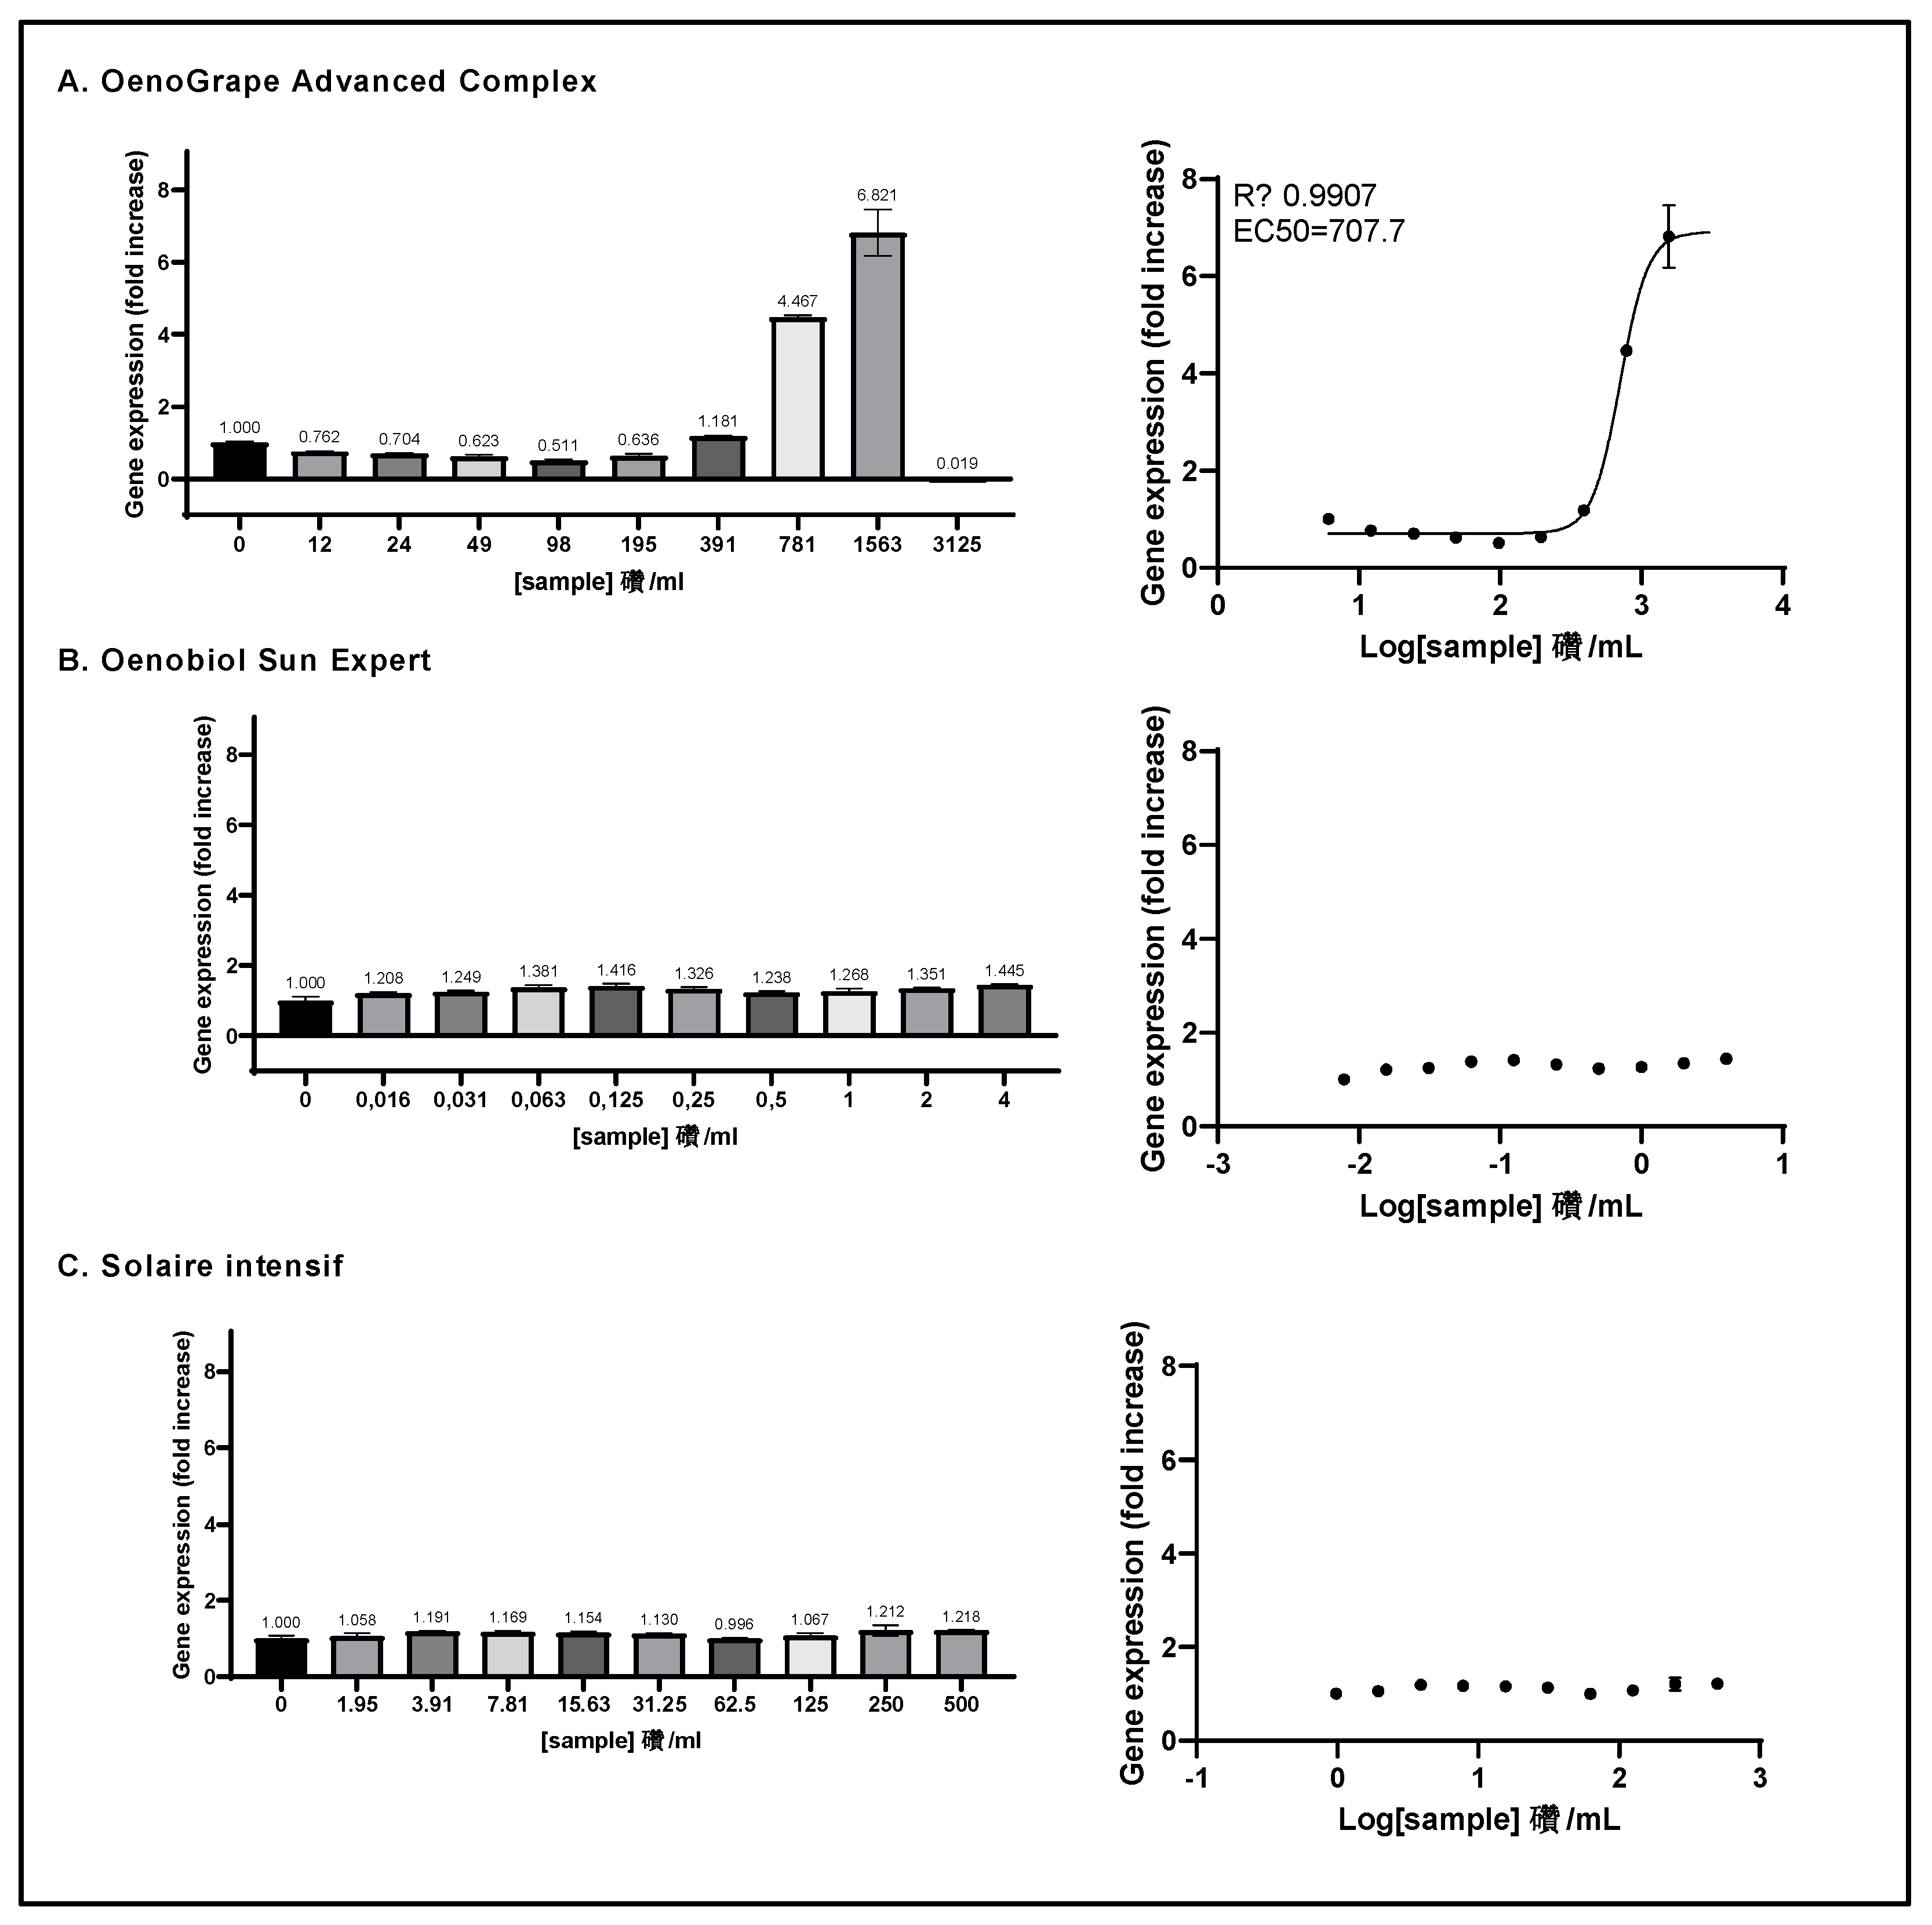
The ARE transcriptional activity of the three individual ingredients was assessed on ARE-luc-HepG2 cells. ARE-luciferase-HepG2 cells were treated for 17 hours with a range of concentrations of 10% lycopene - rich tomato extract (A), sodium selenite (B) and grape pomace extract (C), and luciferase luminescence was measured as relative luminescence units. Left panels: the graphs display the luciferase gene expression as fold increase (FI) relative to the vehicle control. Right panels: the dose-response curves are represented, where the log-transformed concentrations are plotted on the x-axis against fold increase in the gene expression (FI). Data points: mean FI of duplicate measurements; error bars: SD; EC50: efficacy concentration required for 50% of the maximum effect; R2: coefficient of determination for the dose-response curve.
Figure 5.
The ARE transcriptional activity of OenoGrape Advanced Complex, Oenobiol Sun Expert and Solaire Intensif formulations was evaluated on ARE-luc-HepG2 cells. ARE-luciferase-HepG2 cells were treated for 17 hours with a range of concentrations of OenoGrape Advanced Complex (A), Oenobiol Sun Expert (B), and Solaire Intensif (C) formulations, and the luciferase luminescence was measured. The left panels display the fold increase in gene expression (FI) relative to the vehicle control, while the right panels present the dose-response curves with the log-transformed concentrations plotted on the x-axis and the fold increase in gene expression (FI) on the y-axis. Data points: the mean fold increase in gene expression (FI) of duplicate measurements; error bars: SD; EC50: efficacy concentration required to achieve 50% of the maximum effect, and R2: coefficient of determination for the dose-response fit.
Figure 6.
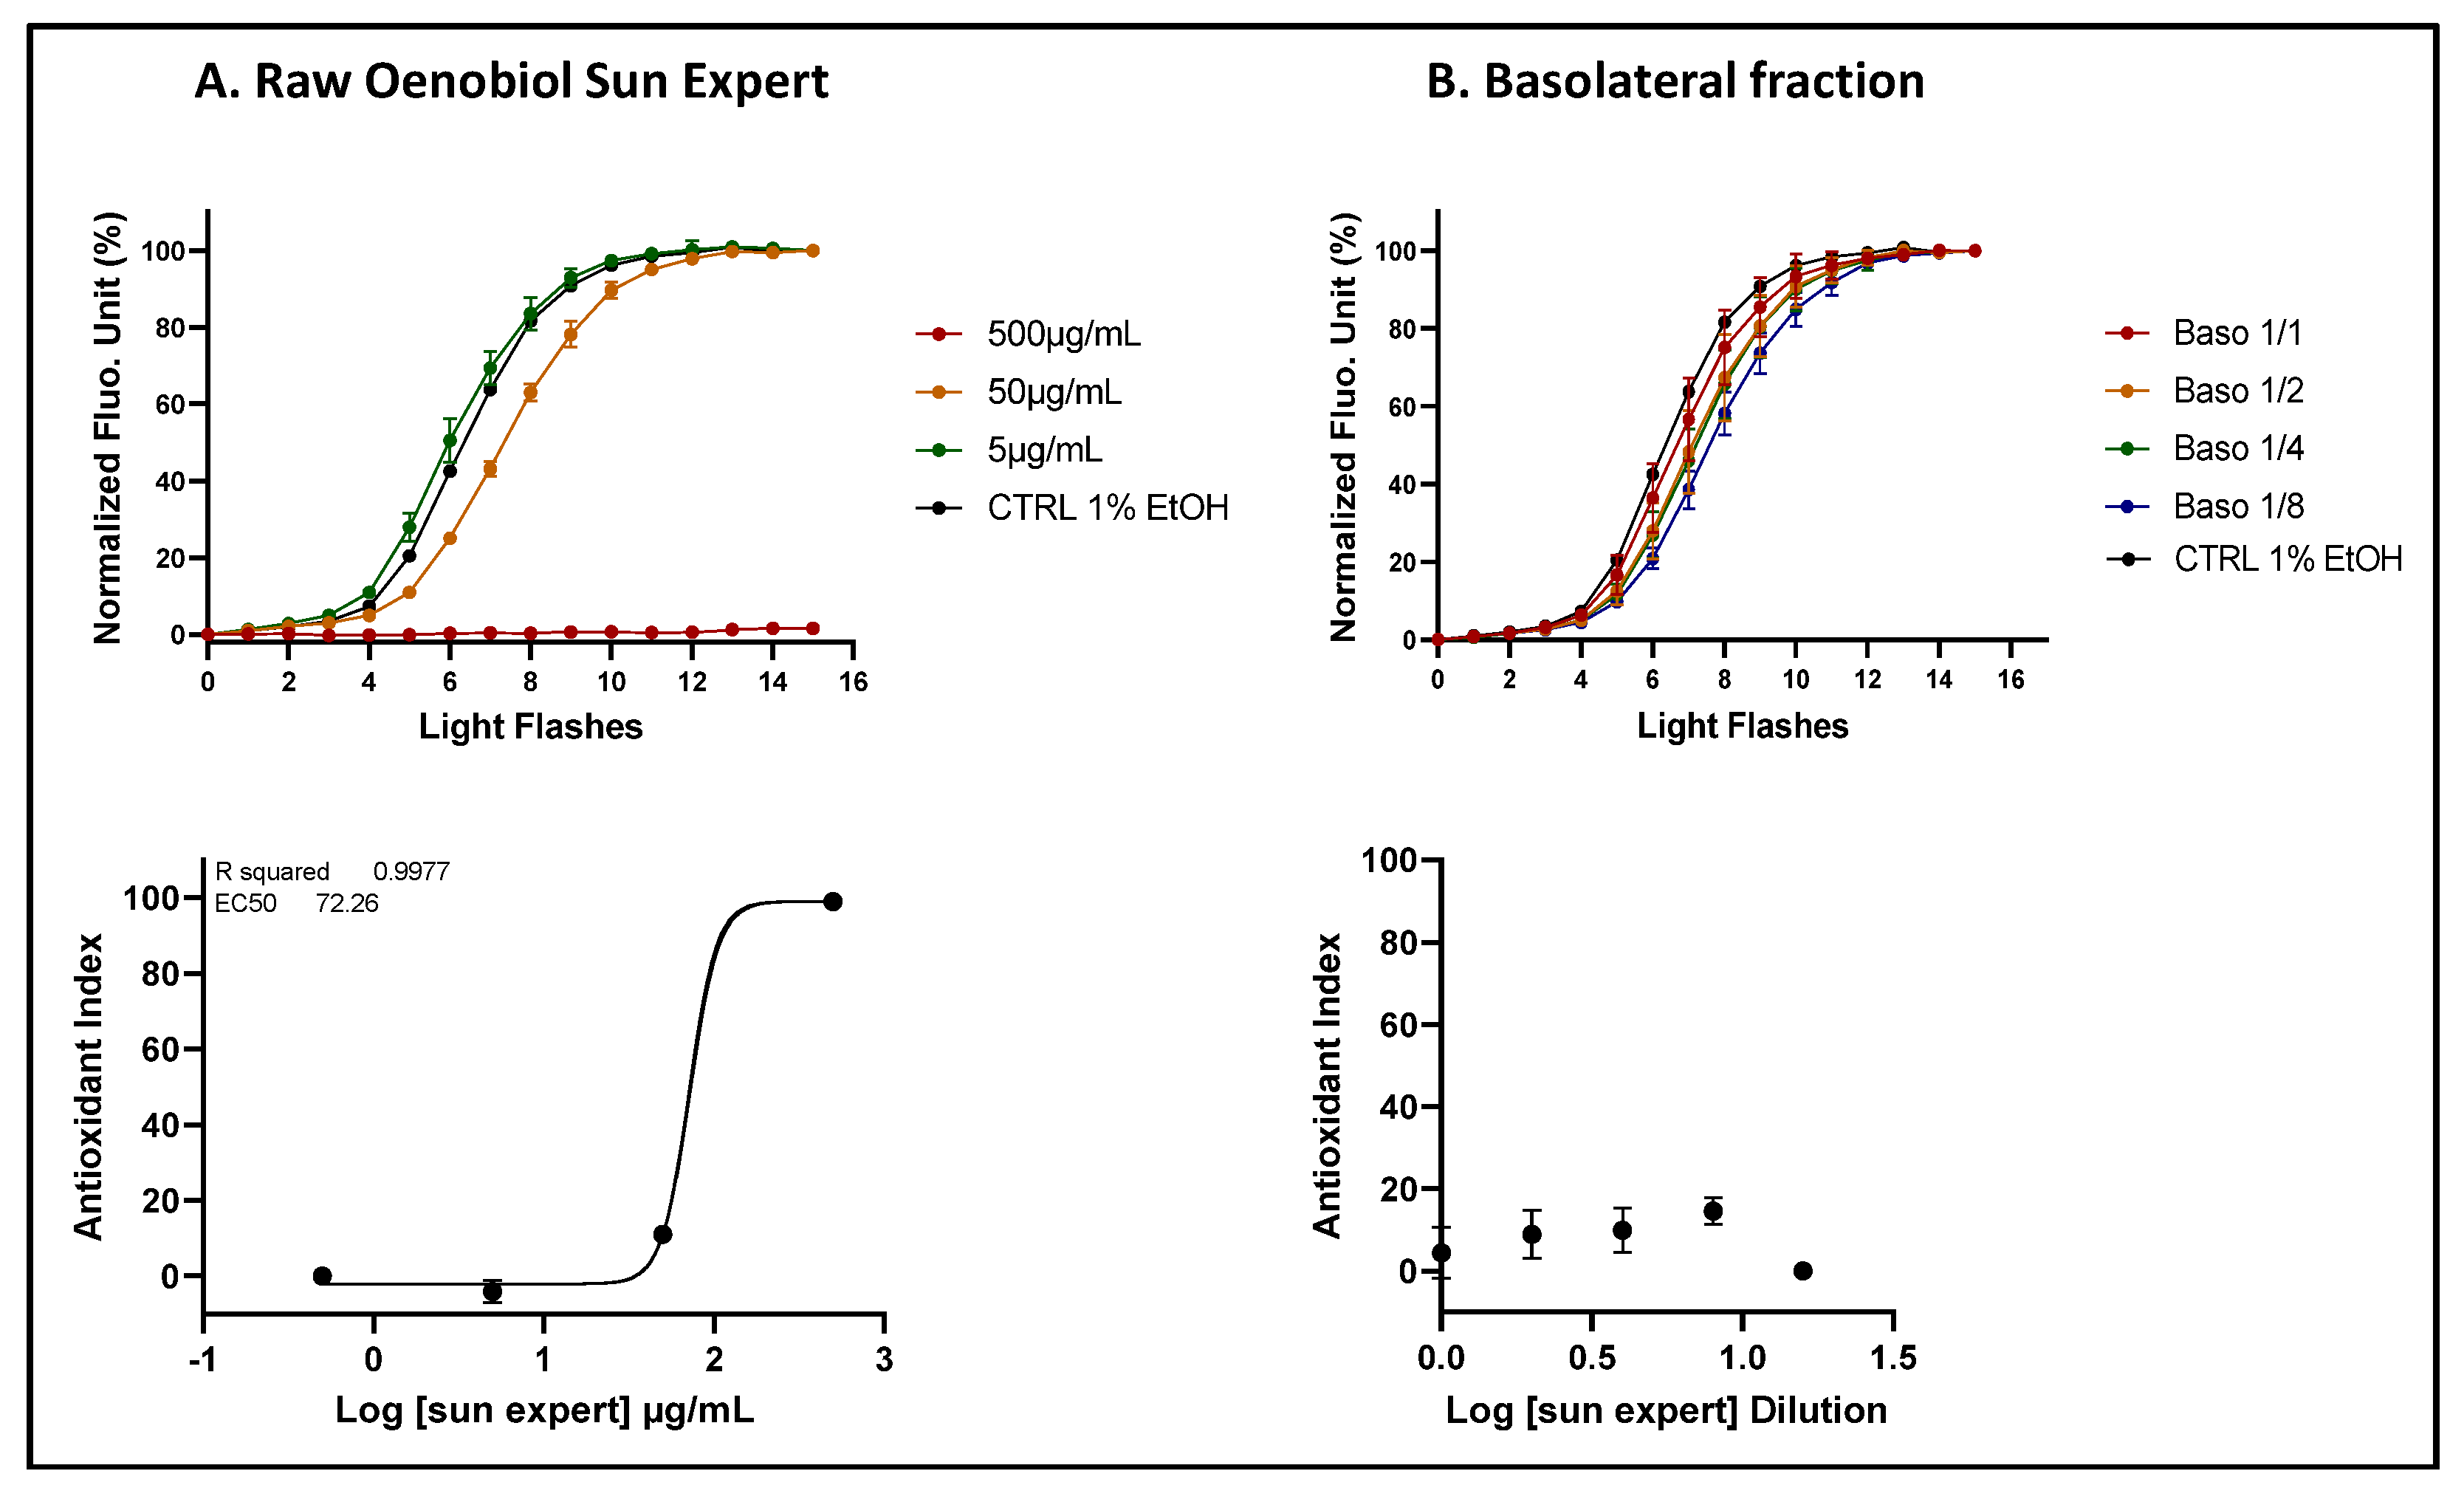
A comparative analysis of ROS scavenging activity (AOP1 assay) in HepG2 cells was performed for the Oenobiol Sun Expert formulation, before and after intestinal transepithelial transfer. HepG2 cells were treated with increasing concentrations of raw Oenobiol Sun Expert (panel A) and with serial dilutions of the basolateral fractions obtained from Caco2 cells following a 1-hour incubation with Oenobiol Sun Expert (panel B). Top panels: kinetic fluorescence profiles, with the x-axis representing the light flash number and the y-axis showing the normalized Relative Fluorescence Unit (RFU) values. Bottom panels: Dose-response curves, where log concentrations or log dilutions are plotted on the x-axis and the Antioxidant Index on the y-axis. Data points: mean RFUs of triplicate measurements; error bars: SD; EC50: efficacy concentrations at 50% effect; R2: coefficient of determination.
Figure 7.
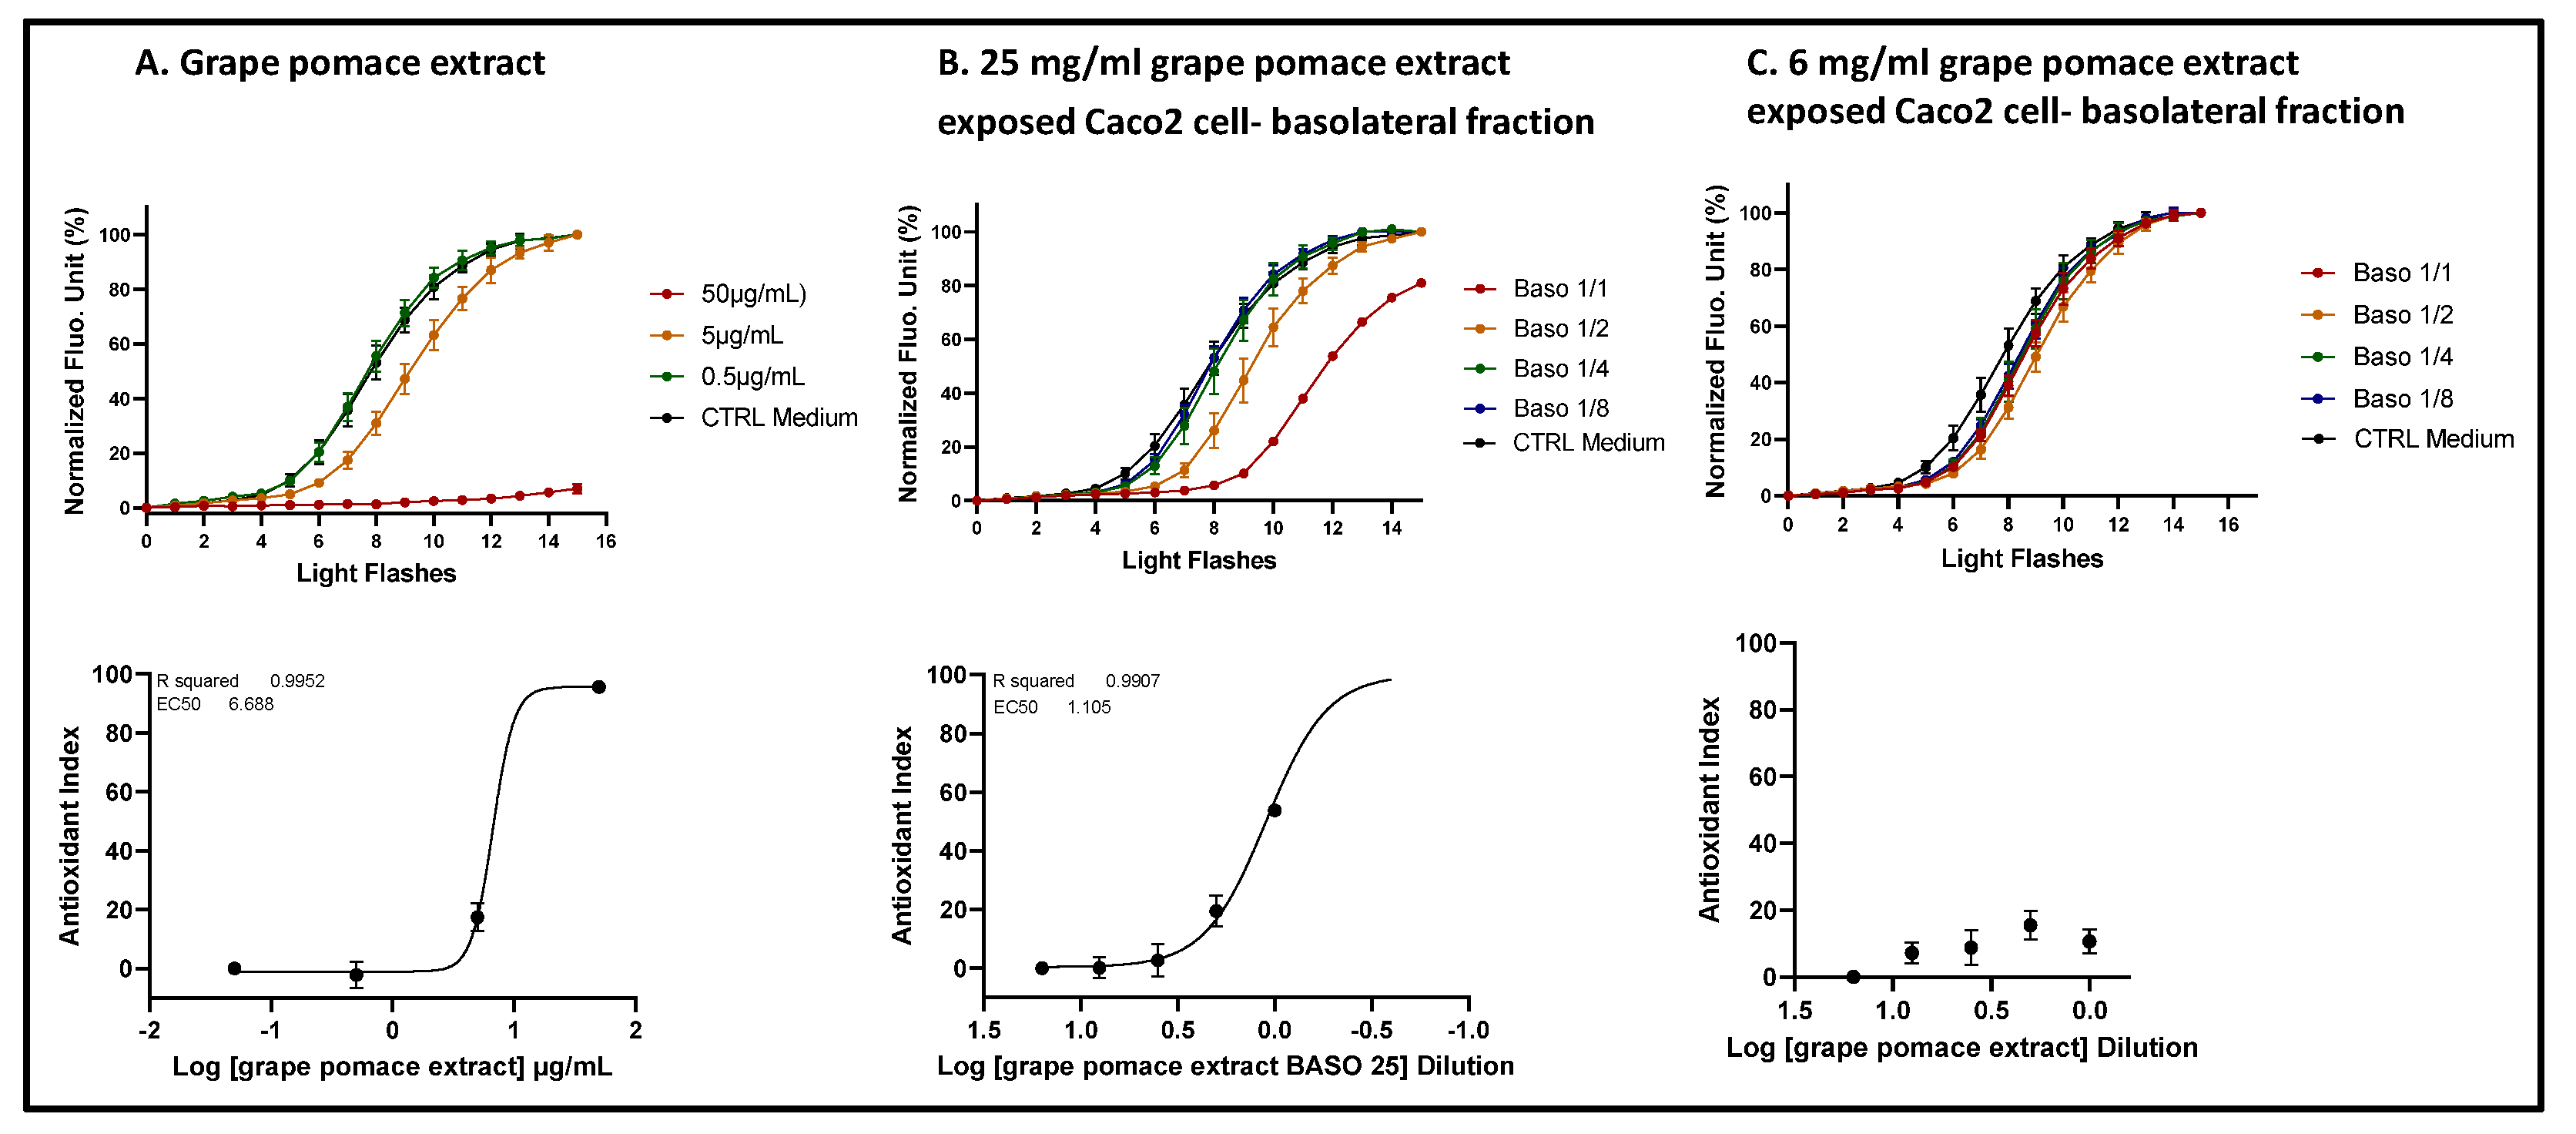
The comparison of ROS scavenging activity (AOP1 assay) in HepG2 cells was conducted for grape pomace extract before and after intestinal transepithelial transfer. HepG2 cells were treated with increasing concentrations of raw grape pomace extract (panel A) and increasing dilutions of basolateral fractions collected from Caco2 cells following 1-hour incubation with either 25 mg/ml (panel B) or 6 mg/ml (panel C) grape pomace extract. Top panels: kinetic fluorescence profiles, with the light flash number on the x-axis and the normalized Relative Fluorescence Unit (RFU) values on the y-axis. Bottom panels: Dose-response curves, with log concentrations or log dilutions plotted on the x-axis and the Antioxidant Index on the y-axis. Data points: mean RFUs from triplicate measurements; bars: SD; EC50: efficacy concentrations at 50% effect; R2: coefficient of determination.
Figure 8.
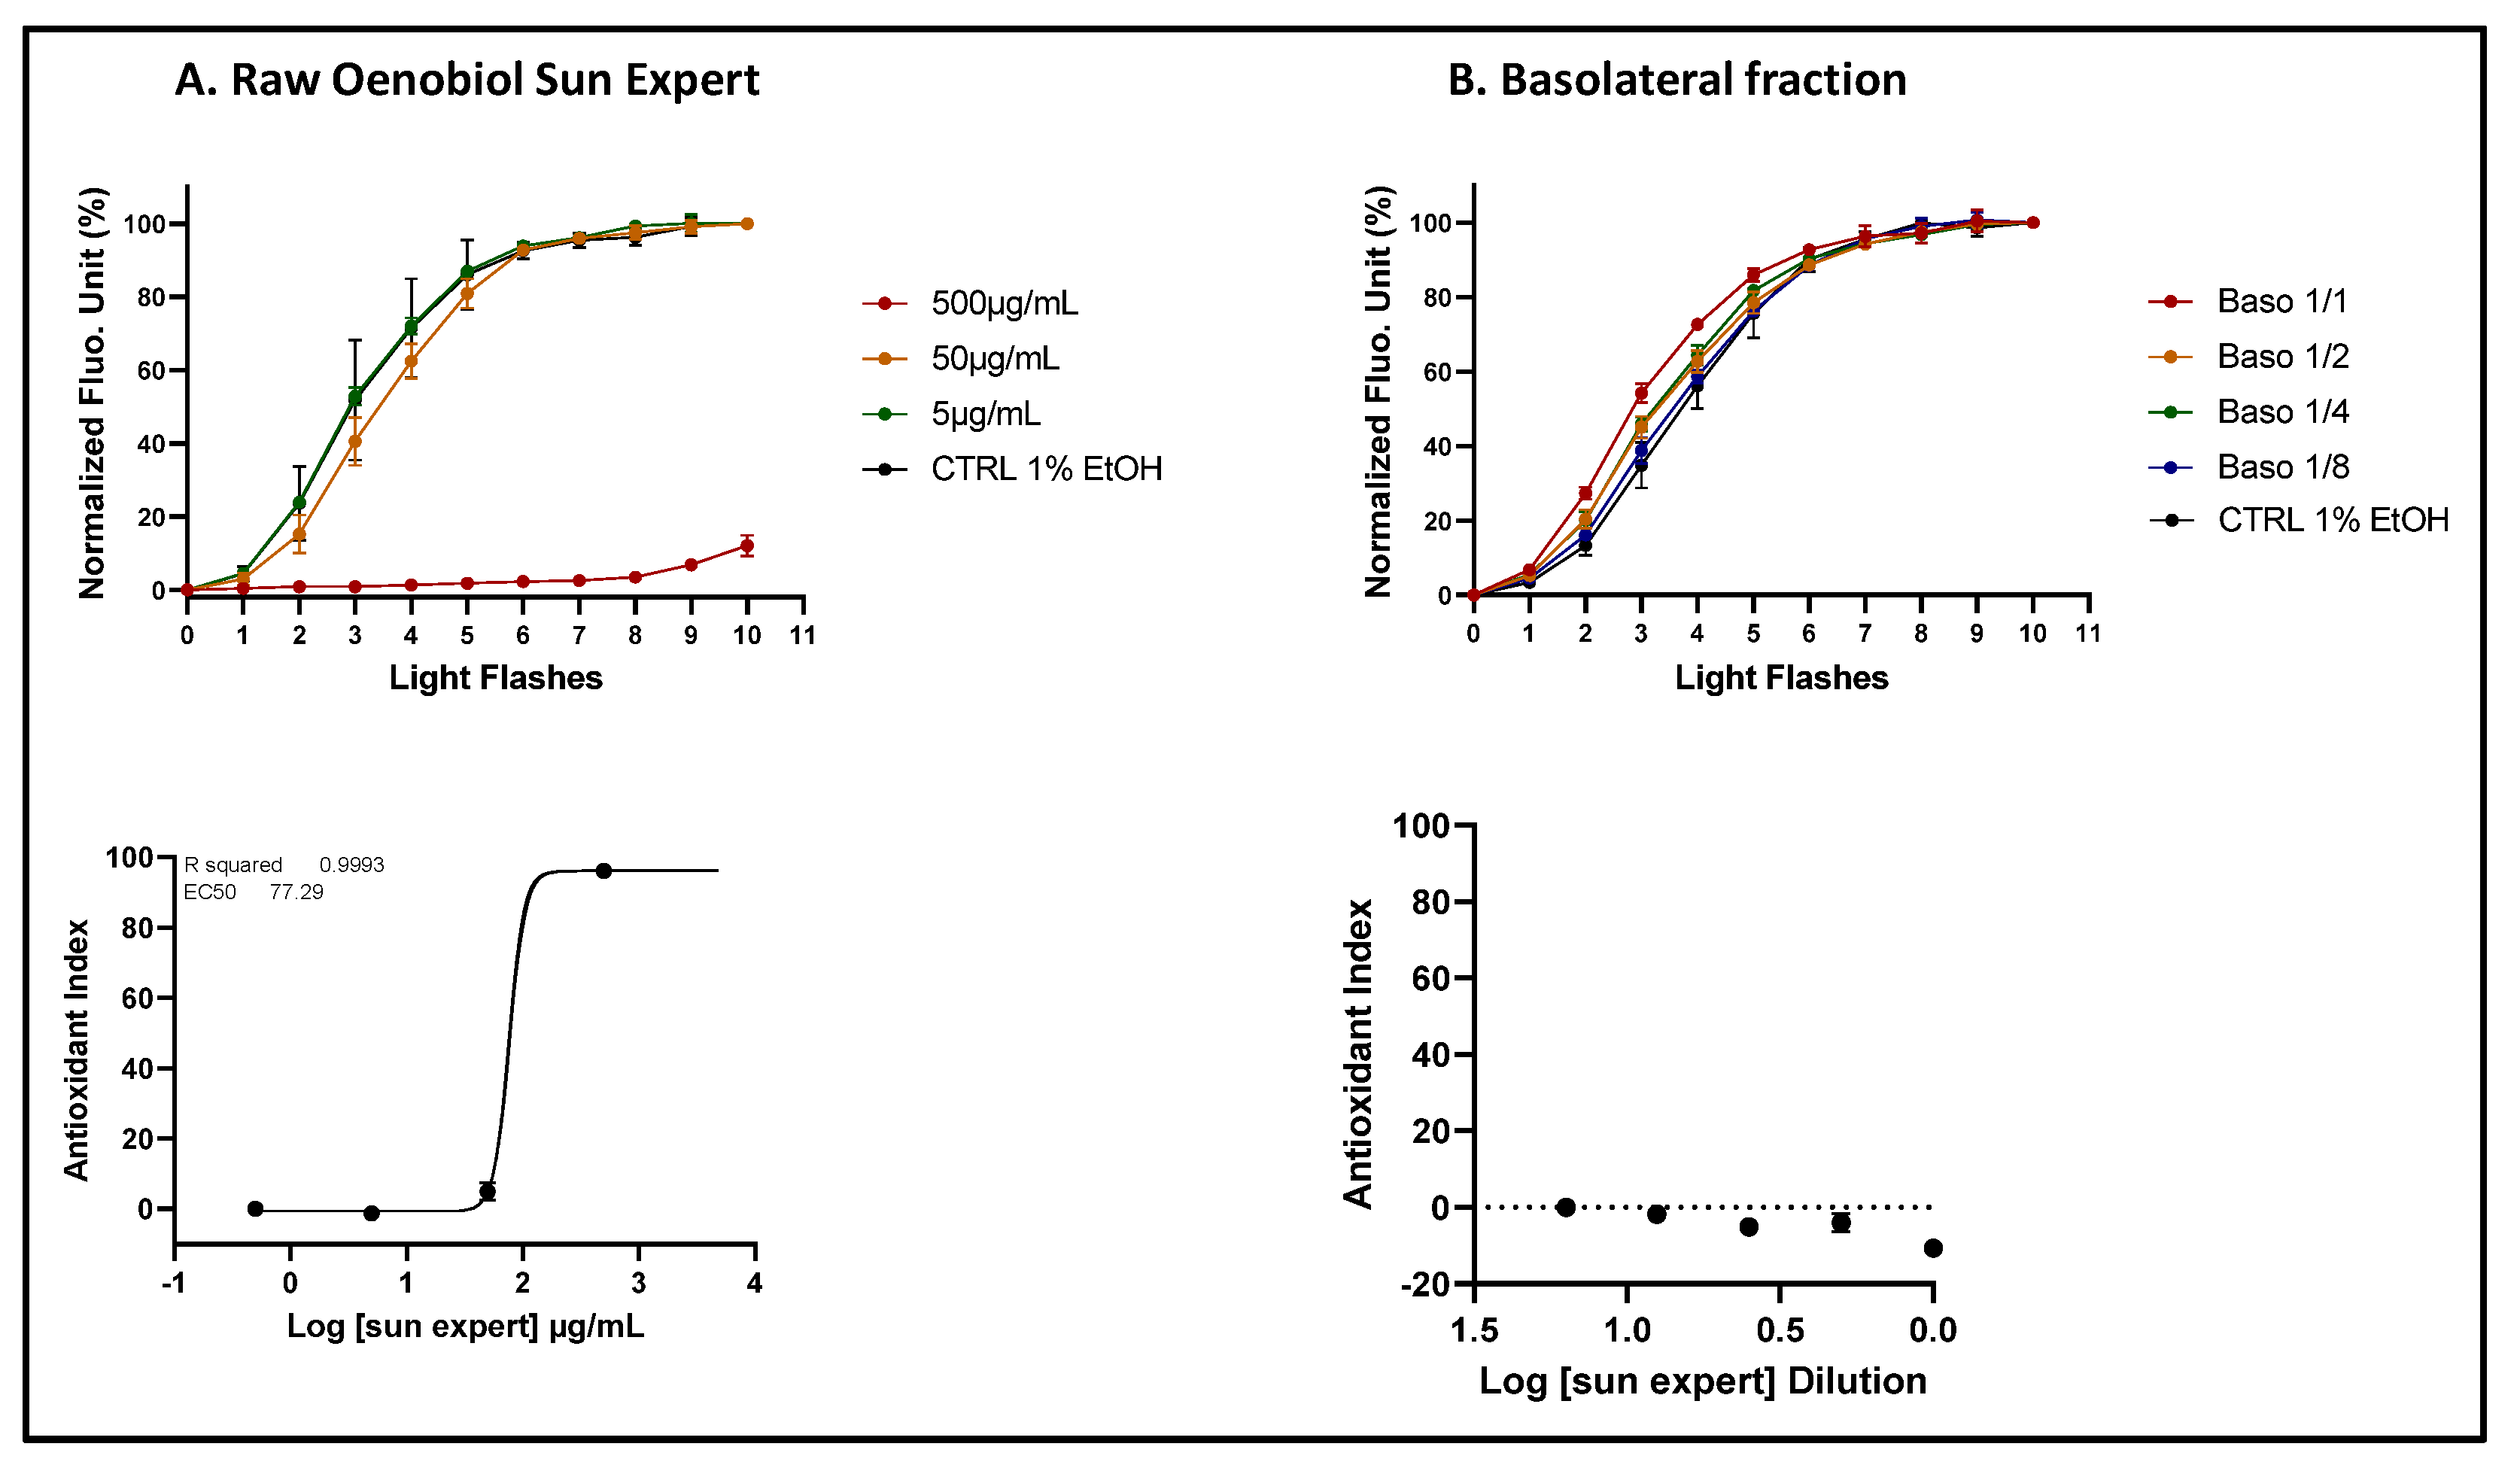
The comparison of ROS scavenging activity (AOP1 assay) in HaCaT cells was performed for the Oenobiol Sun Expert formulation before and after intestinal transepithelial transfer. HaCaT cells were treated with increasing concentrations of raw Oenobiol Sun Expert (panel A) and increasing dilutions of basolateral fractions obtained from Caco2 cells after 1-hour incubation with Oenobiol Sun Expert (panel B). Top panels: kinetic fluorescence profiles, with the light flash number on the x-axis and the normalized Relative Fluorescence Unit (RFU) values on the y-axis. Bottom panels: Dose-response curves, with log concentrations or log dilutions plotted on the x-axis and the Antioxidant Index on the y-axis. Data points: mean RFUs of triplicate measurements; bars: SD; EC50: efficacy concentrations at 50% effect; R2: coefficient of determination.
Figure 9.
The comparison of ROS scavenging activity (AOP1 test) was conducted on HacaT cells for grape pomace extract before and after intestinal transepithelial transfer. HaCaT cells were treated with increasing concentrations of raw grape pomace extract (panel A) and increasing dilutions of basolateral fractions from Caco2 cells after 1-hour incubation with 25 mg/ml (panel B) or 6 mg/ml (panel C) of grape pomace extract. Top panels: kinetic fluorescence profiles, with the light flash number on the x-axis and the normalized Relative Fluorescence Unit (RFU) values on the y-axis. Bottom panels: Dose-response curves with log concentrations or log dilutions plotted on the x-axis and the Antioxidant Index on the y-axis. Data points: mean RFUs of triplicate measurements; bars: SD; EC50: efficacy concentrations at 50% effect; R2: coefficient of determination.
Figure 10.
The comparison of ARE transcriptional activity comparison in ARE-luciferase-HepG2 cells was conducted for sodium selenite before and after intestinal transfer. ARE-luciferase-HepG2 cells were treated for 17 hours with a range of sodium selenite concentrations (panel A) or dilutions of basolateral compartments collected from Caco2 cells after 1-hour incubation with 10 or 20 μg/ml sodium selenite (panel B). Luciferase luminescence was measured as an indicator of ARE pathway activation. The graphs depict the gene expression fold increase (FI) relative to the vehicle control for either decreasing concentrations of sodium selenite or varying dilutions of the basolateral fractions. Data points: mean fold increase (FI) of duplicate measurements; bars: SD.
Figure 11.
The comparison of ARE transcriptional activity in ARE-luciferase-HacaT cells was conducted for sodium selenite before and after intestinal transfer. ARE-luciferase-HacaT cells were treated for 17 hours with a range of concentrations of sodium selenite (panel A) or dilutions of basolateral fractions collected from Caco2 cells following a 1-hour incubation with 10 or 20 μg/ml sodium selenite (panel B). Luciferase luminescence was measured to assess ARE pathway activation. The graphs display the fold increase (FI) in gene expression compared to the vehicle control for either decreasing concentrations of sodium selenite or different dilutions of the basolateral fractions. Data points: mean fold increase (FI) of duplicate measurements; bars: SD.
Table 1.
Efficacy concentrations for intracellular ROS scavenging activity of the three ingredients, OenoGrape Advanced Complex, and Oenobiol Sun Expert were determined using the AOP1 assay in HepG2 cells. EC10, EC50 and EC90: concentrations required to achieve 10%, 50% and 90% of the maximal antioxidant activity; 95% CI: 95% confidence interval; R2: coefficient of determination for the dose-response fits; ND: values not determined.
| Tested compounds |
EC10 (g/ml)
[95% CI] |
EC50 (g/ml)
[95% CI] |
EC90 (g/ml)
[95% CI] |
R2
|
10% lycopene-rich
tomato extract |
ND |
ND |
ND |
ND |
| Sodium selenite |
ND |
ND |
ND |
ND |
| Grape pomace extract |
0.9886
[0.4081; 1.737] |
6.580
[4.880; 8.649] |
43.80
[26.32; 91.52] |
0.9916 |
