Preprint
Article

Investigating Genetic Diversity and Correlations Between Mineral Concentration and Neurotoxin (β-ODAP) Content in the Lathyrus Genus

Altmetrics

Downloads

78

Views

31

Comments

0

A peer-reviewed article of this preprint also exists.

Submitted:

11 October 2024

Posted:

12 October 2024

You are already at the latest version

Alerts
Abstract
Grass pea (Lathyrus sativus L.) is a nutritious legume crop well-adapted to fragile agro-ecosystems that can survive under challenging climatic conditions. The cultivation of grass pea faces stigma primarily due to the presence of β-N-Oxalyl-l-α, β-diaminopropionic Acid (β-ODAP), which is associated with a risk of inducing neurolathyrism upon prolonged consumption of its grains as a staple diet. The grass pea improvement program of International Center for Agricultural Research in the Dry Areas (ICARDA) aims to reduce β-ODAP content to a safe level along with improving yield potential and nutritional quality of grass pea. In this study, 183 germplasm accessions representing 13 different Lathyrus species and 11 L. sativus breeding lines were evaluated for β-ODAP content based on Rao protocol and mineral concentration using ICP-OES. Significant variability was observed among the accessions for the studied traits. The results showed low β-ODAP content and high mineral concentration in 25 accessions of crop wild relatives (CWR) which included L. cicera, L. ochrus and L. cassius with one accession IG65277 of L. cassius, in addition to two lines IG117034 and ACC1335 of L. sativus having very low ODAP content. Furthermore, some accessions of L. pseudocicera, L. aphaca, L. cicera, L. marmoratus, L. gorgoni and L. tingitanus also showed low β-ODAP content. The results showed significant positive correlations between different trait combinations viz., K and P (r =0.193***), K and Fe (r =0.177***), Mn and Fe (r = 0.210***), Mn and Se (r = 0.137***), ODAP and Mg (r = 0.158**), and ODAP and Ca (r = 0.140**). L. cicera, L. ochrus, and L. cassius were identified as a great source for improving the mineral concentration and reducing ODAP content in the cultivated grass pea.
Keywords: 
Subject: Biology and Life Sciences  -   Agricultural Science and Agronomy

1. Introduction

Grass pea (Lathyrus sativus L.) is a nutritious legume popularly known as chickling pea, khesari in India and Bangladesh, pois carré or gesse in France, Cicerchia coltivata in Italy, guaya in Ethiopia, and san li dow in China. It is an annual cool season crop of economic and ecological significance in South Asia and sub-Saharan Africa, and to a limited extent in Central and West Asia and North Africa (CWANA), Southern Europe and South America [1]. Globally, grass pea cultivated area at 0.70 million ha with 0.79 million tons’ production has observed drastic reduction from the last global estimate of production (1.2 million tons) and area (1.5 million ha) [2]. Grass pea is one of the most resilient crops due to its ability to grow under extreme climatic conditions such as drought, waterlogging, soil salinity and high temperature but remains the most underutilized crop for adaptation to fragile agro-ecosystems.
The genus Lathyrus comprises about 181 annual and perennial species [3]. L. sativus is widely cultivated as food and feed crop [4] mostly in the Indian sub-continent, Ethiopia, and the Mediterranean region [5]. L. cicera is grown mainly as stock feed both as fodder and grain, and its cultivation has been confined to South-western Europe and to a limited extent in West Asia and North Africa [6]. Recently, grass pea has received considerable attention from scientific and farming communities and it is considered as an excellent option for building agri-food sustainability under stress conditions such as drought, waterlogging, high temperature, cold, and salinity [7]. It has a very hardy and penetrating root system and, therefore, can be grown on a wide range of soil types including very poor soil and heavy clays. Its ability to fix atmospheric nitrogen up to 124 kg/ha, especially in dry conditions [8], makes the crop well suited for harsh conditions [9]. In South Asia, grass pea is well-suited to the rice ecosystem as it is typically broadcasted in the standing rice crop before its harvest, thriving on the residual moisture. Therefore, it makes a valuable contribution for development of sustainable rice production system [9,10]. Compared with the other legumes, grass pea is relative resistance to insect pests [11,12] and diseases but highly susceptible to parasitic weeds, Orobanche crenata and O. foetida [13]. The grass pea seeds are rich in protein, micronutrients, and fiber [14,15,16]. In addition to that it is also rich in magnesium, phosphorus, calcium, iron, zinc, manganese, and copper. Despite these advantages, its consumption has declined due to the presence of a neurotoxin known as β-N-oxalyl-L-α, β-diaminoproprionic acid (β-ODAP) in seeds and vegetative tissues that can lead to Neurolathyrism, if taken in large quantity continuously for a longer period as staple diet [10,17,18,19,20]. Previous studies conducted on L. sativus showed significant variability in seeds’ β-ODAP content ranging from 0.518 to 1.001 mg/100 g [21]. These levels are 2 to 5 times higher than the level presumed to be safe for human consumption [22]. Various processing methods have been suggested to reduce the β-ODAP content [23,24]. However, none has proven entirely effective in eliminating β-ODAP, including techniques such as soaking and boiling, roasting, extrusion, cooking, fermenting, and autoclaving [25]. Crop improvement efforts are currently underway, employing conventional methods to identify grass pea genotypes with lower neurotoxin levels at ICARDA [26]. Exploring the inter- and intra-specific genetic diversity within the Lathyrus genus could serve as a valuable strategy for discovering and mining low β-ODAP traits.
This study was undertaken with following objectives: 1) to select low β-ODAP germplasm of Lathyrus sativus with high macro- and micronutrient contents, 2) to assess correlations among nutritional traits and β-ODAP content, and 3) to explore the genetic variability for nutrient and β-ODAP concentrations among the crop wild relatives of Lathyrus.

2. Results

2.1. ODAP Content and Macro and Micro-Nutrients Concentrations

The MANOVA (Table 1) showed significant genotypic differences (P < 0.01) for macro- and micro-nutrients, and for ODAP content among the accessions. The results indicated the highest mean values for potassium (K) 2953.8 ppm and zinc (Zn) 33.4 ppm but Mg (magnesium) and selenium (Se) showed lower concentrations of 1027.5 and 0.1 ppm, respectively. Phosphorus (P) content varied from 953.7 (IG65224) to 3788.9 ppm (IG64807). Notably, IG64807 of L. ochrus exhibited maximum value of P (Table 1). Calcium (Ca) content ranged from 688.4 ppm (IG64834) to 1678.4 ppm (IG116889). The highest Ca and K concentrations were observed in L. sativus (IG116889) and (IG117365), respectively, both originated from Bangladesh (Table S1). The maximum Mg concentration was observed in IG65074 (L. cicera). Two accessions namely, IG117012 and ACC1916 of L. sativus showed the highest values of Fe (57.1 ppm) and Mn (30.0 ppm) content. ACC1348 revealed the highest Zn (48.7 ppm) content among all the accessions. The highest concentration of Se was recorded in IG62145 (L. odoratus) (Table 1). Low ODAP content was observed in IG65277 (0.01%) and high content in IG65340 (0.3%). Indeed, this L. cassius accession, IG65277, is originated from Syria. High heritability was recorded for Mn, Fe, Se and ODAP contents, moderate heritability for P, K, Ca and Mg contents, and low heritability for Zn. Significant genotypic variation was observed for all the parameters. The coefficients of variance (CV%) and LSD (95%) showed variation for nutrient content and ODAP. The highest value of CV was recorded for Mn (122.51%). Low genotypic variance (0.02) and LSD (0.1) were observed for Se (Selenium).

2.2. PCA of Macro-Nutrients

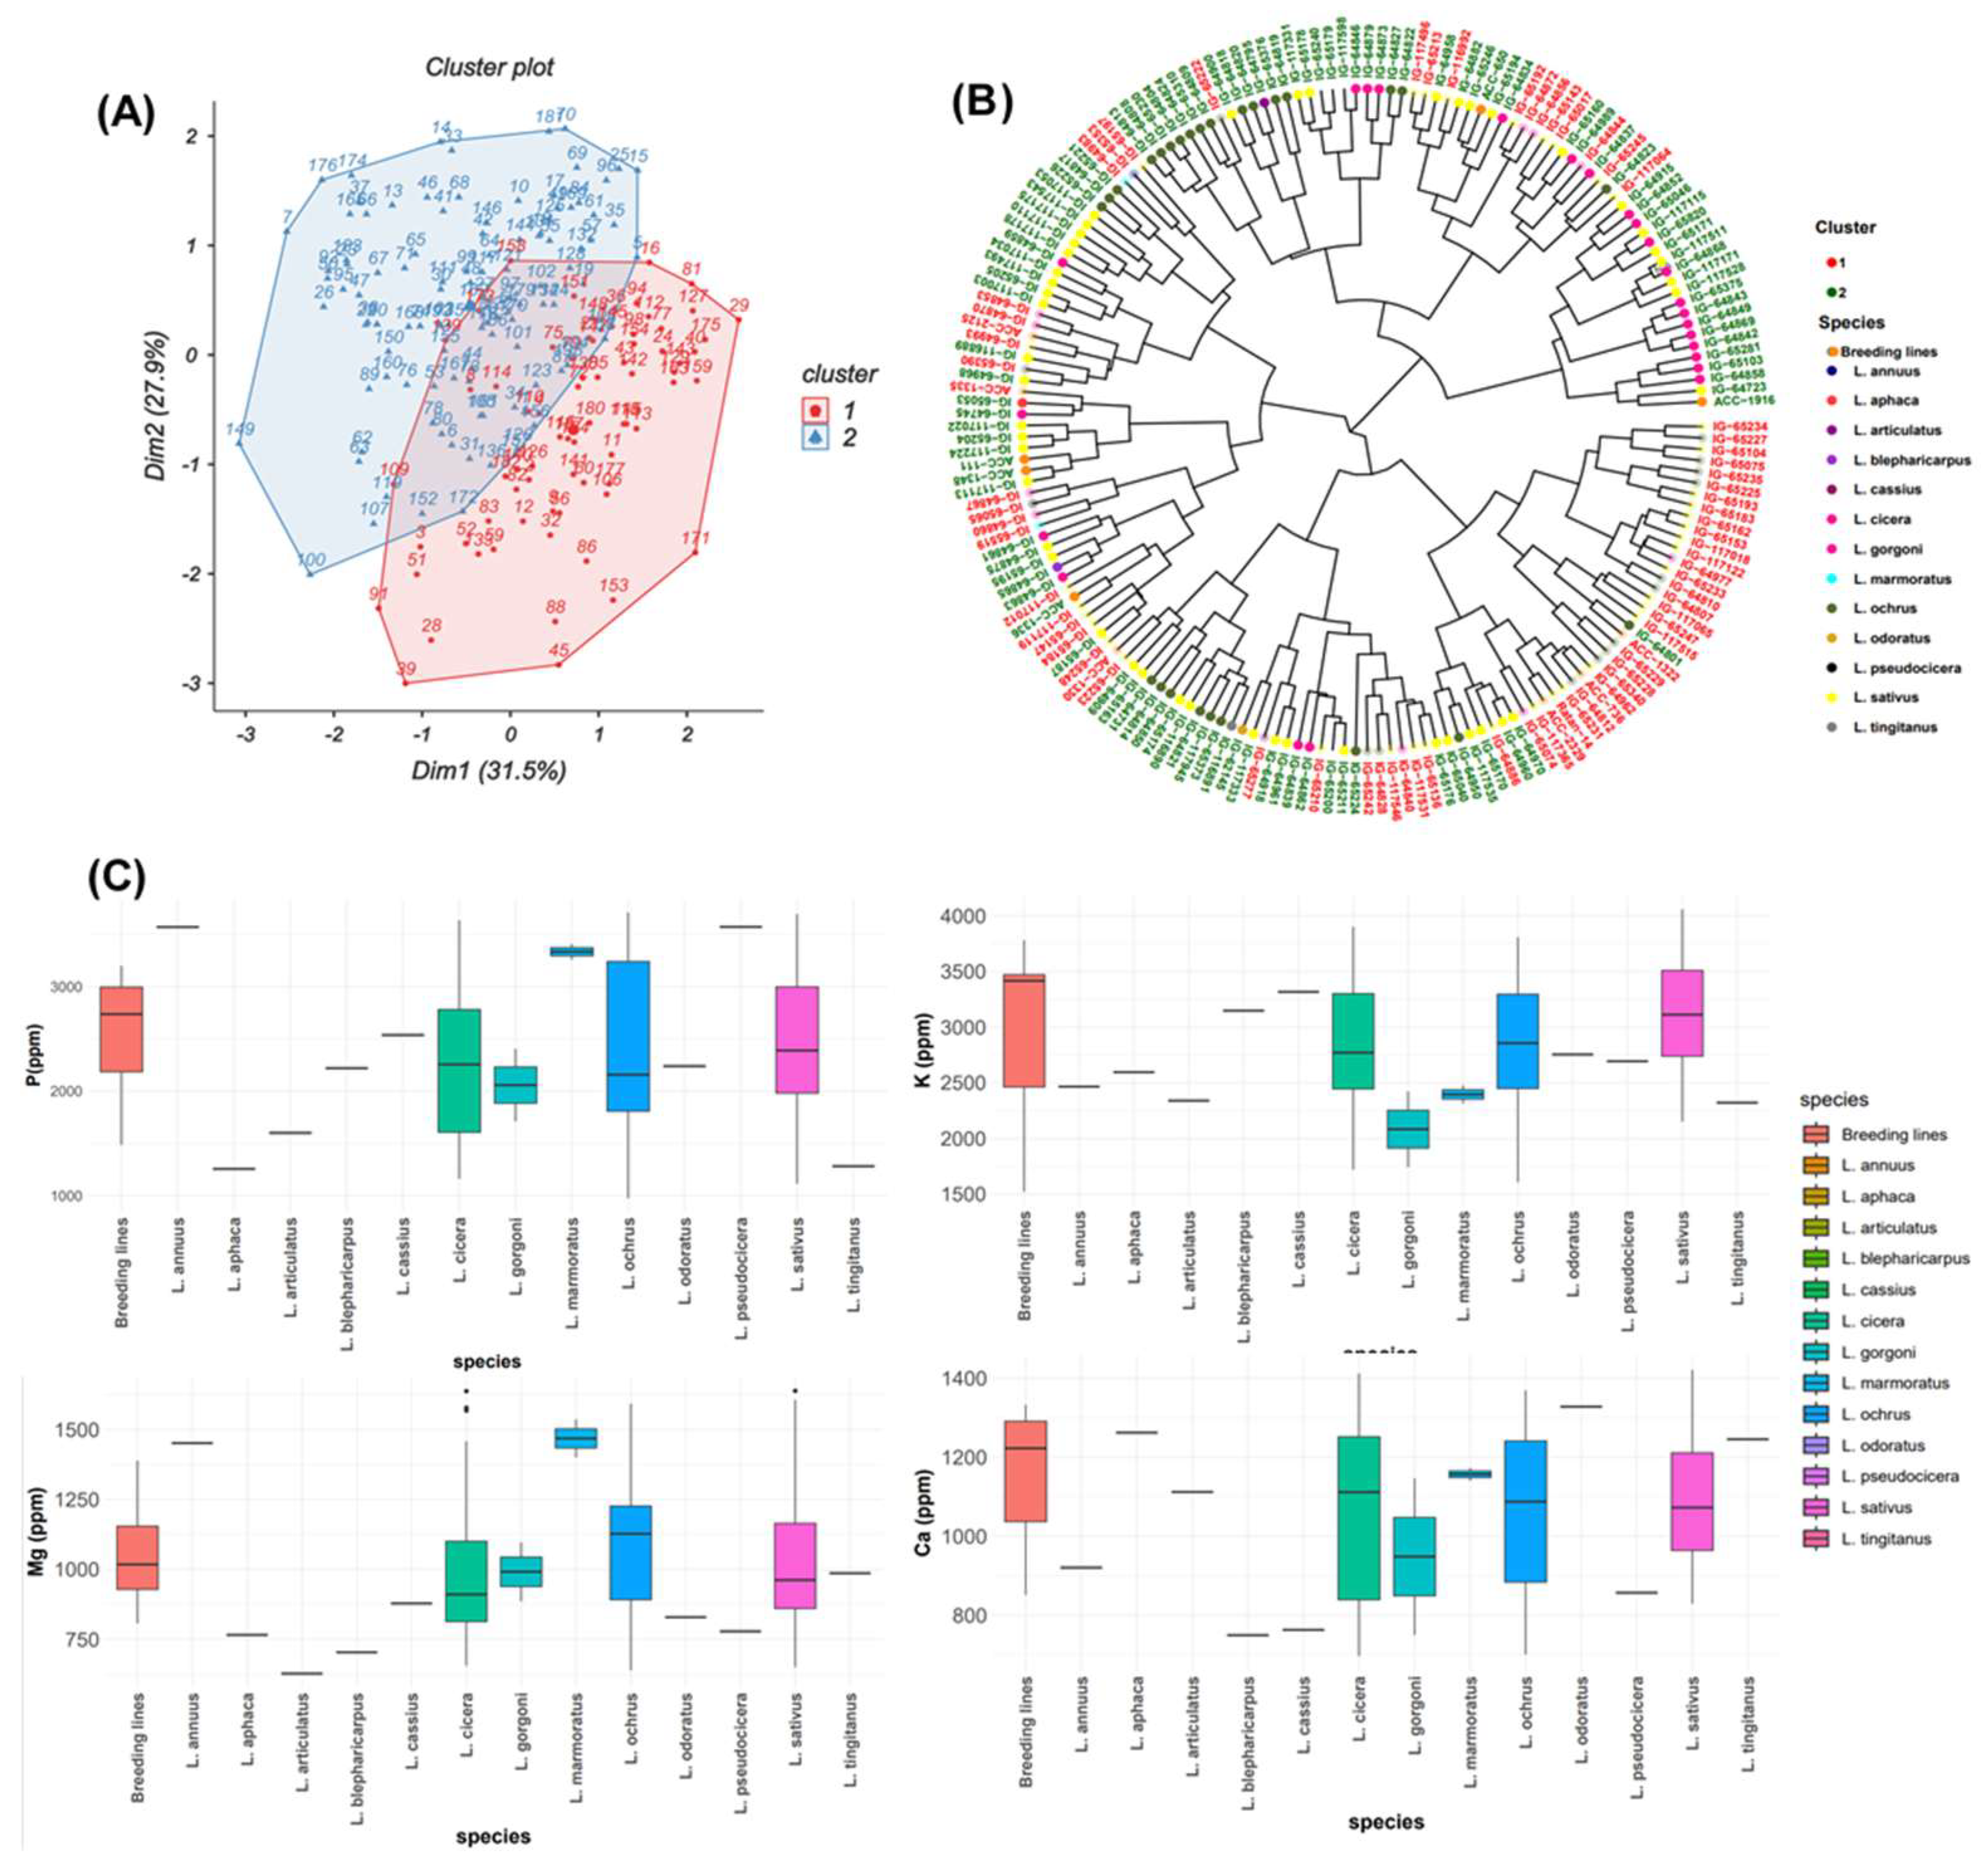
Normal distribution frequency was observed for all macronutrients (Figure 1). The first two principal components explained together 59.4% of the total variance for macronutrient contents (Figure 2A). The first component of PCA (PC1) accounted for 31.5% and the second component PC2 explained an additional 27.9% of the observed variation.
Table 2 revealed that PC1 was positively correlated with Mg (r = 0.599). PC2 was positively correlated with P (r = 0.630) and K (r = 0.753), but negatively correlated with Ca and Mg. PC3 recorded positive correlation with Ca (r = 0.678), a low positive correlation with Mg (r = 0.187), while a negative correlation with P (r = -0.014) and K (r = -0.033). The results showed that PC4 was positively correlated with P (r = 0.335), Ca (r = 0.177) and Mg (r = 0.524) but negatively correlated with K (r = - 0.068).
Bold values for each column correspond to the parameters highly correlated (positive or negative) with each of the four PCs.
The PCA biplot (Figure 2A) grouped these accessions into two clusters. The first cluster comprised of 72 accessions mainly from breeding lines, L. cicera, L. gorgoni, L. ochrus and L. sativus (Figure 2C) with high P and K and moderate Mg and Ca contents. The second cluster consisting of 111 accessions, exhibited comparable magnesium (Mg) and calcium (Ca) values to those in cluster 1, along with lower potassium (K) and phosphorus (P) contents than cluster 1. Cluster 2 included accessions belonging to L. annuus, L. aphaca, L. articulatus, L. blepharicarpus, L. cassius, L. mamoratus, L. odoratus, L. pseudocicera and L. tingitanus (Figure 2B, C).

2.3. PCA of Micronutrients

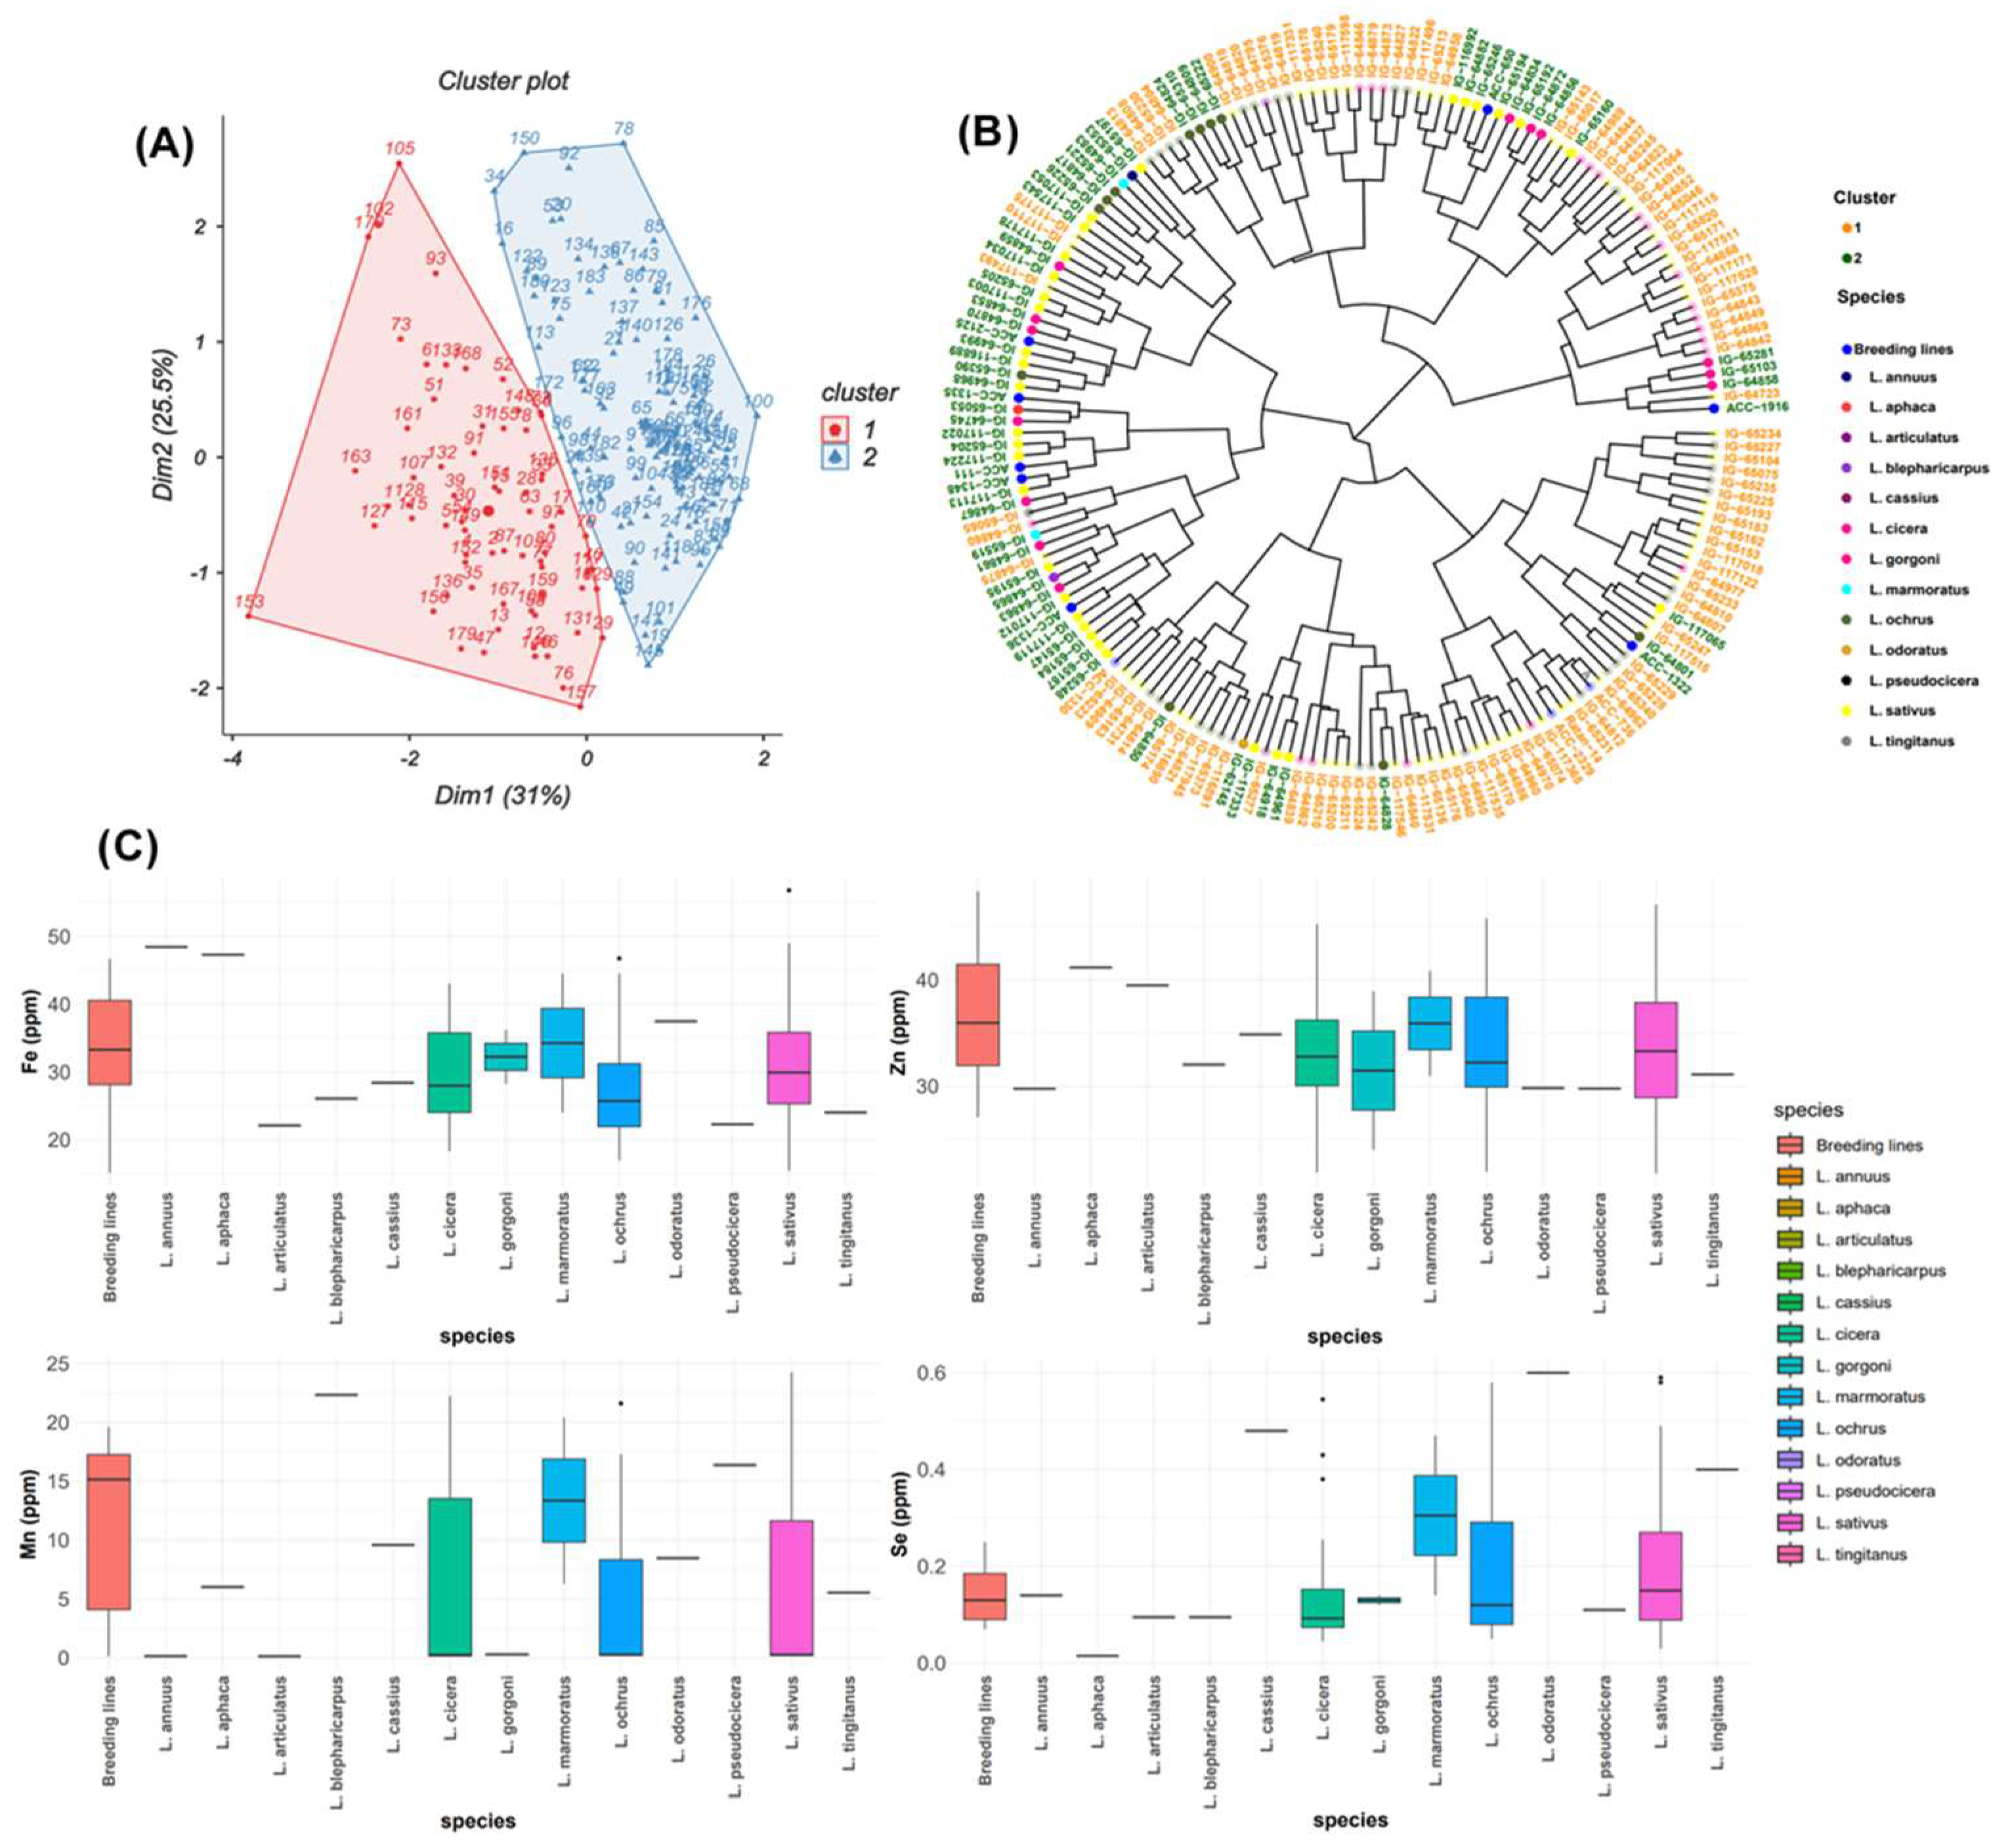
The frequency distribution of the three micronutrients Zn, Fe, and Se followed a normal distribution among the grass pea tested germplasm (Figure 1). Principal component analysis for all micronutrients (Figure 3A) revealed that the first two principal components explained 56.5% of the total variation. PC1 (31%) was highly associated with Mn (r = 0.734) and Fe (0.646) and revealed positive correlation with Se (r = 0.38) and negative correlation with Zn (r = -0.19) (Table 2). Positive correlation was observed between PC2 (25.4%) and all micronutrients (Mn, Fe and Se) except Zn (r = -0.156). A positive correlation was recorded between PC3 and Se (r = 0.717), Mn (r = 0.178) and Zn (r = 0.373) while negative correlation was revealed with Fe (r = -0.246). PC4 had negative correlations with Se (r = -0.078), Fe (r = -0.134), Mn (r = -0.141), and Zn (r = -0.416). PCA grouped all 183 accessions into two clusters comprising 114 and 69 accessions (Figure 3A). Cluster 1 grouped the accessions with high Fe and Zn concentrations. Box plots (Figure 3C) showed that cluster 1 contained breeding lines, and accessions of L. cassius, L. cicera, L. gorgoni, L. marmoratus, L. ochrus and L. sativus. The second cluster included accessions with a moderate value of Mn and Se, and almost the same Zn and Fe contents (Figure 3A, B). This group embraced other species namely, L. pseudocicera, L. blepharicarpus, L. articulatus, L. annuus, L. tingitanus, L. odoratus and L. aphaca (Figure 3B, C).

2.4. PCA of ODAP Content

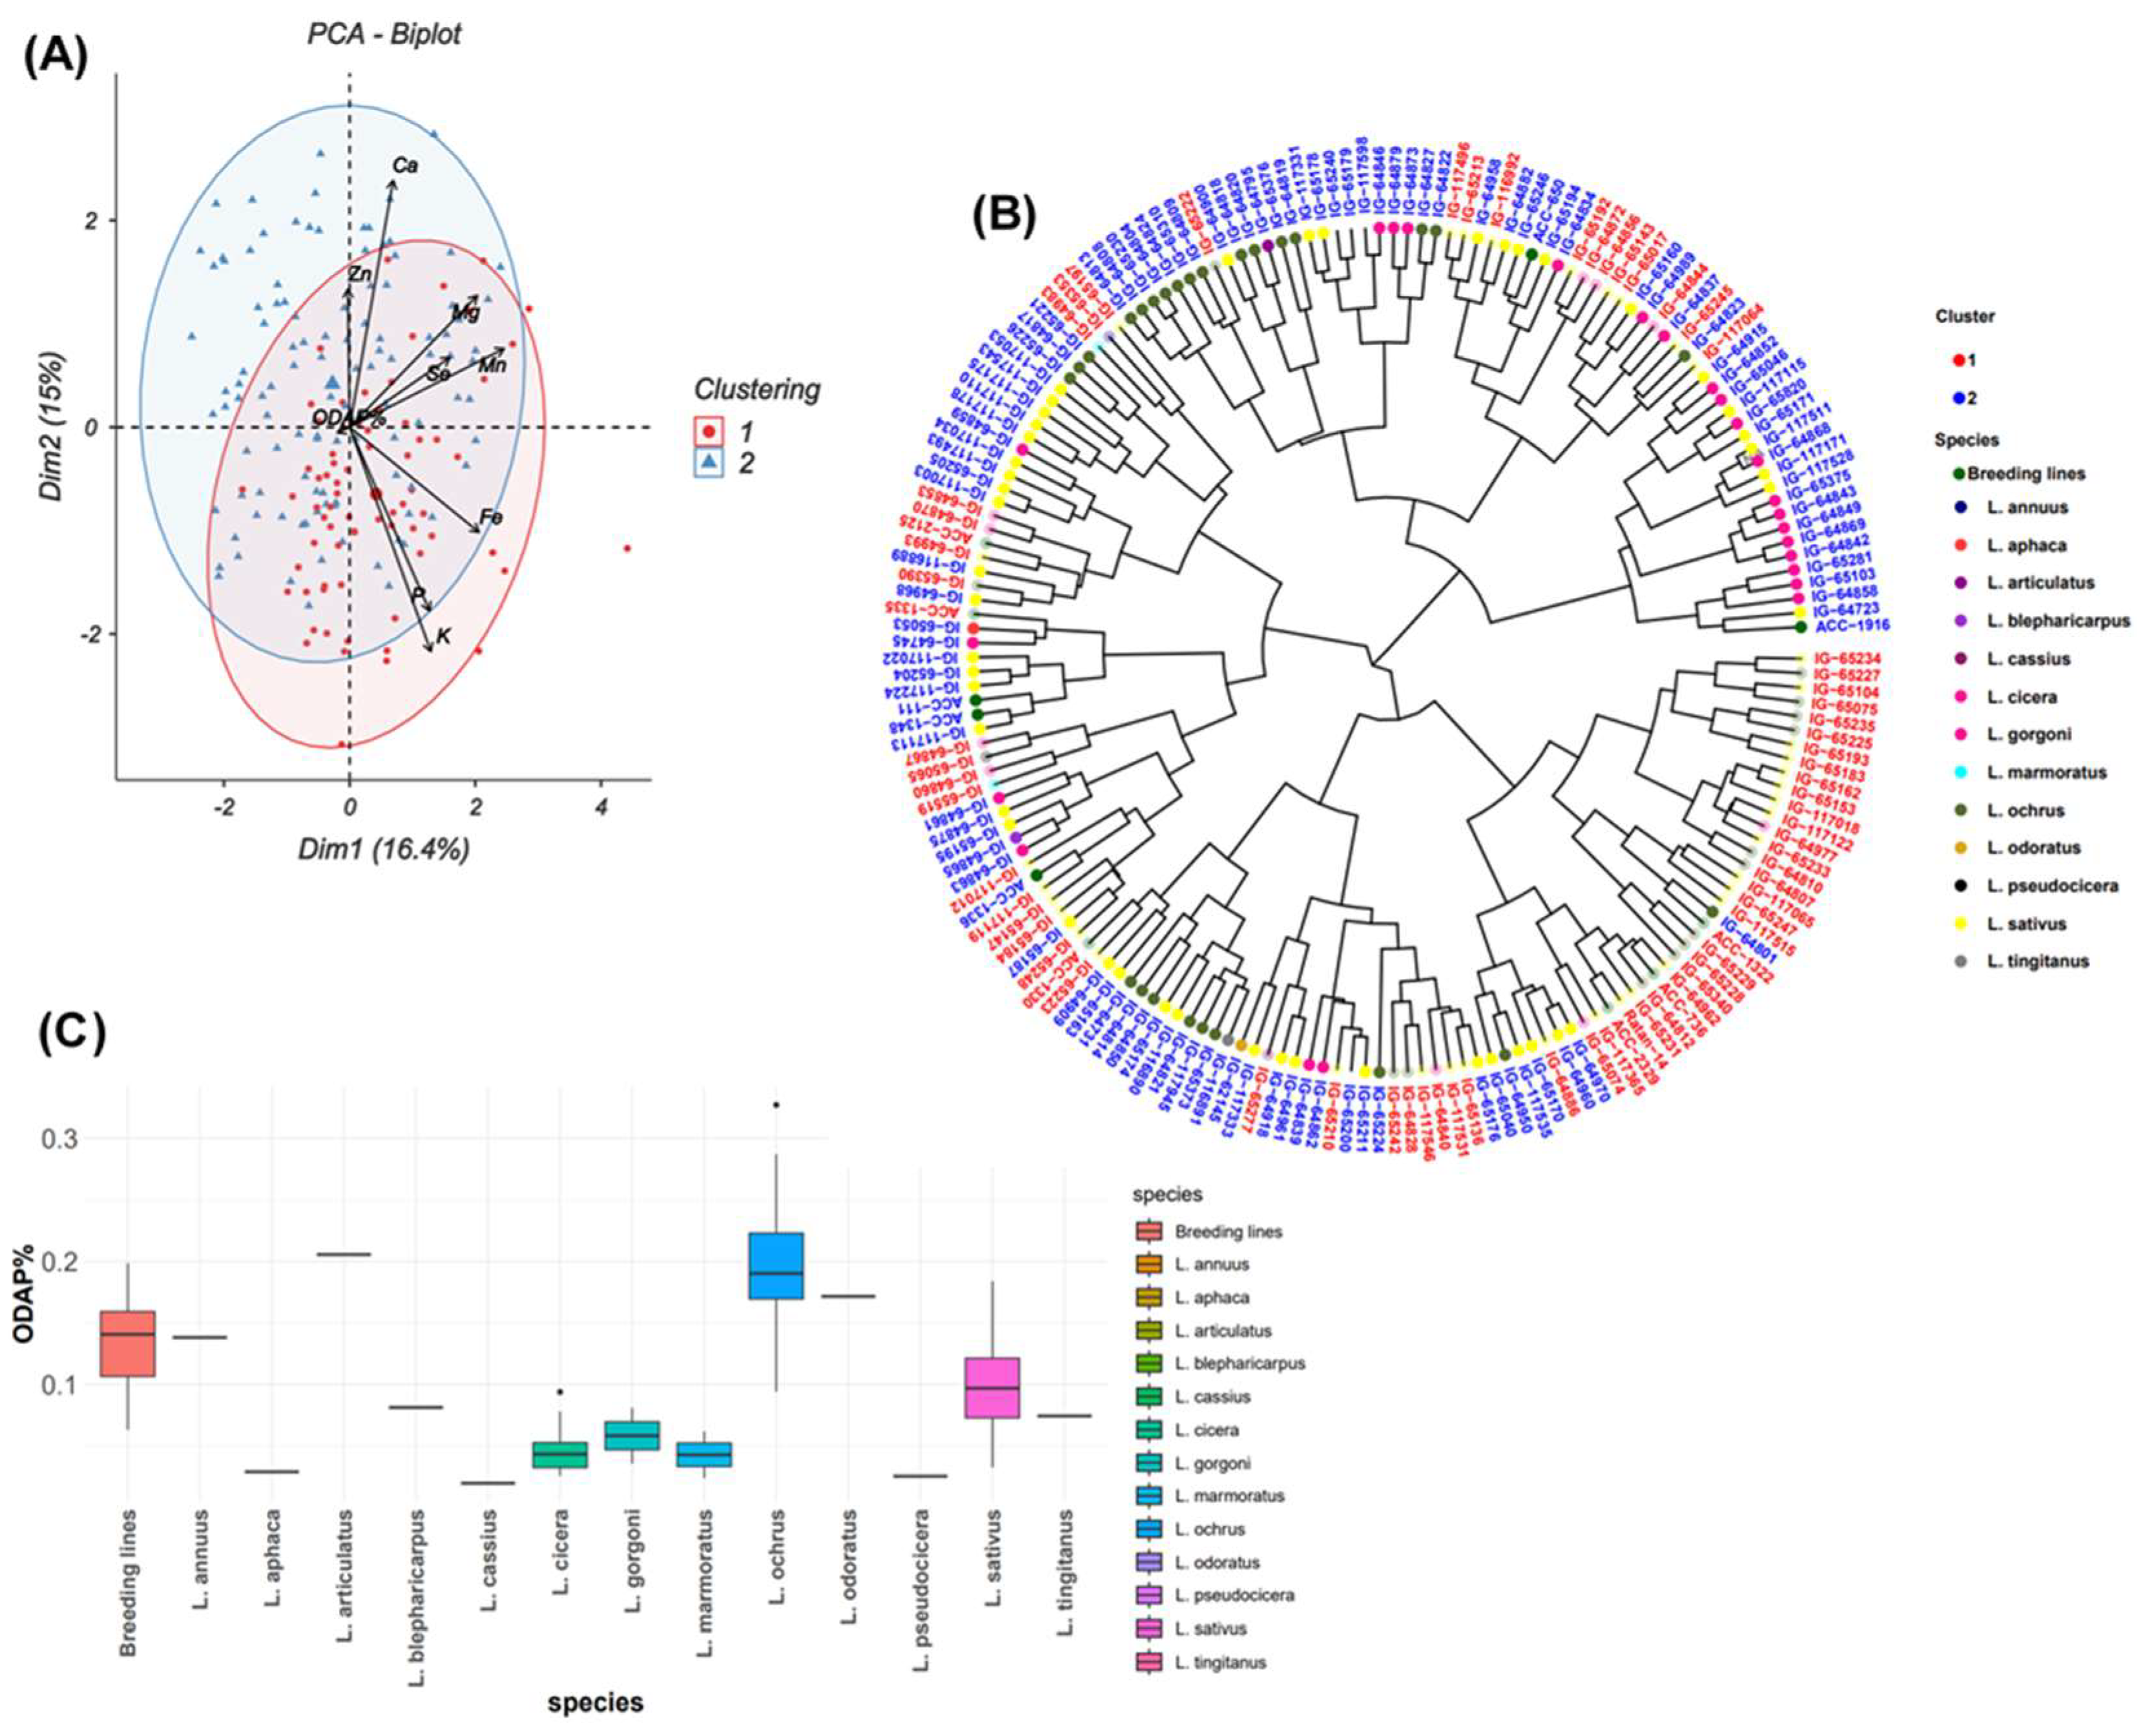
PCA indicated that the first two principal components, PC1 (16.4%) and PC2 (15%) explained together 31.4 % of the total genotypic variation of ODAP content (Figure 4A). ODAP content was positively correlated with PC4 (r = 0.706) and moderately associated with PC2 (r = 0.075) and PC3 (r = 0.104). A frequency distribution representing the normal distribution of ODAP content across the tested accessions is illustrated in Figure 1. The negative correlation was observed between ODAP content and PC1 (r = -0.242) (Table 2).
Further, Biplot and ggtree (Figure 4A, B) showed 72 accessions in cluster 1 and 111 accessions in cluster 2. Clusters 1 and 2 had almost the same values; high content in Zn and Fe, and moderate for the other traits (Mg and Ca). On the other hand, P and K content were higher in cluster 1 than in cluster 2. On other side, ODAP value was 0.11% in cluster 1 and 0.10% in cluster 2. The dendrogram was used to identify and select germplasm with good performance for nutrient and ODAP contents (Figure 4B). Three species L. sativus, L. ochrus, and L. cicera and breeding lines belonging to Lathyrus sativus were grouped in two clusters. Accessions belonging to L. annuus, L. blepharicarpus, L. marmoratus and L. pseudocicera were included in cluster 1 and L. articulatus, L. odoratus, L. cassius, L. aphaca, L. gorgoni and L. tingitanus in cluster 2 (Figure 4B). The box plot analysis revealed species with low and high ODAP content (Figure 4C). Accession with the lowest ODAP content belonged to L. cassius (0.01%, IG65277) (Table 1, Figure 4B) followed by accessions of L. pseudocicera, L. aphaca, L. cicera, L. marmoratus, L. gorgoni and L. tingitanus. Species which revealed high ODAP concentrations (≥ 0.10%) were L. ochrus (0.3%, IG65340), L. articulatus, L. odoratus, L. annuus, L. sativus and L. blepharicarpus. In general, results revealed that L. cicera showed the lowest ODAP content (0.02% to 0.1%), followed by L. sativus (0.03% to 0.2%) and L. ochrus (0.1% to 0.3%) (Figure 4C).

2.5. Correlations among Nutrients and ODAP Contents

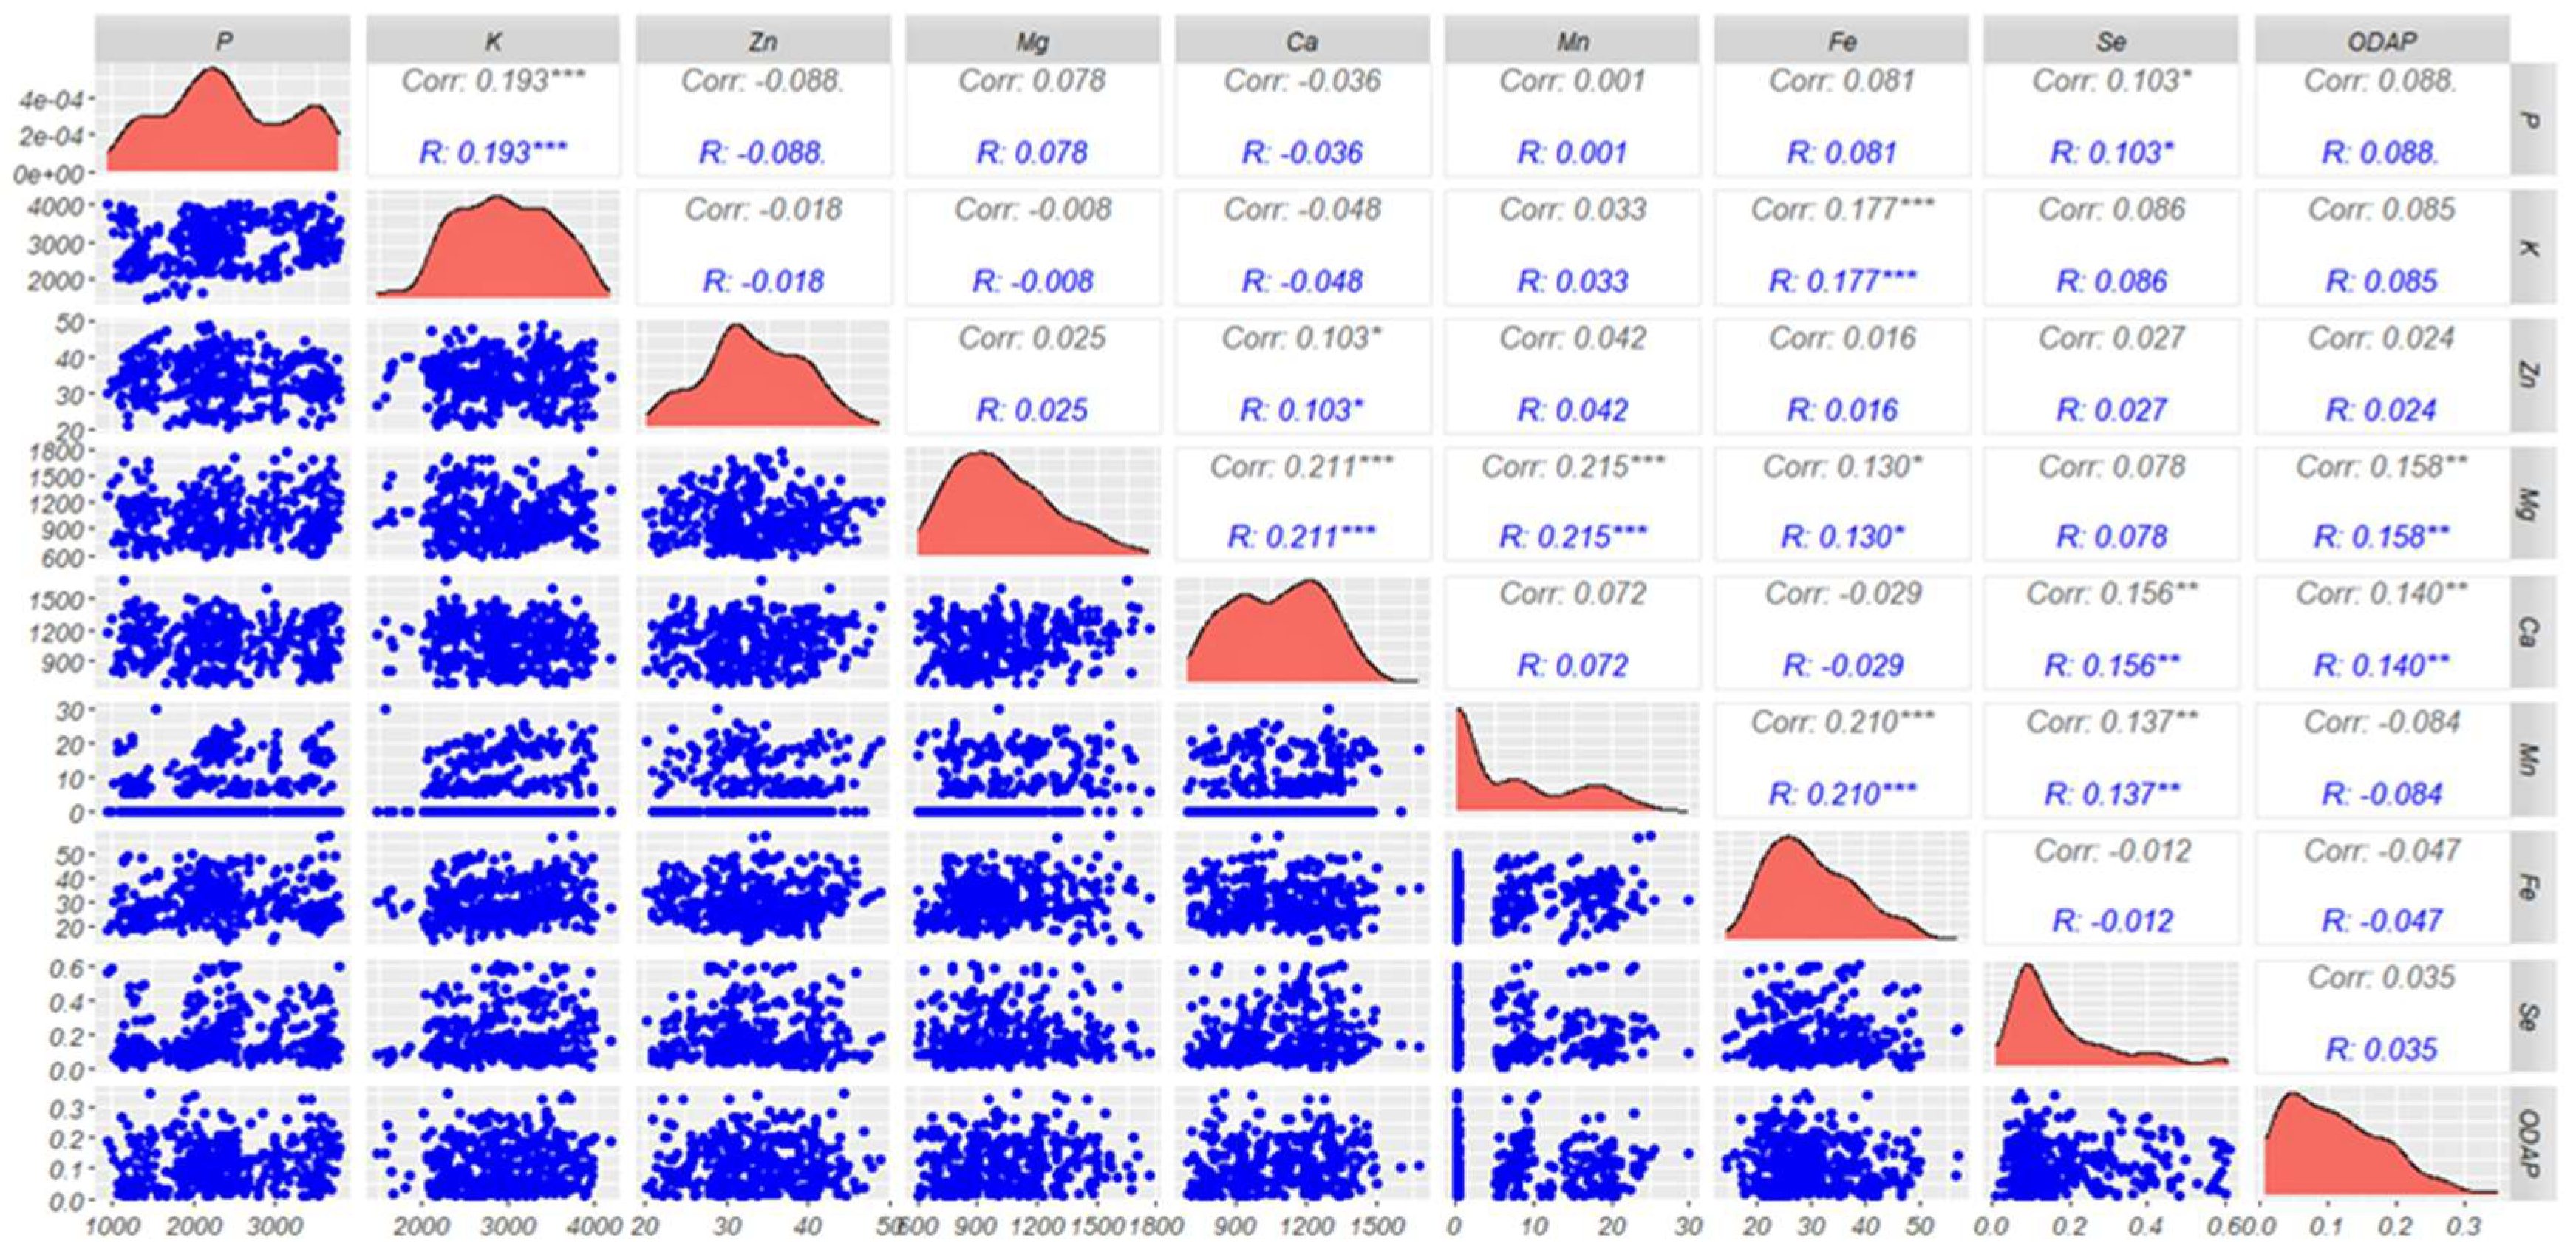
Pairwise correlation (Figure 5) was carried out on all 183 analyzed accessions in this study. Correlation analysis indicated significantly positive associations of magnesium (Mg) with manganese (Mn) (r = 0.215***) and calcium (Ca) (r = 0.211***) (Figure 5). Significant positive correlations of K were observed with P (r = 0.193***) and Fe (r = 0.177***), and for Mn with Fe (r = 0.210***) and Se (r = 0.137***). However, low significant positive correlations were recorded for three combinations namely, Se with P (r = 0.103*), Zn with Ca (r = 0.103*) and Mg with Fe (r = 0.130*). ODAP revealed a significant positive correlation with Mg (r = 0.158**) and Ca (r = 0.140**). Furthermore, ODAP showed a positive correlation with P (r = 0.088), K (r = 0.085), Zn (r = 0.024) and Se (r = 0.035). The results also revealed that ODAP content was negatively correlated with Mn (r = - 0.084) and Fe (r = - 0.047).

2.6. Best Performing Accessions

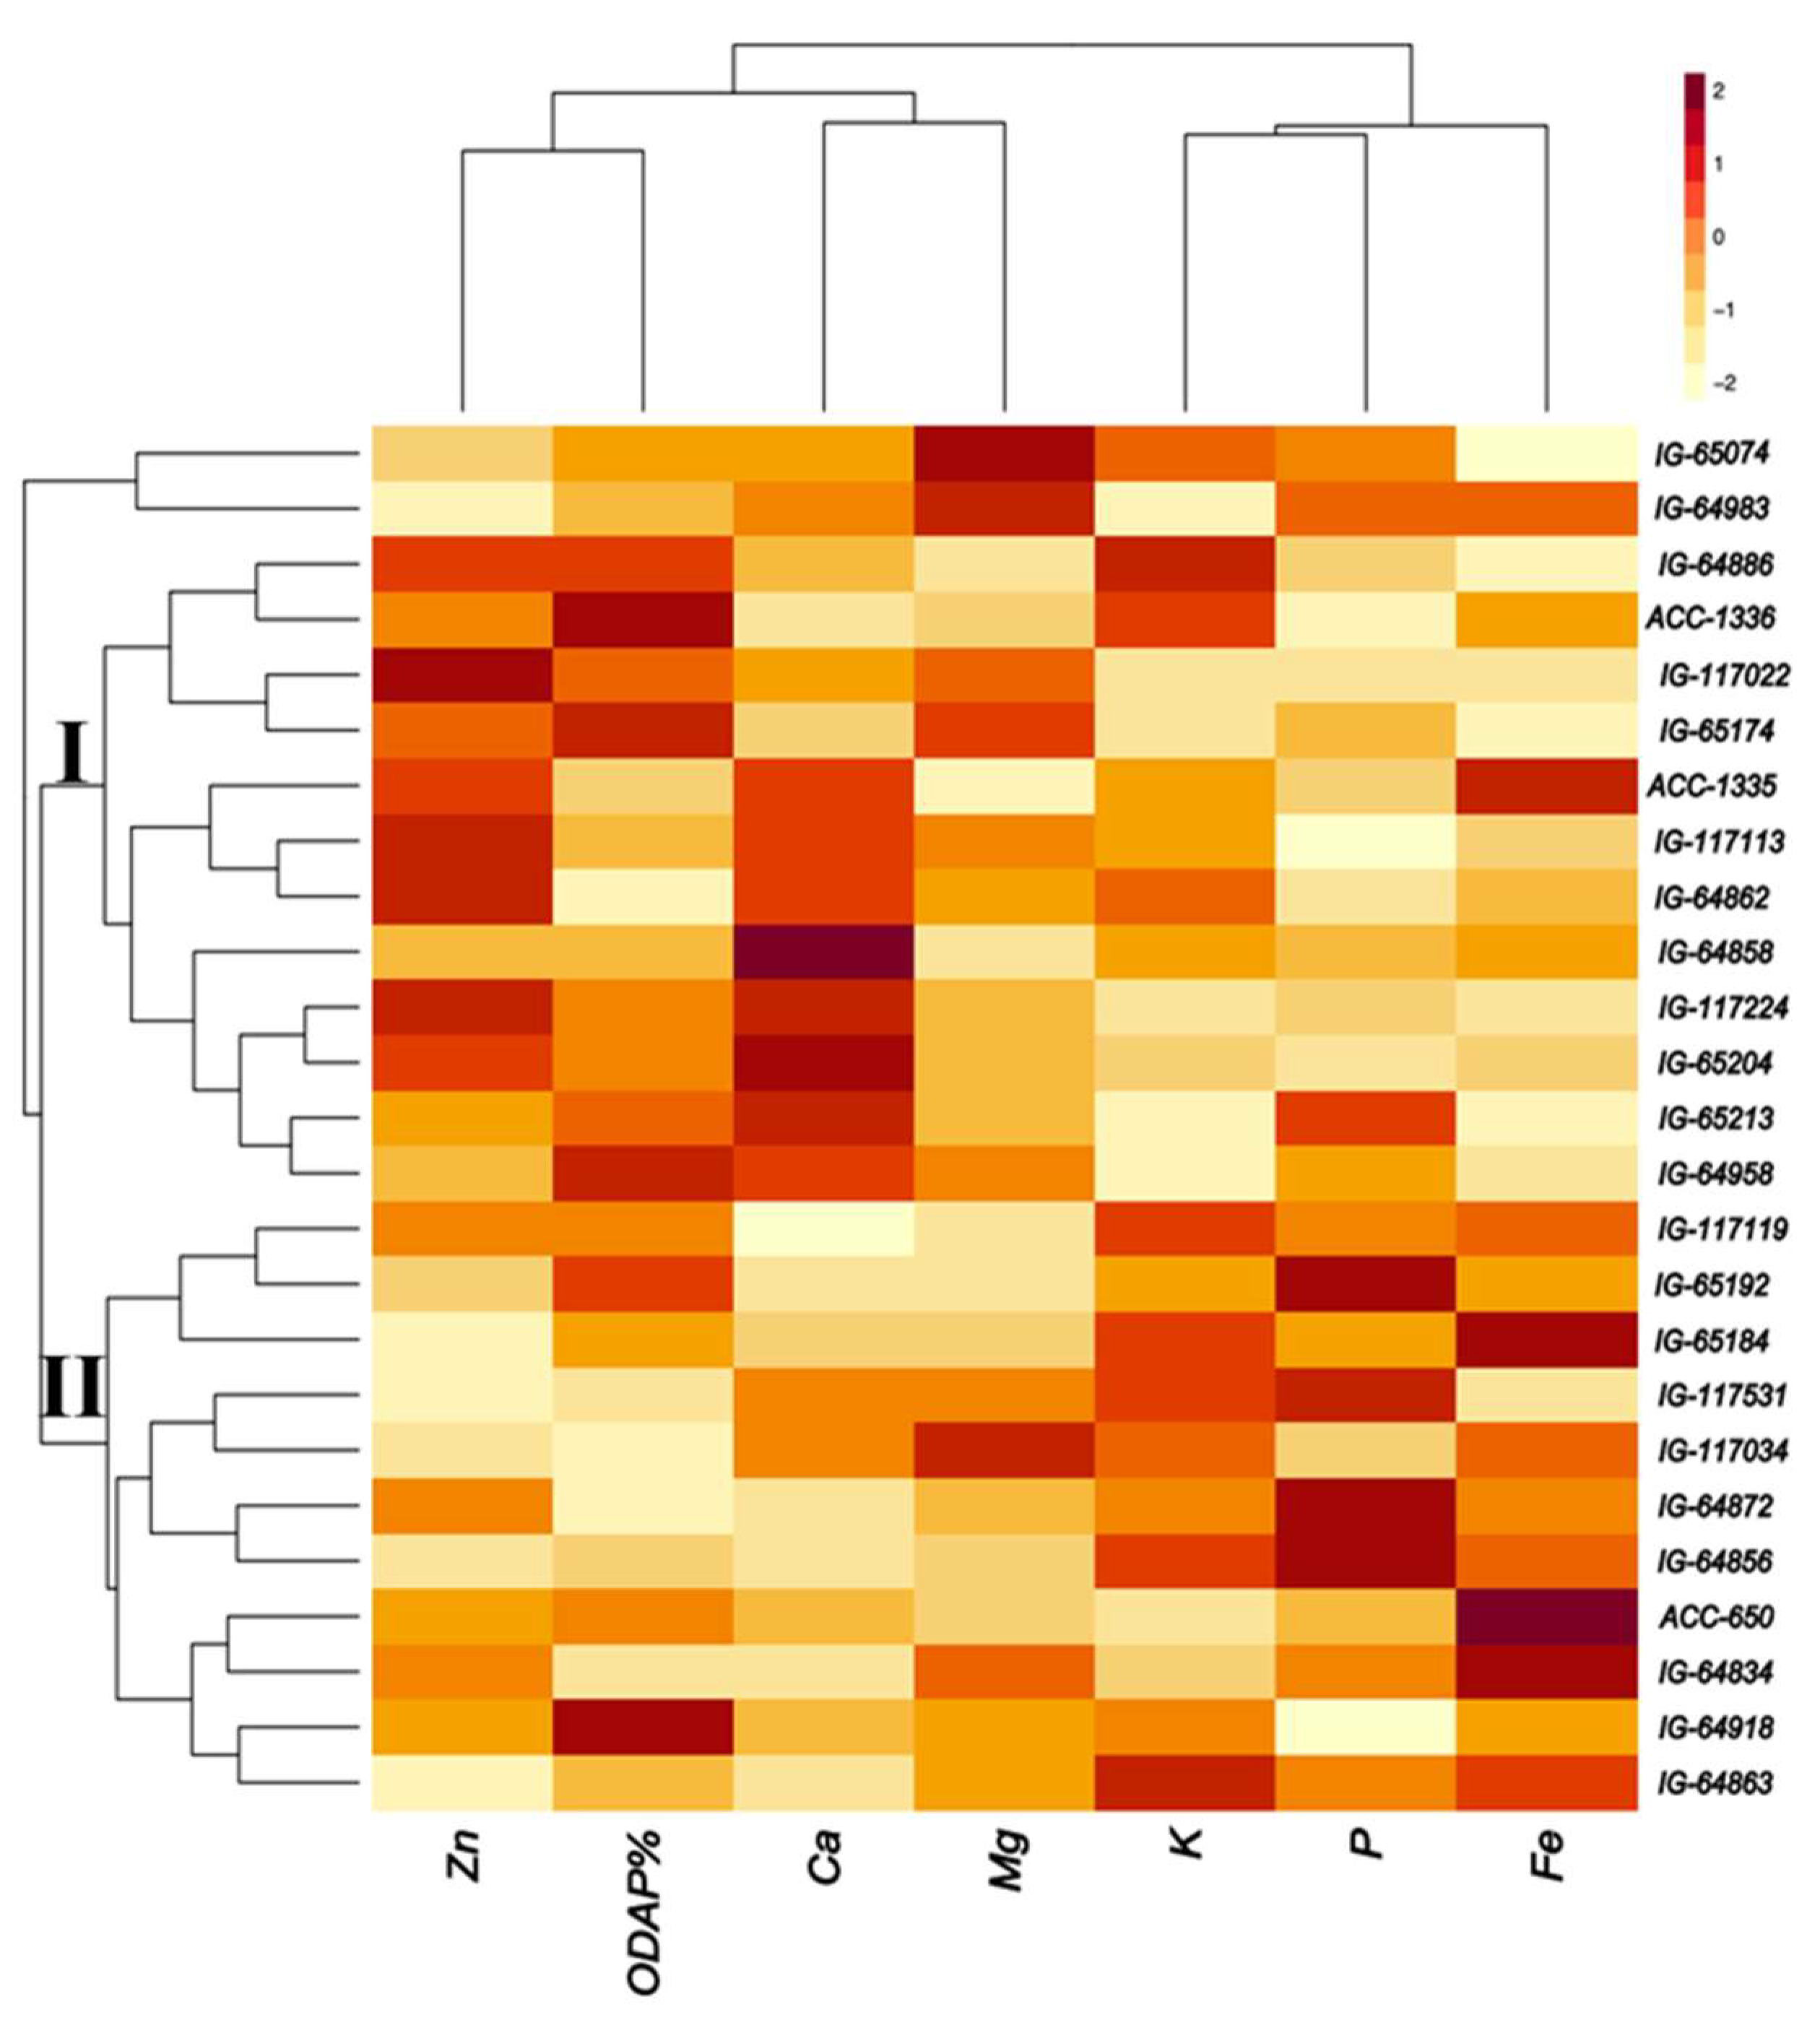
Twenty-five accessions were selected based on their high nutrient composition and low ODAP concentration (Figure 6). Most of these accessions represented L. sativus, followed by L. cicera and L. marmoratus. The first cluster contained 11 accessions with high P and Fe concentrations such as ACC 650 (L. sativus), IG64834, IG64856 and IG64872 (L. cicera, Greece) and IG65184, IG65192 (L. sativus, Ethiopia) (Figure 6). Moderate concentration was found for K in IG64863 (L. cicera, Greece) and for Mg in IG117034 (L. sativus, Bangladesh). Low ODAP content was revealed in IG64872 (L. cicera) from Greece and in IG117034 (L. sativus) from Bangladesh. In the second cluster, 14 accessions were characterized by high concentration of Mg, Ca, and Zn. This included IG117022, IG65204 and IG65074 from L. sativus, IG64858 from L. cicera and IG64983 from L. marmoratus. Furthermore, moderate content was obtained for K and Fe in L. sativus (IG64886) originated from Greece and in ACC1335. Two accessions revealed low ODAP in this cluster, which are IG64862 (L. cicera from Greece) and ACC1335.

3. Discussion

Traditional grass pea varieties and landraces especially from South Asia and Sub-Saharan Africa contain higher levels of the neurotoxin β-ODAP content which can cause neurolathyrism, if consumed in large quantity for prolonged period by the under nourished population. Despite its ODAP content, grass pea is also recognized as a good source of protein, carbohydrates, and homoarginine that can sustain life during periods of famine when other food is unavailable [27]. The mineral composition of grass pea is comparable to other grain legume crops [28], although this will likely vary with soil mineral content. Global and regional efforts are underway to develop low ODAP varieties utilizing the genetic variability available within the cultivated genepool and in the crop wild relatives. Past studies have indicated the presence of low ODAP content in the related wild species. Keeping that in mind, we analyzed 183 germplasm accessions representing 13 Lathyrus species originated from different continents for nutrient and ODAP contents. Results revealed significant genetic variation, and high heritability for most of the traits studied. A large variation was observed for macro- and micro-nutrient concentrations and ODAP content.
For macro-nutrients, the highest values were recorded for K followed by P, Ca, and Mg. This agrees with the findings of [28] in L. cicera [K (0.91%), P (0.33%), Ca (0.25%) and Mg (0.13%)], as well as in L. sativus [ K (0.64%), P (0.42%), Ca (0.16%) and Mg (0.11%)]. The maximum values for K and Ca were observed in L. sativus (IG117365, IG116889, Bangladesh), and for P in L. ochrus (IG64807, Greece). [29], reported the highest K ratio in Sel706 (2.44%), Sel1837 (2.44%), ETH-24 (2.44%), and ETH WIR-70 (2.46%) genotypes. Among the studied nutrients, Zn emerged as the most abundant micronutrient, particularly in ACC1348, followed by Fe in IG117012 (L. sativus, Bangladesh), Mn in ACC1916, and Se in IG62145 (L. odoratus, Italy). Similar results were reported in L. sativus and L. cicera [28,30], in lentil [31,32] and in chickpea [33]. [34] reported relatively low concentrations of Mg (473-642 ppm) and Fe (20- 36.7 ppm) in L. sativus seeds compared to what was observed in our study with Mg (1027.5 ppm) and Fe (30.1 ppm). On an average, [35] announced that the trace elements contents for Mg and Fe of Lathyrus maritimus were (1800 mg/kg and 94 mg/Kg, respectively) and of L. sativus were (1500 mg/kg and 82 mg/kg, respectively). A large number of grass pea genotypes have been evaluated for nutritional value; K (8.33-11.05 ppm) [36,37], Mg (0.86-1.61ppm), Mn (7.86-42.5ppm) [37,38], Fe (41-73ppm) and Zn (19-54ppm) [16,21,36].
In the present research, lower neurotoxin concentration (ODAP) was detected in L. cassius with 0.01% in IG65277 (from Syria). [21] also reported significant variability in ODAP levels among Lathyrus species with some accessions having low ODAP content considered as safe for human consumption [22]. L. cicera cultivar “Chalus” was selected based on high yield and low ODAP (0.09%) in comparison with many other L. cicera genotypes tested by [5]. Our results identified accessions of L. pseudocicera, L. aphaca, L. cicera, L. marmoratus, L. gorgoni and L. tingitanus with low ODAP content. In our study, high variability for ODAP content was reported in L. ochrus with IG65340 having the highest ODAP content (0.33%). Identical results were also reported by [39]. In contrast to our results, [40] reported highest ODAP content in L. sativus (IG46075) from Ethiopia. Four lines of L. sativus, viz, IFLLS 522 (Syria), IFFLS 588 (Cyprus), IFLLS 516 (Turkey) and IFLLS 563 (Turkey) showed low ß-ODAP content ranging from 0.02 to 0.07%. The level presumed safe for human consumption is <0.2% [41]. As stated in our results, ODAP content ranged from 0.01% to 0.3% with an average of 0.1%, for all studied species. Other studies reported ODAP content ranging from 0.150 to 0.952% in a large collection of L. sativus (1128 accessions) by [2], with only two accessions having low content, IG118563 (0.150%) and IG64888 (0.198%). [42] reported ODAP content ranging from 0.067 to 0.712% among 1963 entries of grass pea, with IPLY9, Prateek, AKL 19, BioL202, BioL203, Ratan, No. 2203 and No. 2208 in Lathyrus sativus having <0.1%. The range of ODAP content varied across studies. Results have included ranges of 0.2%-2% among 1000 accessions [43]; 0.02%-0.74% among 81 accessions [44] and 0.149%–0.916% in a set of 150 accessions [45]. Moreover, our study revealed the lowest ODAP content was in L. cicera (0.05%) followed by L. sativus (0.1%) and L. ochrus (0.2%), which is in consistent with the results of [5,26,39]. Likewise, [46] also found the same classification by using capillary electrophoresis. The evaluation of 142 accessions of L. cicera at ICARDA during 2009 showed a range of 0.073–0.513% for ODAP content, which is much lower than the cultivated species. Therefore, L. cicera accessions hold promise as a source of low ODAP content in grass pea breeding programs [1]. Low ODAP was detected mainly in L. sativus, L. cicera, L. clymenum, L. ochrus, L. hirsutus, L. sylvestris and also with lesser content in L. aphaca, L. sphaericus and L. gorgoni [47,48,49,50].
We selected the 25 best germplasm accessions with high mineral concentration and low ODAP content. The results reported high P and Fe in ACC650, IG64834, IG64856, IG64872 (L. cicera, Greece), IG65184, and IG65192 (L. sativus, Ethiopia). In addition, we noted that accessions of L. sativus from Bangladesh, Ethiopia and Maldova, which were IG117022, IG65204 and IG65074, respectively, with L. cicera (IG64858) from Greece and L. marmoratus (IG64983) from Iraq, contained high content of Mg, Ca, and Zn. Low ODAP content was reported in L. cicera from Greece (IG64872, IG64862), L. sativus derived from Bangladesh (IG117034) and in a breeding line (ACC1335). We notice that the selected accessions differed in their origin covering different continents (Africa, Asia, Europe, Australia). As proved by [51], Prateek, Ratan and Mahateora showed significantly low amount of ODAP content, instead, Local Khesari and Boga Khesari revealed a very high nutritional characteristic. According to our results, Europe is the continent which contain most of the best performing accessions, followed by Asia, Ethiopia, then Australia. [26], also reported that grass pea germplasm from Ethiopia and the Indian subcontinent is generally higher in ODAP (0.7–2.4%) compared to germplasm from the Near East (0.02–1.2%). This is interpreted that the species origin influences the ODAP content in Lathyrus. The ODAP content in grass pea may be influenced by environment and agronomic practices [43] within the same species. [52] found for 407 L. sativus and 96 L. cicera lines collected from three geographic origins (Ethiopian. Mediterranean and European), that genotype was the most important determinant of β-ODAP concentration and that environment had less influence. However, [53] concluded for L. sativus that genotype and its interaction with the environment are the most significant determinants for β-ODAP level.
Significant positive correlations were recorded between Mn and Fe (r=0.210***) and Mn and Se (r=0.137***). Zinc showed moderate associations with all other micronutrients. [54] revealed a significant correlation (at 5%) between Se and Mg and a highly significant relation (at 1%) among all the other minerals. Significant correlations Mg (r = 0.158**) and Ca (r = 0.140**), moderate correlations with P, K, Zn and Se and negative correlations with manganese (Mn) (r = - 0.084) and iron (Fe) (r = - 0.047), with ODAP content were found in this study. Nonetheless, [55] also reported that ODAP was highly correlated with Zinc (r = 0.732**) and B (r = - 0.507*) and poorly correlated with P, K, Mg, Fe. These latter authors indicated that interactions between ODAP and minerals are complex and vary depending on species. So, any observations regarding ODAP x mineral interaction in certain species cannot be generalized for the whole genus.
Taking into account our results, we identified grass pea germplasm with high content of minerals and low ODAP content which could be useful for integrating them into genetic improvement program. Breeding for low ODAP was achieved through soma clonal mutation which has allowed the released of several viable diploid mutants with marked alterations in plant characters [56]. The accessions of grass pea with the valuable traits can also be used by the breeding programs. However, the mobilization of the genes for low ODAP and for high macro and micro-elements from other Lathyrus species will require strengthening pre-breeding efforts. Interspecific crosses of grass pea with more than 11 Lathyrus species were attempted at ICARDA and allowed to develop germplasm from crosses with L. cicera, L. ochrus, L. inconspectus, L. marmoratus and L. heirosolymitanus (Amri A., unpublished data). Further crosses using the identified accessions of Lathyrus species with low ODAP and high Zinc, Fe and Se will allow the development of high yielding varieties with low ODAP content and bio fortified for micro-elements.

4. Materials and Methods

4.1. Plant Material

A set of 183 germplasm accessions belonging to 13 wild Lathyrus species originated from different continents (Asia, Africa, Europe) and 11 L. sativus breeding lines were provided by ICARDA gene bank (Table S1). During the crop season of 2016 and 2017, these accessions were grown under net-cages to avoid out-crossing and ensure the seed purification. Two samples from each accession were subjected to ODAP% and nutritional quality analysis at ICARDA, Morocco quality laboratory.

4.2. ODAP Protocol

Seeds harvested from a representative single plant of each accession were collected and grinded separately. The 5 g of powdered sample of each accession was diluted in 60% ethanol and mixed in a volumetric flask for 45 min at 200 rpm. All the tubes were centrifuged at 4500 rpm for 15 min followed by collection of 2 ml supernatant in centrifuge tubes. Afterwards, 4 ml of 3 N potassium hydroxide (KOH) was added to each tube, vortexed and placed in a boiling water bath at 100°C for 30 minutes. The sample tubes were once again centrifuged at 4500 rpm for 15 minutes, and 250 µl of the hydrolyzed supernatant was pipetted. These samples were then combined with 750 µl of H₂O and 2000 µl of O-phthalaldehyde (OPT) solution in tetraborate. The procedure included three blanks: 0.25 ml non-hydrolysed extract + 0.75 ml distilled water + 2 ml of the OPA reagent (OPA blank); 0.25 ml non-hydrolysed extract + 0.75 ml distilled water + 2 ml tetraborate buffer (sample blank); and 0.25 ml hydrolysed extract + 0.75 ml distilled water + 2 ml tetraborate buffer (buffer blank). Afterward, the tubes were vortexed and incubated for 2 h at 40°C. The spectrophotometric measurement was recorded at 425 nm with the absorbance at blank set as zero [57]. The final absorbance was given by:
A = (A (sample) – A (buffer blank) – 1/3 (A (OPA blank) – A (sample blank)), (1)
A is a calibration curve was made using DL-2,3-diaminopropionic acid mono hydrochloride as standard and a conversion factor to ODAP of 1.69 [39]. The general equation for calculating the concentration of ODAP was as follows:
C= ((A3- A4) – 1/3 (A1- A2) – y intercept)/ Slope, (2)
Where, C is the concentration of ODAP in the amino acid extract, y intercept and the slope were extrapolated from a regression line calculated from absorbance readings of DL-α-β-diamino propionic acid (DAP) as standard [57]. The DAP solutions were prepared and reacted with OPT precisely in the same way as described for the amino acid extracts. A1 to A4 are absorbance values for amino acid solutions.

4.3. Mineral Analysis

The seeds were grounded using a Cyclone mill (Twister, 10 mm–250 um, Retsch) and mineral concentration was measured using a modified HNO3 and H2O2 method [58]. For each accession, 500 mg of sample was placed in digestion tubes with 6 mL nitric acid (HNO3), at 90°C for 60 min in the digestion block (QBlock series, Horiba). Then, 3 ml of 30% of hydrogen peroxide (H2O2) was added to each tube, followed by the second digestion when the samples were heated again at 90°C for 15 min. Next, 3 ml of 6 M hydrochloric acid (HCL) was added to each digestion tube. Finally, all samples were cooled, filtered (Whatman No. 1 filter papers), and then diluted with distilled water to 10 ml. The mineral concentrations were carried out by inductively coupled plasma-optical emission spectroscopy (ICP-OES); (iCAP-7000 Duo, Thermo Fisher Scientific, Waltham, MA, USA). The results were based on lab references and NIST standard references using a specific calibration for the micronutrients with a dilution from 0.1 to 10 mg L-1.

4.4. Statistical Analysis

The data was analyzed using two software tools, SPSS version 25 (IBM Corporation, New York, NY, United States) and R Core Team (2023). _R: A Language and Environment for Statistical Computing_. R Foundation for Statistical Computing, Vienna, Austria. <https://www.R-project.org/>. Multivariate Analysis of Variance (MANOVA) for ODAP and nutrient contents was performed. Mean, max, min, R2, heritability, genotypic variance, coefficient of variation CV (%) and least significant difference (LSD) were determined using SPSS. All statistical descriptive parameters were tested for significant at p < 0.05. Principal Component Analysis (PCA) was performed to explore the relationships between genotypes and to determine the number of clusters when accessions are associated with major nutrient concentration and low ODAP contents using ggplot, factoextra, factoMineR in Rstudio. Hierarchical Clustering Analysis (HCA) was employed to form different groups of accessions based on their performance in nutrient and ODAP values, using ward’s method based on Euclidean distance. Tree diagrams resulting from hierarchical clustering analysis were represented using the ggplot2 and ggtree packages in Rstudio. Correlogram was used to study the relationships between all studied traits with ggpairs function. Boxplots and the frequencies histograms were established with ggplot2 package in Rstudio, to provide a quick summary of the values variabilities.

5. Conclusions

This study indicates the potential of crop wild relatives (CWR) as a source of novel variation for mainstreaming in the grass pea improvement program to develop improved varieties with high mineral concentration and low ODAP content. Some of the species such as L. cicera, L. ochrus, and L. cassius present an excellent source of desirable traits useful for enhancing the mineral concentration and reducing ODAP content in the cultivated species. L. cassius (IG65277 from Syria) showed the lowest ODAP content. Some of the species namely, L. pseudocicera, L. aphaca, L. marmoratus, L. gorgoni and L. tingitanus showed crossing barriers with cultivated species and requires special breeding tools and techniques to overcome the bottleneck to integrating them in grass pea improvement program.

Supplementary Materials

The following supporting information can be downloaded at the website of this paper posted on Preprints.org.

Author Contributions

Conceptualization, S.K.; Methodology, F.A., A. EL-B., S.K. and M.A.; Software, Z.K. and MA. EL-K.; Validation, Z.K., A.A., S.K. and M.A.; Formal analysis, F.A., S.K., A.A. and M.A.; Investigation, F.A., S.K., A.A. and M.A.; Resources, S.K.; Data curation, F.A., Z.K. and MA. EL-K.; Writing—original draft preparation, F.A.; Writing—review and editing, S.K., M.A., Z.K. and A.A.; Visualization, F.A and S.K.; Supervision, S.K.; Project administration, S.K.; Funding acquisition, S.K. All authors have read and agreed to the published version of the manuscript.”.

Funding

This work was undertaken as part of the initiative “Adapting Agriculture to Climate Change: Collecting, Protecting and Preparing Crop Wild Relatives,” which is supported by the Government of Norway. The project is managed by the Global Crop Diversity Trust with the Millennium Seed Bank of the Royal Botanic Gardens, Kew, and implemented in partnership with national and international gene banks and plant breeding institutes around the world. For further information, see the project website: http://www.cwrdiversity.org/.

Data Availability Statement

The data presented in this study are available on request from the corresponding author.

Acknowledgments

The work of this publication was carried out with partial support from a grant received from the Crop Trust.

Conflicts of Interest

The authors declare no conflicts of interest.

References

  1. Kumar, S.; Gupta, P.; Barpete, S.; Sarker, A.; Amri, A.; Mathur, P.N.; Baum, M. Grass pea. In Genetic and Genomic Resources of Grain Legumes Improvement; Singh, M., Upadhyaya, H.D., Bisht, I.S., Eds.; Elsevier: Amsterdam, The Netherlands, 2013; pp. 269–292. [Google Scholar] [CrossRef]
  2. Kumar, S.; Bejiga, G.; Ahmed, S.; Nakkoul, H.; Sarker, A. Genetic improvement of grass pea for low neurotoxin (β-ODAP) content. Food Chem. Toxicol. J. 2011, 49, 589–600. [Google Scholar] [CrossRef] [PubMed]
  3. Maxted, N.; Goyder, D.J. A new species of Lathyrus sect. Lathyrus (Leguminosae - Papilionoideae) from Turkey. Kew Bull. 1988, 43, 711–714. [Google Scholar] [CrossRef]
  4. Jackson, M.T.; Yunus, A.G. Variation in the grass pea (L. sativus L.) and wild species. Euphytica 1984, 33, 549–559. [Google Scholar] [CrossRef]
  5. Hanbury, C.D.; Siddique, K.H.M.; Galwey, N.W.; Cocks, P.S. Genotype-environment interaction for seed yield and ODAP concentration of Lathyrus sativus L. and L. cicera L. in Mediterranean type environments. Euphytica 1999, 110, 45–60. [Google Scholar] [CrossRef]
  6. Saxena, M.C.; Abd El Moneim, A.M.; Raninam, M. Vetches (Vicia spp.) and chicklings (Lathyrus spp.) in the farming systems in West Asia and North Africa and improvement of these crops at ICARDA. In Potential for Vicia and Lathyrus species as New Grain and Fodder Legumes for Southern Australia; Garlinge, J.R.; Perry, M.W., Eds.; CLIMA, Perth, 1993; pp. 2 - 9.
  7. Lambein, F.; Travella, S.; Kuo, Y.H.; Montagu, M.V.; Heijde, M. Grass pea (Lathyrus sativus L.): orphan crop, nutraceutical or just plain food? Planta 2019, 250, 821–838. [Google Scholar] [CrossRef]
  8. Schulz, S.; Keatinge, J.D.H.; Wells, G.J. Productivity and residual effects of legumes in rice-based cropping systems in a warm-temperate environment: II. Residual effects on rice. Field Crops Res. 1999, 61, 37–49. [Google Scholar] [CrossRef]
  9. Campbell, C.G.; Mehra, R.B.; Agrawal, S.K.; Chen, Y.Z.; Abd-El-Moneim, A.M.; Khawaja, H.I.T.; Yadav, C.R.; Tay, J.U.; Araya, W.A. Current status and future strategy in breeding grass pea (Lathyrus sativus). Euphytica. 1994, 73, 167–175. [Google Scholar] [CrossRef]
  10. Kumar, J. Utilization of Lathyrus. In Lathyrus Genetic International Resources Network, proceedings of IPGRI-ICARDA-ICAR Regional Working Group Meeting; Mathur, P.N.; RAmanatha Rao, V.; Arora, R.K., Eds.; New Delhi, India. 1997, p. 57. Available online: https://hdl.handle.net/10568/105246 (accessed on 7 October 2024).
  11. Tiwari, K.R.; Campbell, C.G. Inheritance of neurotoxin (ODAP) content, flower and seed coat colour in grass pea (Lathyrus sativus L). Euphytica. 1996, 91, 195–203. Available online: http://link.springer.com/article/10.1007/BF00021070 (accessed on 4 October 2024). [CrossRef]
  12. Campbell, C.G. Grass pea. Lathyrus sativus L.; Institute of Plant Genetics and Crop Plant Research (IPK): Gatersleben, Germany; International Plant Genetic Resources Institute (IPGRI): Rome, Italy, 1997; p. 91. Available online: https://www.researchgate.net/publication/245231747 (accessed on 7 October 2024).
  13. Abdallah, F.; Kumar, S.; Amri, A.; Mentag, R.; Kehel, Z.; Mejri, R.K.; Triqui, Z.E.A.; Hejjaoui, K.; Baum, M.; Amri, M. Wild Lathyrus species as a great source of resistance for introgression into cultivated grass pea (Lathyrus sativus L.) against broomrape weeds (Orobanche crenata Forsk. and Orobanche foetida Poir.). Crop Sci. 2020, 61, 263–276. [Google Scholar] [CrossRef]
  14. Tarade, K.M.; Singhal, R.S.; Jayram, R.V.; Pandit, A.B. Kinetics of degradation of ODAP in Lathyrus sativus L. flour during food processing. Food Chem. 2007, 104, 643–649. [Google Scholar] [CrossRef]
  15. Tamburino, R.; Guida, V.; Pacifico, S.; Rocco, M.; Zarelli, A.; Parente, A.; Maro, A.D. Nutritional values and radical scavenging capacities of grass pea (Lathyrus sativus L.) seeds in Valle Agricola district, Italy. Aust. J. Crop Sci. 2012, 6, 149–156. Available online: https://www.semanticscholar.org/paper/Nutritional-values-and-radical-scavenging-of-grass-Tamburino-Guida/d7823f5c000e7da938d6369f6ae7ccb03681c08f (accessed on 7 October 2024).
  16. Sen Gupta, D.; Barpete, S.; Kumar, J.; Kumar, S. Breeding for better grain quality in Lathyrus. In Breeding for enhanced nutrition and bio-active compounds in food legumes. D. S., Gupta; S, Gupta; J, Kumar; Eds.; Springer: Kanpur, Uttar Pradesh, India, 2021; pp. 131–156. [CrossRef]
  17. Rao, S.L.N.; Adiga, P.R.; Sarma, P.S. The isolation and characterization of β-N-oxalyl-l-α, β-diaminopropionic acid: a neurotoxin from the seeds of Lathyrus sativus. Biochemistry. 1964, 3, 432–436. [Google Scholar] [CrossRef] [PubMed]
  18. Eyzaguirre, P.B.; Paludosi, S.; Hodgkin, T. IPGRI’s strategy for neglected and underutilized species and the human dimension of agrobiodiversity. In Priority-setting for underutilized and neglected plant species of the Mediterranean region. Report of the IPGRI Conference, ICARDA, Aleppo, Syria. IPGRI, Rome, Italy, 9-11 February 1998; pp. 1–20.
  19. Hanbury, C.D.; Siddique, K.H.M.; Seymour, M.; Jones, R.; MacLeod, B. Growing Ceora grass pea (Lathyrus sativus) in Western Australia. (Ed. SP Department of Agriculture Western Australia and Centre for Legumes in Mediterranean Agriculture. (CLIMA)). Farmnote No. 58, Government of Western Australia. 2005. Available online: https://www.web.uwa.edu.au/__data/assets/pdf_file/0004/920569/ceorafarmnote.pdf (accessed on 3 October 2024).
  20. Yan, Z.Y.; Spencer, P.S.; Li, Z.X.; Liang, Y.M.; Wang, Y.F.; Wang, C.Y.; Li, F.M. Lathyrus sativus (grass pea) and its neurotoxin ODAP. Phytochemistry. 2006, 67, 107–121. [Google Scholar] [CrossRef] [PubMed]
  21. Urga, K.; Fufa, H.; Biratu, E.; Husain, A. Evaluation of Lathyrus sativus cultivated in Ethiopia for proximate composition, minerals, β-ODAP and anti-nutritional components. Afr. J. Food Agric. Nutr. Dev. 2005, 5, 1–15. [Google Scholar] [CrossRef]
  22. Vedna, K. Field evaluation of grass pea (Lathyrus sativus L.) germ plasm for its toxicity in the northwestern hills of India. Lathyrus Lathyrism Newsl. 2001, 2, 82–84. Available online: http://scholar.google.com/scholar_lookup?&title=Field%20evaluation%20of%20grass%20pea%20%28Lathyrus%20sativus%20L.%29%20germ%20plasm%20for%20its%20toxicity%20in%20the%20northwestern%20hills%20of%20India&journal=Lathyrus%20Lathyrism%20Newsl&volume=2&pages=82-84&publication_year=2001&author=Vedna%2CK (accessed on 8 October 2024).
  23. Tekle Haimanot, R.; Abegaz, B.M.; Wuhib, E.; Kassina, A.; Kidane, Y.; Kebede, N.; Alemu, T.; Spencer, P.S. Pattern of Lathyrus sativus (grass pea) consumption and Beta-N-oxalyl-a, β -diaminopropionic acid (β -ODAP) content of food samples in the lathyrism endemic region of northwest Ethiopia. Nutri. Res. 1993, 13, 1113–1126. [Google Scholar] [CrossRef]
  24. Barpete, S.; Gupta, P.; Khawar, K.M.; Kumar, S. Effect of cooking methods on protein content and neurotoxin (β-ODAP) concentration in grass pea (Lathyrus sativus L.) grains. CyTA – J. of Food. 2021, 19, 448–456. [Google Scholar] [CrossRef]
  25. Hailu, D.; Abera, S.; Teka, T.A. Effects of processing on nutritional composition and anti-nutritional factors of grass pea (Lathyrus sativus L): A review. Food Sci. Qual. Manag. 2015, 36, 61–70. Available online: https://www.researchgate.net/publication/303700648 (accessed on 8 October 2024).
  26. Abd-El-Moneim, A.M.; van Dorrestein, B.; Baum, M.; Mulugeta, W. Improving the nutritional quality and yield potential of grass pea (Lathyrus sativus L.). Food Nutr. Bull. 2000, 21, 493–496. [Google Scholar] [CrossRef]
  27. Spencer, P.S.; Ludolph, A.; Dwivedi, M.P.; Roy, D.N.; Hugon, J.; Schaumburg, H.H. Lathyrism: evidence for role of the neuroexcitary amino acid BOAA. Lancet ii. 1986, 1066–1067. [Google Scholar] [CrossRef]
  28. White, C.L.; Hanbury, C.D.; Young, P.; Phillips, N.; Wiese, S.C.; Milton, B.; Avidson, R.H.; Siddique, K.H.M.; Harris, D. The nutritional value of Lathyrus cicera and Lupinus angustifolius grain for sheep. Anim. Feed Sci. Technol. 2002, 99, 45–64. [Google Scholar] [CrossRef]
  29. Özyazıcı, M.A.; Açıkbaş, S. Forage quality and mineral composition of common grass pea (Lathyrus sativus L.) genotypes. Int. J. Elem. 2023, 28, 405–421. [Google Scholar] [CrossRef]
  30. Hanbury, C.D.; White, C.L.; Mullan, B.P.; Siddique, K.H.M. The potential of Lathyrus sativus L. and L. cicera L. grain for use as animal feed: A review. Anim. Feed Sci. Tech. 2000, 87, 1–27. [Google Scholar] [CrossRef]
  31. El Haddad, N.; Choukri, H.; Ghanem, M.E.; Smouni, A.; Mentag, R.; Rajendran, K.; Hejjaoui, K.; Maalouf, F.; Kumar, S. High temperature and drought stress effects on growth, yield and nutritional quality with transpiration response to vapor pressure deficit in lentil. Plants. 2021, 11, 95. [Google Scholar] [CrossRef] [PubMed]
  32. Choukri, H.; El Haddad, N.; Aloui, K.; Hejjaoui, K.; El-Baouchi, A.; Smouni, A.; Thavarajah, D.; Maalouf, F.; Kumar, S. Effect of high temperature stress during the reproductive stage on grain yield and nutritional quality of lentil (Lens culinaris medicus). Front. Food. Sci. Technol. 2022, 9, 857469. [Google Scholar] [CrossRef]
  33. Farida Traoré, F.; El-Baouchi, A.; En-nahli, Y.; Hejjaoui, K.; Metougui, M.L.; Hamwieh, A.; Sohail, Q.; Istanbuli, T.; Boughribil, S.; Amri, M. Exploring the genetic variability and potential correlations between nutritional quality and agro-physiological traits in Kabuli chickpea germplasm collection (Cicer arietinum L.). Front. Plant Sci. 2022, 13, 905320. [Google Scholar] [CrossRef]
  34. Lisiewska, Z.; Korus, A.; Kmiecik, W.; Gebczynski, P. Effect of maturity stage on the content of ash components in raw and preserved grass pea (Lathyrus sativus L.) seeds. Int. Food Sci. Nutr. 2006, 57, 39–45. [Google Scholar] [CrossRef]
  35. Chavan, U.D.; Shahidi, F.; Bal, A.K.; McKenzie, D.B. Physico-chemical properties and nutrient composition of beach pea (Lathyrus maritimus L.). Food Chem. 1999, 66, 43–50. [Google Scholar] [CrossRef]
  36. Grela, E.R.; Rybiński, W.; Klebaniuk, R.; Matras, J. Morphological characteristics of some accessions of grass pea (Lathyrus sativus L.) grown in Europe and nutritional traits of their seeds. Genet. Resour. Crop. Evol. 2010, 57, 693–701. [Google Scholar] [CrossRef]
  37. Grela, E.R.; Rybiński, W.; Matras, J.; Sobolewska, S. Variability of phenotypic and morphological characteristics of some Lathyrus sativus L.and Lathyrus cicera L. accessions and nutritional traits of their seeds. Genet. Resour. Crop. Evol. 2012, 59, 1687–1703. [Google Scholar] [CrossRef]
  38. Hanbury, C.D.; Siddique, K.H.M. Registration of 'Chalus' Lathyrus cicera L. Crop. Sci. 2010, 40, 1199. [Google Scholar] [CrossRef]
  39. Aletor, V.A.; Abd El-Moneim, A.; Goodchild, A.V. Evaluation of the seeds of selected lines of three Lathyrus spp for p-N-Oxalylamino-L-Alanine (BOAA), Tannins, Trypsin Inhibitor Activity and Certain In-vitro Characteristic. J. Sci. Food Agric. 1994, 65, 143–151. [Google Scholar] [CrossRef]
  40. Urga, K.; Fite, A.; Kebede, B. Nutritional and anti-nutritional factors of grass pea germ plasm. Bull. Chem. Soc. Ethiop. 1995, 9, 9–16. Available online: https://www.ajol.info/index.php/bcse/article/view/74085/64747 (accessed on 8 October 2024).
  41. Dahiya, B.S. Seed morphology as an indicator for low neurotoxin in Lathyrus sativus. Qualitas Plantarium. Plant Foods Hum. Nutr. 1976, 25, 391–394. [Google Scholar] [CrossRef]
  42. Pandey, R.L.; Kashyap, O.P.; Sharma, R.N.; Nanda, H.C.; Geda, A.K.; Nair, S. Catalogue on grass pea (Lathyrus sativus L.) germplasm. Indira Gandhi Krishi Vishwavidyalaya, Raipur, India. 2008, p. 213. Available online: http://krishikosh.egranth.ac.in/handle/1/5810141369 (accessed on 8 October 2024).
  43. Leakey, C. Khesari dhal: The poisonous pea. J. Appropr. Technol. 1979, 6, 15–16. Available online: https://scholar.google.com/scholar_lookup?title=Khesari%20dalthe%20poisonous%20pea&publication_year=1979&author=C.%20Leakey (accessed on 8 October 2024).
  44. Robertson, L.D.; Abd-El-Moneim, A. Status of Lathyrus germplasm held at ICARDA and its use in breeding programs. In Lathyrus Genetic Resources Network, Proceedings of a IPGRI-ICARDA-ICAR Regional Working Group Meeting; Mathur, P.N., Rao, V.R., Arora, R.K., Eds.; New Delhi, India, 8-10 December 1997, pp. 30–41. Available online: https://cgspace.cgiar.org/server/api/core/bitstreams/d259bae7-ccf4-4a10-897c-a90af077062d/content (accessed on 8 October 2024).
  45. Tadesse, W.; Bekele, E. Variation and association of morphological and biochemical characters of grass pea (Lathyrus sativus L.). Euphytica. 2003, 130, 315–324. [Google Scholar] [CrossRef]
  46. Eichinger, P.C.H.; Rothnie, N.E.; Delaere, I.; Tate, M.E. New technologies for toxin analyses in food legumes. In Linking research and marketing opportunities for pulses in the 21st century; Knight, R., Ed.; Kluwer Academic Publishers: Dordrecht, 2000; pp. 685–692. [Google Scholar] [CrossRef]
  47. Siddique, K.H.M.; Loss Herwig, S.P.; Wilson, J.M. Growth, yield and neurotoxin (ODAP) concentration of three Lathyrus species in Mediterranean type environments of Western Australia. Aus. J. Exp. Agric. 1996, 36, 209–218. [Google Scholar] [CrossRef]
  48. Sammour, R.H.; Abd El-Zahar, M.; Salwa, B.; Walla, B. Genetic variability of some quality traits in Lathyrus spp. germplasm. Acta Agric. Slov. 2007, 90, 33–43. [Google Scholar] [CrossRef]
  49. Sammour, R.H.; Abd El-Zahar, M.; Salwa, B.; Walla, T. Genetic variations in accessions of Lathyrus sativus L. Acta Bot. Croat. 2007, 66, 1–13. Available online: https://hrcak.srce.hr/11767 (accessed on 8 October 2024).
  50. Basaran, U.; Acar, Z.; Karacan, M.; Onar, A.N. Variation and correlation of morpho-agronomic traits and biochemical contents (protein and ß-ODAP) in Turkish grass pea (Lathyrus sativus L.) landraces. Turk. J. Field. Crops. 2013, 18, 166–173. Available online: https://www.researchgate.net/publication/286365155 (accessed on 7 October 2024).
  51. Bandana, C.; Khanin, P.; Priyanka, D.; Ranjan, B.A.; Hemen, K.; Samindra, B. Nutritional evaluation of few grass pea (Lathyrus sativus L.) genotypes of Assam. Ind. J. Agric. Biochem. 2022, 35, 155–158. [Google Scholar] [CrossRef]
  52. Hanbury, C.D.; Siddique, K.H.M.; Galwcy, N.W.; Cocks, P.S. Genotype-environment interaction for seed yield and ODAP concentration of Lathyrus sativus L. and L. cicera L. in Mediterranean type environments. Euphytica. 2000, 110, 45–60. [Google Scholar] [CrossRef]
  53. Wuletaw, T. Stability of grass pea (Lathyrus sativus L.) varieties for β-ODAP content and grain yield in Ethiopia. Lathyrus Lathyrism Newsl. 2003, 3, 32–34. [Google Scholar] [CrossRef]
  54. Arslan, M. Variation of some seed trace element contents in grass pea (Lathyrus sativus L.) genotypes from Turkey. Fresenius Environ. Bull. 2017, 26, 3676–3684. Available online: https://www.researchgate.net/publication/348805447 (accessed on 6 October 2024).
  55. Basaran, U.; Gulumser, E.; Dogrusoz, M.; Mut, H. Variation and association in Lathyrus species based on seed biochemical constituents. Range Manag. Agrofor. 2019, 40, 124–130. Available online: https://hdl.handle.net/11552/1346 (accessed on 7 October 2024).
  56. Talukdar, D. Recent progress on genetic analysis of novel mutants and aneuploid research in grass pea (Lathyrus sativus L.). Afr. J. Agric. Res. 2009, 4, 1549–1559. [Google Scholar] [CrossRef]
  57. Rao, S.L.N. A sensitive and specific colorimetric method for the determination of α, β-diaminopropionic acid and the Lathyrus sativus neurotoxin. Anal. Biochem. 1978, 86, 386–395. [Google Scholar] [CrossRef]
  58. Sen Gupta, D.; Thavarajah, D.; McGee, R.; Coyne, C.; Kumar, S.; Thavarajah, P. Genetic diversity among cultivated and wild lentils for iron, zinc, copper, calcium and magnesium concentrations. Aust. J. Crop Sci. 2016, 10, 1381–1387. [Google Scholar] [CrossRef]
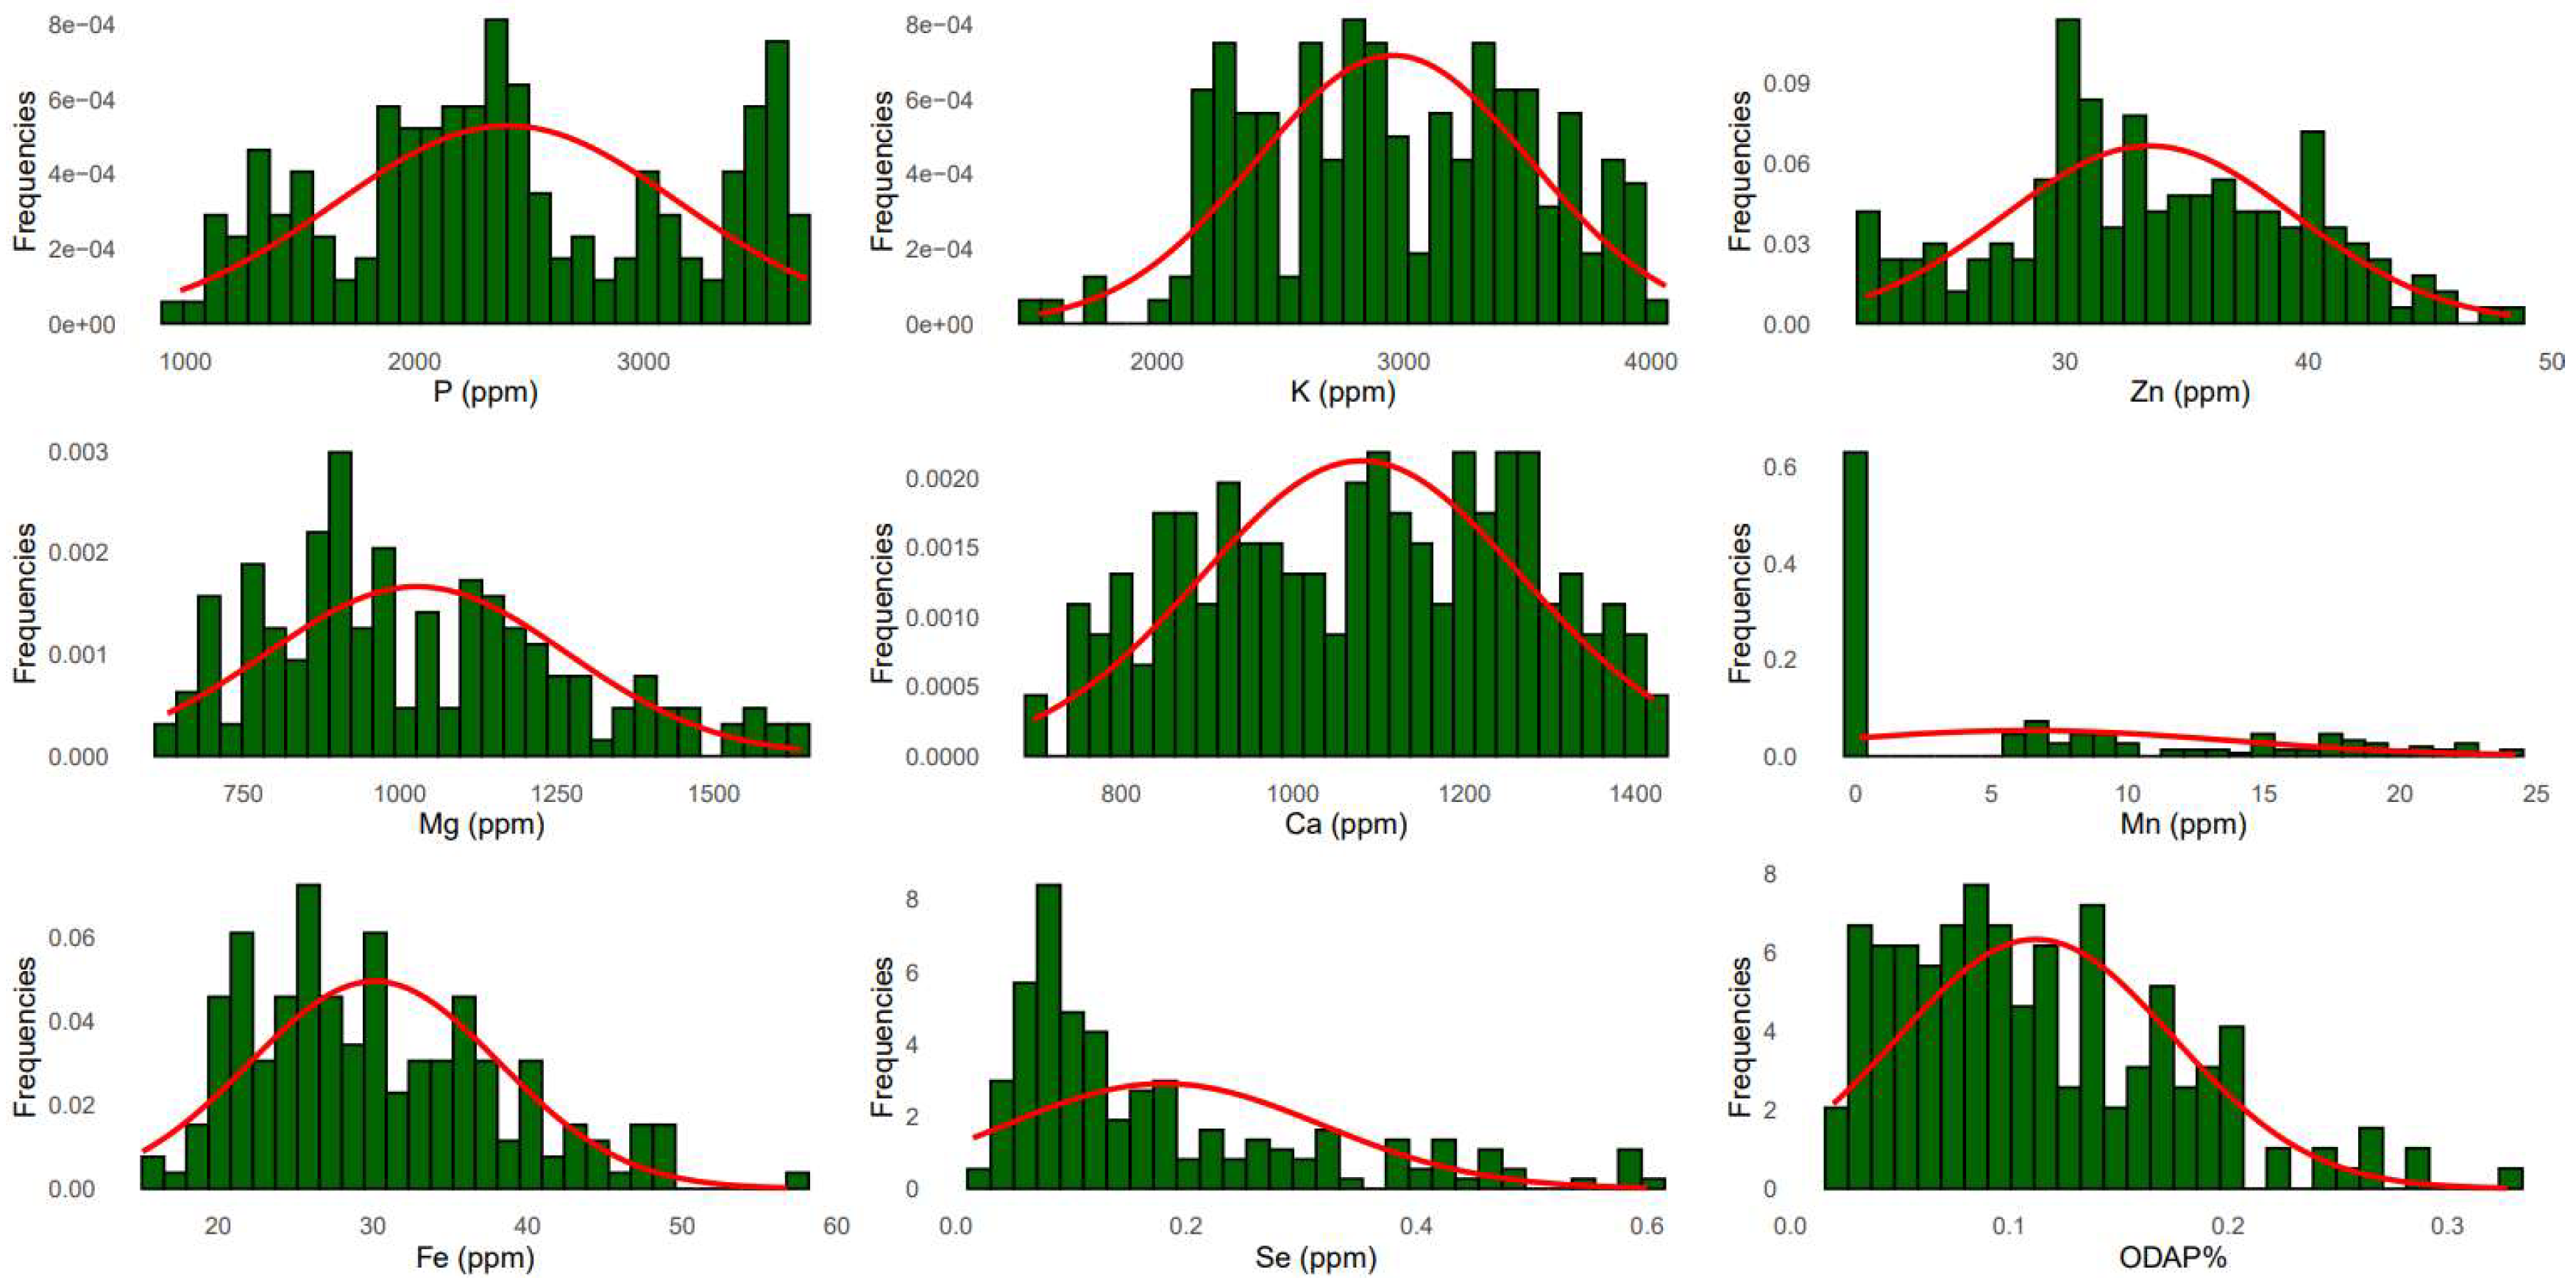
Figure 1. Frequency distribution of macro- and micro-nutrients, and ODAP concentrations in grass pea species.
Preprints 121002 g001
Figure 2. (A) Biplot of the first two dimensions of PCA based on the macronutrient contents for all tested grass pea germplasm. (B) Dendrogram showing the level of macronutrients of the total examined accessions. (C) Box plots showing a comparison of different macronutrient concentrations between the whole analyzed species.
Preprints 121002 g002
Figure 3. (A) Biplot of the first two dimensions of PCA based on the micronutrient contents for grass pea accessions. (B) Dendrogram showing the level of micronutrients of the total examined accessions. (C) Box plots showing a comparison of different micronutrient concentrations between the whole analyzed species.
Preprints 121002 g003
Figure 4. (A) Biplot of the first two dimensions of PCA based on ODAP content and nutirnet concentration for grass pea accessions. (B) Dendrogram revealed the neurotoxins and nutrient levels of different tested accessions. (C) Box plot showing a comparison of different ODAP% concentrations between the whole analyzed accessions.
Preprints 121002 g004
Figure 5. Correlogram with ggpairs between different parameter’s (macro and micronutrient concentrations and percentage of ODAP) recorded for all grass pea genotypes.
Preprints 121002 g005
Figure 6. Heat map and hierarchical clustering of 25 selected grass pea accession for the best performances parameter’s (high nutrient level and low ODAP content).
Preprints 121002 g006
Table 1. Range, mean, F, R2, heritability (h2), coefficient of variance (CV%), genotypic variance and LSD of nutrient and ODAP for 183 grass pea accessions belonging to 13 species.
Min. Max. Mean F R2 Heritability
(h2)
CV
(%)
Genotypic Variance LSD
(95%)
P 953.7
(IG65224)
3788.9
(IG64807)
2405.8 63.9** 0.9 0.5 31.6 308479.4 177.9
K 1478.9
(ACC1916)
4189.1
(IG117365)
2953.8 40.9** 0.9 0.4 19.0 157105.1 169.2
Ca 688.4
(IG64834)
1678.4
(IG116889)
1080.1 5.7** 0.8 0.5 18.9 23025.8 74.6
Mg 601.1
(IG64858)
1765.4
(IG65074)
1027.5 10.4** 0.9 0.5 24.3 33138.6 69.6
Mn 0.1
(IG117018)
30.0
(ACC1916)
6.3 21.5** 0.9 0.6 122.5 37.5 9.6
Fe 14.4
(ACC1330)
57.1
(IG117012)
30.1 75.3** 0.9 0.6 27.0 43.6 6.0
Zn 20.3
(IG65147)
48.7
(ACC1348)
33.4 48.4** 0.9 0.2 18.0 8.3 8.39
Se 0.01
(IG65053)
0.6
(IG62145)
0.1 66.3** 0.9 0.7 77.2 0.02 0.1
ODAP% 0.01
(IG65277)
0.3
(IG65340)
0.1 2.5** 0.7 0.5 66.0 38.6 5.0
Table 2. The first four principal components of principal component analyses (PCAs) for 183 grass pea accessions based on their neurotoxins (ODAP%) and macro-micronutrient concentrations.
PC1 PC2 PC3 PC4
P 0.044 0.630 -0.014 0.335
K 0.052 0.753 -0.033 -0.068
Ca 0.055 -0.250 0.678 0.177
Mg 0.599 -0.191 0.187 0.524
Mn 0.734 0.003 0.178 -0.141
Fe 0.646 0.252 -0.246 -0.134
Zn -0.019 -0.156 0.373 -0.416
Se 0.038 0.391 0.717 -0.078
ODAP % -0.242 0.075 0.104 0.706
Disclaimer/Publisher’s Note: The statements, opinions and data contained in all publications are solely those of the individual author(s) and contributor(s) and not of MDPI and/or the editor(s). MDPI and/or the editor(s) disclaim responsibility for any injury to people or property resulting from any ideas, methods, instructions or products referred to in the content.
Copyright: This open access article is published under a Creative Commons CC BY 4.0 license, which permit the free download, distribution, and reuse, provided that the author and preprint are cited in any reuse.
Prerpints.org logo

Preprints.org is a free preprint server supported by MDPI in Basel, Switzerland.

Subscribe

© 2024 MDPI (Basel, Switzerland) unless otherwise stated