Preprint
Article

Simplified Gravity Load Collapse Dynamic Analysis of Old-Type Reinforced Concrete Frames

Altmetrics

Downloads

83

Views

199

Comments

0

A peer-reviewed article of this preprint also exists.

This version is not peer-reviewed

Submitted:

12 October 2024

Posted:

14 October 2024

Read the latest preprint version here

Alerts
Abstract
The results of shaking table tests from the literature on a one-story, two-bay reinforced concrete frame experiencing both shear and axial failures are compared with nonlinear dynamic analyses using simplified models designed for assessing the collapse of older reinforced concrete structures. To simulate the nonlinear behavior of columns—both those prone to shear failure and those more flexure-dominant—the one-component beam model was utilized. This model consists of a linear elastic element linked in series to a rigid-plastic linear hardening spring at each end, representing a concentrated plasticity element. To capture strength degradation through path-dependent plasticity, a negative kinematic hardening model was used, connecting points at shear and axial failure, respectively. Shear failure points were determined via pushover analysis of the shear-critical columns using Phaethon software. While the simplified model yielded reasonable predictions of the overall frame response and lateral strength degradation, the reduced computational cost of the modeling approach led to some deviations between the calculated and measured shear forces and drifts during portions of the time-history response.
Keywords: 
Subject: Engineering  -   Civil Engineering

1. Introduction

Reinforced concrete buildings constructed before modern seismic design provisions were established are a major global concern for seismic safety. These structures are highly susceptible to severe damage or even collapse during strong earthquakes, which has historically led to significant loss of life. Many earthquake-related fatalities in the past can be attributed to the collapse of these buildings. Since the 1980s, when the capacity design concept was introduced into seismic codes, the safety gap between newly designed, earthquake-resistant buildings and those built before 1980 has widened, raising alarm worldwide. The earthquakes in Athens (1999), Turkey (1999), L’Aquila (2009)—which the author personally experienced while living there—and the 2023 Turkey-Syria earthquakes have highlighted the urgent need to improve the assessment and retrofitting of older reinforced concrete structures. Over the past two decades, intensive research and code development have focused on addressing this issue, as the detailing of these older buildings often falls short of today’s standards for earthquake-resistant construction.
Reinforced concrete (RC) columns are critical to a structure’s overall performance, as their failure can result in disproportionate damage to the entire building. The behavior of RC columns under combined axial load, shear, and flexure has been extensively studied over the years. For flexural behavior, sectional analysis or a fiber model in a one-dimensional stress field can provide reasonable estimates of ultimate strength and yielding deformation. However, when a column’s performance is dominated by shear or a combination of shear and flexure, sectional analysis alone is insufficient, as shear forces create stress fields that run through the member to its supports [1,2].
One example of a member-based approach to modeling shear effects is the strut-and-tie mechanism, which is used in the D-regions of beams and columns. Here, a 45° diagonal strut extends through the concrete member, covering a distance at least equal to the member's depth. Despite this, many design codes treat shear strength as a cross-sectional property [3], though alternative approaches like strut-and-tie models [4,5,6,7] are available, albeit less commonly used and often unfamiliar to many practitioners.
More advanced methods, such as variable-angle strut-and-tie models, account for different angles of the strut depending on the amount of transverse reinforcement. For example, Eurocode 2 (2004) [8] allows for a strut angle between 22.5° and 45°, with the angle varying based on the required amount of transverse reinforcement. A more detailed method, seen in AASHTO 2013 [5] and Model Code 2010 [4], is based on the Modified Compression Field Theory (MCFT), developed by Vecchio & Collins (1986) [9], which is considered the most comprehensive theory for the shear behavior of reinforced concrete members.
Even the most advanced seismic design and assessment techniques currently available require some form of nonlinear analysis, whether static or dynamic. These analyses are primarily conducted using frame elements that incorporate varying levels of approximation. The two main approaches employed are lumped-plasticity and distributed-inelasticity models.
Distributed-inelasticity elements can directly achieve the integration of the section response [10,11]. For this latter approach, fiber beam elements yield results particularly well-suited for examining the behavior of RC structures under reversed cyclic loads, as they effectively account for moment-axial force (M-N) coupling and the interaction between concrete and steel within the section. While several fiber beam-column elements have been developed that accurately reproduce axial force and flexural effects, the coupling of normal and shear force effects remains complex, and thus only a few modeling strategies have been fully implemented to date [12].
On the other hand, lumped-plasticity elements necessitate calibration of their parameters based on the response of an actual or ideal frame element under simplified loading conditions. This calibration is essential because the response of concentrated plasticity elements is derived from the moment–rotation relationship of their components. In a real frame element, the end moment–rotation relationship is obtained through the integration of the section response as it happens with a fiber beam element [10].
To address the behavior of prismatic members, where normal stresses and strains across the depth of a cross-section vary according to flexural moment demands (i.e., plane sections remain plane), Vecchio and Collins (1988) [13] introduced the Modified Compression Field Theory (MCFT) within a layered analysis model, commonly referred to as a fiber model [14]. In this method, the kinematic assumptions for flexure and shear (represented by sectional curvature and shear strain) guide the algorithm, while the orientations of principal stresses and strains are calculated across the depth of the member at various layers. Nonlinear material constitutive laws, describing uniaxial stress and strain in the principal directions, are employed to determine the stress state and establish equilibrium of the stress resultants. In this approach, concrete fibers are treated as biaxially stressed elements within the cross-section, and their in-plane stresses are analyzed using the MCFT. This methodology was later refined to improve the determination of shear stress distribution across the cross-section. These advanced formulations were implemented in Response 2000 [15], a nonlinear member analysis computer program.
However, when applying the MCFT to seismic assessments, several adaptations are needed due to the unique characteristics of cyclic loading. One limitation is that most experimental data supporting the MCFT comes from tests using monotonic loads, providing limited insight into how the model performs under cyclic displacement reversals and the associated degradation mechanisms. Additionally, the method assumes uniformly distributed reinforcement, which is not suitable for older, sparsely reinforced structures. A third limitation is the lack of explicit consideration of the role of bond-slip degradation in the shear behavior of RC members.
The latter limitation along with the unique characteristics of lightly reinforced concrete columns that arise from the interaction between shear and flexure were recently studied by developing a fiber beam model based on the Modified Compression Field Theory (MCFT) [16]. This theory was applied in an exact Timoshenko fiber element, which also incorporates the significant impact of tensile reinforcement pullout from its anchorage or short lap splice on the column's overall lateral drift. These features were integrated into a stand-alone Windows program called "Phaethon" [16] with a user interface developed in C++ programming language. The program is designed to assist engineers in analyzing both rectangular and circular substandard reinforced concrete columns.
Using the moment-rotation envelope results from a cantilever shear-critical column analyzed by the Phaethon software, an inelastic frame structure experiencing shear, axial or pull-out failures can be modeled by placing a rigid plastic spring at the location where shear failure is anticipated considering also the contribution of anchorage or lap-splice pullout slip in the total drift and applying a negative kinematic hardening. The slope of the kinematic hardening connects the point on the moment-rotation envelope where shear failure occurs to the point of axial failure, beyond which the column can no longer support its gravity loads. The part of the member between the two rigid plastic springs remains perfectly elastic. The original version of this one-component model was generalized by Giberson [17,18]. A key advantage of this approach is that inelastic deformation at the member ends depends solely on the moment applied at the end, allowing any moment-rotation hysteretic model to be assigned to the spring. Although this simple model has faced some rational criticism, its performance is expected to be reasonably effective for relatively low-rise frame structures, where the inflection point of a reinforced concrete column is located near mid-height.
The primary goal of Performance-Based Earthquake Engineering is to establish an "acceptable" probability of collapse. Collapse should be quantified as accurately as possible through nonlinear dynamic analysis. A comprehensive set of guidelines will serve as a foundation for addressing the complexities of nonlinear softening responses under large displacements and deformations, helping to promote the acceptance of nonlinear response analyses in professional practice [19,20,21]. The introduction of simple but effective column models, like those presented in this study, which account for localized effects such as shear and anchorage or lap splice slip within a consistent element formulation, will reduce non-convergence issues and computational time. This paper has the following contributions in the research area of seismic assessment of old-type RC frames through nonlinear dynamic analyses:
  • The formulation of path-dependent one-component element response with strength degradation due to shear and axial failures is described in detail.
  • A MATLAB [22] code is developed in order to run a nonlinear dynamic analysis on one-story, two-bay reinforced concrete frame experiencing both shear and axial failures and was simulated with the above formulated beam element.
  • The proposed analytical model can also address the stress state of a column under full cyclic load reversals, accounting for both flexure- and shear-dominated response conditions in RC columns, while also considering the contribution of anchorage or lap-splice pullout slip to the total drift.
The structure of this study is the following: after the introduction that describes the initiatives of this research paper, the formulation of path-dependent one-component element response with strength degradation is described in Section 2. In Section 3 the correlation of the proposed analytical model to the experimental results from the literature is thoroughly described. Finally, the discussion of the output results is presented in Section 4 while the conclusions and future work are presented in Section 5.

2. Materials and Methods

It is valuable to examine one-component beam model formulation in greater detail, as it exemplifies a category of elements that rely on assumptions about internal force distribution. These elements are crucial in contemporary earthquake engineering analysis, as they accurately represent the force distribution within a member and lead to a reliable numerical implementation.

2.1. Path-Dependent Element Response with Strength Degradation

For a linear elastic, perfectly plastic beam with non-smooth multi-surface plasticity, the equilibrium, compatibility, and constitutive relations of the elastic component, along with the yield function, are provided in the following equations as illustrated in Figure 1 (p denotes plastic and e denotes elastic, Mp is the plastic moment and k is the stiffness) [10,23,24,25]:
Equilibrium :   q = q e = q p
Compatibility :   v = v e + v p with v p = 0 v p 2 v p 3
Constitutive relation of elastic component:
q = k e · v e = k e · v v p
Yield   function :   f 1 q 2 , q 3 = q 2 M p i 0 for   node   i
Yield   function :   f 2 q 2 , q 3 = q 3 M p j 0 for   node   j
There are now two independent yield surfaces, one for node i and one for node j. These can be expressed more concisely by using the relationship |x| = sign(x)x:
f 1 q 2 , q 3 = s i g n q 2 q 2 M p i 0
f 2 q 2 , q 3 = s i g n q 3 q 3 M p j 0
Introducing the derivative:
f 1 q = 0 s i g n q 2 0 = n 2
f 2 q = 0 0 s i g n q 3 = n 3
Using the definition n = n 2 n 3 and f q = n T the yield conditions can be reformulated:
f q 2 , q 3 = n T q q p l 0   with   q p l = 0 M p i M p j
The flow rule for non-smooth plasticity is provided below:
Flow   rule :   v ˙ p = n 2 β 2 + n 3 β 3 = n β   iff   f q 2 , q 3 = n T q q p l = 0
Kuhn - Tucker   conditions :   β k 0   and   f k 0   and   β k f k = 0 for k = 2 , 3
Consistency   condition :   β k f k ˙ = 0 for k = 2 , 3
The plastic flow β k can be defined from the consistency condition β k f k ˙ = 0 for k=2,3
f ˙ = n · q = n · k e v ˙ v p ˙ ˙
Substituting the flow rule with v p ˙ = n β :
f ˙ = n · k e v ˙ n β ˙
According to the consistency condition β k > 0 only if f k ˙ = 0 for k=2,3 (α stands for active node, i.e., for a node with f a ˙ = 0 :
β a = n a T k e v ˙ n a T k e n a
The tangent modulus during plastic flow is expressed as:
k = k e k e n a n a T k e n a T k e n a
The summary of multi-surface plasticity for a linear elastic, perfectly plastic beam is presented below (cyclic rules similar to bilinear model):
  • Additive deformation decomposition v = v e + v p
  • Force-deformation relation q = k e · v e = k e · v v p
  • Yield condition f q 2 , q 3 = n T q q p l 0 with n = n 2 n 3
  • Flow rule v ˙ p = n 2 β 2 + n 3 β 3 = n β iff f q 2 , q 3 = n T q q p l = 0
  • Kuhn – Tucker conditions β k 0 and f k 0 and β k f k = 0 for k=2,3
  • Consistency condition β k f k ˙ = 0 for k=2,3
In order for the kinematic hardening Hk to be included, the Equations 16 and 17 are rewritten as follows:
β a = n a T k e v ˙ n a T ( k e   + H k )   n a
k = k e k e n a n a T k e n a T ( k e   + H k )   n a
The kinematic hardening Hk equals to the negative slope connecting the point of the response at shear failure to the point at axial failure of a shear-critical RC column. For flexure-dominant elements the kinematic hardening can have a positive value or could be omitted.
In order to determine the point of shear failure of a shear-critical column, pushover analysis of a single cantilever column is applied using Phaethon software. For the pushover analysis, the sectional model of Phaethon (either rectangular or circular) based of MCFT is used, along with the footing anchorage model from Tastani and Pantazopoulou (2013) [26] or the lap-splice model of Megalooikonomou (2024) [16], all embedded in Phaethon Windows software. A progressively increasing lateral point load is applied at the tip of the cantilever. A single exact Timoshenko force-based fiber element considering the effect of shear in modifying the principal directions along the fiber section depth is assigned to represent the entire height of the cantilever column, with the number of Gauss-Lobatto integration points chosen by the user. The user also selects the analysis step size for the lateral load and the total number of steps up to the maximum load (shear failure). Since the Modified Compression Field Theory in the fiber approach [15] cannot capture the descending behavior of shear-critical columns, a load-controlled procedure without adjusting the load-step size and only updating the stiffness is implemented in Phaethon. The point at shear failure corresponds to the last converged step of the incremental algorithm. It's important to note that in reality, the response of a shear-critical column features a descending branch following peak strength (brittle response). However, the embedded algorithm only simulates up to the point of strength attainment and shear failure. Beyond the maximum load, the descending portion of the capacity curve is represented by a line connecting the peak load point (shear failure) with the point of axial failure, as defined in terms of drift by Elwood and Moehle (2005) [27], with 20% of the peak load considered as the residual load at axial failure. This defines also the negative kinematic hardening Hk of the moment-rotation envelope of the shear-critical column to be applied in the following Section in the nonlinear time-history analysis.

3. Results

In this Section the results of shaking table tests on a one-story (height: 1628 mm), two-bay (length of each bay 1830 mm) reinforced concrete frame experiencing both shear and axial failures [28,29] are compared with nonlinear dynamic analyses using simplified models designed for assessing the collapse of older reinforced concrete structures. To simulate the nonlinear behavior of columns—both those prone to shear failure and those more flexural in nature—the one-component beam model of the previous Section was utilized.

3.1. Experimental Test Setup

Shake table tests were performed [28,29] to investigate the dynamics of shear and axial load failures in reinforced concrete columns when an alternative load path is available for load redistribution. The test specimens consisted of three columns fixed at their bases and connected by a beam at the top. The central square-section column had a wide spacing of transverse reinforcement, making it susceptible to shear failure and subsequent axial load failure during the tests. As the central column failed, shear and axial loads were redistributed to the neighboring ductile circular columns. Two test specimens were constructed and evaluated. The first specimen supported a mass that generated axial load stresses in the column similar to those expected in a seven-story building. In the second specimen, hydraulic jacks were incorporated to increase the axial load on the central column, thereby heightening the demand for axial load redistribution as the central column began to fail. Both specimens underwent one horizontal component of a scaled ground motion recorded during the 1985 earthquake in Chile. A comparison of the results from both specimens revealed that the behavior of the frame depended on the initial axial stress of the center column. The specimen with lower axial load experienced shear failure but retained most of its initial axial load. In contrast, the specimen with the higher axial load exhibited shear failure of the central column at lower drift levels and earlier in the ground motion record, leading to axial failure of the central column. Displacement data captured just after the onset of axial failure suggest two mechanisms for the shortening of the center column during axial failure: first, large pulses that lead to a sudden increase in vertical displacement after a critical drift is reached, and second, smaller oscillations that seem to ‘grind down’ the shear-failure plane. Additionally, dynamic amplification of axial loads transferred from the center column to the outer columns was observed during the axial failure of the center column.
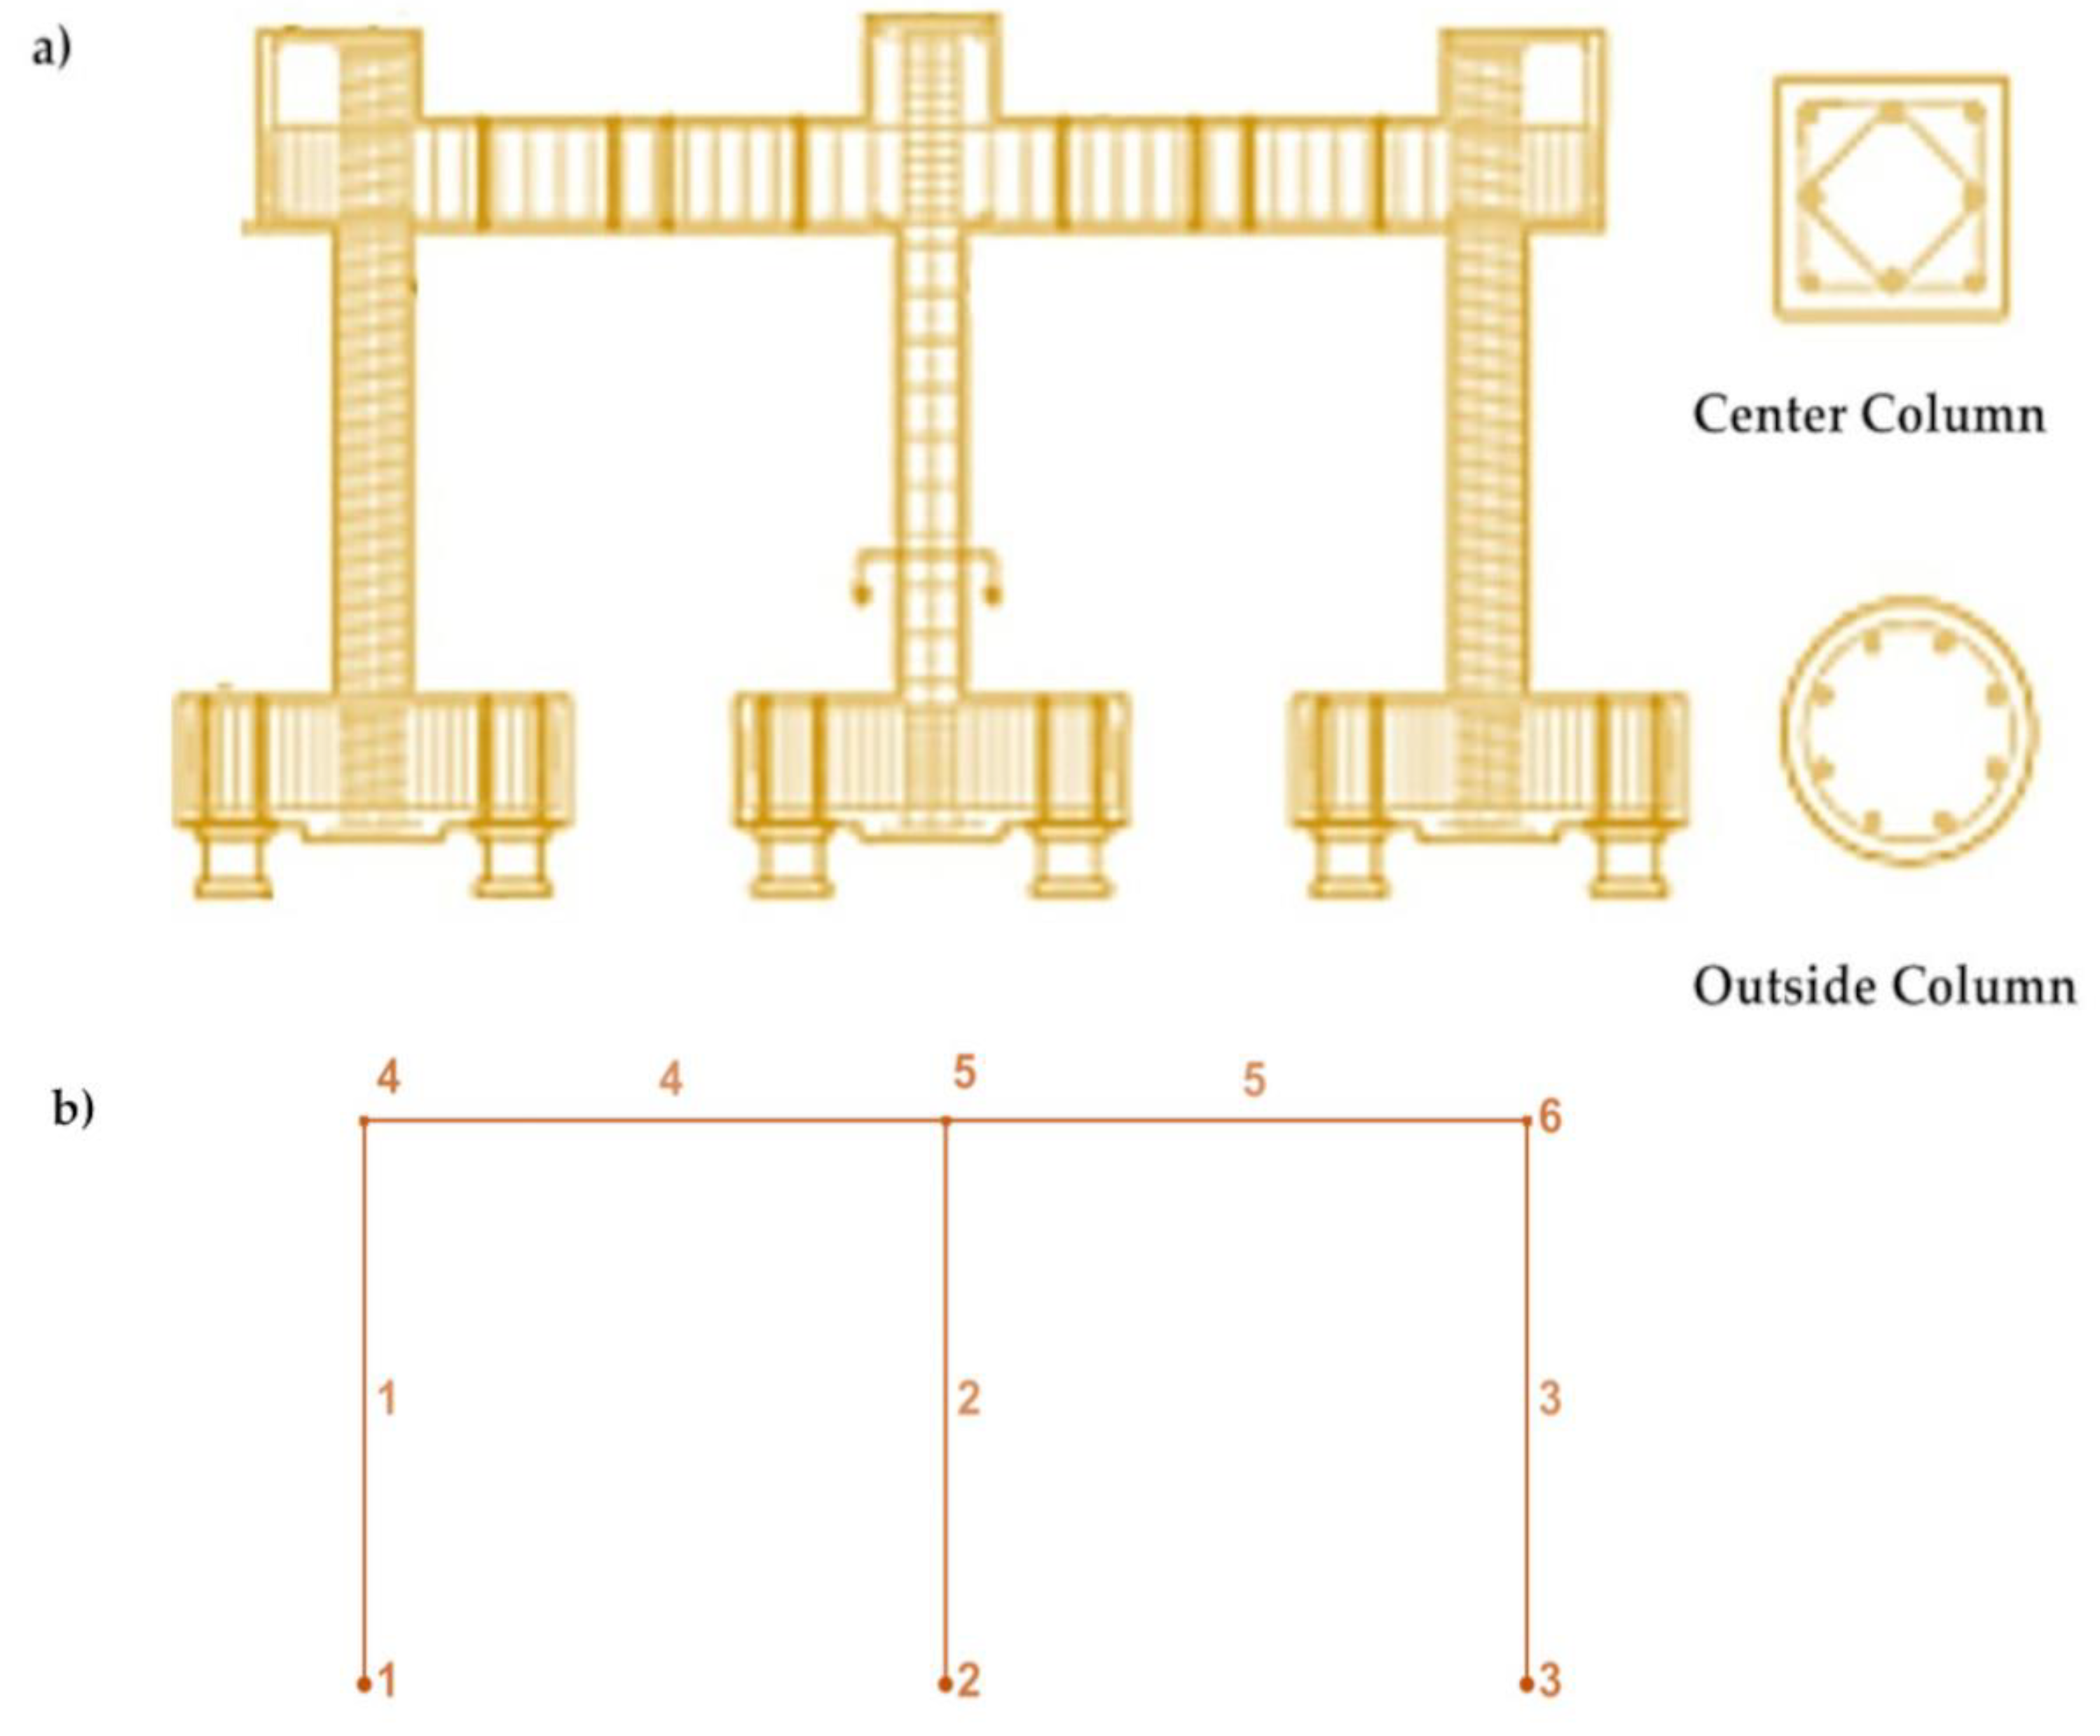
Two half-scale specimens, nominally identical, were built and tested on the shaking table at the University of California, Berkeley [28,29]. Each planar-frame specimen consisted of three columns connected at the top by a 1.5m-wide beam and supported at the bottom by footings attached to multi-axis load cells (Figure 2 (a)). The columns supported a total mass of 31,000 kg. To simulate reinforced concrete columns typical of 1960s construction in the western United States, the center column was built with light transverse reinforcement (Ash/bs = 0.18%, where Ash is the area of transverse reinforcement parallel to the applied shear, b is the width of the column (230x230 mm with 4 #4 corner bars and 4 #5 corner bars with fy = 479.18 MPa), and s is the spacing of the transverse reinforcement (W2.9 wire @152 mm with fu = 717 MPa) and 90° hooks. The outer columns (circular section with diameter 255 mm – 8 #4 longitudinal steel bars) were reinforced with closely spaced spirals (#3 spiral@ 50 mm) to ensure a ductile response and to maintain gravity load support in the event of shear and axial-load failure in the center column.
Both specimens were subjected to one horizontal component of the ground motion recorded in Viña del Mar during the 1985 Chile earthquake. However, the recorded acceleration values on the shake table during testing will be applied on the numerical simulation of the next Section. The only difference between the two specimens was the initial axial load applied to the center column. For Specimen 1, the center column's axial load was 0.10Agfc, while for Specimen 2, it was 0.24Agfc (where Ag is the gross cross-sectional area and fc is the measured concrete strength (24.27 MPa). The axial load in Specimen 2 was increased to examine the impact of axial load on shear and axial failures. This higher load was achieved by post-tensioning the specimen to the shaking table using pneumatic jacks, preventing unwanted changes in the vibration period due to added reactive mass.
During testing, Specimen 1's center column experienced a reduction in lateral-load capacity, apparently due to shear failure, but did not suffer axial failure. In contrast, Specimen 2's center column experienced both shear and axial-load failures. Therefore, the latter specimen will be employed in the numerical simulation for correlation with experimental results. Additional details regarding the specimens, test setup, and experimental results can be found in [28,29].

3.2. Pushover Analysis of Center Shear-Critical RC Cantilever Column.

The center column of the Specimen 2 of the above-described shake table test will be analyzed in this Section through pushover analysis using Phaethon software [16]. In Table 1 the properties of the column under study are given in detail.
For each point load applied at the tip of the cantilever, the corresponding shear force at the specified sections of the column (integration points) matches the applied load, producing a constant shear force diagram. The flexural moment at the column's base along with the moment distribution, is derived from the lateral load, resulting in a consistent shear force. The concentric axial load (whether tensile or compressive) applied at the cantilever's tip remains unchanged throughout the pushover analysis and along the cantilever's length, ensuring that each section of the column experiences the same axial force as at the tip. Using this approach, the resisting section forces should converge to the previously determined section forces, which are based on the moment, shear, and axial load diagrams of the cantilever column under a constant axial load and progressively increasing lateral tip point loads. Once the section forces converge (via the Newton-Raphson iteration algorithm) along the cantilever column to match the correct values from the force diagrams resulting from the applied horizontal and axial loads at the tip, the axial deformation, curvature and shear strain for each section can be calculated.
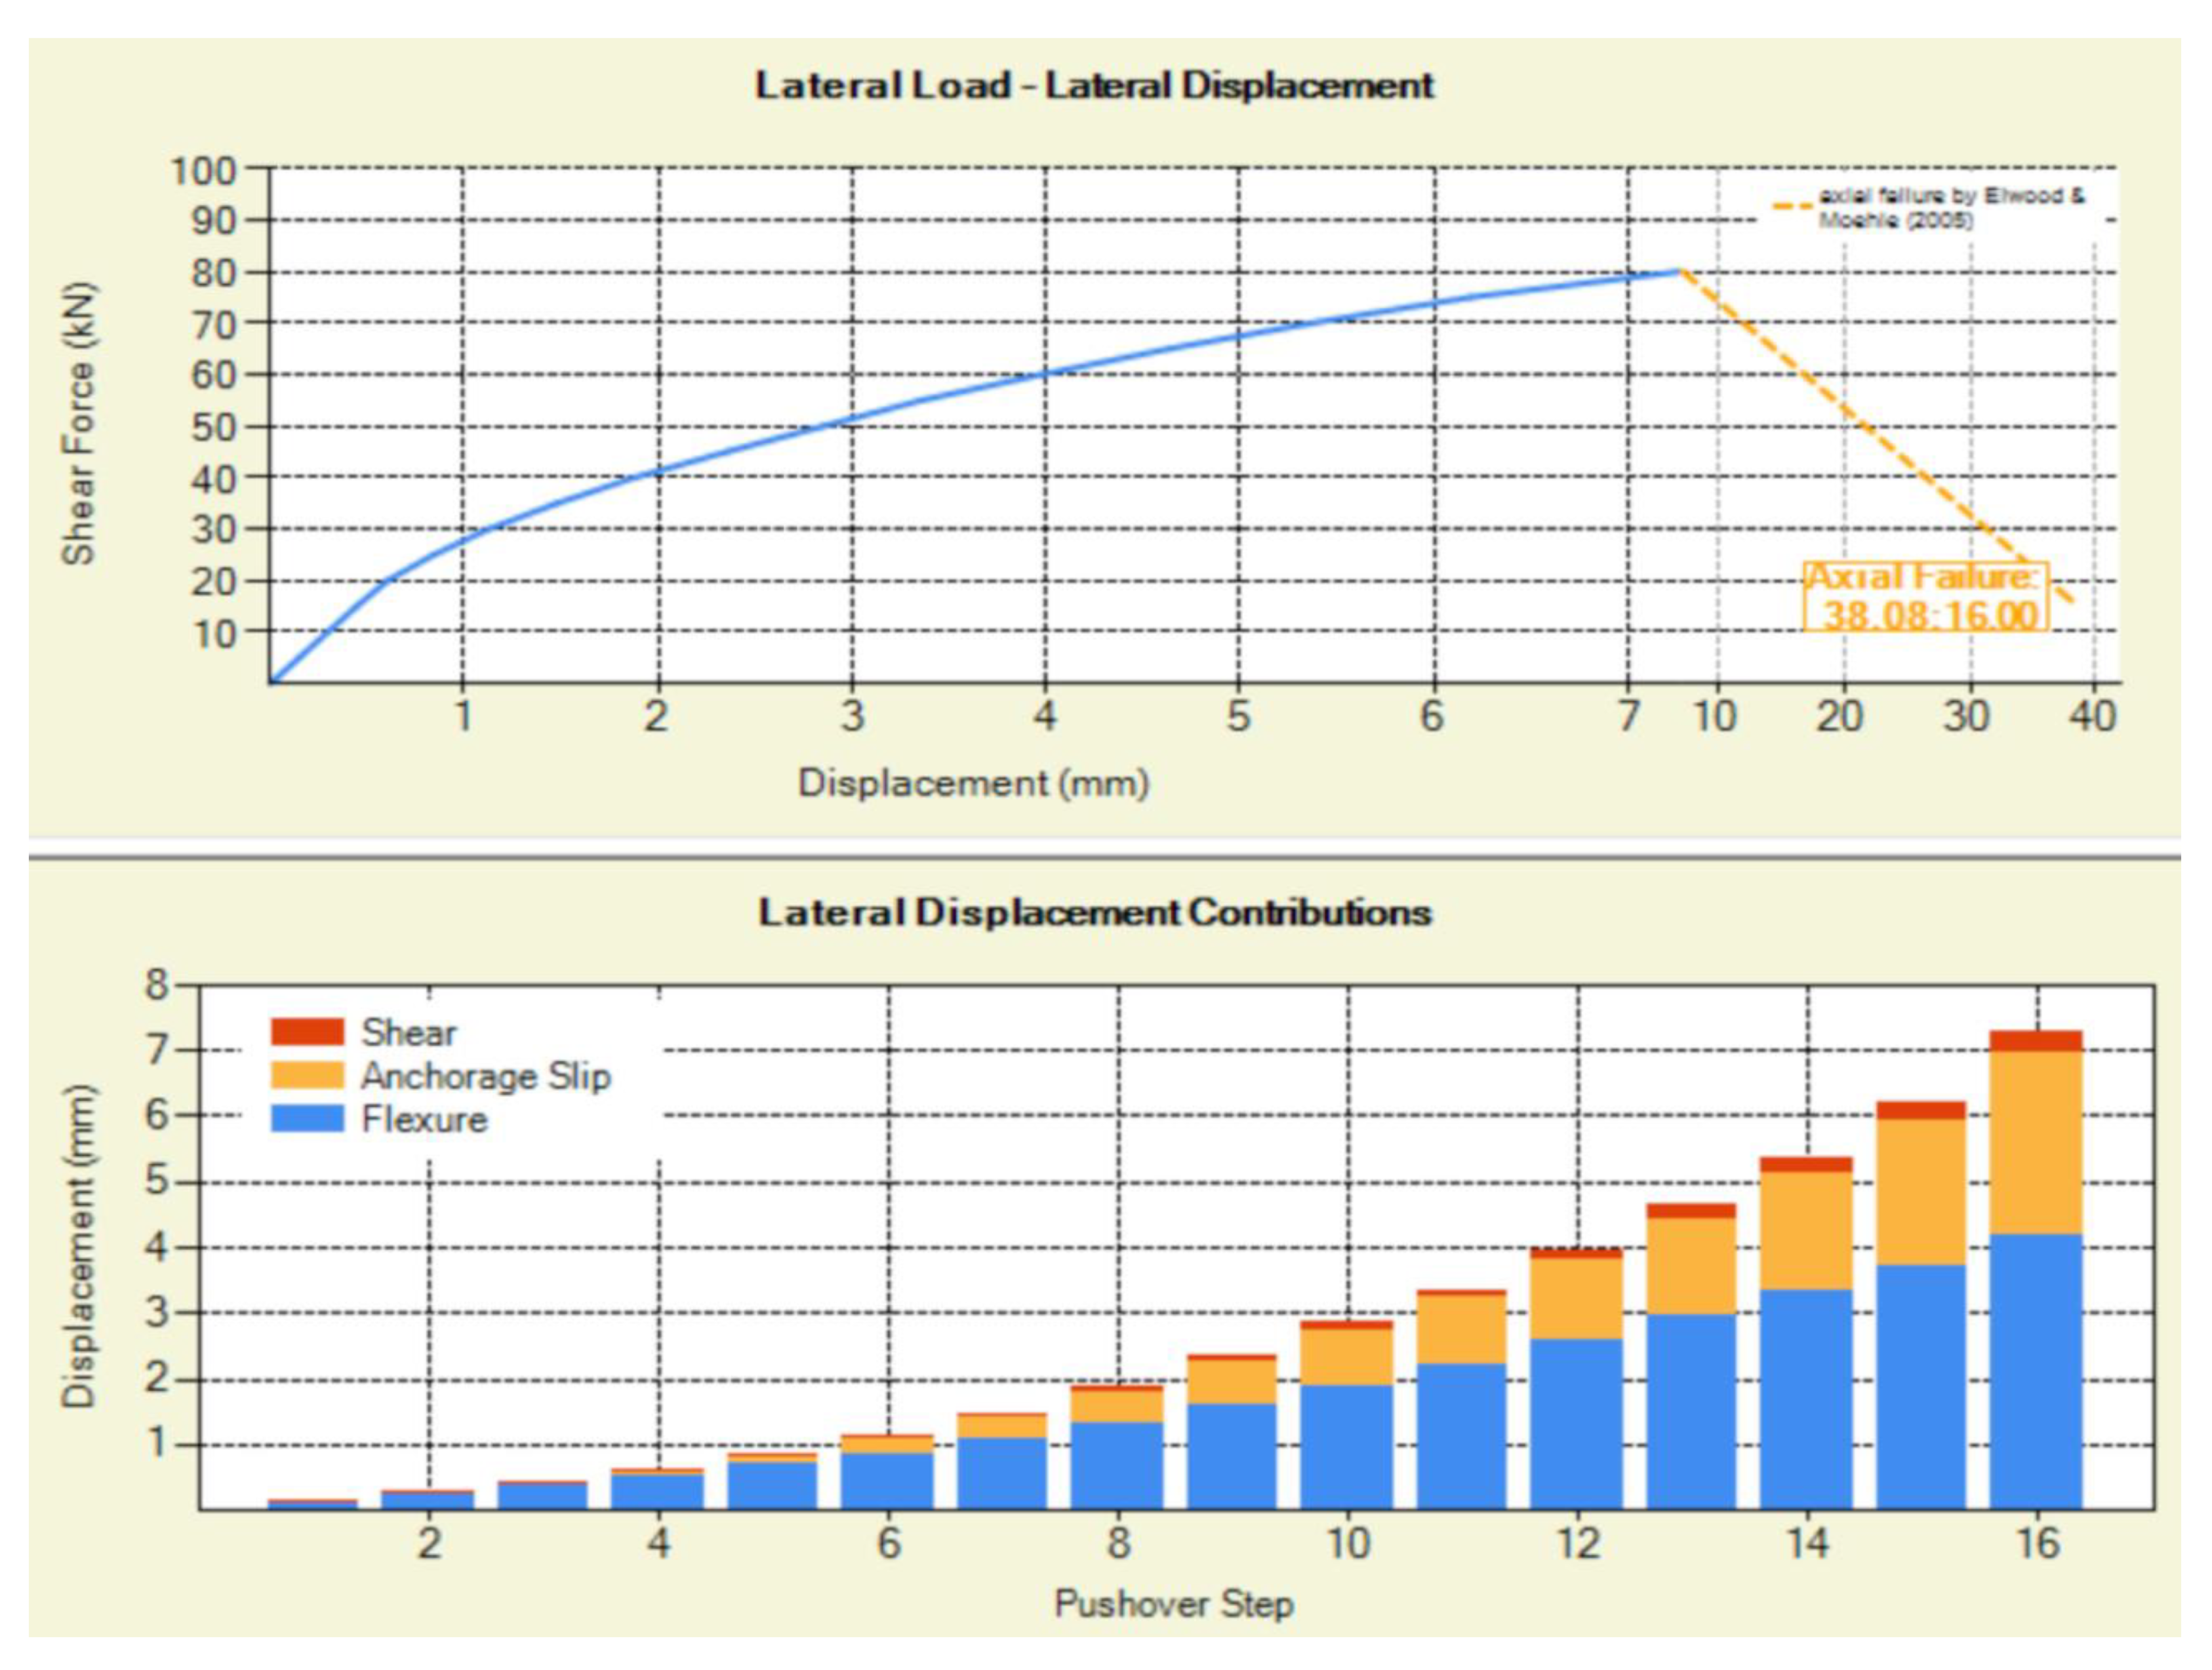
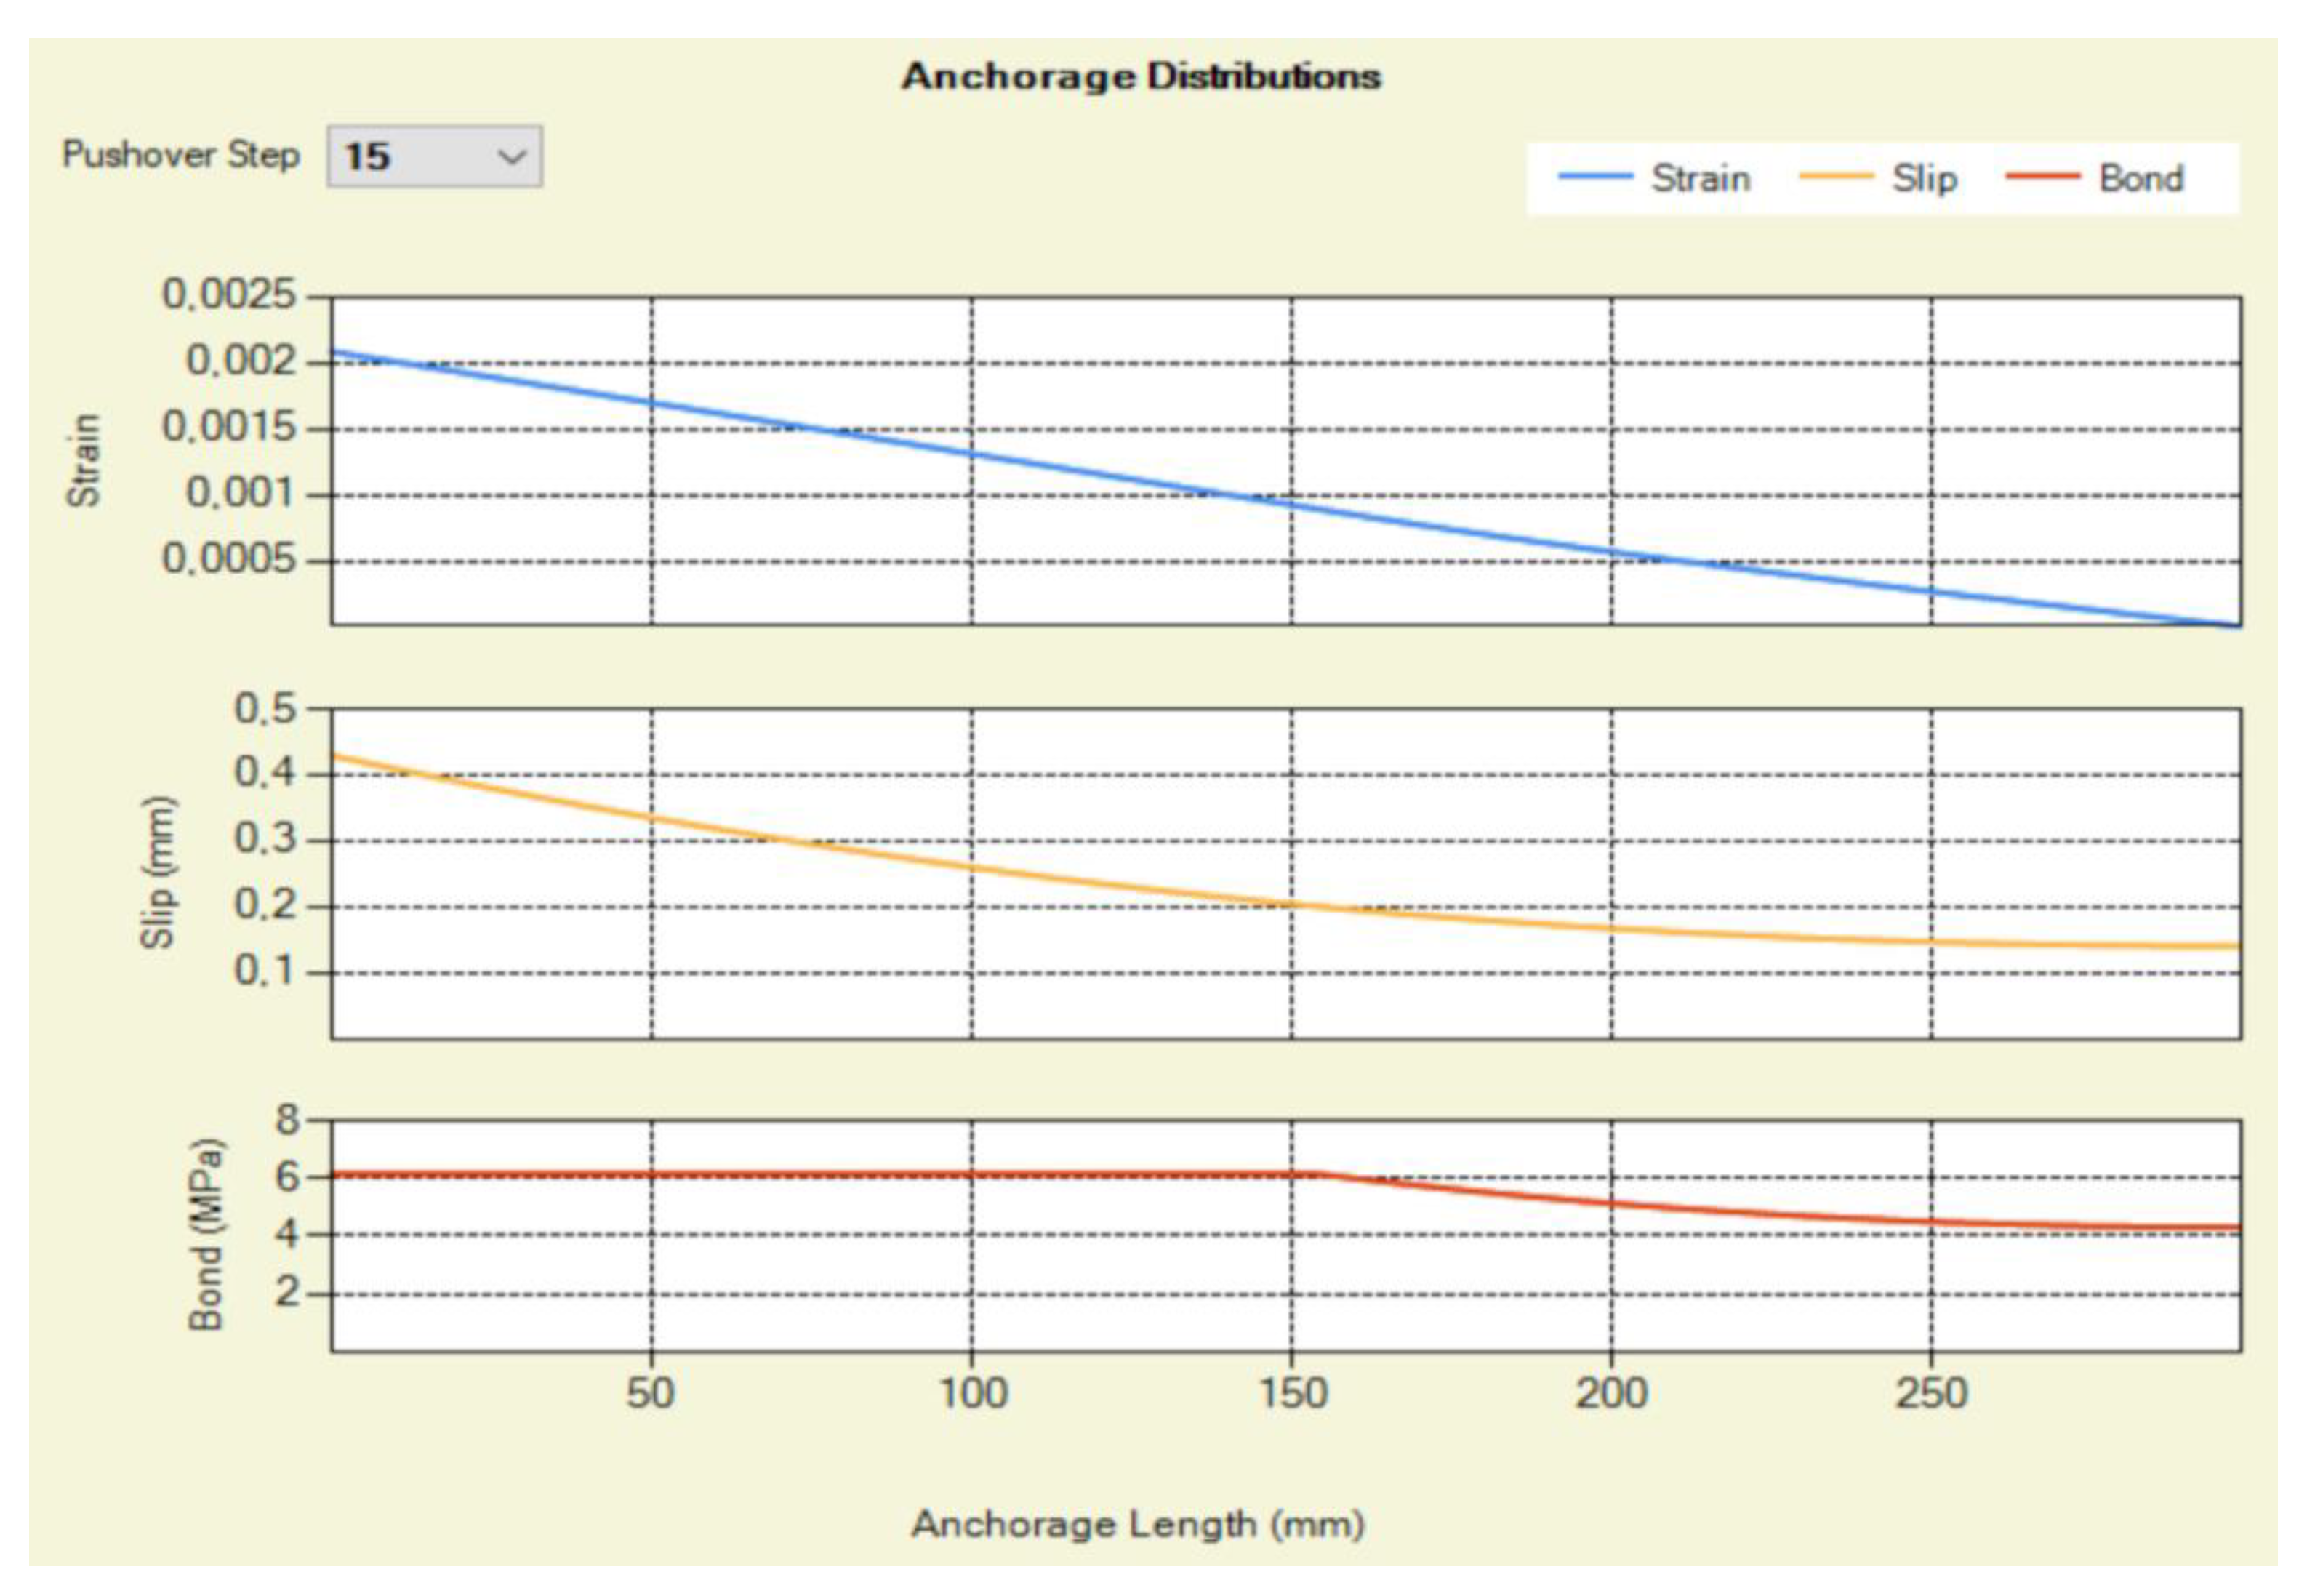
By integrating the curvatures along the shear span of the cantilever column, the rotation due to flexure is determined, which can be easily converted into lateral displacement due to flexure by multiplying it by the shear span length. Similarly, integrating the shear strains across multiple sections (with positions determined using Gauss-Lobatto integration scheme) along the cantilever column’s length (integration points) provides the lateral displacement caused by the shear distortion mechanism of the column. Finally, the rotation and displacement resulting from the pull-out of the tensile reinforcement are determined using the theoretical framework outlined in [26]. These contributions from flexure, shear, and anchorage are then combined to determine the total lateral displacement, of the cantilever column at each lateral load increment. This process continues until reaching the maximum lateral load (point of shear failure), establishing the column's capacity curve. As already described, beyond the maximum load, the descending part of the capacity curve is depicted by a line connecting the peak load point (corresponding to shear failure) to the point of axial failure, as described by Elwood and Moehle (2005) [27]. At this point, 20% of the peak load is considered as the residual load during axial failure. This also defines the negative kinematic hardening behavior of the moment-rotation envelope for the shear-critical column, which will be used in the next section for nonlinear time-history analysis. Figure 3 and Figure 4 present the results of the shear-critical center column of Figure 2 under study. According to Figure 3 the point of shear failure defined by Phaethon software for the cantilever center shear-critical column of Specimen 2 is Vsh = 80 kN and Δsh = 7.27 mm. The axial failure event is depicted also in the same Figure. Thus, the negative kinematic hardening in terms of moment-rotation can be defined.

3.3. Nonlinear Time-History Analysis of Specimen 2

A MATLAB code [22] was developed for the nonlinear time-history analysis of the already introduced Specimen 2 by Elwood and Moehle [28,29]. The model of the 2D shear-critical RC frame fixed at the base can be seen in Figure 2b. All columns were modeled by employing the one-component beam model of Section 2. To the center column was applied, as already described, the negative kinematic hardening defined in the previous Section along with its secant stiffness’ elastic properties until the point of shear failure. To the side columns the experimental reported yielding moment was employed along with its elastic stiffness. Since the side columns sustain fluctuating axial load during testing a mean yielding moment value was introduced. The horizontal beams (Figure 2b) were modeled as 2D linear elastic beam elements with elastic properties.
In the case of earthquake excitation, the support degrees of freedom (DOFs) are assumed to move together following a specified ground acceleration history in the global coordinate system. The key step is to express the total acceleration relative to a fixed reference frame as the sum of the acceleration of the support DOFs and the additional acceleration of the free DOFs relative to the supports [30].
Central difference time integration method algorithm is used to solve the equations of motion. The advantage of the central difference method is that the stiffness matrix does not rely on the static stiffness matrix, which may change at each time step under nonlinear material behavior, requiring re-assembly and re-triangularization. In contrast, with the central difference method, the effective stiffness remains constant, provided the damping stiffness matrix is constant, as is commonly assumed with Rayleigh damping [30]. Additionally, this method does not require iterations within each time step, unlike the implicit time integration method. However, the central difference method is only conditionally stable, meaning it requires a small-time step for accurate integration. The introduced ground motion is the recorded acceleration values on the shake table during testing of Specimen 2. The equivalent viscous damping was set at 2% of critical damping for the fundamental mode of the shear-critical RC frame. The masses were lumped equally at the horizontal beams’ nodes and an additional vertical load was applied at the top node of the center column [0.24Agfc (where Ag (230x230 mm2) is the gross cross-sectional area and fc is the measured concrete strength (24.27 MPa)].
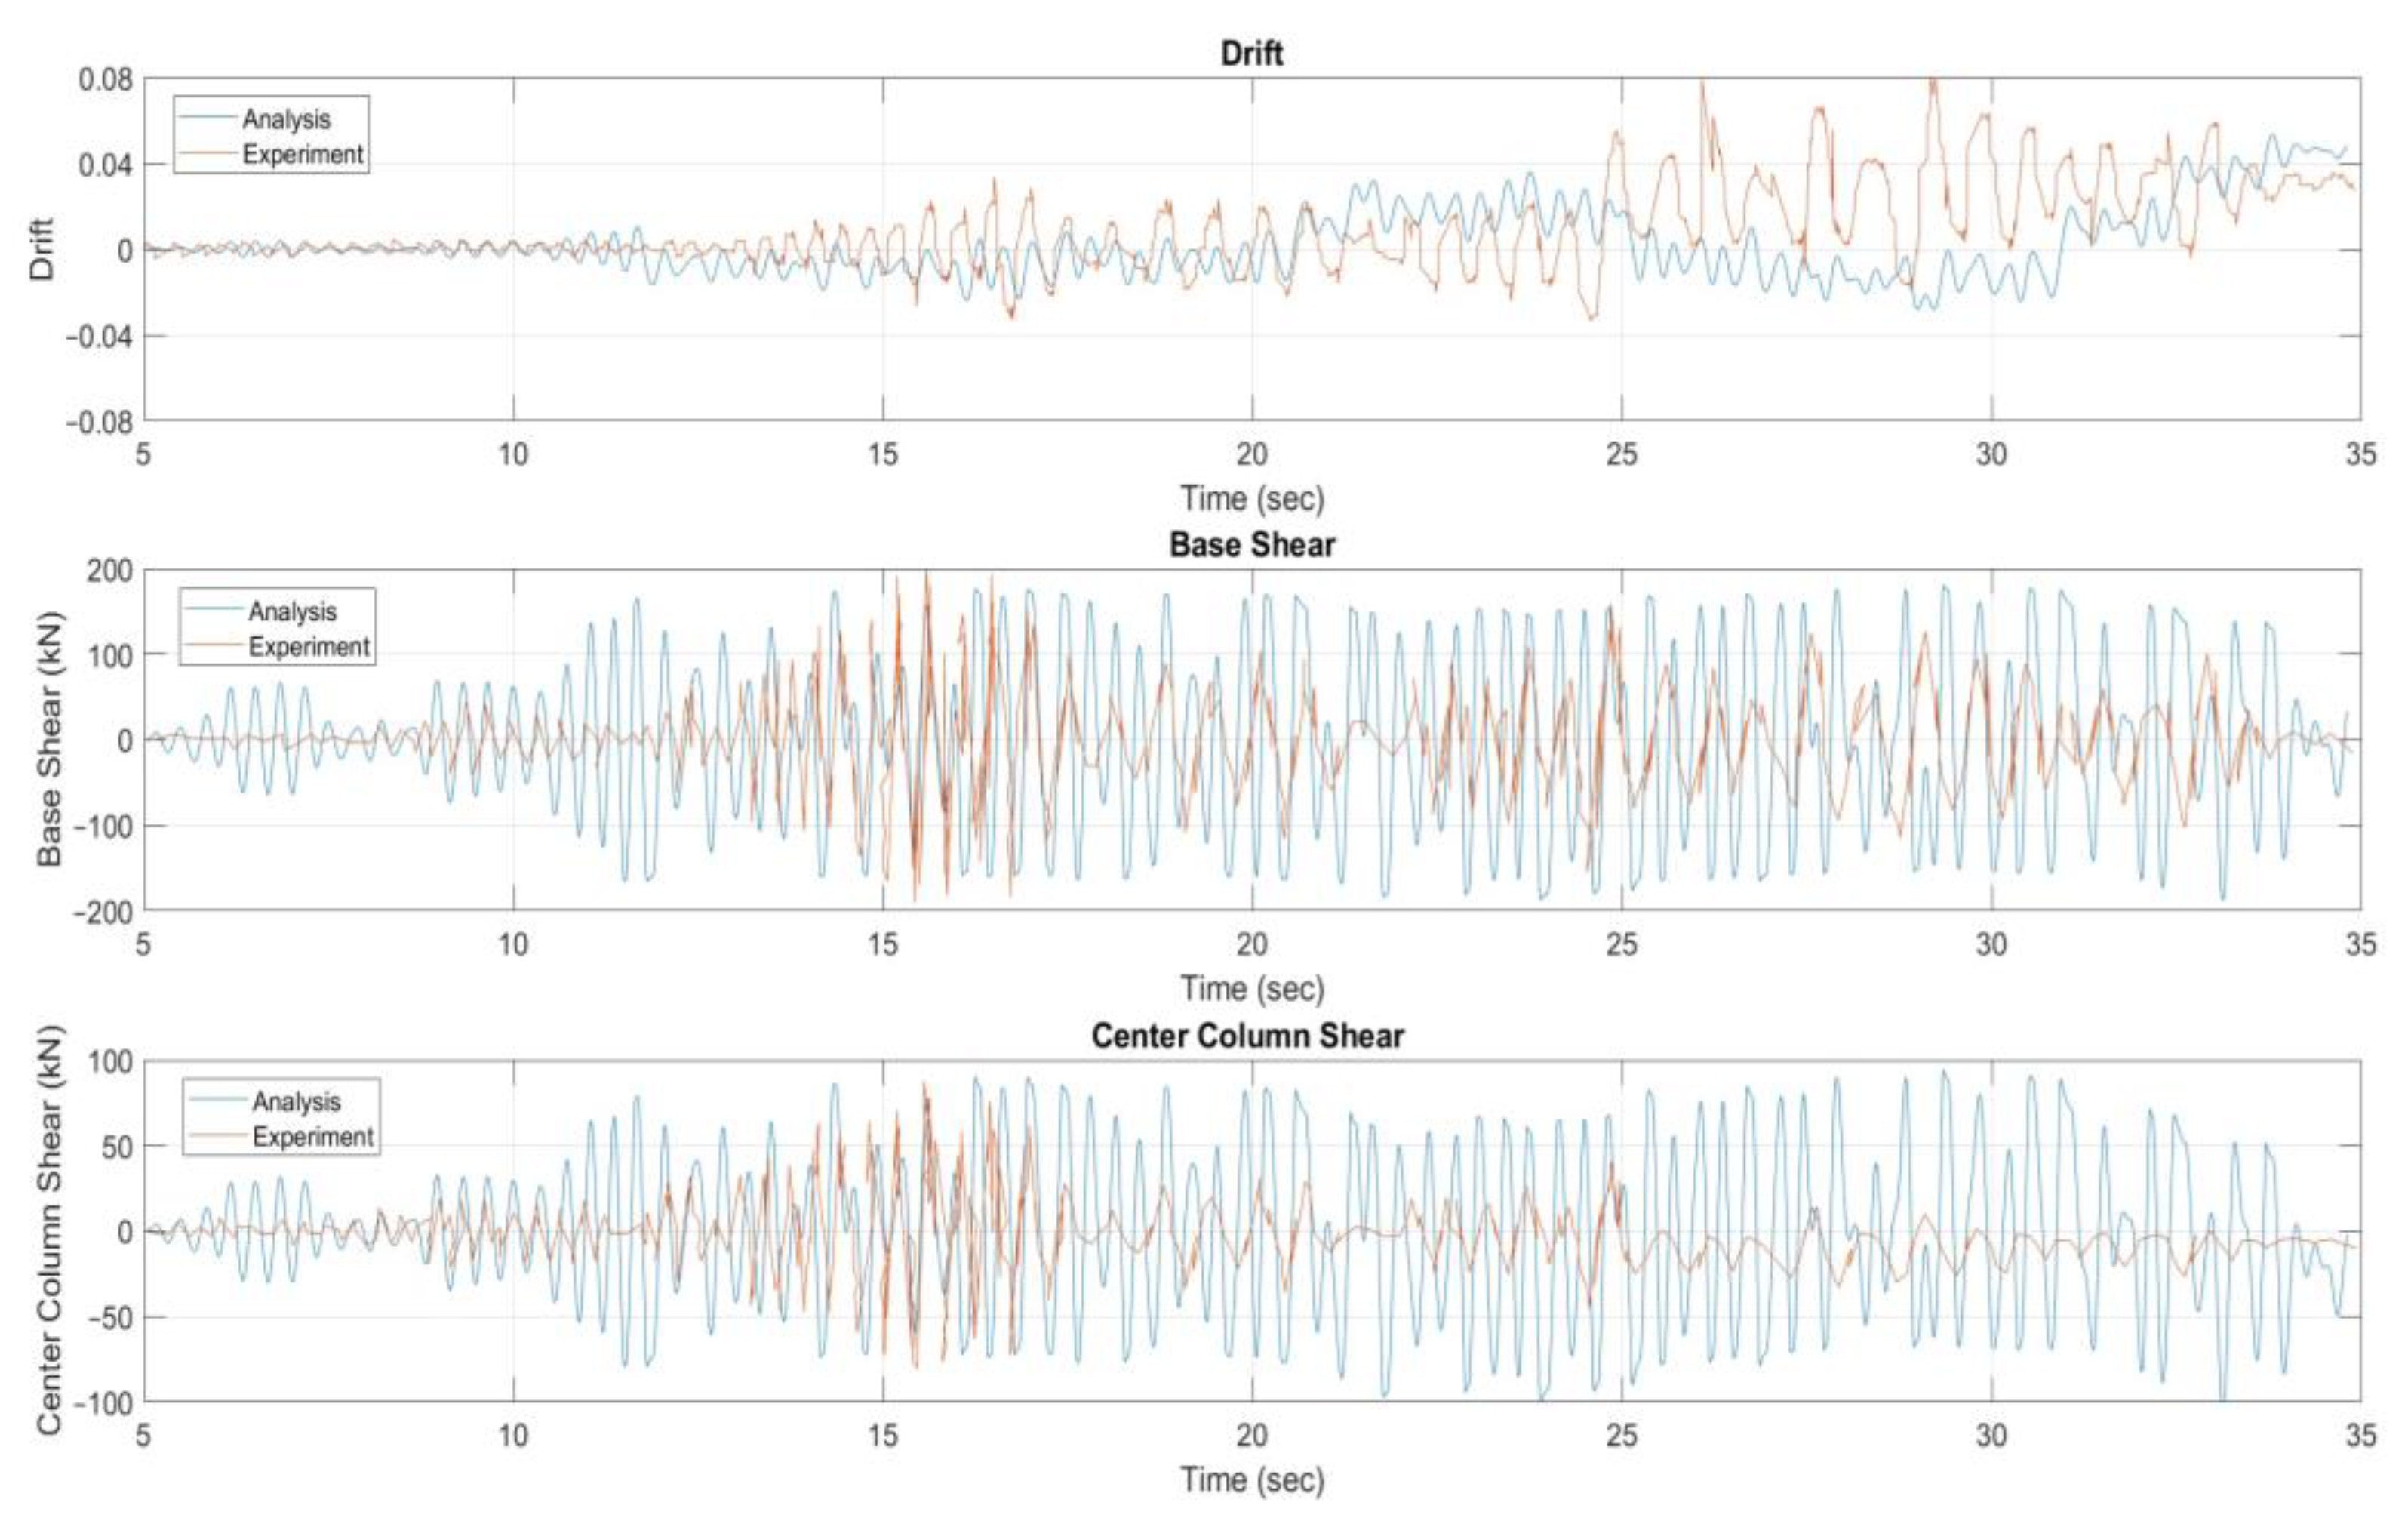
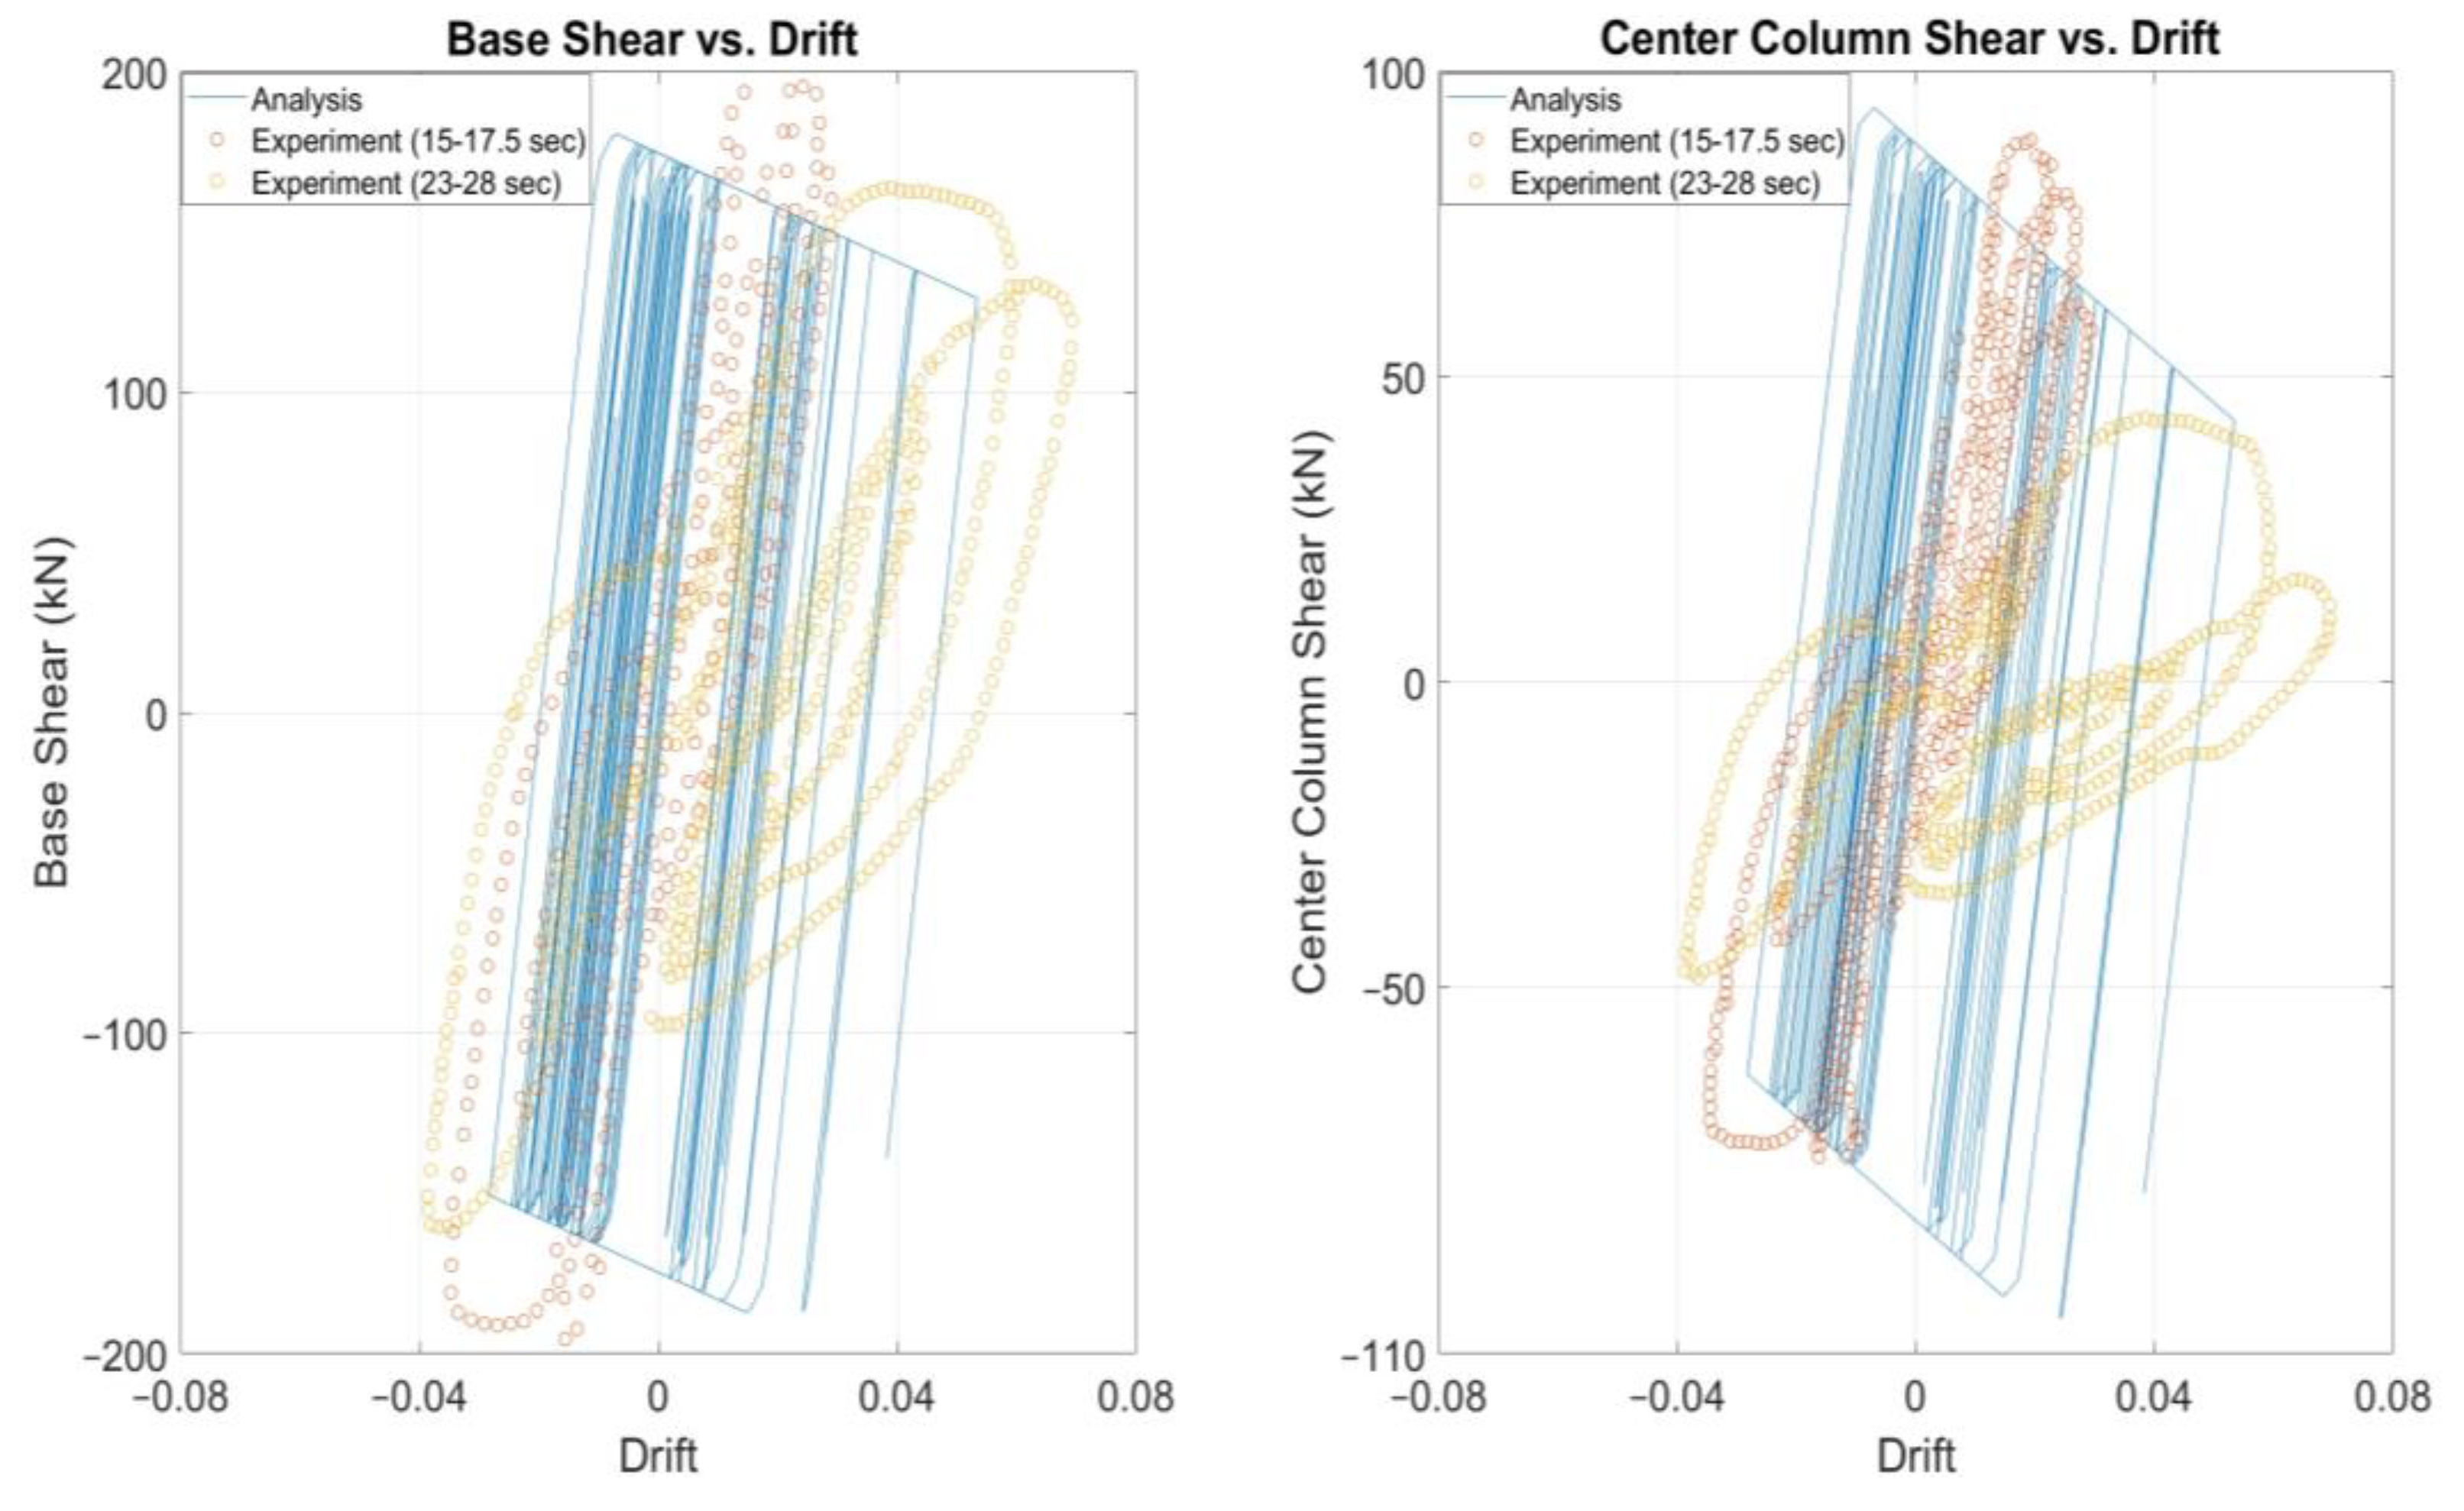
Figure 5 depicts the numerical and experimental nonlinear time-history response. It can be seen that there are similar value-ranges in the response however the reduced computational cost of the modeling approach led to some deviations between the calculated and measured shear forces and drifts during portions of the time-history response. Regarding drift, the permanent damage drift at 35s-time history has almost the same value. Base shear and center column shear forces are comparable but once the rigid plastic hardening springs of one-component model are triggered then there is no fluctuation in the sustained envelope shear forces apart from the negative kinematic hardening response as it would happen by employing distributed inelasticity beam elements.
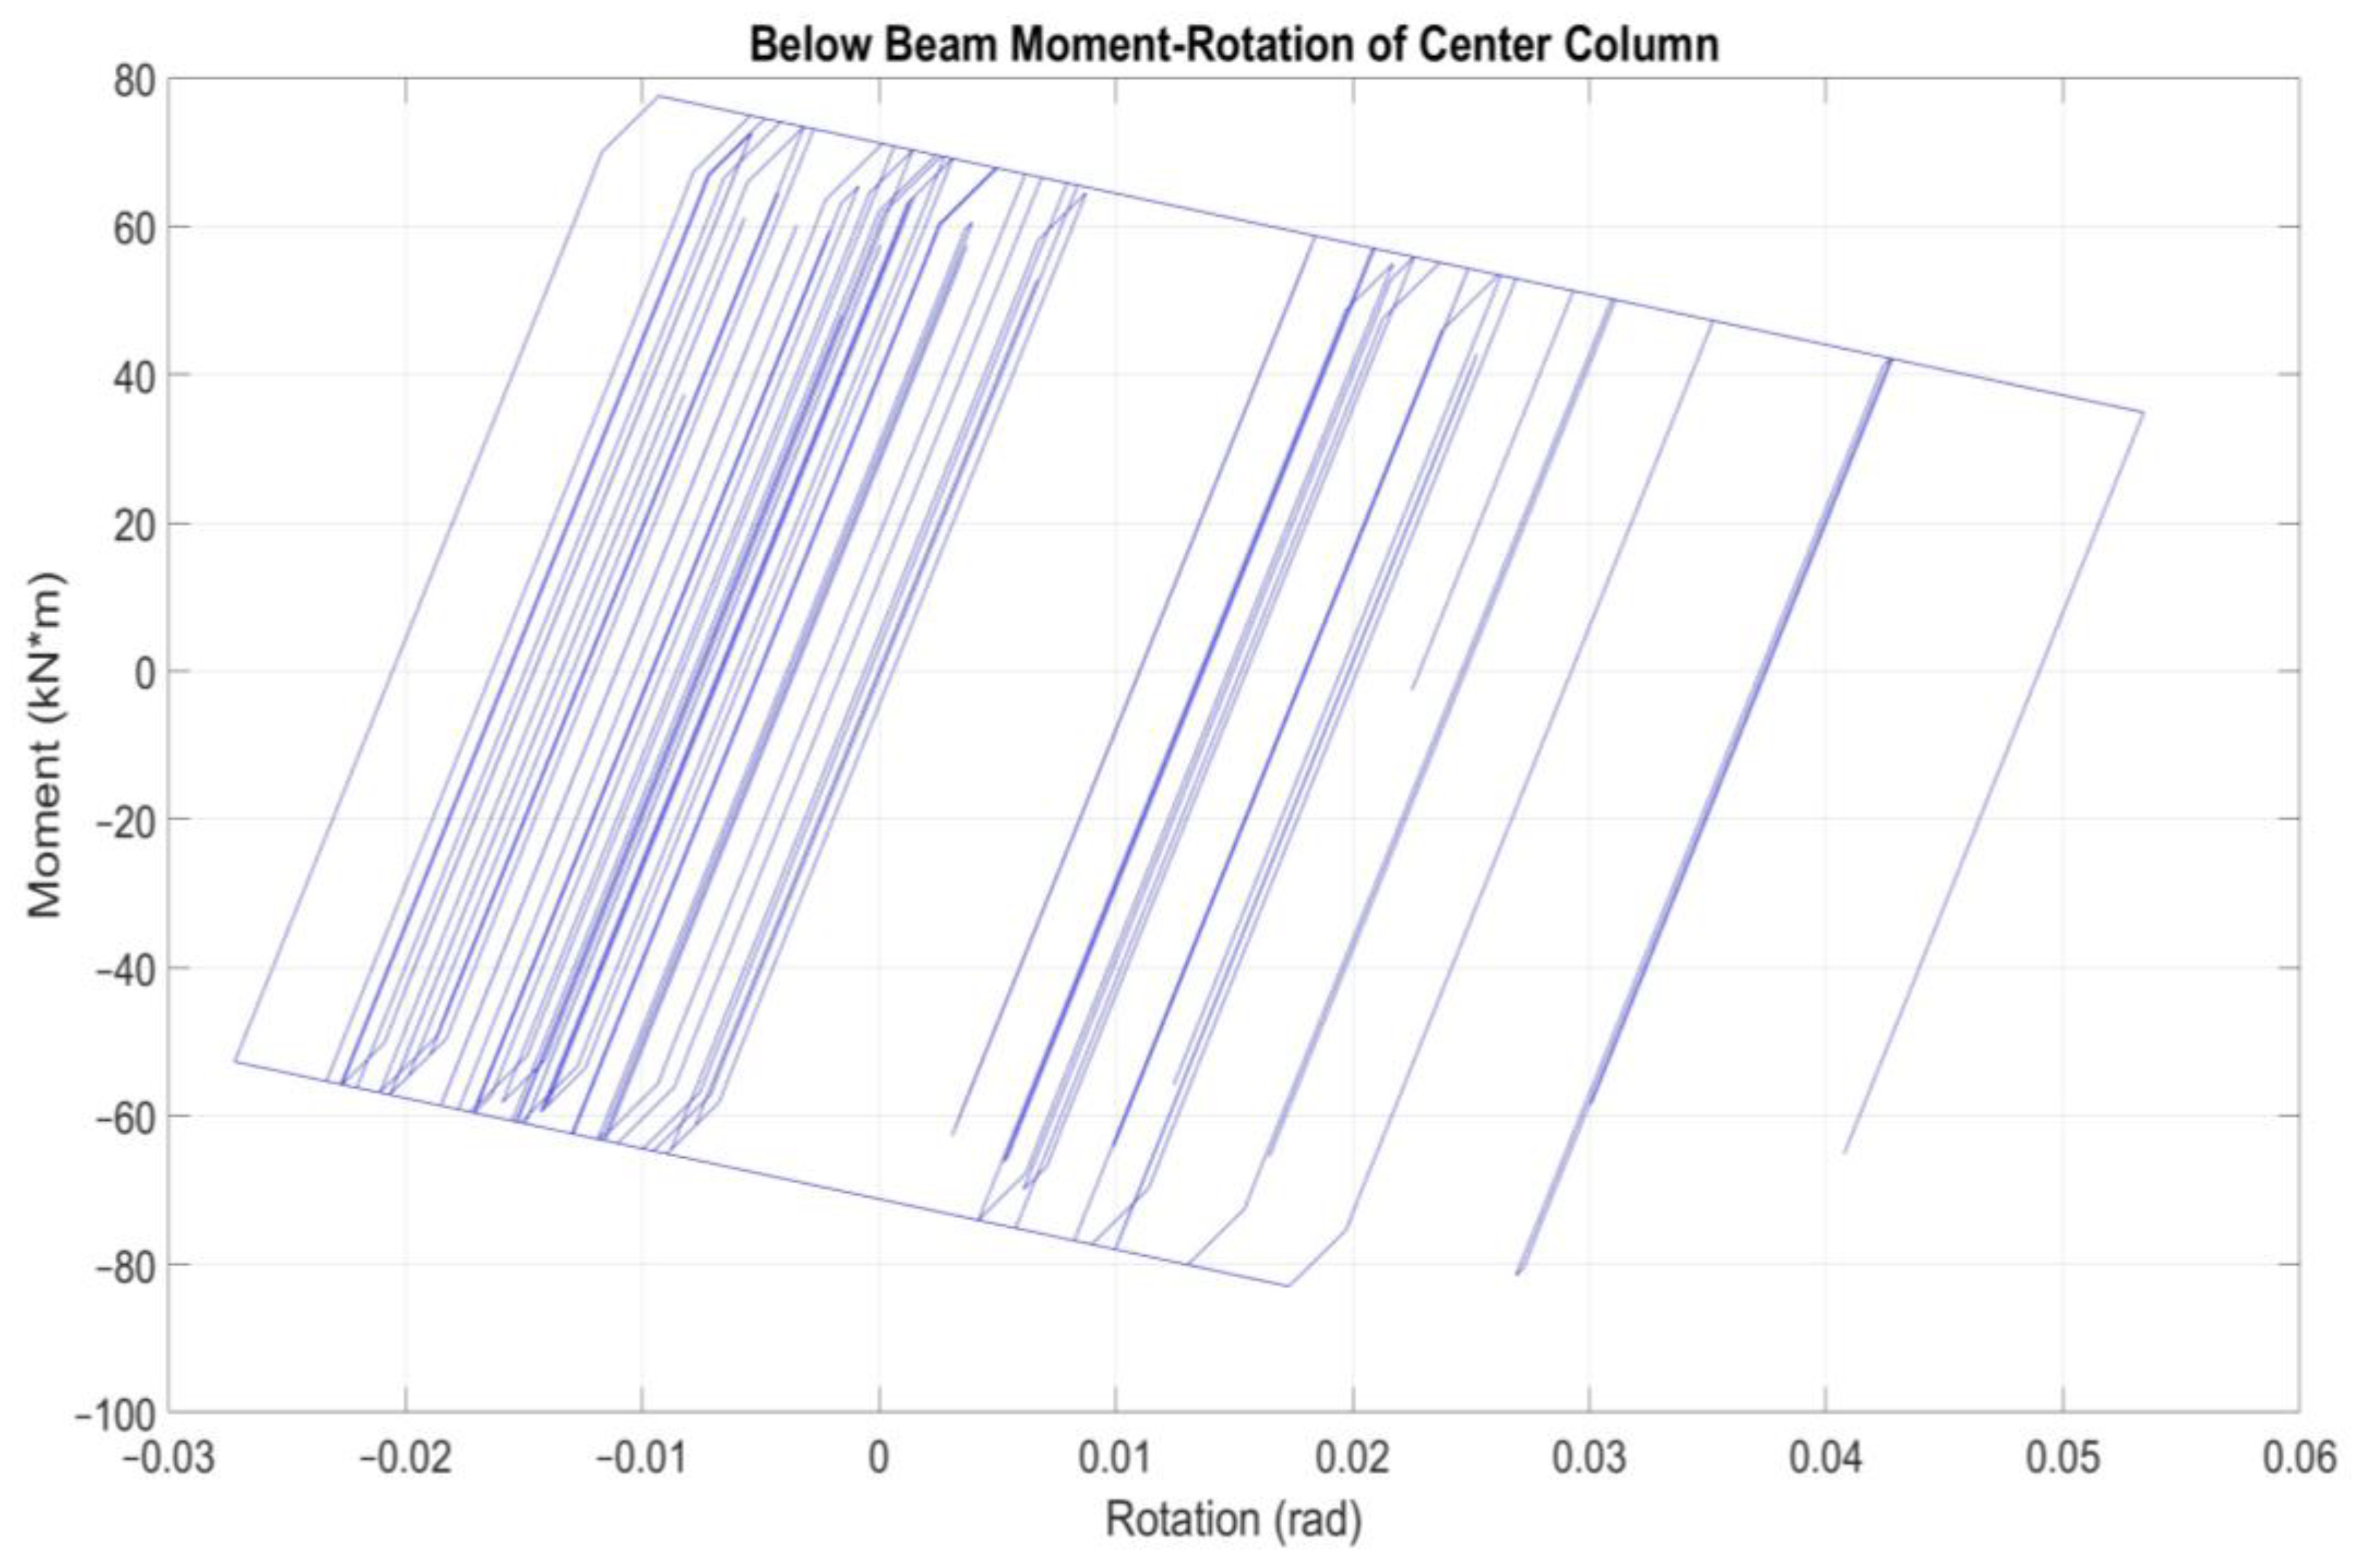
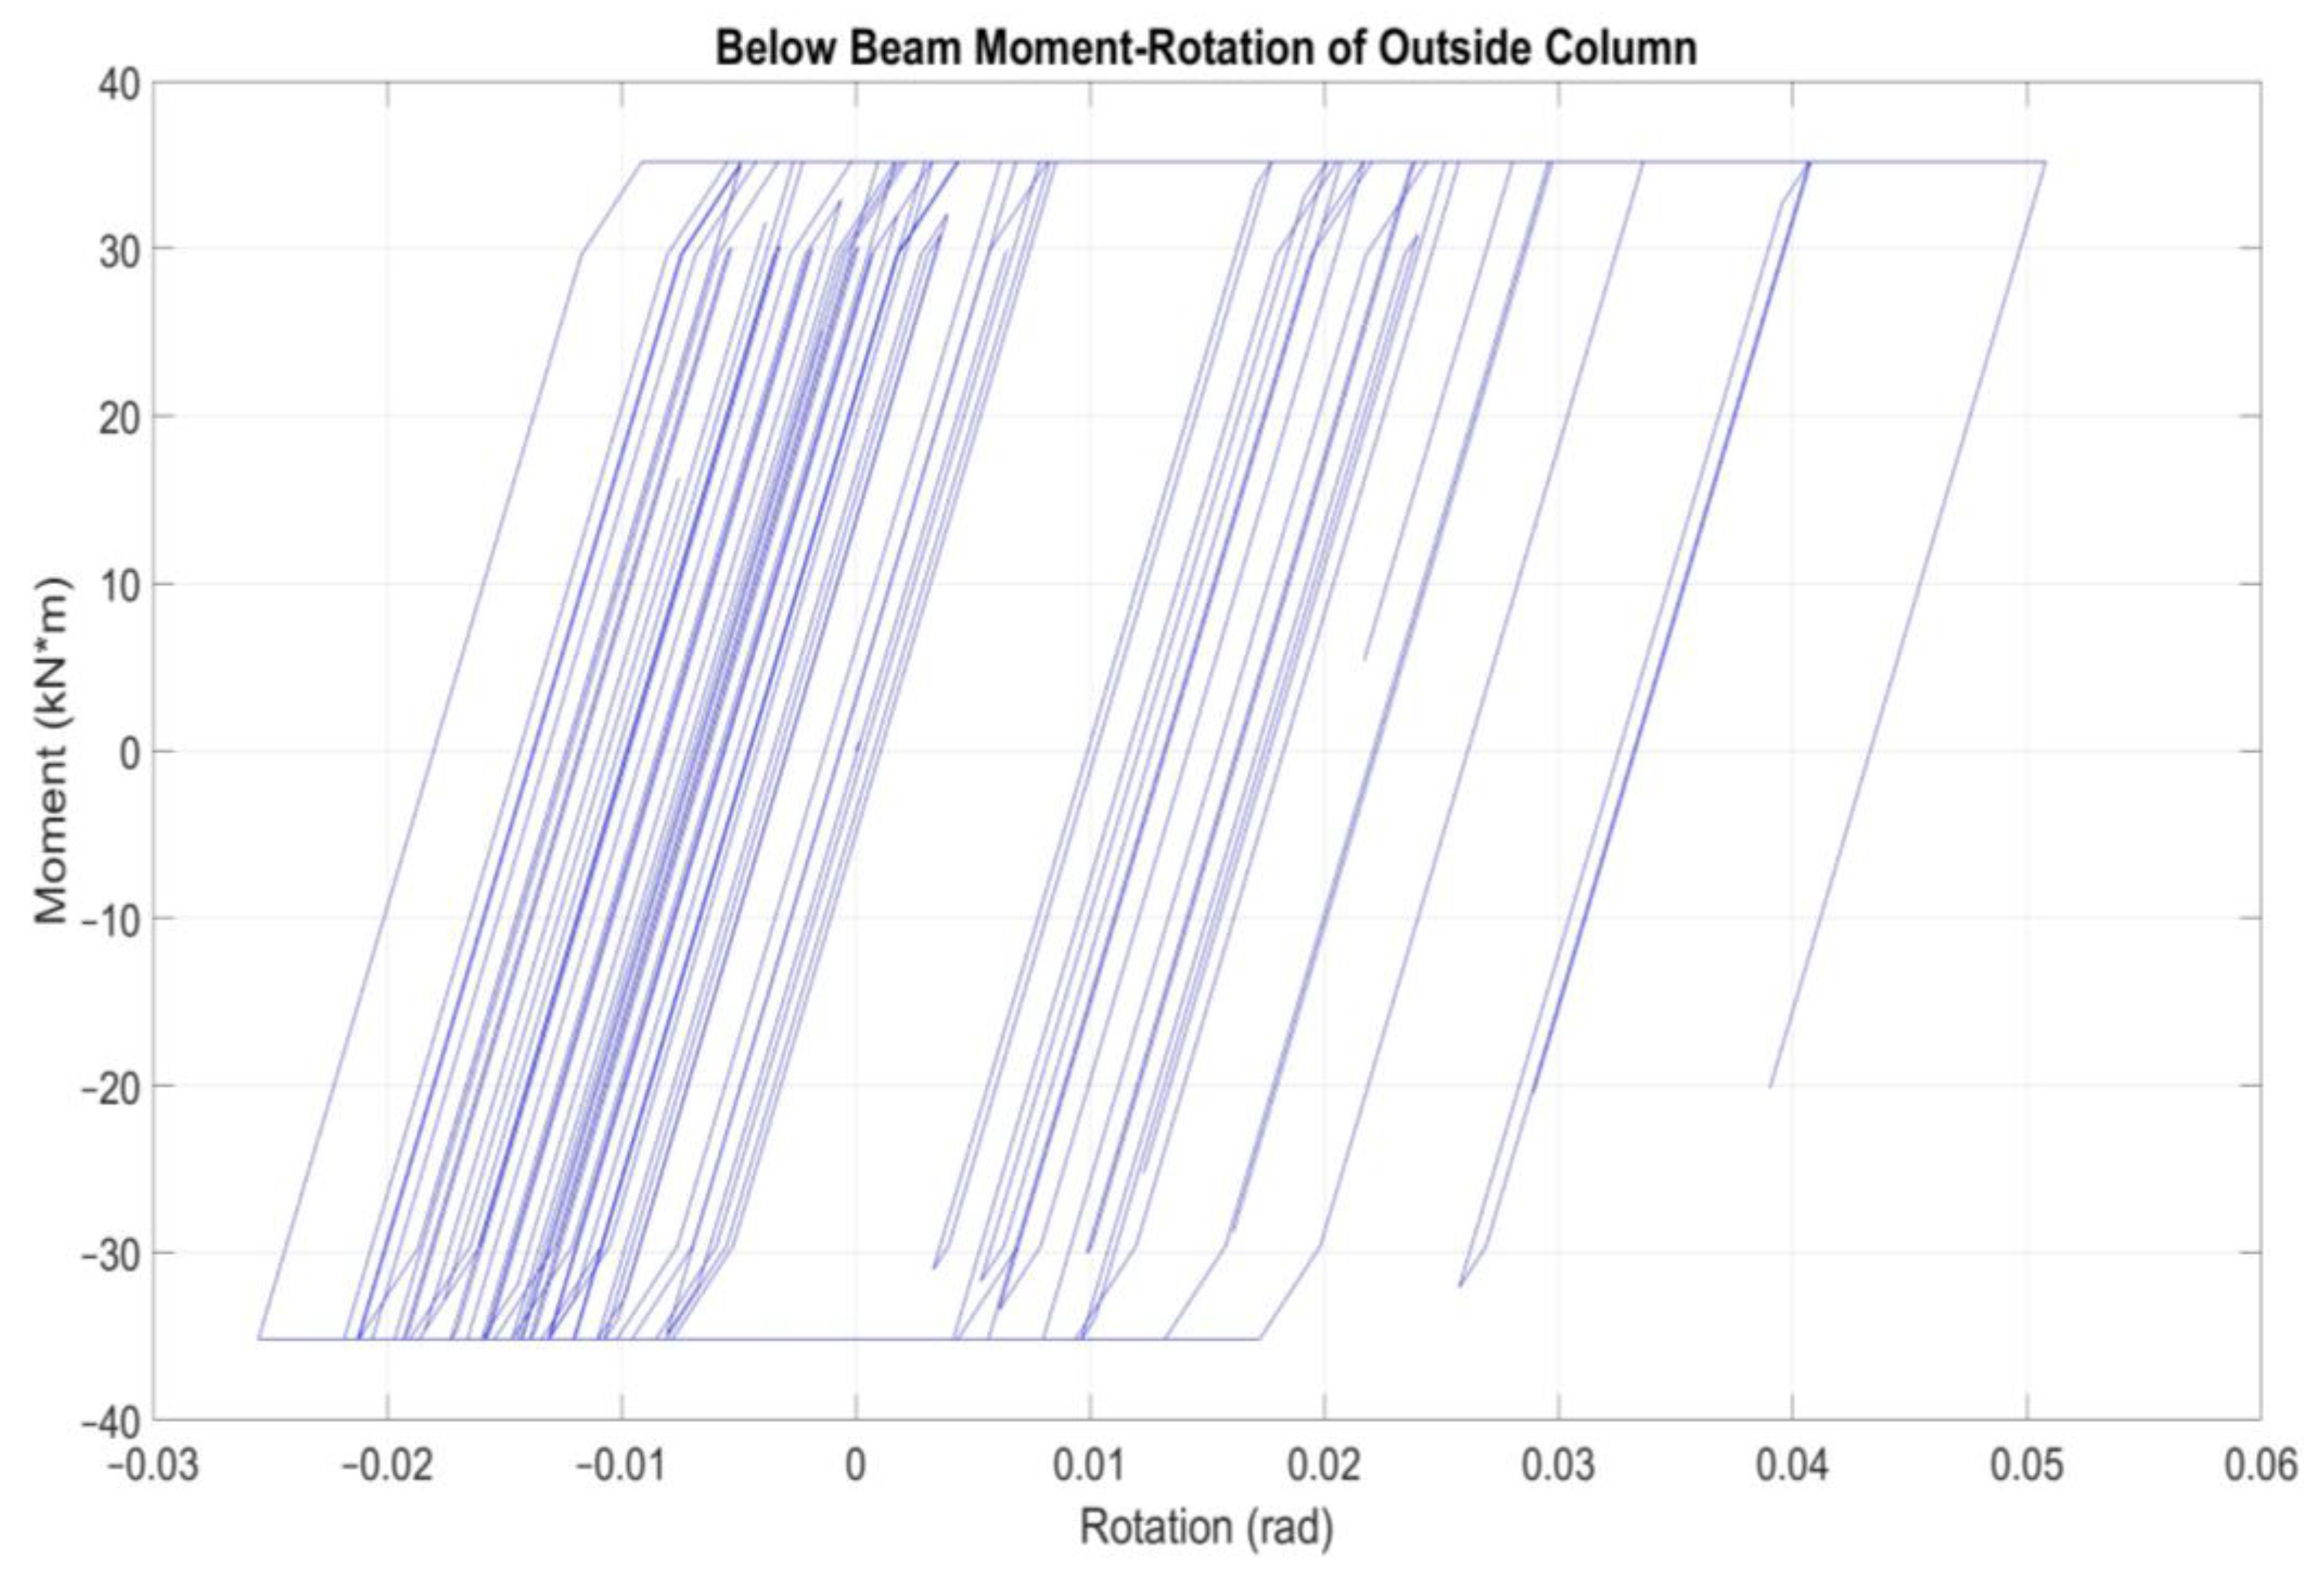
The above remarks are confirmed also by Figure 6. The corresponding time responses between numerical model and experimental test do not coincide at every time step. The effective stiffness and strength degradation in the central shear-critical column is well captured. The employed moment-rotation envelopes below horizontal beams of the columns of Specimen 2 both shear-critical but also flexure-dominant can be seen in Figure 7 and Figure 8. Considering the brittle specimen response and the low computational cost for this simplified model approach for collapse modeling, the results are acceptable.

4. Discussion

During an earthquake, columns can experience a wide range of loading histories, which may include a single large pulse or several smaller-amplitude cycles. These cycles can sometimes result in shear failure or even collapse, where the column loses its ability to support gravity loads. Previous research [1,2] has shown that such collapse cannot be explained by a simple combination of shear force and axial load. Instead, it is governed by an interaction envelope that depends on both the loading history and the peak deformation exerted on the column (maximum drift demand).
To understand how the loading history affects a column's response, it is important to note that structural members undergoing lateral displacement reversals tend to lengthen due to the accumulation of permanent tensile strains in the longitudinal reinforcement crossing diagonal shear cracks. As displacement cycles increase in amplitude, the cracks widen. This is depicted in the axial stress-strain diagram of the reinforcement after yielding, where permanent strains are biased in tension due to the neutral axis shifting towards the compression side of the member's cross-section after cracking. Axial load plays a key role in this process, as it helps keep the cracks partially closed, thereby delaying the elongation and ratcheting of the column.
Additionally, research [1,2] shows that increasing the number of cycles beyond the yield displacement can reduce a column’s drift capacity at shear failure. One of the goals of this research is to better understand these effects and develop simplified tools to identify the failure characteristics at the loss of axial load-bearing capacity, as well as the impact of drift demand on the column’s deformation capacity.
As already mentioned, collapse should be quantified as accurately as possible through nonlinear dynamic analysis. A comprehensive set of guidelines will serve as a foundation for addressing the complexities of nonlinear softening responses under large displacements and deformations, helping to promote the acceptance of nonlinear response analyses in professional practice. The introduction of simple but effective column models, like those presented in this study, which account for localized effects such as shear and anchorage or lap splice slip within a consistent element formulation, will reduce non-convergence issues and computational time. The correlation of the proposed model with the experimental results produces acceptable results and the model succeeds in reducing the computational effort.

5. Conclusions

One-component beam model formulation exemplifies a category of elements that rely on assumptions about internal force distribution. These elements are crucial in contemporary earthquake engineering analysis, as they accurately represent the force distribution within a member and lead to a reliable numerical implementation. Using the moment-rotation envelope results from cantilever shear-critical columns analyzed by Phaethon software, an inelastic frame structure experiencing shear, axial or pull-out failures can be modeled by placing a rigid plastic spring at the location where shear failure is anticipated considering also the contribution of anchorage or lap-splice pullout slip in the total drift and applying a negative kinematic hardening. The slope of the kinematic hardening connects the point on the moment-rotation envelope where shear failure occurs to the point of axial failure, beyond which the column can no longer support its gravity loads. The part of the member between the two rigid plastic springs remains perfectly elastic. A key advantage of this approach is that inelastic deformation at the member ends depends solely on the moment applied at the end, allowing any moment-rotation hysteretic model to be assigned to the spring. The results of shaking table tests on a one-story, two-bay reinforced concrete frame experiencing both shear and axial failures were compared after developing a MATLAB code [22] with nonlinear dynamic analyses implementing this one-component beam model for columns prone to shear failure but also including those with more flexure-dominant behavior under cyclic reversals. While the simplified model yielded reasonable predictions of the overall frame response and lateral strength degradation, the reduced computational cost of the modeling approach led to some deviations between the calculated and measured shear forces and drifts during portions of the time-history response. Based on the research included in this paper, a future goal is to implement the proposed element into a commercial software for larger scale nonlinear dynamic analyses of real RC structures.

Data Availability Statement

All included data in this study is available upon request from the corresponding author.

Conflicts of Interest

The author declares no conflict of interest.

References

  1. Megalooikonomou K.G., Modeling the behavior of shear-critical reinforced concrete columns under lateral loads, Ph.D. Thesis, Department of Civil and Environmental Engineering, Faculty of Engineering, University of Cyprus, Nicosia, Cyprus, December 2019. [CrossRef]
  2. Megalooikonomou K.G., Seismic Assessment and Retrofit of Reinforced Concrete Columns, 1st ed.; Cambridge Scholars Publishing, Newcastle upon Tyne, UK, ISBN (10): 1-5275-2785-9, ISBN (13): 978-1-5275-2785-0, 2019, 387.
  3. ACI Committee 318 Building Code Requirements for Structural Concrete (ACI 318-14) and Commentary, American Concrete Institute, Farmington Hills, MI. USA, 2014.
  4. Fib Model Code Chapter 6: Interface Characteristics, Ernst & Sohn Publications, Berlin, Germany, 2010.434.
  5. AASHTO LRFD Bridge Design Specifications and Commentary, 3rd Edition, American Association of State Highway Transportation Officials, Washington, D.C, 2013 1264.
  6. Morsch, E. Der Eisenbetonbau-Seine Theorie und Anwendung, 5th Edition, Vol. 1, Part 1, 1922, Wittwer, Stuttgart, Germany.
  7. Ritter, W. Die Bauweise Hennebique. Schweizerische Bauzeitung 1899, 33, 59–61. [Google Scholar]
  8. EN 1992-1-1: Eurocode 2: Design of concrete structures – Part 1-1: General rules and rules for buildings, European Committee for Standardization (CEN), Brussels, 2004.
  9. Vecchio, F. J. , and Collins, M. P. The modified compression field theory for reinforced concrete elements subjected to shear. ACI Journal Proceedings, 1986, 83(2), 219-231.
  10. Filippou, F. C. , and Fenves, G. L. Methods of analysis for earthquake-resistant structures. In: Bozorgnia Y, Bertero VV (eds) Earthquake engineering: From engineering seismology to performance-based engineering. CRC Press, Boca Raton, 2004.
  11. Mergos, P. E. and Kappos, A. J. A distributed shear and flexural flexibility model with shear–flexure interaction for R/C members subjected to seismic loading. Earthquake Engng. Struct. Dyn., 2008, 37: 1349-1370.
  12. Ceresa, P., Petrini, L., and Pinho, R. Flexure-shear fiber beam-column elements for modeling frame structures under seismic loading-state of the art. Journal of Earthquake Engineering, 2007, 11, 46–88.
  13. Vecchio, F. J., and Collins, M. P. Predicting the Response of Reinforced Concrete Beams Subjected to Shear Using Modified Compression Field Theory. ACI Structural Journal 1988, 85, 258–268. [Google Scholar]
  14. Zeris, C.A. Three-Dimensional Nonlinear Response of Reinforced Concrete Buildings. Ph.D. Thesis, Department of Civil and Environmental Engineering, University of California, California, USA, 1986. [Google Scholar]
  15. Bentz, E. C. Sectional Analysis of Reinforced Concrete Members. PhD Thesis, Department of Civil Engineering, University of Toronto, Toronto, Canada, 2000. [Google Scholar]
  16. Megalooikonomou K. G. Monotonic and Cyclic Seismic Analyses of Old-Type RC Columns with Short Lap Splices. Constr. Mater. MDPI 2024, 4, 329–341. [Google Scholar]
  17. Giberson, M. F. The response of nonlinear multi-story structures subjected to earthquake excitation, Earthquake Engineering Research Laboratory, California Institute of Technology, Pasadena, CA, EERL Report, 1967.
  18. Giberson, M.F. Two Nonlinear Beams with Definition of Ductility. Journal of Structural Division, ASCE 1969, 95, 137–157. [Google Scholar] [CrossRef]
  19. Zimos DK, Mergos PE, Kappos AJ Modelling of R/C members accounting for shear failure localisation: finite element model and verification. Earthq Eng Struct Dyn, 2018, 47, 1631–1650. [CrossRef]
  20. Zou X, Gong M, Zuo Z, Liu Q, An efficient framework for structural seismic collapse capacity assessment based on an equivalent SDOF system. Eng Struct 2024, 300, 117213. [CrossRef]
  21. Zou, X. , Gong, M. & Zuo, Z. An efficient method based on shear models for structural seismic response prediction considering hysteretic characteristics. Bull Earthquake Eng, 2024.
  22. Mathworks. (2024). MATLAB: User's Guide (R2024b).
  23. Megalooikonomou KG. KADET-based One-component Beam Model for the Simulation of Cyclic Lateral esponse of URM walls, 18th World Conference on Earthquake Engineering (18WCEE), Milan, Italy, July 1-5, 2024.
  24. Simo, J.C. and Hughes, T.J.R. Computational Inelasticity. Springer-Verlag, New York,1998.
  25. Hughes, T. J. R. The Finite Element Method: Linear Static and Dynamic Finite Element Analysis, Dover Publications, 2000.
  26. Tastani, S. P., and Pantazopoulou, S. J. Reinforcement and concrete bond: State determination along the development length. Journal of Structural Engineering, ASCE 2013, 139, 1567–1581. [Google Scholar] [CrossRef]
  27. Elwood, K. J. and Moehle, J. P. Axial Capacity Model for Shear-Damaged Columns. ACI Structural Journal 2005, 102, 578–587. [Google Scholar]
  28. Elwood, K. Shake Table Tests and Analytical Studies on the Gravity Load Collapse of Reinforced Concrete Frames. PhD Thesis, University of California, Berkeley, Berkeley, USA, 2002. [Google Scholar]
  29. Elwood KJ, Moehle J. P. Dynamic collapse analysis for a reinforced concrete frame sustaining shear and axial failures. Earthq Eng Struct Dyn 2008, 37, 991–1012. [Google Scholar] [CrossRef]
  30. Chopra AK, Dynamics of structures. Pearson Education India, 2007.
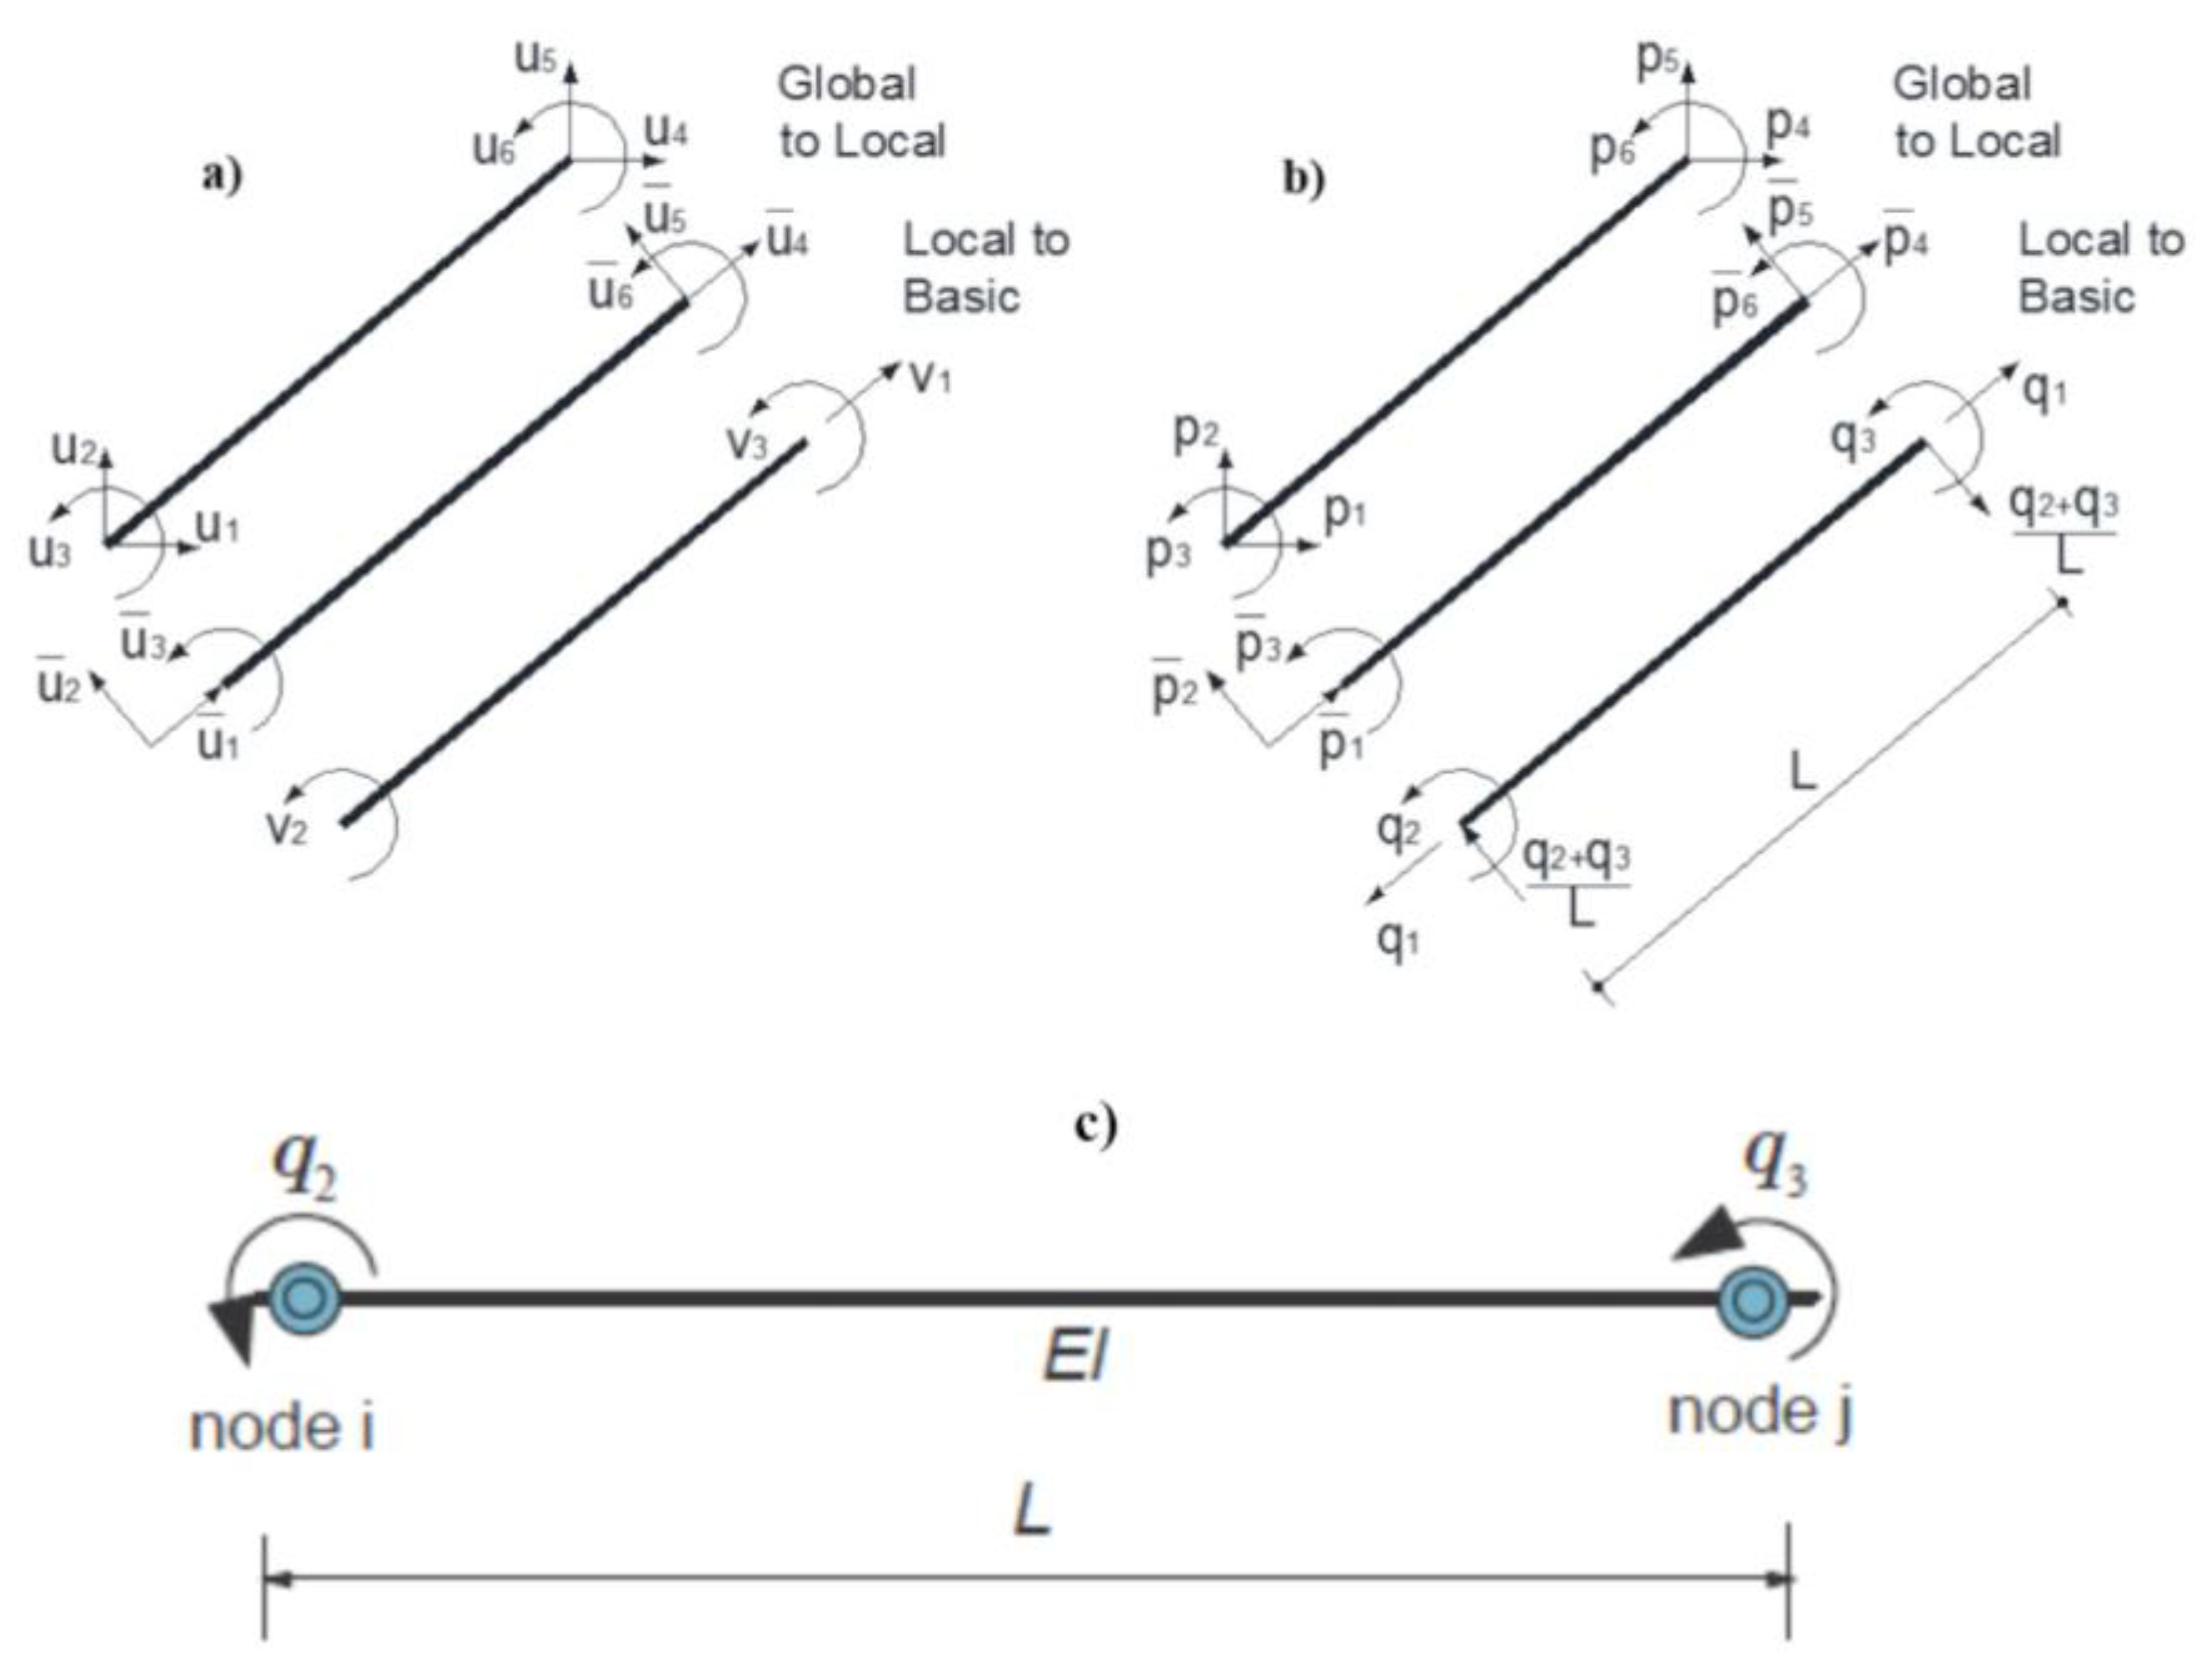
Figure 1. Beam (a) displacements and (b) forces in global, local and basic reference systems and c) one-component beam model.
Preprints 121036 g001
Figure 2. (a) Specimen 2 of shake table test [28,29] (b) Simplified numerical model implemented in MATLAB 2024b.
Preprints 121036 g002
Figure 3. Capacity curve of center shear-critical column of Specimen 2 and lateral displacement contributions for each step of the pushover analysis (16 total pushover steps of 5 kN).
Preprints 121036 g003
Figure 4. Strain, Slip and Bond distributions along the straight anchorage length of center shear-critical column of Specimen 2.
Preprints 121036 g004
Figure 5. Time-history responses in terms of drift, base shear, and center column shear of Specimen 2.
Preprints 121036 g005
Figure 6. Shear hysteretic response of Specimen 2.
Preprints 121036 g006
Figure 7. Below beam moment-rotation hysteretic response of center column of Specimen 2.
Preprints 121036 g007
Figure 8. Below beam moment-rotation hysteretic response of outside column of Specimen 2.
Preprints 121036 g008
Table 1. Details of central shear-critical RC columns of Specimen 2 (units: mm, MPa, kN).
Case Axial Load (kN)
Width (mm) – Depth (mm) Shear Span (mm) –
StraightAnchorage Length (mm)
Clear Cover (mm) Concrete Strength (MPa) Number - Diameter (mm) – Reinforcing ratio of Longitudinal Bars Yielding Strength of Long. Bars (MPa) Ultimate Strength (MPa) – Spacing (mm) – Diameter (mm) –Ratio of Transv. Reinf.
Elwood and Moehle [28,29] – (Spec. 2 – Center Column) 308.132 230
230
814
298
25.4 24.27 4 and 4
12.7 and 15.875
0.0245
479.18
717
152
4.9
0.00236
Disclaimer/Publisher’s Note: The statements, opinions and data contained in all publications are solely those of the individual author(s) and contributor(s) and not of MDPI and/or the editor(s). MDPI and/or the editor(s) disclaim responsibility for any injury to people or property resulting from any ideas, methods, instructions or products referred to in the content.
Copyright: This open access article is published under a Creative Commons CC BY 4.0 license, which permit the free download, distribution, and reuse, provided that the author and preprint are cited in any reuse.
Prerpints.org logo

Preprints.org is a free preprint server supported by MDPI in Basel, Switzerland.

Subscribe

© 2024 MDPI (Basel, Switzerland) unless otherwise stated