Submitted:
11 October 2024
Posted:
14 October 2024
You are already at the latest version
Abstract
Keywords:
1. Introduction
2. Research questions
- (1)
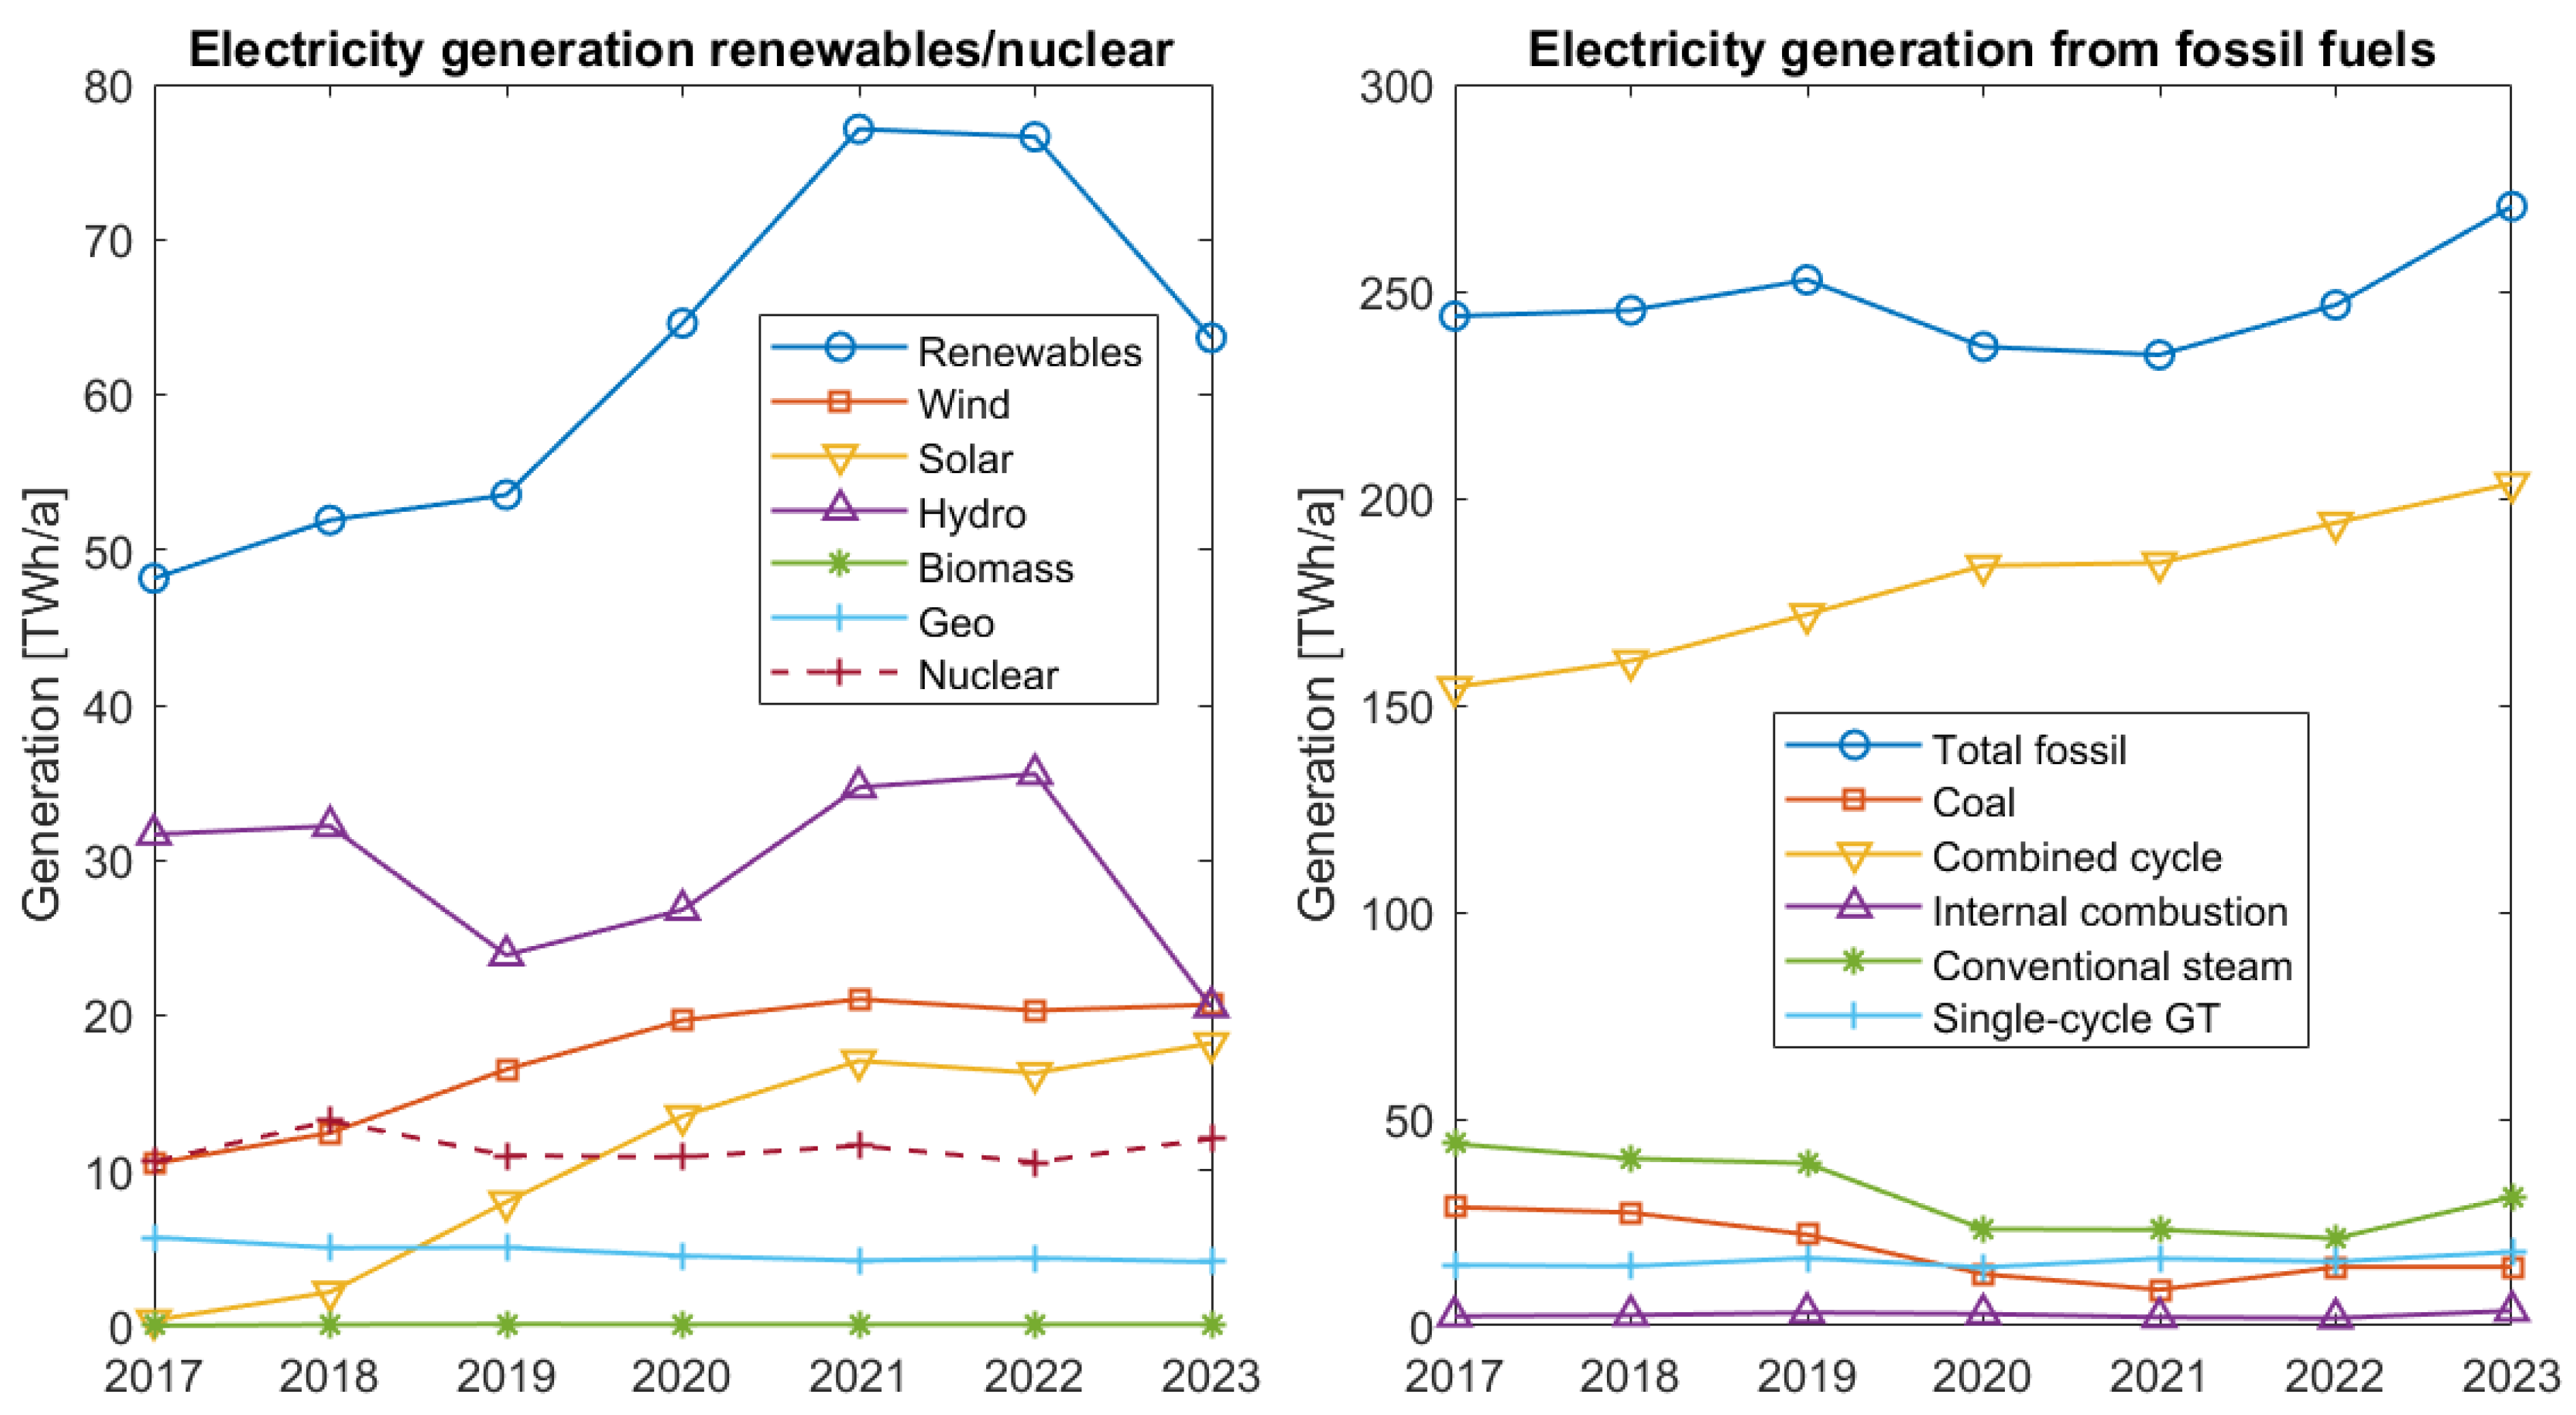
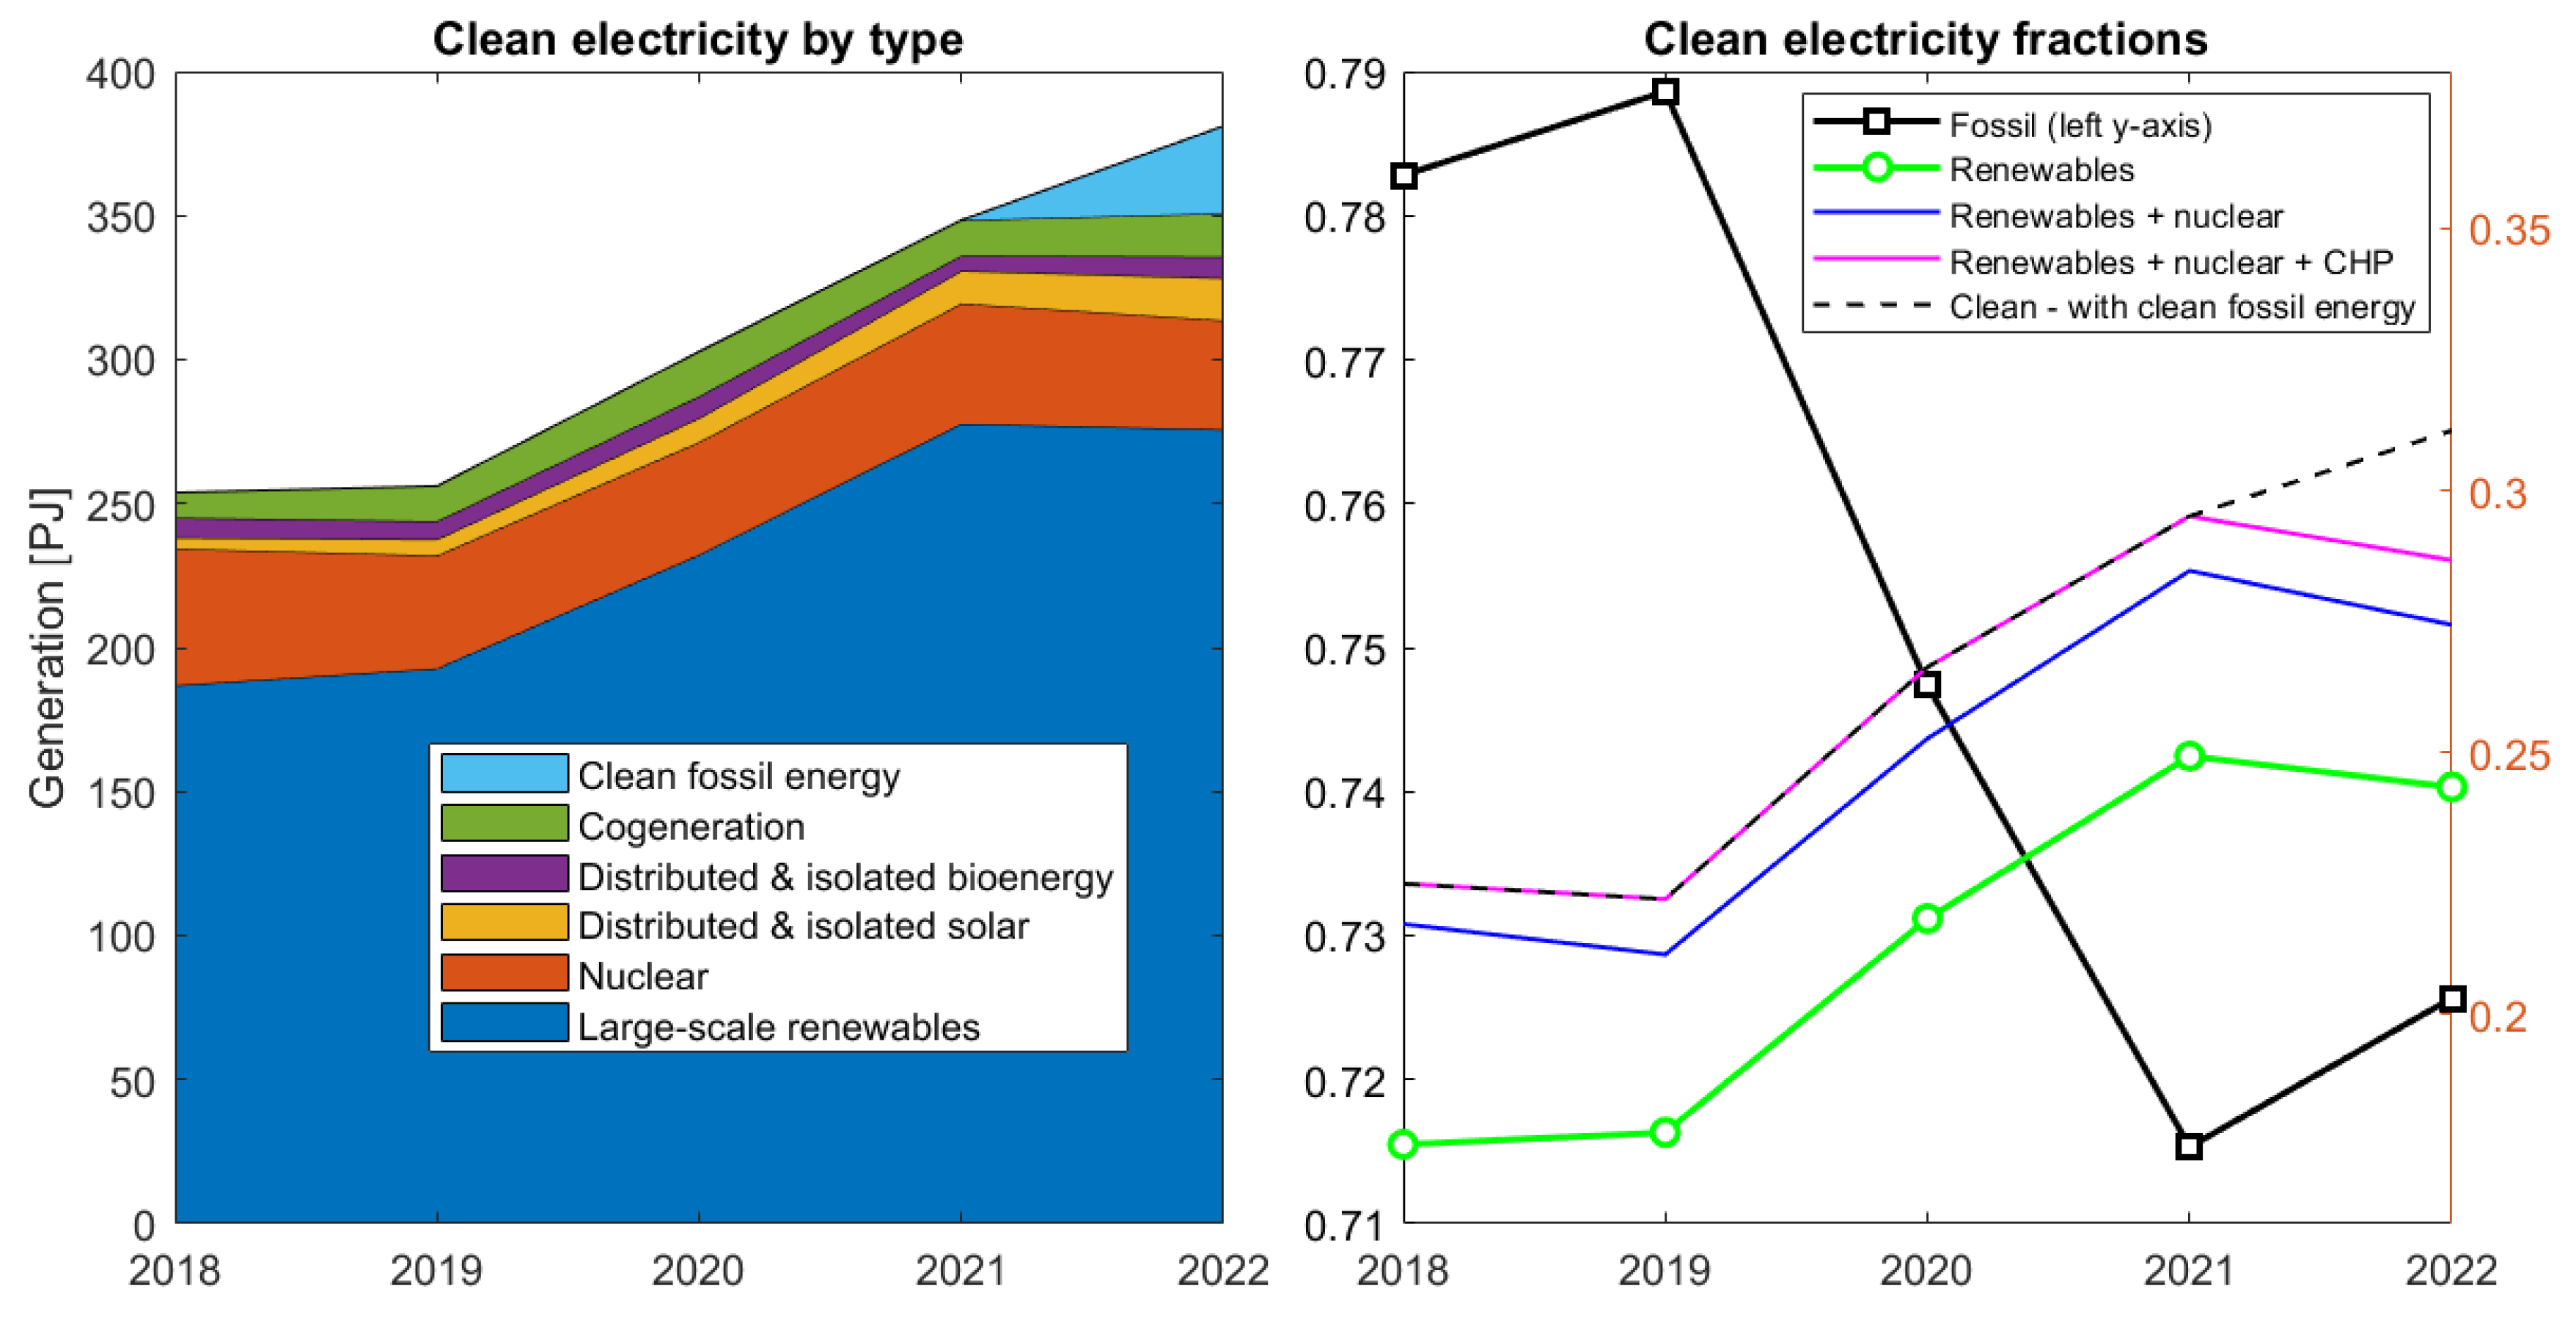
- How have Mexico’s electricity generation mix and the share of “clean” energy evolved? How consistent has the methodology for determining clean energy been over the years?
- (2)
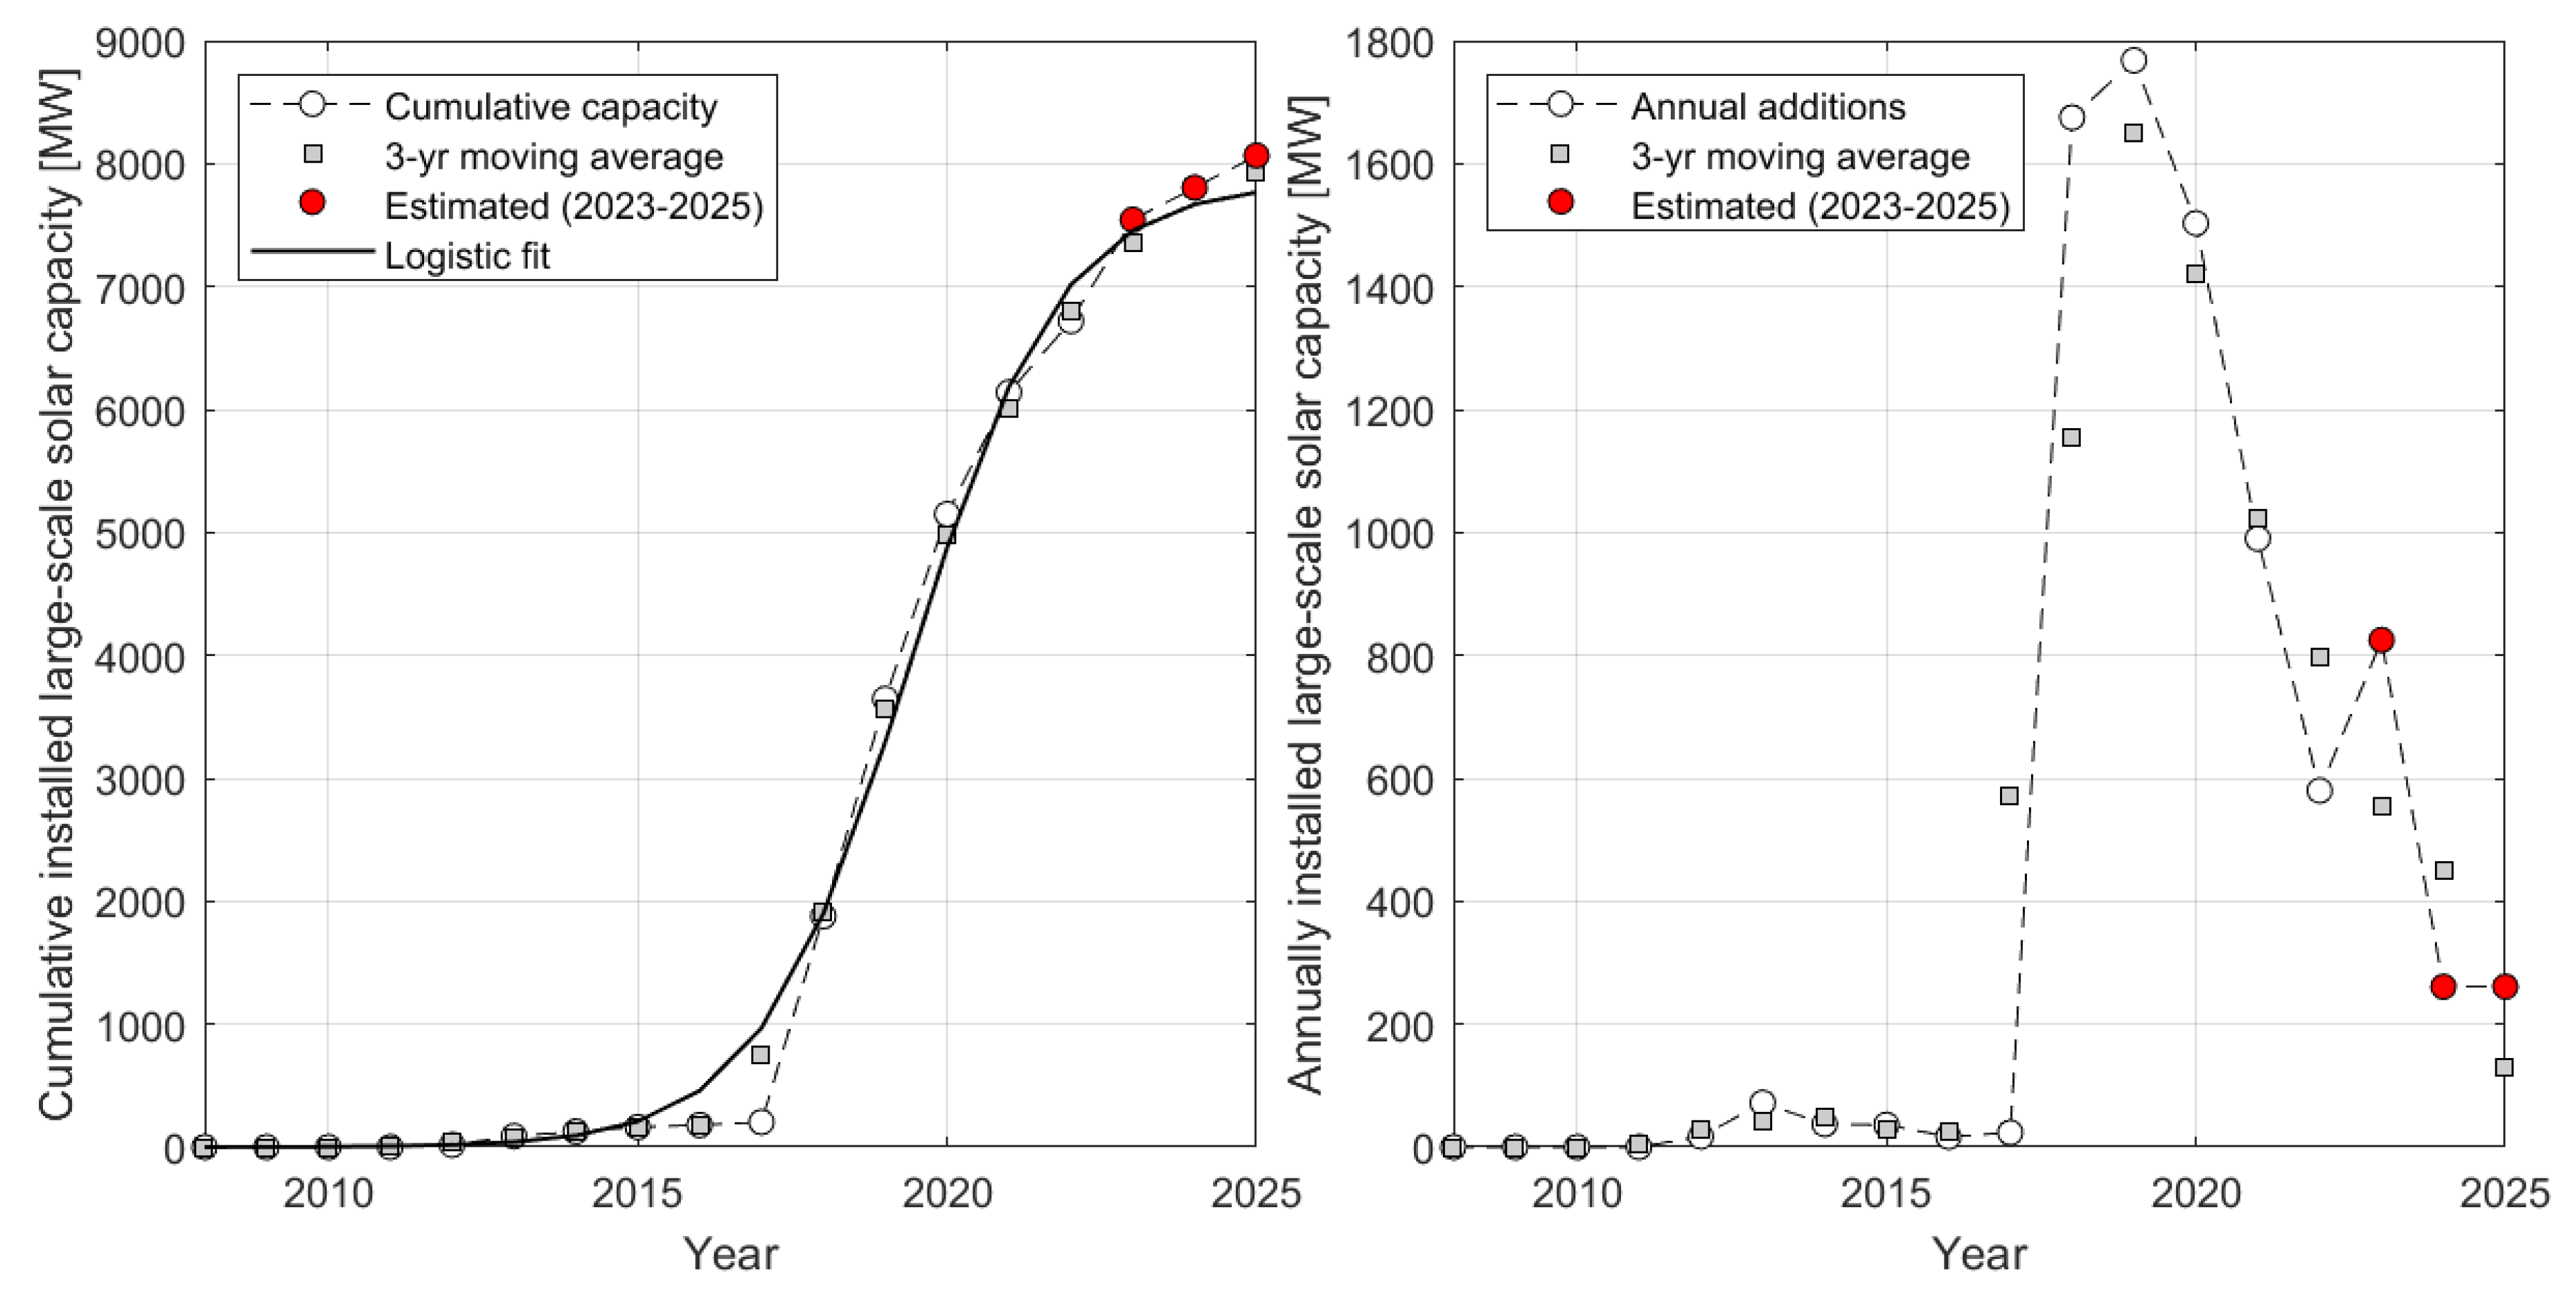
- What has been the progress on the installed capacity of large-scale wind and solar power plants, as well as distributed solar?
- (3)
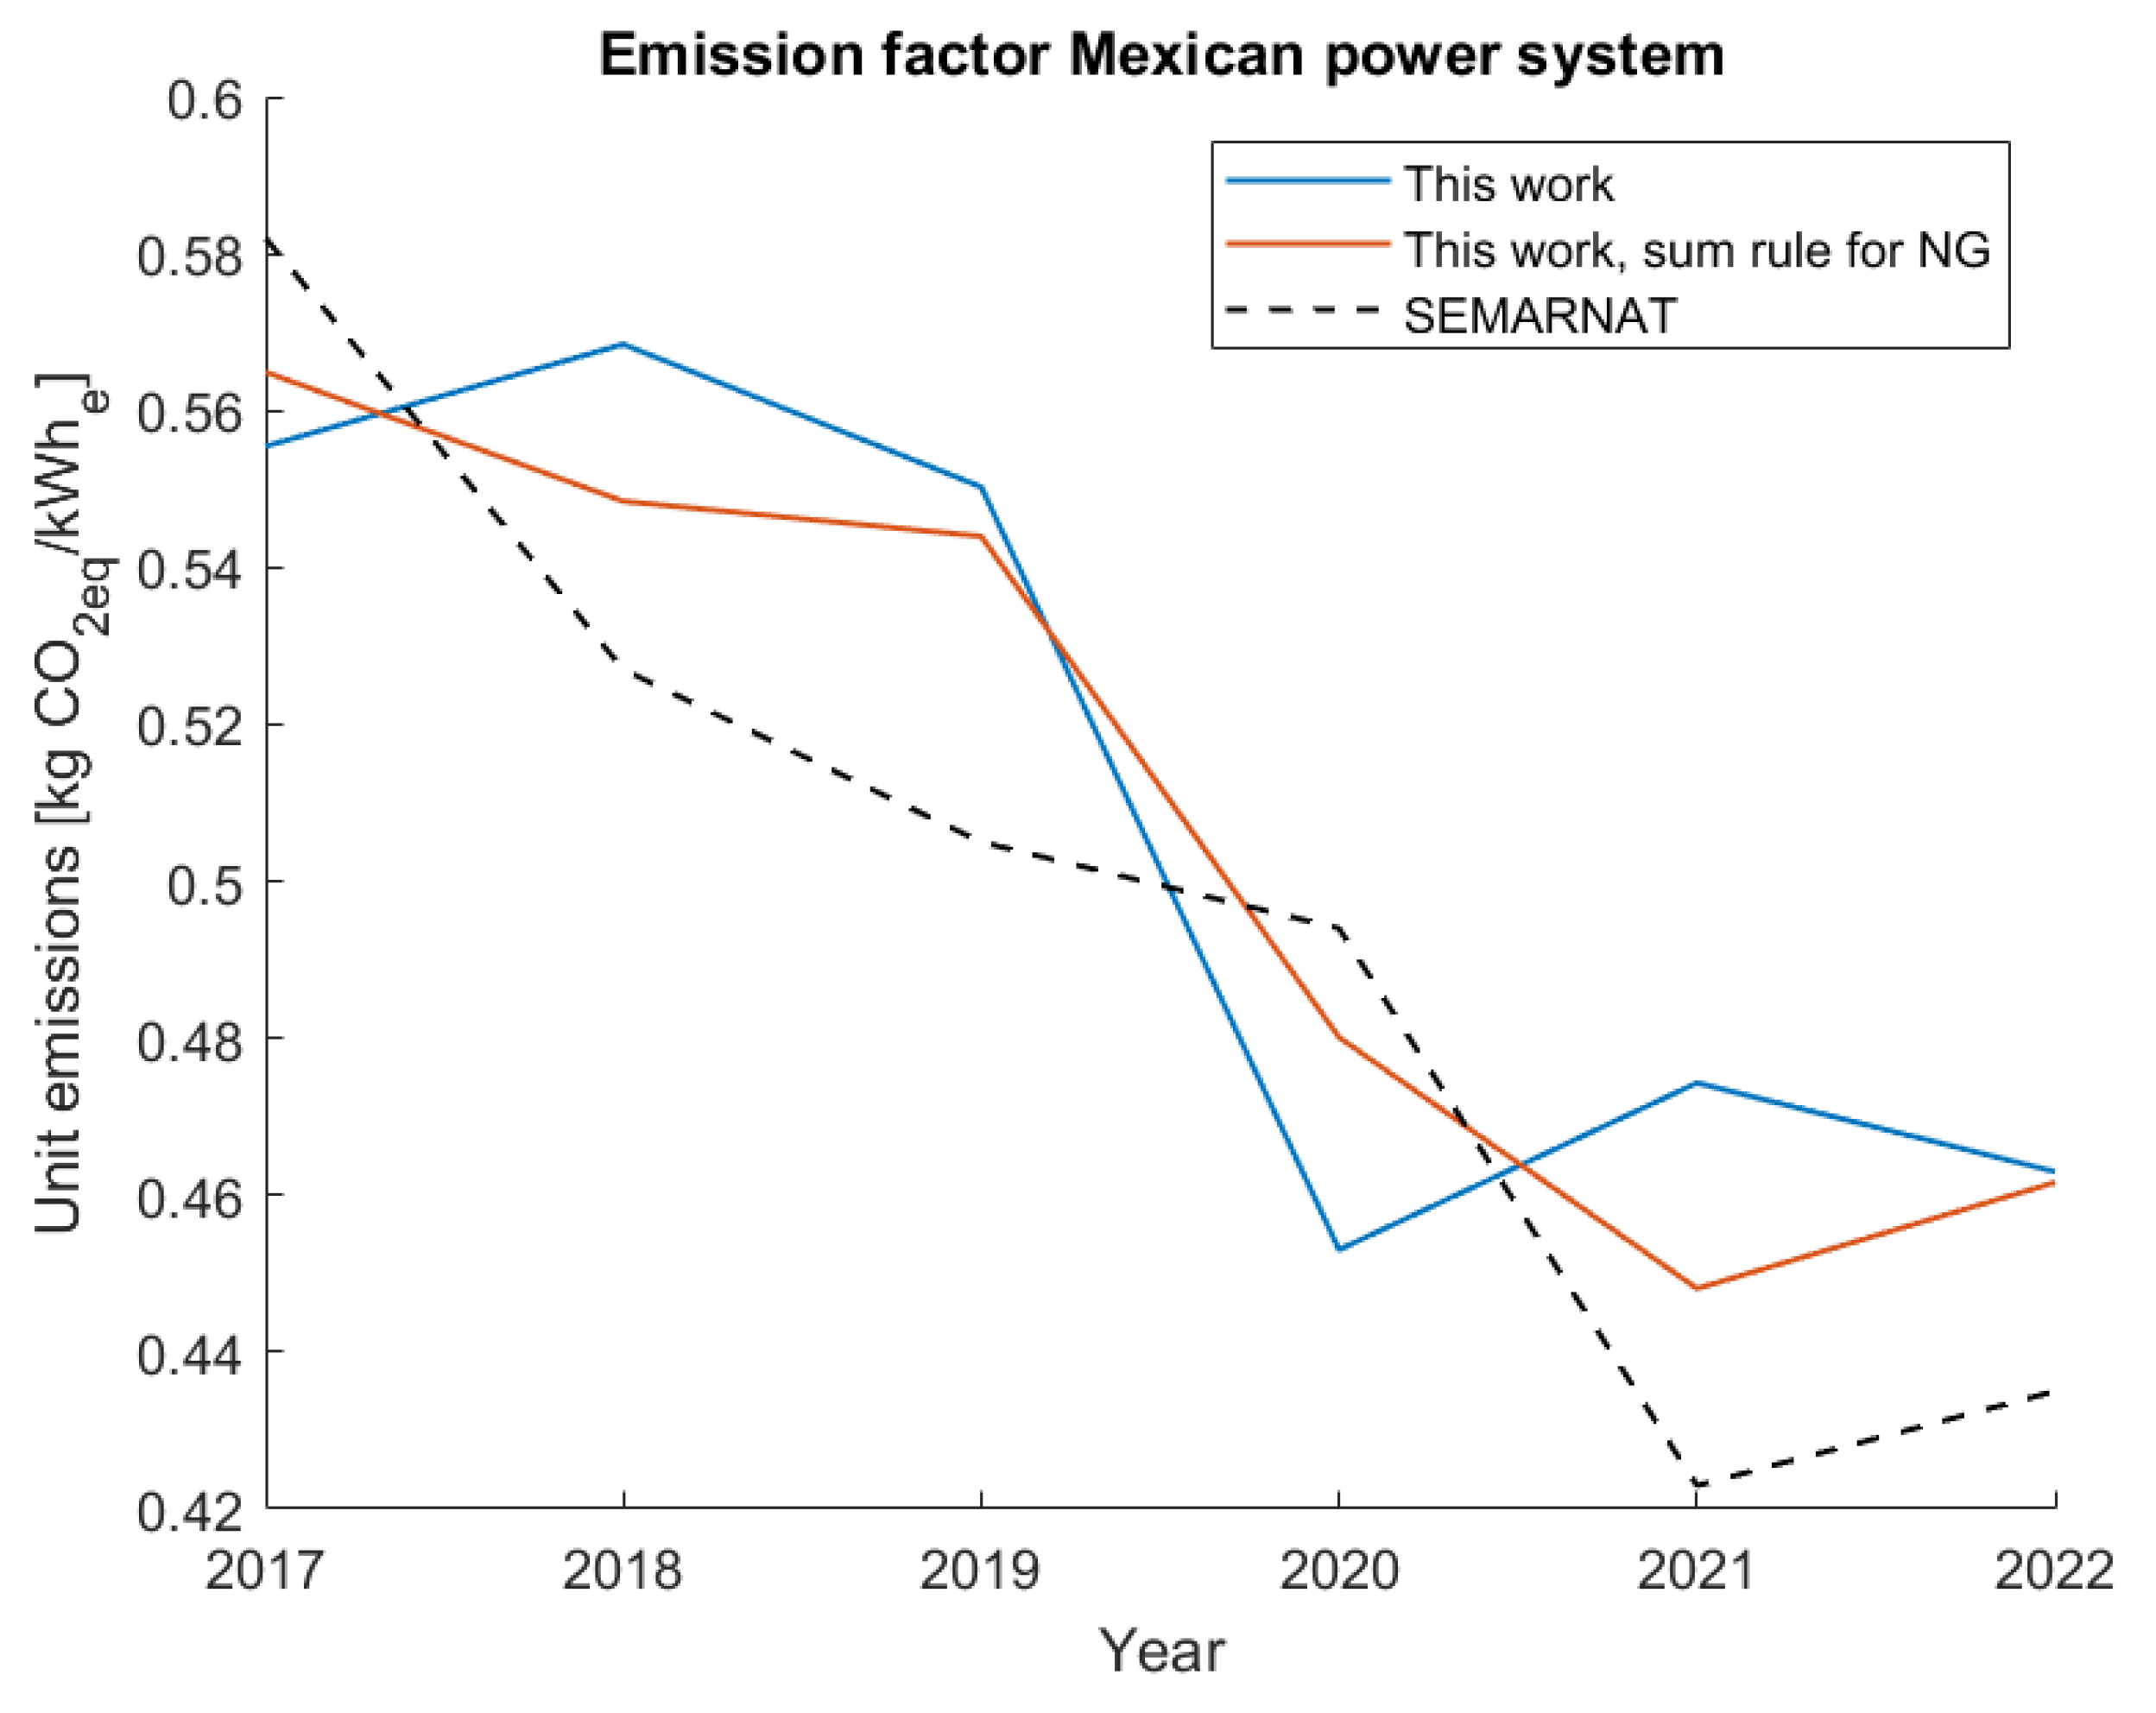
- Based on reported fuel consumption data available for the 2017-2022 period, how have the emissions of electricity-related greenhouse gases (GHG) changed over time?
- (4)
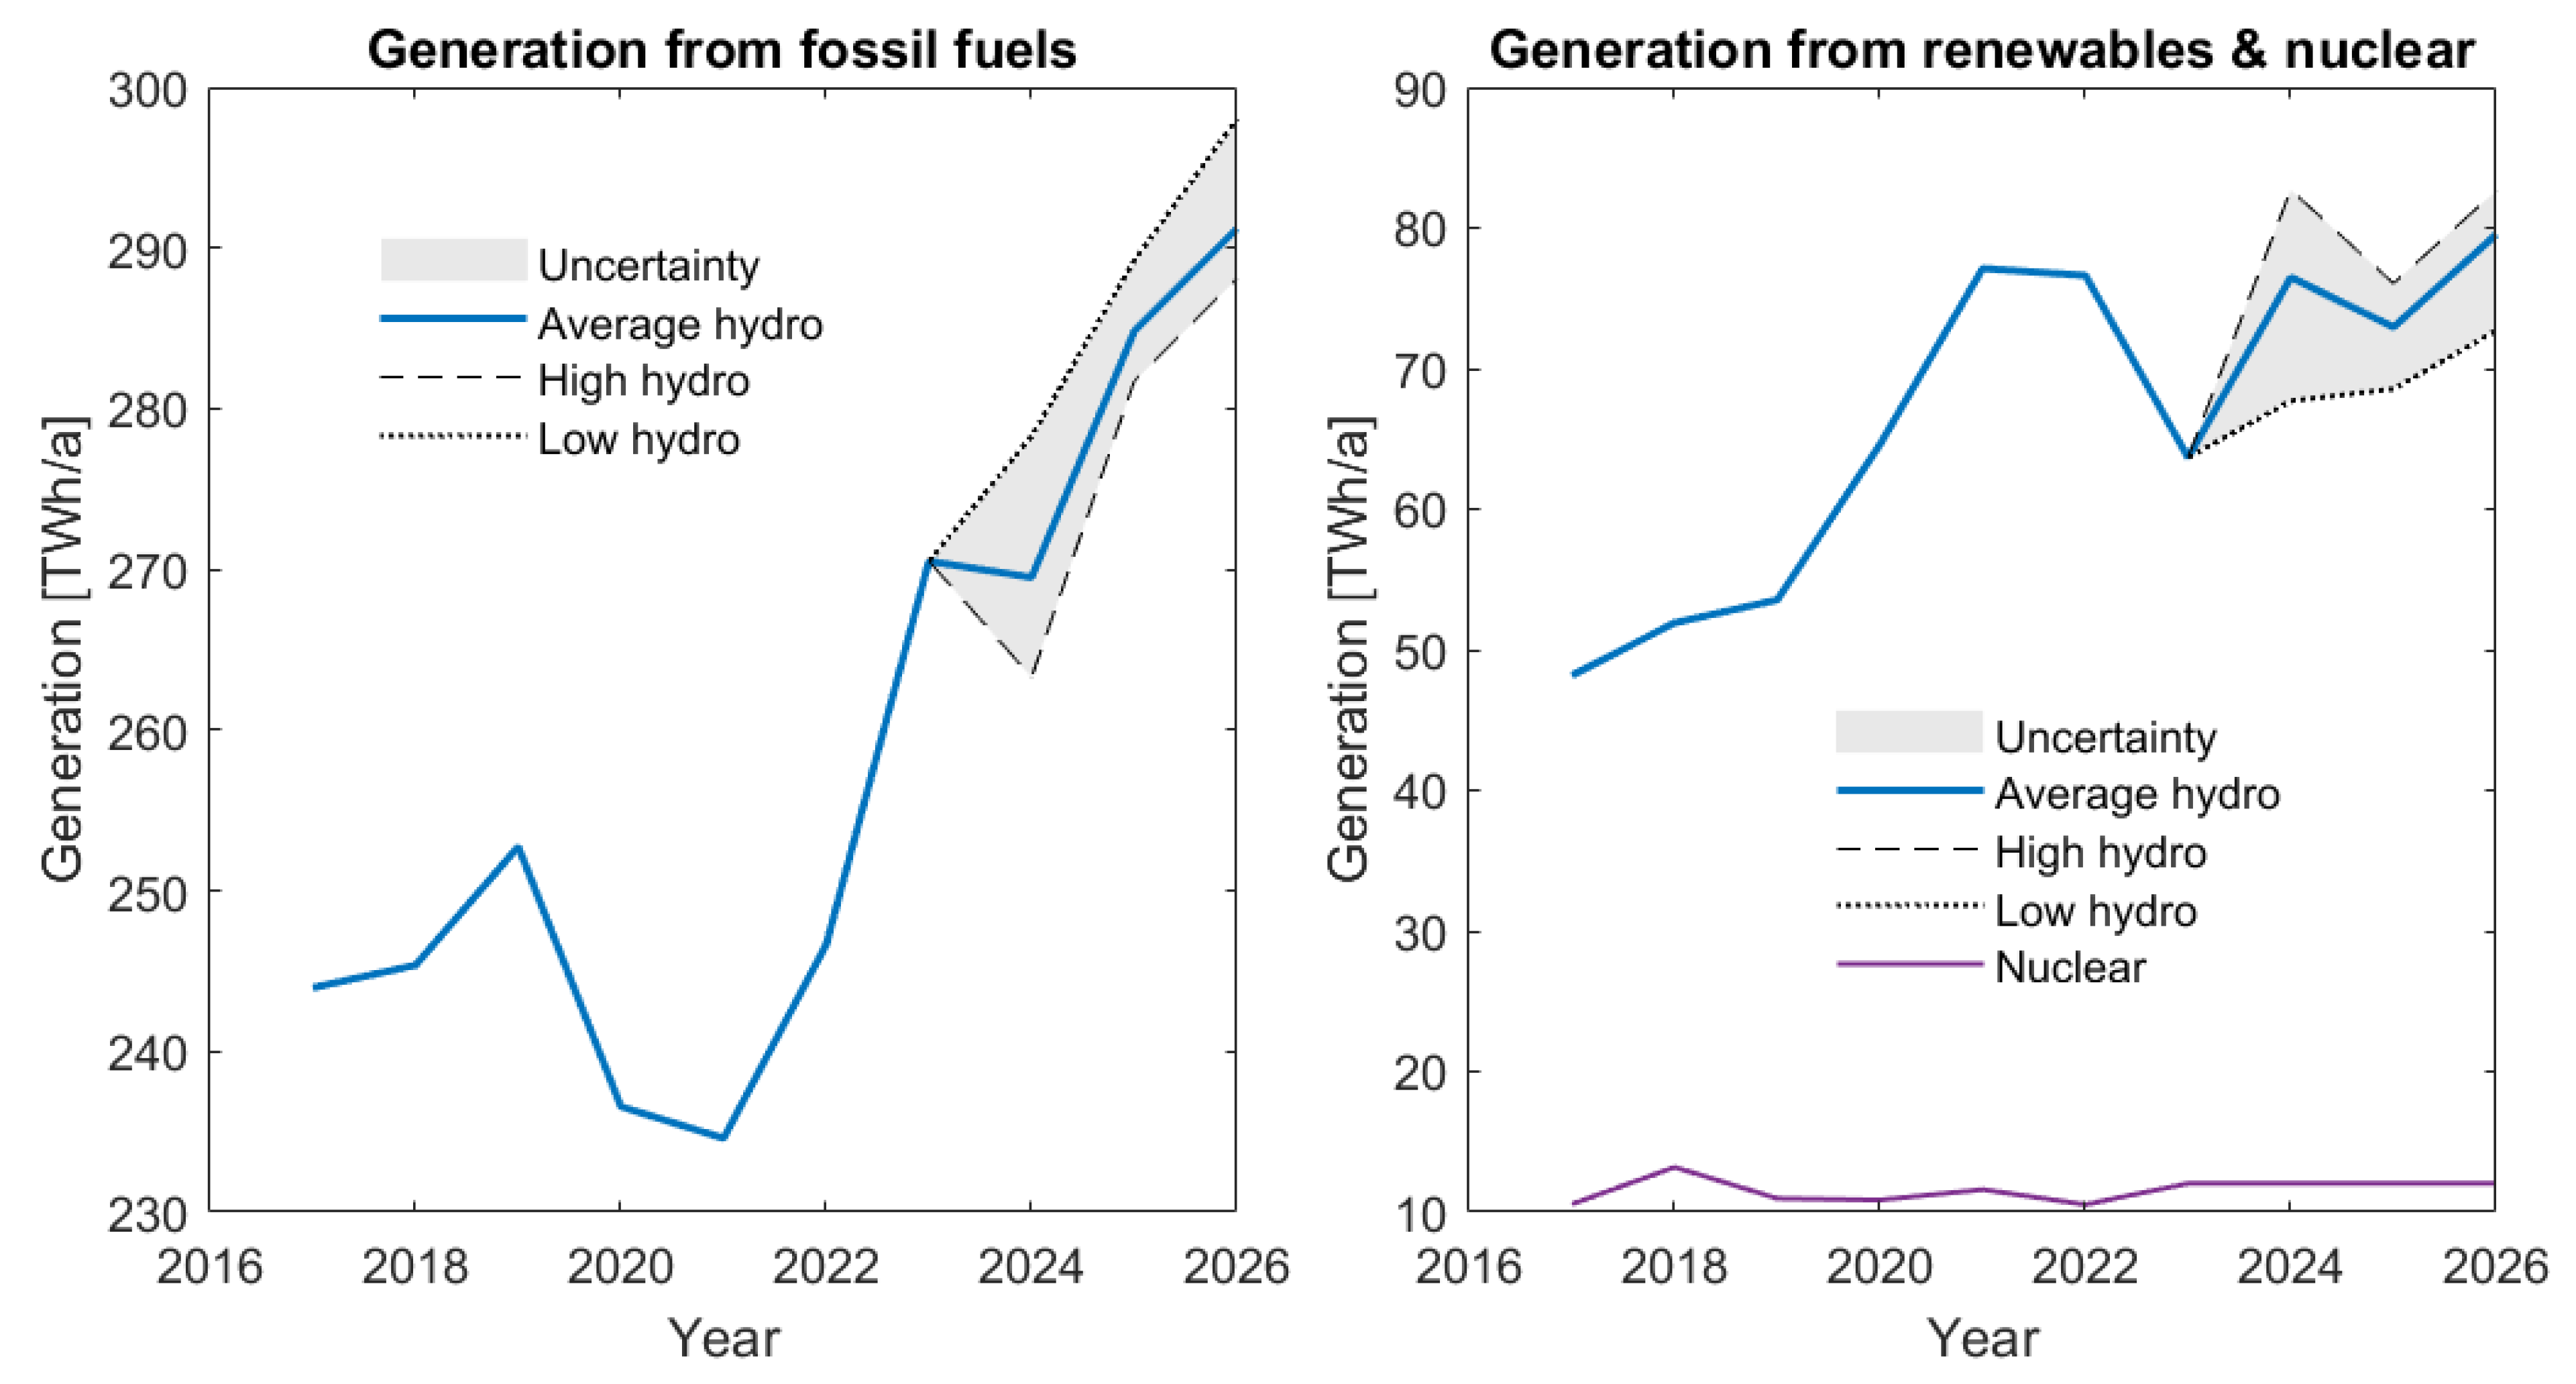
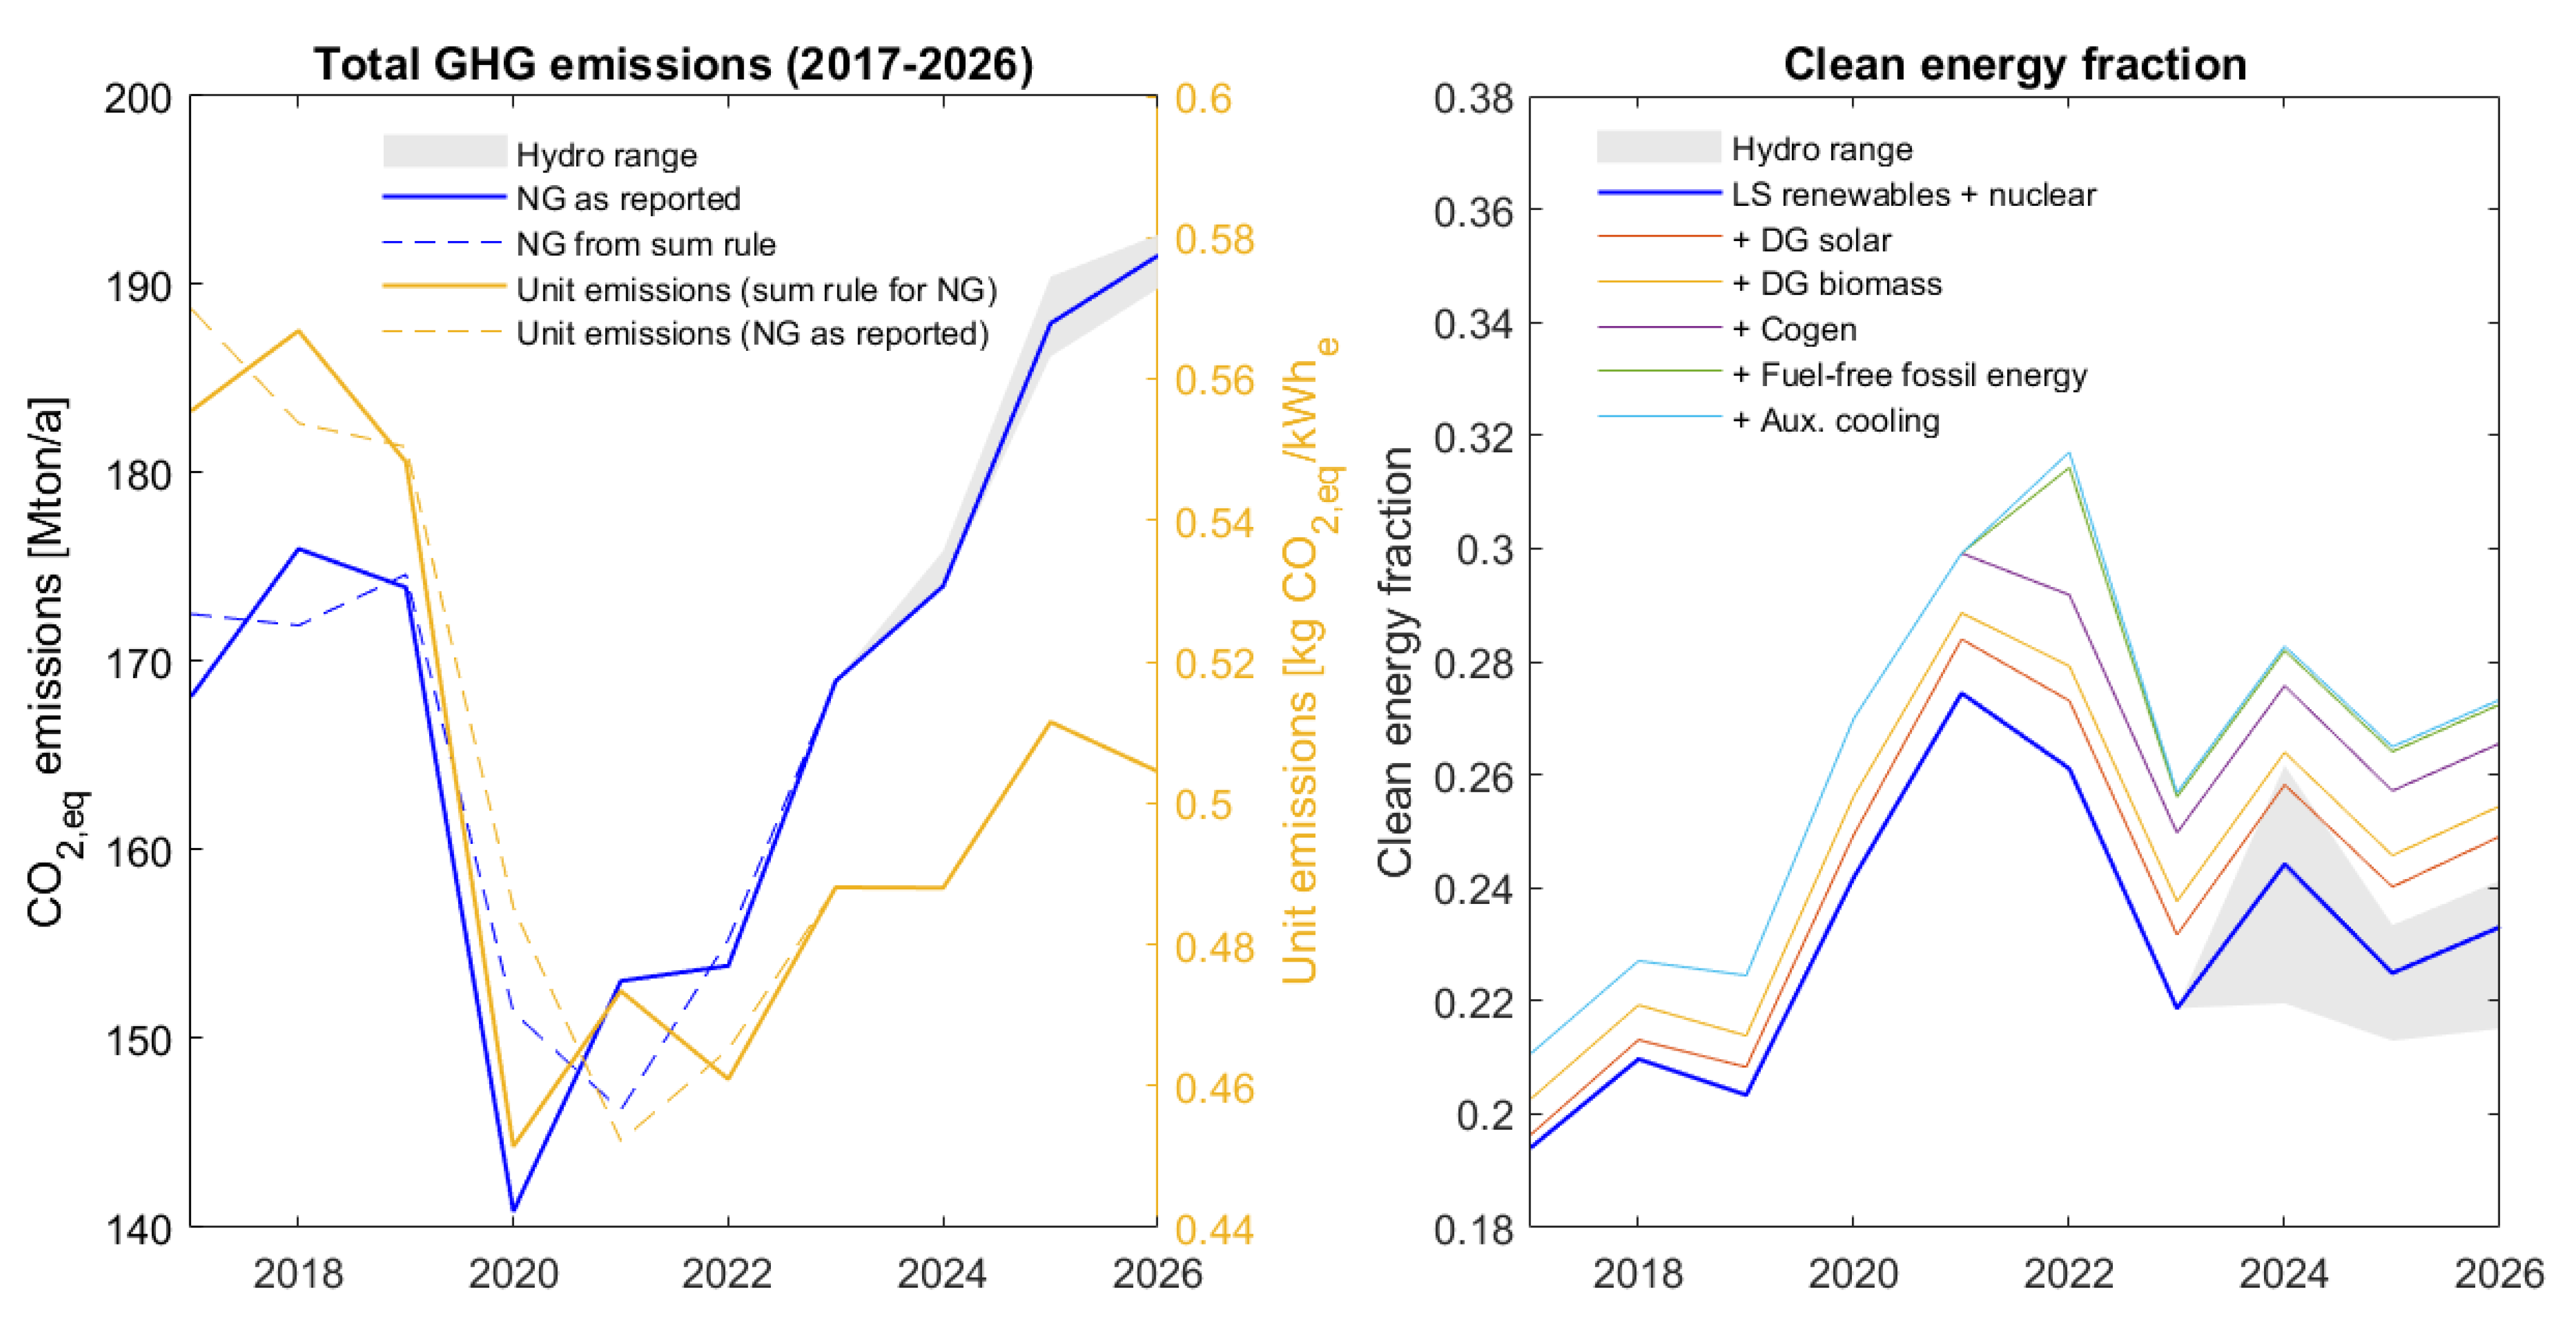
- How are the GHG emissions projected to evolve in the near future, based on the observed progress of both state-owned and privately funded generation projects?
- (5)
- Is Mexico on track to meeting its clean energy targets for 2024 and beyond? And, to what extent is the reported clean energy fraction a good predictor of GHG emissions?
3. The clean energy concept in Mexico
4. Data sources and methodology
4.1. Clean energy figures
4.2. Greenhouse gas emissions
- (a)
- The annual National Energy Balance reports [22] (SENER) contain detailed annual numbers for hydrocarbon production, particularly natural gas, fuel oil, coal and Diesel and their utilization in the power sector. In recent reports clean energy figures are also reported.
- (b)
- The governmental portal SIE (Information Energy System) offers access to data from different data sources. The SIE was used for queries of the following items:
- a.
- Annual data for hydrocarbon fuel consumption for electricity generation, as reported by the Energy Regulatory Commission (CRE, for its Spanish acronym). This data source is referred to as SIE/CRE in Table 4.
- b.
- Monthly values for natural gas consumption for electricity generation, as compiled by the Mexican Institute of Petroleum (IMP, for its Spanish acronym). This data source is referred to as SIE/IMP in Table 4.
- c.
- Annual values for coal consumption for electricity generation, as reported by the National Coal Balance (BNC, for its Spanish acronym), referred to as SIE/BNC.
- (c)
- Data from The Statistical World Review of Energy [23], through the web portal Our World in Data was used to query electricity data by fuel for the case of Mexico for comparisons.
| Fuel type/technology | Life-cycle emissions [gCO2eq/kWhe] |
Life-cycle emissions [ktCO2eq/ PJfuel] |
| Biomass | 52 | - |
| Solar photovoltaic | 43 | - |
| Geothermal energy | 37 | - |
| Hydropower | 21 | - |
| Wind power | 13 | - |
| Nuclear power | 13 | - |
| Natural gas | - | 69 |
| (Fuel) oil | - | 72 |
| Coal | - | 112 |
| Diesel | - | 73 |
4.3. Short-term outlook (2024-2026)
- (a)
- (b)
- (c)
- Research into the progress of pending fossil fuel generation projects by private investors, based on a generator database developed in the work of Miranda et al. [31] was conducted.
- (d)
- The new capacities were assumed to generate with net capacity factors (NCF) corresponding figures for the 2017-2023 period.
- (e)
- Generation figures were calculated for three hydroelectric scenarios: (i) low hydro generation (taken as the generation for 2023), (ii) high generation (2022), and (iii) typical generation (average of the period 2017-2023).
- (f)
- Re-dispatch was conducted based on the following principles: (i) Existing coal, conventional steam, internal combustion, and single-cycle gas turbine plants were reduced down to their minimum generation levels observed during the 2017-2023 period, (ii) required additional reductions in generator output were achieved by reducing the output of existing combined-cycle plants and curtailing the existing renewable energy fleet in equal parts, (iii) missing energy, where required, was provided by (slightly) increasing the output of the existing combined-cycle fleet.
- (g)
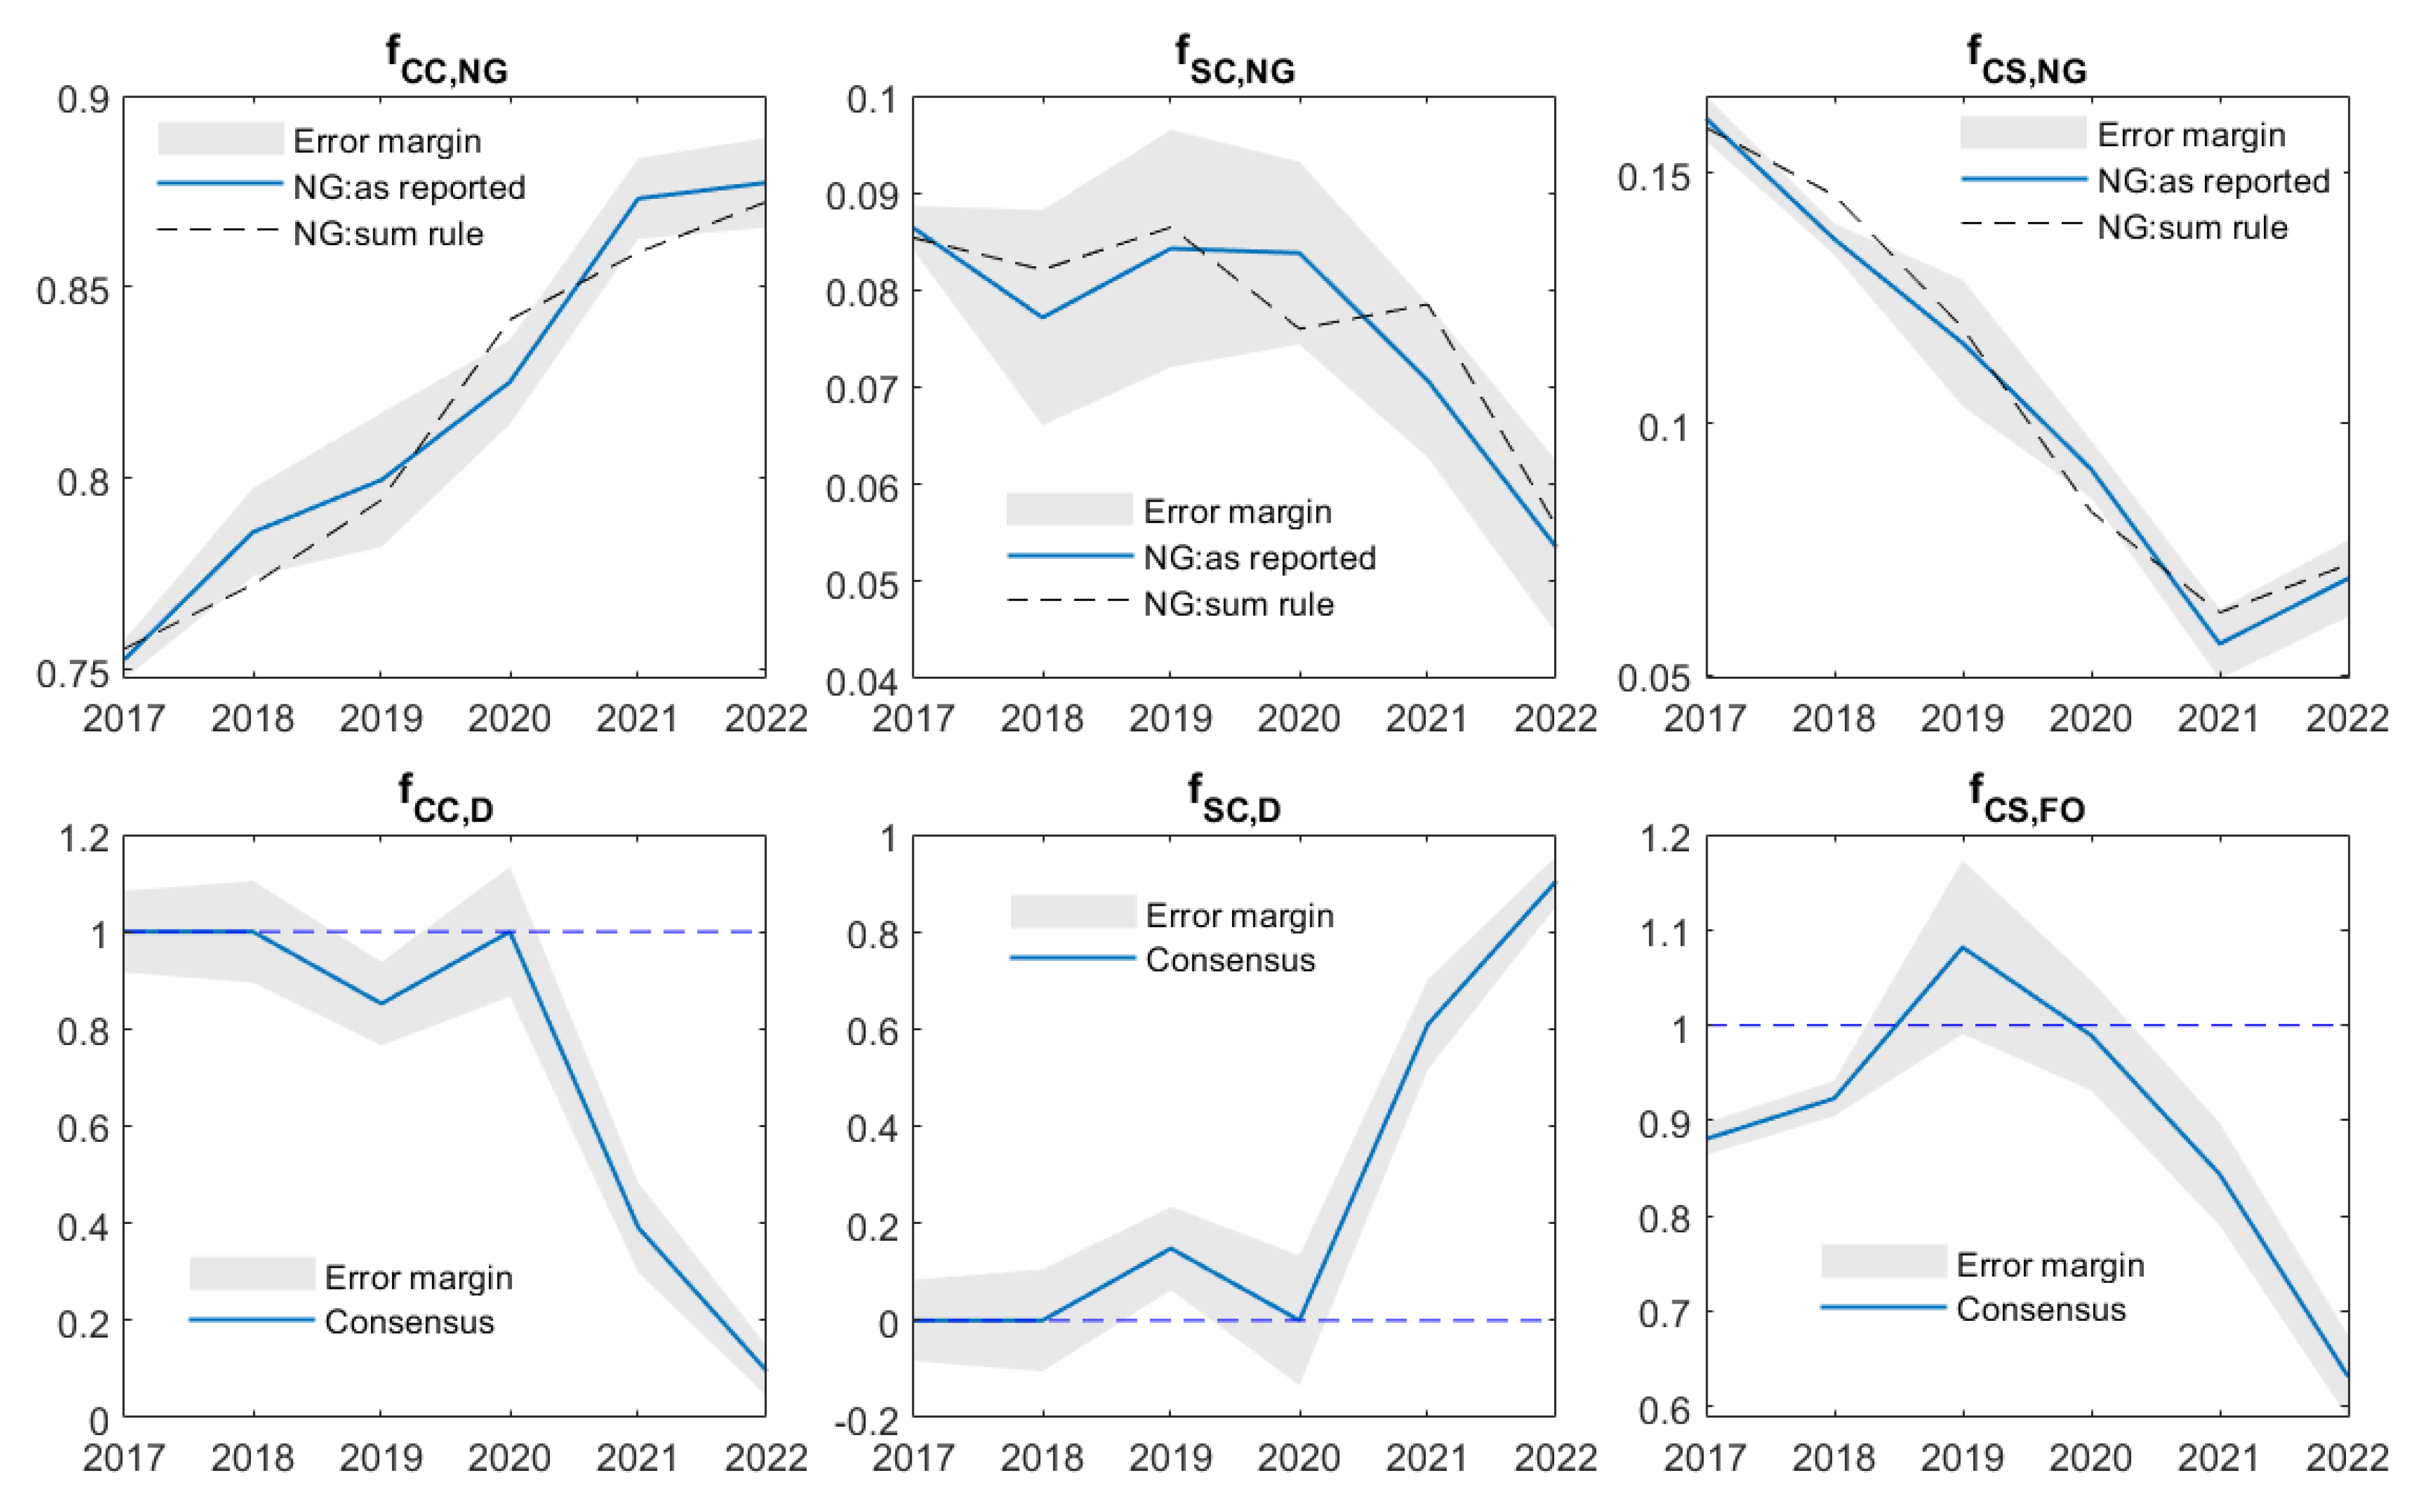
- Predicted fuel consumption values for 2023-2026 were estimated using the technology-fuel matrix method described in Appendix A, using reported and projected electricity generation data for 2023 and 2024-2026, respectively.
5. Results and discussion
5.1. Observed and official clean energy production figures for the 2017-2023 period
| Technology \ Year | 2017 | 2018 | 2019 | 2020 | 2021 | 2022 | 2023 |
| Wind | 10,454,444 | 12,432,826 | 16,520,991 | 19,684,175 | 21,049,271 | 20,304,826 | 20,695,412 |
| Solar PV | 346,947 | 2,174,394 | 7,980,058 | 13,517,173 | 17,070,210 | 16,287,206 | 18,209,982 |
| Biomass | 2,886 | 75,399 | 105,861 | 89,394 | 98,872 | 95,362 | 96,693 |
| Coal | 28,663,360 | 27,345,012 | 22,034,690 | 12,510,530 | 8,704,632 | 14,192,507 | 14,247,160 |
| Combined cycle | 154,289,170 | 160,670,910 | 171,877,440 | 183,672,570 | 184,356,620 | 194,013,140 | 203,586,556 |
| Internal combustion | 2,333,057 | 2,564,187 | 3,170,767 | 2,873,152 | 2,057,782 | 1,843,928 | 3,634,595 |
| Geothermal | 5,706,169 | 5,023,157 | 5,056,714 | 4,508,830 | 4,198,437 | 4,368,535 | 4,113,117 |
| Hydro | 31,660,120 | 32,203,712 | 23,879,279 | 26,804,751 | 34,697,076 | 35,556,117 | 20,548,855 |
| Nuclear | 10,571,136 | 13,198,780 | 10,971,859 | 10,864,278 | 11,605,475 | 10,539,513 | 12,043,370 |
| Conventional steam | 43,993,068 | 40,408,219 | 39,260,648 | 23,378,736 | 23,200,245 | 21,118,786 | 31,182,527 |
| Single-cycle gas turbines | 14,687,034 | 14,379,489 | 16,401,278 | 14,133,336 | 16,276,667 | 15,487,650 | 17,855,481 |
| Total renewables | 48,170,567 | 51,909,488 | 53,542,904 | 64,604,323 | 77,113,866 | 76,612,046 | 63,664,059 |
| Total clean energy | 58,741,703 | 65,108,268 | 64,514,763 | 75,468,601 | 88,719,341 | 87,151,559 | 75,707,430 |
| Total fossil energy | 243,965,689 | 245,367,817 | 252,744,823 | 236,568,324 | 234,595,947 | 246,656,011 | 270,506,319 |
| Clean energy fraction | 19.4% | 21.0% | 20.3% | 24.2% | 27.4% | 26.1% | 21.9% |
| Electricity generation [PJ] | ||||||
| Technology | Source | 2018 | 2019 | 2020 | 2021 | 2022 |
| Hydroelectricity | CENACE | 115.9 | 86.0 | 96.4 | 124.9 | 128.0 |
| Hydroelectricity | BNE | 116.0 | 85.0 | 96.5 | 125.0 | 128.0 |
| Geothermal | CENACE | 18.1 | 18.2 | 16.2 | 15.1 | 15.7 |
| Geothermal | BNE | 18.2 | 18.2 | 16.5 | 15.3 | 15.9 |
| Wind | CENACE | 44.8 | 59.5 | 70.8 | 75.8 | 73.1 |
| Wind | BNE | 44.8 | 60.2 | 70.9 | 75.9 | 73.9 |
| Solar photovoltaic | CENACE | 7.8 | 28.7 | 48.6 | 61.5 | 58.6 |
| Solar photovoltaic (large scale) | BNE | 7.8 | 30.2 | 48.7 | 61.4 | 58.6 |
| Solar photovoltaic (dist. generation) | BNE | 3.7 | 5.6 | 8.3 | 11.2 | 14.6 |
| Solar photovoltaic (isolated supply) | BNE | 0.0 | 0.0 | 0.0 | 0.1 | 0.1 |
| Solar photovoltaic (FIRCO program) | BNE | 0.1 | 0.0 | 0.0 | 0.0 | 0.0 |
| Biomass | CENACE | 0.3 | 0.4 | 0.3 | 0.4 | 0.3 |
| Bioenergy (total) | BNE | 7.2 | 6.7 | 7.9 | 5.7 | 7.7 |
| Nuclear | CENACE | 47.5 | 39.5 | 39.0 | 41.8 | 37.9 |
| Nuclear | BNE | 47.5 | 39.2 | 39.1 | 41.8 | 37.9 |
| Regenerative brakes | BNE | 0.0 | 0.0 | 0.0 | 0.0 | 0.0 |
| Efficient cogeneration | BNE | 8.7 | 12.2 | 15.5 | 12.3 | 15.1 |
| Fossil fuel-free energy | BNE | 0.0 | 0.0 | 0.0 | 0.0 | 27.0 |
| Auxiliary cooling | BNE | 0.0 | 0.0 | 0.0 | 0.0 | 3.3 |
| Batteries | BNE | 0.0 | 0.0 | 0.0 | 0.0 | 0.0 |
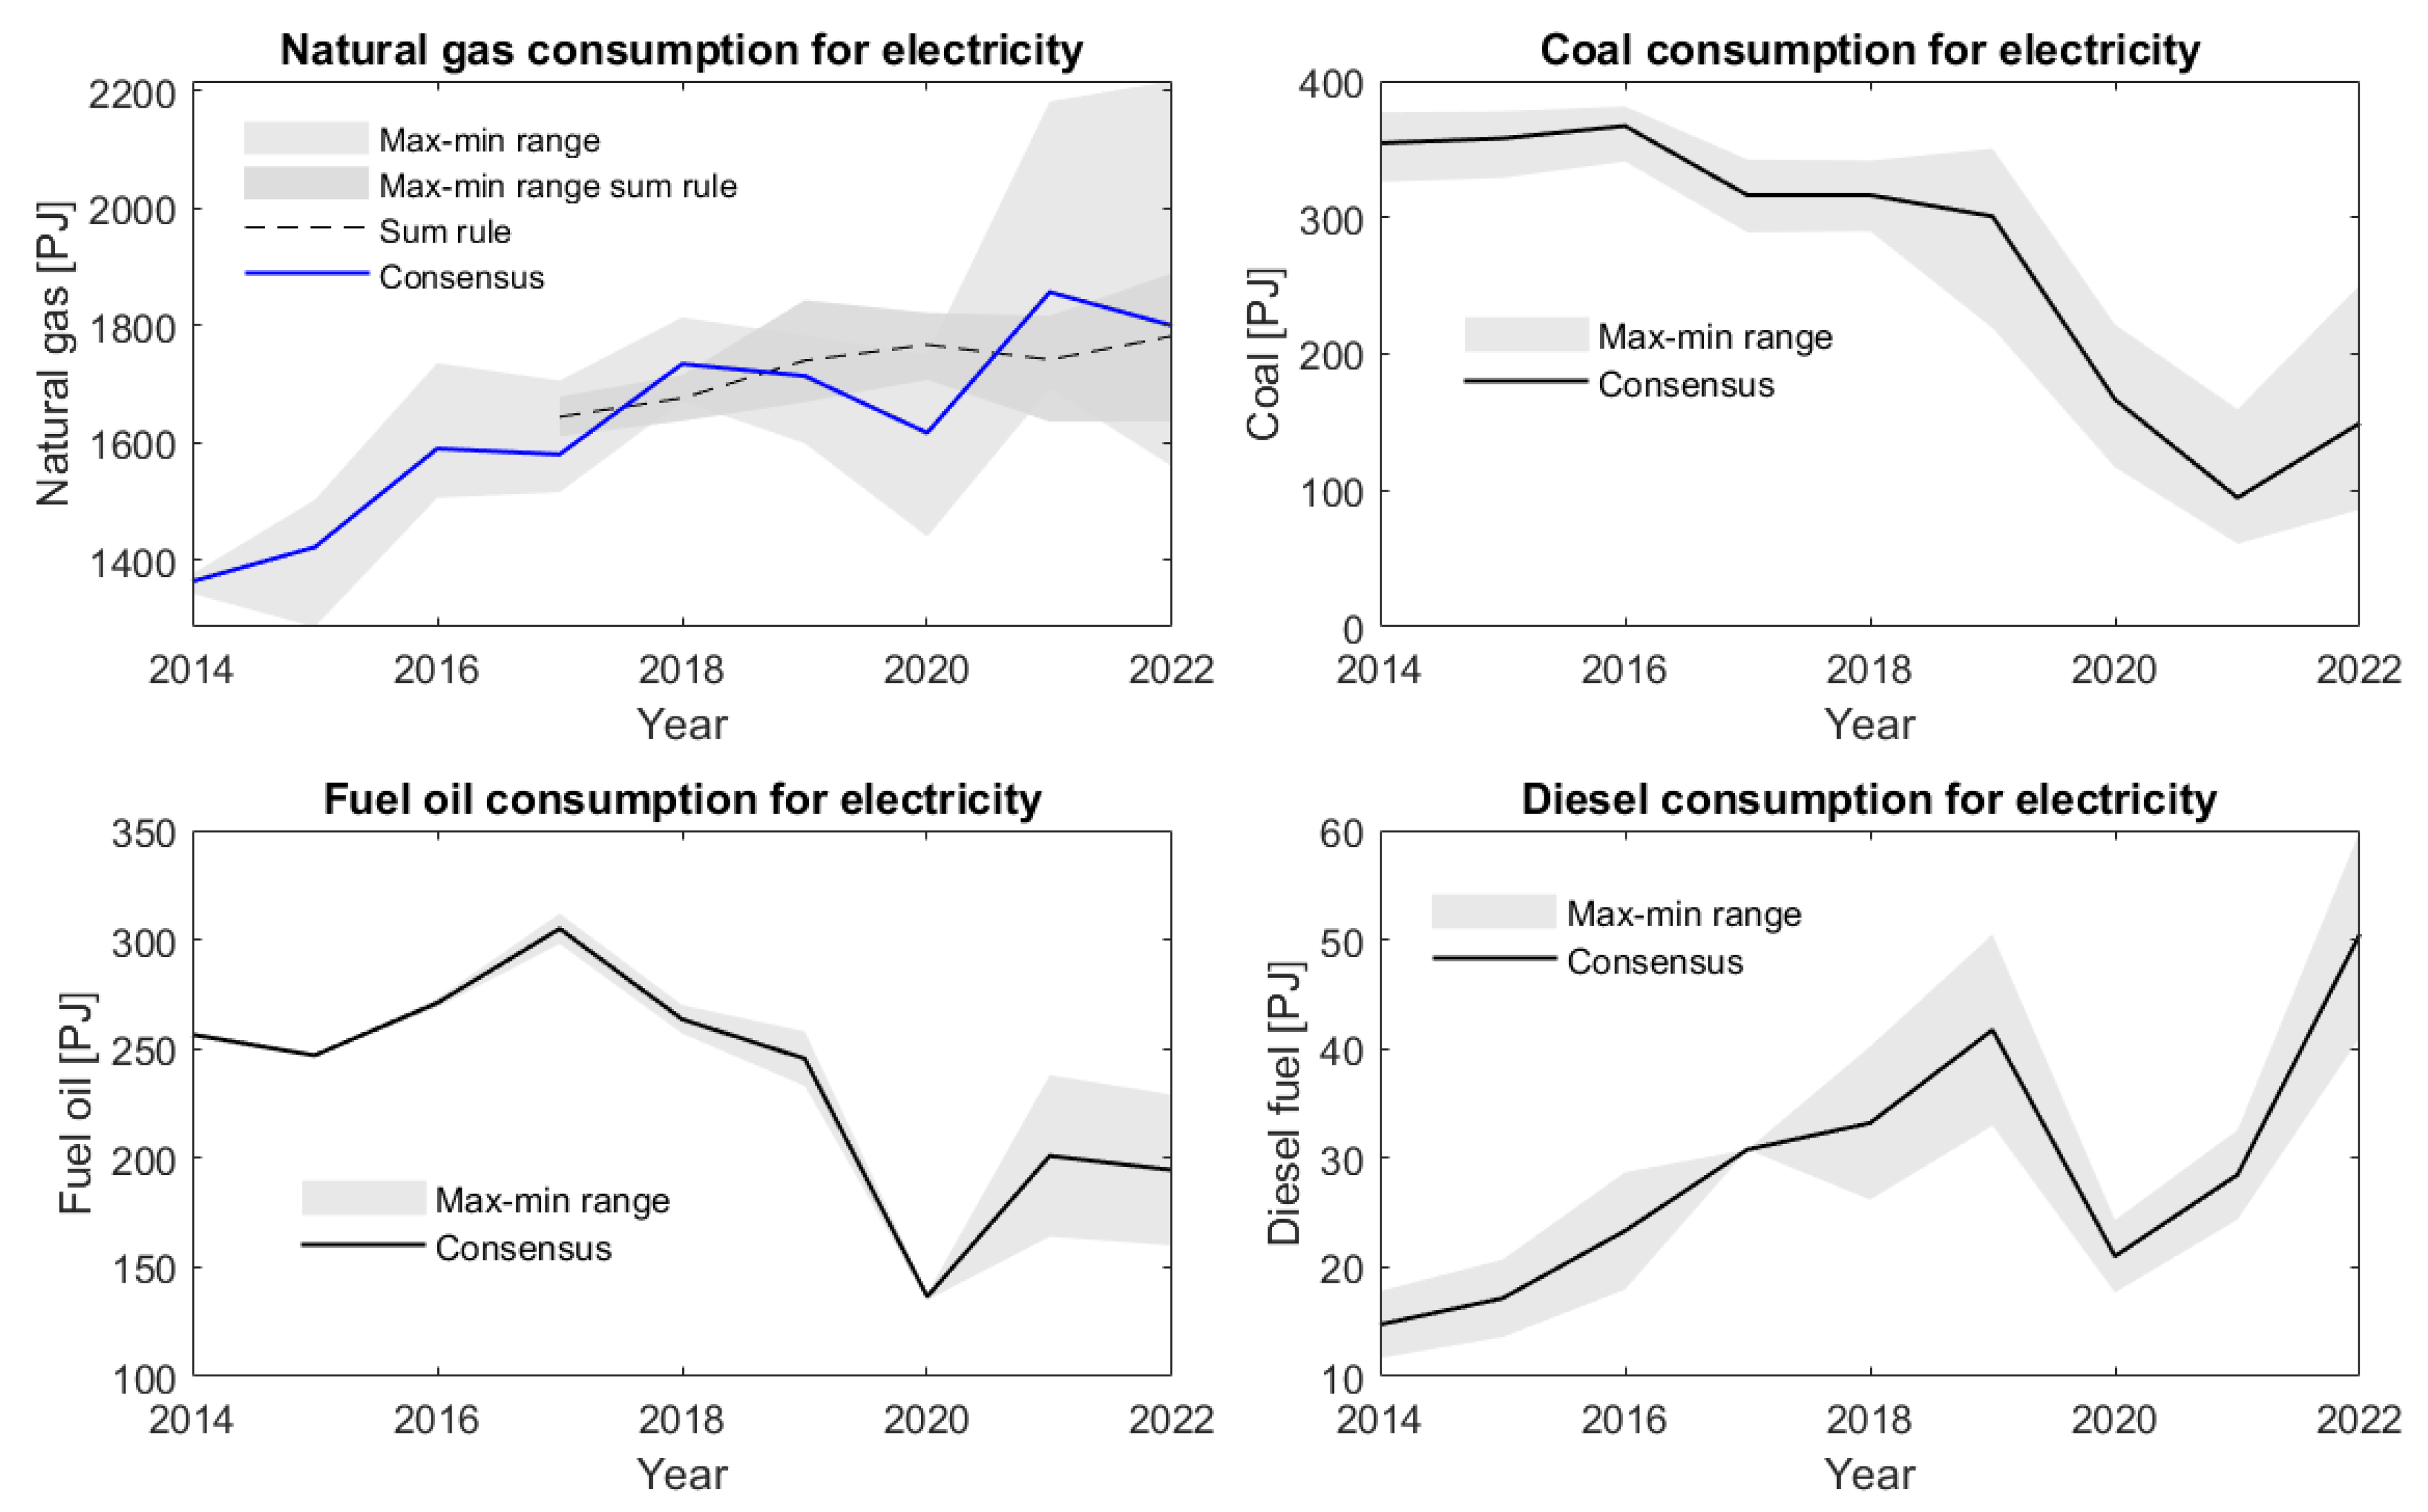
5.2. Fuel consumption for electricity generation
| Coal | Natural gas / dry gas | Fuel oil / oil | Diesel | Pcoke | Other | Lgas | |||||||||||
|---|---|---|---|---|---|---|---|---|---|---|---|---|---|---|---|---|---|
| Year | SIE / CRE(1) | SIE / BNC(2) | BNE | OWD (12) | SIE /CRE | SIE / IMP(3) | BNE(4) | OWD (8.5) | SIE / CRE | BNE | OWD (18.5) | OWD (9.3) | SIE / CRE(1) | BNE | BNE | BNE | BNE |
| 2014 | 326 | 357 | 358 | 377 | 513 | 1371 | 1342 | 1375 | 255 | 258 | 558 | 279 | 12 | 18 | 39 | 7 | 5 |
| 2015 | 329 | 362 | 363 | 378 | 588 | 1502 | 1285 | 1476 | 246 | 248 | 537 | 269 | 14 | 21 | 39 | 6 | 5 |
| 2016 | 341 | 373 | 373 | 381 | 610 | 1527 | 1735 | 1505 | 269 | 273 | 571 | 285 | 18 | 29 | 35 | 6 | 4 |
| 2017 | 289 | 317 | 317 | 342 | 474 | 1518 | 1705 | 1515 | 298 | 312 | 663 | 332 | 1537 | 31 | 39 | 4 | 2 |
| 2018 | 290 | 317 | 317 | 342 | 586 | 1718 | 1813 | 1670 | 257 | 270 | 646 | 323 | 26 | 40 | 38 | 0 | 4 |
| 2019 | 219 | 284 | 350 | 350 | 635 | 1782 | 1759 | 1598 | 233 | 258 | 573 | 286 | 33 | 50 | 34 | 2 | 0 |
| 2020 | 117 | 164 | 164 | 222 | 409 | 1749 | 1439 | 1660 | 135 | 138 | 585 | 292 | 18 | 24 | 38 | 2 | 0 |
| 2021 | 61 | 79 | 79 | 159 | 1030 | 1692 | 2181 | 1695 | 164 | 238 | 594 | 297 | 24 | 33 | 35 | 404 | 0 |
| 2022 | 86 | N/A | 111 | 251 | 3883 | 1558 | 2216 | 1622 | 160 | 229 | 873 | 436 | 41 | 60 | 38 | 34 | 0 |
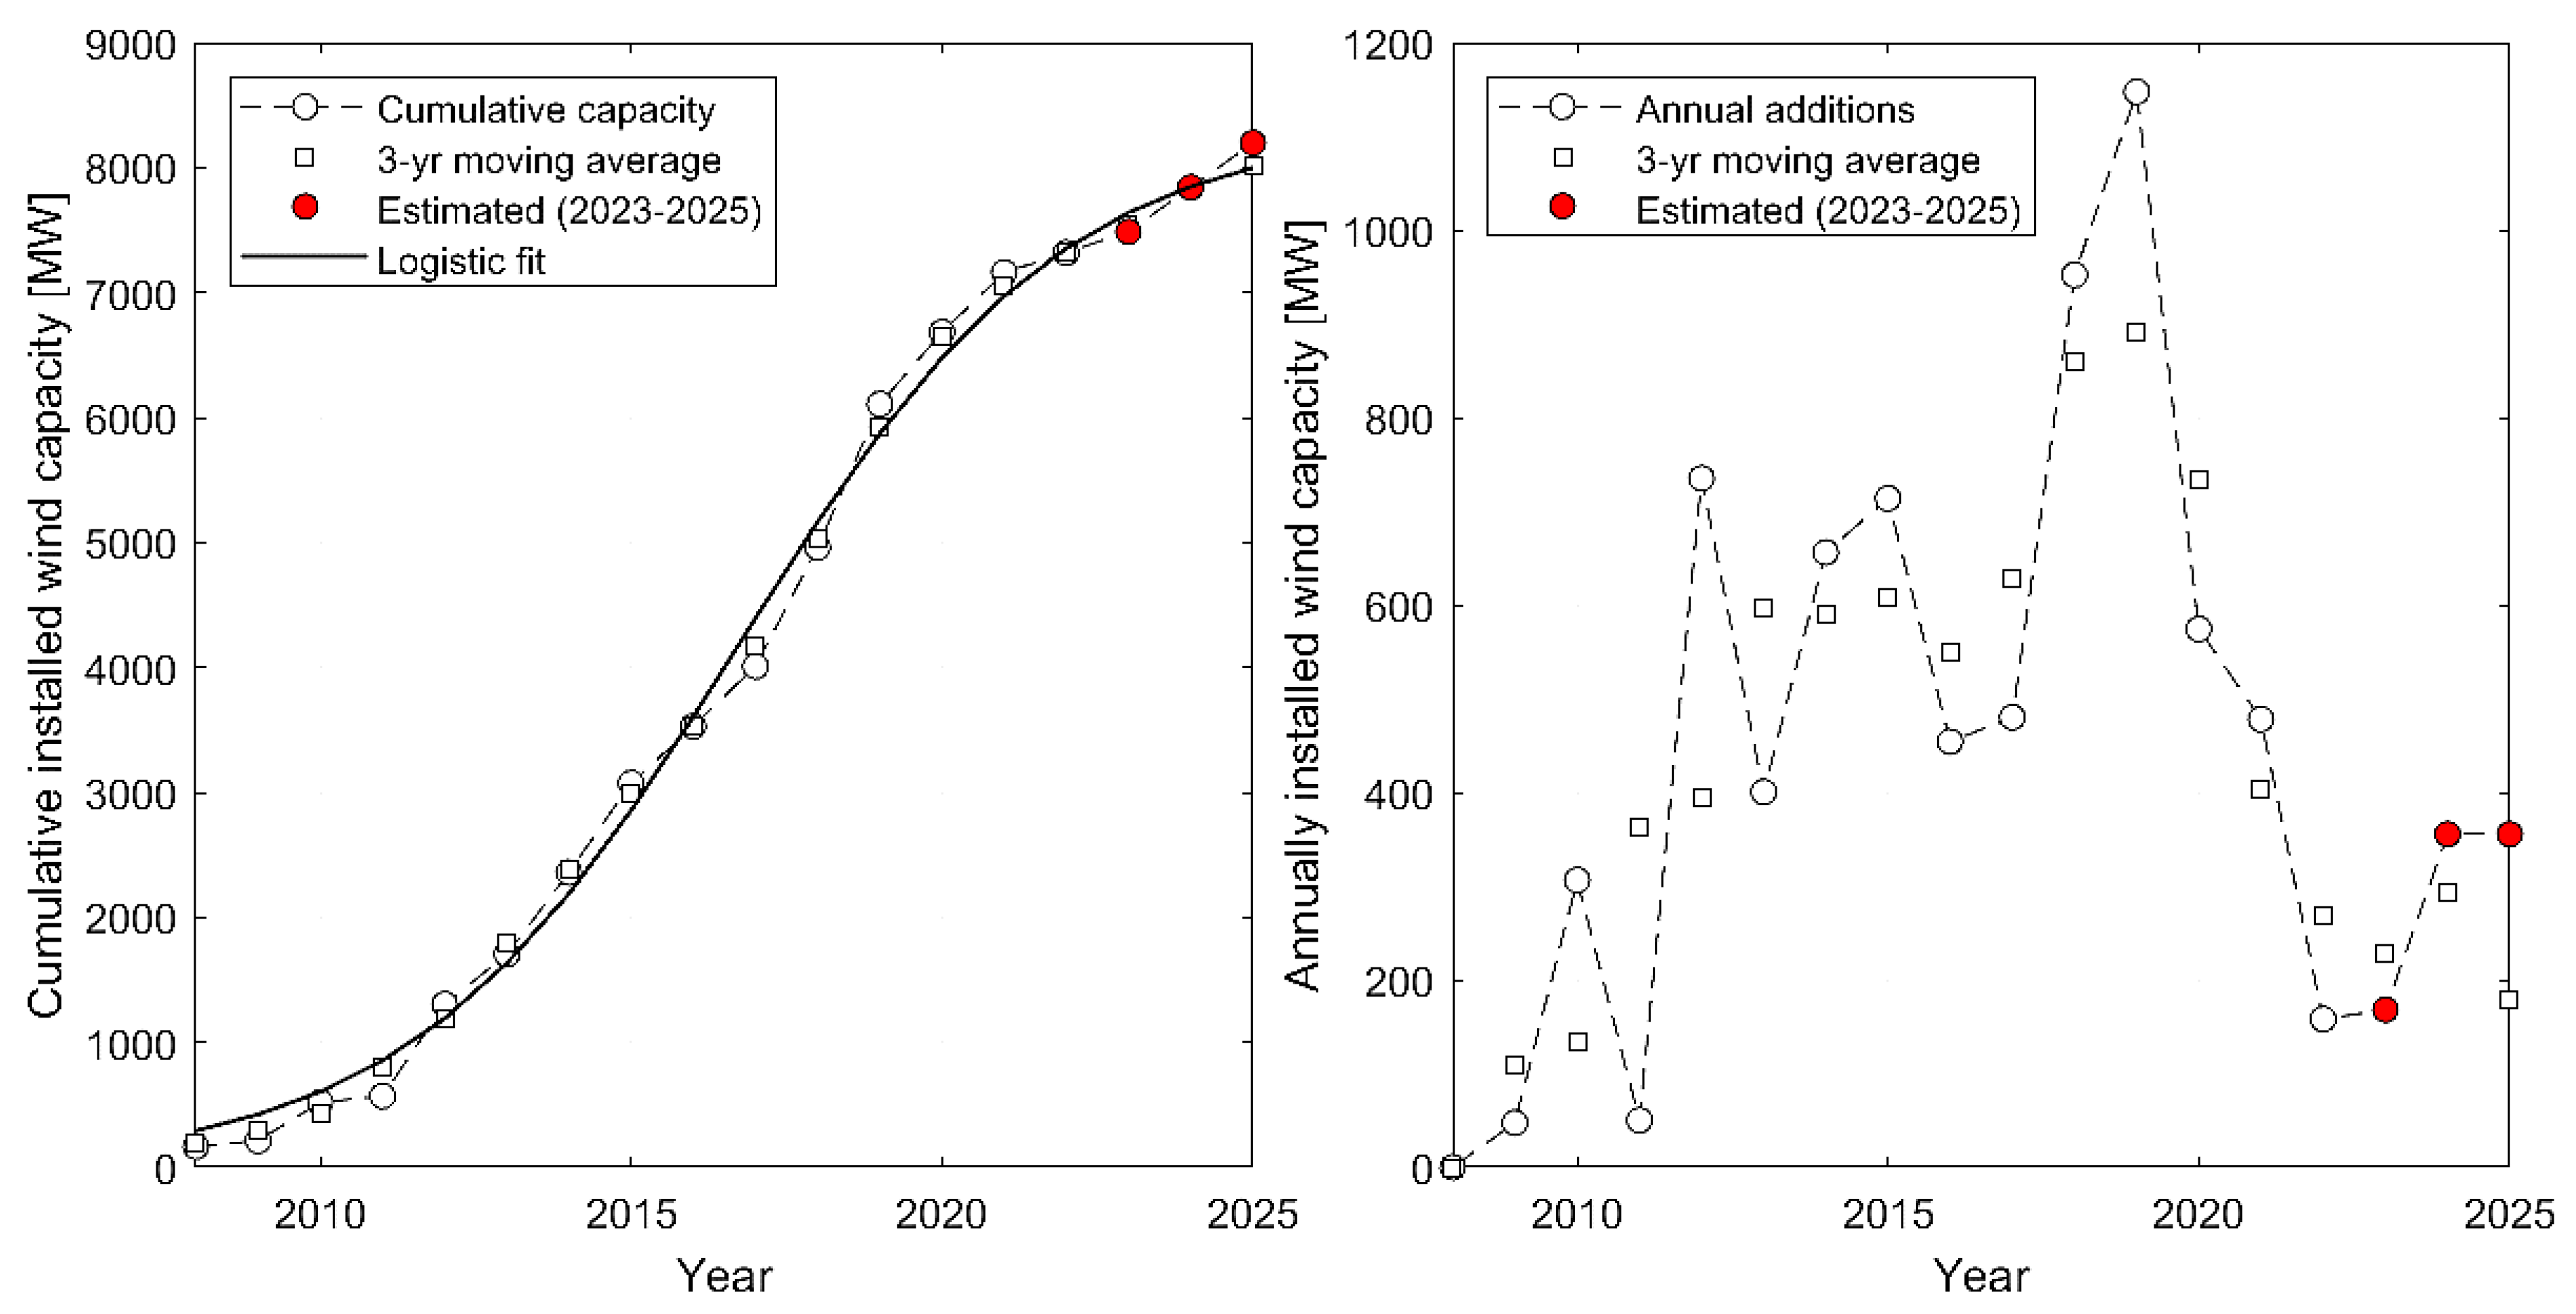
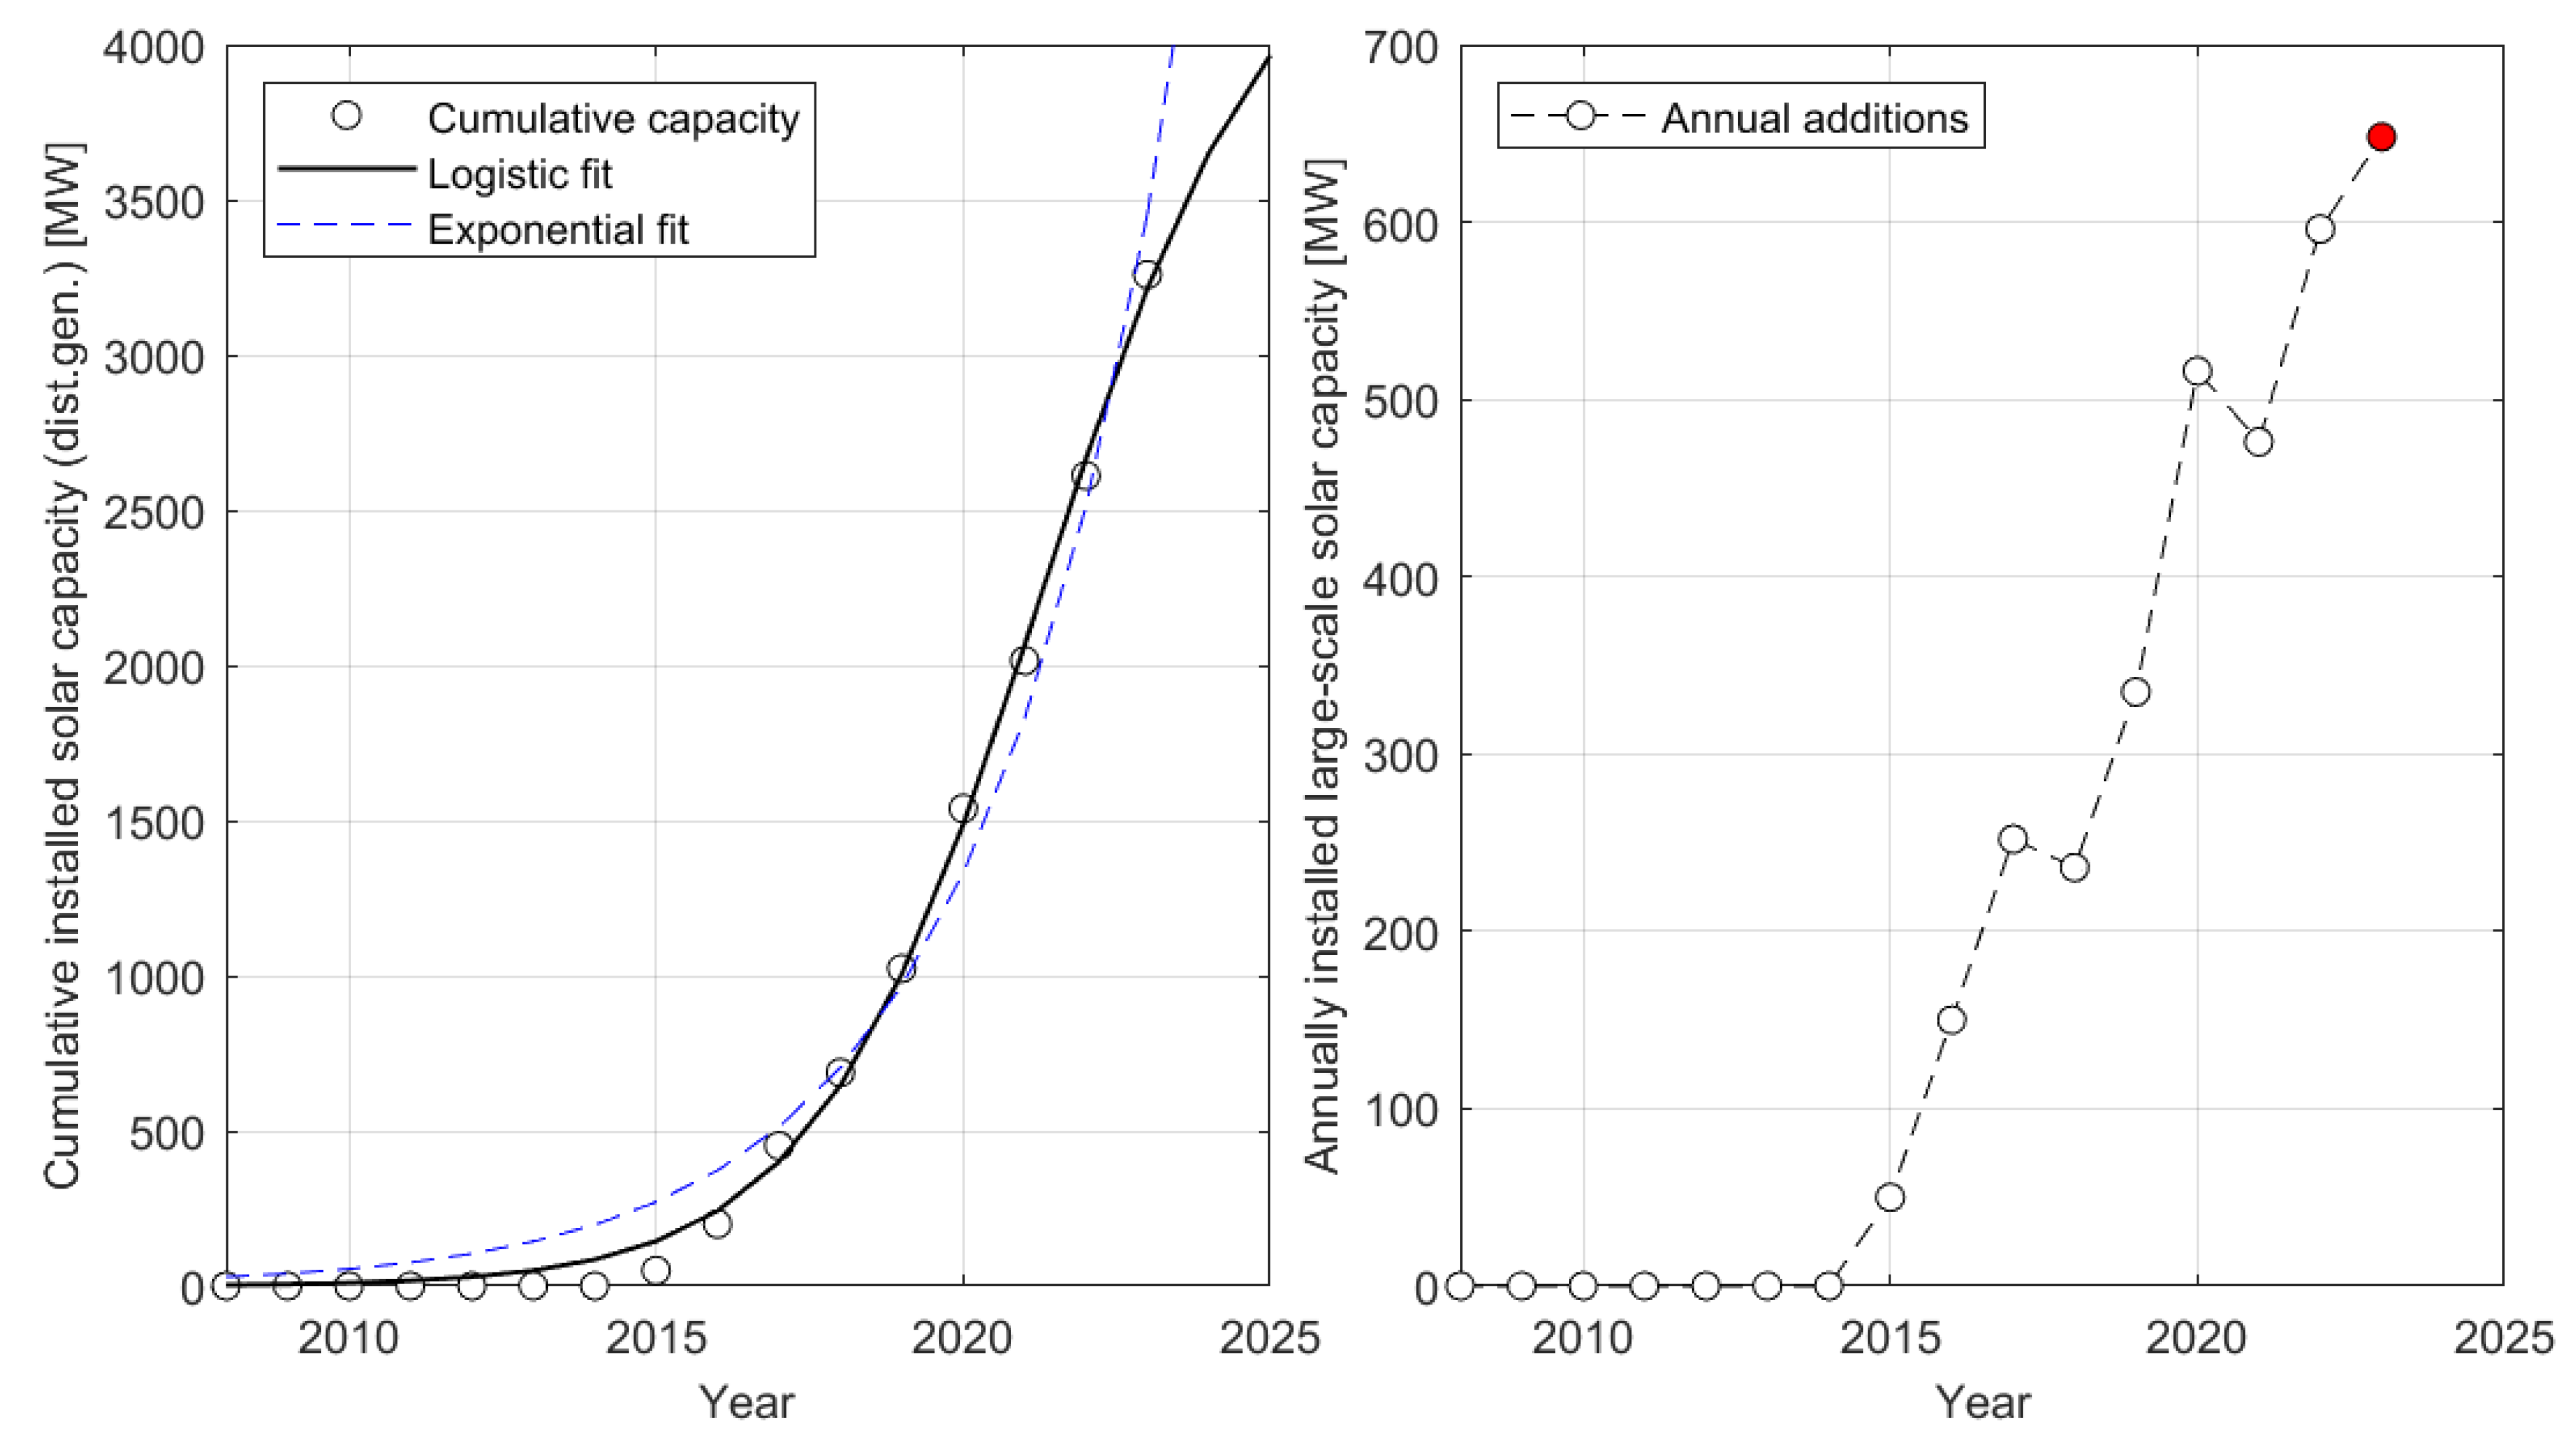
5.3. Evolution of installed capacity for wind and solar generation
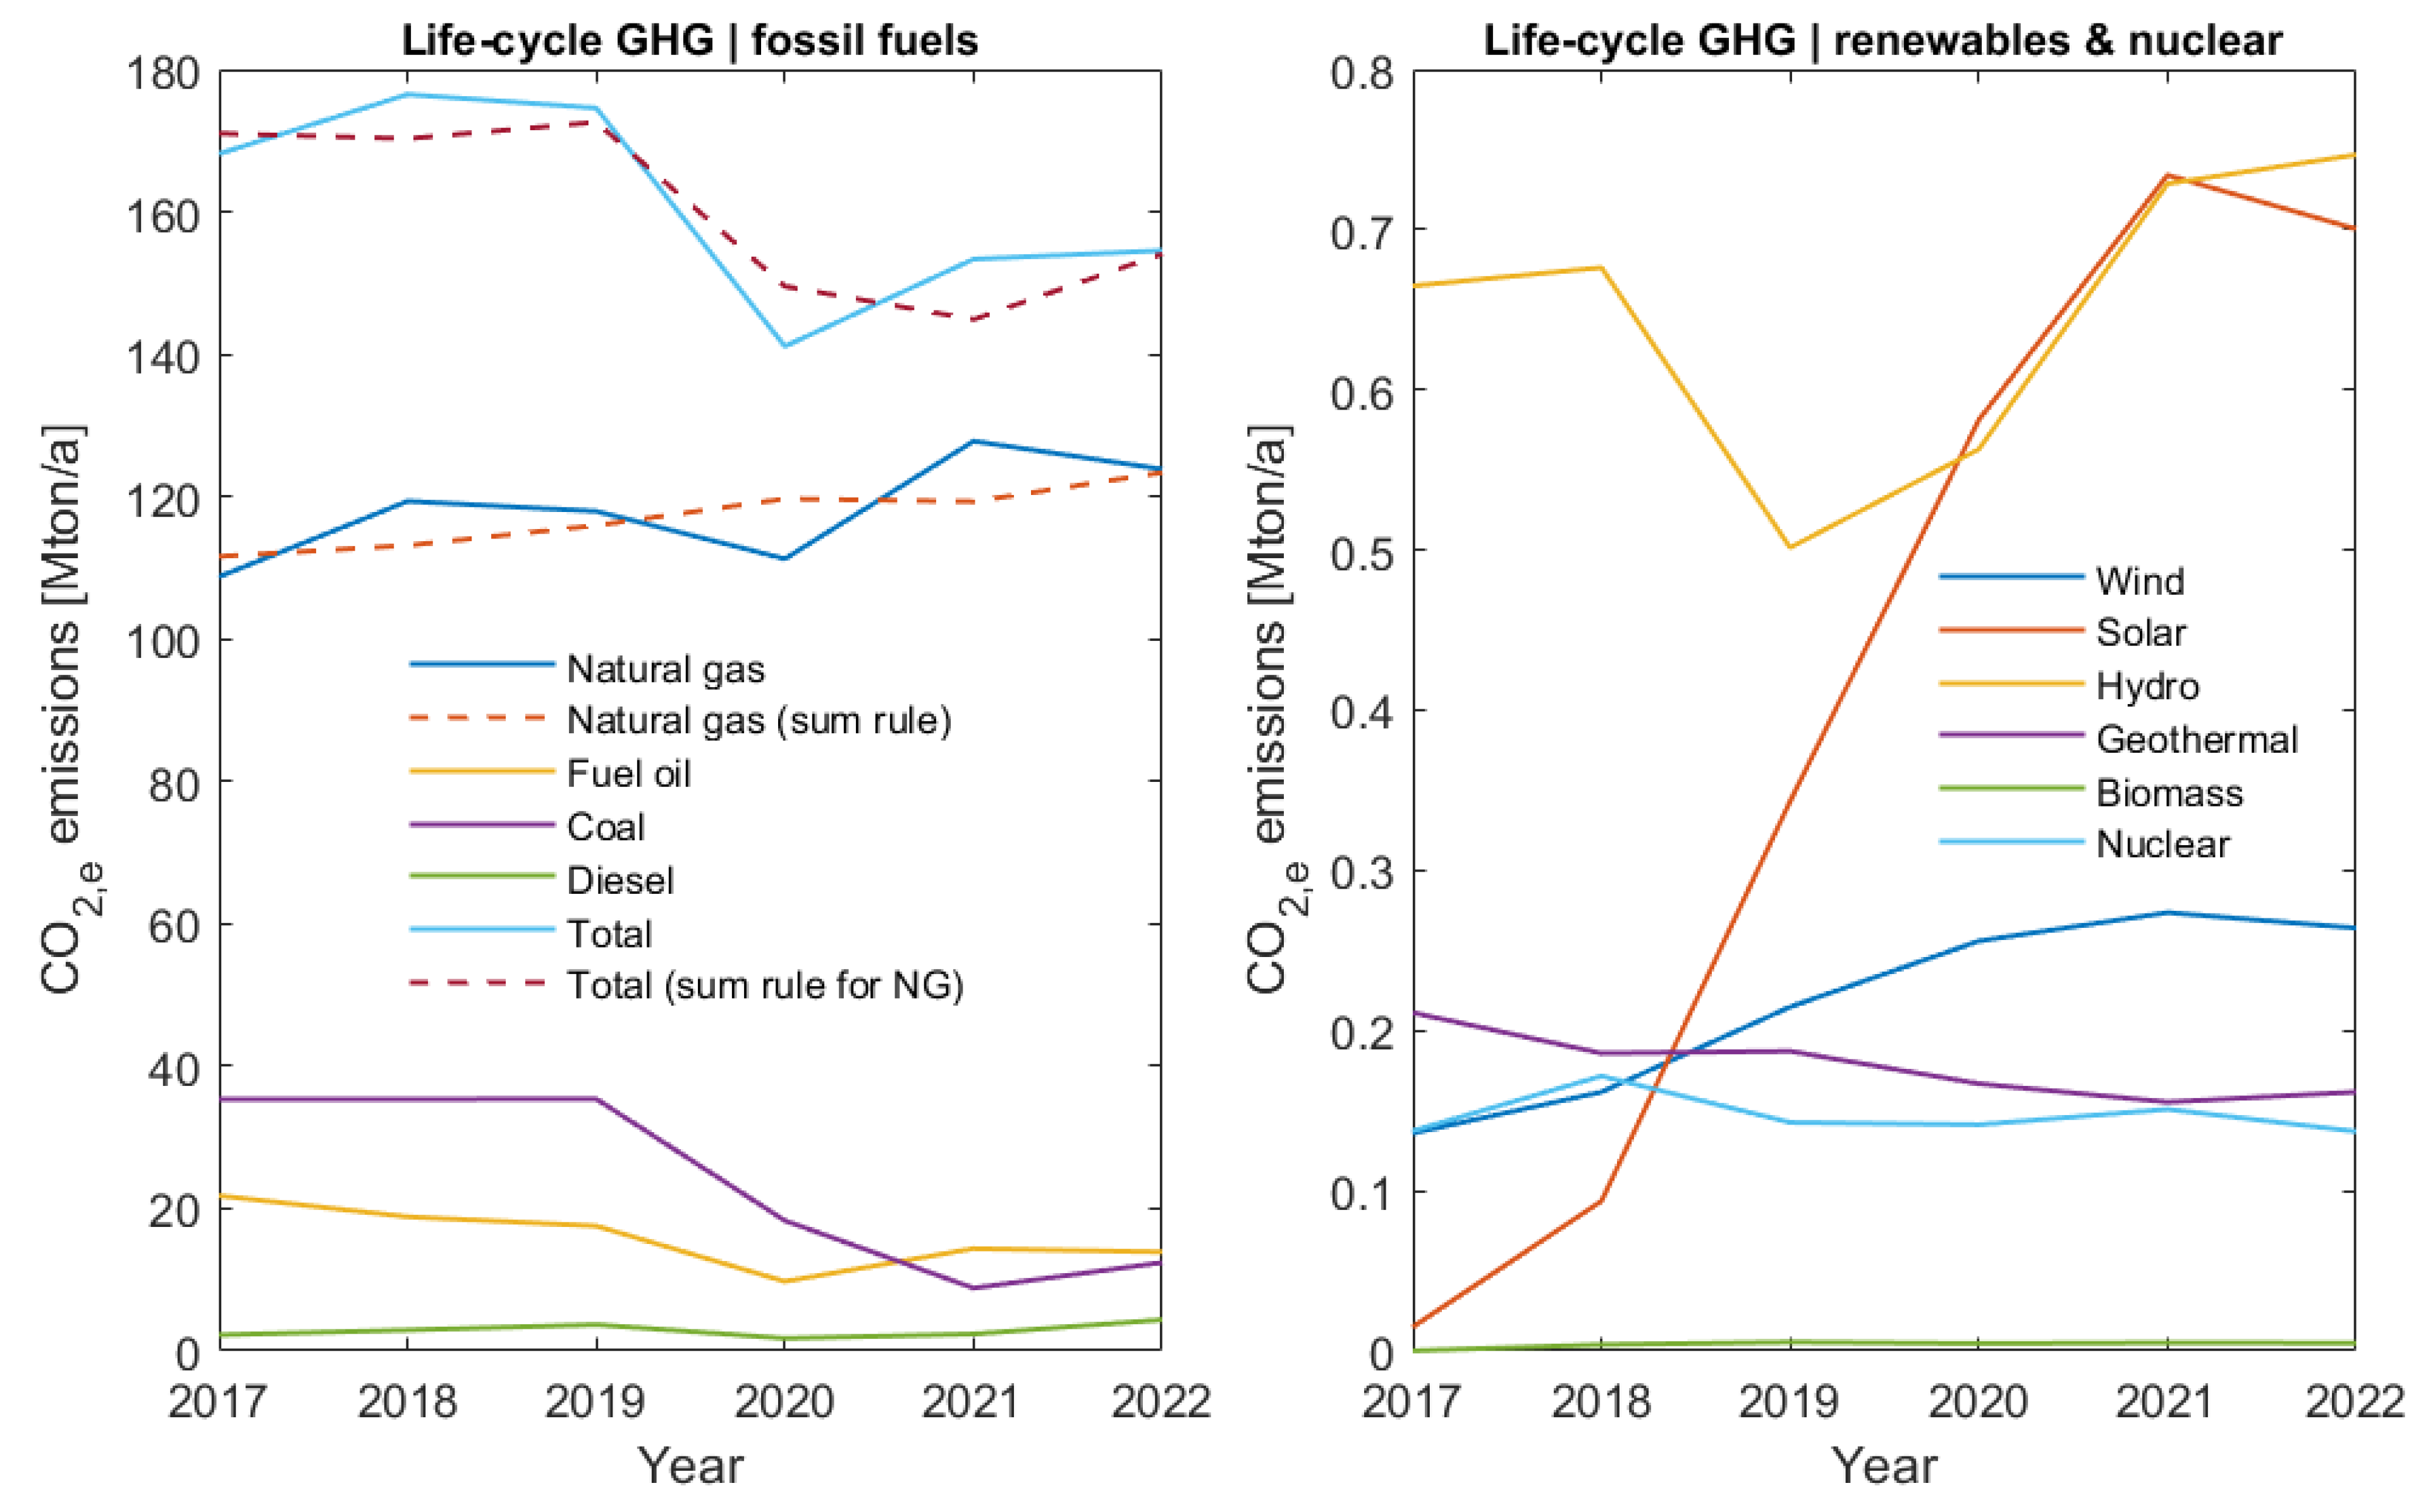
5.4. Carbon emissions from the power sector for the 2017-2022 period
5.5. Projected clean energy production and GHG emissions through 2026
5. Summary and conclusions
Funding
Data Availability Statement
Acknowledgments
Conflicts of Interest
Appendix A. Estimation of future fuel consumption data
A.1 Technology-fuel matrix
| Fuels | ||||
| Technology | Natural gas (NG) | Diesel (D) | Fuel oil (FO) | Coal (C) |
| Combined cycle (CC) plants | 0 | 0 | ||
| Single cycle (SC) gas turbines | 0 | 0 | ||
| Conventional steam (CS) plants | 0 | 0 | ||
| Coal power plants (CCP) | 0 | 0 | ||
| Internal combustion (IC) plants | 0 | |||
A.2 Uncertainty measures
A.3 Estimation of fuel consumptions
A.4 Estimation of fuel consumptions
| 1 | This heat rate value was calculated from an energy-weighted average of plant-specific data from the PIIRCE data base mentioned above (PIIRCE, 2018) |
| 2 | Generally referred to as (reverse) auctions |
| 3 | Additionally, the consumption of natural gas was also determined through the consistency requirement ; see below for more explanations. |
| 4 | The rated capacity of the Mayakan pipeline is 250 MMcfd (or 7.1 Mm3/day), out of which 240 MMcfd (0.86 Mm3/day) are tagged for power generation. Actual injection levels are much lower; the annual averages for 2019 to 2022 were = 71, 102, 142, and 160 MMcfd |
| 5 | Note that the predicted fuel consumption fraction for fuel oil (FO) in conventional steam (CS) for the year 2019 is slightly higher than 100%; however, this value is consistent with 100% within the margins of error indicated in the figure. |
| 6 | Note that one cannot argue that the technology-fuel matrix elements remain at their 2022 values. (The proof is left to the reader). |
References
- IPCC. (2023). Climate Change 2023. Retrieved from AR6 Synthesis Report: https://www.ipcc.ch/report/ar6/syr.
- Cullet, P. (2010). Chapter 8: Common but Differentiated Responsibilities. En M. Fitzmaurice, D. M. Ong, & P. Merkouris, Research Handbook on Environmental Law. Cheltenham, UK: Edward Elgar Publishing. [CrossRef]
- Climate Action Tracker. (2022, December). Country profile Mexico. Retrieved March 30, 2024, from https://climateactiontracker.org/countries/mexico/.
- Buira, D. , Tovilla, J., Farbes, J., Jones, R., Haley, B., & Gastelum, D. A whole-economy Deep Decarbonization Pathway for Mexico. Energy Strategy Reviews 2021, 33, 100578. [Google Scholar] [CrossRef]
- SENER. (2016). Reporte de avance de energías limpias. Retrieved March 30, 2024, from https://www.gob.mx/cms/uploads/attachment/file/118995/Informe_Renovables_2015_2.pdf.
- Cole, W. , Antonysamy, A., Brown, P., Sergi, B., Mai, T., & Denholm, P. How much might it cost to decarbonize the power sector? It depends on the metric. Energy 2023, 276, 127608. [Google Scholar] [CrossRef]
- Kim, Y.-G. , Lim, H., & Lee, J. Decarbonizing road transport in Korea: Role of electric vehicle transition policies. Transportation Research Part D: Transport and Environment 2024, 128, 104084. [Google Scholar] [CrossRef]
- Masuku, C. M., Caulkins, R. S., & Siirola, J. J. Process decarbonization through electrification. Current Opinion in Chemical Engineering 2024, 44, 101011. [CrossRef]
- Farfan, J. , & Lohrmann, A. Gone with the clouds: Estimating the electricity and water footprint of digital data services in Europe. Energy Conversion and Management 2023, 290, 117225. [Google Scholar] [CrossRef]
- Cruz Ake, S. , Ortiz Arango, F., & García Ruiz, R. Possible paths for Mexico's electricity system in the clean energy transition. Utility Policies 2024, 87, 101716. [Google Scholar]
- CRE. (22 de February de 2011). Methodología cogeneración eficiente RES/003/2011. Resolución por la que la Comisión Reguladora de Energía expide la metodología para el cálculo de la eficiencia de los sistemas de Cogeneración Eficiente. Mexico City, Mexico: Diario Oficial de la Federación.
- CRE. (26 de September de 2012). Metodología acreditación sistemas de cogeneración eficiente RES/291/2012. Resolución por la que la Comisión Reguladora de Energía expide las disposiciones generales para acreditar sistemas de cogeneración eficiente. Mexico City, Mexico: Diario Oficial de la Federación.
- CRE. (12 de June de 2014). Actualización metodología cogeneración eficiente RES/206/2014. RESOLUCIÓN por la que se modifica la diversa por el que se emitió la metodología para el cálculo de la eficiencia de los sistemas de cogeneración eficiente. Mexico City, Mexico: Diario Oficial de la Federación.
- CRE. (22 de December de 2016). Metodología porcentaje de energía libre RES/1838/2016. RESOLUCIÓN de la Comisión Reguladora de Energía por la que se expiden las Disposiciones administrativas de carácter general que contienen los criterios de eficiencia y establecen la metodología de cálculo para determinar el porcentaje de energía libre de. Mexico City, Mexico: Diario Oficial de la Federación.
- Presidencia. (11 de August de 2014). Ley de la Industria Eléctrica. DECRETO por el que se expiden la Ley de la Industria Eléctrica, la Ley de Energía Geotérmica y se adicionan y reforman diversas disposiciones de la Ley de Aguas Nacionales. Mexico City, Mexico: Diario Oficial de la Federación.
- Llamas, A. , & Probst, O. On the role of efficient cogeneration for meeting Mexico's clean energy goals. Energy Policy 2018, 112, 173–183. [Google Scholar] [CrossRef]
- CRE. (26 de May de 2023). Acuerdo A/018/2023 Energía libre de combustible. ACUERDO Núm. A/018/2023 de la Comisión Reguladora de Energía por el que se actualizan los valores de referencia de las metodologías para el cálculo de la eficiencia de los sistemas de cogeneración de energía eléctrica y los criterios para determinar la CE. Mexico City, Mexico: Diario Oficial de la Federación.
- SENER. (2022). Balance National de Energía 2022. Retrieved from https://base.energia.gob.mx/BNE/BalanceNacionalDeEnerg%C3%ADa2022.pdf.
- SENER. (29 de May de 2023). Programa de Desarrollo del Sector Eléctrico 2023-2037. Reporte de avance de energías limpias. Mexico City. Obtenido de https://base.energia.gob.mx/PRODESEN2023/Anexo3.pdf.
- INECC. (2022). Inventario nacional de emisiones y compuestos de efecto invernadero 2020-2021. Retrieved from https://www.gob.mx/cms/uploads/attachment/file/853373/10-2023_INEGyCEI_2020_2021.xlsx.
- SEMARNAT. (2020). Registro nacional de emisiones 2015-2018. Retrieved from https://www.gob.mx/cms/uploads/attachment/file/776803/informe_rene_emisiones_2015-2018.pdf.
- SENER. (n.d.). Balance Nacional de Energía. Retrieved from https://www.gob.mx/sener/es/articulos/balance-nacional-de-energia-296106.
- Energy Institute. (2023). Statistical Review of World Energy - with major processing by Our World in Data. “Share of primary energy consumption that comes from oil – Using the substitution method” [dataset]. Energy Institute, “Statistical Review of World Energy [original data].
- NREL. (2021). Life Cycle Greenhouse Gas Emissions from Electricity Generation: Update. Retrieved from https://www.nrel.gov/docs/fy21osti/80580.pdf.
- Gordon, D. , Reuland, F., Worden, J. R., Jacob, D. J., Shindell, D., & Dyson, M. Evaluating net life-cycle greenhouse gas emissions intensities. Environ. Res. Lett. 2023, 084008. [Google Scholar]
- Gibon, T. , Hahn Menacho, Á., & Guiton, M. (2022). Carbon Neutrality in the UNECE Region: Integrated Life-cycle Assessment of Electricity Sources. Geneva: UNECE.
- CFE. (2021). Plan de negocios 2021-2025. Versión pública. Retrieved from https://www.cfe.mx/finanzas/Documents/Plan%20de%20Negocios%20CFE%202021.pdf.
- CFE. (2022). Plan de negocios 2022-2026. Versión pública. Retrieved from https://www.cfe.mx/finanzas/documents/plan%20de%20negocios%202022.pdf.
- AMDEE. (2023). Status of wind projects in Mexico . Status of wind projects in Mexico . Mexico City, Mexico: Personal communication.
- ASOLMEX. (August de 2023). Inventario solar. Inventario solar. Mexico City, Mexico.
- Miranda, K. , Tarín-Santiso, A., Llamas, A., & Probst, O. The Electricity Generation Dispatch in Mexico: An Uncertain Road towards Sustainability. Energies 2022, 8831. [Google Scholar] [CrossRef]
- PIIRCE. (2018). Programa Indicativo para la Instalación y el Retiro de Centrales Eléctricas v2018. Programa Indicativo para la Instalación y el Retiro de Centrales Eléctricas v2018. Mexico City: Secretaría de Energía (SENER).
- Santillán Vera, M., García Manrique, L., Rodríguez Peña, I., & de la Vega Navarro, A. Drivers of electricity GHG emissions and the role of natural gas in mexican energy transition. 2023, 173, 113316. [Google Scholar] [CrossRef]
- Lenoir, T. (2023, August 28). US Interconnection Queues Analysis 2023. S&P Global Market Intelligence. Retrieved from https://www.spglobal.com/marketintelligence/en/news-insights/research/us-interconnection-queues-analysis-2023.
- Brown , S., & Jones, D. (2024). European Electricity Review 2024. Ember. Obtenido de https://ember-climate.org/insights/research/european-electricity-review-2024/#supporting-material.
- IRENA. (n.d.). Renewable capacity statistics 2023. Retrieved from https://www.irena.org/Publications/2023/Mar/Renewable-capacity-statistics-2023.
- California Distributed Generation Statistics. (2024, January 31). Retrieved March 31, 2024, from https://www.californiadgstats.ca.gov/.
- SA Power Network. (s.f.). Distributed Energy Transition Road Map 2020-2025. Retrieved from https://www.sapowernetworks.com.au/public/download.jsp?id=319084.
- The European Comission. (2024). Carbon Border Adjustment Mechanism. Recuperado el 31 de March de 2024, de https://taxation-customs.ec.europa.eu/carbon-border-adjustment-mechanism_en.
- Chojkiewicz, E., Paliwal, U., Abhyankar, N., Baker, C., O'Connell, R., Callaway, D., & Phadke, A. (2024, February). Accelerating Transmission Expansion by Using Advanced Conductors in Existing Right-of-Way. Retrieved from https://haas.berkeley.edu/wp-content/uploads/WP343.pdf.
| Additions by CFE (state utility) [MW] | Private generators [MW] | ||||||||
| Year | CCGT | ICE | SCGT | PV-LS | Geo | Hydro | Wind | PV-LS | PV-DG |
| 2024 | 409 | 1038 | 103 | 120 | 25 | 83 | 168 | 825 | 648 |
| 2025 | 5801 | - | - | 300 | - | 83 | 356 | 261 | 393 |
| 2026 | 348 | - | - | - | - | 83 | 355 | 261 | 314 |
| Total | 6558 | 1038 | 103 | 420 | 25 | 248 | 879 | 1347 | 1355 |
| Grand total | 7699 | 693 | 3581 | ||||||
| Renewables | New generation CFE [GWh] | New private generation [GWh] | |||||||||||
| Year | Total | Fossil | DRE | VRE | CCGT | ICE | SCGT | PV-LS | Geo | Hydro | Wind | PV-LS | PV-DG |
| 2024 | 8,796 | 4,459 | 315 | 3,717 | 2,615 | 1,546 | 298 | 305 | 123 | 193 | 486 | 2,096 | 1,135 |
| 2025 | 49,228 | 41,555 | 508 | 6,097 | 39,712 | 1,546 | 298 | 1,067 | 123 | 385 | 1,515 | 2,759 | 1,824 |
| 2026 | 53,885 | 43,781 | 701 | 8,337 | 41,937 | 1,546 | 298 | 1,067 | 123 | 578 | 2,541 | 3,422 | 2,374 |
| Demand | Supply | Balance | ||||
| Year | Total required generation | Generation increase | Total new generation | Low hydro | High hydro | Average hydro |
| 2024 | 358,331 | 12,117 | 8,796 | (3,322) | 11,686 | 5,465 |
| 2025 | 370,873 | 24,659 | 49,228 | 24,569 | 39,576 | 33,355 |
| 2026 | 383,853 | 37,640 | 53,885 | 16,246 | 31,253 | 25,032 |
| Redispatch - low hydro [GWh] | |||||||
| Year | Total | CS | Coal | SCGT | ICE | CCGT | VRE curt. |
| 2024 | 3,322 | - | - | - | - | 3,322 | - |
| 2025 | (24,569) | (10,064) | (5,543) | (3,722) | (1,791) | (1,725) | (1,725) |
| 2026 | (16,246) | (5,190) | (5,543) | (3,722) | (1,791) | - | - |
| Redispatch - high hydro [GWh] | |||||||
| Year | Total | CS | Coal | SCGT | ICE | CCGT | VRE curt. |
| 2024 | (11,686) | (10,064) | (1,622) | - | - | - | - |
| 2025 | (39,576) | (10,064) | (5,543) | (3,722) | (1,791) | (9,228) | (9,228) |
| 2026 | (31,253) | (10,064) | (5,543) | (3,722) | (1,791) | (5,067) | (5,067) |
| Redispatch - typical hydro [GWh] | |||||||
| Year | Total | CS | Coal | SCGT | ICE | CCGT | VRE curt. |
| 2024 | (5,465) | (5,465) | - | - | - | - | - |
| 2025 | (33,355) | (10,064) | (5,543) | (3,722) | (1,791) | (6,118) | (6,118) |
| 2026 | (25,032) | (10,064) | (5,543) | (3,722) | (1,791) | (1,957) | (1,957) |
Disclaimer/Publisher’s Note: The statements, opinions and data contained in all publications are solely those of the individual author(s) and contributor(s) and not of MDPI and/or the editor(s). MDPI and/or the editor(s) disclaim responsibility for any injury to people or property resulting from any ideas, methods, instructions or products referred to in the content. |
© 2024 by the authors. Licensee MDPI, Basel, Switzerland. This article is an open access article distributed under the terms and conditions of the Creative Commons Attribution (CC BY) license (http://creativecommons.org/licenses/by/4.0/).


