1. Introduction
The modeling and analysis of the topology of different computer systems (eg. quantum computer topologies) interdisciplinary field of computer science. The topologies are mathematically related to graph theory. It is known that topology represents the properties of the whole observed structure.
In our case, a topology describes a real quantum system configuration map
(with constraints) and it can be converted to an undirected or directed graph. The common property of topological models is that they are usually calculated based on probabilities [
2,
3,
7,
33]. The objects of the model can be matched by the vertices of the graph. Edges can be used to describe the relations between the objects. Graph-based modeling can be one of two types: ad-hoc or measurement-based.
The measurement-based metrics can be further divided into three parts the distance-based
(eccentricity), the centrality-based
(degree centrality, closeness centrality, betweenness centrality, eigenvector centrality, eccentricity centrality) and the connection-based metrics
(degree of a node, number of edges, degree distribution). Quantum topologies are usually represented by the traditional measurements based procedures [
8,
9,
23,
24,
25,
36,
42,
43,
44].
Traditional graph metrics are generally unacceptable for large graphs due to the complexity of the algorithms over time. With
k-hop-based analysis, they conduct research in many areas of computer science. Some important areas are social networks, ontologies, software verification, data mining, bioinformatics, complex optimization problems, machine learning, artificial intelligence, and cyber-physical systems. The goal of
k-hop-based algorithms is to reduce the search space, combining local and global search procedures to find the best solution to a problem. The purpose of
k-hop-based metrics, in addition to reducing the time complexity caused by the exponential explosion, is to represent local global properties in the case of the investigated problem. J. Cheng et al. [
17] studied the problem of answering
k-hop reachability queries in a directed graph, they investigated whether there exists a
k-length directed path from the source query vertex to the destination query vertex in the input graph. Xie, X. et al. [
47] is recommended for solving vertex-cover problems in cyber-physical systems as a composite index method, which was used to reduce the
k-hop reachability query time and improve pruning efficiency. Graph neural networks have the same expressive power as the Weisfeiler-Lehman graph isomorphism test [
45], but neither can identify fundamental graph properties.
G. Nikolentzos et al. [
38] proposed a new
k-hop-based architecture, which can identify the basic properties
(connectivity, triangle freeness) of the graph by aggregating the information from the
k-hop neighborhood of the nodes. The minimum-cost
k-hop spanning tree problem asks for a spanning tree of minimum total cost such as the longest path from the root to any leaf element has at most k edges. E. Althaus et al. [
1] presented an
time algorithm to compute a minimum-cost k-hop spanning tree. W. Liu and Z. Li [
35] used a key/value-based method on a parallelized architecture in the interest of computing
k-hop neighborhoods on a large-scale graph efficiently. Due to their approach, they do not transmit large amounts of neighborhood information, so unlike a breadth-first search traversal managed to reduce significantly the overhead of communication. Chen et al. [
16] improved the partition-based algorithm in spatial sub-prevalent co-location patterns mining and proposed a novel hierarchy-based algorithm based on
k-hop neighbors. By extending the study to a k-hop environment the modified algorithm can discover more potentially valuable maximally sub-prevalent co-location patterns.
Quantum topology [
30] is a branch of mathematics that studies the topological properties of quantum mechanical systems. This includes the study of knots and links, which are closed curves in three-dimensional space, and their invariants. These invariants can be used to describe the topological properties of the underlying quantum system. The invariants have applications in a variety of fields, including physics [
31], biology [
27], and computer science [
26]. In quantum mechanics, particles are described by wave functions that can have nontrivial topological properties, and these properties can have important physical consequences. Another area of study is topological quantum field theories, which are quantum field theories that are invariant under changes in topology [
46].
In quantum computing, the term "topology" refers to the physical arrangement or layout of the qubits and other components that make up the quantum computer. Different topologies can have different strengths and weaknesses, depending on the type of quantum algorithm being run and the available technology [
11,
15,
21]. Some common quantum computer topologies include:
Circuit-based quantum computers [
41]: These are the most widely used type of quantum computers today. They typically consist of qubits arranged in a linear or 2D grid and quantum gates are applied sequentially to the qubits to perform computations.
Measurement-based quantum computers [
15]: In this topology, the qubits are first prepared in a highly entangled state, and computations are performed by making measurements on custom qubits. Measurement-based quantum computers can be implemented using linear optics or spin chains.
Topological quantum computers [
32]: These are a type of quantum computer designed to be more resistant to noise and errors. In this topology, qubits are arranged on a lattice, and the topology of the lattice is used to encode and protect quantum information.
Quantum annealers [
19]: These are a type of quantum computer "Specifically designed" for optimization problems. Qubits are arranged in a graph, and the interactions between the qubits are used to find the optimal solution to a given problem.
The rest of this article is organized as follows. In
Section 2 we briefly describe our previous results. In
Section 3 and
Section 4, we present in detail the
k-hop-based analysis of the Chimera, Pegasus, and Zephyr topologies. Finally,
Section 5 contains our conclusions and future work.
2. Previous Work
In our previous work, we focused on wireless sensor networks and defined some globally local and locally global graph-based metrics. We introduced several density and redundancy based metrics interpreted in a k-hop environment: Weighted Communication Graph Density (), Relative Communication Graph Density (), Weighted Relative Communication Graph Density (), Communication Graph Redundancy (value-based) (), Weighted Communication Graph Redundancy (size-based) () and (value-based) ().
We compared them to well-known graph metrics and showed that they can be used for node ranking [
5].
The basic notations are:
u: the candidate node;
k: the number of hops;
, : the number of nodes and edges of graph ;
,: the number of nodes and edges of graph ;
, : the set of maximum cliques of graph and the cardinality of this set;
, : the set of maximal cliques of graph and the cardinality of this set;
, : the number of edges of the minimum cost spanning tree of graph and . Note, that in the case of a communication graph, we have that , regardless of whether the graph is directed or undirected;
s: the spreading factor, which is a technical value to enlarge small differences in the metrics. In this article, we set ;
: the clique size, minimum value is 2.
Weighted Communication Graph Density
Relative Communication Graph Density
Weighted Relative Communication Graph Density
Communication Graph Redundancy
(value-based)
Weighted Communication Graph Redundancy
(size-based)
Weighted Communication Graph Redundancy
(value-based)
In our previous paper [
6], we focused on graph-based analysis of the topology of D-Wave quantum computers. The Pegasus, Chimera, and Zephyr topologies generated with different parameters we examined using classical-based graph metrics. We worked on the average values of the metrics interpreted on the graphs as we were interested in the characteristics shown by the metrics.
Classical graph metrics, such as degree centrality, closeness centrality, betweenness centrality, and eigenvector centrality, provide valuable insights into the structure and properties of graphs.
However, they have several limitations:
Metrics like betweenness and closeness centrality have high computational complexity, making them impractical for very large graphs [
4,
14].
Metrics can be affected by the density of the graph. For example, in very dense or very sparse graphs, some centrality measures might not. In our previous paper [
6] we focused on graph-based analysis of the topology of D-Wave quantum computers. The Pegasus, Chimera, and Zephyr topologies generated with different parameters we examined using classical-based graph metrics. We worked on the average values of the metrics interpreted on the graphs as we were interested in the characteristics shown by the metrics. Classical graph metrics, such as degree centrality, closeness centrality, betweenness centrality, and eigenvector centrality, provide valuable insights into the structure and properties of graphs. However, they have several limitations: provide meaningful distinctions between nodes [
39].
Many metrics were originally designed for undirected graphs and may not straightforwardly apply to directed graphs.[
28]
Centrality measures can be significantly affected by the presence of outlier nodes, which may not be representative of the overall network [
13].
Many classical metrics assume that all nodes have similar roles or functions, which is not always true in heterogeneous networks where nodes represent different entities or functions [
22].
Classical metrics may not effectively capture the nuances of complex network structures such as modularity, community structure, or hierarchical organization [
37].
3. Topology Analysis
In this article, we focus on
D-Wave processor topologies. The processors of
D-Wave work with quantum annealing used for solve optimization problems. The topology of
D-Wave’s quantum annealing processors is based on a Chimera or a Pegazus or a Zephyr graph [
10,
11,
12]. In general, these topologies
(graphs) consist of different subgraphs depending on the implementation in which the qubits are connected in a specific pattern. On the entire chip, these subgraphs are repeated with varying degrees of interconnectedness, resulting in a highly interconnected and modular architecture. These topologies are optimized for optimization problems, such as the Ising model and the quadratic unconstrained binary optimization
(QUBO) problem.
D-Wave’s processors are not universal and may not be suitable for other types of quantum algorithms that require different types of connectivity or topology [
29,
34,
40].
3.1. Chimera
Chimera two-dimensional lattice graph
is an
x grid of Chimera tiles implements the topology of the
D-Wave 2000Q systems. The Chimera titles
are complete bipartite graphs. Chimera graph contains a particularly nice clique minor, so the triangle embedding is uniform and near-optimal [
10,
18].
The following configurations were used on Chimera-based D-Wave processors: where and . In the configuration, the processor can use 1152 qubits. The Chimera graphs were examined under different configurations from to with L values of 4 and 8.
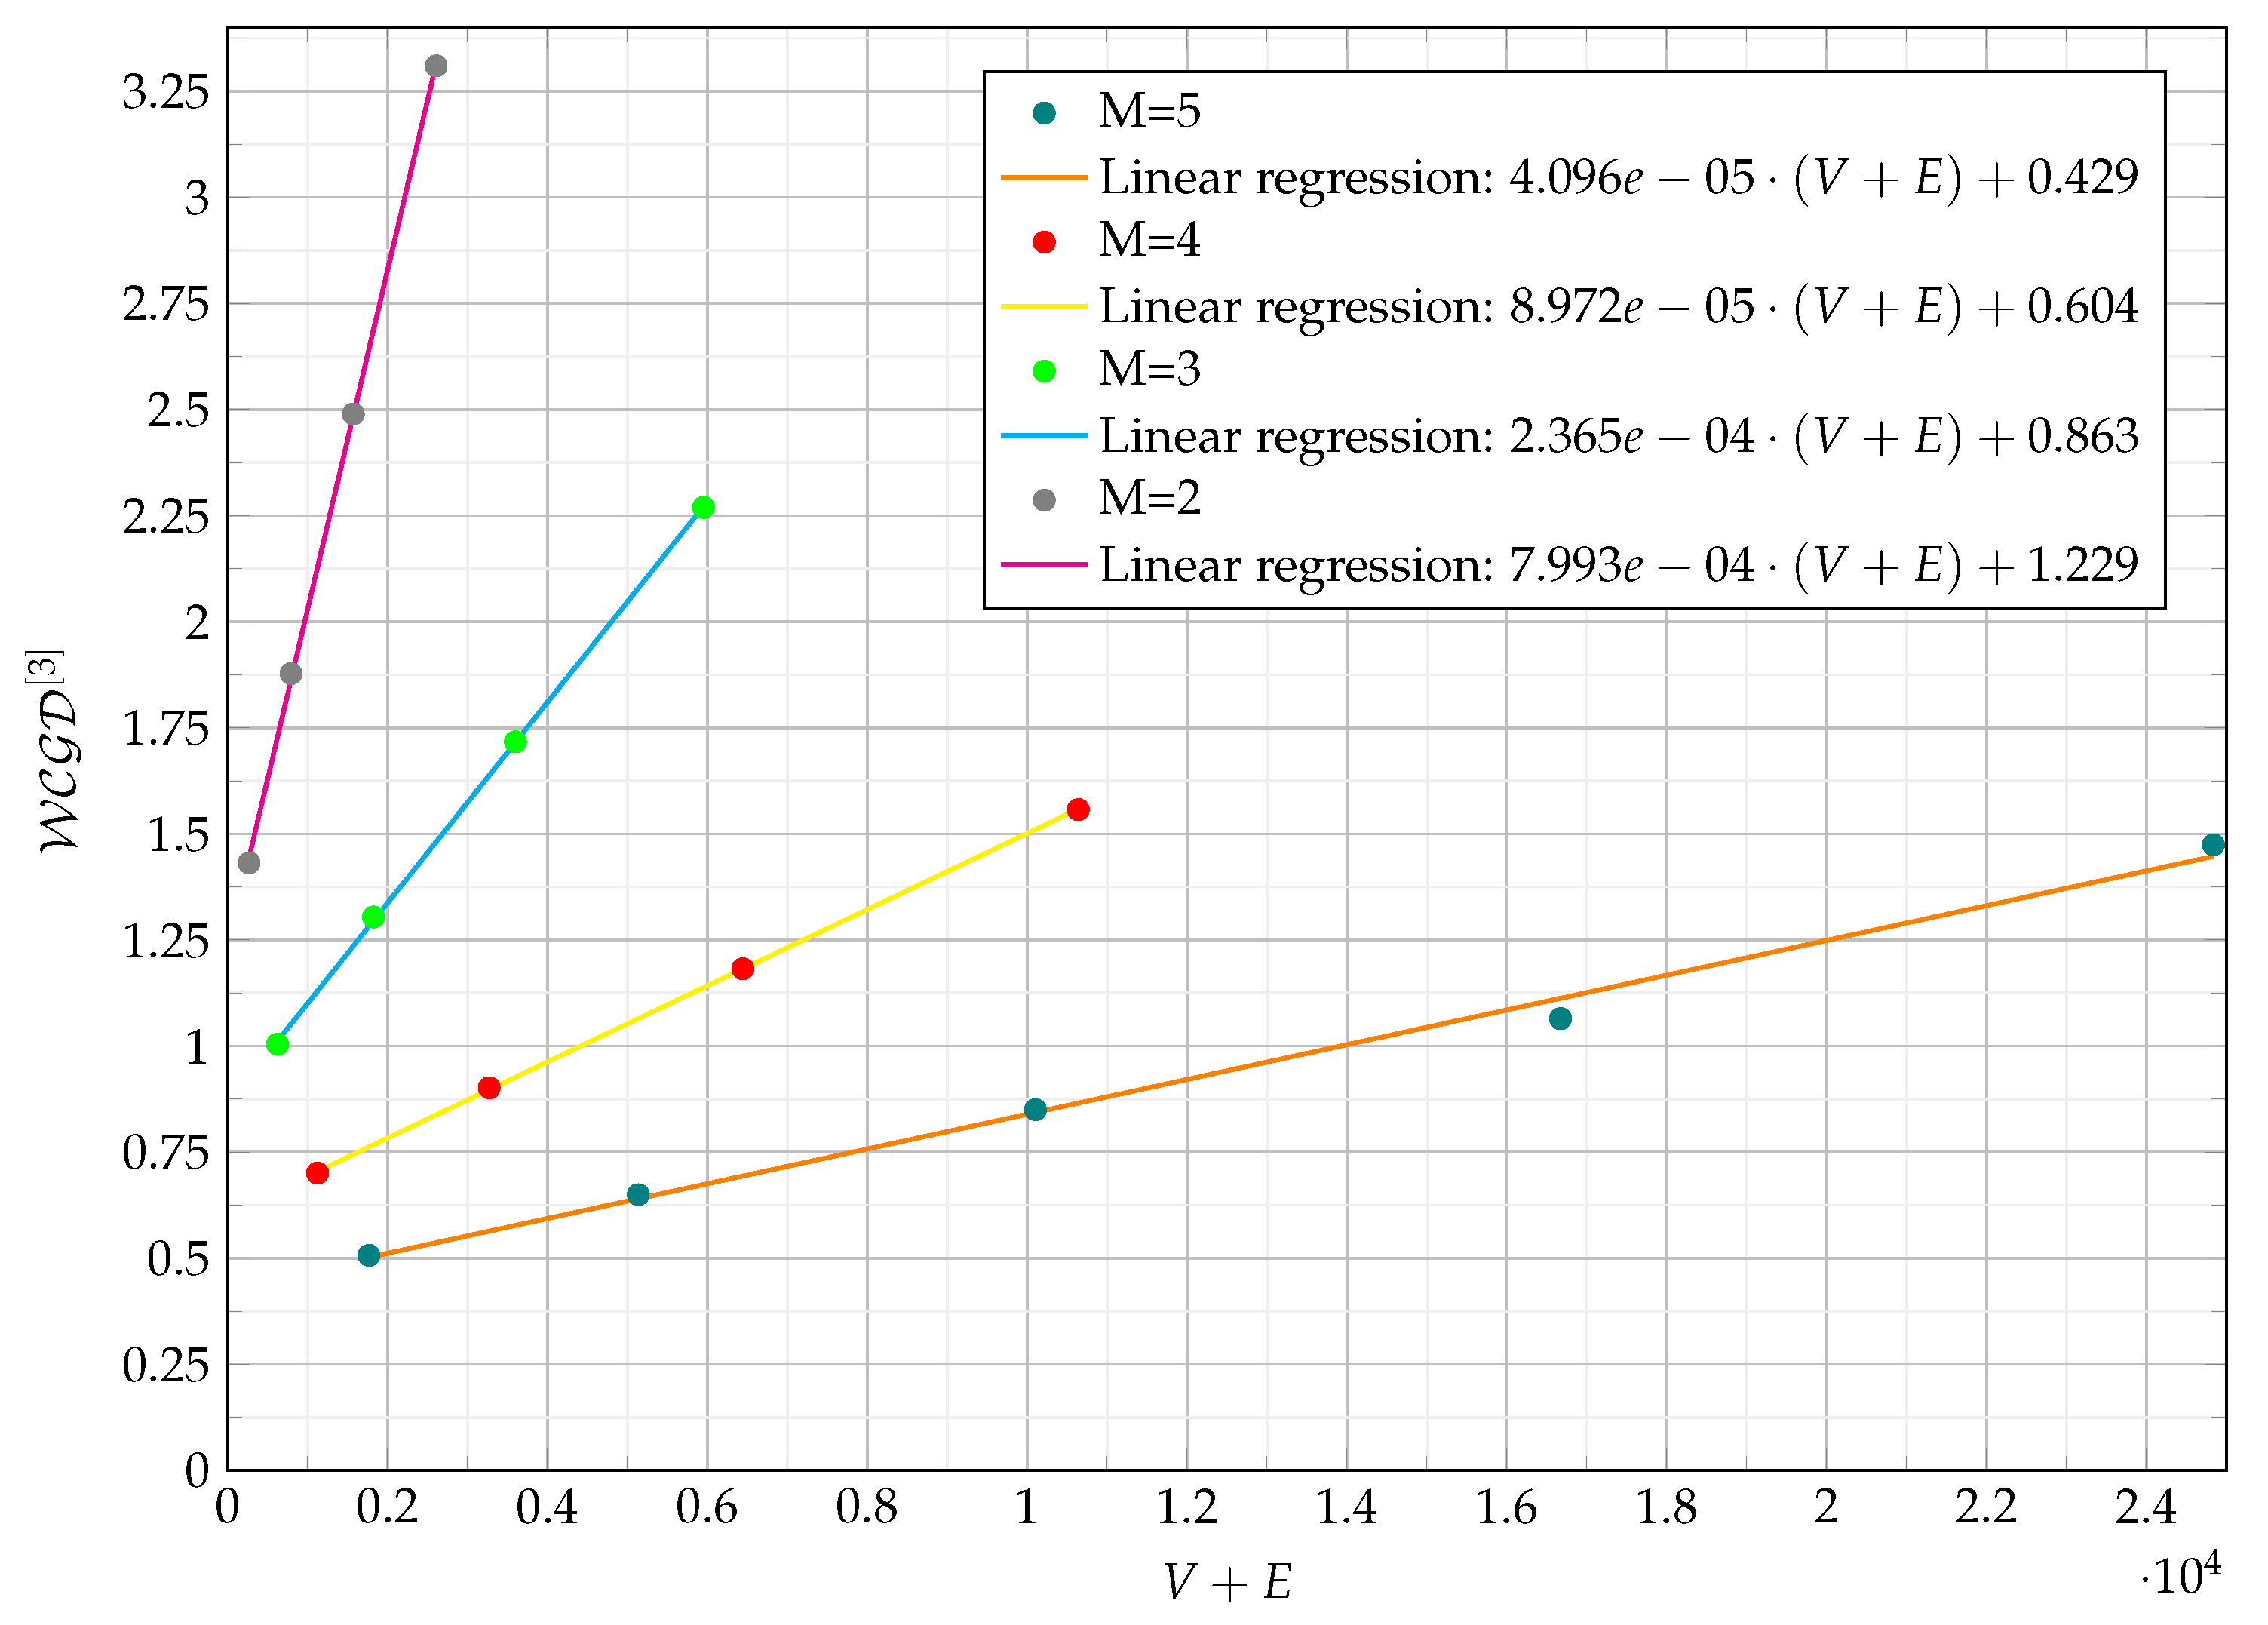
Within the analyzed interval, the average number of neighbors of each vertex is from 6 to . While the average degrees of vertices from 10 to . Let be a function for representing a Chimera graph as a function of V + E. The value set of , is given by the average values of one of the previously defined classical or k-hop-based metrics.
The parameters
N and
M primarily define the characteristic of the function, while
L the offset of
on the
y axis.
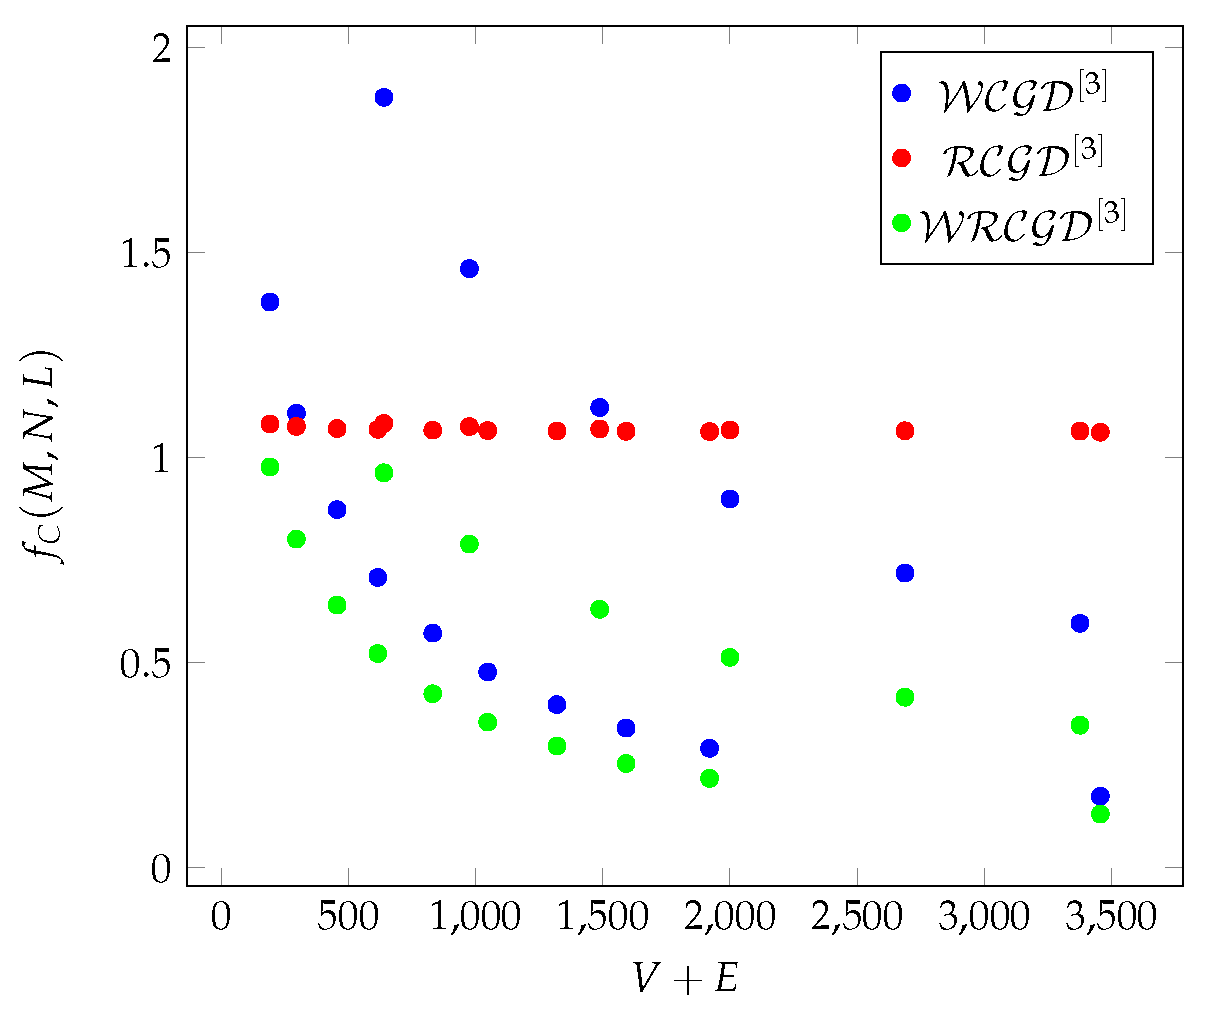
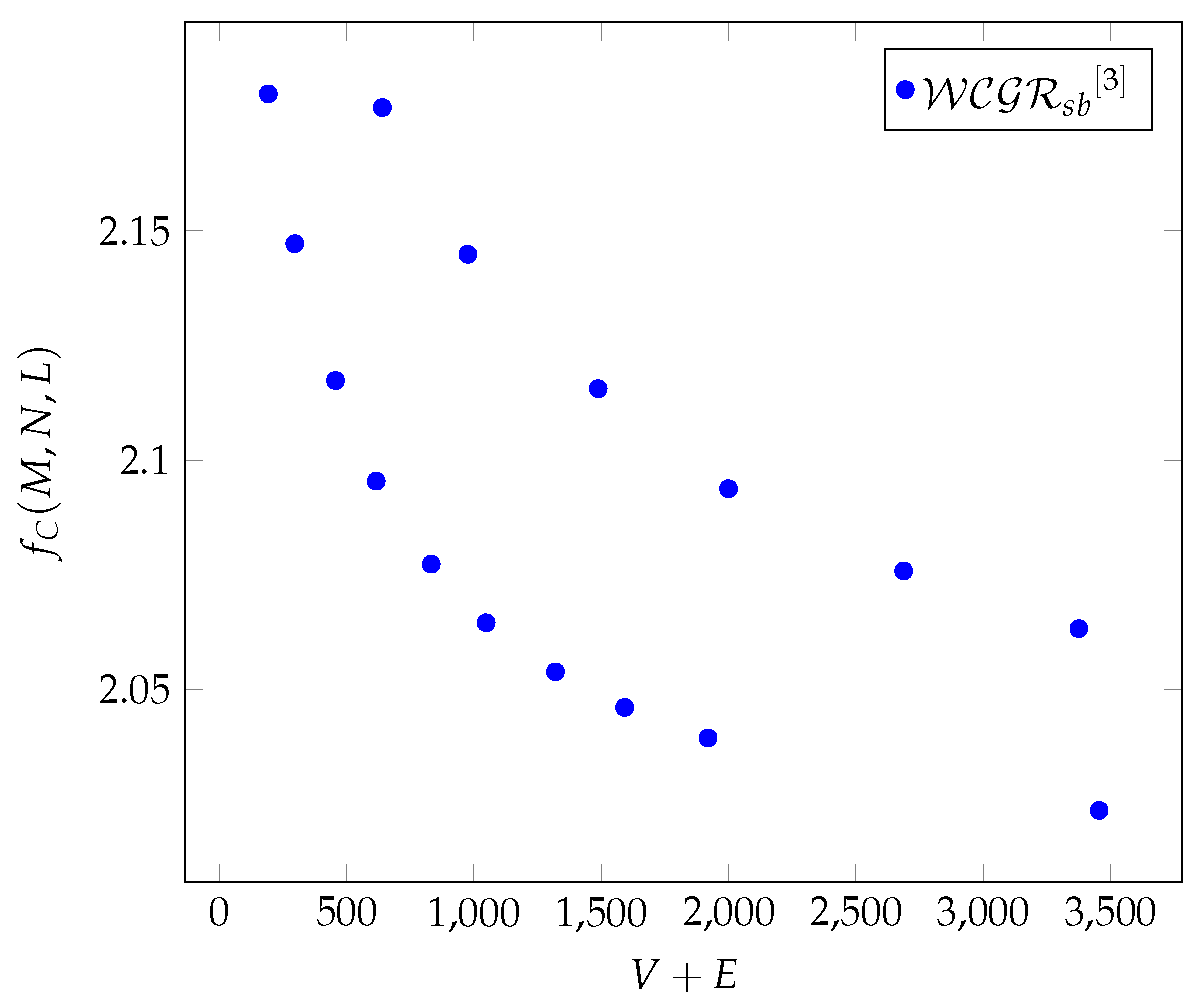
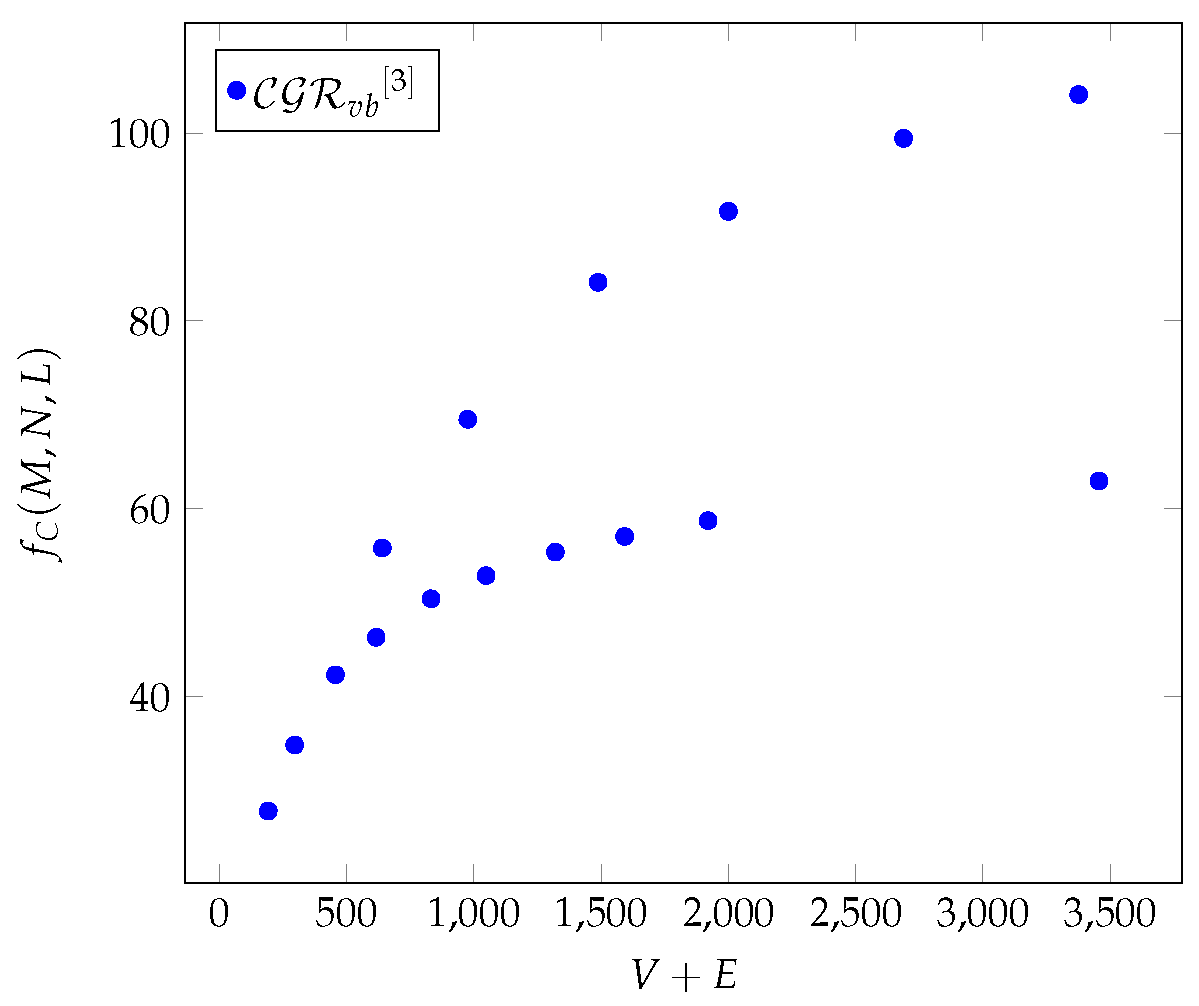
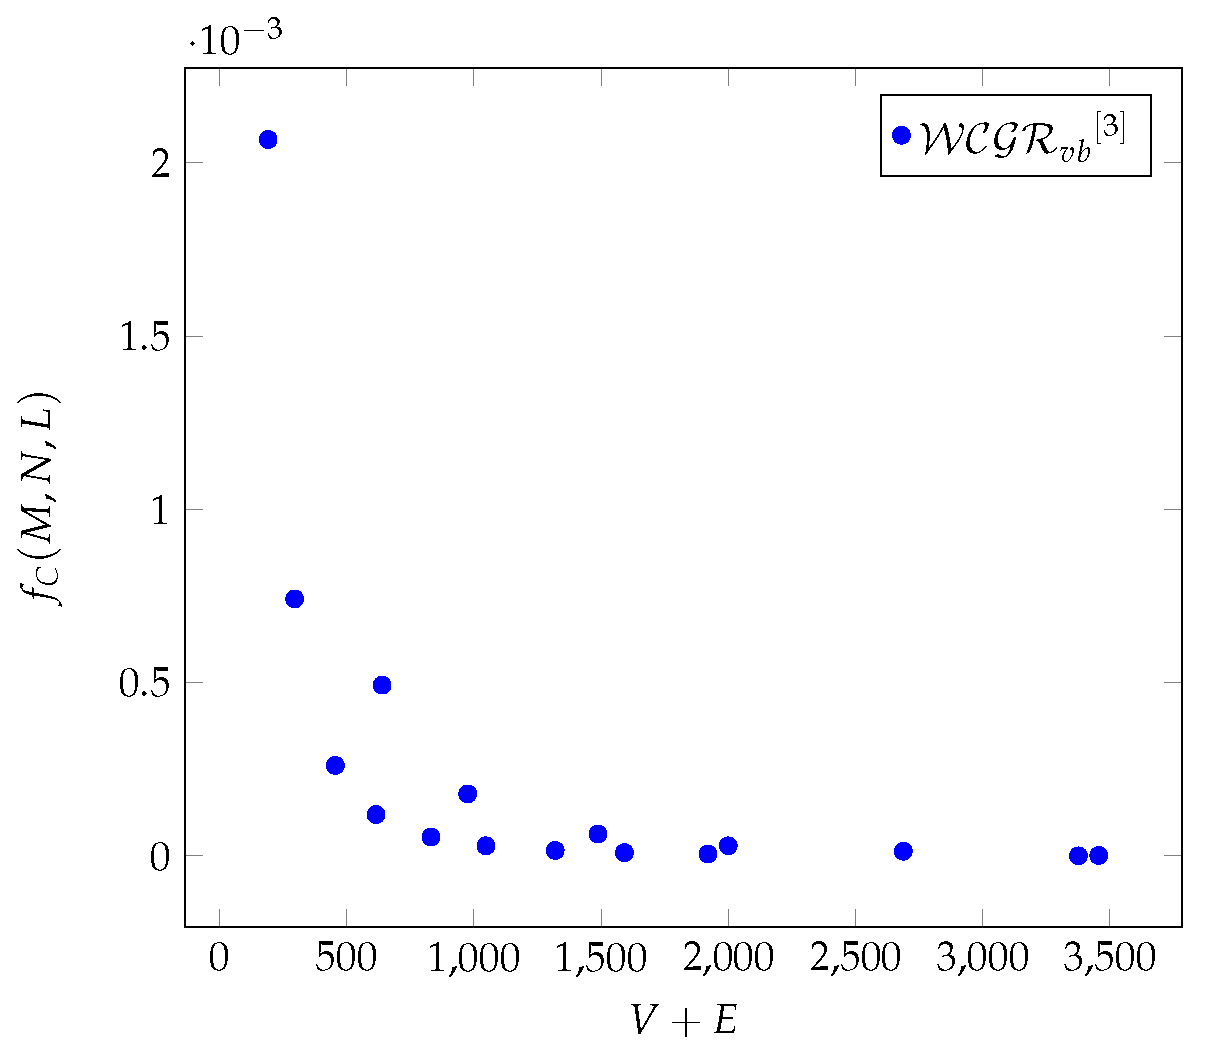
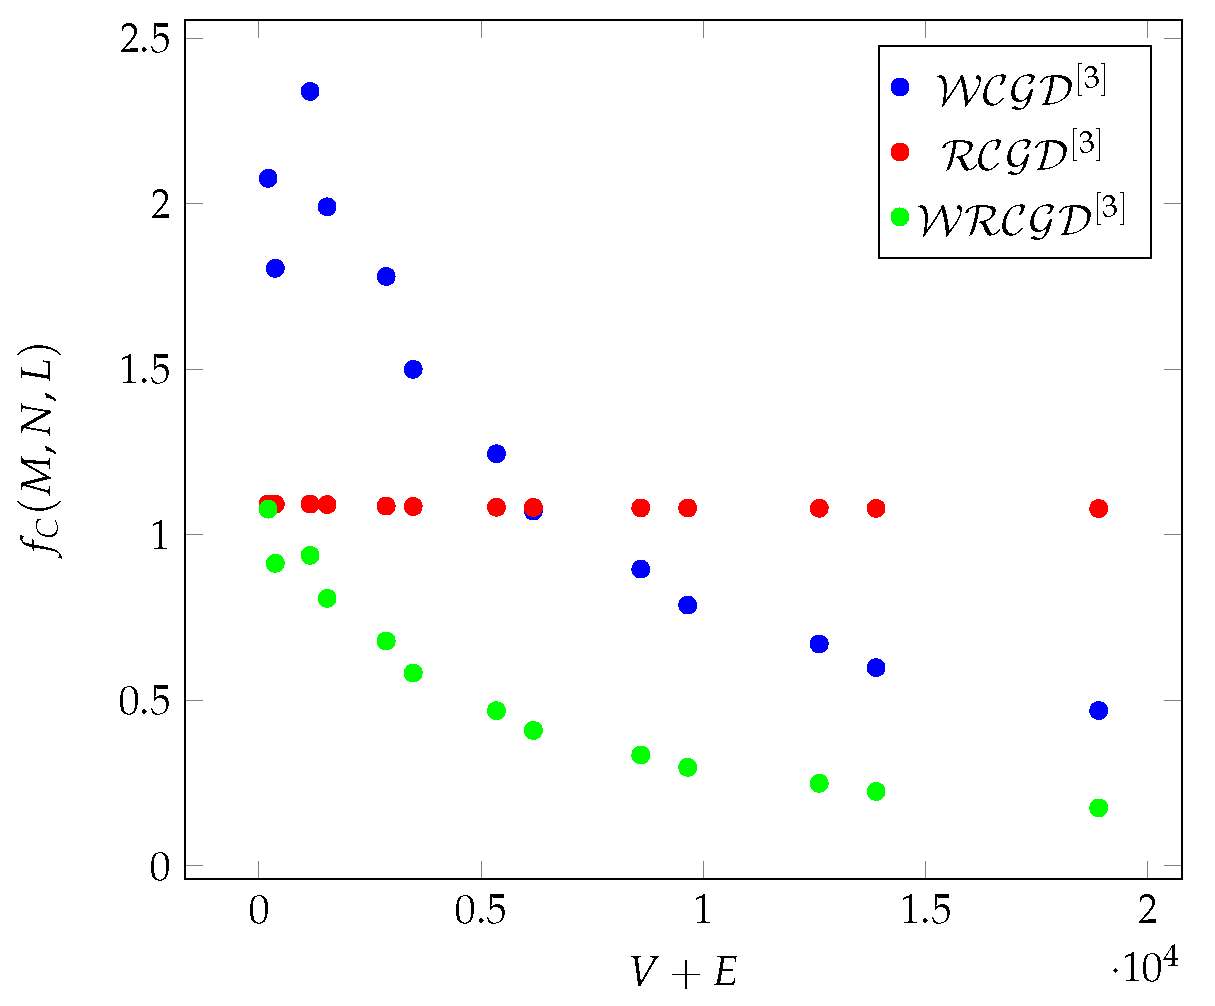
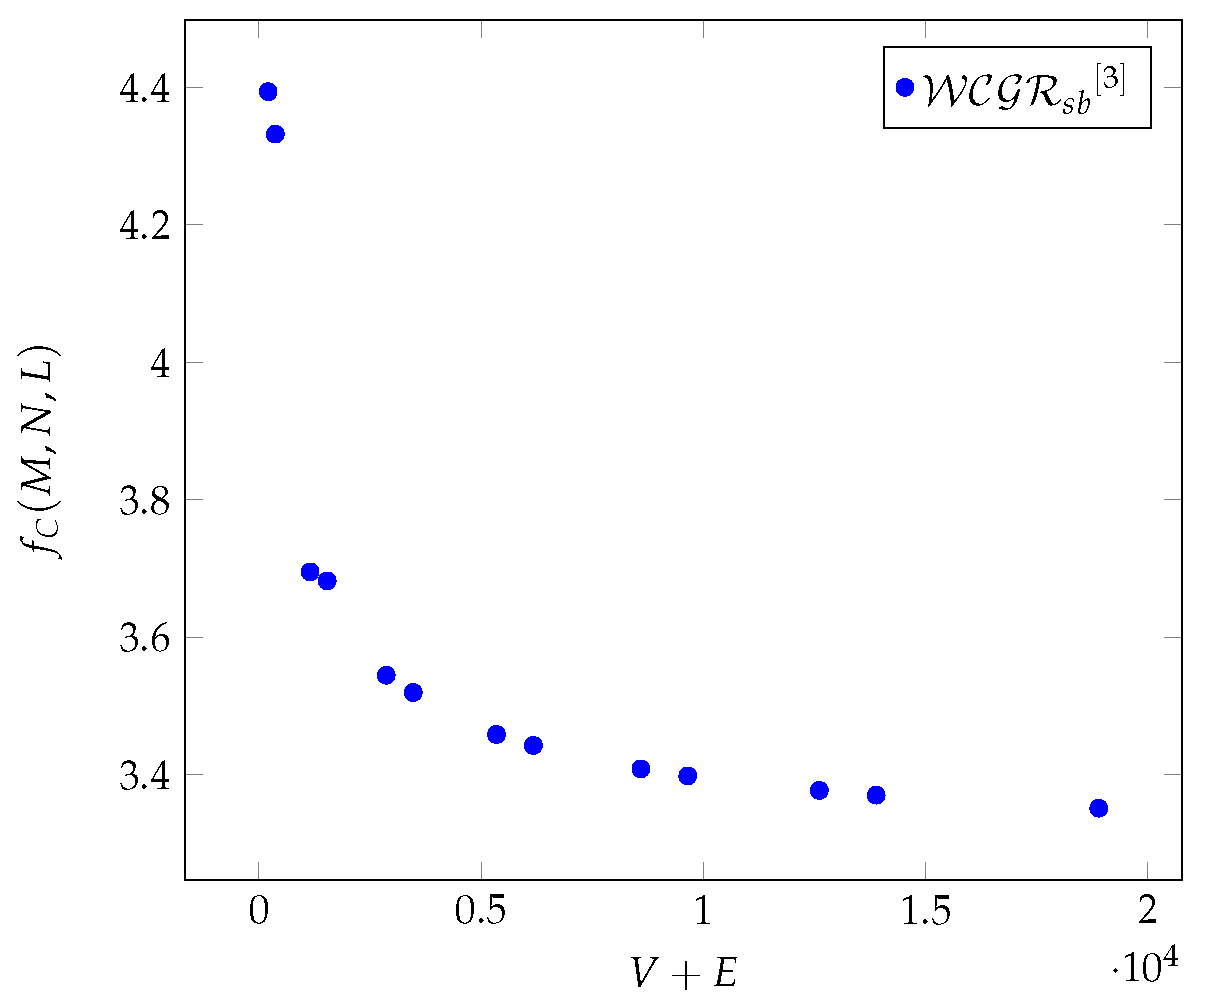
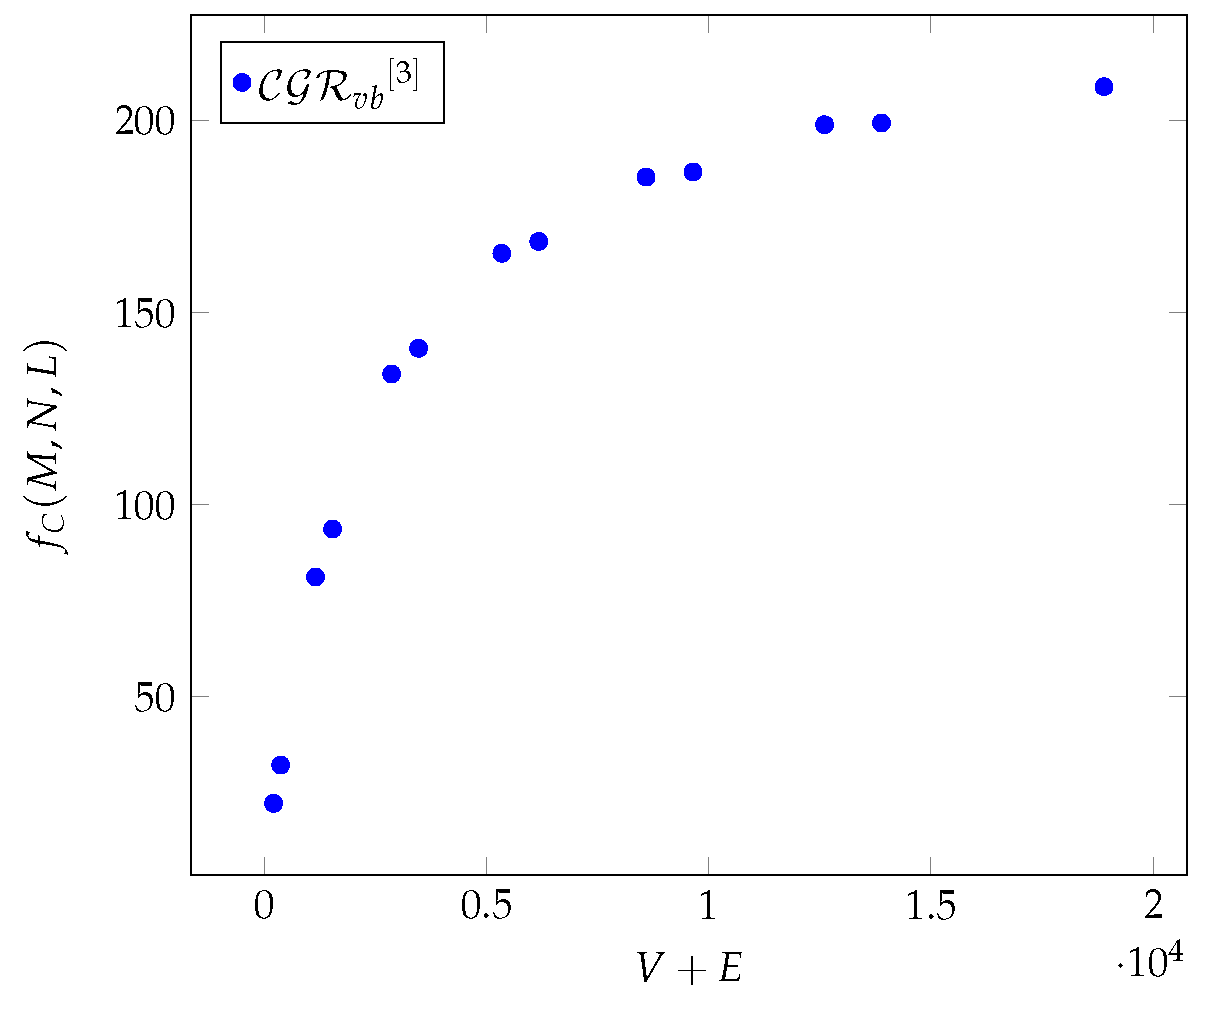
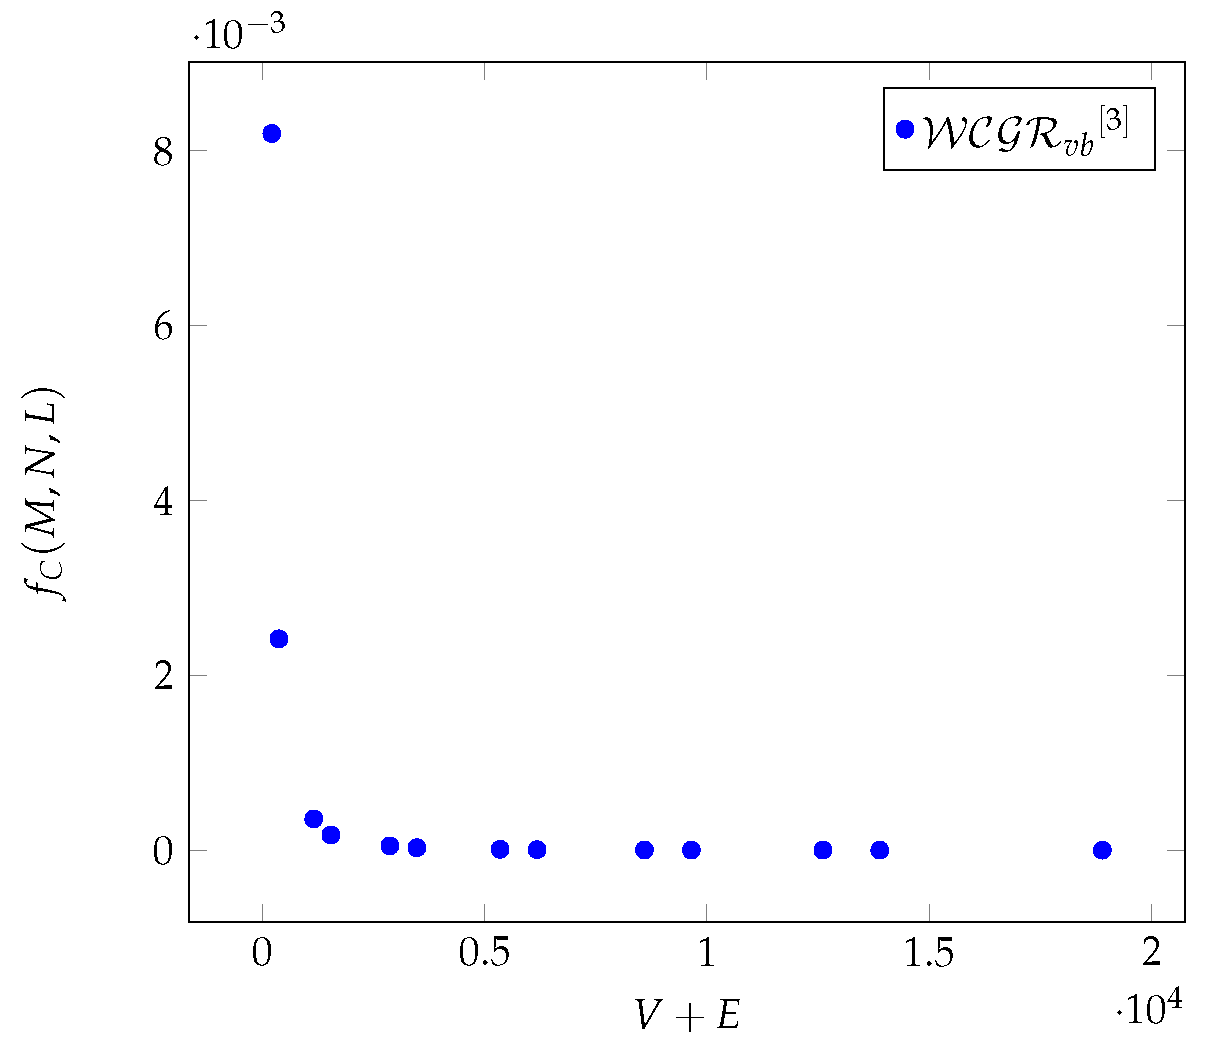
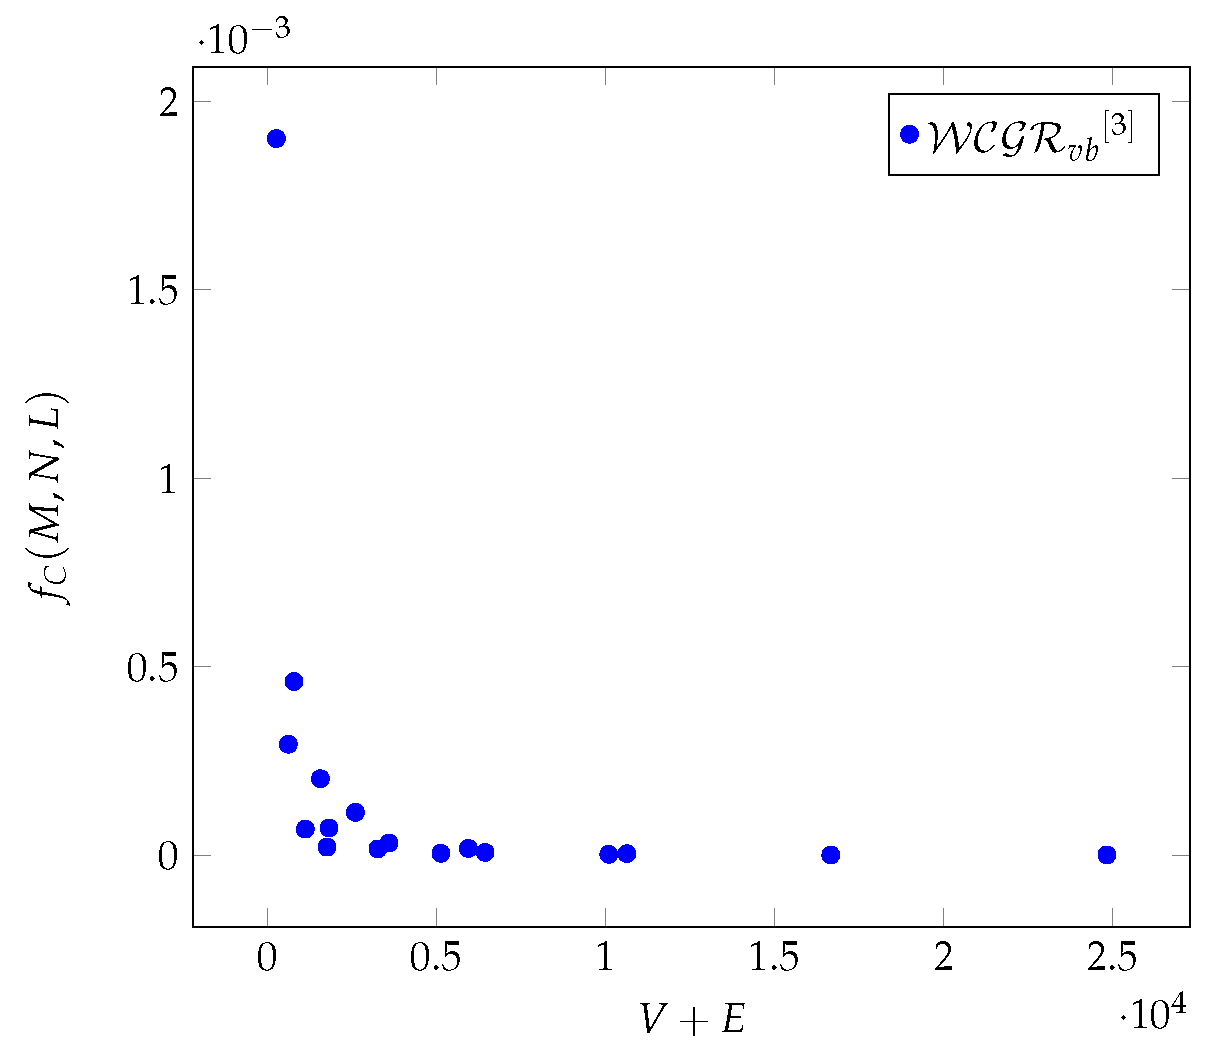
Figure 1,
Figure 2,
Figure 3 and
Figure 4 show
functions of
k-hop-based metrics as a function of
for different Chimera graphs.
Examining the graph in more detail. The redundancy of the entire graph is , and the average value of the cliques is .
Table 1 shows how the average number of vertices and edges in each vertex environment increases as a function of hop number. In this graph, the number of vertices is 512, and the number of edges is 2944. In a 3-hop environment, the average
% of all vertices can be reached from custom vertices, and environments contain
% of all edges on average.
Table 2 and
Table 3 show the average values of density-based and redundancy-based metrics in 1–3 hop environments of vertices.
Figure 8Figure 9 show the relationships between the average values of density and redundancy-based metrics on Chimera graphs in a 3-hop environment.
3.2. Pegasus
The Pegasus topology is a variation of the Chimera architecture. In the case of this topology, each tile has eight qubits arranged in a square, and each qubit is connected to its four nearest neighbors by couplers. The couplers are essentially the connections between qubits. One of the important features of the Pegasus topology is that it also has longer-range couplers that connect qubits between adjacent tiles.
It is suitable for performing more complex calculations than the Chimera-based processors because it allows for more complex interactions between qubits. The Pegasus topology is designed to provide high connectivity and flexibility. Thus, this supports a wider range of quantum algorithms than earlier. In Pegasus, as in Chimera, the qubit’s orientations are vertically or horizontally [
11,
20]. The maximum degree of this
graph is 15. The number of vertices depends on multiple parameters:
u,
w,
k,
z respectively orientation, tile offset, qubit offset, and parallel tile offset.
By definition, has some disconnected components, the contains qubits. The size of the main processor fabric is , the size of the full disconnected graph is . A Pegasus graph that retains the basic characteristics of Chimera can also be created, in this case, the size of the graph is . A contains 1344 qubits and 1288 in the main fabric. The Pegasus graphs were examined under different configurations from to .
Within the analyzed interval, the average number of neighbors of each vertex is from to , while the average degrees of vertices are from to . Let be a function for representing a Pegasus graph as a function of V + E. The value set of is given by the average values of one of the previously defined classical or k-hop-based metrics.
Examining the graph in more detail, the redundancy of the entire graph is , and the average value of the cliques is .
Table 4 shows how the average number of vertices and edges in each vertex environment increases as a function of hop number. In this graph, the number of vertices is 1288 and the number of edges is 17608. In a 3-hop environment average of
% of all vertices can be reached from custom vertices, and the custom environments contain
% of all edges on average.
Table 5 and
Table 6 show the average values of density-based and redundancy-based metrics in 1–3 hop environments of vertices.
Figure 17Figure 18 show the relationships between density and redundancy-based metrics on Pegasus graphs in a 3-hop environment.
3.3. Zephyr
Zephyr provides the topology of
D-Wave’s latest-generation processors. In Zephyr, as in Pegasus and Chimera, qubits are oriented either vertically or horizontally. Zephyr topology includes the basic coupler types of both Chimera and Pegasus, with two odd couplers, two external couplers, and sixteen internal couplers. In this topology, the nominal length and degree of qubits are, respectively, 16 and 20. The two basic parameters of the Zephyr
are
M (grid parameter) and
T (tile parameter).The maximum degree of this graph is
, and the number of nodes is
[
12,
29].
The number of edges depends on parameter settings:
The Zephyr index of a vertex in a Zephyr lattice depends on multiple parameters: u,w,k,j,z, respectively orientation, perpendicular block (major) offset, qubit index (secondary offset), shift identifier (minor offset), parallel tile offset. The consist of 84 vertices and 540 edges and the contains 168 and 1656. The Zephyr graphs were examined under different configurations from to .
Within the analyzed interval, the average number of neighbors of each vertex is from to . While the average degrees of vertices are from to . Let be a function for representing a Zephyr graph as a function of V + E. The value set of is given by the average values of k-hop-based metrics.
Examining the graph in more detail, the average values of the classic metrics: degree centrality, betweenness centrality, closeness centrality, eccentricity, clustering coefficient in hop environment naturally are the same, and respectively: , , , , . The redundancy of the entire graph is , and the average value of the cliques is .
In this graph, the number of vertices is 1100 and the number of edges is 23740. In a 3-hop environment average of % of all vertices can be reached from custom vertices, and the custom environments contain % of all edges on average.
In addition to
, the tables (
Table 7 and
Table 8) also show the average values of Zephyr graphs
to
.
Figure 26 and
Figure 27 show the relationships between density and redundancy-based metrics on Zephyr graphs in a 3-hop environment.
Table 7 shows how the average number of vertices and edges in each vertex environment increases as a function of hop number.
Table 8 and
Table 9 show the average values of density-based and redundancy-based metrics in 1–3 hop environments of vertices.
4. Comparison and Analysis
We examine the density-based metrics interpreted in the
k-hop environment, where
, notedly the
, the
and the
. In the case of Chimera graphs,
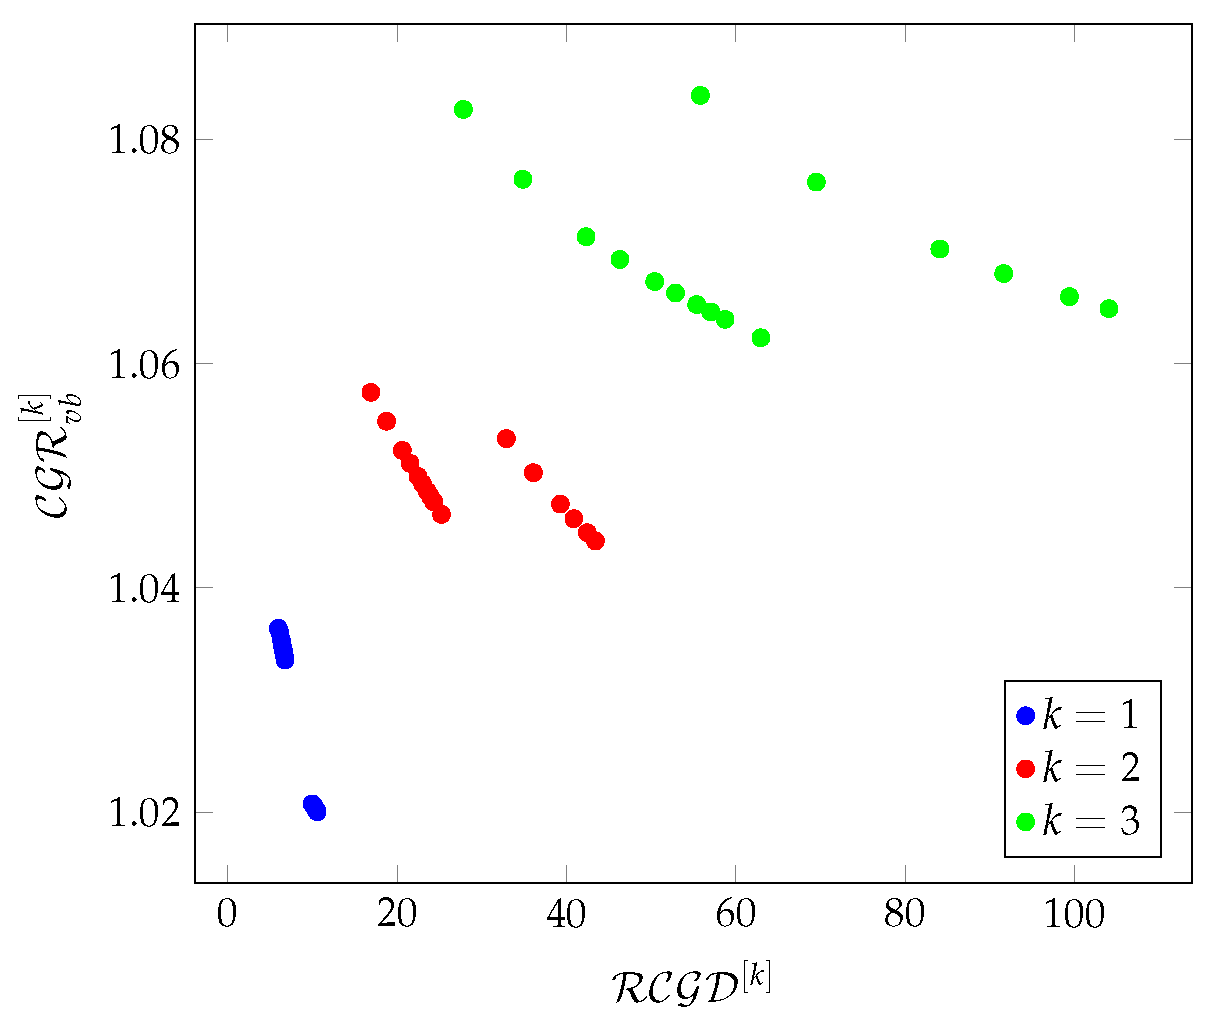
shows (see in
Figure 1(green)) the same characteristics as the degree and the closeness centrality, with the difference that
more clearly shows the differences resulting from different
L values. In the case of Pegasus, also they show (see in
Figure 10(green)) the same character as the degree and the closeness centrality [
6]. In the case of Zephyr, the
metric shows a completely different character.
Figure 16(green) shows the increase of the
values as a function of the
parameters. In the case of
, the linear regression is assigned to the series of points:
where
.
Figure 1(red),
Figure 10(red) and
Figure 19(red) show that the
values are similar for all three graphs, there are no essential differences. The
values move around a constant value as a function of
.
In the case of Chimera graphs,
shows (see in
Figure 1(green)) same characteristics as the degree, the closeness centrality and the
[
6]. In the case of Pegasus graphs, also they show a same character as the degree, the closeness centrality and the
[
6]. It can be seen in
Figure 10(green) that
shows a decreasing constant-like value depending on the increase of the
M parameter (independent of the
T parameter).
We examine the redundancy-based metrics interpreted in the k-hop environment, where , notedly the , the and the .
Among the redundancy-based metrics, let is first look in more detail at the values shown by the
metric.
Figure 3,
Figure 12 and
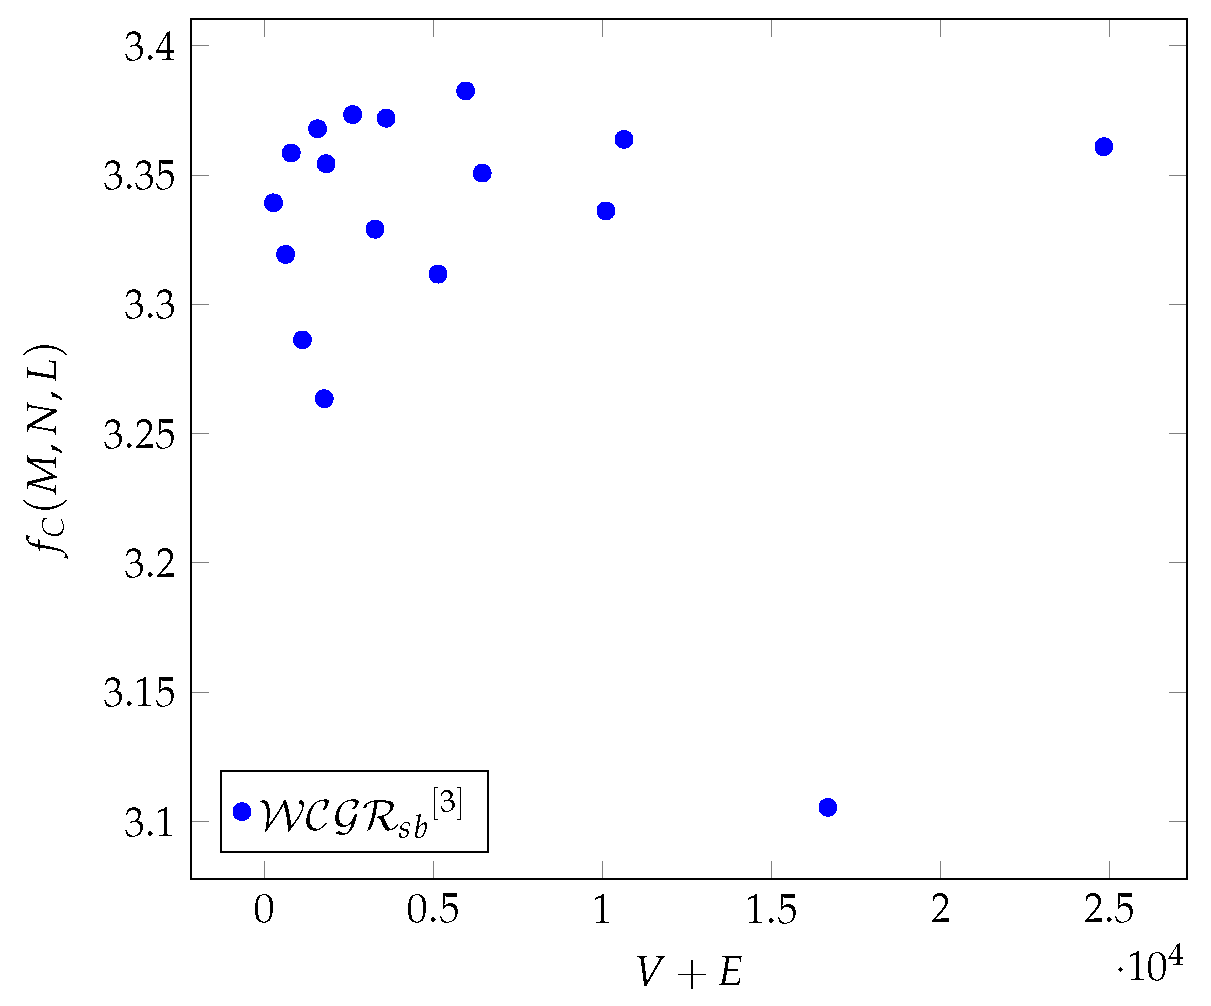
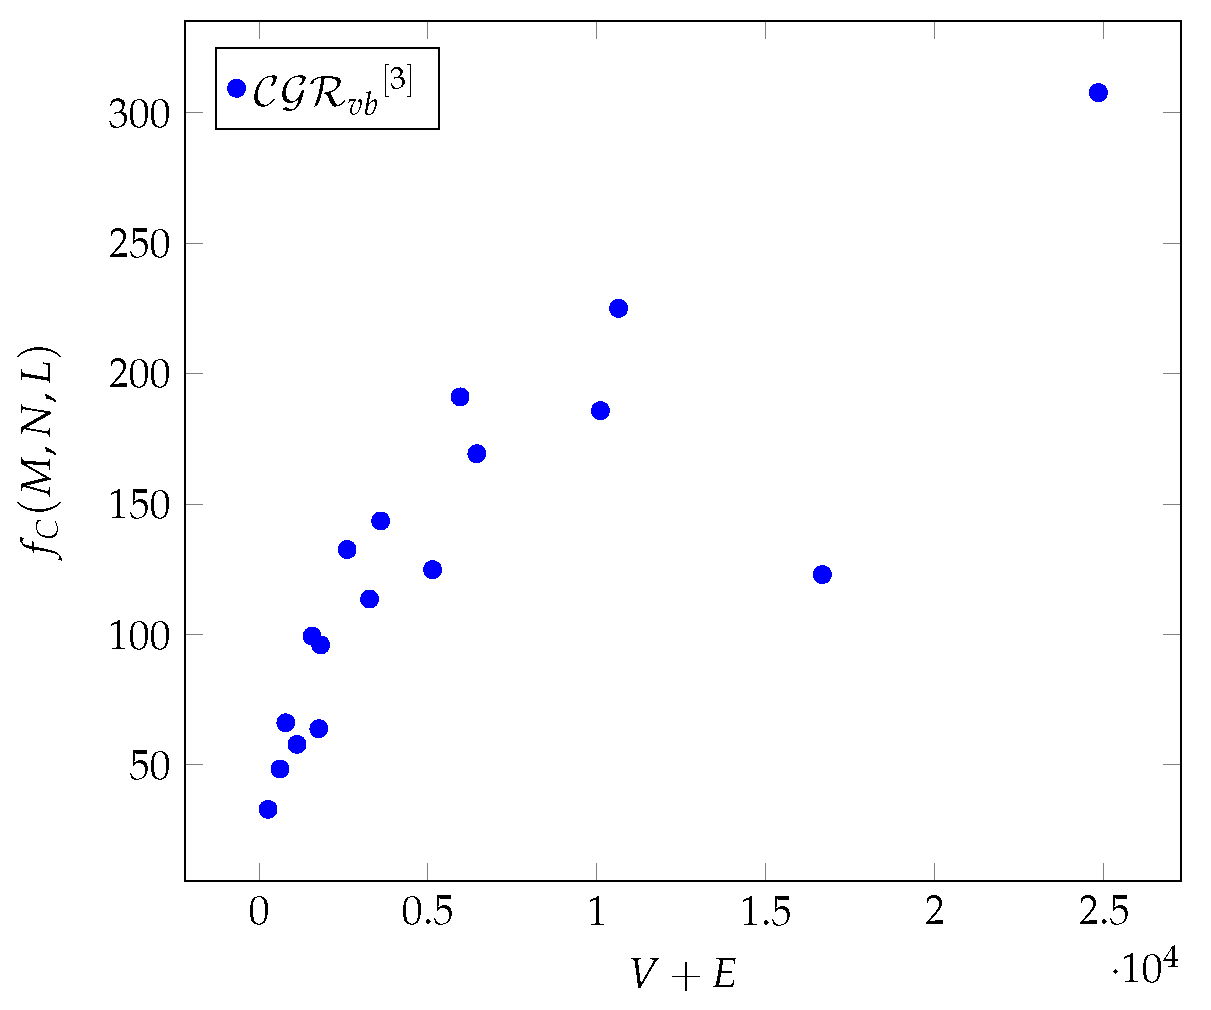
Figure 21 show that all three graphs show a logarithmic increase in the case of
, and in the case of the Chimera and Zephyr graphs, the differences resulting from the values of
L and
M are clearly visible.
In the case of Chimera graphs,
shows (see in
Figure 2) same characteristics as the closeness centrality and the
[
6]. In the case of Pegasus, they show (see in
Figure 11) a same character as the betweenness centrality [
6]. For Zephyr graphs, it shows (see in
Figure 20) the same characteristics as the
.
Figure 4,
Figure 13 and
Figure 22 show that the
shows the same characteristics as the composition of degree and betweenness centrality, in all three graph cases [
6].
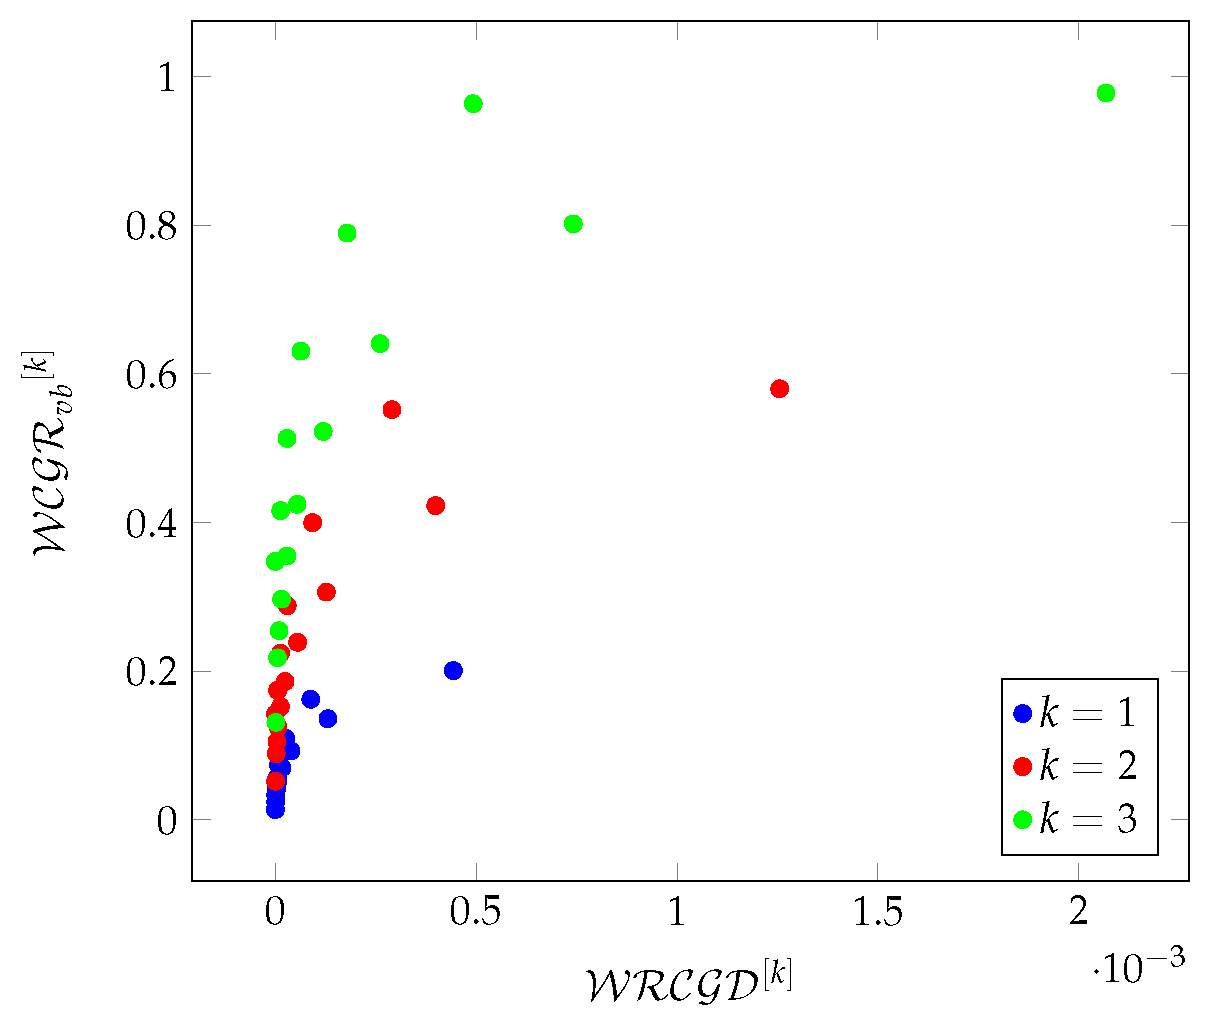
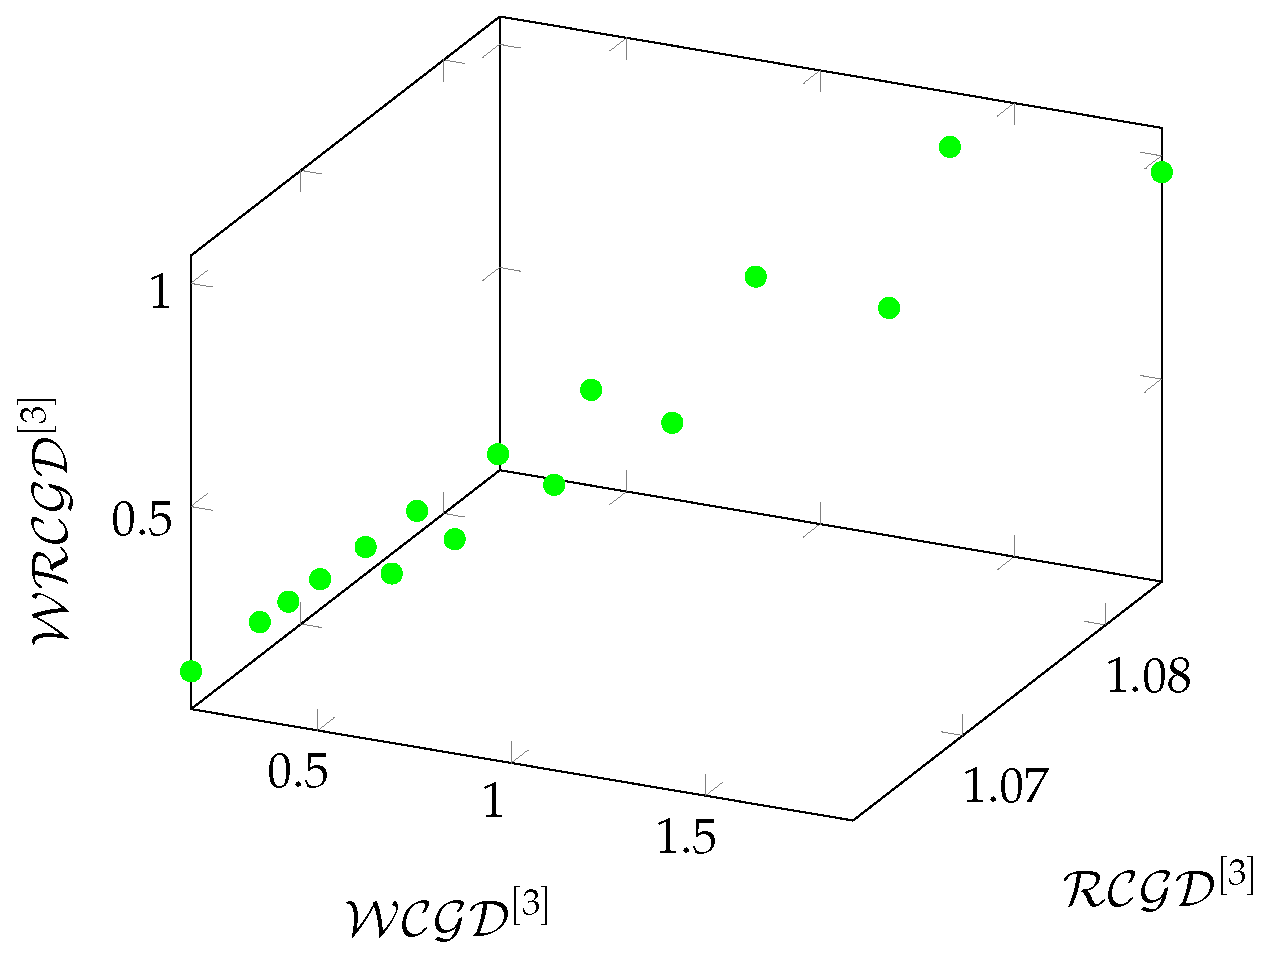
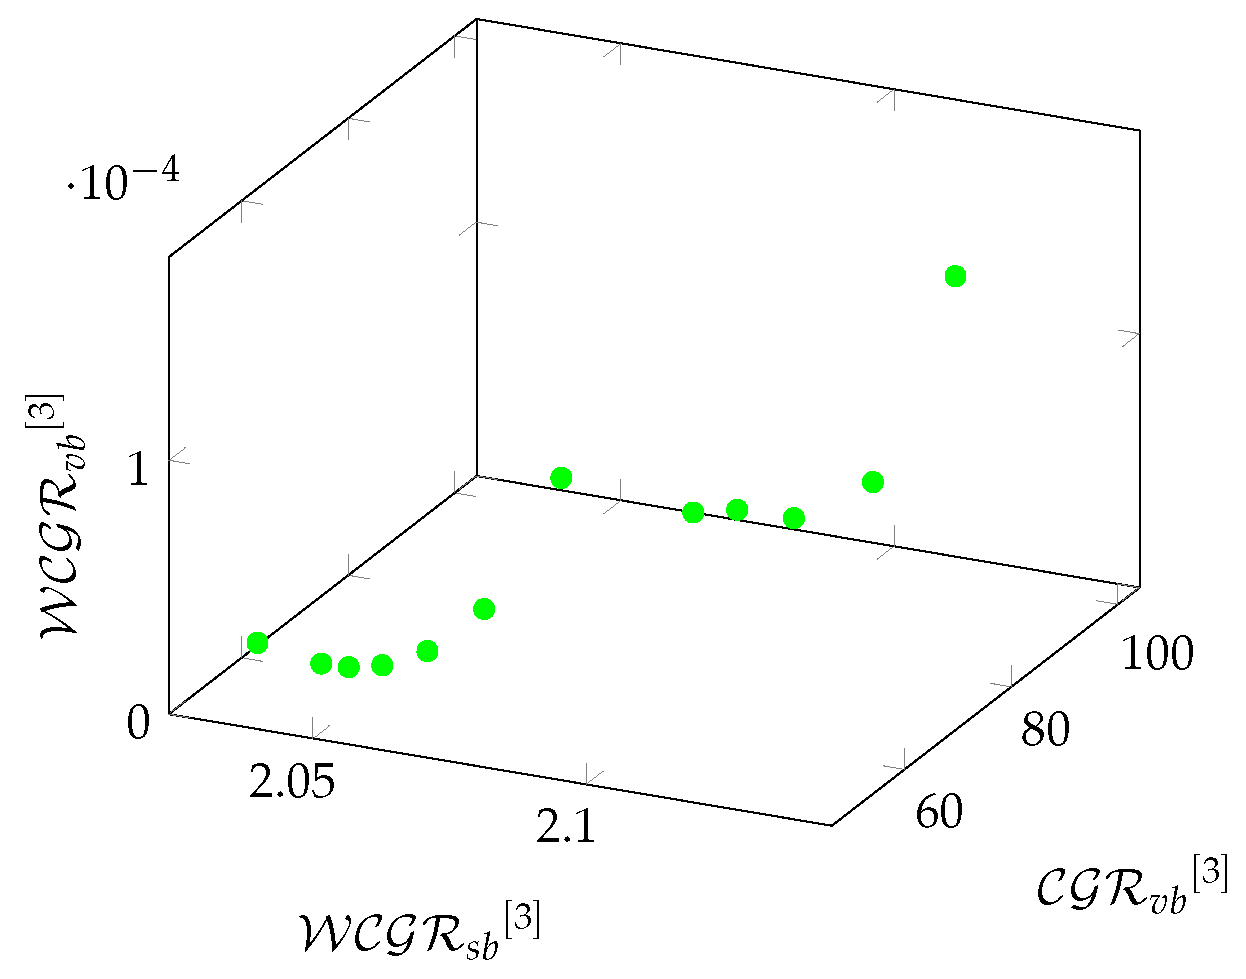
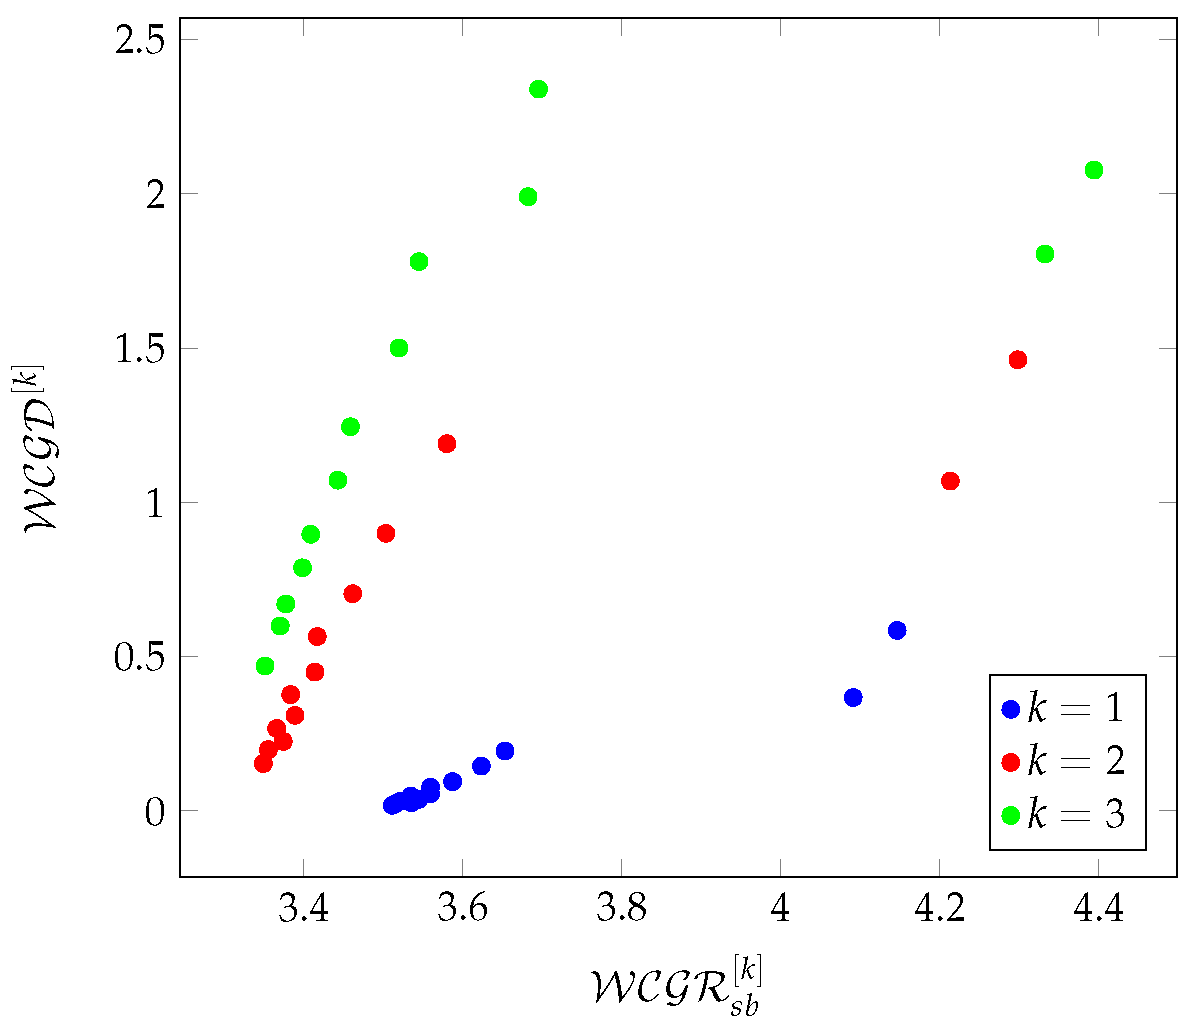
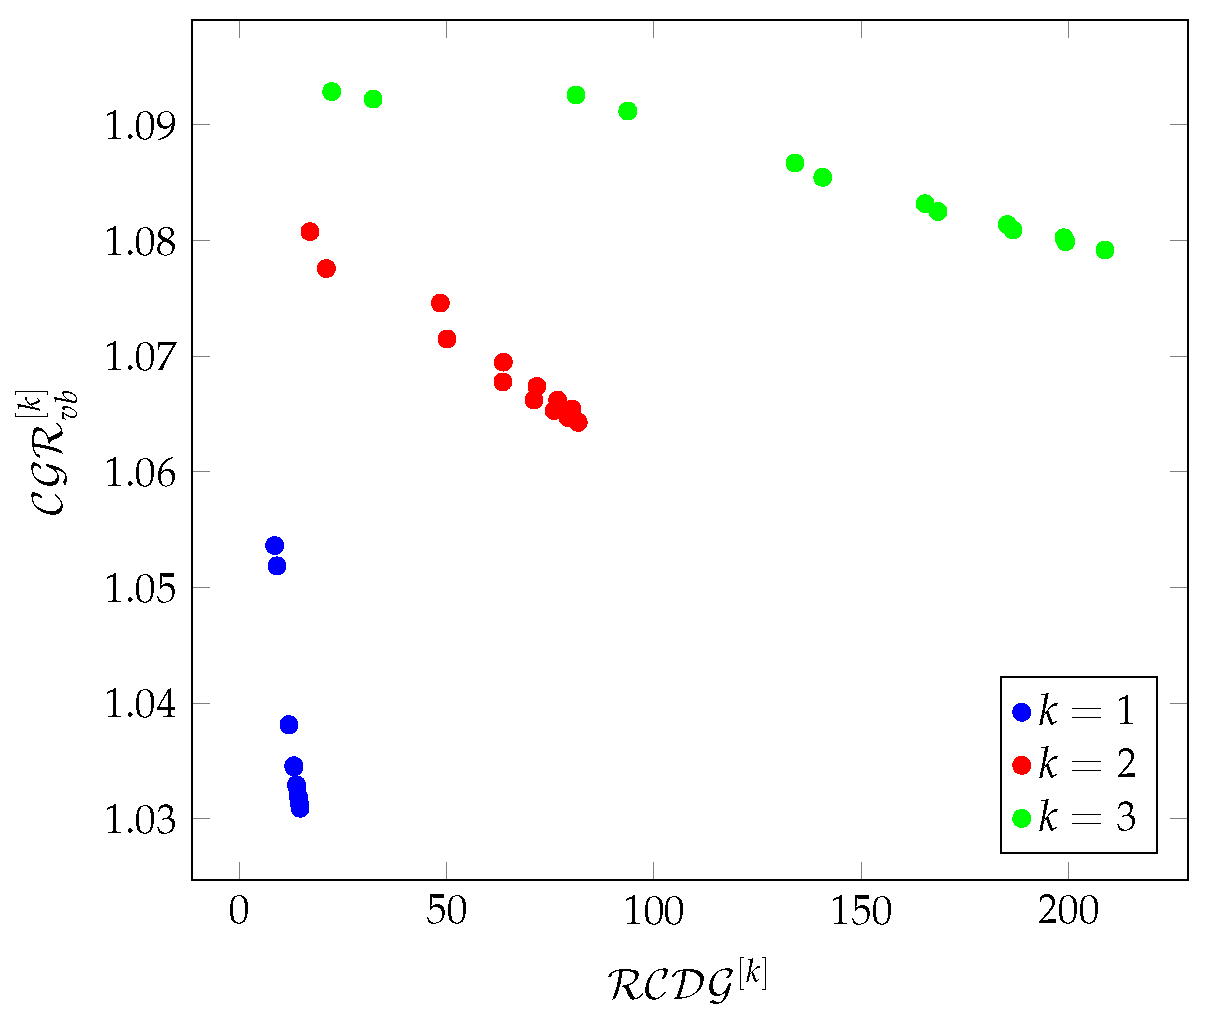
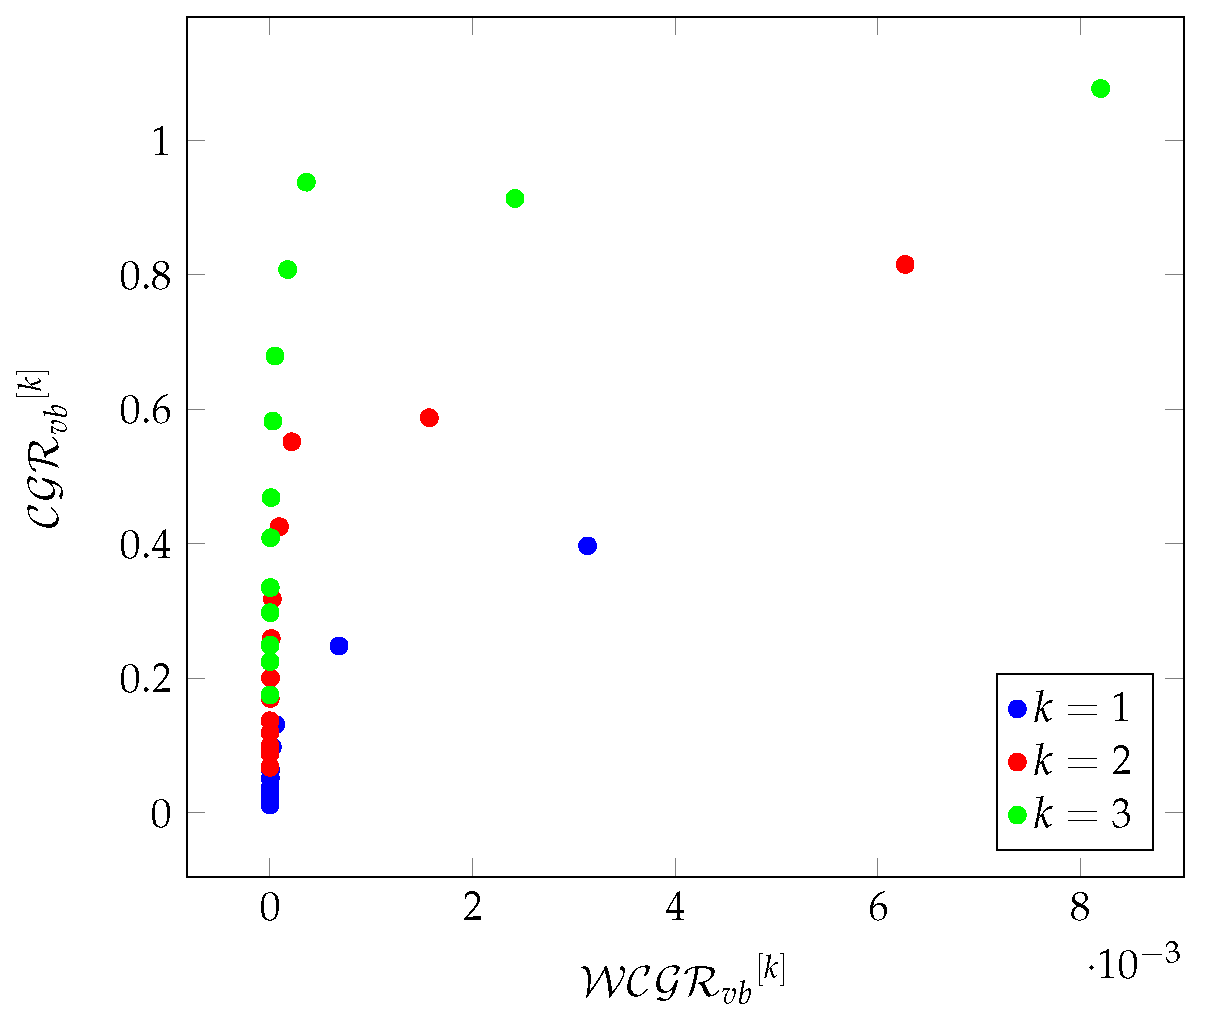
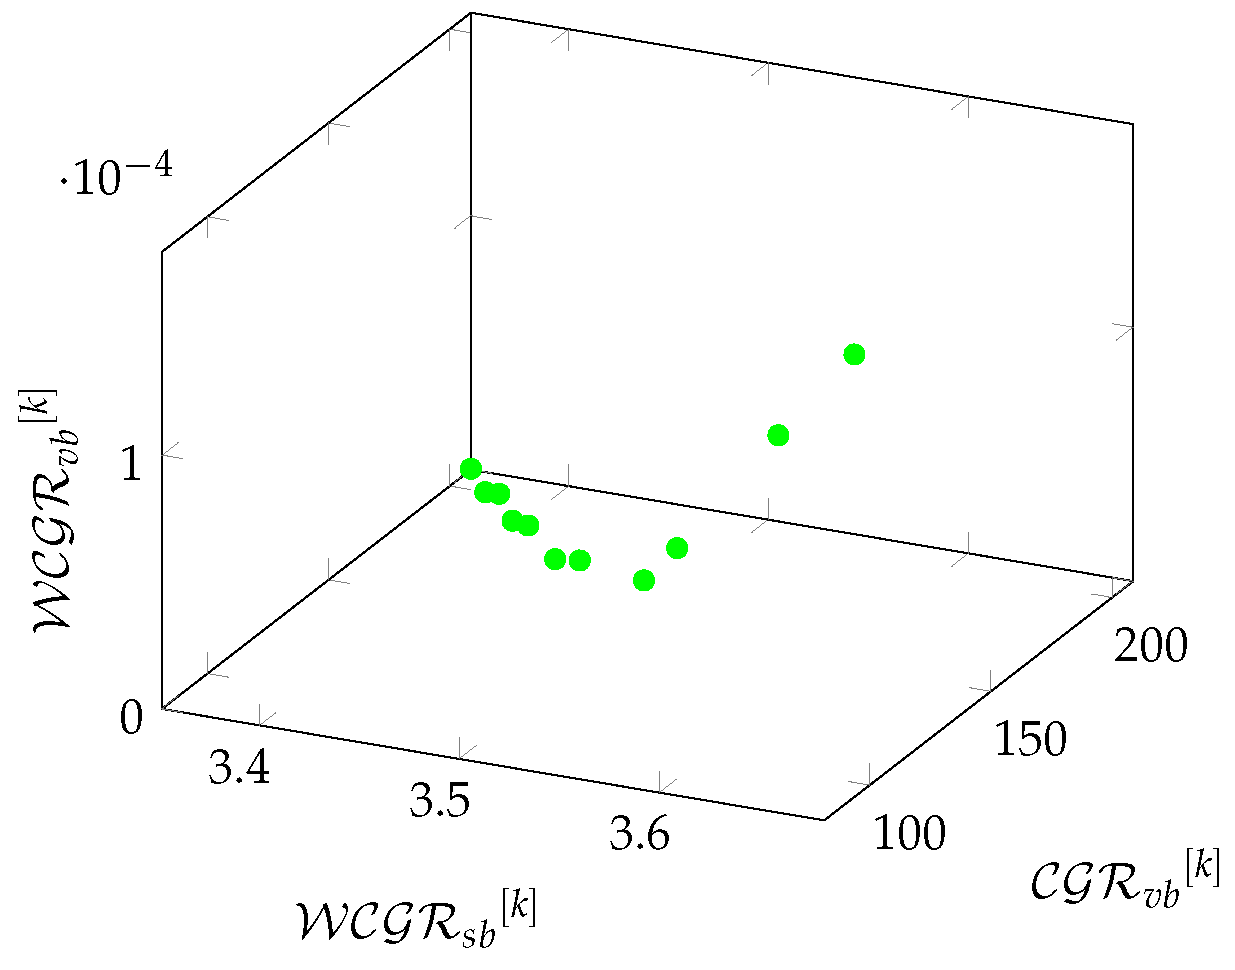
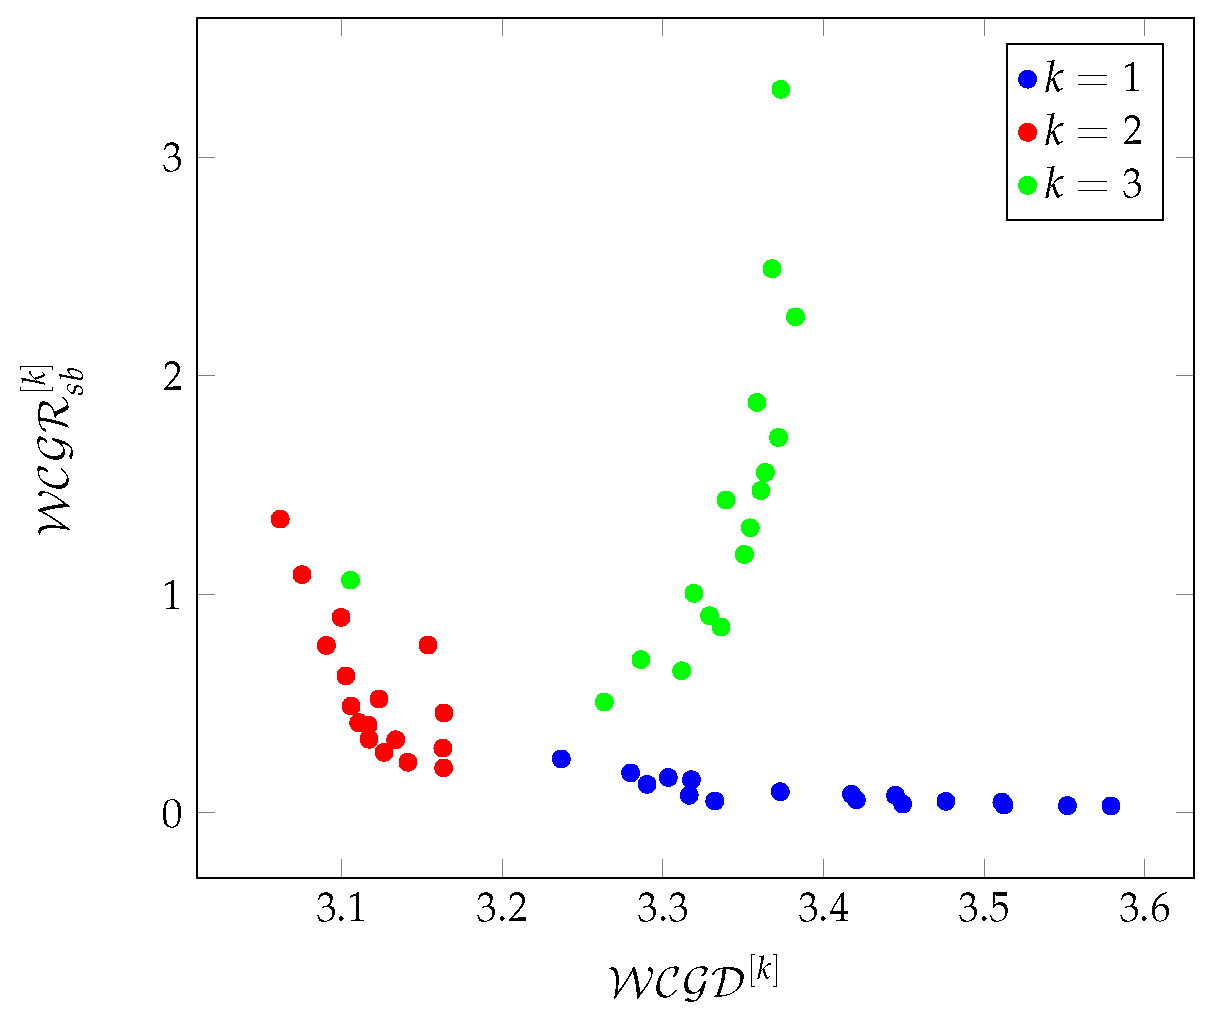
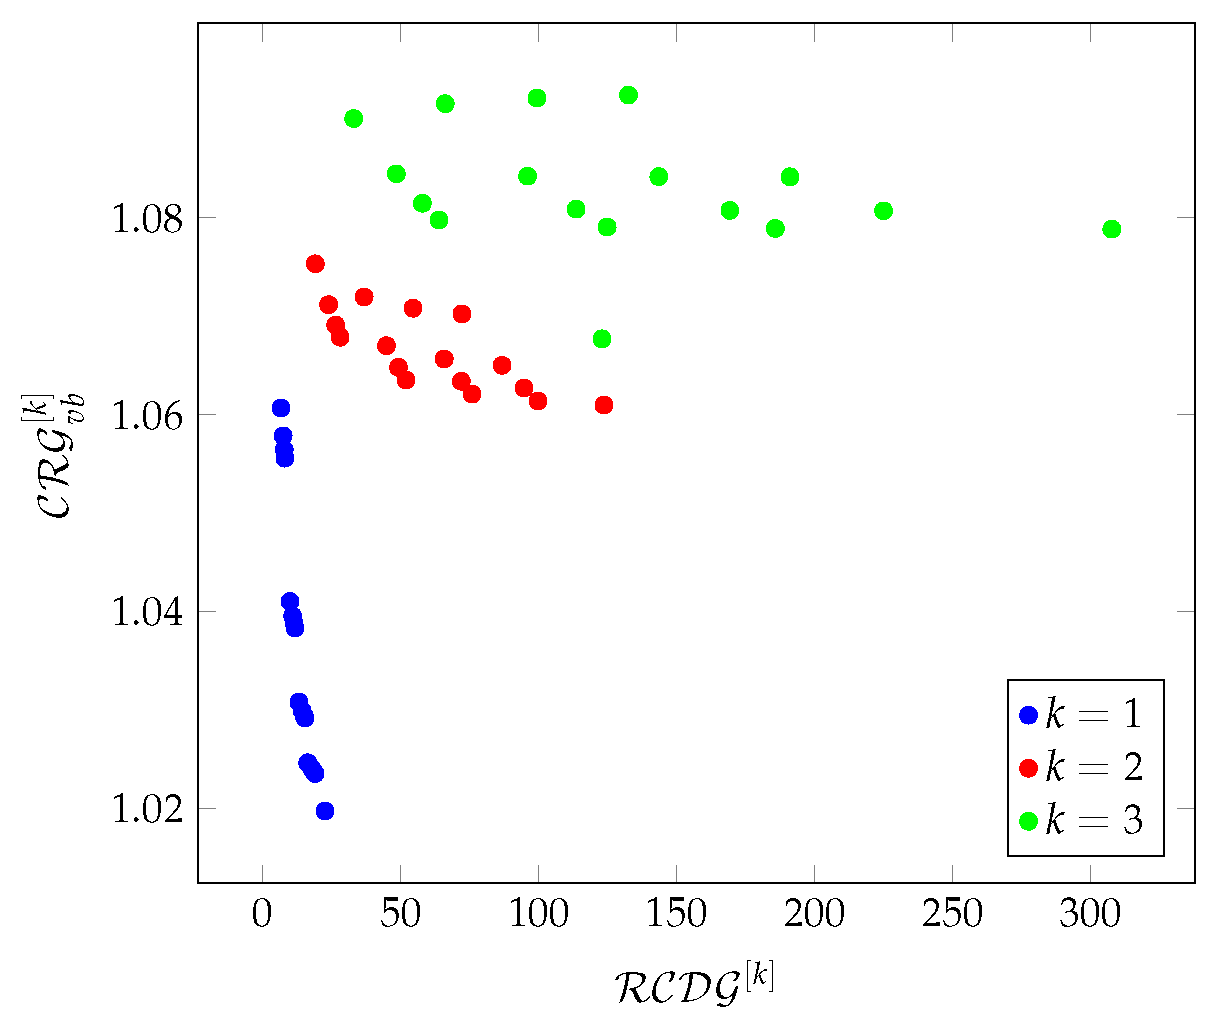
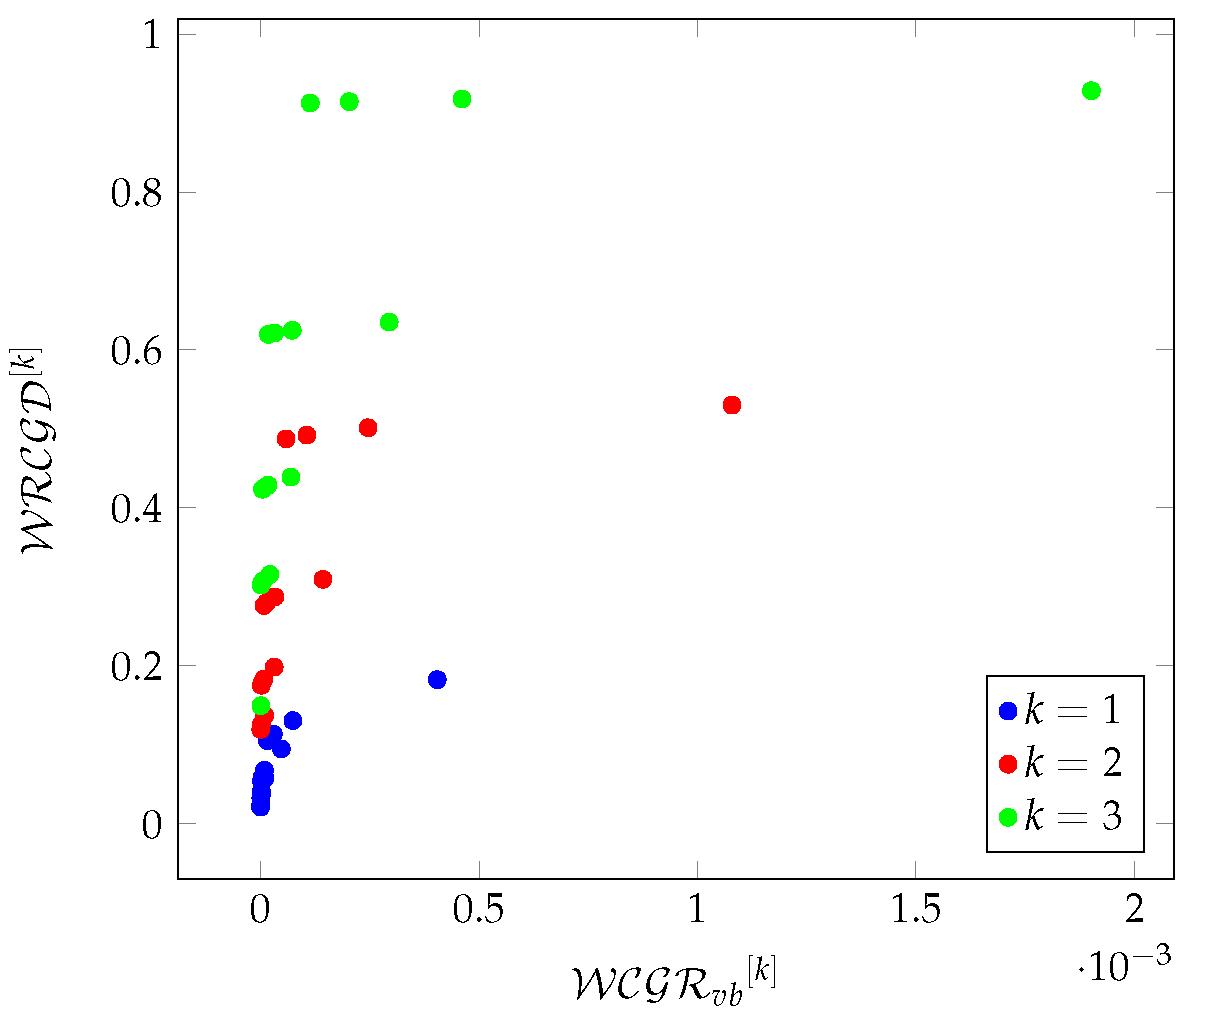
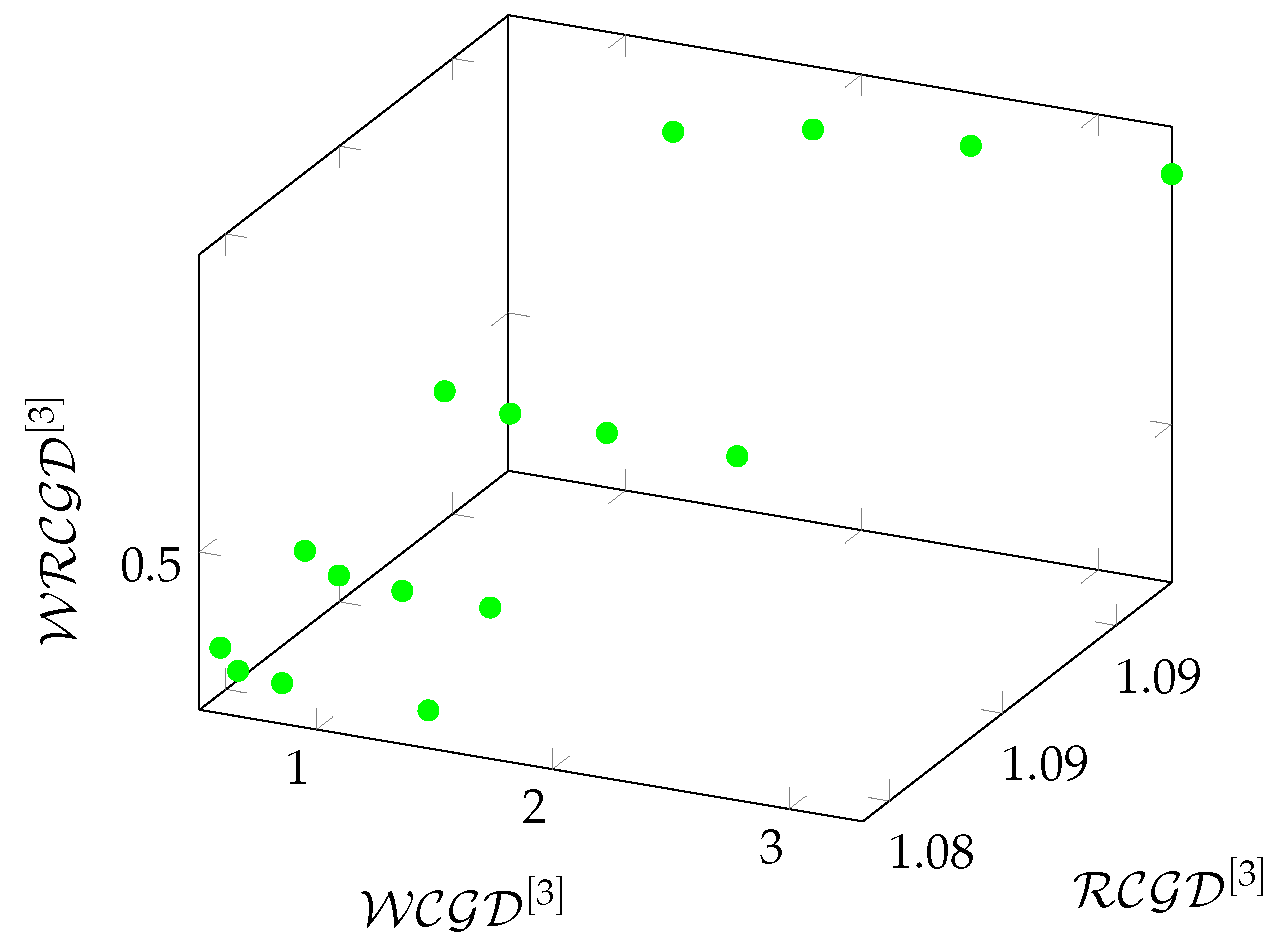
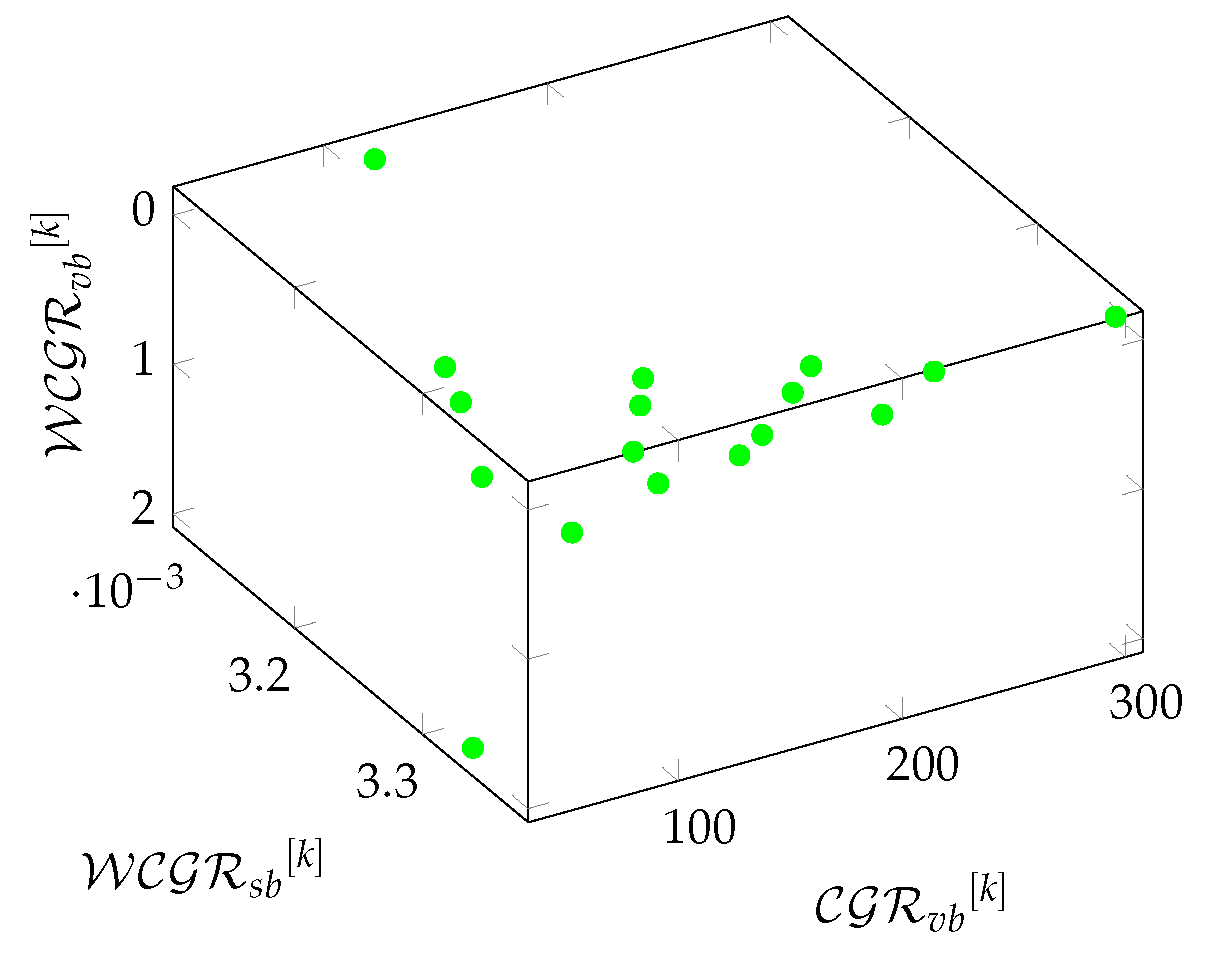
Finally, we examine the relationships between density and redundancy-based metrics in a 3-hop environment. The results were plotted on charts, for density-based metrics the axes are respectively , , , while for redundancy-based metrics , , .
In the case of the Chimera and Pegasus graphs (see in
Figure 8,
Figure 17)—apart from the Chimera
L parameter dependence—the density-based metrics show the same characteristic, the density increases linearly in a 3-hop environment as a function of
. For these two graphs,
Figure 9,
Figure 18 also show the same characteristics for the redundancy-based metrics. It can be seen that in the case of Chimera graphs,
shows case separation depending on the value of
L, and
shows an exponential increase as a function of
.
Figure 26 shows the relationship between Zephyr and density-based metrics, the linear growth between
and
that can be experienced in the Chimera and Pegasus graphs is not visible,
shows case separation depending on the value of
M.
In the case of Zephyr graphs, the results of the redundancy-based metrics can be seen in
Figure 27. This figure had to be rotated to present the results. The figure nicely shows the tendency of redundancy-based metrics as a function of the
T parameter.
5. Conclusion and Future Work
In this paper, we focused on graph-based analysis of the topology of D-Wave quantum computers. We analyzed the Chimera, Pegasus, and Zephyr graphs with different configurations. We generated topologies from to for Chimera, from to for Pegasus, and from to for Zephyr. In general, we worked on the average values of the metrics interpreted on the graphs, we were interested in the characteristics shown by the metrics. Our main goal was to highlight the main features and limitations of topologies with the thought of metrics. We believe that we have managed to highlight several interesting characteristics, advantages, and features. In the following, our goal is to examine Zephyr and newer topologies more deeply, focusing on cliques and bicliques, heuristic and lattice embeddings, and heuristic optimization.
Funding
This research was supported by the Ministry of Innovation and Technology and the National Research, Development and Innovation Office within the Quantum Information National Laboratory of Hungary.
Conflicts of Interest
The authors declare no conflict of interest.
References
- Althaus, E., Funke, S., Har-Peled, S., Könemann, J., Ramos, E. A. and Skutella, M. Approximating k-hop minimum-spanning trees. Operations Research Letters., 33(2), pp. 115-120, 2005.
- Albert-László Barabási, Réka Albert, Hawoong Jeong. Scale-free characteristics of random networks: the topology of the world-wide web, Physica A: Statistical Mechanics and its Applications., pp. 69–77, 2000.
- Réka Albert, Albert-László Barabási.Statistical mechanics of complex networks, Reviews of Modern Physics, pp.74–77, 2002.
- Batagelj, V. and Zaversnik, M, An O(m) algorithm for cores decomposition of networks. arXiv preprint cs/0310049, 2003.
- Cs. Biró, G. Kusper, Some k-hop Based Graph Metrics and Node Ranking in Wireless Sensor Networks. Annales Mathematicae et Informaticae., Vol. 50, pp. 19-37, 2019.
- Cs. Biró, Analysis of D-Wave topologies with classical graph metrics. International Journal of Mathematics and Computer Science. , Vol. 19 pp. 1171-1175, 2024.
- S. Boccaletti, V. Latora, YAlthaus, E., Funke, S., Har-Peled, S., Könemann, J., Ramos, E. A., and Skutella, M. Approximating k-hop minimum-spanning trees. Operations Research Letters., 33(2), pp. 115-120, 2006.
- P. Bonacich. A Technique for Analyzing Overlapping Memberships. Sociological Methodology, San Francisco: Jossey-Bass., pp. 176-85, 1972.
- P. Bonacich. Factoring and Weighting Approaches to Status Scores and Clique Identification. Journal of Mathematical Sociology., pp. 113-20, 1972.
- Boothby, T., King, A. D., and Roy, A. Fast clique minor generation in Chimera qubit connectivity graphs. Quantum Information Processing., 15, 495-508, 2016.
- Boothby, K., Bunyk, P., Raymond, J., and Roy, A. Next-generation topology of d-wave quantum processors. arXiv preprint arXiv:2003.00133., 2020.
- Boothby K, King A, Raymond J. Zephyr Topology of D-Wave Quantum Processors. D-wave technical report series., 2021.
- Borgatti, S. P., and Everett, M. G. A graph-theoretic perspective on centrality, Social Networks, 28(4), pp. 466-484, 2006.
- Brandes, U., A faster algorithm for betweenness centrality, Journal of Mathematical Sociology, 25(2), pp. 163-177, 2003.
- Briegel, H. J., Browne, D. E., Dür, W., Raussendorf, R., and Van den Nest, M. Measurement-based quantum computation. Nature Physics., 5(1), 19-26, 2009.
- Chen, Y., Wang, L., and Zhou, L. Mining Maximal Sub-prevalent Co-location Patterns Based on k-hop. Advanced Data Mining and Applications: 18th International Conference, ADMA 2022., Proceedings, Part I,pp. 384-396, 2022.
- Cheng, J., Shang, Z., Cheng, H., Wang, H., and Yu, J. X. K-reach: Who is in your small world. arXiv preprint arXiv:1208.0090., 2012.
- Choi, V. Minor-embedding in adiabatic quantum computation: II. Minor-universal graph design. Quantum Inf. Process., 10(3), pp. 343–353, 2011.
- A. Das, and Chakrabarti, B. K. Colloquium: Quantum annealing and analog quantum computation. Reviews of Modern Physics., 80(3), 1061, 2008.
- Dattani, N., Szalay, S., and Chancellor, N. Pegasus: The second connectivity graph for large-scale quantum annealing hardware.arXiv preprint arXiv:1901.07636., 2019.
- Flurin, E., Ramasesh, V. V., Hacohen-Gourgy, S., Martin, L. S., Yao, N. Y., ad Siddiqi, I. Observing topological invariants using quantum walks in superconducting circuits. Physical Review X., 7(3), 2017.
- Fortunato, S.Community detection in graphs, Physics Reports, 486(3-5), pp. 75-174. 2010.
- L. C. Freeman. Set of measures of centrality based on betweenness. Sociometry., pp. 35–41, 1977.
- L. C. Freeman, Centrality in social networks conceptual clarification. Social Networks., Vol. 1, Issue 3, pp. 205, 1978.
- L. C. Freeman, D. Roeder, R. R. Mulholland. Centrality in social networks: II. Experimental results. Social networks., 2(2), 119–141, 1979.
- Gyongyosi, L., and Imre, S. A survey on quantum computing technology. Computer Science Review., 31, pp. 51-71, 2019.
- Hagan, S., Hameroff, S. R., and Tuszyski, J. A. Quantum computation in brain microtubules: Decoherence and biological feasibility. Physical review E., 65(6), 2002.
- Hage, P., and Harary, F. Eccentricity and centrality in networks, Social Networks, 17(1), pp. 57-63, 1995.
- Huang, T., Zhu, Y., Goh, R. S. M., and Luo, T. When quantum annealing meets multitasking: Potentials, challenges and opportunities. Array., 100282, 2023.
- Isham, C. J. Topological and global aspects of quantum theory. In Relativity, groups and topology., 2, 1984.
- Keimer, B., and Moore, J. E. The physics of quantum materials. Nature Physics., 13(11), pp. 1045–1055, 2017.
- Lahtinen, V., and Pachos, J. A short introduction to topological quantum computation. SciPost Physics., 3(3), 021, 2017.
- A. Lesne. Complex Networks: from Graph Theory to Biology. Letters in Mathematical Physics., pp. 235–262, 2006.
- Lewis M. and Glover F. Quadratic unconstrained binary optimization problem preprocessing. Theory and empirical analysis Networks., 70 (2), pp. 79–97, 2017.
- Liu, W., and Li, Z. An efficient parallel algorithm of n-hop neighborhoods on graphs in distributed environment. Frontiers of Computer Science., 13, pp. 1309–1325, 2019.
- R. Luce, A. Duncan, D. Albert, matrix analysis of group structure. Psychometrika., pp. 95–116, 1949.
- Newman, M. E. J., and Girvan, M., Finding and evaluating community structure in networks, Physical Review E, 69(2), 2004.
- Nikolentzos, G., Dasoulas, G., and Vazirgiannis, M. k-hop graph neural networks. Neural Networks, 130, 195-205, 2020.
- Opsahl, T., Agneessens, F., and Skvoretz, J., Node centrality in weighted networks: Generalizing degree and shortest paths, Social Networks, 32(3), pp. 245-251, 2010.
- Pelofske, E. Comparing Three Generations of D-Wave Quantum Annealers for Minor Embedded Combinatorial Optimization Problems. arXiv preprint arXiv:2301.03009., 2023.
- Saffman, M. Quantum computing with atomic qubits and Rydberg interactions: progress and challenges. Journal of Physics B: Atomic, Molecular and Optical Physics., 49(20), 202001, 2016.
- M. T. Van Genuchten. A closed-form equation for predicting the hydraulic conductivity of unsaturated soils. I. Soil science society of America journal., 44(5), pp. 892–898, 1980.
- S. Wasserman, K. Faust. Social network analysis: Methods and applications. Cambridge university press., v. 4, 1994.
- D. J. Watts, S. H. Strogatz. Collective dynamics of ’small-world’ networks. Nature., pp. 440–442, 1998.
- B. Weisfeiler and A. A. Lehman.A reduction of a graph to a canonical form and an algebra arising during this reduction (in russian). Nauchno-Technicheskaya Informatsia.n Seriya 2, 9:12–16, 1968.
- Witten, E. Topological quantum field theory. Communications in Mathematical Physics., 117(3), pp. 353–386, 1988.
- Xie, X., Yang, X., Wang, X., Jin, H., Wang, D., and Ke, X. BFSI-B: An improved K-hop graph reachability queries for cyber physical systems. Information Fusion., 38, pp. 35–42, 2017.
Figure 1.
The average values of , and as a function of for different Chimera graphs.
Figure 1.
The average values of , and as a function of for different Chimera graphs.
Figure 2.
The average values of as a function of for different Chimera graphs.
Figure 2.
The average values of as a function of for different Chimera graphs.
Figure 3.
The average values of as a function of for different Chimera graphs.
Figure 3.
The average values of as a function of for different Chimera graphs.
Figure 4.
The average values of as a function of for different Chimera graphs.
Figure 4.
The average values of as a function of for different Chimera graphs.
Figure 5.
On Chimera graphs the average values of as a function of the average values of .
Figure 5.
On Chimera graphs the average values of as a function of the average values of .
Figure 6.
On Chimera graphs the average values of as a function of the average values of .
Figure 6.
On Chimera graphs the average values of as a function of the average values of .
Figure 7.
On Chimera graphs the average values of as a function of the average values of .
Figure 7.
On Chimera graphs the average values of as a function of the average values of .
Figure 8.
The relationship between the average values of density-based metrics on Chimera graphs in a 3-hop environment.
Figure 8.
The relationship between the average values of density-based metrics on Chimera graphs in a 3-hop environment.
Figure 9.
The relationship between the average values of redundancy-based metrics on Chimera graphs in a 3-hop environment.
Figure 9.
The relationship between the average values of redundancy-based metrics on Chimera graphs in a 3-hop environment.
Figure 10.
The average values of , and as a function of for different Pegasus graphs.
Figure 10.
The average values of , and as a function of for different Pegasus graphs.
Figure 11.
The average values of as a function of for different Pegasus graphs.
Figure 11.
The average values of as a function of for different Pegasus graphs.
Figure 12.
The average values of as a function of for different Pegasus graphs.
Figure 12.
The average values of as a function of for different Pegasus graphs.
Figure 13.
The average values of as a function of for different Pegasus graphs.
Figure 13.
The average values of as a function of for different Pegasus graphs.
Figure 14.
On Pegasus graphs the average values of as a function of the average values of .
Figure 14.
On Pegasus graphs the average values of as a function of the average values of .
Figure 15.
On Pegasus graphs the average values of as a function of the average values of .
Figure 15.
On Pegasus graphs the average values of as a function of the average values of .
Figure 16.
On Pegasus graphs the average values of as a function of the average values of .
Figure 16.
On Pegasus graphs the average values of as a function of the average values of .
Figure 17.
The relationship between density-based metrics on Pegasus graphs in a 3-hop environment.
Figure 17.
The relationship between density-based metrics on Pegasus graphs in a 3-hop environment.
Figure 18.
The relationship between redundancy-based metrics on Pegasus graphs in a 3-hop environment.
Figure 18.
The relationship between redundancy-based metrics on Pegasus graphs in a 3-hop environment.
Figure 19.
The average values of , and as a function of for different Zephyr graphs.
Figure 19.
The average values of , and as a function of for different Zephyr graphs.
Figure 20.
The average values of as a function of for different Zephyr graphs.
Figure 20.
The average values of as a function of for different Zephyr graphs.
Figure 21.
The average values of as a function of for different Zephyr graphs.
Figure 21.
The average values of as a function of for different Zephyr graphs.
Figure 22.
The average values of as a function of for different Zephyr graphs.
Figure 22.
The average values of as a function of for different Zephyr graphs.
Figure 23.
On Zephyr graphs the average values of as a function of the average values of .
Figure 23.
On Zephyr graphs the average values of as a function of the average values of .
Figure 24.
On Zephyr graphs the average values of as a function of the average values of .
Figure 24.
On Zephyr graphs the average values of as a function of the average values of .
Figure 25.
On Zephyr graphs the average values of as a function of the average values of .
Figure 25.
On Zephyr graphs the average values of as a function of the average values of .
Figure 26.
The relationship between density-based metrics on Zephyr graphs in a 3-hop environment.
Figure 26.
The relationship between density-based metrics on Zephyr graphs in a 3-hop environment.
Figure 27.
The relationship between redundancy-based metrics on Zephyr graphs in a 3-hop environment.
Figure 27.
The relationship between redundancy-based metrics on Zephyr graphs in a 3-hop environment.
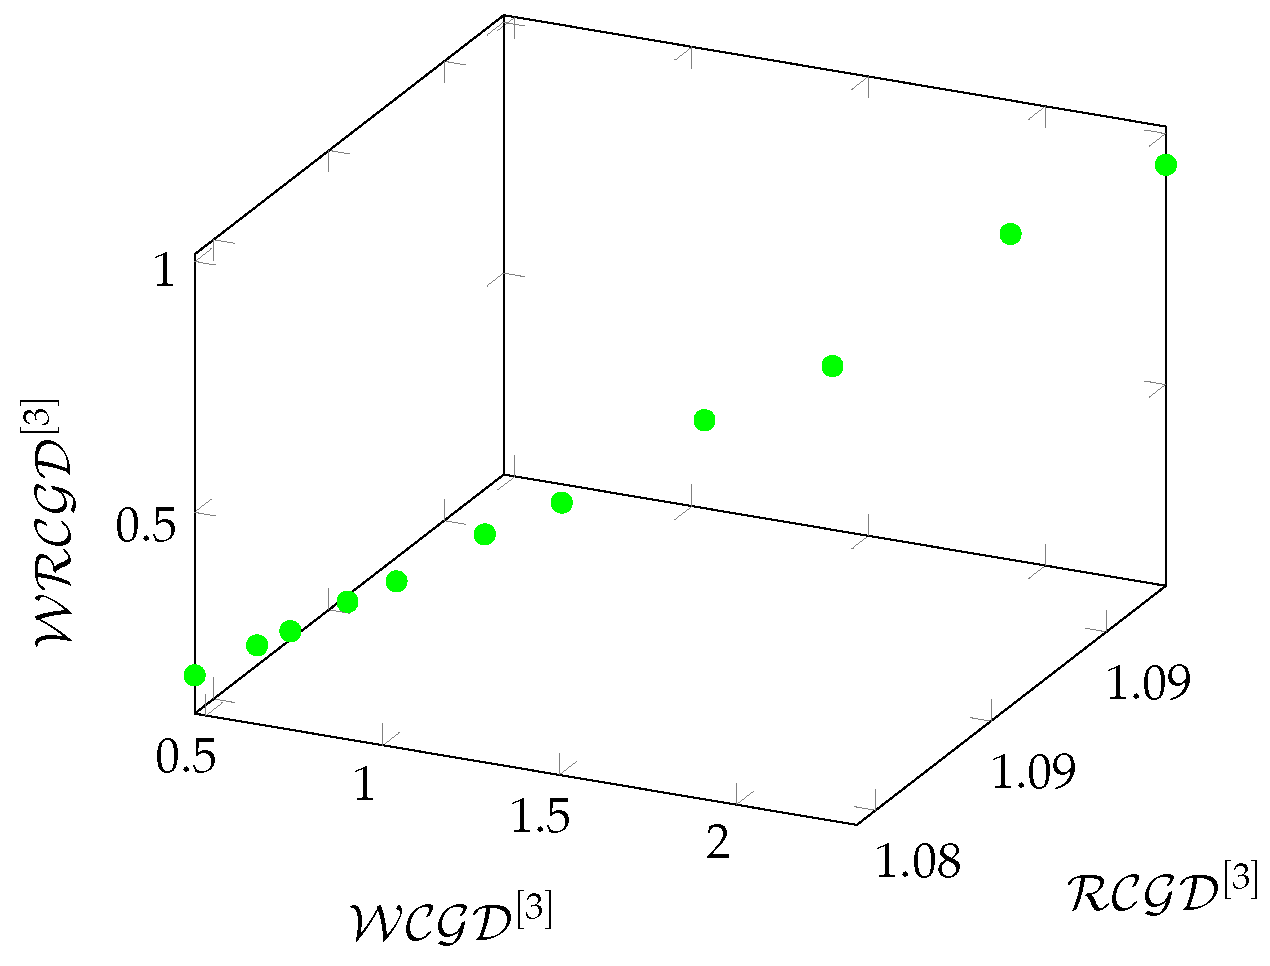
Figure 28.
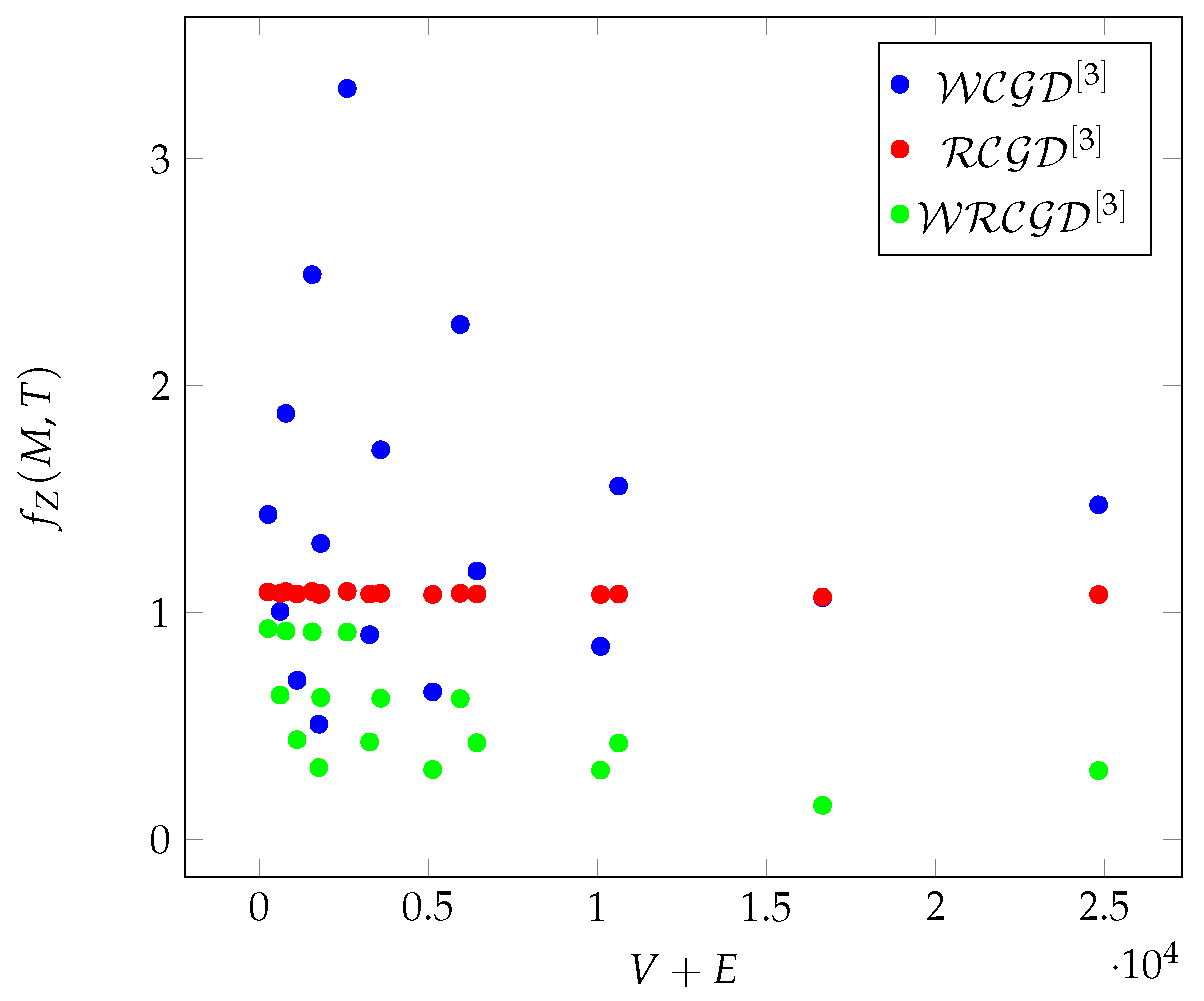
The average values of as a function of and for different Zephyr graphs.
Figure 28.
The average values of as a function of and for different Zephyr graphs.
Table 1.
The average values of classical metrics in 1-3 hop environments of vertices.
Table 1.
The average values of classical metrics in 1-3 hop environments of vertices.
| |
|
N. of vertices |
N. of edges |
| |
1-hop |
|
|
| |
2-hop |
|
|
| |
3-hop |
63 |
226 |
Table 2.
Average values of density-based metrics in 1–3 hop environments of vertices.
Table 2.
Average values of density-based metrics in 1–3 hop environments of vertices.
| |
|
k-hop-based metrics |
| |
|
|
|
|
| |
|
|
|
|
| |
|
|
|
|
| |
|
|
|
|
Table 3.
Average values of redundancy-based metrics in 1–3 hop environments of vertices.
Table 3.
Average values of redundancy-based metrics in 1–3 hop environments of vertices.
| |
|
k-hop-based metrics |
| |
|
|
|
|
| |
|
|
|
|
| |
|
|
|
|
| |
|
|
|
|
Table 4.
Average values of classical metrics in 1–3 hop environments of vertices
Table 4.
Average values of classical metrics in 1–3 hop environments of vertices
| |
|
N. of vertices |
N. of edges |
| |
1-hop |
|
|
| |
2-hop |
|
|
| |
3-hop |
|
|
Table 5.
Average values of density-based metrics in 1–3 hop environments of vertices
Table 5.
Average values of density-based metrics in 1–3 hop environments of vertices
| |
|
k-hop-based metrics |
| |
|
|
|
|
| |
|
0.0173 |
1.0309 |
0,0117 |
| |
|
0.1527 |
1.0642 |
0.0677 |
| |
|
0.4691 |
1.0791 |
0,1753 |
Table 6.
Average values of redundancy-based metrics in 1–3 hop environments of vertices
Table 6.
Average values of redundancy-based metrics in 1–3 hop environments of vertices
| |
|
k-hop-based metrics |
| |
|
|
|
|
| |
|
|
|
|
| |
|
|
|
|
| |
|
|
|
|
Table 7.
The average values of a number of vertices and edges in hop environments of vertices.
Table 7.
The average values of a number of vertices and edges in hop environments of vertices.
| |
|
|
| |
|
N. of vertices |
N. of edges |
| |
1-hop |
|
|
| |
2-hop |
|
|
| |
3-hop |
|
|
| |
|
|
| |
|
N. of vertices |
N. of edges |
| |
1-hop |
|
|
| |
2-hop |
|
|
| |
3-hop |
|
|
| |
|
|
| |
|
N. of vertices |
N. of edges |
| |
1-hop |
|
|
| |
2-hop |
75.87 |
|
| |
3-hop |
|
|
| |
|
|
| |
|
N. of vertices |
N. of edges |
| |
1-hop |
|
|
| |
2-hop |
|
|
| |
3-hop |
24685 |
|
| |
|
|
| |
|
N. of vertices |
N. of edges |
| |
1-hop |
|
|
| |
2-hop |
|
1667 |
| |
3-hop |
|
|
Table 8.
Average values of density-based metrics in hop environments of vertices.
Table 8.
Average values of density-based metrics in hop environments of vertices.
| |
|
k-hop-based metrics
|
| |
|
|
|
|
| |
|
|
|
|
| |
|
|
|
|
| |
|
|
|
|
| |
|
k-hop-based metrics
|
| |
|
|
|
|
| |
|
|
|
|
| |
|
|
|
|
| |
|
|
|
|
| |
|
k-hop-based metrics
|
| |
|
|
|
|
| |
|
|
|
|
| |
|
|
|
|
| |
|
|
|
|
| |
|
k-hop-based metrics
|
| |
|
|
|
|
| |
|
|
|
|
| |
|
|
|
|
| |
|
|
|
|
| |
|
k-hop-based metrics
|
| |
|
|
|
|
| |
|
|
|
|
| |
|
|
|
|
| |
|
|
|
|
Table 9.
Average values of redundancy-based metrics in hop environments of vertices.
Table 9.
Average values of redundancy-based metrics in hop environments of vertices.
| |
|
k-hop-based metrics
|
| |
|
|
|
|
| |
|
|
|
|
| |
|
|
|
|
| |
|
|
|
|
| |
|
k-hop-based metrics
|
| |
|
|
|
|
| |
|
|
|
|
| |
|
|
|
|
| |
|
|
|
|
| |
|
k-hop-based metrics
|
| |
|
|
|
|
| |
|
|
|
|
| |
|
|
|
|
| |
|
3.3362 |
185.7993 |
|
| |
|
k-hop-based metrics
|
| |
|
|
|
|
| |
|
|
|
|
| |
|
|
|
|
| |
|
|
|
|
| |
|
k-hop-based metrics
|
| |
|
|
|
|
| |
|
|
|
|
| |
|
|
|
|
| |
|
|
|
|
|
Disclaimer/Publisher’s Note: The statements, opinions and data contained in all publications are solely those of the individual author(s) and contributor(s) and not of MDPI and/or the editor(s). MDPI and/or the editor(s) disclaim responsibility for any injury to people or property resulting from any ideas, methods, instructions or products referred to in the content. |
© 2024 by the authors. Licensee MDPI, Basel, Switzerland. This article is an open access article distributed under the terms and conditions of the Creative Commons Attribution (CC BY) license (http://creativecommons.org/licenses/by/4.0/).
