1. Introduction
The local effects of global climate change are increasingly recognised as one of the major challenges facing modern civilisation and the development of society. They affect all geosystems on the planet, including impacting the way society lives. One of the important issues in this context relates to the increasing intensity of the Urban Heat Island (UHI) phenomenon, which is a persistent feature of local climates in highly urbanized areas, and its manifestation is expected to intensify with increasing temperatures as well as the frequency and duration of heat waves [
1,
2]. As most of the planet's population and major economic and infrastructural systems are concentrated there, this phenomenon poses a serious threat to the quality of life and the ability of urban ecosystems to provide it sufficiently [
3]. For this reason, the urban heat island effect is the subject of increasing research interest, both in terms of improving approaches and methods to record, study, and map it and in terms of developing mitigation strategies or adaptation plans [
4,
5,
6].
One of the central issues in studying the characteristics of UHI inevitably relates to the application of effective and sensitive approaches and methods for recording and tracking the phenomenon to ensure the provision of comprehensive and reliable data to inform a wide range of stakeholders in the practice of strategic urban planning and urban management. To achieve such information provision, resources and data with high spatial and temporal resolution are needed to enable discussion of important characteristics of UHI, including its intensity (magnitude), spatial extent, and variability. Understanding these key characteristics of the phenomenon is essential for clarifying its causes, as well as for assessing and predicting its impact on urban environmental quality (urban water and air) and the functioning of urban infrastructure (especially energy).
The main challenge in measuring and tracking the impact of UHI results, on the one hand, from the complex nature of the factors that cause it and from the complex spatial nature of the phenomenon itself. The structure of urban spaces and their geographical and functional characteristics also have a significant influence. These areas are characterised by a high degree of spatial dynamics of land cover and ecosystems, combined with a high concentration of population, artificial/sealed surfaces and sites, and functional systems that underpin the development of urban areas. All this naturally implies the application of a holistic approach to mapping and studying the UHI.
The complexity of the UHI phenomenon is due to many factors of the urban environment (urban climate, urban geometry, morphology, urban functionality, etc.), including those related to the place where it is formed. In this regard, different types of UHI are distinguished, the observations of which are carried out through different research methods. UHI can be observed at the surface of the urban area (surface heat islands, SUHI), below it (subsurface heat islands), and above it (atmospheric heat islands) [
7]. Atmospheric heat islands are most studied by observing air temperature (Ta) from fixed or mobile meteorological stations, which provides relatively good temporal resolution but exhibits poor spatial resolution due to the low density of the observing network in most cities. It also seems problematic to provide data from reference "rural" stations for comparison with data from "urban" stations, which in the context of ever-expanding urbanization is increasingly difficult - for example, even stations from suburban airports are now in urban environments [
8]. Subsurface heat islands are less frequently studied, using data from temperature measurements at different depths in the soil/substrate or in urban groundwater basins [
9,
10].
Remote sensing methods are the most used methods in SUHI studies. Typically, Land Surface Temperature (LST) or radiative temperature data is obtained by remotely sensing the radiative and thermodynamic properties of urban surfaces (horizontal, inclined, or vertical) and recording them from Thermal Infrared (TIR) sensors mounted on satellite, aircraft, unmanned platforms or helicopters are used [
11,
12]. The main disadvantage of the data obtained in this way is related, on the one hand, to the relatively low temporal resolution of the satellite data, which limits our ability to continuously estimate UHI intensity, and, on the other hand, to the insufficient spatial resolution, which is not able to reflect the high spatial dynamics of urban areas. Typically, under the same meteorological conditions, the recorded surface air temperatures and surface temperatures do not coincide because the remote sensor captures the longwave radiation from the surface but not the air temperature (recorded by thermometers) that forms the thermal environment in the habitable atmospheric layer (urban cover layer, UCL). Due to the differences in the processes forming the energy balances of the two environments, LSTs vary over a much wider range than Ta [
13,
14,
15]. Satellite observations lead to biases (overestimation/underestimation) in estimating the actual impact of LSTs on a diurnal timescale [
16].
In contrast to satellite data, remotely sensed airborne thermal data (from manned aircraft and helicopters) have a much higher level of detail, allowing the study of microscale variations in LST between different elements of the urban landscape. Another significant advantage is that it is possible to refine the methodological approach of the survey by selecting the most appropriate time of day to obtain thermal data. The disadvantages, however, are related to the very high cost of the survey, the complex organisation of the survey, and the strict rules governing the flight of manned aircraft over urban areas. This type of observation is usually combined with ground temperature measurements from fixed and/or mobile meteorological stations [
17,
18,
19,
20].
The development of UASs in recent years has provided a very effective alternative to LST research - a reason why they are finding an increasing place in scientific research [
21,
22,
23]. This technology can provide data and analytical information with high temporal and spatial resolution that accurately reflect the geographic characteristics of urban areas (such as genetic conditions for the occurrence of the phenomenon) and enable the important research question related to SUHI - how the heterogeneous urban areas inherently respond to heat stress, especially in a meteorological context of prolonged and intense heat waves.
Ensuring quality SUHI research outputs are in turn an essential requirement for understanding the phenomenon and for rapidly and effectively transferring SUHI knowledge into urban planning and geodesign practice, as well as into urban infrastructure development and management systems. These systems are among the determining factors for improving the quality of life in cities and for managing public health risks. Considering that modern urban planning is a complex process that relies heavily on georeferenced information resources with high spatial and temporal resolution, in this study, we propose a relatively complete, fast, and tested methodological approach to investigate SUHI effects by integrating remote sensing methods using unmanned aerial systems (UAS), thermal photogrammetry and local climate zoning (LCZ) concept.
Based on this, we have identified the main objective of this study - to present an effective approach and methodological scheme for a detailed study and mapping of the SUHI effect at the micro level, based on the integration of various advanced geospatial methods and tools including the use of UAS based remote sensing. The proposed methodological scheme ensures a high degree of detail and integrity of the generated results, including representing SUHI variations in a heterogeneous urban environment at micro- and local scales.
In line with this aim, the following main objectives of the study are formulated:
To validate our hypothesis that the proposed methodology allows the generation of data and information resources, allowing maximum objectification and quantitative parameterization of SUHI intensity and its spatial projection in the urban environment, testing the same in real conditions, in the largest residential area of the city of Sofia, Bulgaria.
Based on the capabilities offered by the methodology, to provide the most objective and detailed basis for creating the conditions for improving the well-established and widely recognized scientific research approach of local climate zoning (LCZ) in the study of UHI. This approach can be used directly by urban planners as it is related to the fact that UHI depends mainly on the specific geospatial characteristics and the spatial combinations of each urban area. Reflecting this dependence requires detailed spatial differentiation (zonation) of urban space so that UHI intensity can be related to certain factors and types of urban structures (intra-urban variations of LULC, urban morphology, degree/type of human activity, and other criteria) [
24,
25,
26,
27]. A number of classification schemes on this research topic are known [
28,
29,
30,
31], but the most common is the concept and scheme developed by Stewart and Oke for local climate zones (LCZs) [
32,
33,
34] as a form of spatial differentiation of urban areas for climate purposes. We believe that the use of the present methodology to investigate, map, and assess the effect of SUHI contributes significantly to the refinement of the LCZ approach by providing very detailed data on individual LULCs within urban areas and linking them to detailed data on their heat load, the specificity of urban morphology and the spatial configuration of sites within the urban area. This makes the results of the methodology directly applicable to urban planning.
Presentation of the serious technological possibilities of conducting regular monitoring through the presented methodology, due to the potential of automated execution of flight missions for primary data collection, which is important both for the clarification of the spatial and temporal dynamics of the phenomenon and for the evaluation of the developed adaptation mechanisms in urban planning and management.
To provide real data and results from the application of the presented methodological framework, this study presents data from a study of the effect of SUHI in the Bulgarian capital Sofia, and its largest residential area Lyulin, the field studies themselves being conducted during the summer months of the period 2021-2024.
2. Materials and Methods
The approach and methodology developed and presented in this paper are based on the integrated application of UAS and GIS in the investigation, mapping, and assessment of different aspects of the SUHI effect. The concept has been developed since 2019 and tested within the urbanized space of the Sofia metropolitan area, focusing on the largest residential area in the city - Lyulin. The capital Sofia (492 km2) is located in the central part of a large valley (550 m a.s.l.) in western Bulgaria with a moderate continental climate (Cfb). Today Sofia is the main economic and cultural center of Bulgaria: it is home to nearly 18% of the country's population and 25% of the urban population. Sofia municipality generates nearly 41% of GDP in 2022 [
35]. It is distinguished by a complex urban morphology - a concentrated old urban core, extensive industrial areas to the north, and post-secondary - steady trends of expansion into residential neighborhoods towards the southern basin fence - the footstep of Vitosha Mountain (2290 m).
To reach its current form, the methodology presented in this paper has undergone substantial development, both in terms of technology and the methods used to collect, process, analyze, and interpret the data. The original concept of the methodology was based on a stratified sampling survey, which was carried out using a multirotor-type UAS with a directional thermal camera to collect the thermal data. The results of these investigations are published in two papers, in 2020 and 2021 [
22,
23], respectively. Discussion of the results showed that the approach provides relatively usable data with high spatial resolution but over limited areas of the city. Additionally, the results are generated by spatial analysis and geostatistical operations with a high degree of uncertainty, which also is a serious weakness of this approach. This uncertainty is explained by the variability of the urban environment over very small distances.
To solve some of these metrological and technological challenges, from 2022 onwards, we have started to use another platform for exploration, a fixed-wing UAS equipped with an integrated sensor including a photogrammetric and thermal camera. This has allowed us to replace the sample-based assay with a comprehensive one, which in turn provides much more reliable information for subsequent analytical procedures. Some of the results of these investigations were published in 2024 [
39], where the advantages of this approach for investigating the urban heat island effect are visible: high spatial resolution, the extended spatial coverage of the investigated spaces, spatial and geostatistical analyses with increased accuracy of the results, expanded applicability of the obtained information in response to the interest of urban business, planning, and management.
A key feature of fieldwork with relevant UAS platforms incorporated in all variants of the methodology presented, whether a sampling or holistic approach is used, is the precise time of day at which the survey is conducted. All surveys strictly followed the rule that field surveys should be conducted after sunset [
36], during the meteorologically hottest months for the respective regions of the country. This eliminates the influence of active solar radiation and hence the distortion of LST data. This solution ensures that adequate information is obtained on the 'contribution' of the different land cover types, the configuration of the sites and systems forming the urban structure, and the nature of the urban morphology to the heat load of the area concerned. The approach also provides more realistic SUHI intensity data.
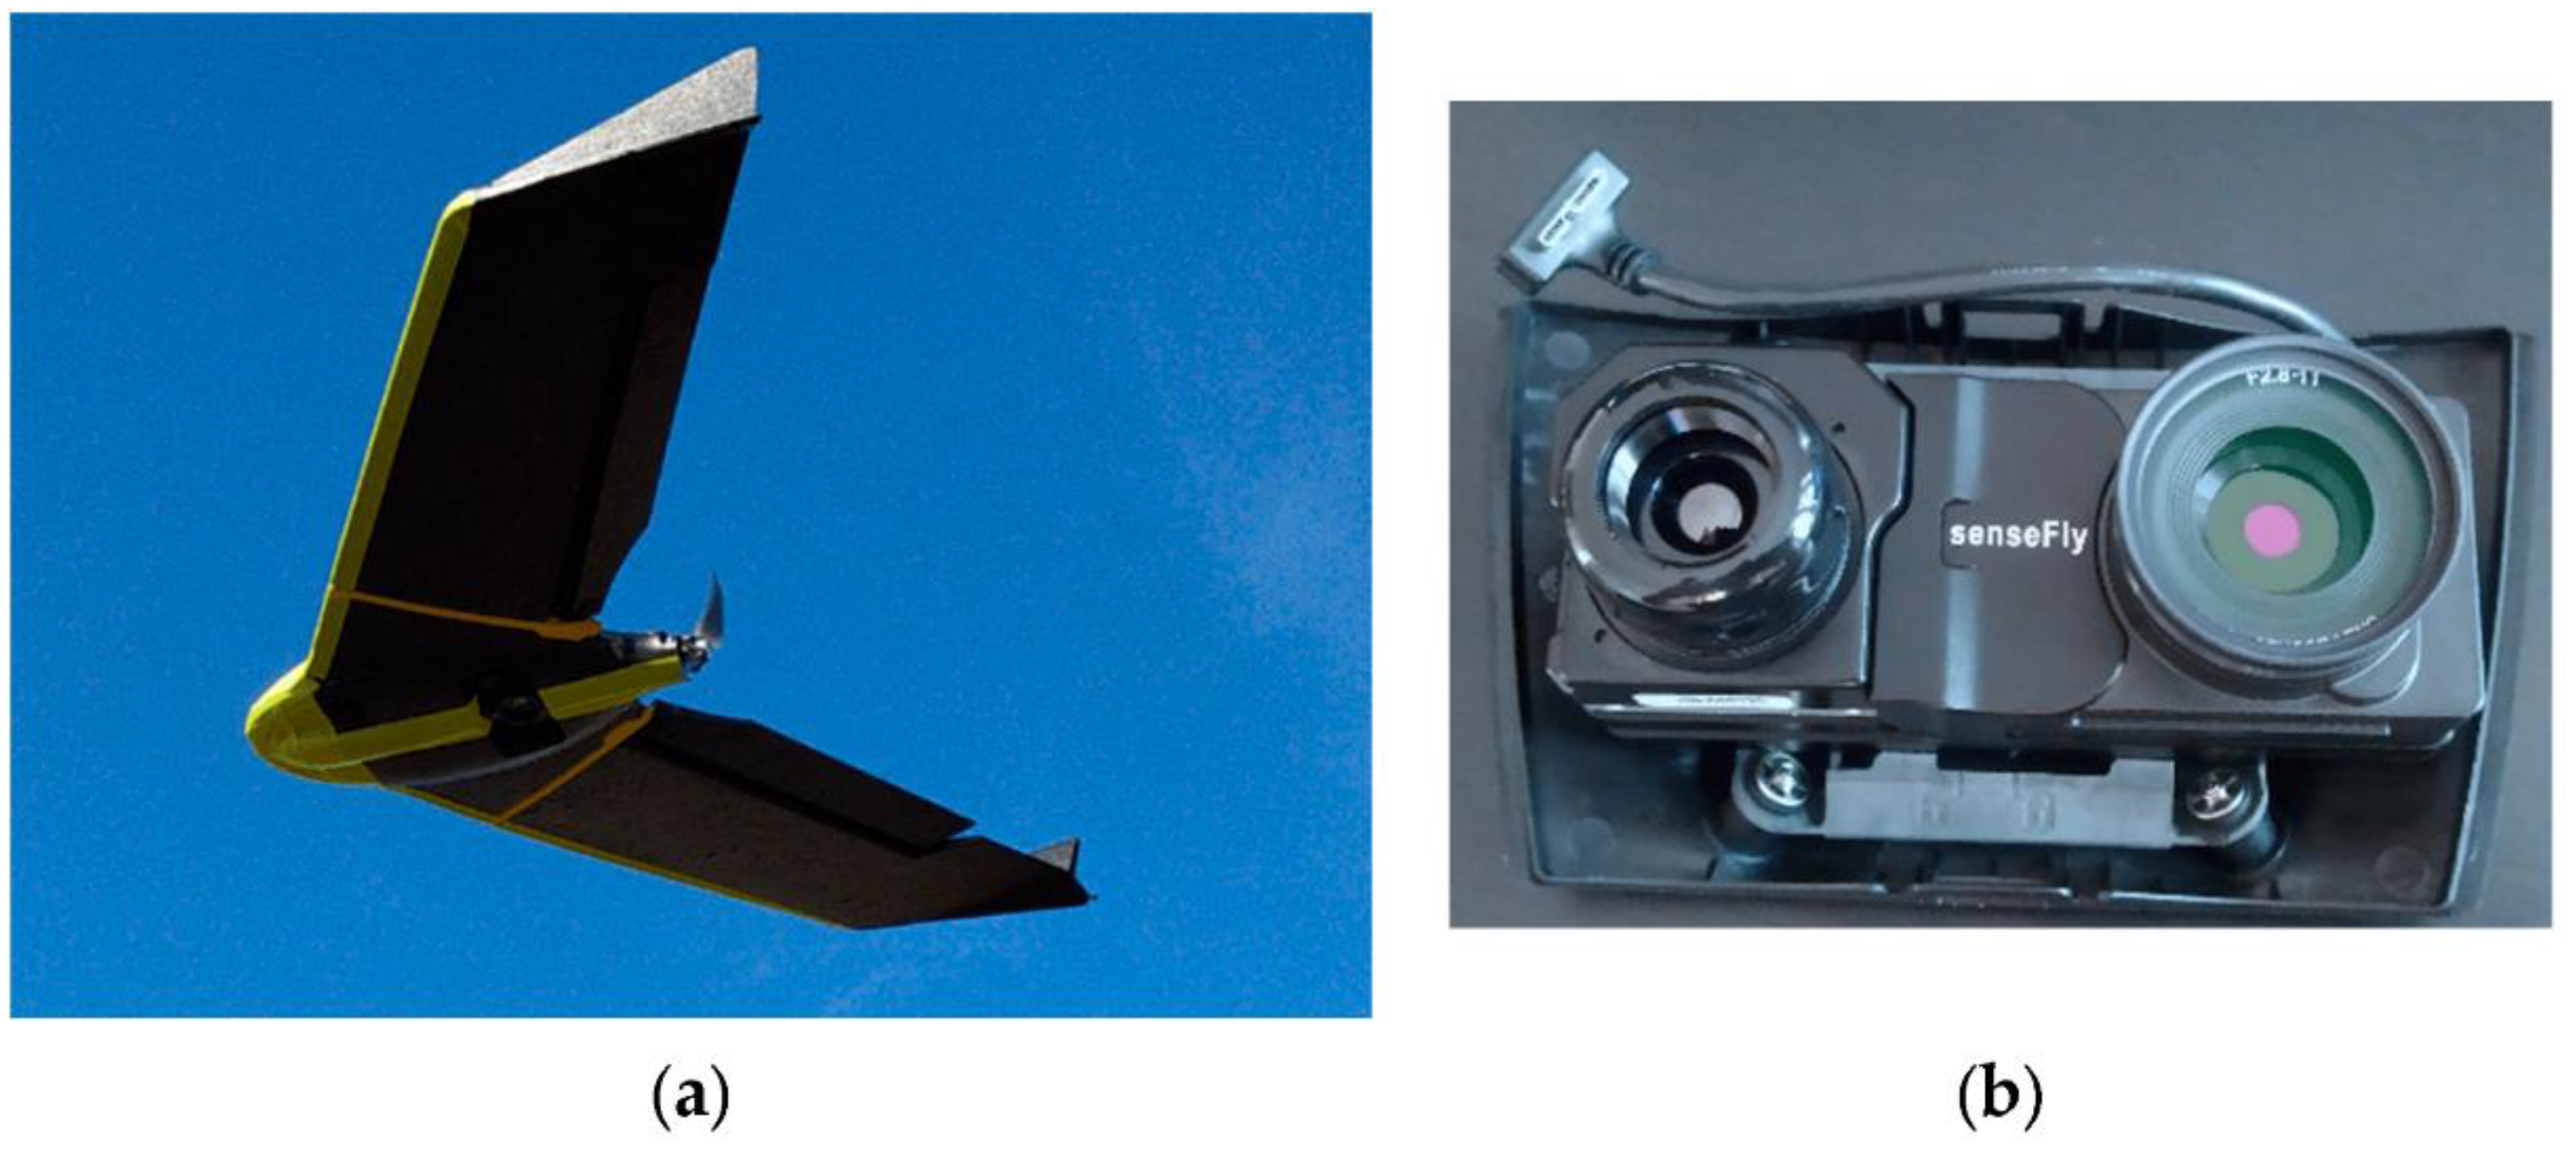
For developing and implementing the methodology, we have used the EbeeX platform of the AgEagle company, equipped with an integrated thermal and photogrammetric DueT sensor (
Figure 1), which allows the creation of a thermal orthophoto mosaic with high spatial accuracy and resolution. It is one of the lightest integrated thermal radiometric and photogrammetric sensors, with synchronization technology to perform efficient thermal mapping of small to medium-sized areas. The thermal sensor is FLIR TAU 2 sensor, with a fixed focal length of 40 mm (35 mm equ.), image frequency of 30 Hz, automatic FFC calibration, spectral band 7.5–13.5 μm, and sensitivity of 50mK. The sensor simultaneously generates RGB images with a resolution of up to 20 Mpx with a focal length of 28 mm (35 mm equivalent) and thermal infrared images with a resolution of 640 x 512 px with a focal length of 40 mm (35 mm equivalent). The camera is controlled by the UAS, with an adaptive automated mechanism to adjust and configure the camera parameters according to the conditions in which the flight takes place. The two sensors work in tandem and are synchronized while featuring direct image georeferencing, which is greatly facilitated by the RTK/PPK functionality of the flight platform.
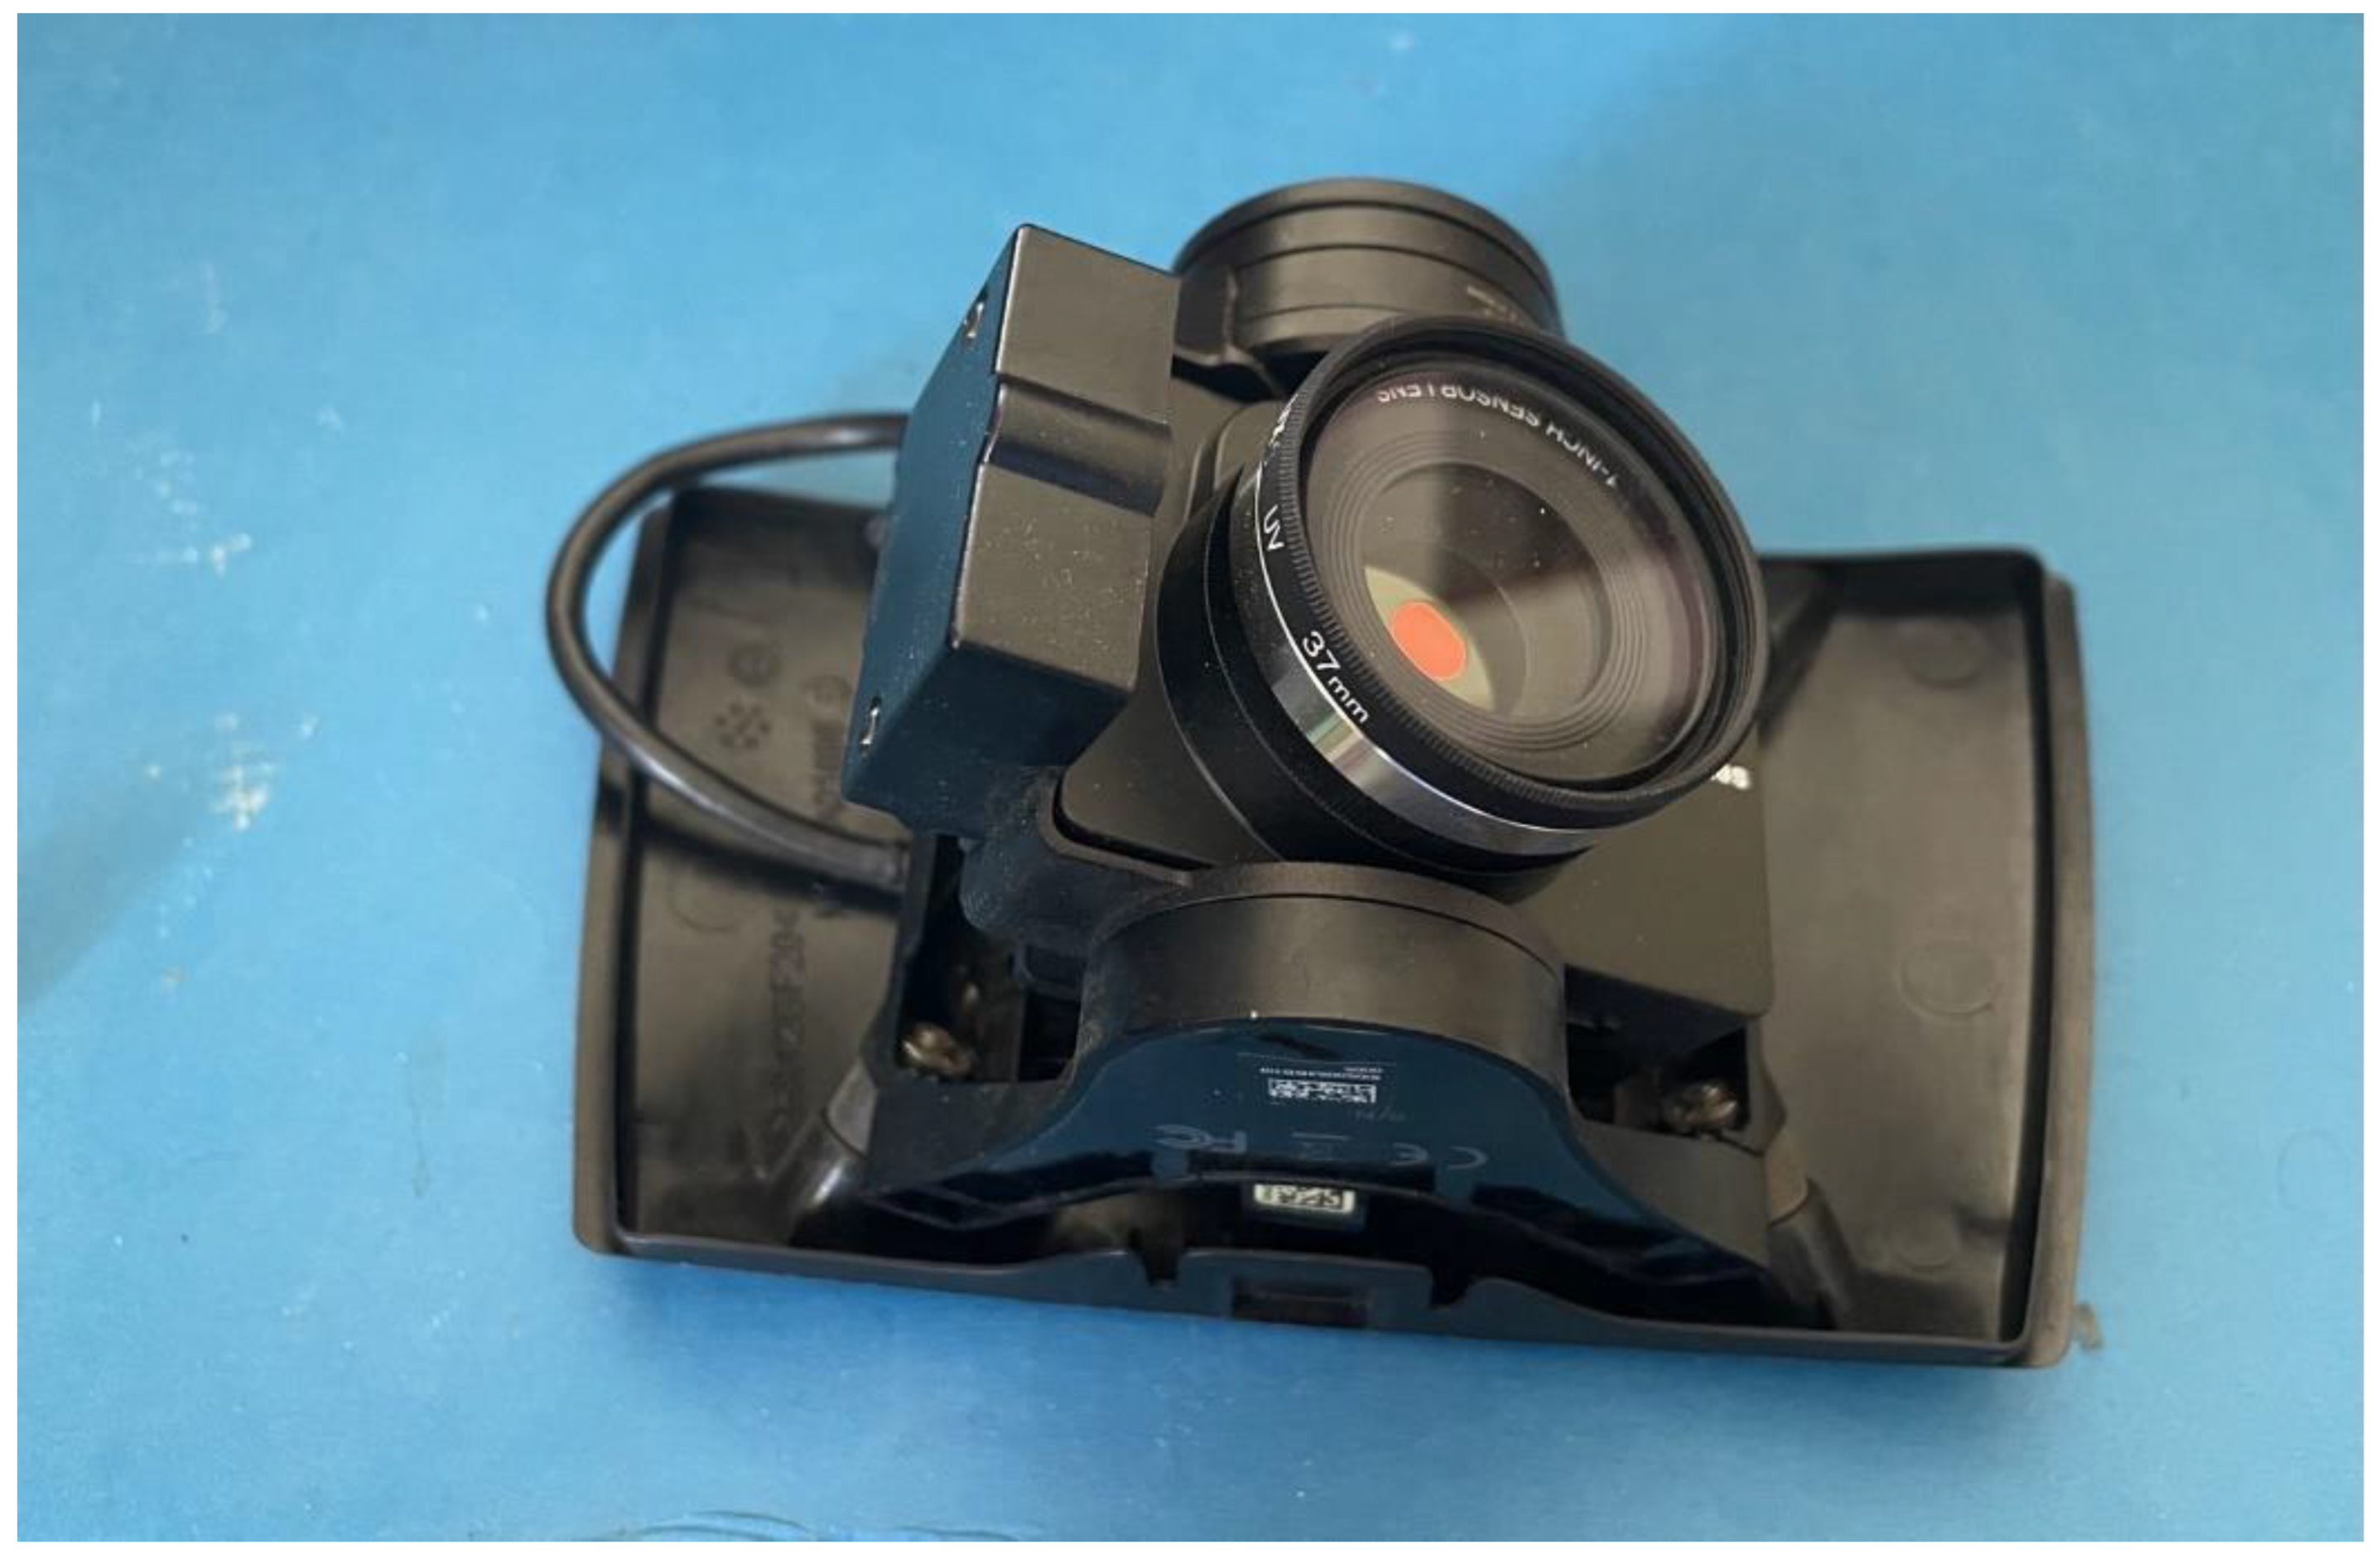
The flight platform itself offers the possibility of using different sensors, and in addition to the mentioned above sensor, during our research, we also used a second one - this is a dedicated 3D photogrammetric camera S.O.D.A. (
Figure 2), which is integrated with a gimbal mechanism allowing to provide oblique images in addition to the standard nadir ones. This sensor feature allows the generation of detailed 3D point clouds, which provides a good basis for creating a Local Climate Zone (LCZ) model with much better geometry and parameterization. The latter is an important part of our proposed integrated methodology for studying, mapping, and assessing the SUHI effect.
For the successful application of the developed methodology, the flight and performance characteristics of the flight platform are of great importance. The EbeeX can maintain a high average flight speed for a long time (90 minutes), which given the time constraint for their execution (up to 2 hours after sunset), is a very important advantage allowing it to cover relatively large areas. For example, in 90 minutes of flight time with the integrated thermal and photogrammetric sensor DuetT, at a resolution of thermal images of 15 cm/pixel (65% overlap in width and 70% in length) and RGB images of 2.6 cm/pixel (76% overlap in width and 80% in length), 135 ha can be mapped, with a flight height of 114 m. If we increase the resolution of the thermal images to 25cm/pixel with the same overlap parameters, the flight should take place at a height of 191m. The mapped area then increases to about 235 ha.
In addition to the flight characteristics as already mentioned above, the platform has direct georeferencing capabilities of the images and is equipped with RTK/PPK functionality, which provides two major advantages of crucial importance for SUHI exploration and mapping:
Firstly, it is the provision of very high positional accuracy of the collected geodata without the need for ground control points. This leads to great survey efficiency and significantly reduces fieldwork time. Of undoubted importance here is also the minimization of the cost of carrying out the field survey.
The second important advantage is associated with the possibility of planning and carrying out precise flight missions according to predefined parameters, the results of which are extremely accurate from a geolocation point of view and can be repeated an unlimited number of times. This creates prerequisites for a high degree of geospatial comparability of the results, and hence for the application of various spatial algebraic and geostatistical methods to study trends in the manifestation of the phenomenon under study.
The proposed in the present article methodological framework of the SUHI study involves the sequential organization and application of the following steps:
Step 1. Planning the missions: Flight mission planning, with purposeful consideration of the characteristics of the terrain under investigation. For this purpose, a flight mission generation system compatible with the selected fixed-wing flight platform is used. In this case, the AgEagle eMotion planning platform (
https://ageagle.com/drone-software/emotion/) was used, which provides the necessary functionalities for flight mission creation, its execution and management, data post-processing and their adaptation for the next steps of geo-information products creation, their analysis and interpretation.
Step 2. Data collection: Surveying the urban area using so-called ‘thermal photogrammetry’. The approach is realized through the integrated application of a thermal and photogrammetric sensor based on a fixed-wing UAS. Due to the specific illumination conditions during the flights, to provide higher quality digital terrain data to be subsequently used both for analysis and to provide reliable metadata for the application of the LCZ approach, a second sensor is used within this step - this is the S.O.D.A. 3D photogrammetric sensor. The flight missions with this sensor were carried out during the day, in the presence of optimal illumination, and they were carried out along two perpendicularly intersecting trajectories, duplicating the coverage of the surveyed area. In this way, a much more complete coverage of the sites is achieved and data is collected that more adequately reflect the morphology of the surveyed area.
Step 3. Data processing: Simultaneous processing of the thermal and photogrammetric data in a dedicated platform and production of the corresponding products, which include: a detailed digital surface model (to determine the geometry and character of the urban morphology), an orthophoto mosaic (to accurately determine the boundaries between the main objects within the surveyed area), a classified point cloud (based on which the main land cover types and extent are determined) and a thermal orthorectified and georeferenced image providing information.
Step 4. Data calibration: Filter and correct the thermal image by applying Focal statistics filtering, which allows the reduction of ‘noise’ in the output raster, for this purpose the value of each cell in the output layer of the imagery is modeled as a function of the values of all input cells that are in a certain neighborhood around that location. The resulting output allows to limit of the likelihood that atypical/erroneous cells from the model distort the data, which are subsequently used for the interpretation of the LST, and consequently, for the calculation of the SUHI intensity.
Step 5. Local climate zoning definition and basic indicators calculations: Based on the created orthophoto map, digital surface model, and classified point cloud, the LCZ and their main metadata, geometric, and morphological characteristics are determined. This is done based on a regular grid with a defined cell size. The following metadata representation model was used in the characterization of the different LCZ types: Deriving baseline relationships between LST and LULC of organized space.
Within this step, the SUHI intensity is also calculated. For this, three approaches are possible:
- (1)
The classical approach uses comparative data analysis inside and outside the urban space. In this approach, the UHI intensity is usually defined as the temperature difference between urban and non-urban locations (or areas) as shown in Equation (1):
where Tu-r is the UHI intensity, Tu is the urban temperature, and Tr is the rural temperature [
37].
In our concept, however, the approach is inapplicable because methodologically it is oriented primarily towards generating new data for inner-city spaces (and relatively limited in area).
- (2)
Another possible approach is UHI intensity calculation [
38] as the difference at a given time between the location with the highest temperature (Thigher) and the location with the lowest temperature (Tlower), according to Equation (2)
This method is applicable when limited data with relatively low spatial resolution are available, but can be used in the present methodology.
- (3)
Against this background, and based on the high spatial resolution and quality of the geospatial data in the application of the current methodology, a third approach is possible, where the so-called ‘intra-urban intensity’ is calculated, where the calculation of the SUHI intensity is represented as a difference between the temperature of each urban location within the urban space under study (residential complex) and the average minimum temperature of the land cover class with the lowest surface temperatures, within that same space, as shown in Equation (3):
where Tn—is the temperature at the given location, and TaverMIN is the average minimum temperatures of the peripheral non-build and natural land cover types within the urbanized area. This approach allows us to assess more effectively the degree of intensity of SUHI within a given urban unit and provides high spatial resolution information within any specific portion of an urban area or spatial urban unit, which is an important necessity in urban planning procedures. It also provides information on the heat load of individual land cover types as well as information data on the heat load for different spatial combinations of land cover types [
39].
Step 6. Problem-oriented zoning: Targeted problem-oriented zoning of the study area that allows for comparative analysis of management and business-related information within the study area. For this purpose, a z-transformation of the temperature values for the delineated local climate zones is performed, calculated by averaging the temperature data of the individual pixels that fall within the respective zone. The results of this transformation are reflected in a map showing the spatial distribution of the different heat loads in the corresponding study zone [
40].
The data for LST were used for the preliminary estimation of the heat load. Calculations are made based on the standardized temperature values by the applied z-transformation according to the following formula [
41]
where X is the mean temperature of a single test cell, µ is the mean temperature of all cells tested, and σ is the standard deviation of the mean LST of all cells.
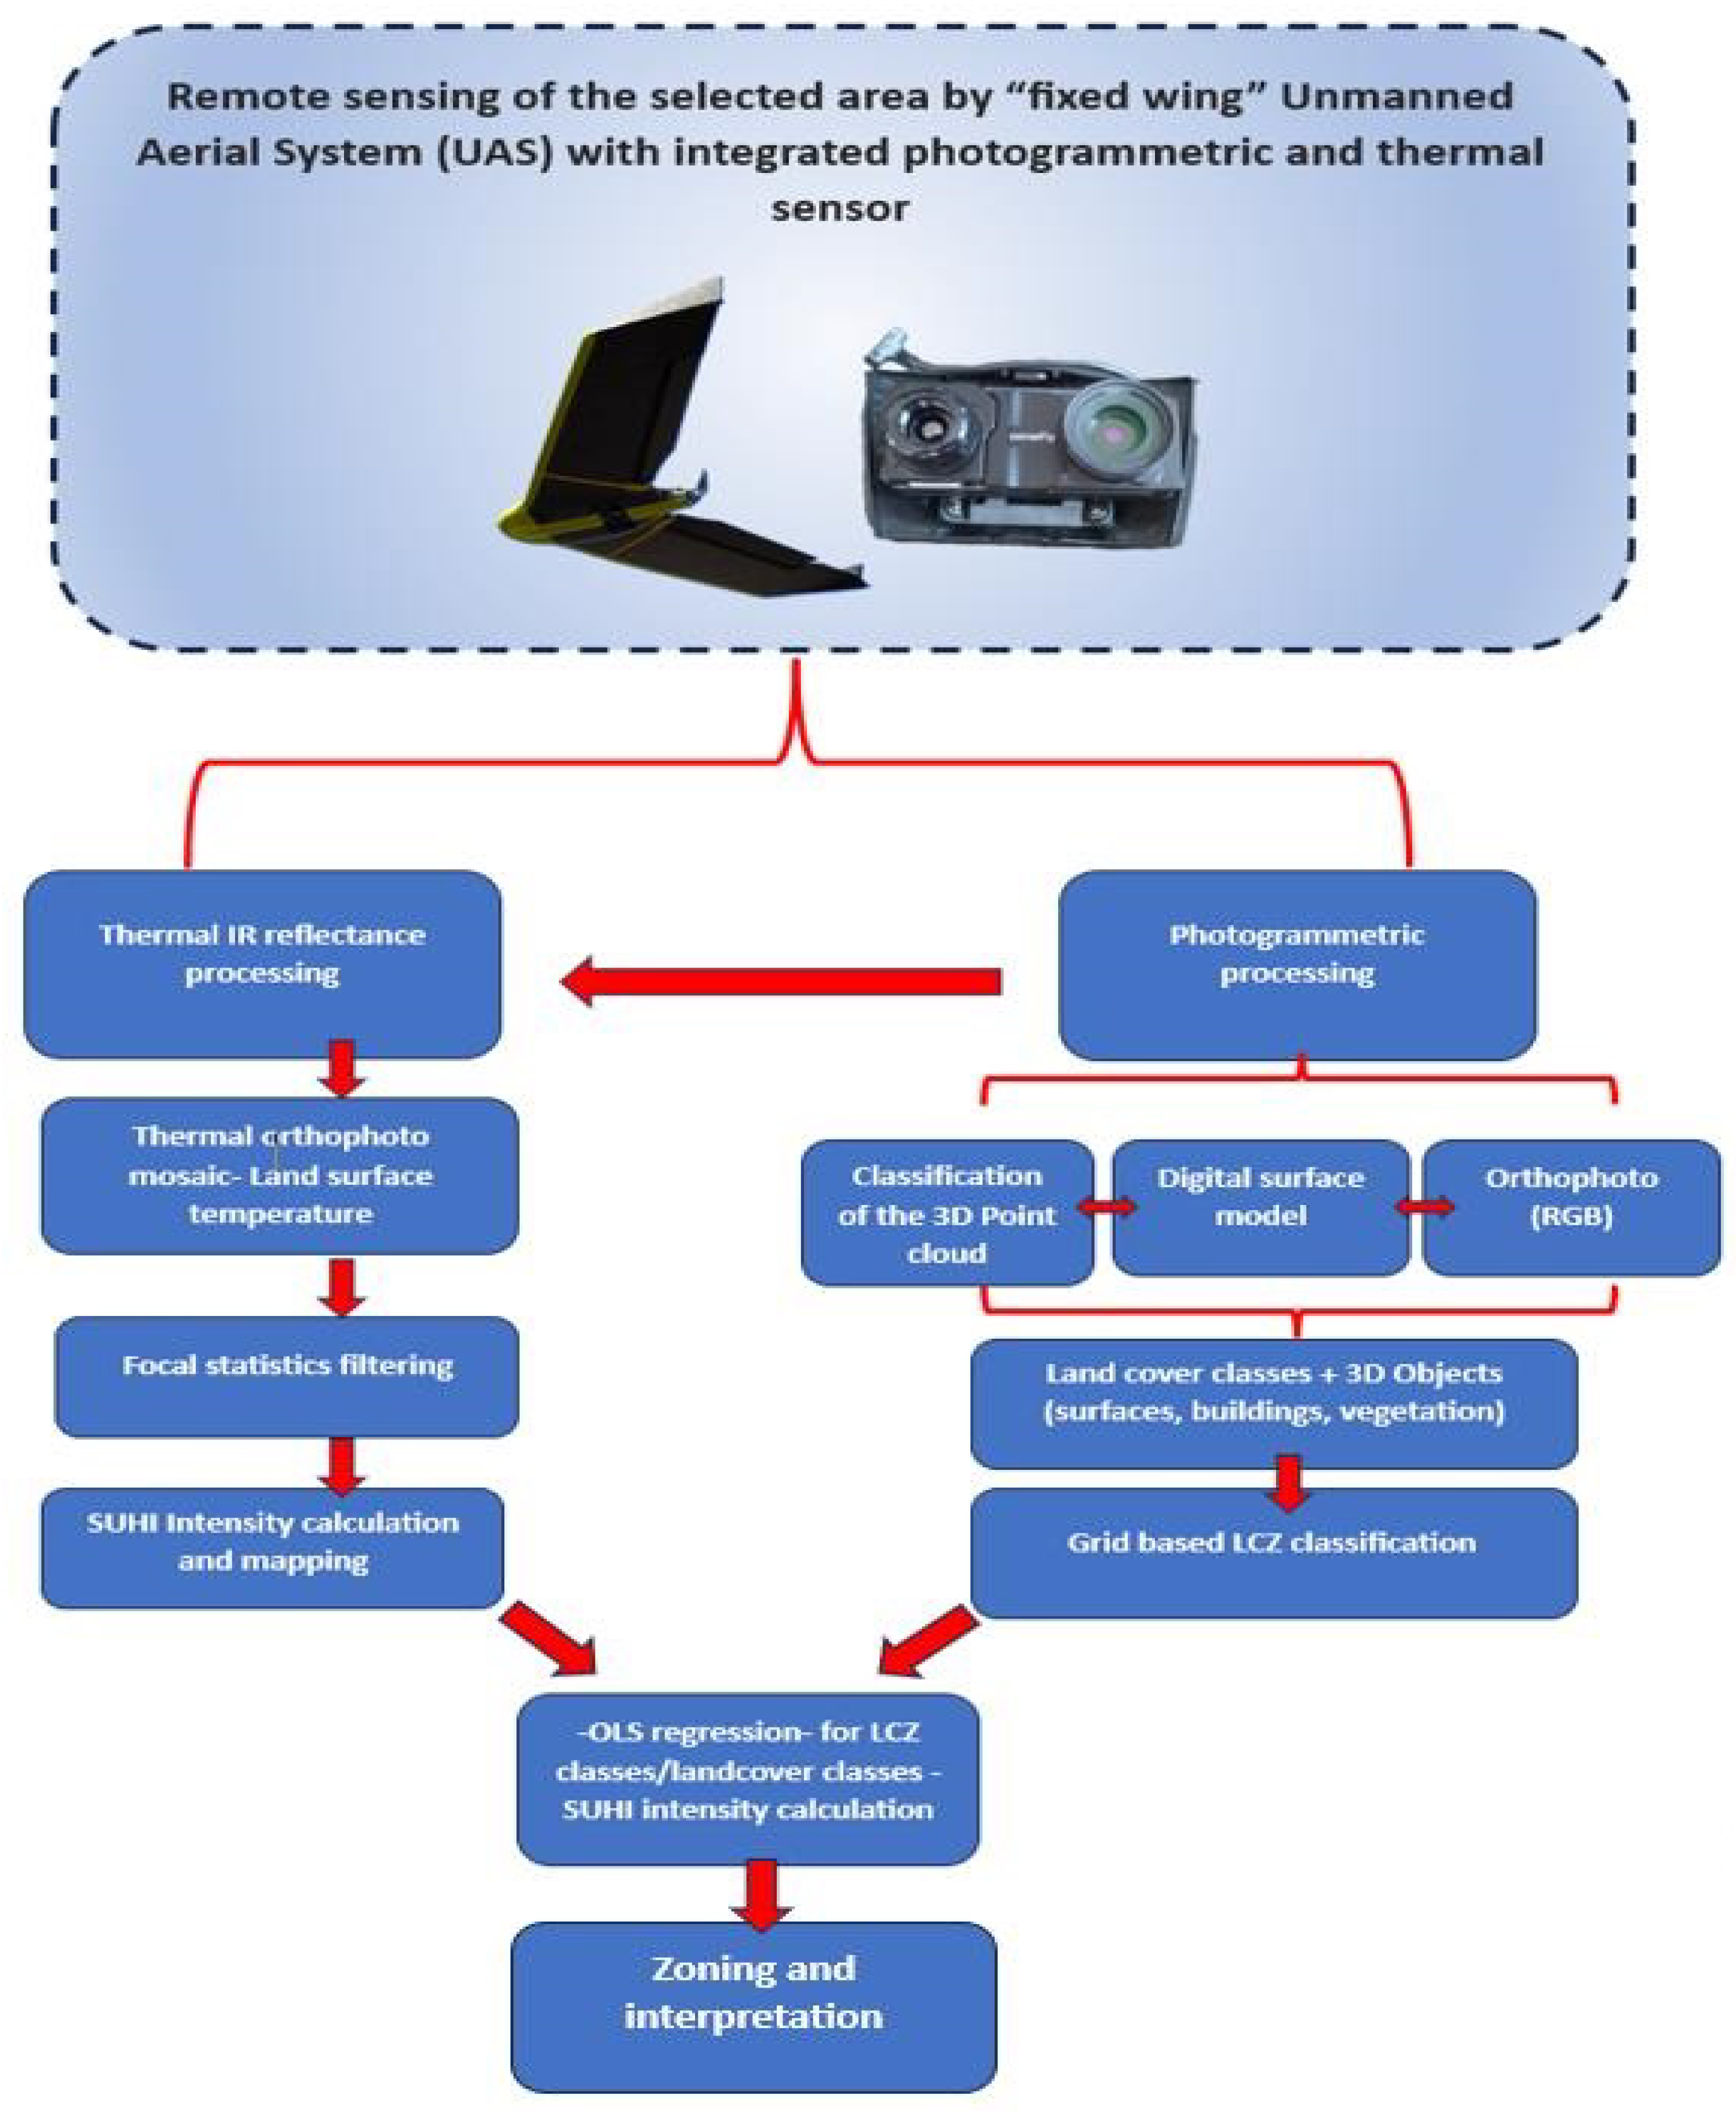
The whole scheme of the proposed methodology is presented in the figure below (
Figure 3).
Based on the characteristics of the used approaches, methods, and technological tools, as well as the achieved results, we can confirm that the proposed methodology is suitable for urban areas of different natures, providing comprehensive data and information resources with high spatial resolution, and objectively characterizing diverse aspects of the SUHI phenomenon. In the results section, some of these aspects are presented, and the information resources for them are generated based on the field investigations carried out in the test urbanized area.
3. Results
The results of the implementation of the methodology described above reflect the main characteristics of the SUHI phenomenon. The main advantage of the achieved results is mainly based on the ability to generate data with high spatial resolution, as well as a temporal resolution that corresponds to the most appropriate period to objectively characterize the phenomenon (up to 2 hours after the sunset). The data in this study were collected over several consecutive years, from 2021 to 2024, in the largest residential area of the Bulgarian capital - the Lyulin residential complex, forming a significant part of the western periphery of the city of Sofia. The collection procedures were carried out in mid-July, in conditions of prolonged heat waves, which are typical for the climate of the area during this part of the year. Although the study area is the same and the data collected have identical spatial characteristics, different survey schemes have been applied over the years. For example, in 2021 and 2022 the field data collection surveys were conducted on a stratified sample basis for the individual LCZs identified for the area. The aim in this case is to provide qualitative metadata to help more adequately identify the characteristics of the LCZ types in the study area from which to determine the key parameters of the SUHI effect. In 2023, for the first time, we used a complete coverage approach of the study residential area, and within 4 consecutive days, the entire study residential area, which covers an area of about 5.7 km2, was surveyed by using thermal photogrammetry through the Duet T integrated sensor. For this purpose, the area was divided into 4 relatively equal parts, with one part imaged on each of the days. This division was necessitated by the technical impossibility of using more than one camera, which in turn limited us to capturing one of the designated parts of the survey area per evening for the specified time interval between 20:30 and 22:00. In addition, a complete survey of the study area was carried out with a 3D photogrammetric camera S.O.D.A., applying a cross-over scheme with a high degree of image overlap (80%) to obtain the most complete and realistic digital representation of the geometry and morphology of the study area. Some of the results of this study were published in the same year [
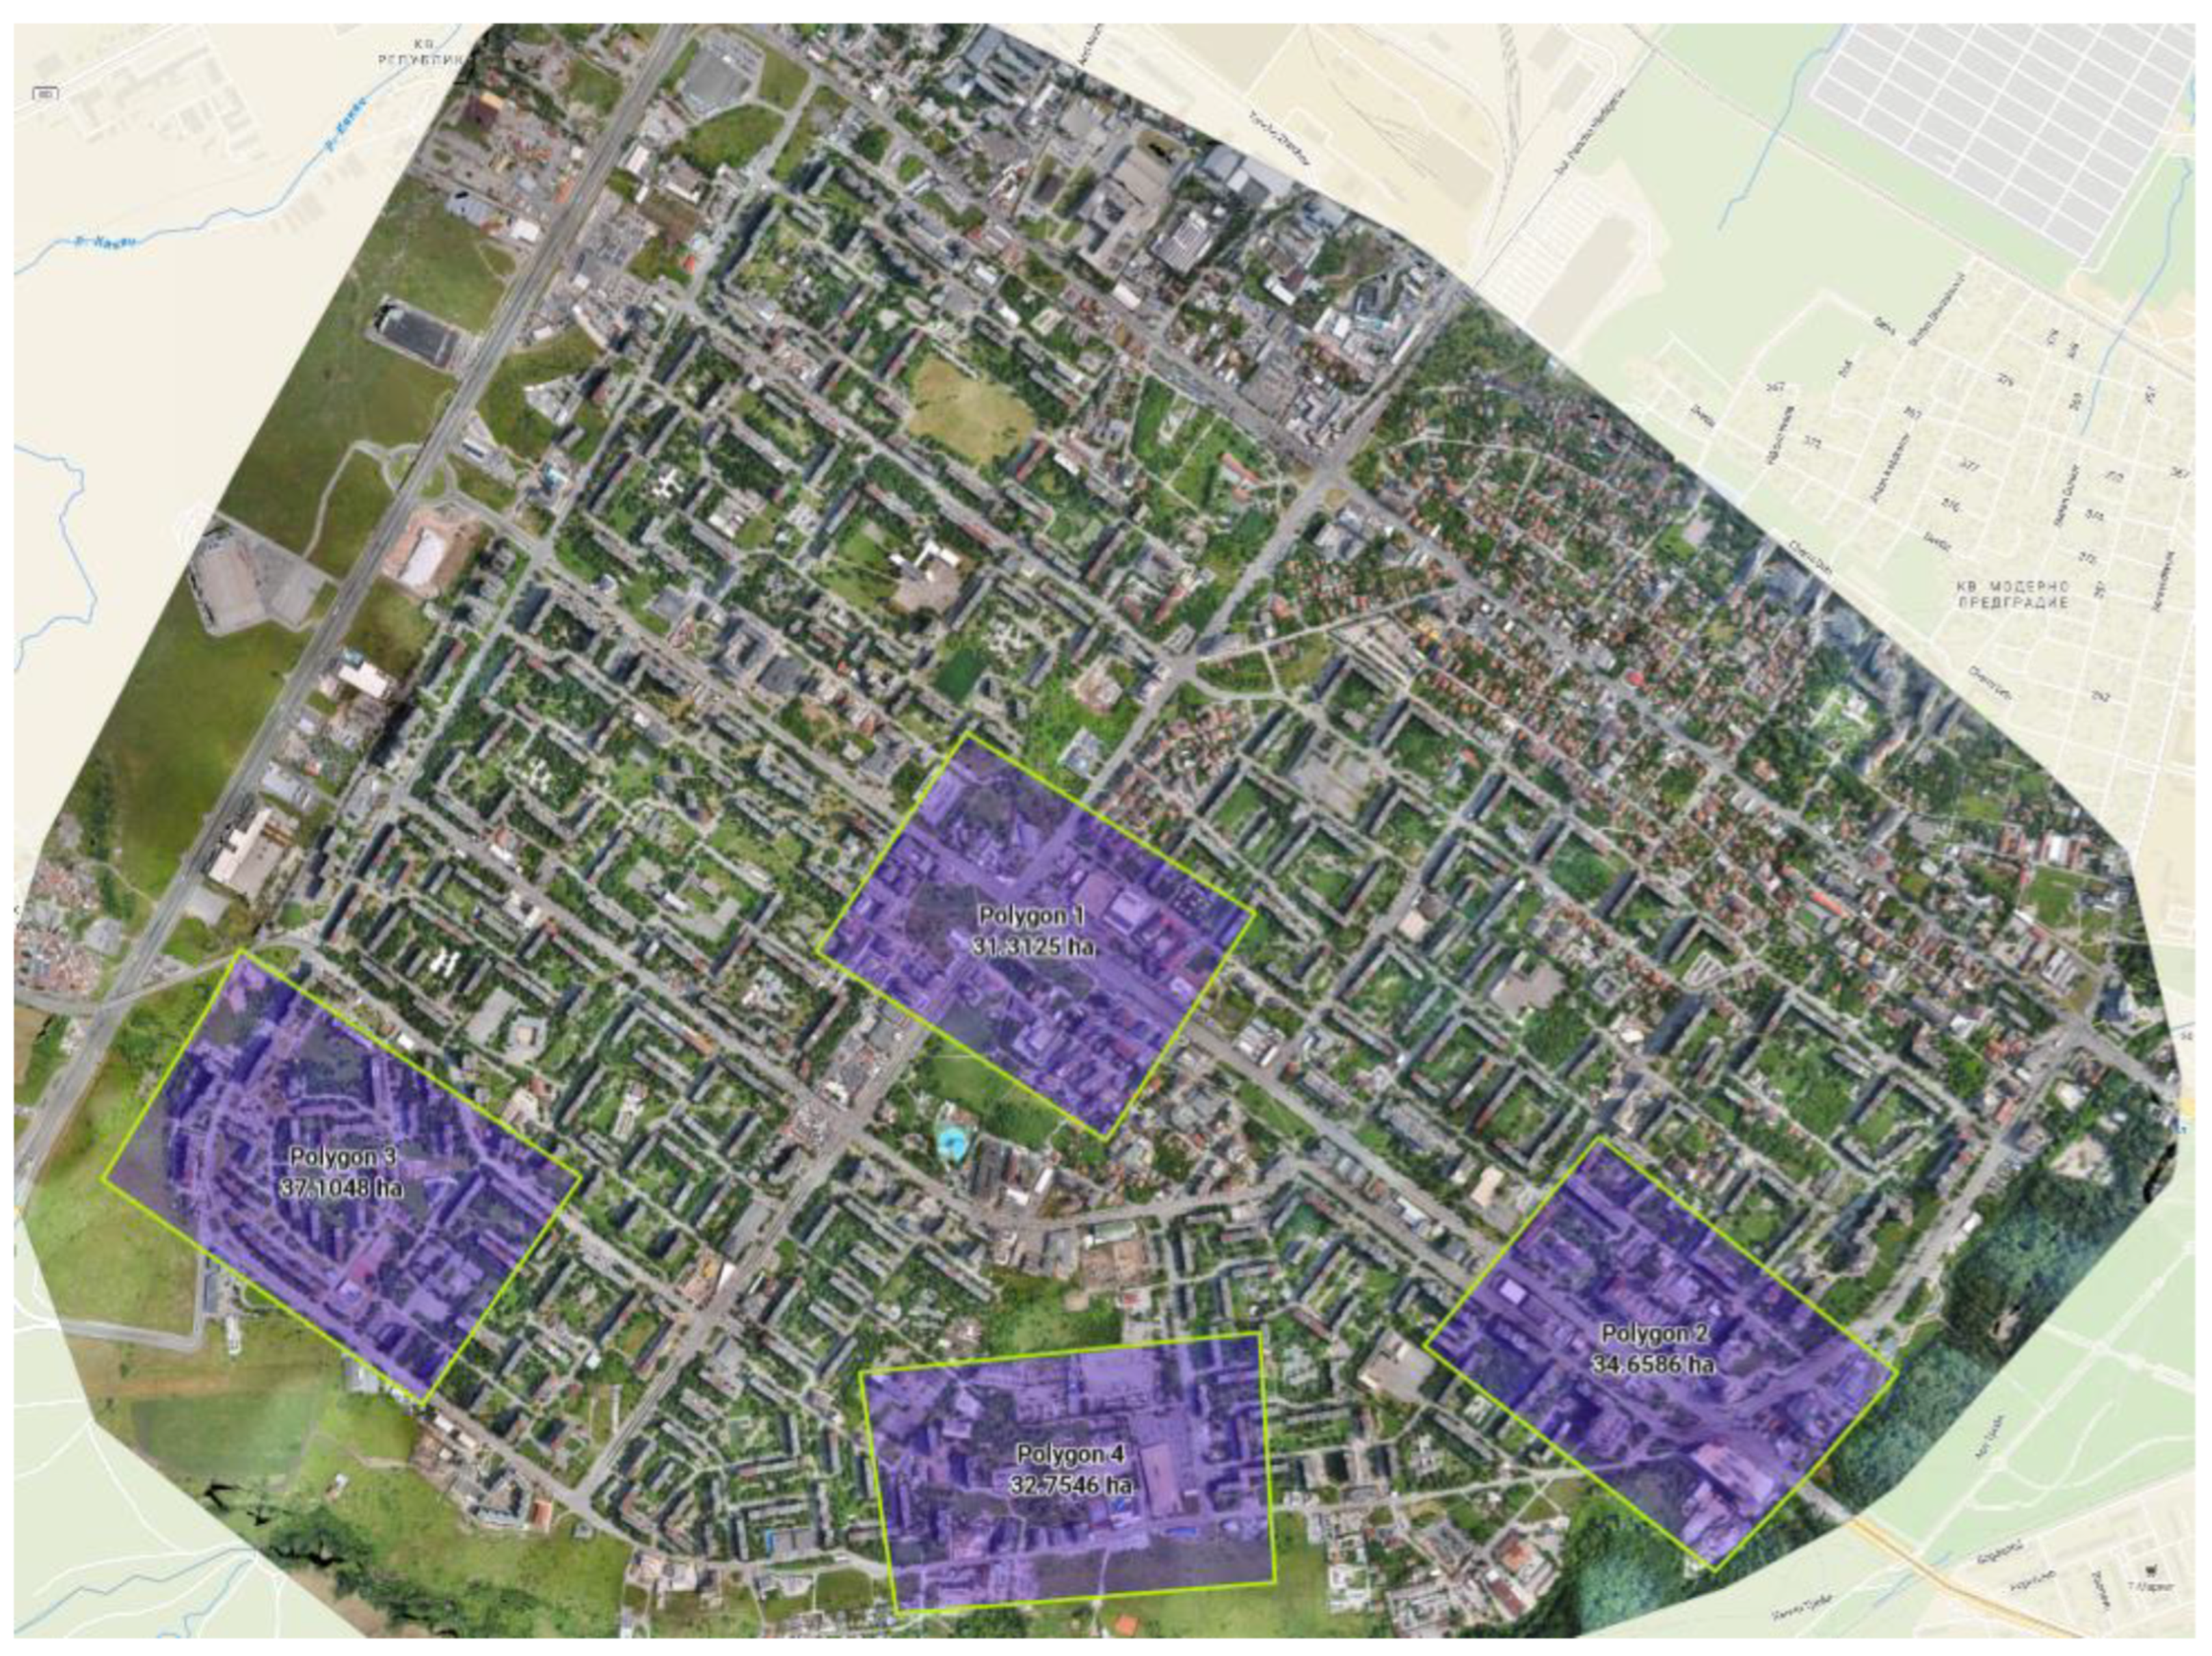
39]. The last survey was carried out between 11.07.-17.07.2024, and in this case, a different approach was used - four key areas in the residential complex were identified (
Figure 4), and surveyed every evening with an integrated sensor, with precisely defined flight parameters, at the same periods. The purpose of this study was related to obtaining additional monitoring data on the response of individual sites and land cover types to the intensifying heat wave.
The collected data from the two sensors (photogrammetric and thermal radiometric) from all years were processed in the Pix4D mapper platform based on the 'rely on relatives and match only reference camera' method. In this case, the thermal radiometric images, which are of significantly lower resolution are sharpened by the visual features from RGB. Images captured by S.O.D.A photogrammetric camera, integrated with the thermal radiometric one. The sharpening method requires a fixed system of thermal (TIR) and RGB cameras, which is the used DuetT integrated sensor. For capturing the TIR image, it is necessary to capture its corresponding RGB image and both images (TIR and RGB) are processed using the SfM method [
42].
Because of the application of the methodology developed and tested in this study, the following main results have been obtained, which are directly relevant to the objective characterization, assessment, and mapping of the SUHI effect, which are at the same time informative enough to support decision-making processes related to sustainable urban planning and the adaptation of urban areas to intensifying climate change:
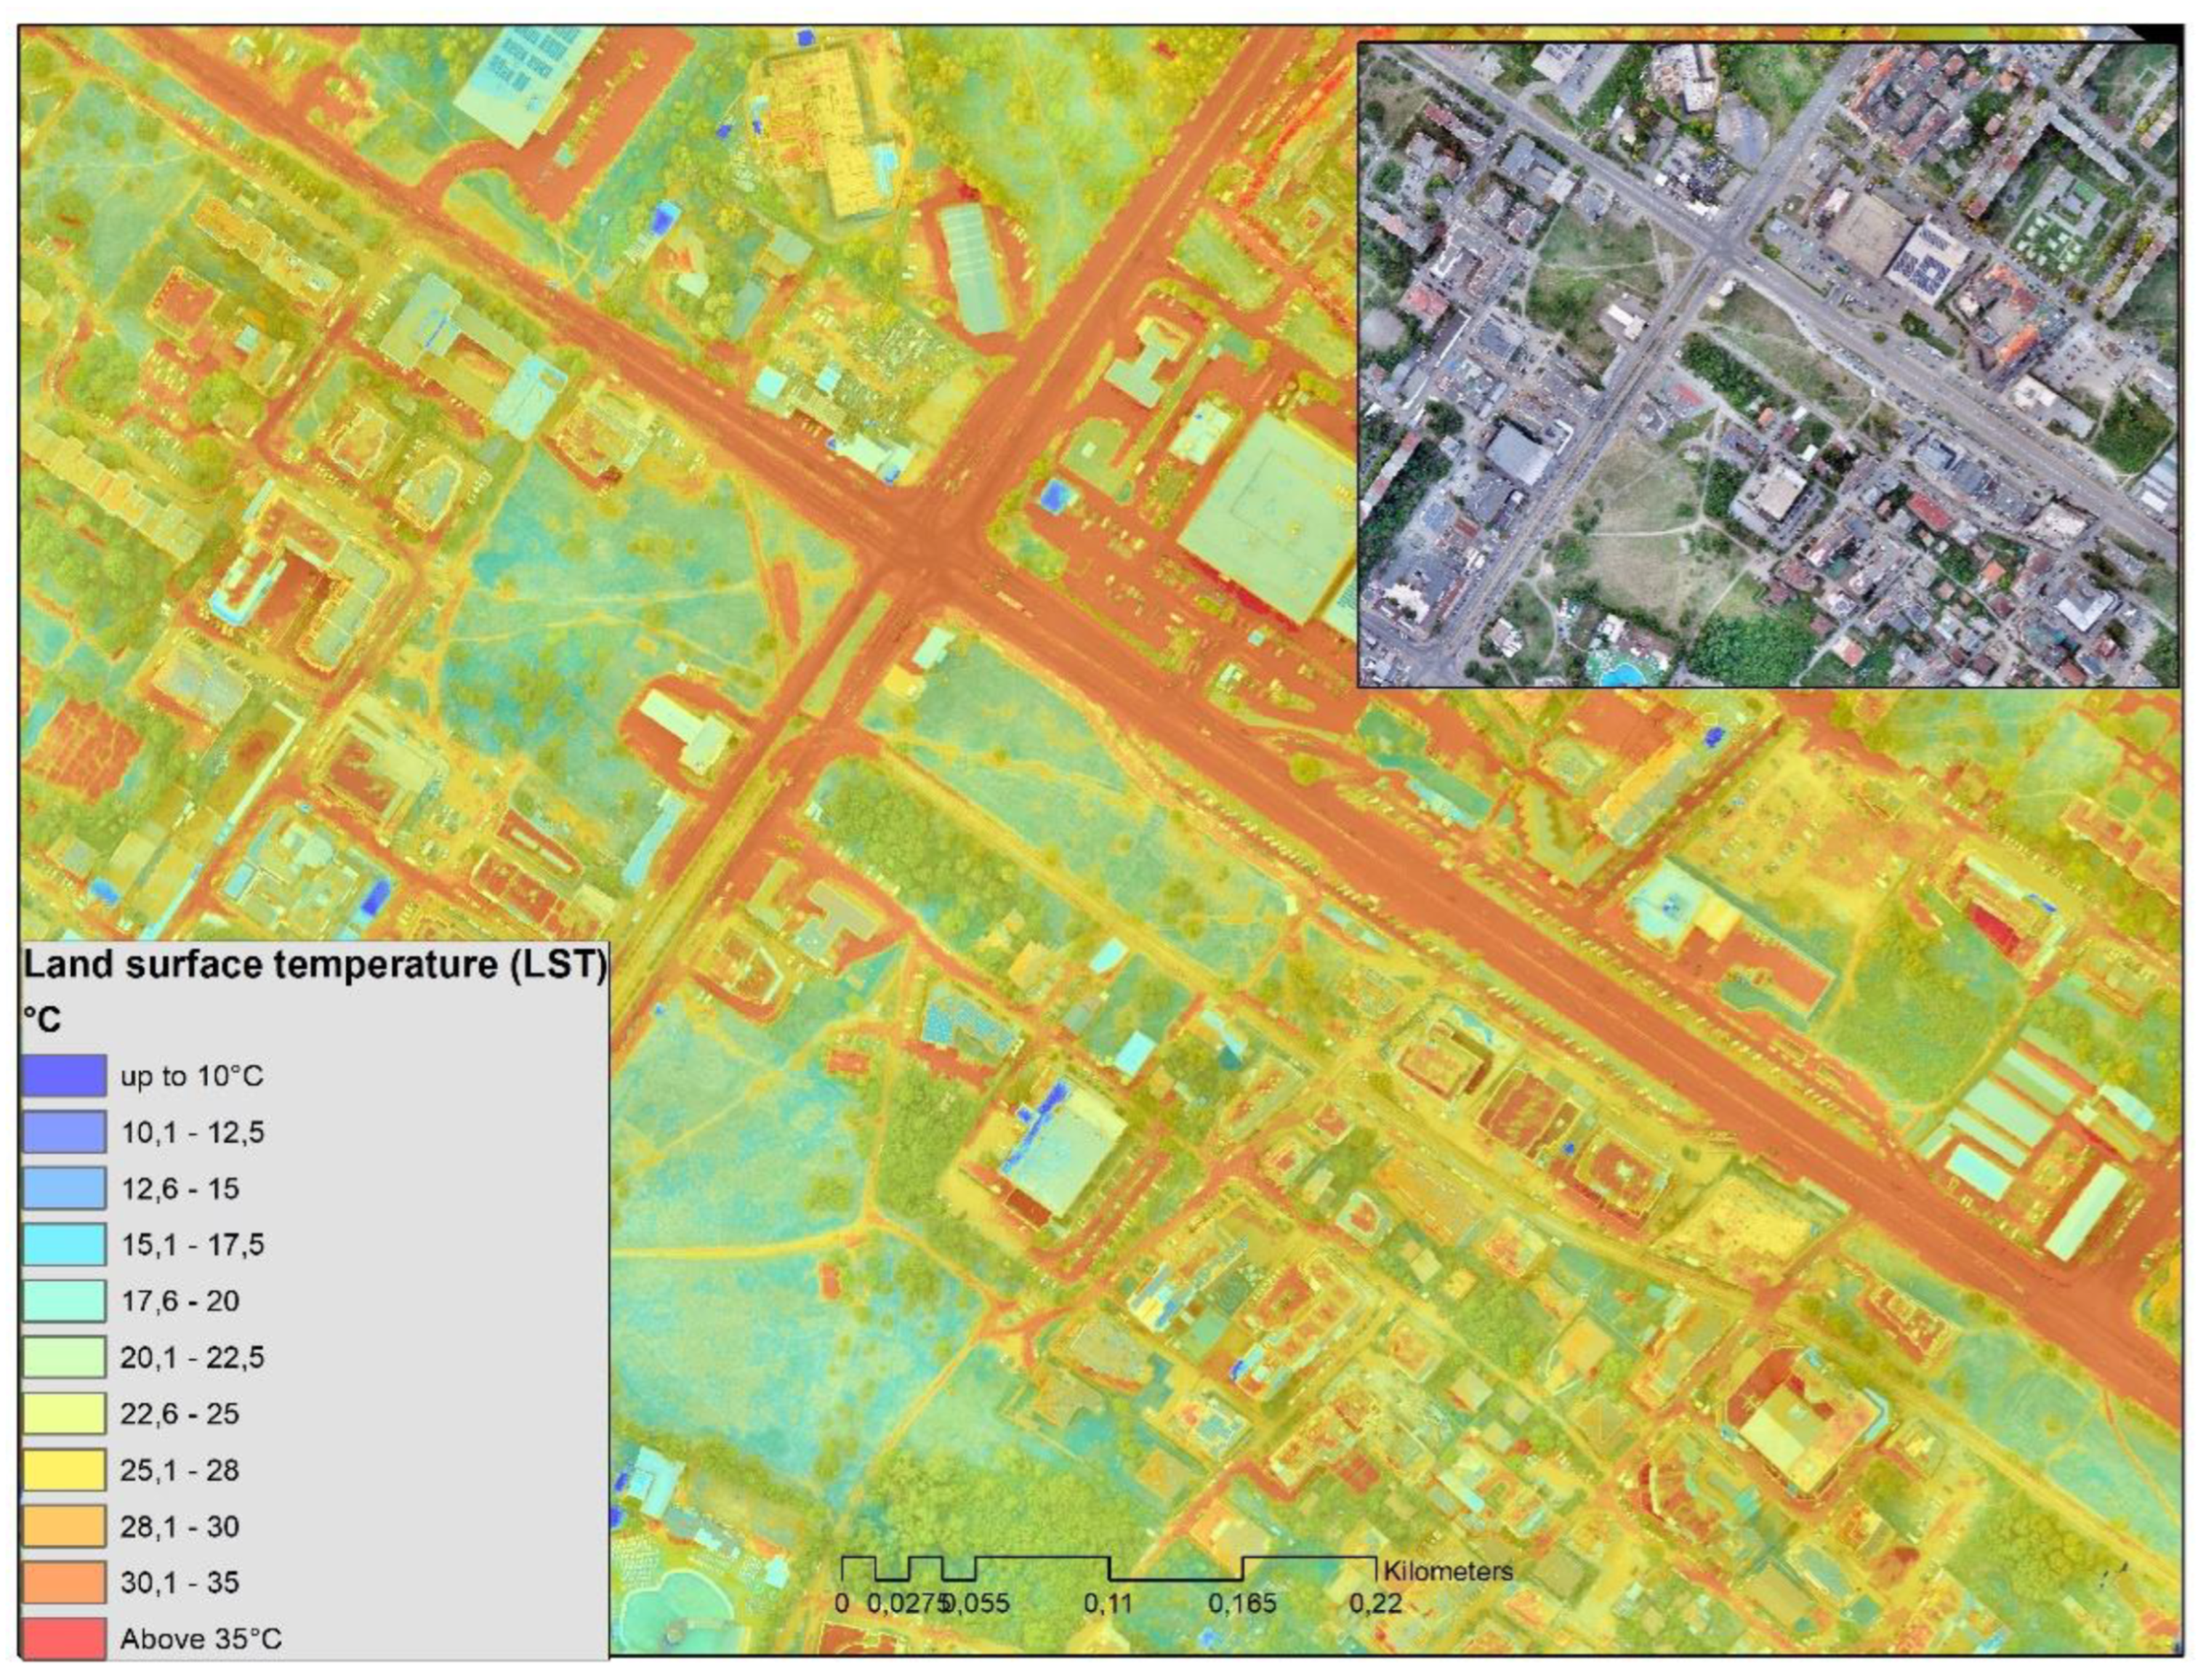
А. High spatial resolution LST mapping: Figure 5 below presents one of the major products of the applied methodology, presented in this paper, namely a high spatial resolution thermal map. The map shows a fragment of the central part of the Lyulin residential complex, the result from the survey in July 2023 in meteorological conditions of a heat wave:
The model presents a detailed thermal orthophoto mosaic with high spatial resolution, in this case, the same is generated by the integrated processing of thermal and RGB images: 15 cm/pixel for TIR and 2.6 cm/pixel for RGB. The result is a sharpened thermal orthophoto mosaic with a spatial resolution of 3 cm/pixel, which provides an opportunity to analyze and interpret the SUHI phenomenon in a complex and highly variable urban environment, including precisely identifying the different thermal loads in the studied area. As a result, the attached images demonstrate the possibilities to analyses important details of the manifestation of the SUHI effect in the local urban fabric - the heating of different land cover types, surface types, and materials, including consideration of the configuration, size, and spacing of urban sites or the territorial proximity of natural green features.
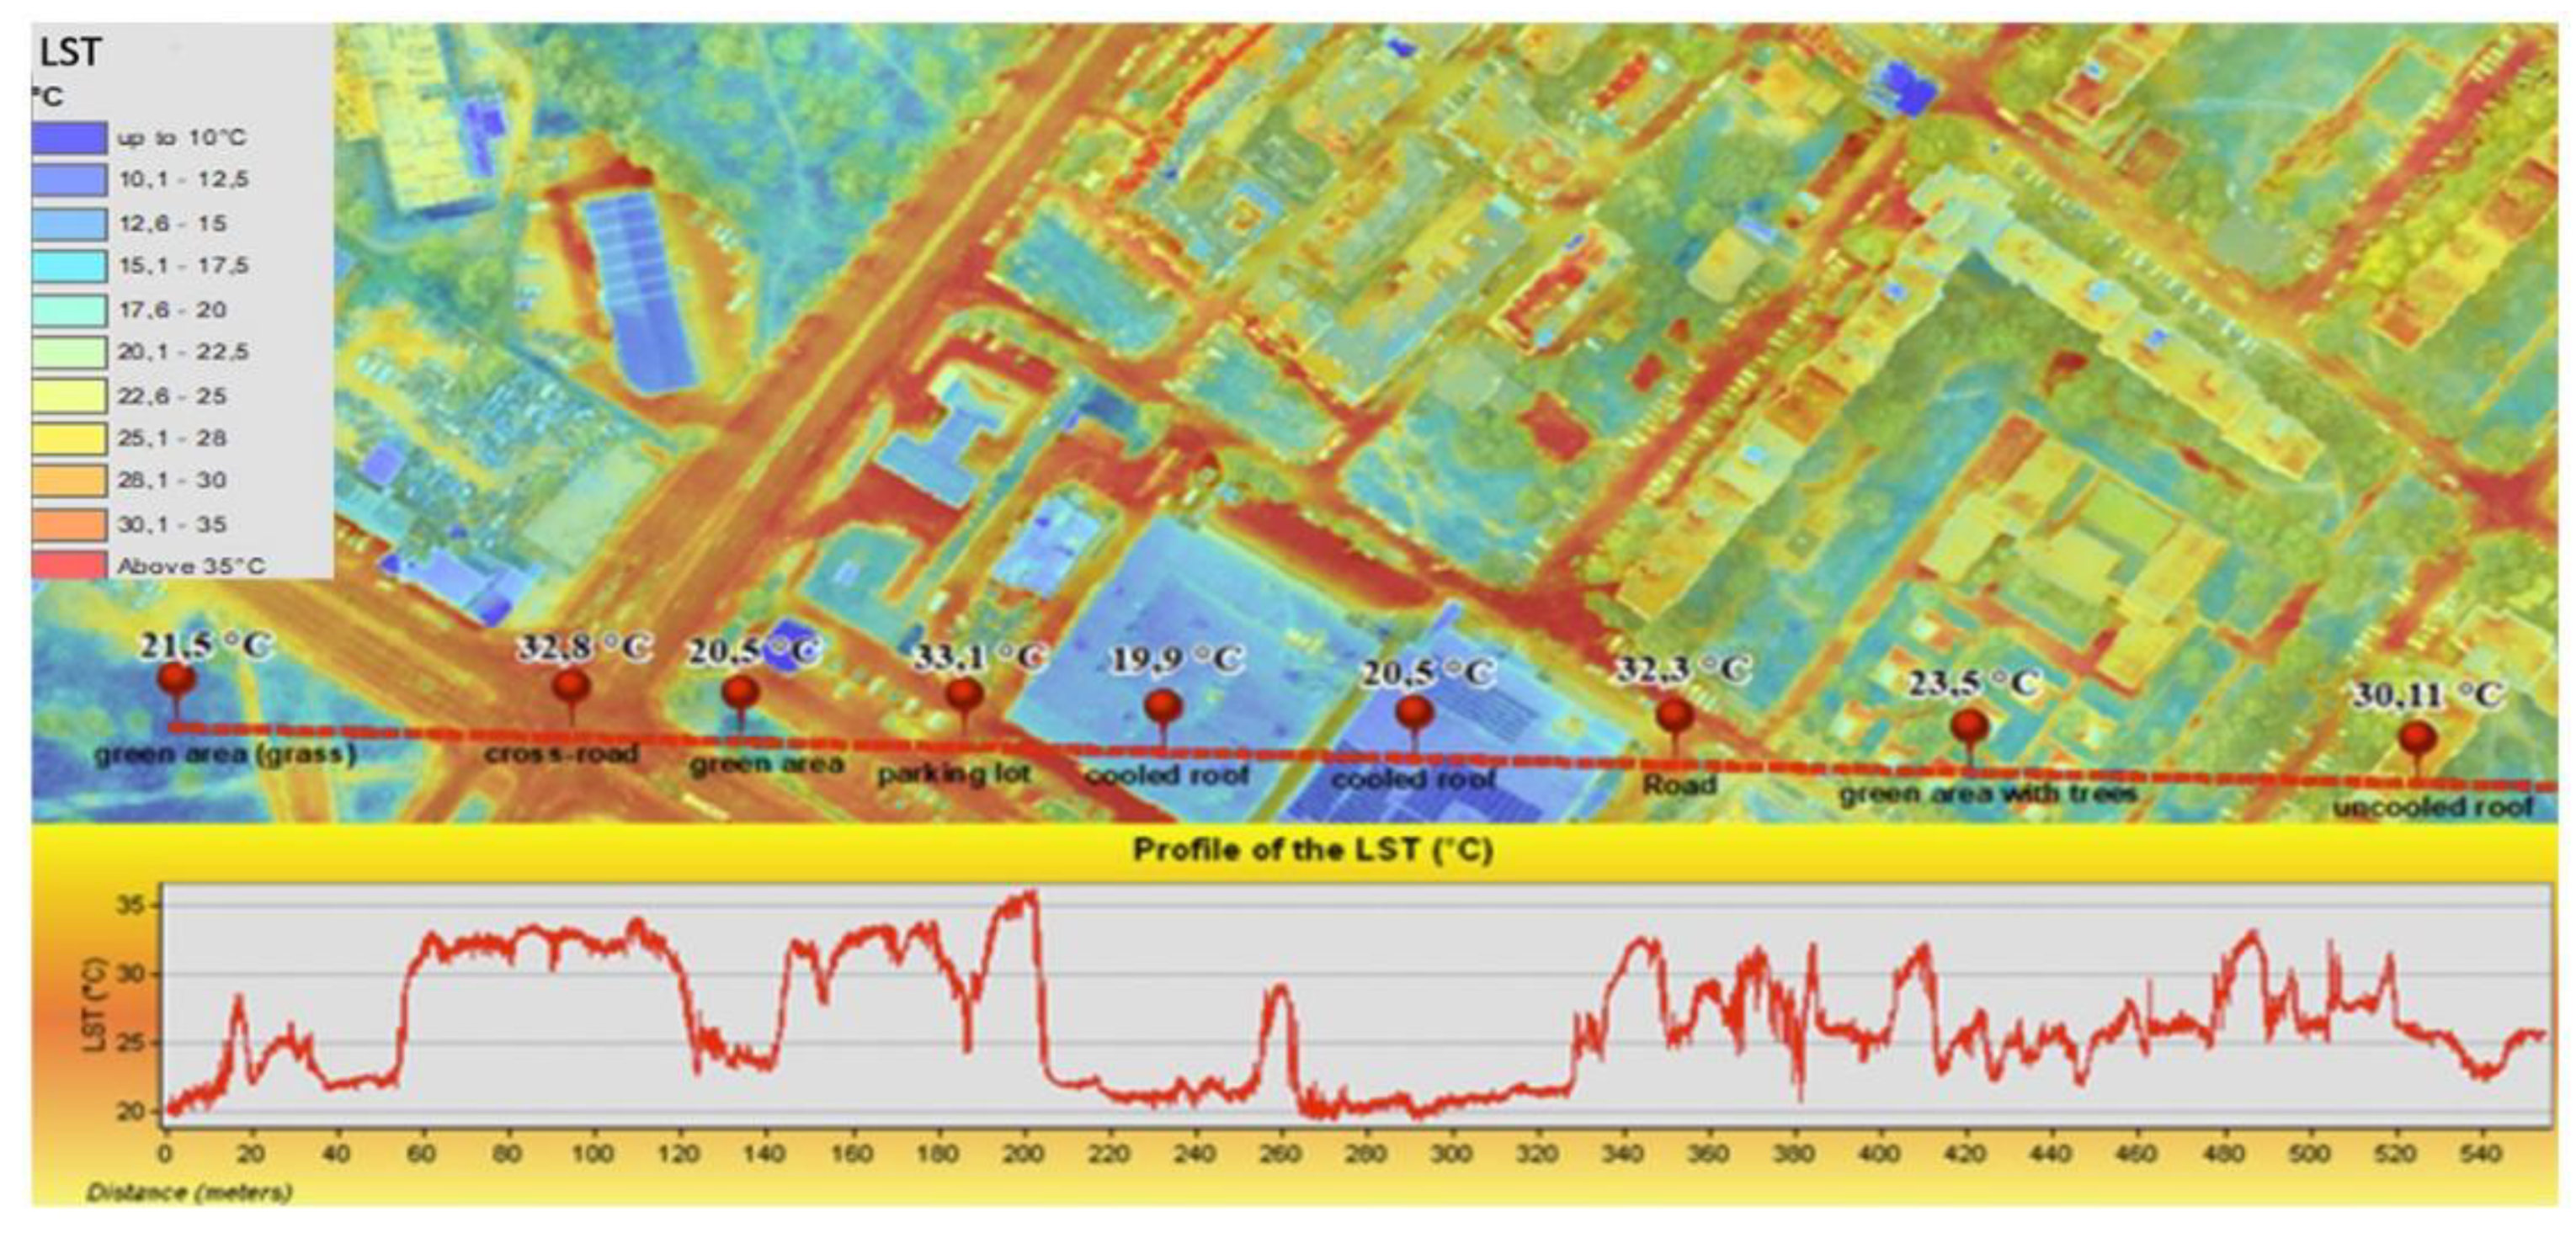
Figure 6 presents a thermal profile of the model that illustrates these capabilities.
B. Provision of adequate information base for studying the cooling effect of the green system: Detailed geo-referenced land surface temperature data provide a context for further analyses and assessments for the management and optimization of urban space under the pressure of much-needed adaptation to adverse urban climate events. For example, the current assessment of the cooling effect of green urban infrastructure [
43] and SUHI mitigation plans [
43].
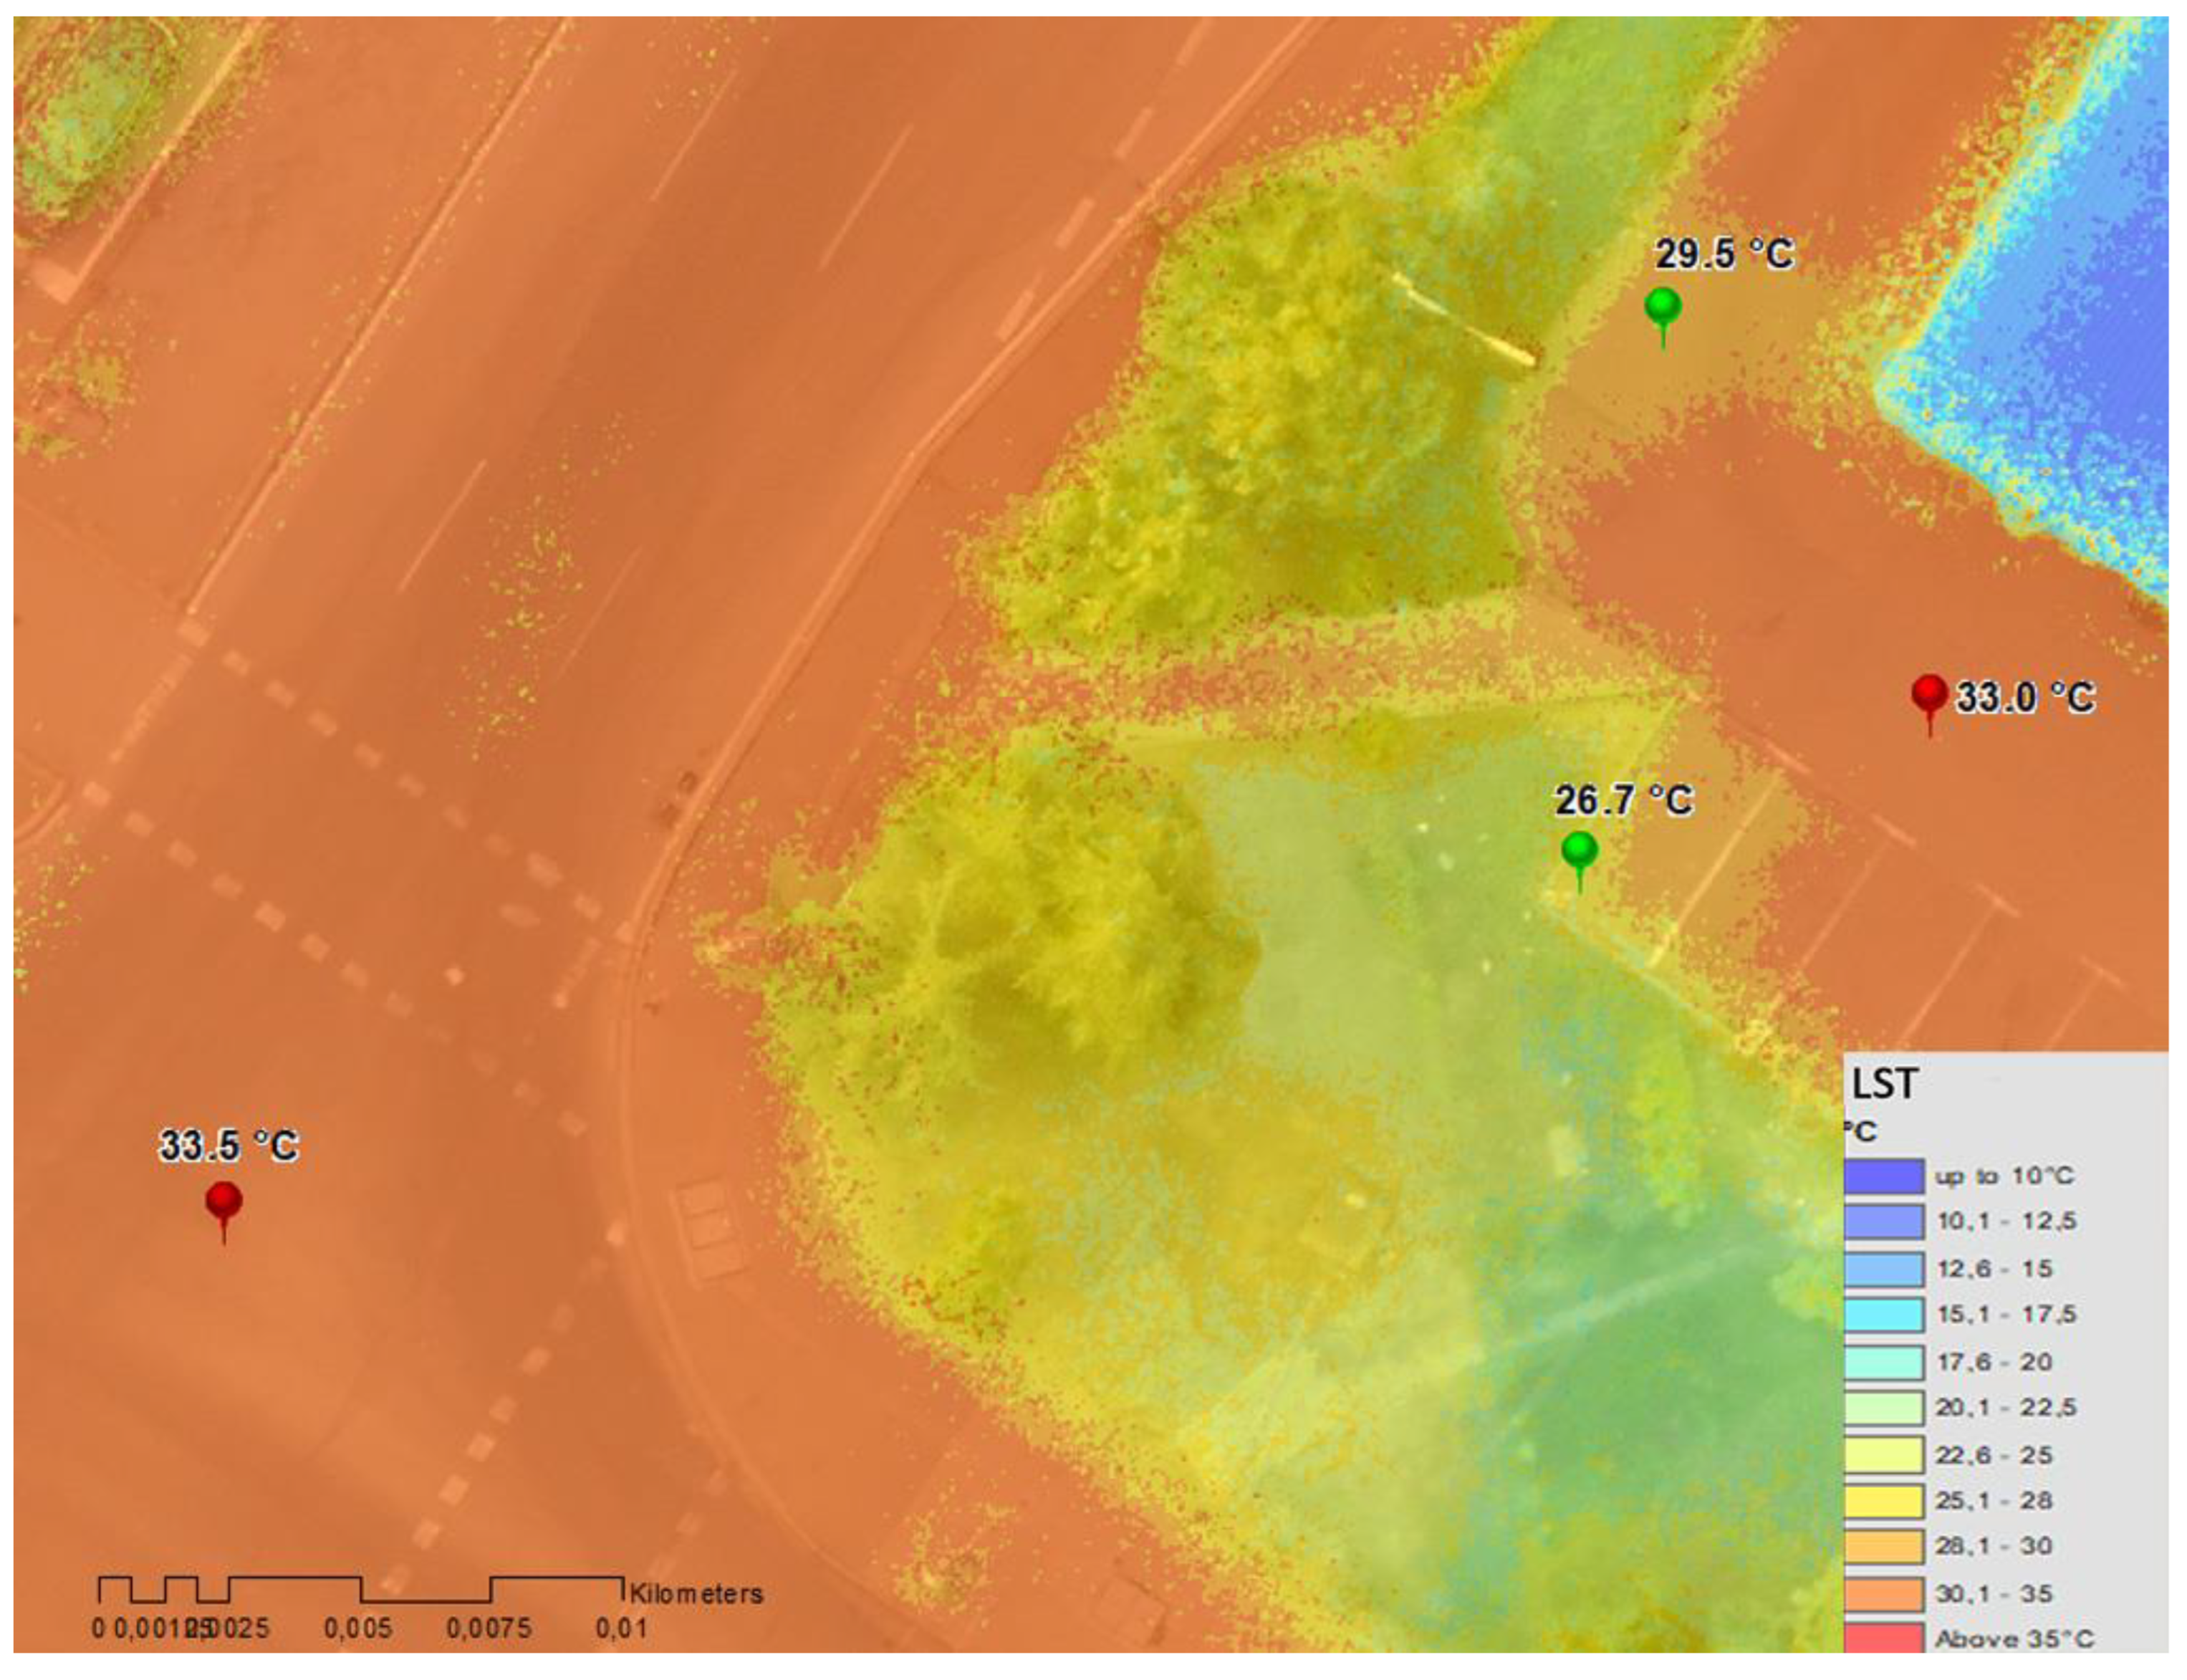
Figure 7 below presents the results of a series of studies conducted within the "Sofia-city" study area - here the cooling effect of three types of vegetation in the central part of the city can be traced: data with this high resolution clearly show how temperature reduction is recorded near trees and green areas.
The cooling effect is a highly valued ecosystem service with relevance to both the quality of the living environment and the sustainability of existing urban infrastructure. The shade from trees protects urban pavements from thermal variations over the day and year and thus extends its service life [
44].
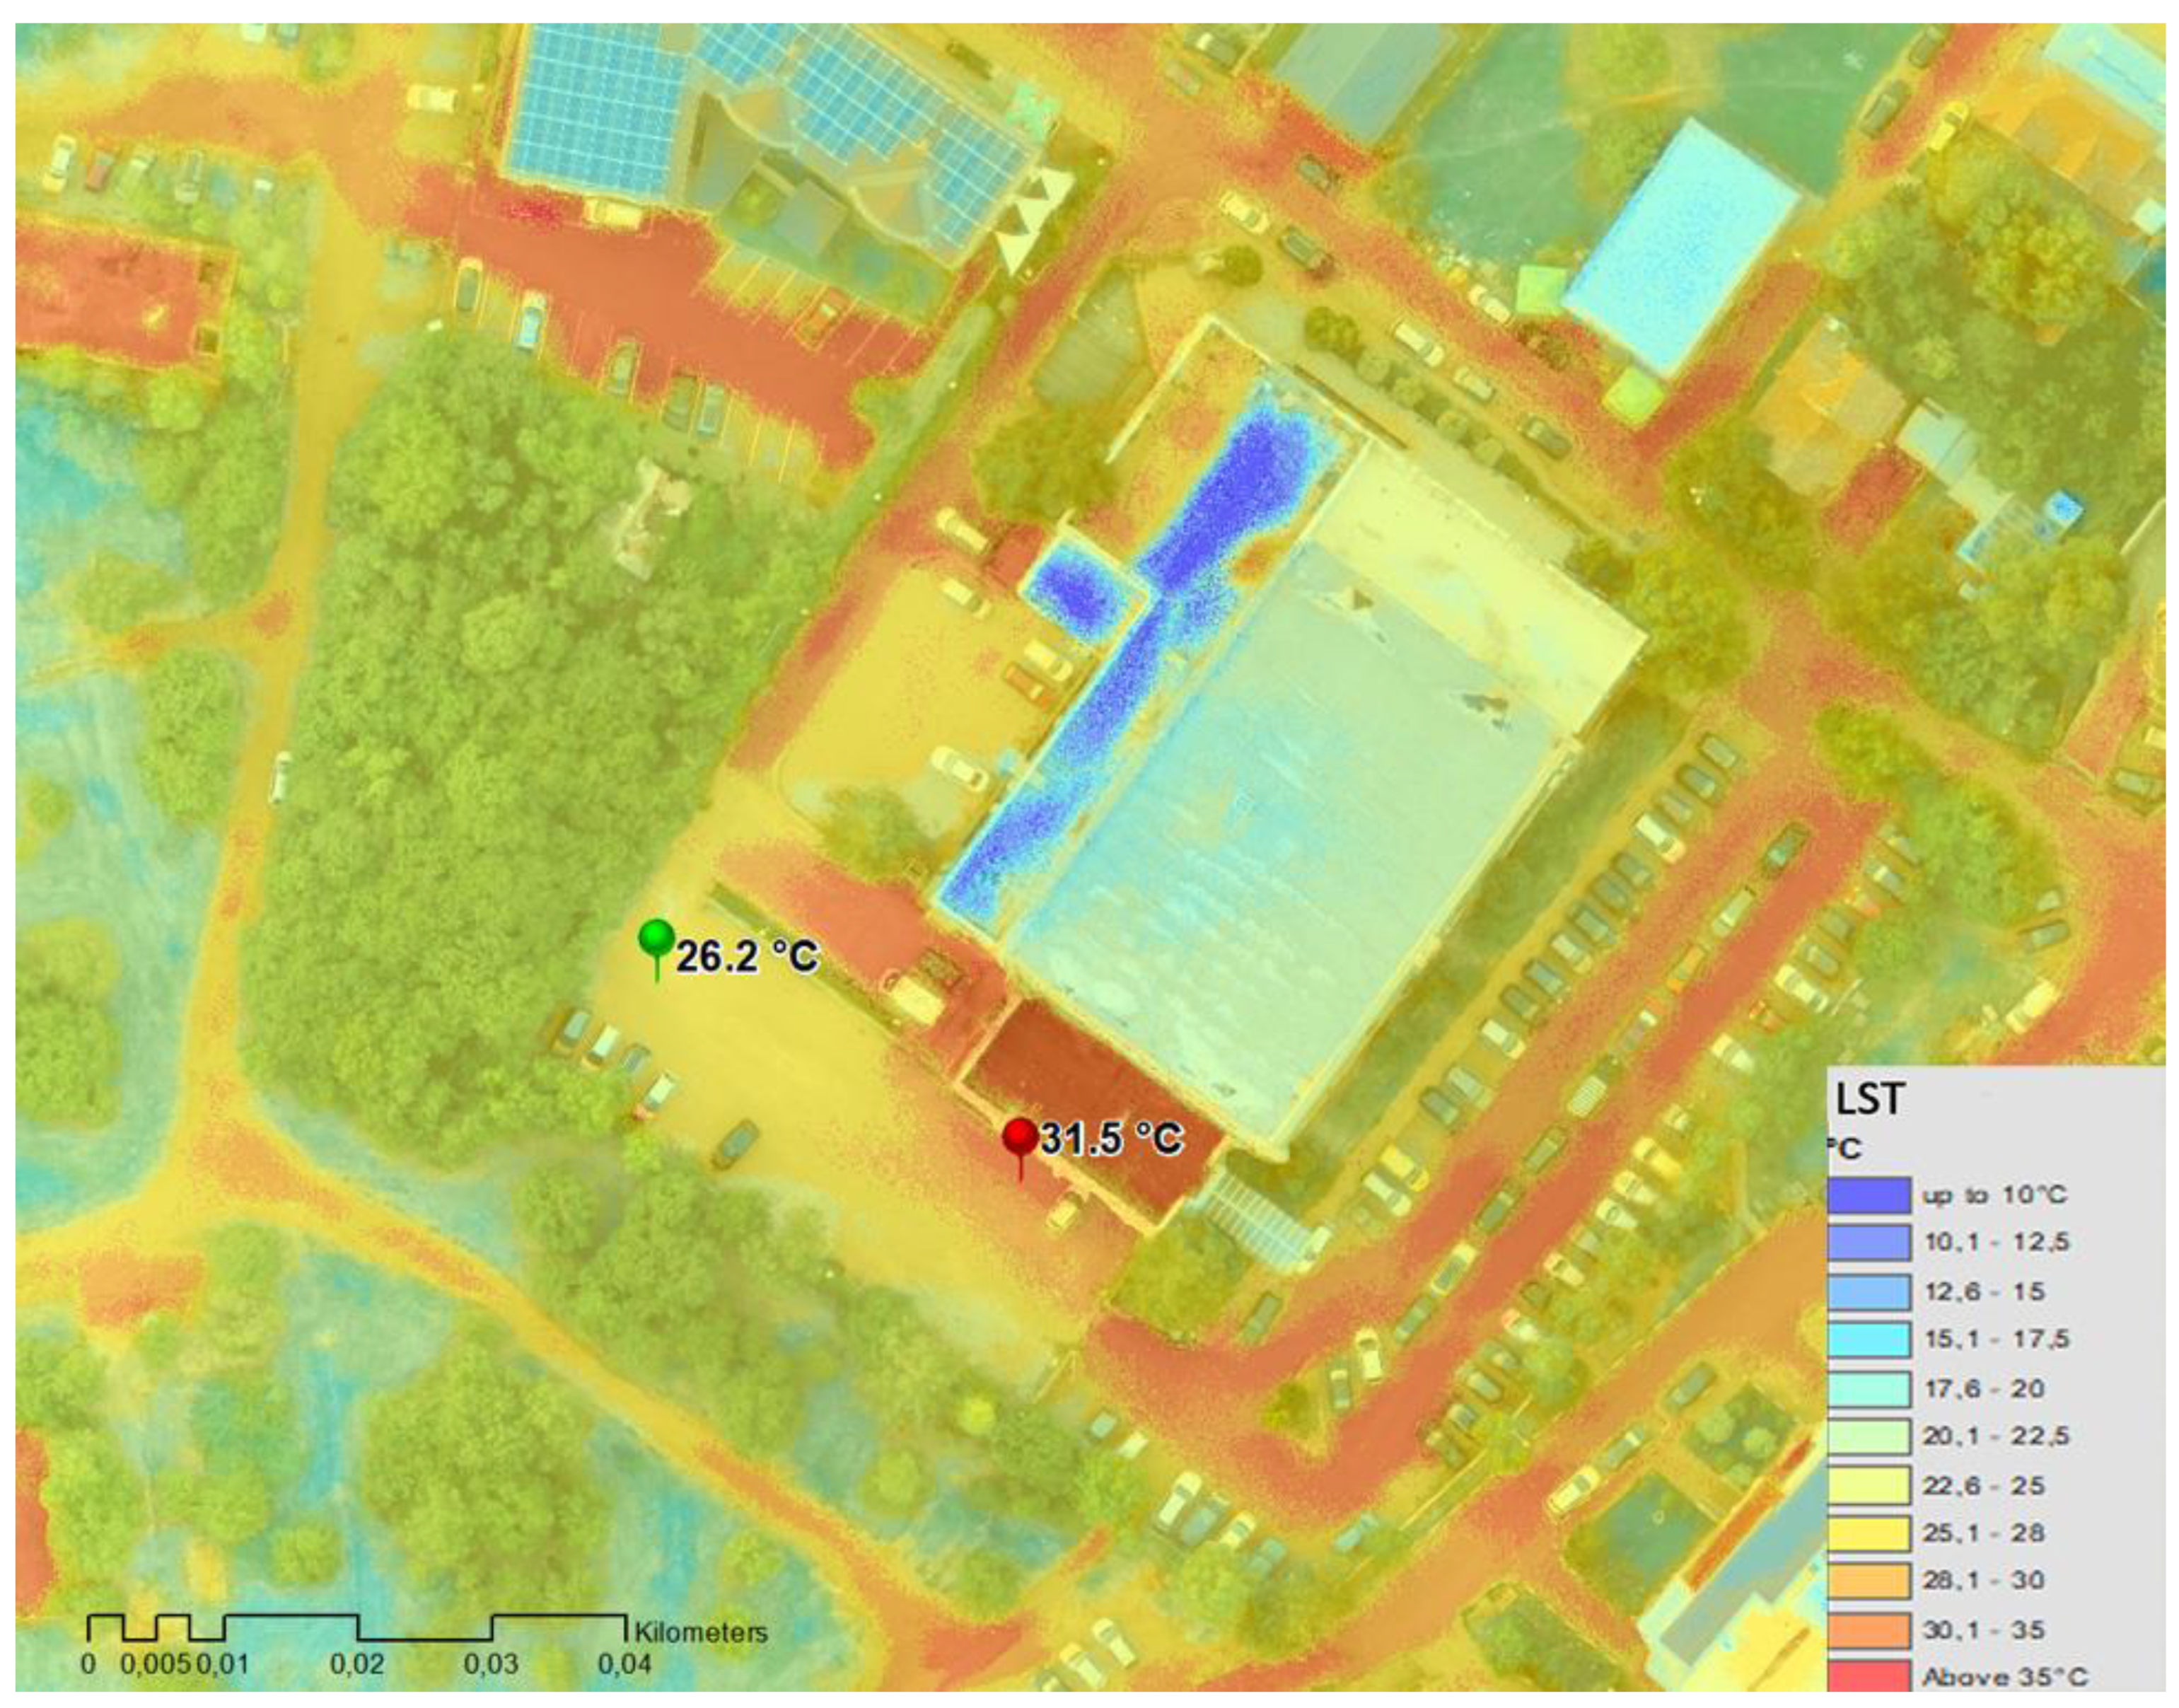
Another example of the effect of vegetation within a sealed space: the temperature near tree cover is more than 5 °C cooler than the part that is further away from the trees (
Figure 8).
In
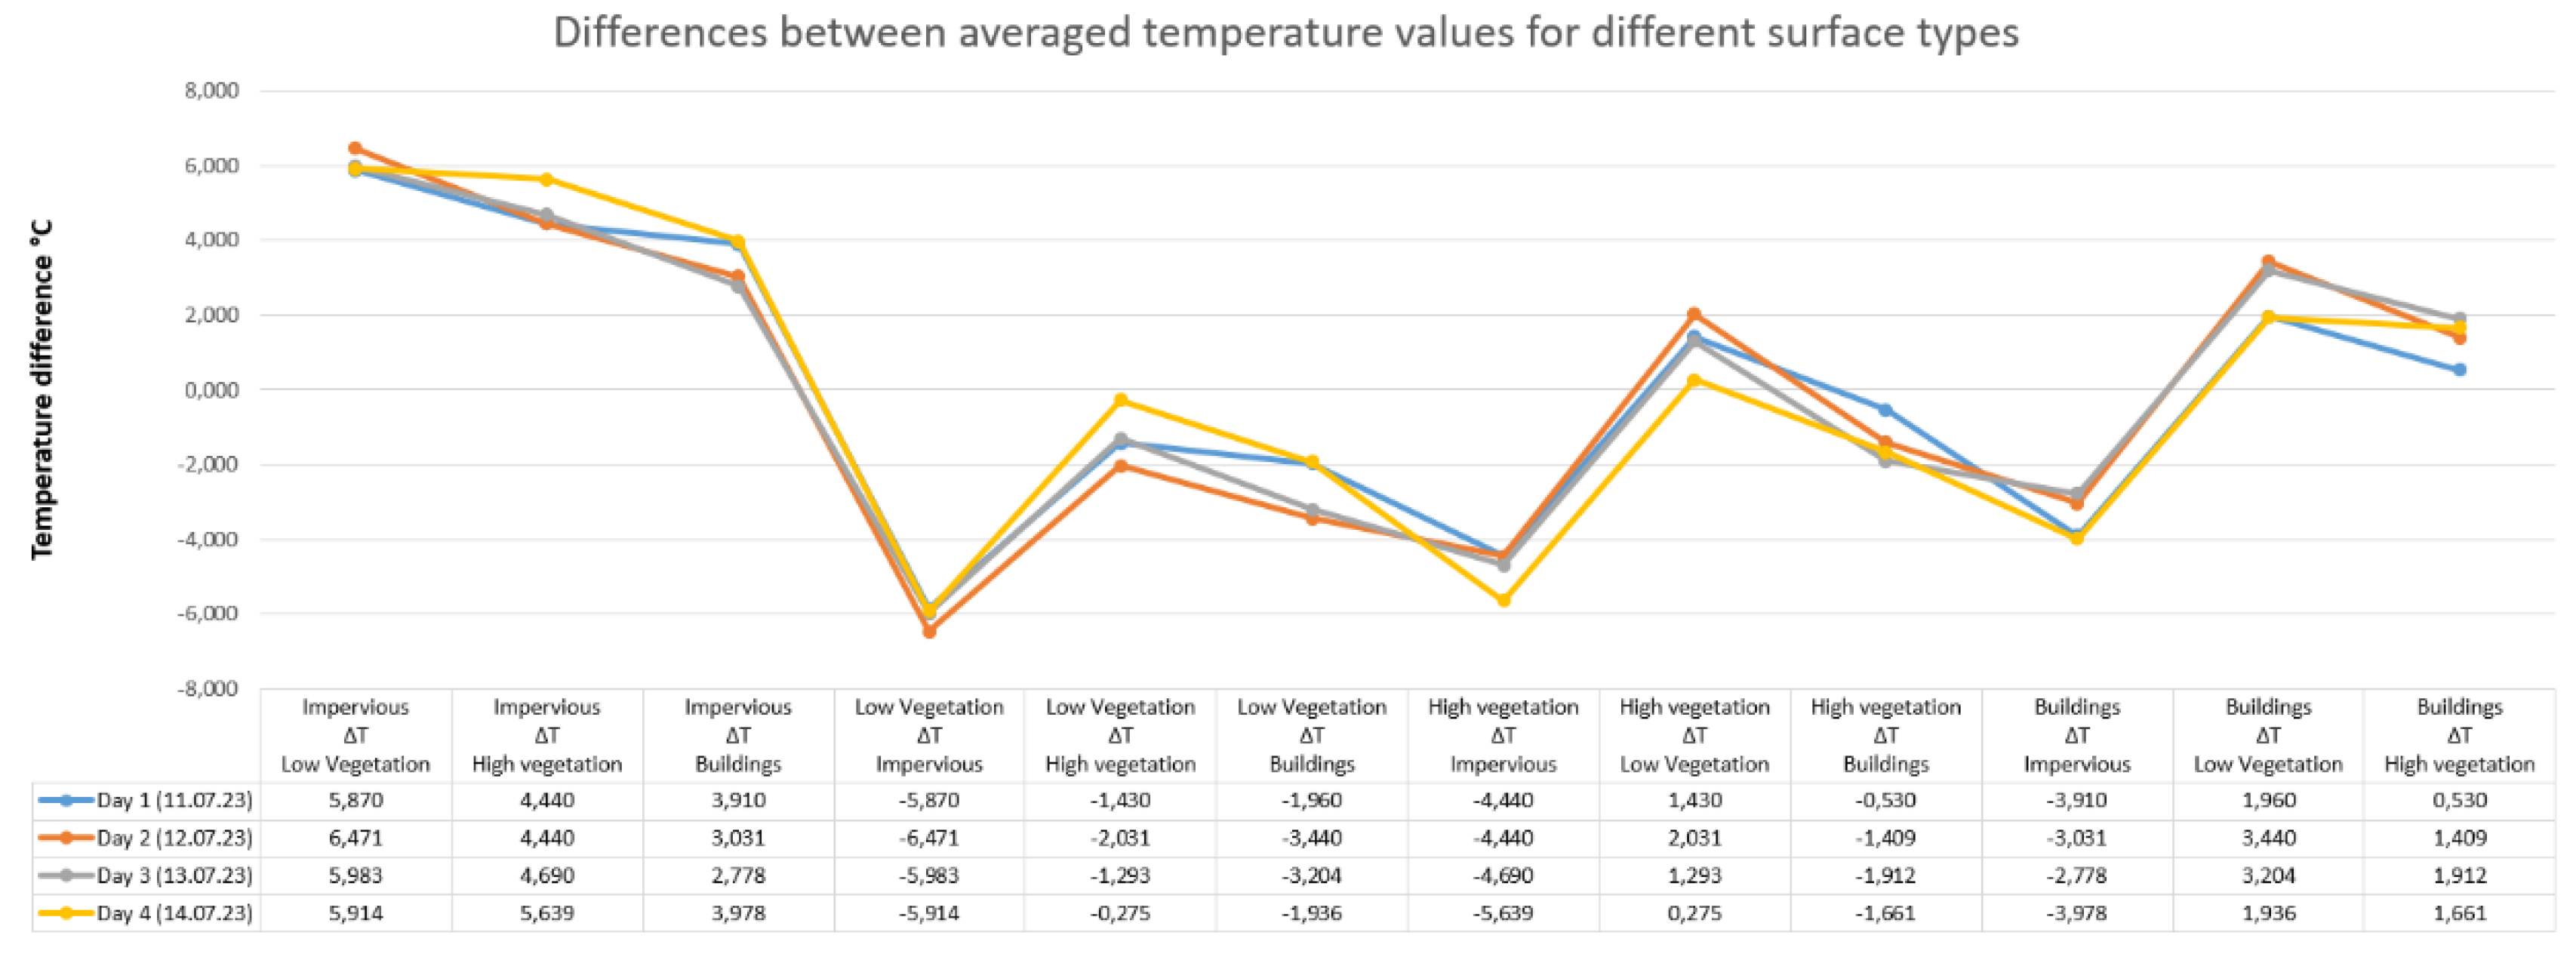
Figure 9, the differences between the average temperatures of the different land cover types and materials within the residential study area can be seen, as the baseline data for this study was collected over 4 consecutive days during a prolonged heat wave between 11/07/2023 and 14/07/2023. The graph clearly shows that the largest positive differences are recorded between impervious surfaces and low vegetation, followed by those between impervious surfaces and high (woody) vegetation.
The examples given are consistent with the effects described by Akbari et al. [
45], who studied the maximum surface temperature of walls and roofs of two adjacent buildings located in the state of California, USA, over several months during the summer. One of the buildings was shaded by vegetation arranged in a belt shape around the building, and the other had no similar green infrastructure in place: The maximum measured surface temperature difference between the two buildings ranged from 11°C to 25°C over the study period.
C. Enhancing the information base for improved local climate zoning: An important component of the methodology presented in this paper relates to the elaboration and application of an integrated spatial model of LCZ, which is based mainly on the classical concept developed by Oke and Stewart [
46]. In this case, the main data source for the definition of the different LCZ classes is the photogrammetric imaging performed with the mentioned 3D sensor S.O.D.A. The main results used are a detailed orthomosaic with a spatial resolution of 5 cm, a precisely classified point cloud, and a digital surface model (
Figure 10).
Subsequently, additional information resources, including cadastral data, Google Earth, Google Street View data, etc., have been used to supplement the information base for identifying individual LCZ types. However, of the greatest importance for the determination of urban landscape characteristics and the LCZ types, including the determination of the spatial distribution of different types of local surfaces (impervious surfaces and blue-green infrastructure elements) and urban morphology characteristics (e.g., street centerlines and widths, building area, building density, and height), is the accurate classification of the 3D point cloud developed from the photogrammetric model. This classification was performed using supervised machine learning techniques, which are based on training on labeled data from which a classification model is generated. The same is then applied to the new unclassified data where the class of each point in the corresponding point cloud is predicted and subjected to a classification procedure. The method proposed by Weinmann et al. 2013 [
47], later further developed by Hackel et al. 2016 [
48], was used to determine the geometric characteristics of the points. The geometric feature maps are complemented by color feature maps, which are determined for each point and its neighbors. To exploit the color information, additional color features are computed based on the color of the corresponding point and its neighbors. The final calibration of the data is done through manual and visual editing. As a result form this procedure, a precisely classified point cloud was generated for our study area in Lulin, which was subsequently transformed into a vector layer reflecting the different land cover types (
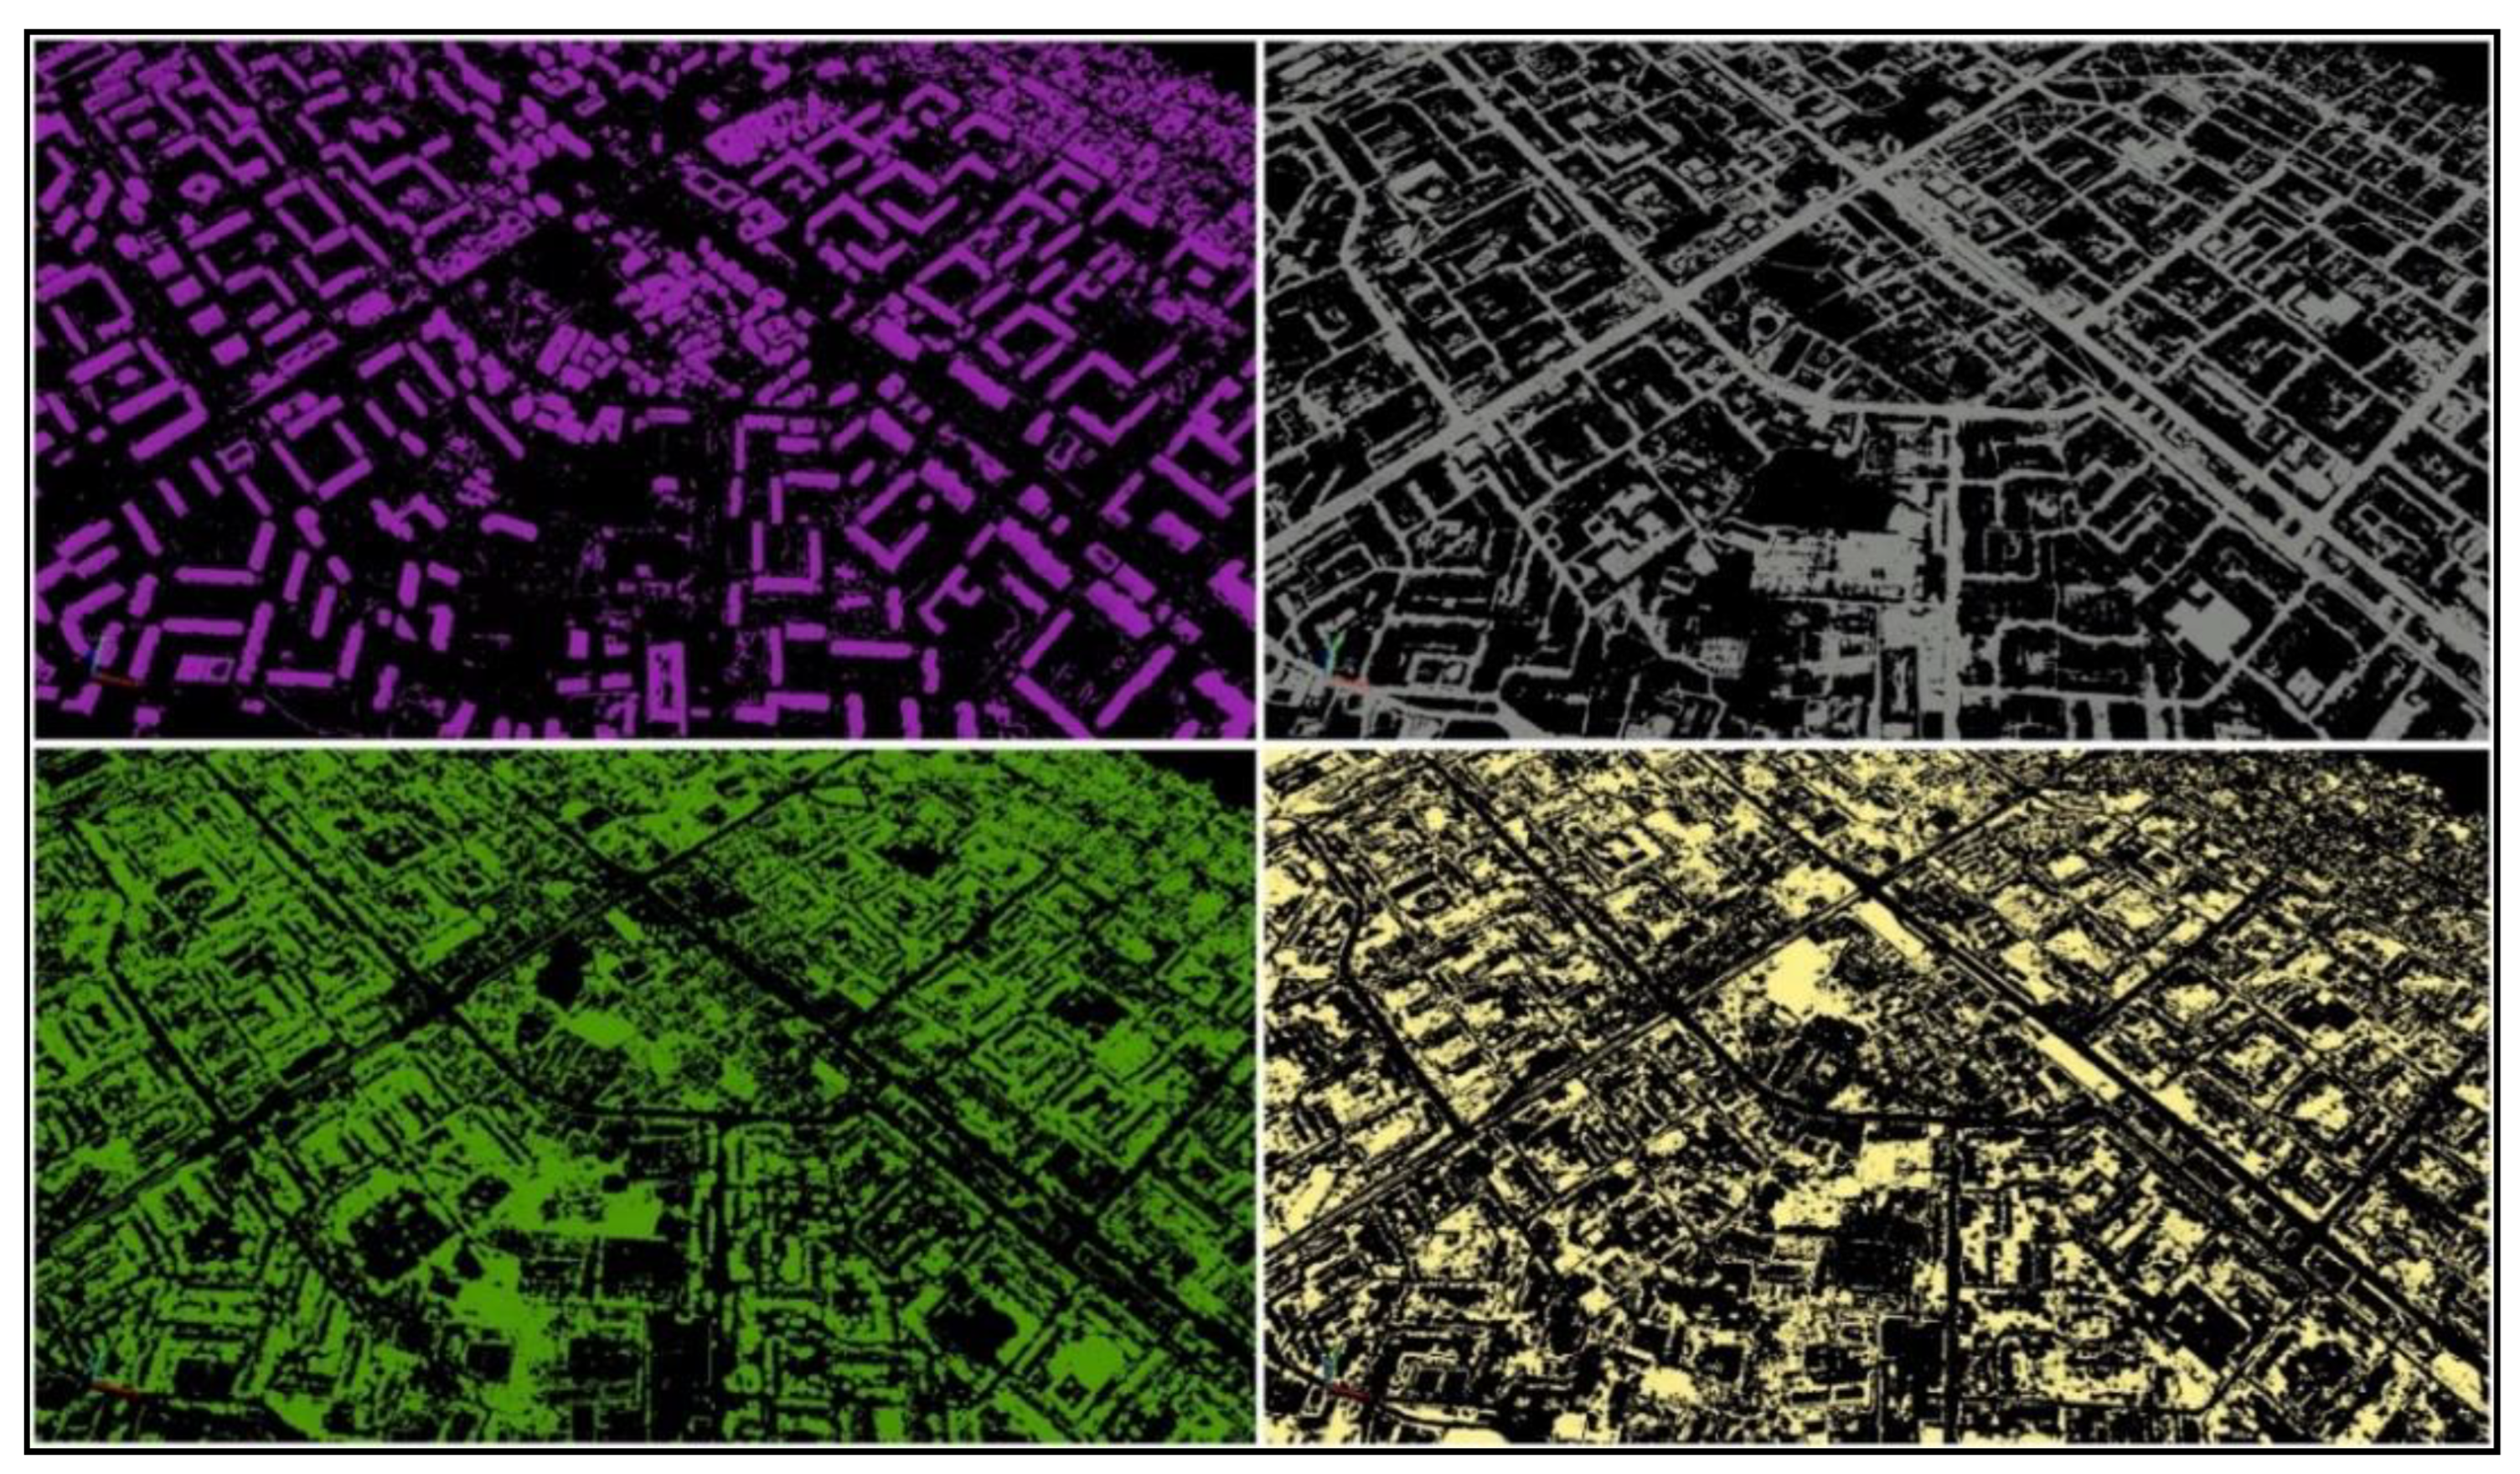
Figure 11).
An important point in our proposed methodology is the definition of the spatial units to which the Local Climate Zoning (LCZ) scheme is assigned. As stated above, the information basis for their determination is based on photogrammetric imagery data and additional metadata. Different possible approaches are described in the literature. The most applied spatial unit schemes are regular grid networks [
49,
50], parcel polygons [
51], urban blocks [
52], or urban functional zones (UFZ) [
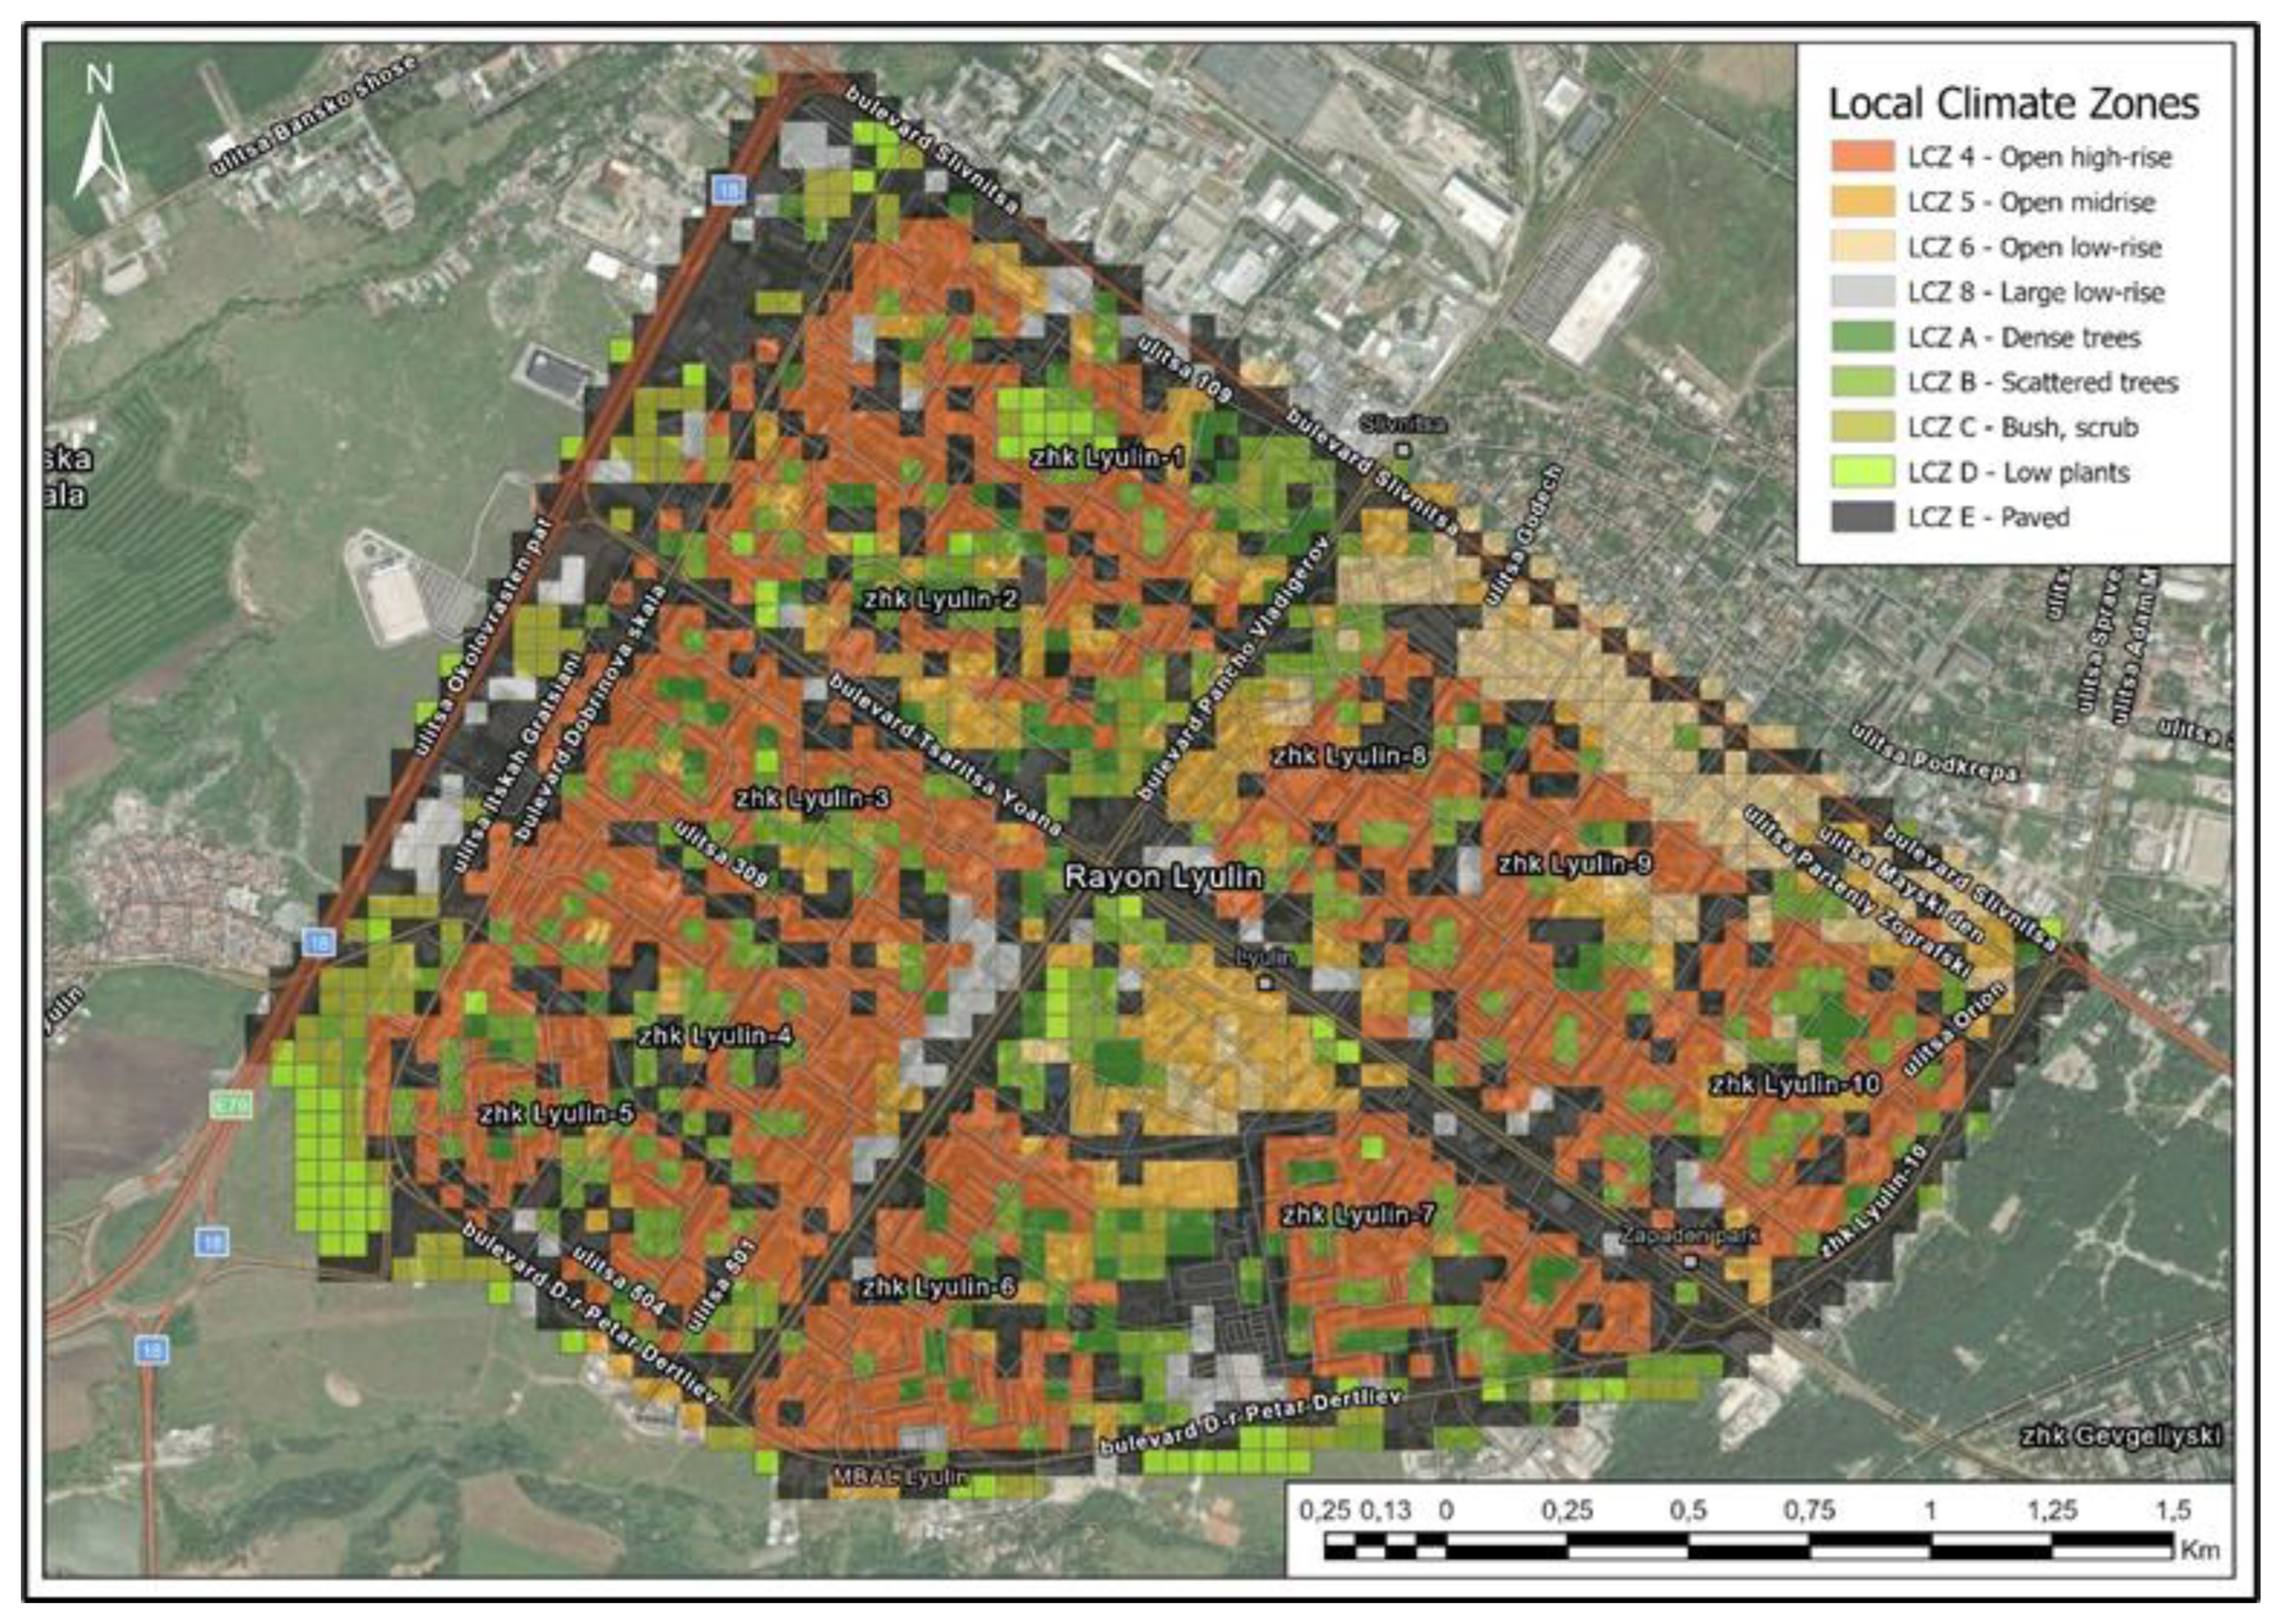
53]. Based on the very high spatial resolution and precision of the data obtained due to the technological tools applied in this methodology, and on the requirement to apply spatially analytical and geostatistical methods of analysis to determine SUHI characteristics, a spatial differentiation scheme based on a regular grid network was chosen in this case. Under the spatial extent of the area used to test the methodology and given the extremely high spatial resolution, a 50 m × 50 m grid cell size was used. In this way, we have standardized the coverage of the main survey units, while providing opportunities for application of geostatistical and spatial-interpolation methods in further analysis. Based on similarities in land cover (from the classified point cloud) and morphological characteristics (extracted from the digital surface model), the cells covering the study area are grouped into different LCZ classes, semantically defined in a classical concept developed by Oke and Stewart [
34]. The basic rule in determining the membership of each cell to a particular LCZ is that of the predominant area of its surface (majority rule), i.e. if different morphological and land use types fall within the range of a cell, the cell is defined by the predominant type (
Figure 12).
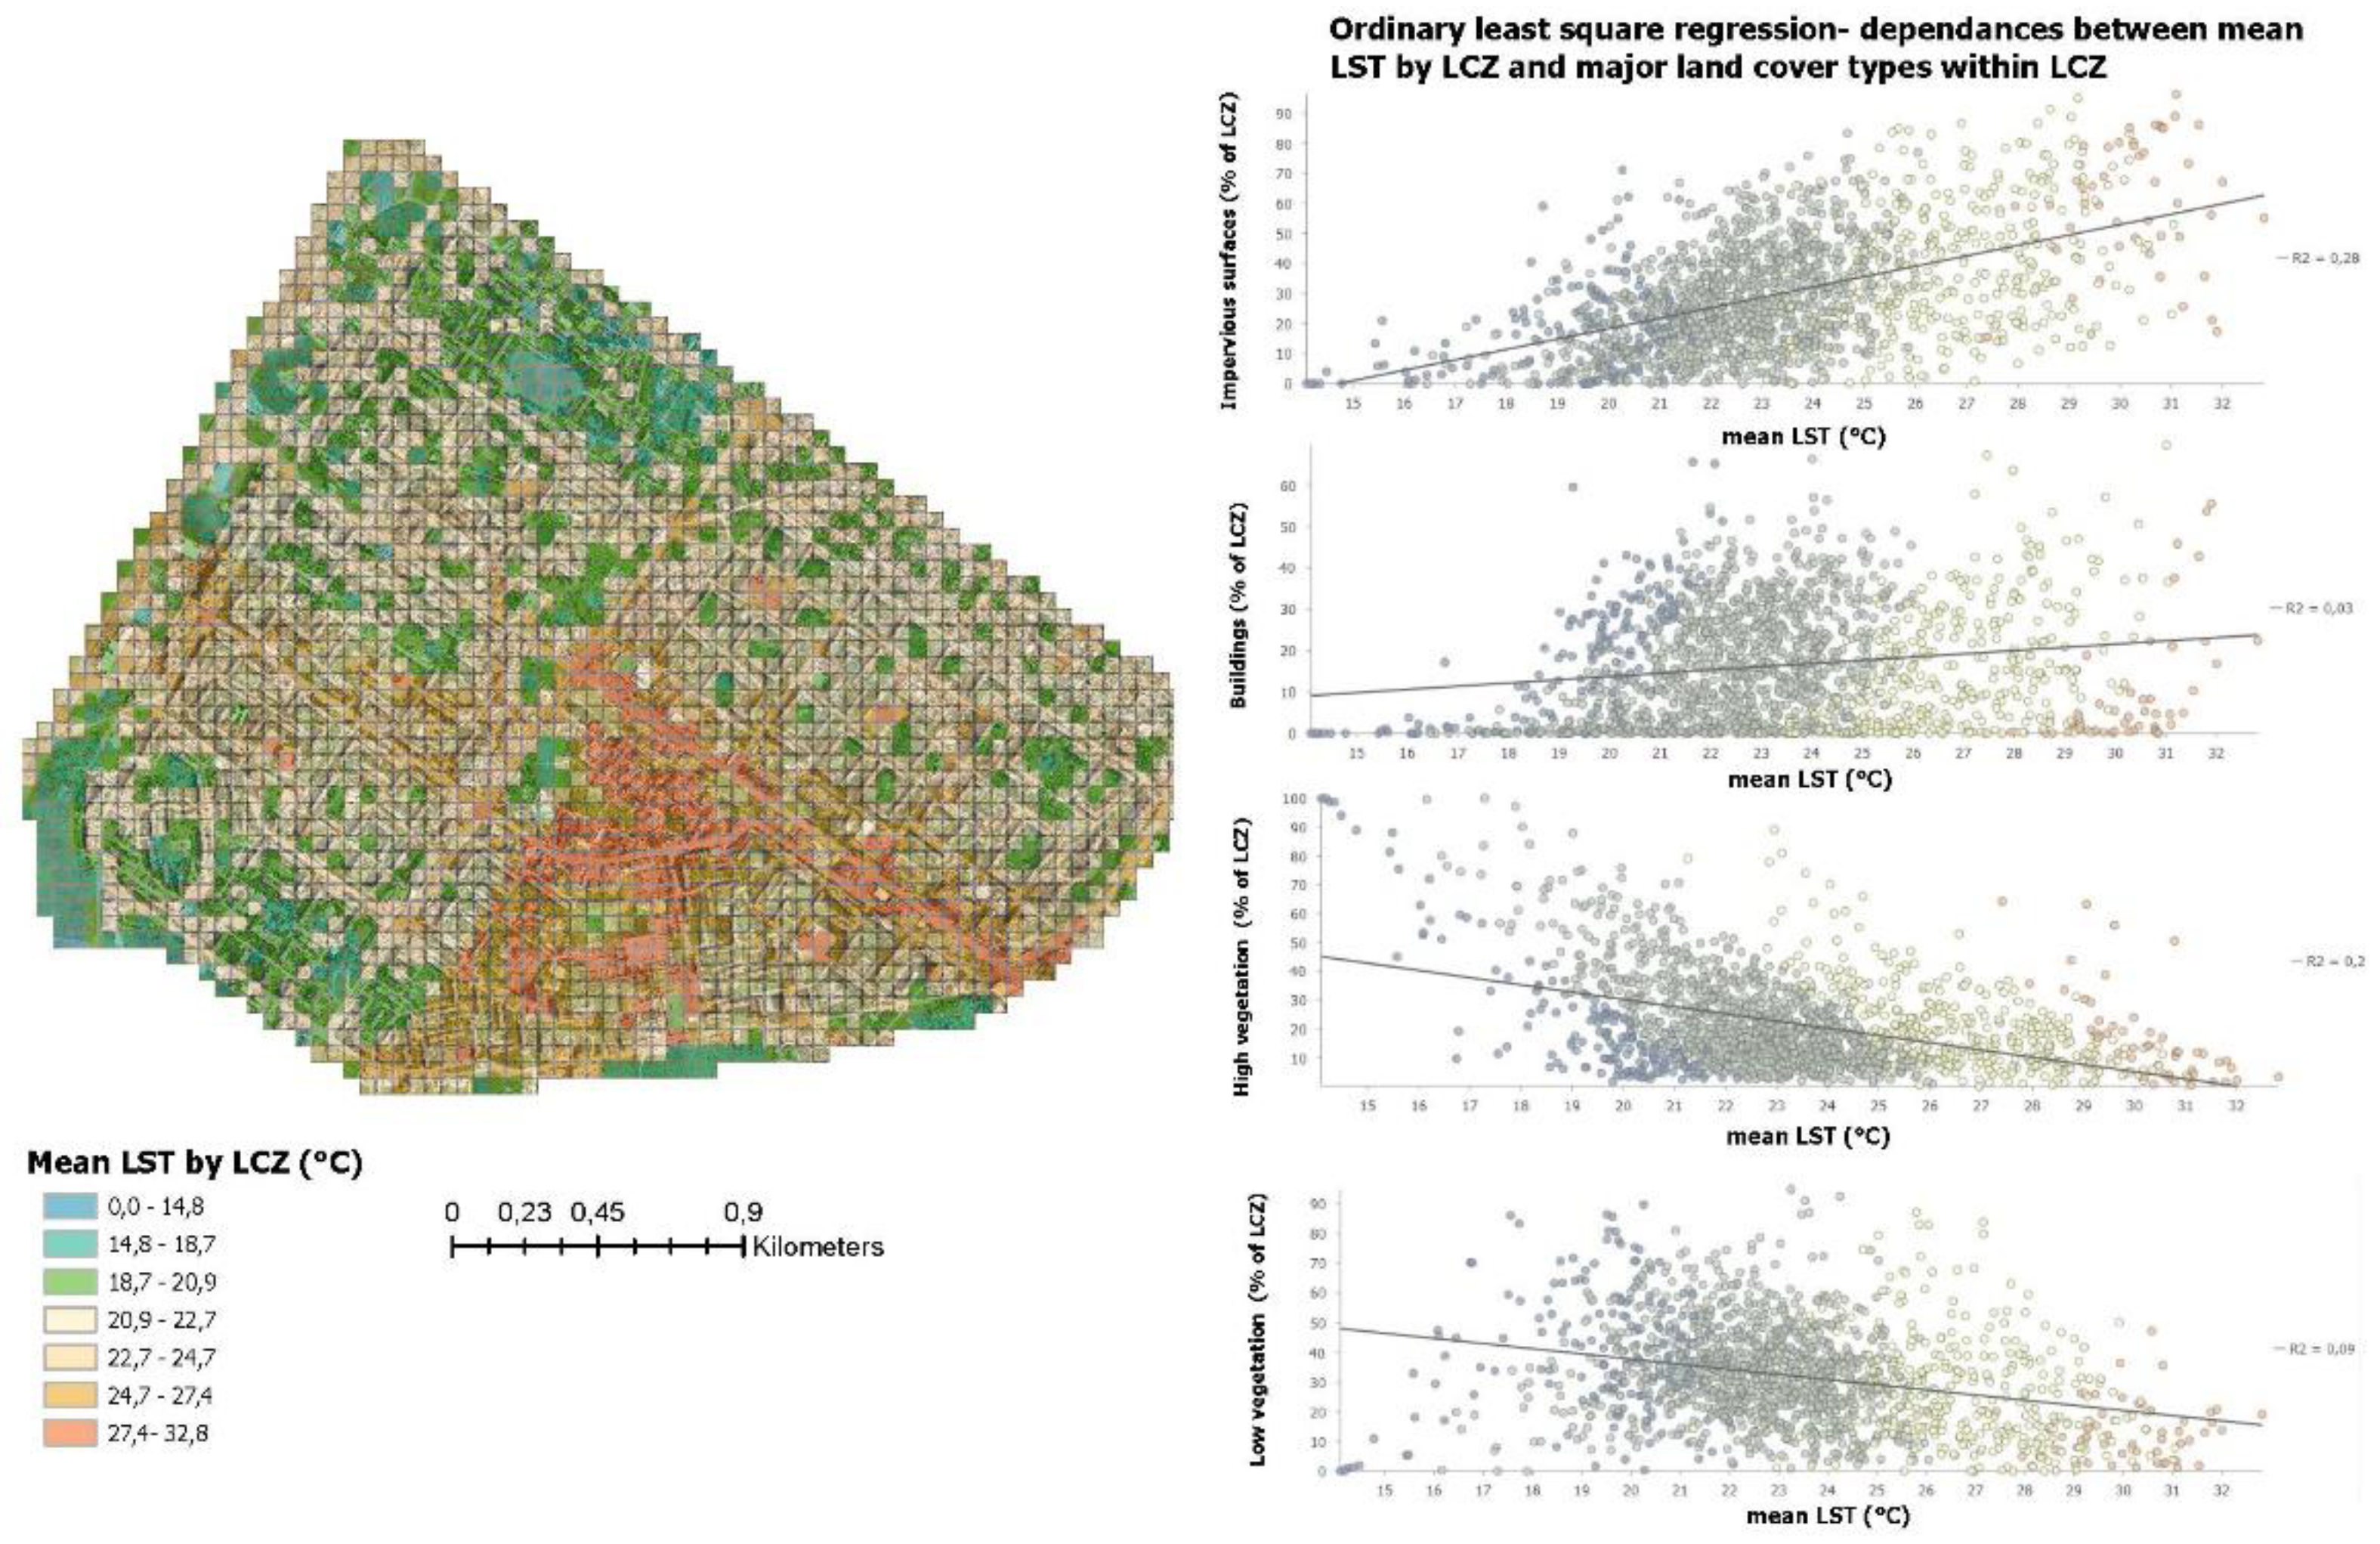
According to the methodological framework, following the determination of the LCZ classes for each cell, the relative land cover fractions within each cell were determined, as well as the mean surface temperature, which was calculated from the thermal photogrammetric survey. Based on this, a linear regression model was created using the least squares method between the areas of the major land use types (as the independent variable) and the mean measured temperatures by land use type (as the dependent variable) (
Figure 13).
The general conclusions confirm the hypothesis that the greater the proportion of green space, the lower the measured temperature values, and vice versa: the higher the proportion of built-up and impervious areas, the higher the surface temperatures. These regression relationships are extremely important for planning because they provide understandable data at the lowest possible level on how the land cover/land use balance affects the thermal balance within the relevant LCZ grid cell.
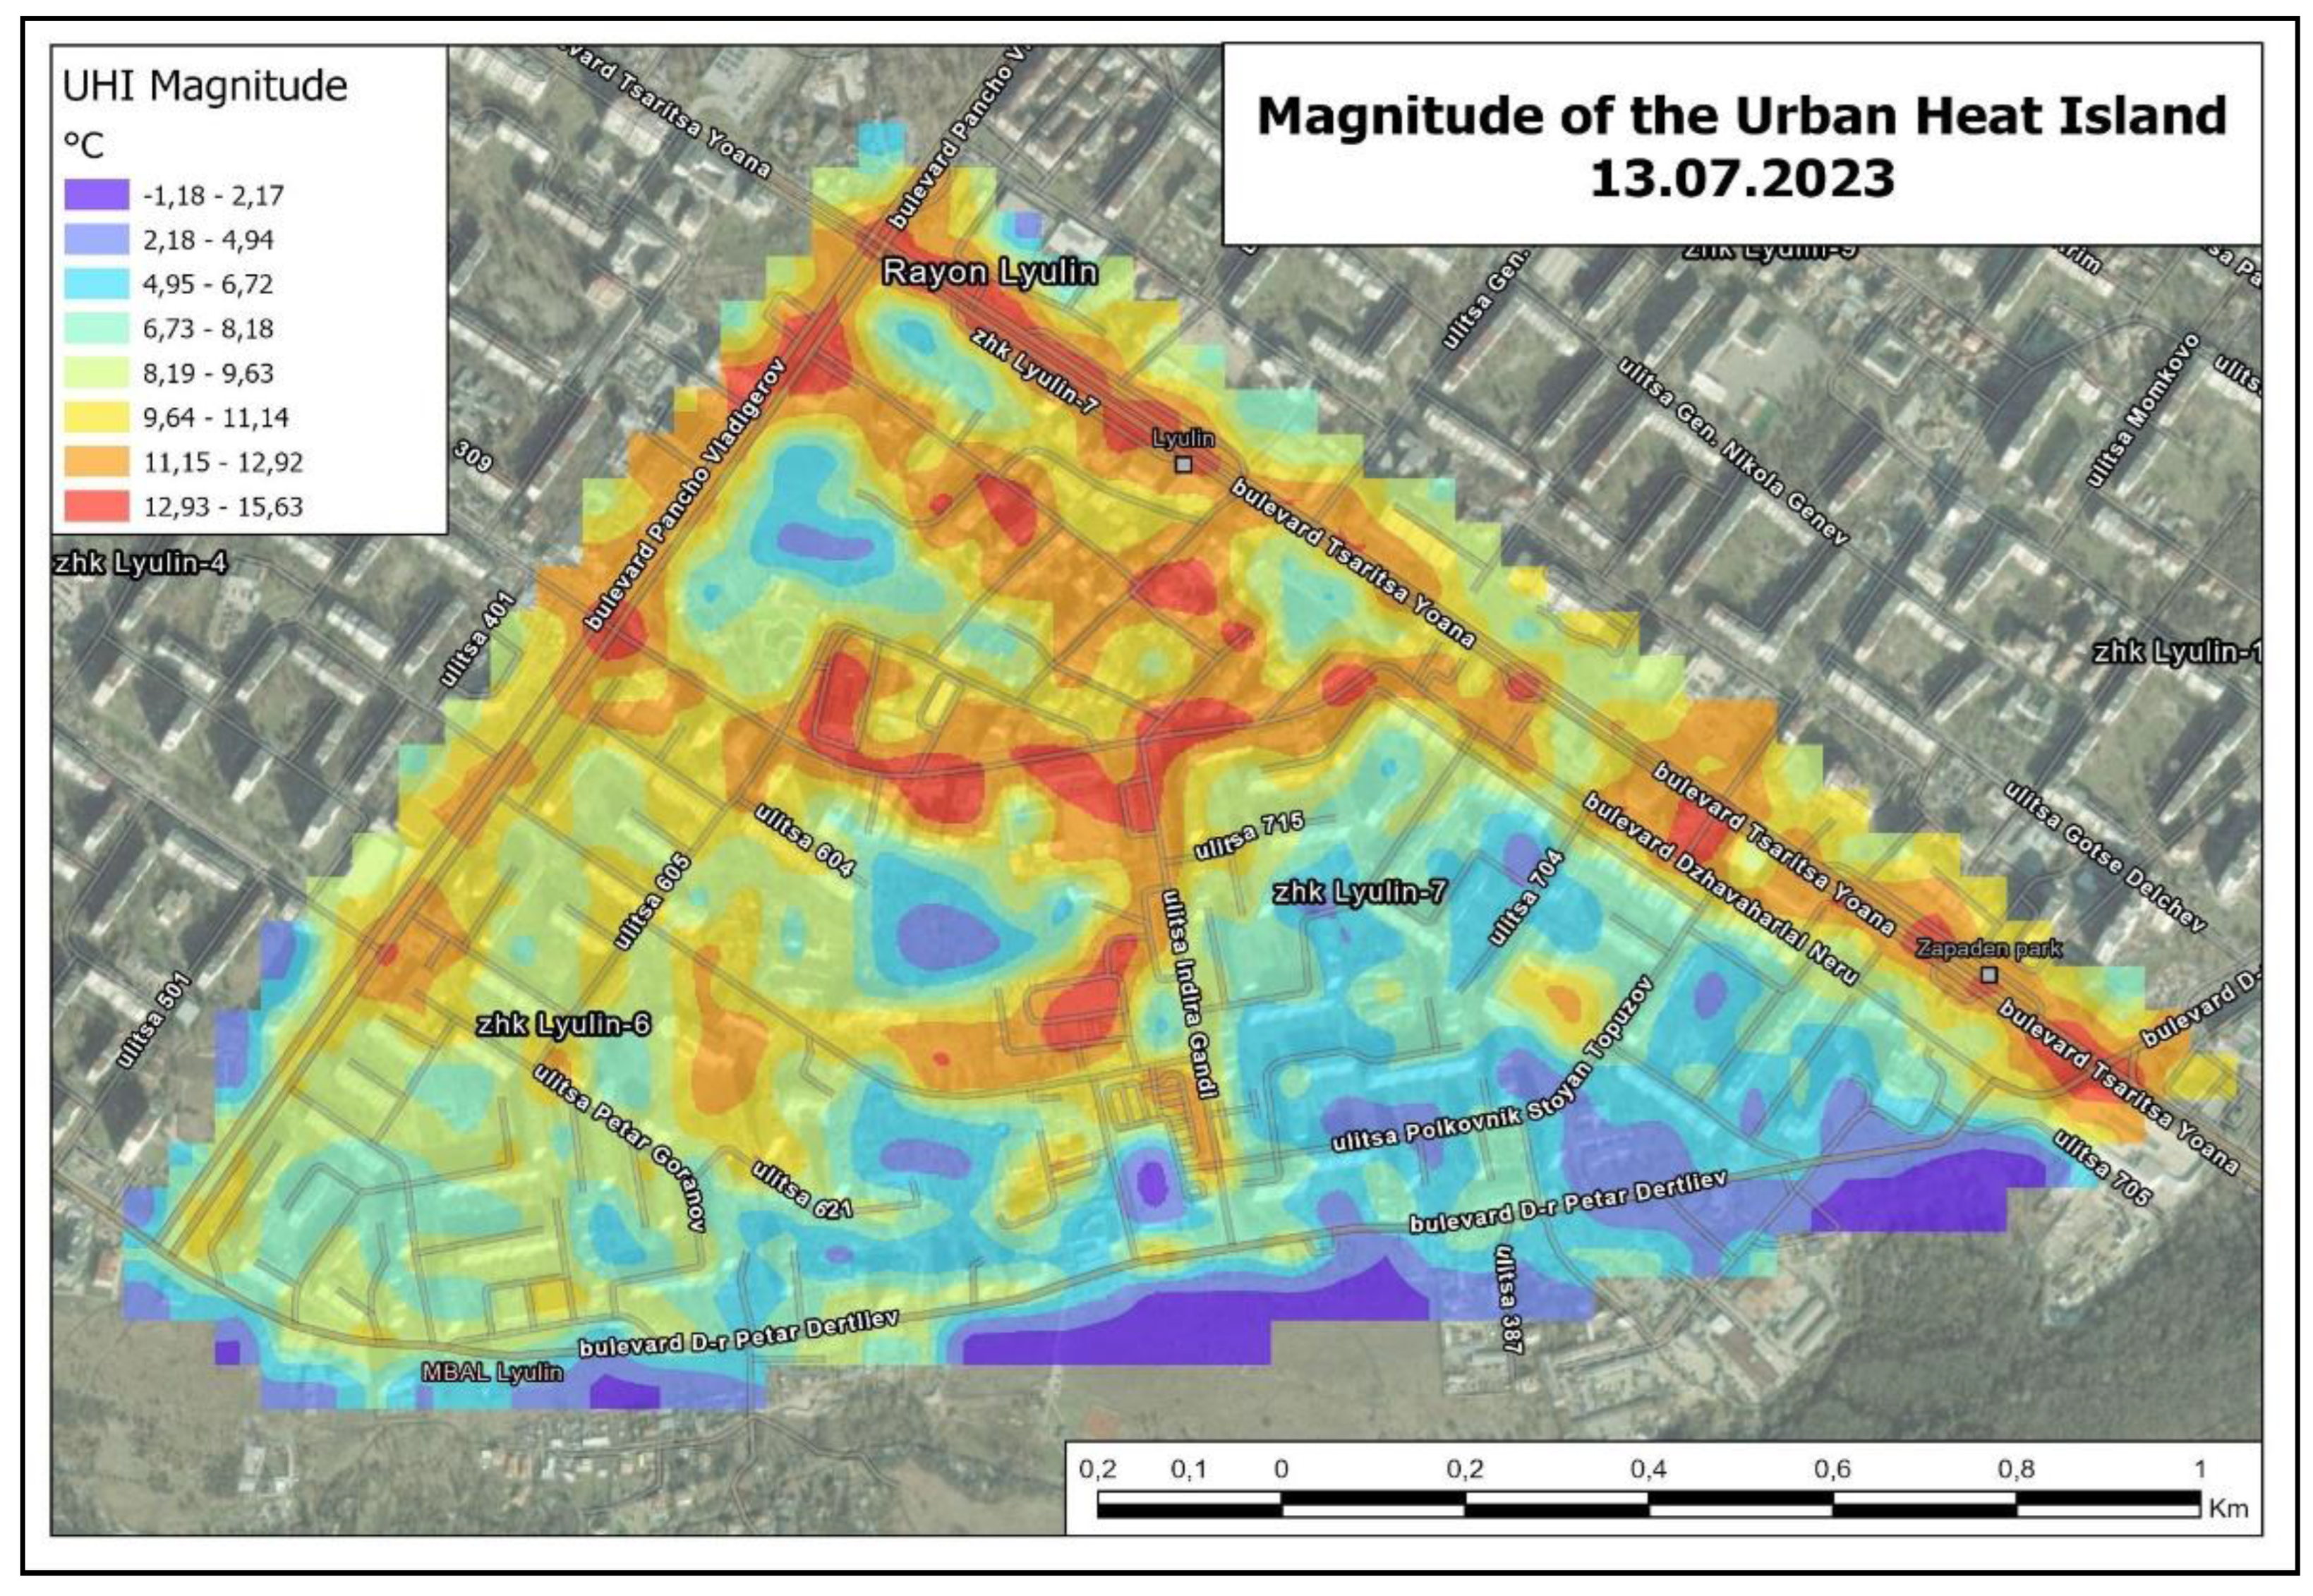
D: Provide opportunities to determine SUHI intensity more adequately for planning purposes: Apart from the construction of the regression relationships mentioned above, another important point of the application of the described methodology is related to the calculation of the UHI intensity, in this case, we have used the approach described in step 5 of the methodology scheme - the so-called ‘intra-urban intensity’. The figure below shows the result of this calculation applied to the data collected on 13.07.2023 covering the southeastern part of the study area (micro-districts Lyulin 6 and Lyulin 7) (
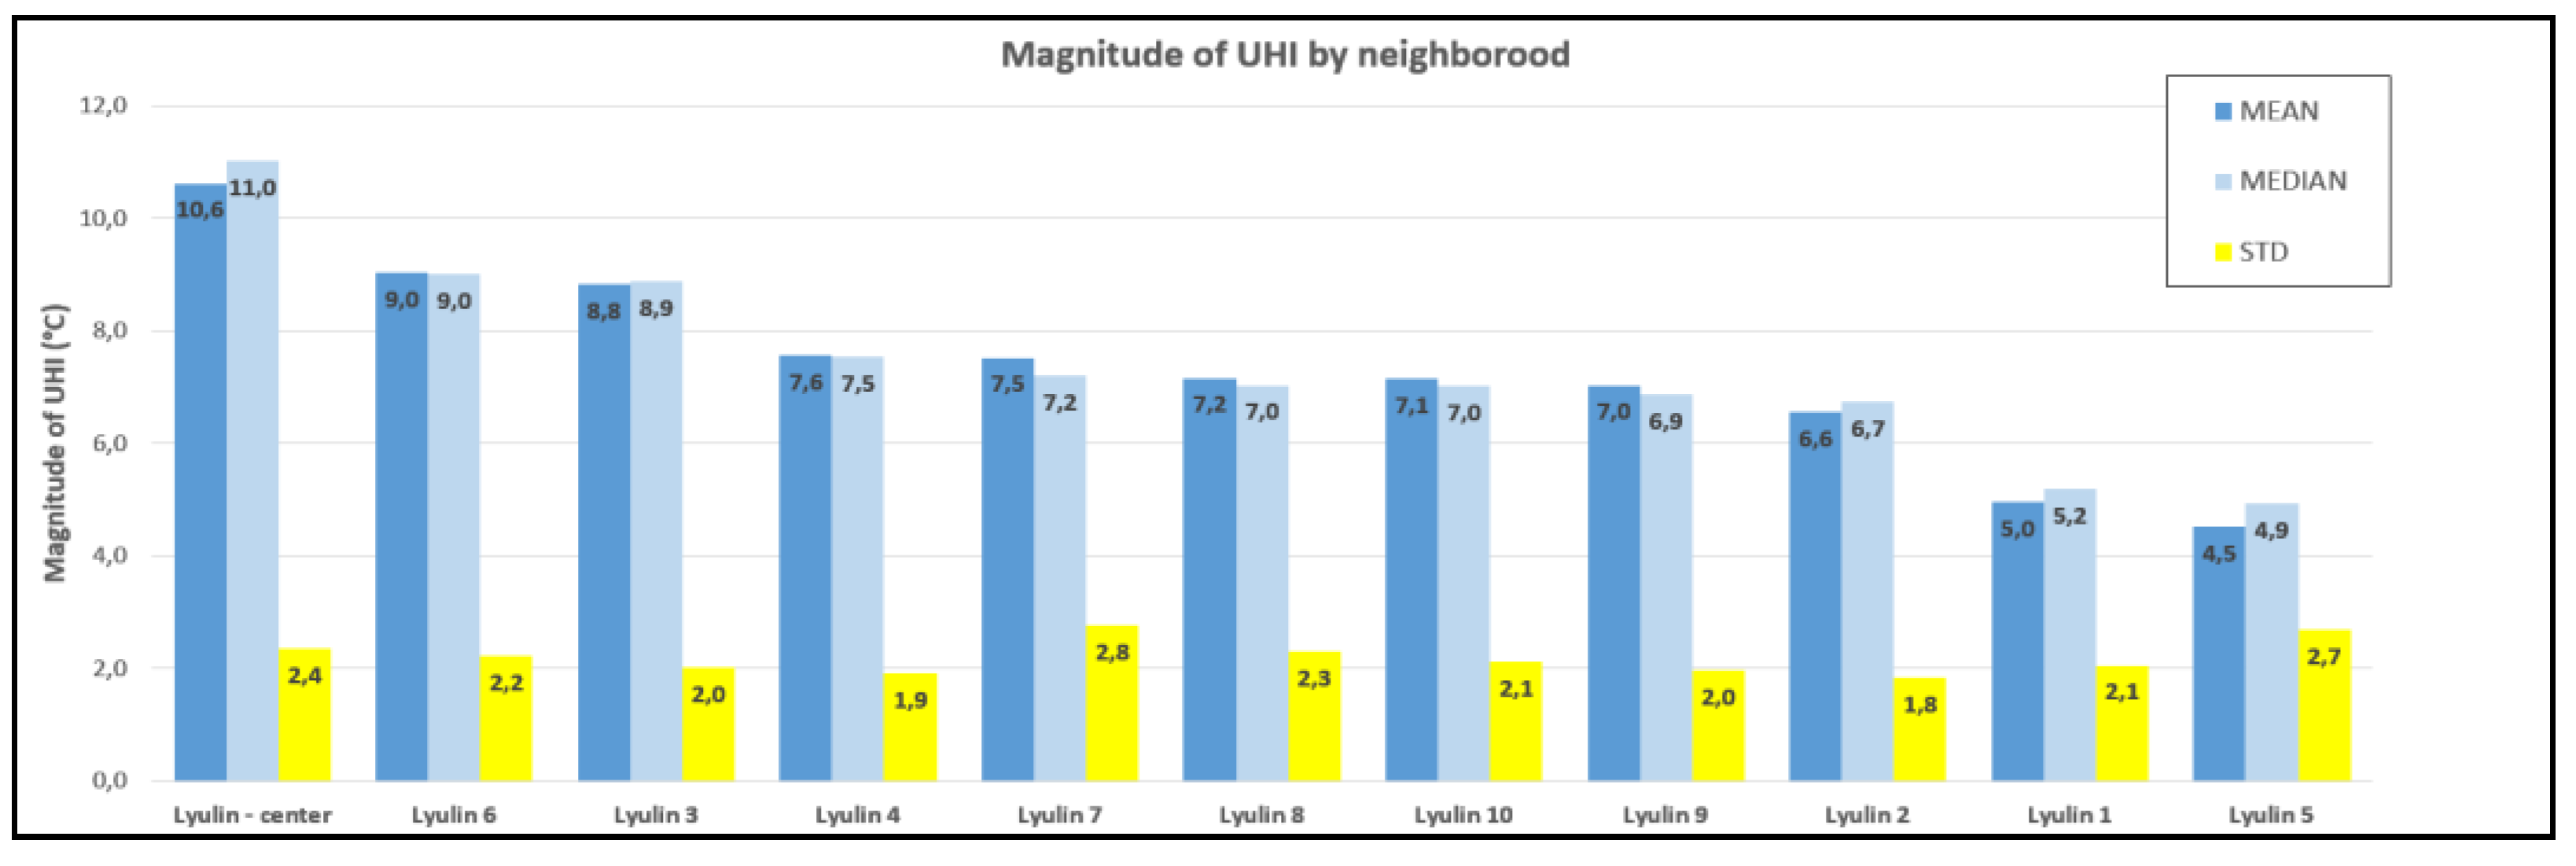
Figure 14). From the chart below it can be seen the characteristics of intra-urban intensity for all micro-regions of the study area (
Figure 15).
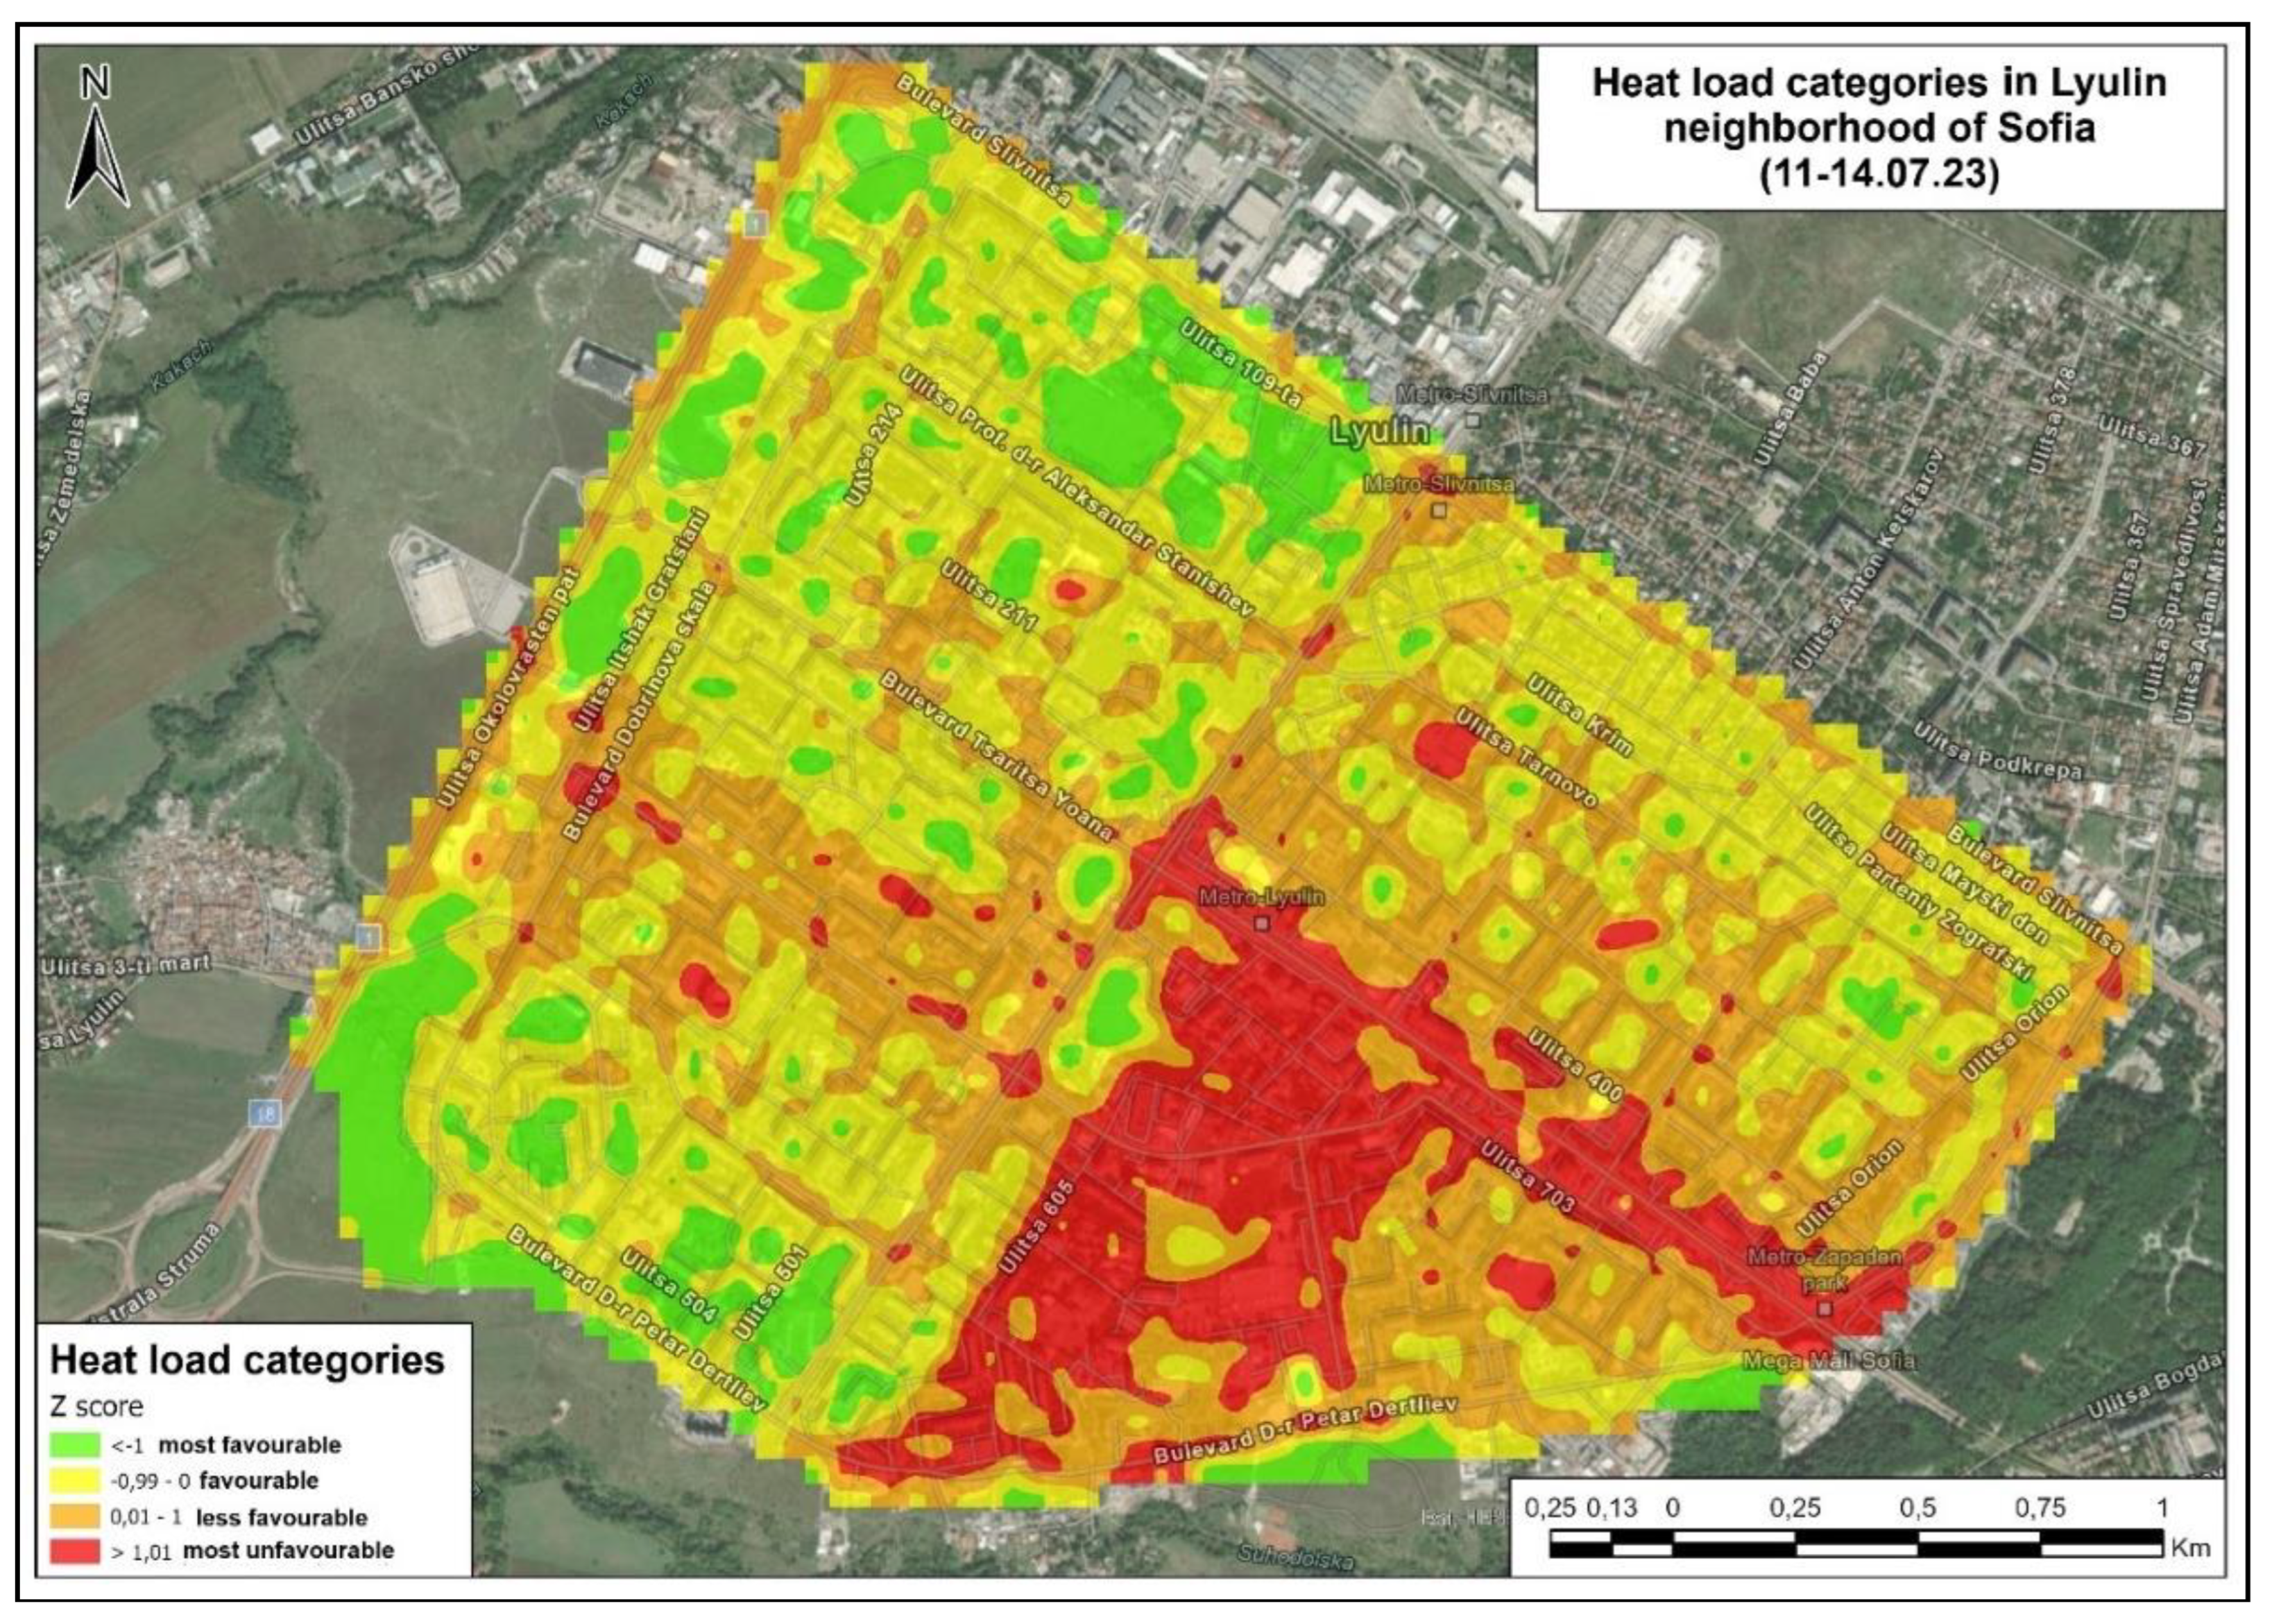
E. Provision of information basis for estimation and interpretation of the heat load within the studied urban area: One of the final results of the application of this methodology is related to the interpretation of the integrated results of its application (step 6). For this purpose, a z-transformation of the SUHI characteristics is applied and a map based on this transformation is generated showing the different degrees of spatial distribution of the thermal load within the area.
The data for LST for the different LCZ is used for the preliminary estimation of the heat load in the Lyulin neighborhood of Sofia. The heat load can be categorized into four stages (most favorable, favorable, less favorable, and most unfavorable) based on the standardized temperature values by the applied z-transformation according to the following formula [
41]:
where X is the mean temperature of a single test cell, µ is the mean temperature of all cells tested, and σ is the standard deviation of the mean LST of all cells.
Figure 16 presents the results of the spatial z-transformation of the temperature values.
The areas with values of z <−1 are distinguished by the lowest levels of heat load. They include mainly tree-covered areas, areas with grass or shrubs and surface water bodies (LCZ A, LCZ C, LCZ D, and LCZ G), as well as low-rise areas with yards and gardens, with trees scattered between the buildings (LCZ 6). The lowest value of the z-score in this category is registered in LCZ D (z-score = −2.10). Category 4 shows the highest degree of heat load (hot island) with a value of z of over 1 (i.e., areas with an LST higher than the mean + one std). These are mainly areas with high and medium-high construction (LCZ 4 and LCZ 5), as well as large low-rise buildings with extensive sealed spaces between them (LCZ 8). Even single cells with z-score = 3.11 (LCZ 4) and z-score = 2.24 (LCZ 5) fall into this category. The other categories (2 and 3) occupy the largest share of the urbanized territory (more than 65%).
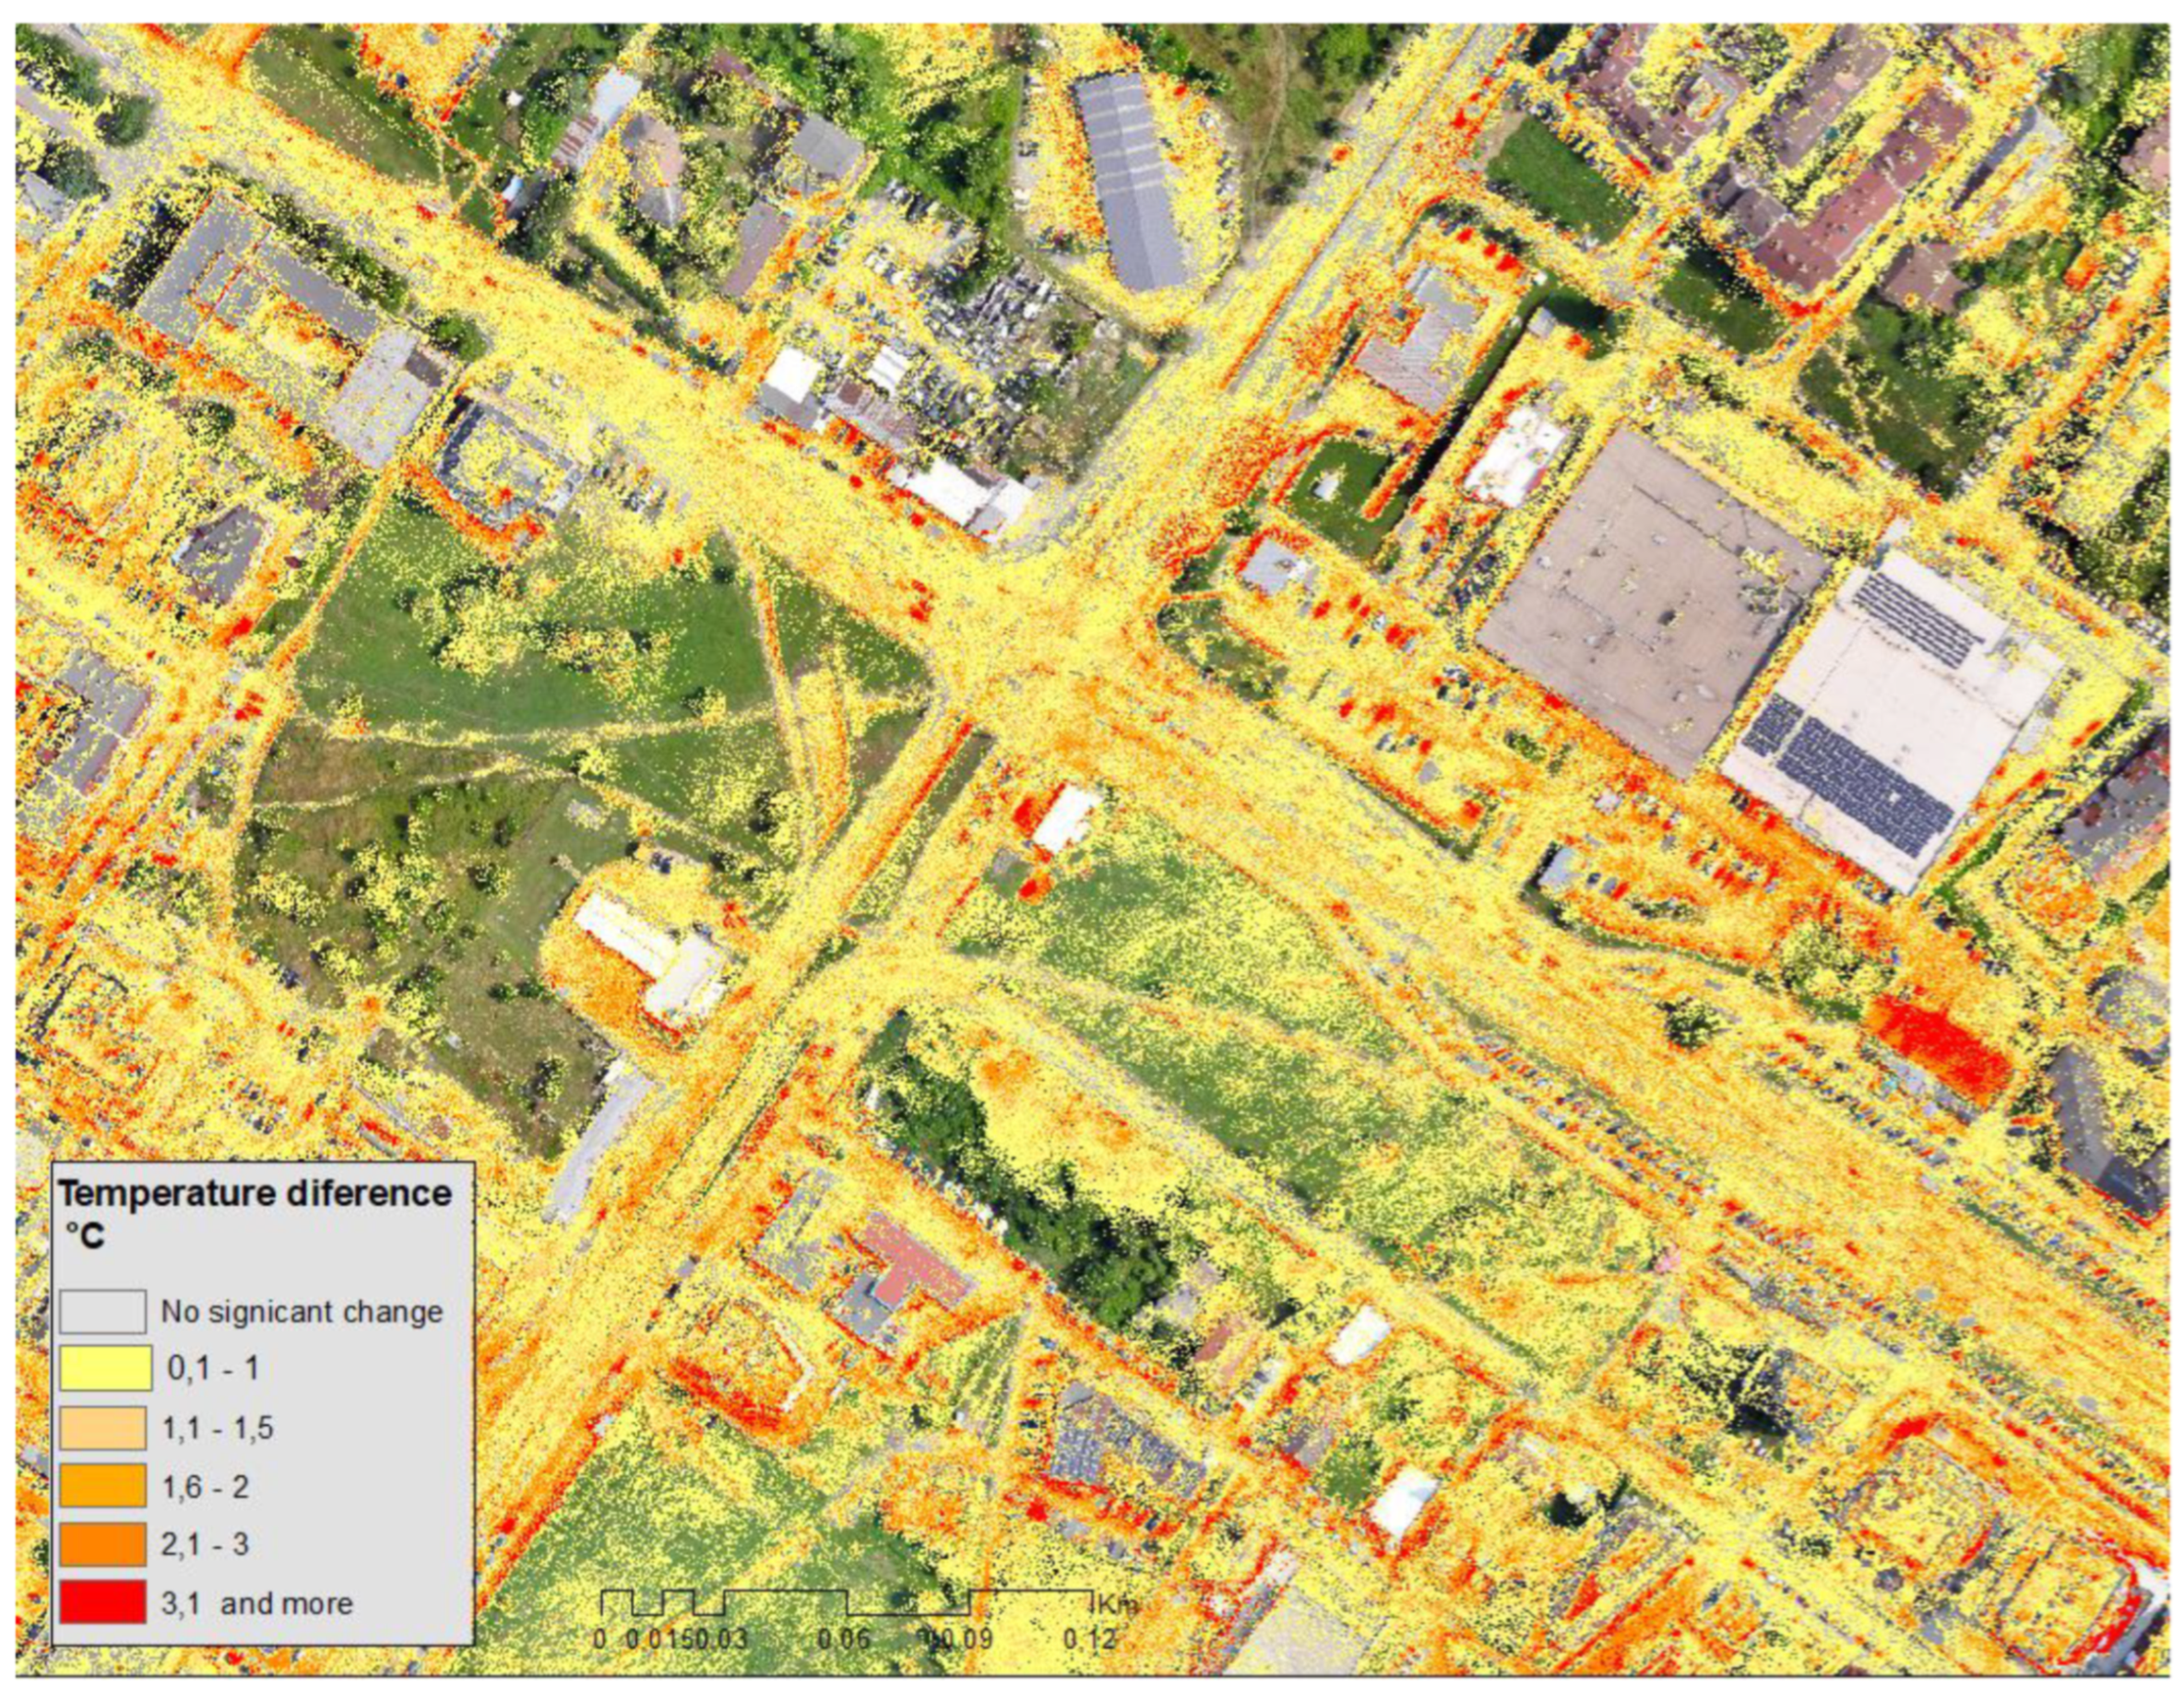
F. Monitoring of the SUHI parameters, including during developing and deepening heat wave: One of the important advantages of the data and information resources collected by the application of the tuning methodology is related to the possibility of repeating flight missions precisely and collecting information resources not only with high resolution but also with high geolocation accuracy. This, in turn, makes them extremely useful for monitoring the development of the SUHI in a situation of a deepening heat wave. To illustrate these characteristics of the methodology, we undertook daily imaging of the same area localized in the central part of the Lyulin region during the period 11.07-17.07.2024. The same area was imaged with absolutely identical flight missions, at the same time of day, under the conditions of a deepening heat wave, in which maximum daily temperatures gradually rose from 34 °C (11.07.2024) to 39 °C (17.07.2024). This allowed us to investigate in detail how the temperature of individual site types and land covers changed (
Figure 17).
As is evident from the map, it is noticeable that in quite a few locations the temperature of the natural cover types is seriously changing, which is probably due to the reduced evaporation from the vegetation, resulting in a higher thermal load. This information is extremely useful for taking adequate operational action to locally mitigate the impact of SUHI, such as providing additional irrigation to green areas to restore their aeration capacity, and consequently increase their cooling capacity. On the other hand, it is easy to notice that the cooled roofed buildings are not seriously affected by the heat wave and their temperature doesn’t change scientifically.
4. Discussion
The above results give us reason to claim that the presented methodology is a good basis for future research on the ‘urban landscape - urban climate’ relationship. The methodology is relevant to all important topics discussed in the context of SUHI genesis (internal and external urban structure factors and variables [
54], manifestation (temporal and spatial variability [
55]), and adaptation to SUHI [
56]. The methodology builds on the best of scientific experience in SUHI research [
57] by presenting an option to combine the advantages of new tools and technologies, including UAS-based remote sensing, both for the generation of new data and for their analytical processing for the parameterization of the phenomenon. However, the main purpose of the results obtained through the presented methodology is towards the target audience of the practice: information provision to urban stakeholders, as active agents in the management of urban processes, and as key parties whose daily lives and work activities are affected by the SUHI phenomenon.
Our methodological approach - as the emergence of the idea and its unfolding over time in a series of tests, is based on the understanding that 'proper' SUHI research is possible through a 'proper' understanding of urban geography at the lowest possible spatial level - structural heterogeneity and its derived functionality. This understanding determines the selection of methods and approaches for integration, the interpretation of intra-urban interdependencies in the structural elements of the environment, and a critical look at the granularity of the data obtained.
On this basis, our attention is prioritized to provide baseline information on the actual state of urban structure as a genetic factor for SUHI formation. Even the smallest areal changes (ongoing development, changes in the functional use of land and sites, new development or degradation of sites, etc.) stimulate the variability of the urban mosaic, complicating over time its inherent heterogeneity and, as a derivative result, altering the natural processes of the landscape - in this case, water and air circulation, heat exchange, bioproduction, etc. are relevant. Attention to these variabilities is a distinct feature of contemporary research [
58]. Kim and Brown, 2021 [
59] emphasize the need to develop a UHI estimation and analysis model considering a 3-D form of a city and especially in focusing on the intensity and magnitude of UHIs.
The proposed methodological approach focuses on the technological possibilities to track the relationship types (including internal differences, e.g. in the built-up or the type of green cover) of urban surfaces and energy balance and heat transfer. In practice, such information has the value of informing the discussion of urban mosaic properties and, consequently, of being informative for users of these properties. That is, the study of SUHI through a detailed mosaic survey provides information from several interrelated perspectives: the intensity and temporal variability of the phenomenon as an urban climate phenomenon (finding and generating an information base for further research and experimentation), the potential for exploiting this thermal capacity of surfaces (a positive economic perspective), and for developing adaptation to the phenomenon with a view to human health or to maintain the functionalities of urban infrastructure (reaction to the negative aspect of the phenomenon on the quality of the urban environment). However, given the impact of SUHI on the quality of urban life, we will focus our comments here mainly on the potential of our methodology to explore the relationship between LST and the cooling effect of urban green infrastructure (UG) by further focusing on its characteristics in the urban mosaic. In their study, Jiachen Liu et al, 2024 [
60], emphasize that the successful solution in UHI management is the identification and cooling of the core areas of the UHI. They used correlation and regression analysis to investigate the relationship between UG indicators and seasonal LST in an urban core and confirmed the significant cooling effect of UG. The results of Xu C et al. 2024 [
61] show that increasing UG coverage decreases the mean LST in the city by up to 4.73 °C while optimizing the spatial distribution of UG leads to a 1.06 °C decrease. At the same time, a synergistic cooling effect is observed when combining the two measures, resulting in additional cooling benefits (0.034-0.341 °C). Support for the establishment of these important relationships is also found in Carlos Bartesaghi-Koc et al, 2020 and Zhang, J., 2024 [
62,
63].
However, long-term studies are needed to obtain a comprehensive picture of temperature fluctuations. Only then can we provide an understanding of temporal trends and long-term impacts of SUHI [
64]. Generating sufficient data is a topic directly related to validating models and data to optimize the accuracy and reliability of results. It would also provide a basis for much-needed uncertainty analysis to understand and account for potential errors and biases in the data and models [
65]. We consider the variable nature of the urban mosaic as a major challenge in this context: our methodological proposal makes a concerted effort to minimize these errors in the output data.
The calculation of SUHI intensity within inner city spaces is also considered by us to have significant potential in the planning and refinement of urban spaces in the context of climate change adaptation. This part of the methodology is possible given the highly detailed LST information and the possibility to relate the same to individual sites and surfaces with a very high degree of confidence. This, in turn, allows the calculation of the SUHI intensity, in the form of the ‘intra-urban intensity’. In our view, this approach ensures efficiency in recording and parameterizing SUHI in microscale/local studies, provides an opportunity to better communicate results to stakeholders, and creates a prerequisite of essential importance - the integration of the resulting data into derived analyses and assessments in urban planning and design. Wangchongyu Peng et al. 2022 [
54] point out that both internal and external characteristics of urban morphology contribute to the generation of UHI intensity and its temporal variations, but internal characteristics are more important. Urban surface modifications with emphasis on the role of urban pavements on UHI variations and the importance of these studies in making informed decisions is supported by Chidozie Maduabuchukwu Nwakaire et al. 2020 [
66].
Another very important feature of the proposed methodology relates to providing the necessary flexibility and responsiveness in collecting data that objectively characterizes SUHI. This particularly refers to the possibility of accurately determining the temporal diapason when these data are collected by thermal photogrammetry technology, namely immediately after sunset but no later than two hours afterward. This, in turn, makes it possible to obtain extremely adequate thermal load data without the same being distorted by the effects of direct solar radiation.
In the context of the importance of inner-city heterogeneity for the generation of SUHI, an important place in the methodological solutions is occupied by building on the LCZ concept. The focus on the precise definition of the LCZ here, in our view, ensures the necessary holistic nature of the approach, allowing for work in a variety of urban structures and dimensionality (in our case with changes in grid size) and making the study sufficiently fair to the objective reality of the urban mosaic. A good interpretation of the LCZ enables the analysis of the UHI effect in the broader context of urban systems, including interactions with environmental quality, resource consumption, and social activity.
Our results show that the methodology applied in this way also contributes to the wider recognition and use of LCZs by active parties in urban planning. We note this as important because LCZs can be an alternative to traditionally used urban units in urban planning when practice requires the assessment of natural functions and processes occurring in the urban fabric. LCZs here have the meaning of a structural-functional grid concerning the whole urban area and provide a good information unit for tracking the activity of natural processes in the urban landscape and the comparability of the vulnerability or advantages of different parts of the city for a given phenomenon. LCZs are particularly suitable for cities with a complex spatial structure, where a unified, structured, and methodologically correct approach is needed in discussing and interpreting the urban mosaic. In our view, the LCZ approach as informative provides a medium for the discussion of structural changes in urban design for improving functionality, thereby going well beyond the benefits of urban climate assessment. However, this is dependent on a high spatial resolution study of the urban mosaic and the correct identification of the LCZ.
The LCZ facilitates the recognition of the "microclimatic setting" as a genetic factor in shaping the SUHI effect, but as the cited results [
39] show, it could also be successfully used as a basic information unit in the assessment of urban environmental quality. This offsets the serious difficulty of integrating climate data from regular urban monitoring, which, given its limited scope, cannot offer spatial representativeness of the data when a smaller area - e.g., an urban core or a single urban neighborhood - is our focus.
In developing the methodological approach, our constant focus has been the requirement that it should have clarity and logical consistency in the methodological steps and with the possibility of intermediate control of the results of the individual sub-steps. The methodology allows for periodic repeatability so important for monitoring. The transparency of the procedure is important in terms of the potential possibility of integrating other interdisciplinary methods and tools.
The main drawbacks of the methodology are related to the need to use highly specific equipment, which is the most significant limitation of its application. Technically, the methodology is dependent on a few main components
- -
the availability of a fixed-wing UAS which, on the one hand, has to comply with the regulations for operation over humans and, on the other hand, has to be equipped with RTK/PPK functionality and the possibility of using the same for direct georeferencing of images.
- -
Availability of a specialized integrated and synchronized sensor including a thermal and photogrammetric component.
- -
Due to the regulations, the flight operations must be conducted by a certified UAS pilot, whose certificate must meet the regulation requirements as well as the class of the used UAS, which need to follow the regulations, related to operations above or close to people. In our case, the UAS used is designated (and certified) in class A2, category C2, which follows the requirements of the European Aerospace Agency (EASA), and enables such flights.
Despite the larger flight capacity of the platform used, it has relatively limited coverage capabilities (up to 1.5 sq km) in the time range most suitable for collecting data that objectively characterize the SUHI phenomenon.
The methodology allows the calculation of the SUHI intensity at the surface within the survey area or the so-called intrazonal intensity, but in terms of the classical formula for calculating the intensity, the same is strongly dependent on the location of the surveyed area. In the case that the same is in the peripheral parts of an urban area, the same can provide data on the total intensity, but if we are talking about inner-urban areas, this is very difficult to achieve. The methodology allows the calculation of the SUHI intensity at the surface within the survey area or the so-called intrazonal intensity, but in terms of the classical formula for calculating the intensity, the same is strongly dependent on the location of the surveyed area. In the case that the same is in the peripheral parts of an urban area, the same can provide data on the total intensity, but if we are talking about inner-urban areas, this is very difficult to achieve.
5. Conclusions
The results obtained during the multi-year study of the SUHI effect through the proposed methodology and its continuous refinement are indicative of both the complexity of the phenomenon under study and the technological developments in the field of modern geospatial technologies and unmanned aerial systems. The proposed methodology for rapid mapping and assessment of the SUHI effect is based on the ability to work with extremely detailed spatial data objectively characterizing the phenomenon, while the same offers great flexibility in terms of the period in which these data are collected to achieve better and realistic results of the research. Moreover, the process of remotely collected baseline data itself is fully automated, as flight missions can be performed repeatedly, under identical parameters, which in turn makes it suitable for monitoring studies.
In our opinion, those are the greatest advantages of the proposed methodology, which in combination with the wide range of analytical and information resources it can generate, are essential essential importance for adequate supporting the planning and management processes of urban areas. It should also be considered in the context of increasing urbanisation and intensifying climate change, which will continue to place such studies in the focus of the global scientific community. The approaches, methods, and technological solutions included in the methodology are fully adequate to address many of the objective challenges that exist in studying SUHI, and the need to effectively address the same in the urban planning process.
The methodology developed and the methods and technological solutions incorporated are in response to the growing need for very high spatial resolution data that realistically reflects the characteristics of the changing urban environment, while providing the necessary flexibility and responsiveness in the data collection process that is key to the study of the SUHI phenomenon. The methodology has been tested in real-world settings, and the results obtained are direct evidence of the benefits and applicability of the methodology.
Author Contributions
Conceptualization, S.D.; methodology, S.D. and M.I.; software, M.I.; validation, B.B., L.S. and S.P.; formal analysis, S.D., B.B., M.I., L.S. and S.P.; writing—original draft preparation, S.D., B.B., M.I., L.S. and S.P.; writing—review and editing, S.D., B.B. and L.S.; visualization, M.I. All authors have read and agreed to the published version of the manuscript.
Funding
This study is financed by the European Union-NextGenerationEU, through the National Recovery and Resilience Plan of the Republic of Bulgaria, project No BG-RRP-2.004-0008-C01 “Sofia University Marking Momentum for Innovation and Technological Transfer”.
Data Availability Statement
Data are contained within the article.
Acknowledgments
We are very grateful for the support from the project No BG-RRP-2.004-0008-C01. (SUMMIT-Sofia University Marking Momentum For Innovation and Technological Transfer), funded by the European Union—NextGenerationEU, through the National Recovery and Resilience Plan of the Republic of Bulgaria. We also thank the reviewers and the academic editors for their valuable comments that helped to improve the paper’s quality.
Conflicts of Interest
The authors declare no conflict of interest.
References
- J.J. Xia, K. Tu, Z.W. Yan, Y.J. Qi. The super-heat wave in eastern China during July-August 2013: a perspective of climate change Int. J. Climatol., 36, 2016, (3), pp. 1291-1298, . [CrossRef]
- W. Zhang, C.G. Zheng, F. Chen, Mapping heat-related health risks of elderly citizens in mountainous area: a case study of Chongqing, China Sci. Total Environ., 2019, 663, pp. 852-866, . [CrossRef]
- X.P. Song, M.C. Hansen, S.V. Stehman, P.V. Potapov, A. Tyukavina, E.F. Vermote, J.R. Townshend Global land change from 1982 to 2016, Nature, 2018, 560 (7720), pp. 639-643, . [CrossRef]
- A.M. Rizwan, Y.C.L. Dennis, C.H. Liu A review on the generation, determination and mitigation of urban heat island J. Environ. Sci., 20, 2008, (1), pp. 120-128, . [CrossRef]
- E. Alves, M. Anjos, E. Galvani Surface urban heat island in middle city: spatial and temporal characteristics, Urban Sci., 2020, 4 (4), p. 54, . [CrossRef]
- I.D. Stewart, E.S. Krayenhoff, J.A. Voogt, J.A. Lachapelle, M.A. Allen, A.M. Broadbent Time evolution of the surface urban heat Island Earth’s Fut., 9 (10) (2021), . [CrossRef]
- Oke, T.R.; Mills, G.; Christen, A.; Voogt, J.A. Urban Climates; Cambridge University Press: Cambridge, UK, 2017; p. 454.
- Anderson, V.; Leung, A.C.; Mehdipoor, H.; Jänicke, B.; Milošević, D.; Oliveira, A.; Manavvi, S.; Kabano, P.; Dzyuban, Y.; Aguilar, R.; et al. Technological opportunities for sensing of the health effects of weather and climate change: A state-of-the-art-review. Int. J. Biometeorol. 2021, 65, 779–803. [CrossRef]
- Ferguson, G.; Woodbury, A.D. Urban heat island in the subsurface. Geophys. Res. Lett. 2007, 34, L23713. [CrossRef]
- Lokoshchenko, M.A.; Korneva, I.A. Underground urban heat island below Moscow city. Urban Clim. 2015, 13, 1–13. [CrossRef]
- Weng, Q. Thermal infrared remote sensing for urban climate and environmental studies: Methods, applications, and trends. ISPRS J. Photogramm. Remote Sens. 2009, 64, 335–344. [CrossRef]
- Voogt, J.A.; Grimmond, C.S.B. Modeling Surface Sensible Heat Flux Using Surface Radiative Temperatures in a Simple Urban Area. J. Appl. Meteorol. Climatol. 2000, 39, 1679–1699. [CrossRef]
- Voogt, J.A.; Oke, T.R. Thermal remote sensing of urban climates. Remote Sens. Environ. 2003, 86, 370–384.
- Soux, A.; Voogt, J.A.; Oke, T.R. A model to calculate what a remote sensor “sees” of an urban surface. Bound. Layer Meteorol. 2003, 111, 109–132. [CrossRef]
- Tomlinson, C.J.; Chapman, L.; Thornes, J.E.; Baker, C. Remote sensing land surface temperature for meteorology and climatology: A review. R. Meteorol. Soc. Meteorol. Appl. 2011, 18, 296–306. [CrossRef]
- Stewart, I. D., Krayenhoff, E. S., Voogt, J. A., Lachapelle, J. A., Allen, M. A., & Broadbent, A. M. Time evolution of the surface urban heat island. Earth's Future, 2021, 9, e2021EF002178. [CrossRef]
- Eliasson, I. Infrared thermography and urban temperature patterns. Int. J. Remote Sens. 1992, 13, 869–879. [CrossRef]
- Saaroni, H.; Ben-Dor, E.; Bittan, A.; Potchter, O. Spatial distribution and microscale characteristics of the urban heat island in Tel-Aviv, Israel. Landsc. Urban Plan. 2000, 48, 1–18. [CrossRef]
- Skarbit, N.; Gál, T.; Unger, J. Airborne surface temperature differences of the different Local Climate Zones in the urban area of a medium sized city. In Proceedings of the Joint Urban Remote Sensing Event (JURSE), Lausanne, Switzerland, 30 March–1 April 2015; pp. 1–4.
- Bartesaghi Koc, C.; Osmond, P.; Peters, A.; Irger, M. Mapping Local Climate Zones for urban morphology classification based on airborne remote sensing data. In Proceedings of the 2017 Joint Urban Remote Sensing Event (JURSE), Dubai, United Arab Emirates, 6–8 March 2017; pp. 1–4.
- Xiang, T.; Xia, G.; Zhang, L. Mini-Unmanned Aerial Vehicle-Based Remote Sensing: Techniques, applications, and prospects. IEEE Geosci. Remote Sens. Mag. 2019, 7, 29–63.
- Stelian Dimitrov, Anton Popov, Martin Iliev, "Mapping and assessment of urban heat island effects in the city of Sofia, Bulgaria through integrated application of remote sensing, unmanned aerial systems (UAS) and GIS," Proc. SPIE 11524, Eighth International Conference on Remote Sensing and Geoinformation of the Environment (RSCy2020), 115241A (26 August 2020); [CrossRef]
- Dimitrov, S.; Popov, A.; Iliev, M. An Application of the LCZ Approach in Surface Urban Heat Island Mapping in Sofia, Bulgaria. Atmosphere 2021, 12, 1370. [CrossRef]
- Kolokotroni, M.; Giridharan, R. Urban heat island intensity in London: An investigation of the impact of physical characteristics on changes in outdoor air temperature during summer. Sol. Energy 2008, 82, 986–998. [CrossRef]
- Yokobori, T.; Ohta, S. Effect of land cover on air temperatures involved in the development of an intra-urban heat island. Clim. Res. 2009, 39, 61–73. [CrossRef]
- Houett, T.; Pigeon, G. Mapping of urban climate zones and quantifying climate behaviors—An application on Toulouse urban area (France). Environ. Pollut. 2011, 159, 2180–2192. [CrossRef]
- Ng, E.; Ren, C. (Eds.) The Urban Climatic Map: A Methodology for Sustainable Urban Planning; Routledge: London, UK, 2020; p. 528. ISBN 9780367670016.
- Oke, T.R. Initial Guidance to Obtain Representative Meteorological Observations at Urban Sites; IOM Rep. 81; WMO/TD-No. 1250: Geneva, Switzerland, 2004; p. 47. Available online: https://www.wmo.int/pages/prog/www/IMOP/publications/IOM-81/IOM-81-UrbanMetObs.pdf (accessed on 29 May 2021).
- Auer, A.H. Correlation of Land Use and Cover with Meteorological Anomalies. J. Appl. Meteor. 1978, 17, 636–643.
- Ellefsen, R. Mapping and measuring buildings in the urban canopy boundary layer in ten US cities. Energy Build. 1991, 16, 1025–1049.
- Grimmond, C.S.B.; Oke, T.R. Aerodynamic properties of urban areas derived from analysis of urban form. J. Appl. Meteorol. 1999, 38, 1262–1292. [CrossRef]
- Stewart, I.D.; Oke, T.R. Thermal differentiation of “local climate zones” using temperature observations from urban and rural field sites. In Proceedings of the Preprints, 9th Symposium, on Urban Environment, Keystone, CO, USA, 2 August 2010; Available online: https://ams.confex.com/ams/19Ag19BLT9Urban/webprogram/Paper173127.html (accessed on 13 June 2021).
- Stewart, I.D. Redefining the Urban Heat Island. Ph.D. Dissertation, Department of Geography, University of British Columbia, Vancouver, BC, Canada, 2011; p. 352. Available online: https://circle.ubc.ca/handle/2429/38069 (accessed on 13 June 2021).
- Stewart, I.D.; Oke, T.R. Local Climate Zones for Urban Temperature Studies. Bull. Am. Meteor. Soc. 2012, 93, 1879–1900. [CrossRef]
- National Statistical Institute, 2023, Available online: https://nsi.bg/en (accessed on 13 August 2024).
- Heisler, Gordon M., and Anthony J. Brazel. "The urban physical environment: Temperature and urban heat islands." Urban ecosystem ecology, 2010, 55: 29-56.
- Miao, S.; Chen, F.; LeMone, M.A.; Tewari, M.; Li, Q.; Wang, Y. An observational and modeling study of characteristics of urban heat island and boundary layer structures in Beijing. J. Appl. Meteorol. Climatol. 2009, 48, 484–501. [CrossRef]
- Lopes, A.; Alves, E.; Alcoforado, M.J.; Machete, R. Lisbon urban heat island updated: New highlights about the relationships between thermal patterns and wind regimes. Adv. Meteorol. 2013, 2013, 487695. [CrossRef]
- Dimitrov, Stelian, Martin Iliev, Bilyana Borisova, Lidiya Semerdzhieva, and Stefan Petrov. "UAS-Based Thermal Photogrammetry for Microscale Surface Urban Heat Island Intensity Assessment in Support of Sustainable Urban Development (A Case Study of Lyulin Housing Complex, Sofia City, Bulgaria)" Sustainability, 2024, 16, no. 5: 1766. [CrossRef]
- Dimitrov, Stelian, Anton Popov, and Martin Iliev. "An Application of the LCZ Approach in Surface Urban Heat Island Mapping in Sofia, Bulgaria" Atmosphere, 2021, 12, no. 11: 1370. [CrossRef]
- Peck, R.; Olsen, C.; Devore, J.L. Introduction to Statistics and Data Analysis, 4th ed.; Brooks/Cole: Boston, MA, USA, 2012; p. 912.
- Dlesk, Adam, Karel Vach, and Karel Pavelka. "Photogrammetric Co-Processing of Thermal Infrared Images and RGB Images" Sensors, 2022, 22, no. 4: 1655.
- Jiachen Liu, Jianting Wu, Yong Yang, Baolei Zhang, Le Yin, Exploring the spatiotemporal impacts of urban green space patterns on the core area of urban heat island, Ecological Indicators, Volume 166, 2024, 112254, ISSN 1470-160X. [CrossRef]
- Aboulnaga, M., Trombadore, A., Mostafa, M., Abouaiana, A. (2024). Global Cities’ Plans to Mitigate Urban Heat Islands Effect Exploiting Urban Green Coverage. In: Livable Cities. Springer, 2024,Cham. [CrossRef]
- McPherson, E. G., Muchnick, J. Effect of street tree shade on asphalt concrete pavement performance, Journal of arboriculture, 2005, Vol. 31, No. 6, pp. 303-310. [CrossRef]
- Akbari, H., Kurn, D., Bretz, S., Hanford, J. Peak power and cooling energy savings of shade trees, Energy and Buildings, Vol., 1997, 25, pp. 139-148. [CrossRef]
- Oke TR, Stewart I. Local climate zones for urban temperature studies. Bull. American Meteorological Society. 2012;93:1879–1900. [CrossRef]
- Weinmann, M., Jutzi, B. and Mallet, C. Feature relevance assessment for the semantic interpretation of 3D point cloud data. ISPRS Annals of Photogrammetry, Remote Sensing and Spatial Information Sciences II-5,/, 2013, W2, pp. 313–318. [CrossRef]
- Hackel, T., Wegner, J. D. and Schindler, K.. Fast semantic segmentation of 3D point clouds with strongly varying density. ISPRS Annals of the Photogrammetry, Remote Sensing and Spatial Information Sciences, 2016, Prague, Czech Republic 3, pp. 177–184.
- Geletič, J.; Lehnert, M. GIS-based delineation of local climate zones: The case of medium-sized Central European cities. Morav. Geogr. Rep. 2016, 24, 2–12. [CrossRef]
- Geletič, J.; Lehnert, M.; Dobrovolný, P. Land surface temperature differences within local climate zones, based on two central European cities. Remote Sens. 2016, 8, 788. [CrossRef]
- Lelovics, E.; Unger, J.; Gál, T.; Gál, C.V. Design of an urban monitoring network based on Local Climate Zone mapping and temperature pattern modelling. Clim. Res. 2014, 60, 51–62. [CrossRef]
- Wu, Y.; Sharifi, A.; Yang, P.; Borjigin, H.; Murakami, D.; Yamagata, Y. Mapping building carbon emissions within local climate zones in Shanghai. Energy Procedia 2018, 152, 815–822. [CrossRef]
- Li, T.; Xu, Y.; Yao, L. Detecting urban landscape factors controlling seasonal land surface temperature: From the perspective of urban function zones. Environ. Sci. Pollut. Res. 2021, 28, 1–16. [CrossRef]
- Wangchongyu Peng, Rui Wang, Jin Duan, Weijun Gao, Zhengxi Fan, Surface and canopy urban heat islands: Does urban morphology result in the spatiotemporal differences?, Urban Climate, 2022, Volume 42, 101136, ISSN 2212-0955. [CrossRef]
- Aboulnaga, M., Trombadore, A., Mostafa, M., Abouaiana, A. Understanding Urban Heat Island Effect: Causes, Impacts, Factors, and Strategies for Better Livability and Climate Change Mitigation and Adaptation. In: Livable Cities. Springer, 2024, Cham. [CrossRef]
- Phan Kieu Diem, Can Trong Nguyen, Nguyen Kieu Diem, Nguyen Thi Hong Diep, Pham Thi Bich Thao, Tran Gia Hong, Thanh Noi Phan,Remote sensing for urban heat island research: Progress, current issues, and perspectives,Remote Sensing Applications: Society and Environment, 2024, Volume 33, 101081,ISSN 2352-9385. [CrossRef]
- Prashanthini Rajagopal, Radhakrishnan Shanthi Priya, Ramalingam Senthil, A review of recent developments in the impact of environmental measures on urban heat island, Sustainable Cities and Society, 2023, Volume 88, 104279, ISSN 2210-6707. [CrossRef]
- Kim and Brown (Se Woong Kim, Robert D. Brown,Urban heat island (UHI) intensity and magnitude estimations: A systematic literature review, Science of The Total Environment, 2021, Volume 779, 146389, ISSN 0048-9697. [CrossRef]
- Jianting Wu, Yong Yang, Baolei Zhang, Le Yin, Exploring the spatiotemporal impacts of urban green space patterns on the core area of urban heat island, Ecological Indicators, 2024, Volume 166, 112254, ISSN 1470-160X. [CrossRef]
- Huang Q, Haase D, Dong Q, Teng Y, Su M, Yang Z. Cooling Effect of Green Spaces on Urban Heat Island in a Chinese Megacity: Increasing Coverage versus Optimizing Spatial Distribution. Environ Sci Technol. 2024 Apr 2;58(13):5811-5820. Epub 2024 Mar 19. PMID: 38502088. [CrossRef]
- Paul Osmond, Alan Peters, Quantifying the seasonal cooling capacity of ‘green infrastructure types’ (GITs): An approach to assess and mitigate surface urban heat island in Sydney, Australia, Landscape and Urban Planning, 2020, Volume 203, 103893, ISSN 0169-2046. [CrossRef]
- Zhang, J.; Zhao, J.; Pang, B.; Liu, S. Calculation of the Optimal Scale of Urban Green Space for Alleviating Surface Urban Heat Islands: A Case Study of Xi’an, China. Land 2024, 13, 1043. [CrossRef]
- Mentaschi, L., Duveiller Bogdan, G.H.E., Zulian, G., Corban, C., Pesaresi, M., Maes, J., Stocchino, A. and Feyen, L., Global long-term mapping of surface temperature shows intensified intra-city urban heat island extremes, GLOBAL ENVIRONMENTAL CHANGE-HUMAN AND POLICY DIMENSIONS, 2022, ISSN 0959-3780, 72, p. 102441, JRC123644).
- Kangning Li, Yunhao Chen, Shengjun Gao, Uncertainty of city-based urban heat island intensity across 1112 global cities: Background reference and cloud coverage, Remote Sensing of Environment, 2022, Volume 271, 112898, ISSN 0034-4257. [CrossRef]
- Wangchongyu Peng, Rui Wang, Jin Duan, Weijun Gao, Zhengxi Fan, Surface and canopy urban heat islands: Does urban morphology result in the spatiotemporal differences?, Urban Climate, 2022, Volume 42, 101136, ISSN 2212-0955. [CrossRef]
- Chidozie Maduabuchukwu Nwakaire, Chiu Chuen Onn, Soon Poh Yap, Choon Wah Yuen, Peter Dinwoke Onodagu, Urban Heat Island Studies with emphasis on urban pavements: A review, Sustainable Cities and Society, 2020, Volume 63, 102476, ISSN 2210-6707. [CrossRef]
Figure 1.
EbeeX fixed-wing UAS (a) and Duet T dual-purpose thermal and mapping camera (b).
Figure 1.
EbeeX fixed-wing UAS (a) and Duet T dual-purpose thermal and mapping camera (b).
Figure 2.
S.O.D.A. 3D camera for EbeeX platform.
Figure 2.
S.O.D.A. 3D camera for EbeeX platform.
Figure 3.
General methodological scheme.
Figure 3.
General methodological scheme.
Figure 4.
Key study areas for thermal photogrammetric surveys in Lulin complex between 11.07- 17.07.2024.
Figure 4.
Key study areas for thermal photogrammetric surveys in Lulin complex between 11.07- 17.07.2024.
Figure 5.
Land surface temperature (LST) oC, Sofia City, Lyulin residential complex.
Figure 5.
Land surface temperature (LST) oC, Sofia City, Lyulin residential complex.
Figure 6.
Profile of the LST oC, Sofia City, Lyulin residential complex.
Figure 6.
Profile of the LST oC, Sofia City, Lyulin residential complex.
Figure 7.
LST oC of different land surfaces, Sofia City, Lyulin residential complex.
Figure 7.
LST oC of different land surfaces, Sofia City, Lyulin residential complex.
Figure 8.
LST oC of green and sealed surfaces, Sofia City, Lyulin residential complex.
Figure 8.
LST oC of green and sealed surfaces, Sofia City, Lyulin residential complex.
Figure 9.
Differences between averaged temperature values for different surface types, Sofia City, Lyulin residential complex.
Figure 9.
Differences between averaged temperature values for different surface types, Sofia City, Lyulin residential complex.
Figure 10.
Orthophoto (a) 3D point cloud (b) and digital surface model (c), Sofia City, Lyulin residential complex.
Figure 10.
Orthophoto (a) 3D point cloud (b) and digital surface model (c), Sofia City, Lyulin residential complex.
Figure 11.
Classified point cloud by class: (top left) buildings; (top right) sealed surfaces; (bottom left) medium and tall vegetation; (bottom right) herbaceous vegetation, Sofia City, Lyulin residential complex.
Figure 11.
Classified point cloud by class: (top left) buildings; (top right) sealed surfaces; (bottom left) medium and tall vegetation; (bottom right) herbaceous vegetation, Sofia City, Lyulin residential complex.
Figure 12.
Local climate zones (LCzs) (50х50m), Sofia City, Lyulin residential complex.
Figure 12.
Local climate zones (LCzs) (50х50m), Sofia City, Lyulin residential complex.
Figure 13.
Regression dependences between landcover/land use and LST by LCZ, Sofia City, Lyulin residential complex (points on the left scatterplots are matching the LCZ colors of the map).
Figure 13.
Regression dependences between landcover/land use and LST by LCZ, Sofia City, Lyulin residential complex (points on the left scatterplots are matching the LCZ colors of the map).
Figure 14.
Intra-urban intensity of SUHI, Sofia City, Lyulin residential complex.
Figure 14.
Intra-urban intensity of SUHI, Sofia City, Lyulin residential complex.
Figure 15.
Magnitude/intensity of SUHI by micro districts, Sofia City, Lyulin residential complex.
Figure 15.
Magnitude/intensity of SUHI by micro districts, Sofia City, Lyulin residential complex.
Figure 16.
Map of heat load categories, Sofia City, Lyulin residential complex.
Figure 16.
Map of heat load categories, Sofia City, Lyulin residential complex.
Figure 17.
Temperature differences on land surfaces (oC) between 11.07-17-07.2024, Sofia City, Lyulin residential complex.
Figure 17.
Temperature differences on land surfaces (oC) between 11.07-17-07.2024, Sofia City, Lyulin residential complex.
|
Disclaimer/Publisher’s Note: The statements, opinions and data contained in all publications are solely those of the individual author(s) and contributor(s) and not of MDPI and/or the editor(s). MDPI and/or the editor(s) disclaim responsibility for any injury to people or property resulting from any ideas, methods, instructions or products referred to in the content. |
© 2024 by the authors. Licensee MDPI, Basel, Switzerland. This article is an open access article distributed under the terms and conditions of the Creative Commons Attribution (CC BY) license (http://creativecommons.org/licenses/by/4.0/).
