1. Introduction
SO
2 is a colorless, pungent gas. SO
2 can quickly generate sulfites after being inhaled into the human body. SO
2 can be produced endogenous in the body and has a unique physiological regulation effect in the cardiovascular system [
1,
2,
3]. However, excessive SO
2 can produce toxic effects on humans and animals, leading to adverse reactions and diseases [
4,
5,
6,
7]. Excessive intake of SO
2 may lead to asthma, allergic reactions, cardiovascular disease, and neurological disorders [
8,
9,
10]. In addition, SO
2 is also an environmental pollutant, which easily reacts with water in the atmosphere to produce acid rain, causing harm to the ecological environment. Because of its importance to human health and the environment, it has received great attention. As an important chemical raw material, hydrazine (N
2H
4) inevitably poses a potential threat to the environment and human health in the process of production and use. At the same time, N
2H
4 is also a highly toxic substance, and the human body does not produce endogenous N
2H
4, but N
2H
4 can enter the human body through the skin, respiratory tract or digestive tract, causing damage to the liver, lung, kidney and central nervous system of the human body, and in severe cases, lead to organ failure and threaten life [
11,
12,
13,
14,
15]. According to the official regulations of the United States Environmental Protection Agency (USEPA), the threshold for N
2H
4 residues in drinking water should be strictly controlled at a level of less than 10 ppb [
16,
17,
18,
19,
20]. Therefore, it is of great significance to develop a dual-function, efficient and sensitive method for the detection of N
2H
4 and SO
2 in environmental and biological samples.
As a new molecular recognition and detection technology, fluorescence probe technology has the advantages of high sensitivity, good selectivity and fast response speed, and has been widely used in biomedicine, environmental monitoring and other fields [
21,
22,
23,
24,
25,
26,
27,
28,
29]. Due to its deep tissue penetration ability, low background interference and high light stability, near-infrared (NIR) fluorescent probes have shown great application potential in biological imaging, medical diagnosis and environmental monitoring and other fields [
30]. So far, a large number of fluorescent probes have been reported for the detection of SO
2 and N
2H
4 in biological and environmental systems, but most of them can only detect one analyte [
31,
32,
33,
34,
35,
36], and few fluorescent probes can detect both SO
2 and N
2H
4. The multifunctional fluorescent probe breaks through the limitation that only a single fluorescent analyte can detect a single analyte, and has more applications and detection efficiency. Simultaneous differential detection of SO
2 and N
2H
4 can avoid optical crosstalk, metabolism, and different localization of multiple probes in vivo, while maintaining cost-effectiveness, less time consumption, and non-invasive imaging [
37,
38,
39,
40].
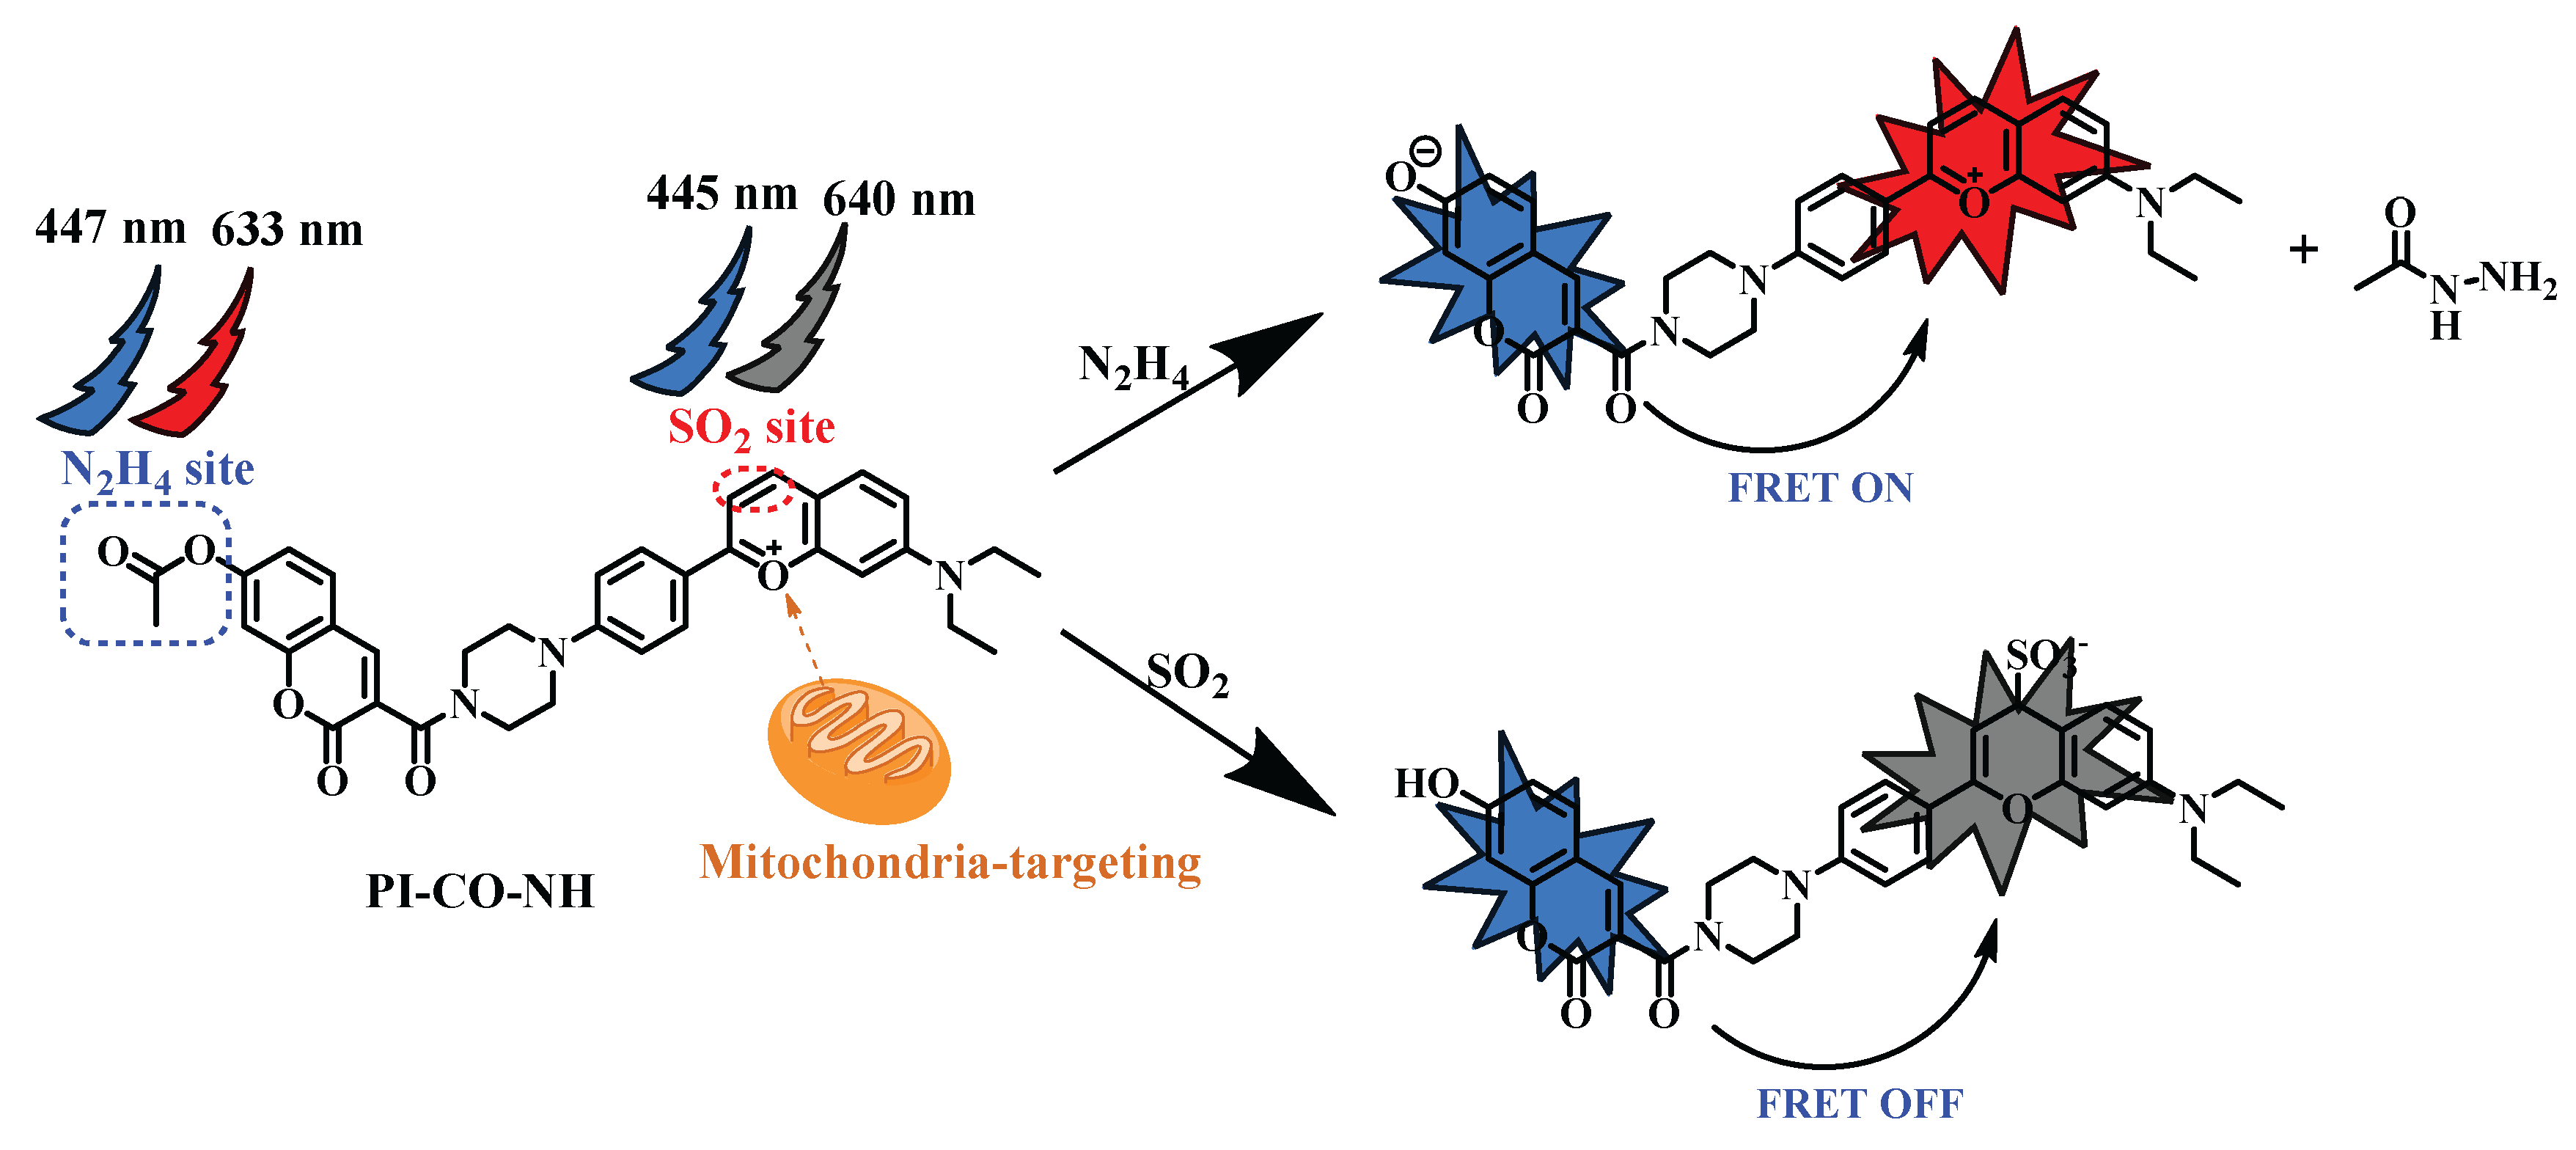
Based on this, we designed and developed a novel fluorescence probe based on piperazine-replaced benzopyranium salt combined with coumarin carboxylic acid, and then mihalic acid and 4-(diethylamino)-2-hydroxybenzaldehyde as raw materials, which also has a two-site FRET regulation strategy. The probe has excellent luminescence performance and low toxicity, including benzopyranium salt containing oxygen ions with excellent mitochondrial localization function, adding SO2 reaction double bond break, red light quenching; Acetyl is a response site for N2H4 (Scheme 2). These response groups can detect N2H4 and SO2 separately or simultaneously by means of emission fluctuations, thereby minimizing overlap in the probe spectral range. In addition, it was confirmed in cell experiments that the probe PI-CO-NH can detect N2H4 and SO2 in living cells. PI-CO-NH has also been successfully applied to soil and test strips, and we hope that the current work can provide good prospects for monitoring N2H4 and SO2 in environmental and biological systems.
2. Experimental Section
2.1. Materials and Instruments
Drugs and solvents used are analytical pure are purchased from suppliers in the experiments and do not need further purification. All chemicals from Aladdin were used without further purification. Fluorescence spectra were carried out a HITACHI F-7000 spectrophotometer. UV-visible spectra were recorded with a HITACHI U-3900 spectrophotometer. NMR spectra were recorded on a JBruker AVANCE-600MHz spectrometer and chemical shifts were referenced relative to tetramethylsilane. Mass data (ESI) were obtained by an AB Triple TOF 5600plus System (AB SCIEX, Framingham, USA). The final bioimaging application were measured by the Zeiss LSM880 Airyscan confocal laser scanning microscope.
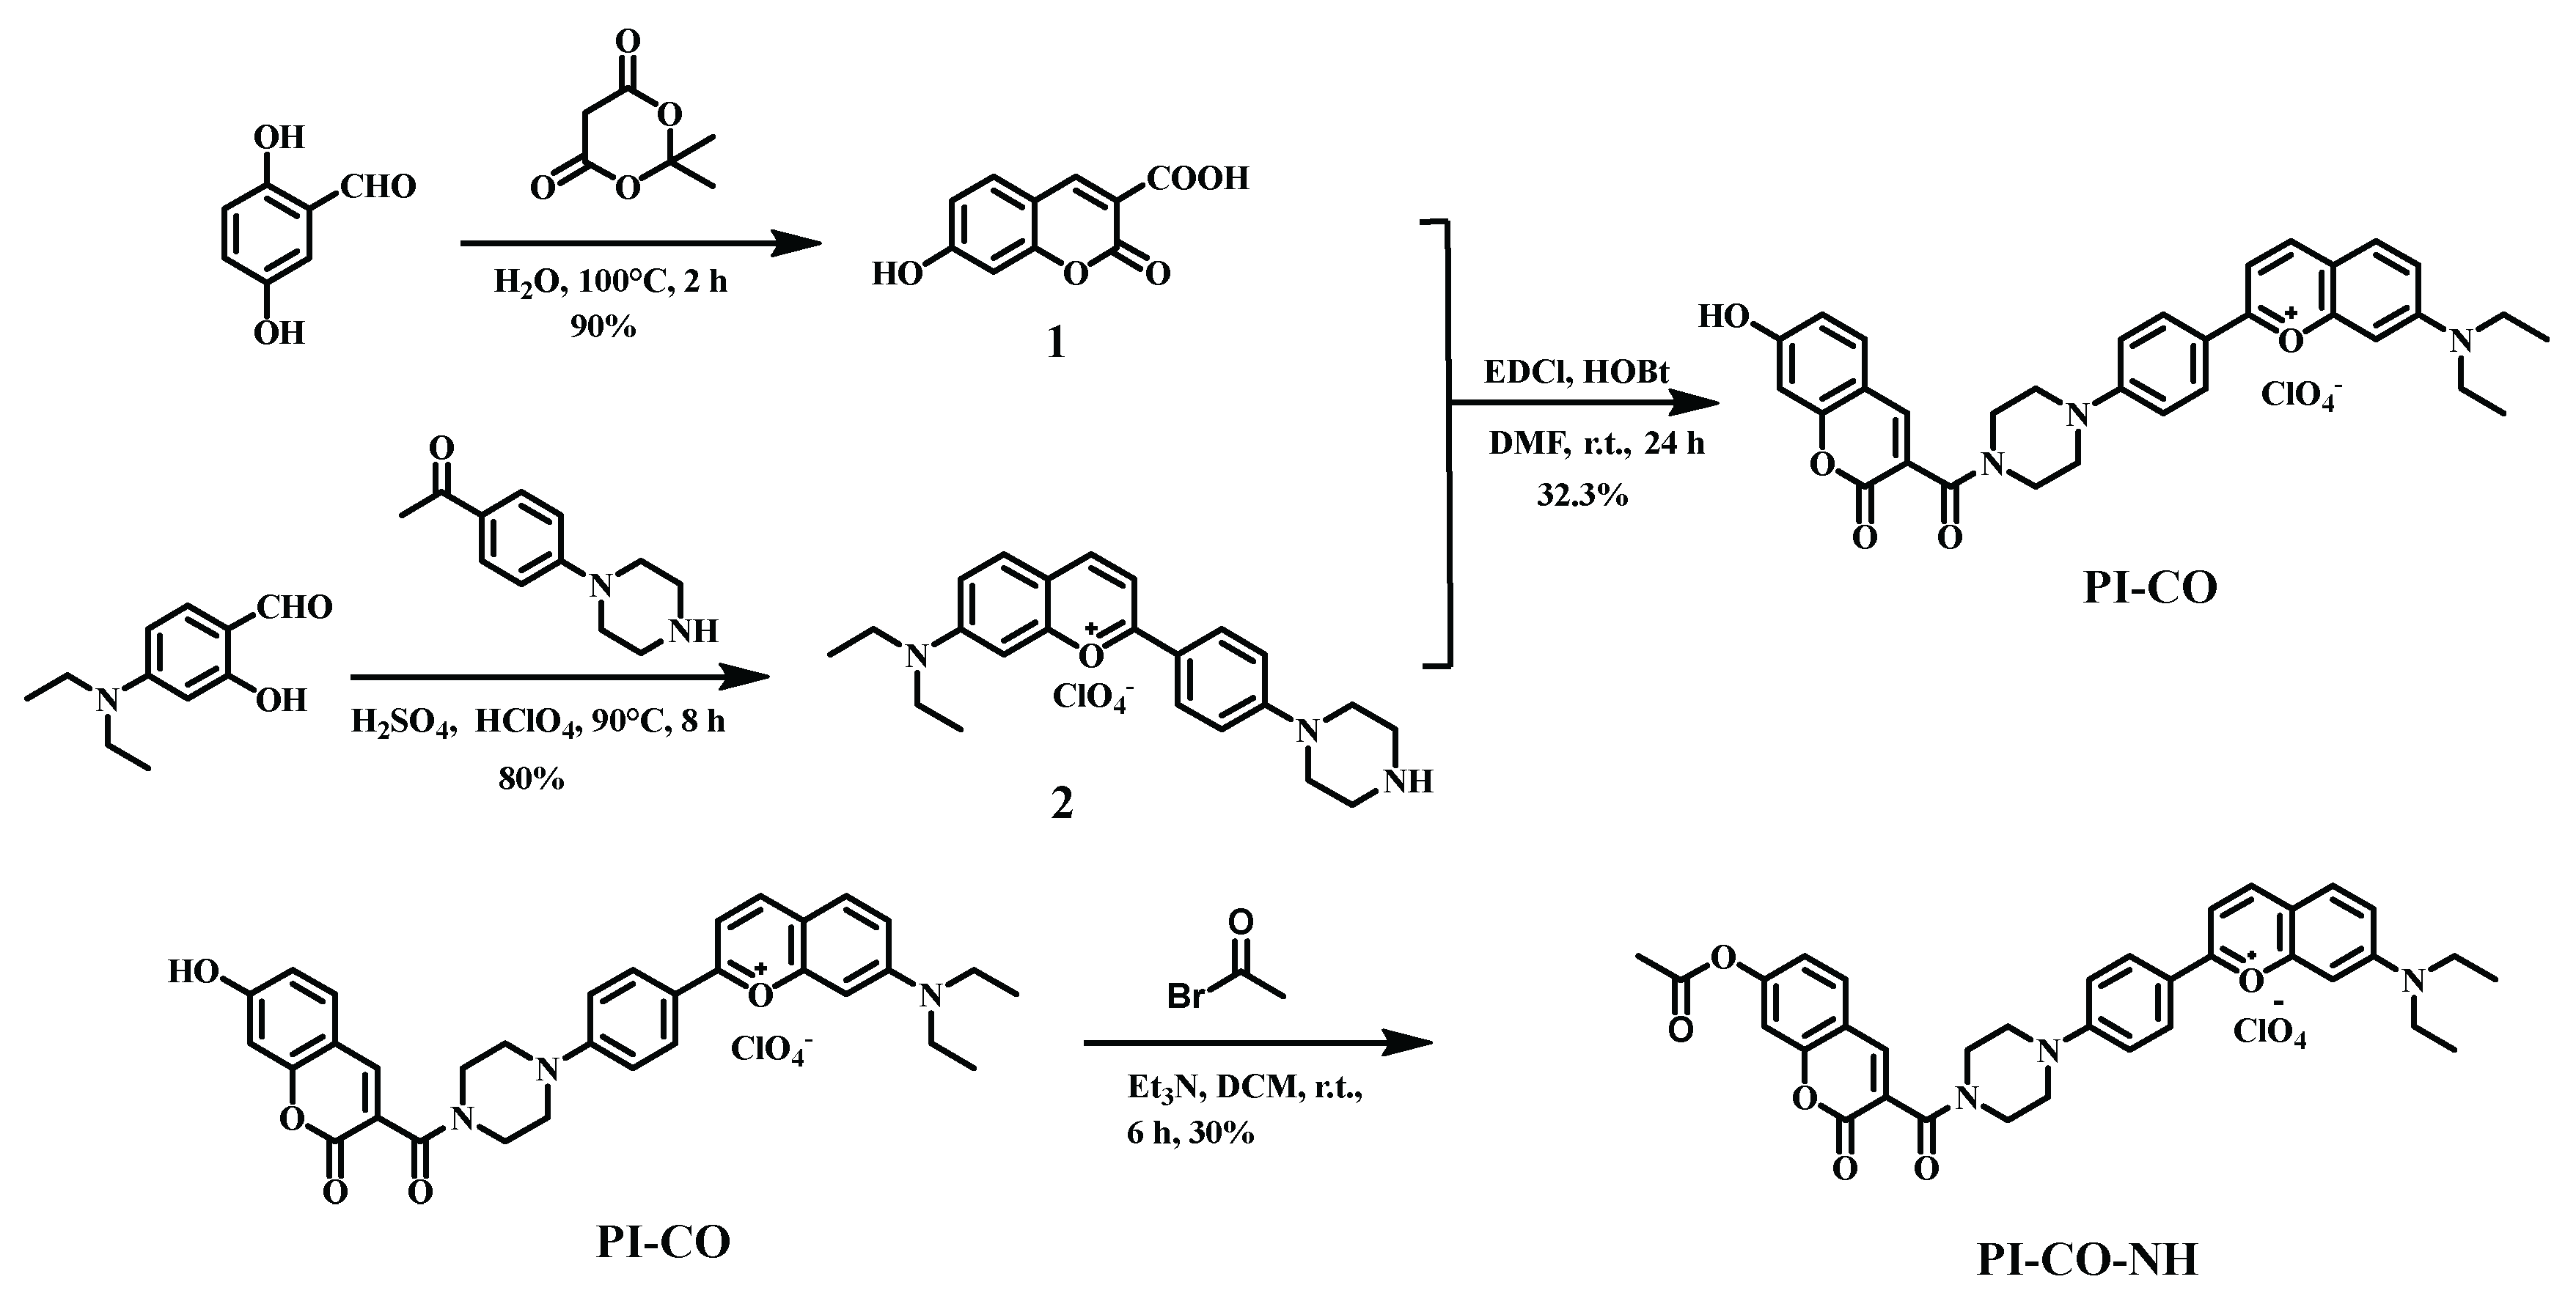
Scheme 1.
The synthesis of the probe PI-CO-NH.
Scheme 1.
The synthesis of the probe PI-CO-NH.
2.2. The Preparation and Characterization of PI-CO-NH
Compound 1 and
compound 2 were synthesized by a method reported in the literature [
41,
42].
To a solution of compound 1 (0.103 g, 0.5 mmol) were added 1-ethyl-3-(3-dimethylaminopropyl) carbodiimide hydrochloride (EDCl, 0.380 g, 2 mmol) and 1-hydroxybenzotriazole (HOBt, 0.270 g, 2 mmol), and the resulting mixture was stirred in dried DMF (15 mL) at 0 ◦C under N2 for 30 min. Then, compound 2 (0.230 g, 0.5 mmol) and triethyl-amine (200 μL) were sequentially added. The resulting mixture was stirred at room temperature for 24 h, and then poured into water and washed with cold water to afford an black solid. This powder was purified by column chromatography on silica (methanol/dichloromethane = 1:10 v/v) to afford probe PI-CO (0.105 g, 32.3%)
PI-CO (0.088 g, 0.16 mmol), acetyl bromide (0.04 g, 0.32 mmol) and trimethylamine (45 μL, 0.32 mmol) were dissolved in CH
2Cl
2 (5 mL) and the mixture was stirred 6 h at room temperature. The solution was concentrated and was purified by column chromatography to get a dark purple solid
PI-CO-NH (0.028 g, yield: 30%). 1H NMR (600 MHz, DMSO-d6) δ 8.73 (d, J = 8.1 Hz, 1H), 8.65 (d, J = 8.4 Hz, 1H), 8.29 (d, J = 8.7 Hz, 2H), 8.00 (d, J = 7.9 Hz, 2H), 7.92 (d, J = 9.2 Hz, 1H), 7.66 (s, 1H), 7.50 (d, J = 8.4 Hz, 1H), 7.37 (d, J = 9.0 Hz, 1H), 7.31 (s, 1H), 7.21 (d, J = 8.6 Hz, 2H), 7.07 (d, J = 8.3 Hz, 1H), 3.78 (d, J = 40.8 Hz, 4H), 3.72 – 3.60 (m, 8H), 2.25 (d, J = 8.1 Hz, 3H), 1.25 (s, 7H) (
Figure S1 and S2). HS-MS m/z: [M]
+ calcd for 592.24; Found 592.30 (
Figure S3).
2.3. Solution Preparation and Optical Measurement
The PI-CO-NH was dissolved in DMSO to make a 2 mM stock solution. Stock solutions of N2H4 and SO2 were prepared by direct dissolution in deionized water. Various ions (NO3-; I-; SO32-; S2O32-; Br-; Cl-; F-; NO2-; CH3COO-; OH-; .O2; ONOO- ; Cys; Glycine; GSH; H2O2; Hcy; L-Cystine; L-Glutamate; L-Lysine ; L-Proline; SO42-; SNP; K+; Na+; Mg2+; Ca2+) were prepared in deionized water. All tests were completed in HEPES buffer (pH 7.4, containing 30% CH3OH, v/v). Hela cells were used for cell imaging studies.
3. Results and Discussion
3.1. Responding Mechanism of PI-CO-NH
The identification mechanism of
PI-CO-NH is speculated as follows (
Scheme 2). The acetyl group linked by the ether bond is the recognition site for N
2H
4, and the reaction with hydrazine first attacks the carbonyl group of the acetyl group, and then causes the ester group to break down, causing coumarin to glow blue. After adding SO
2, the double bond on benzopyrrole was broken and the red fluorescence was quenched. To further investigate the response mechanism, we validated the corresponding HRMS characterization of
PI-CO-NH with N
2H
4 and SO
2. These results provide support for our proposed probe (
PI-CO-NH) to distinguish between N
2H
4 and SO
2.
3.2. UV–Visible Absorption Spectra of PI-CO-NH
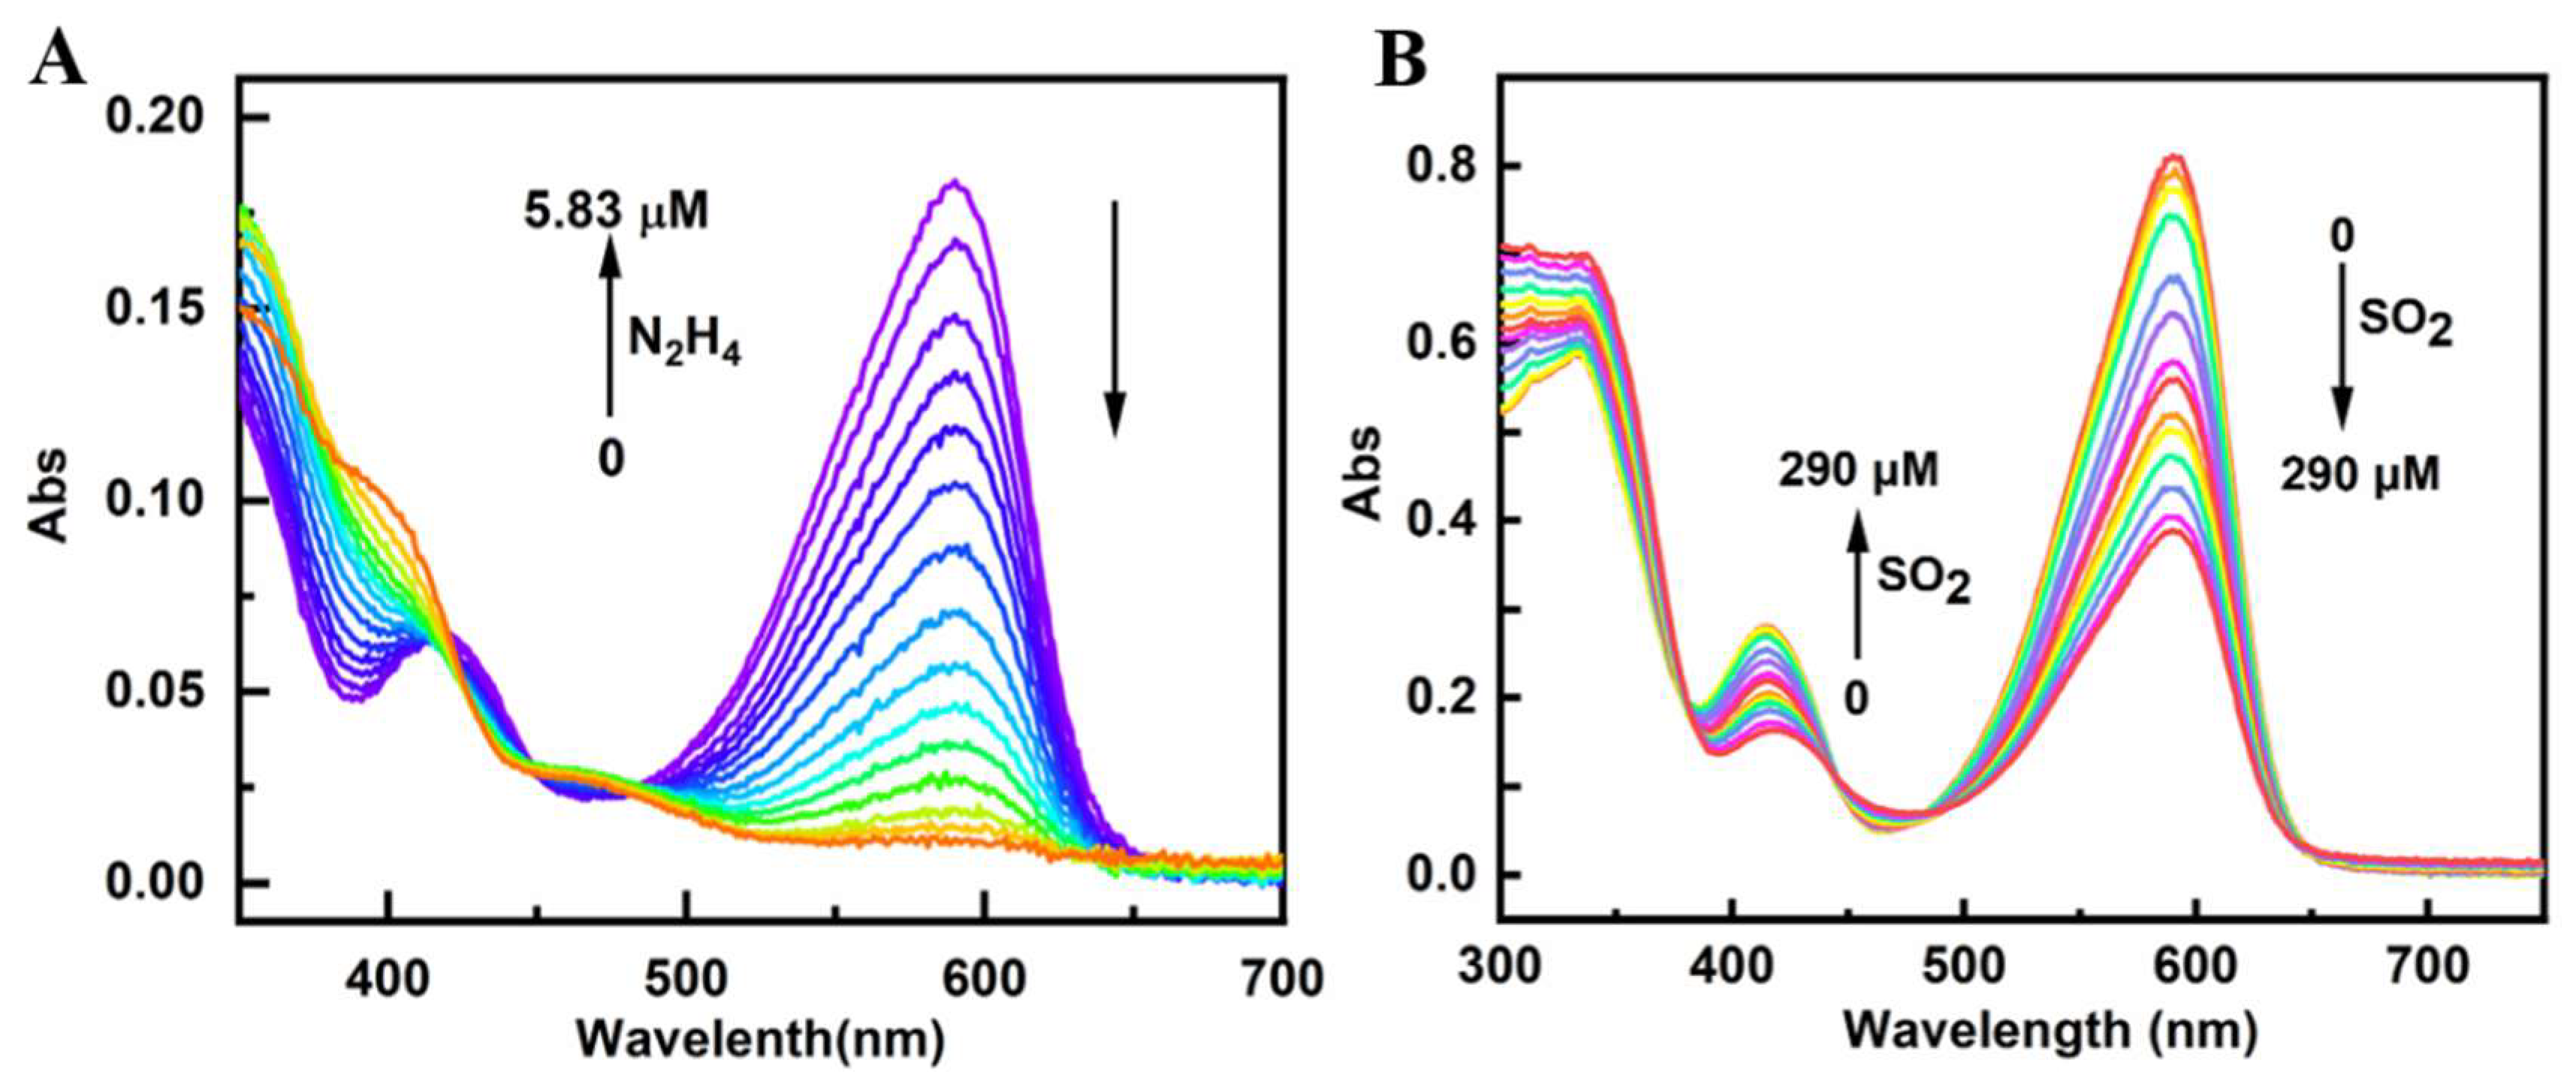
First, we studied the UV-visible spectra of
PI-CO-NH for N
2H
4 in HEPES buffer (pH 7.4, containing 30 % CH
3OH, v/v). As shown in
Figure 1A,
PI-CO-NH has a peak at 447 nm and 633 nm, respectively. After adding N
2H
4, the absorption peak at 447 nm is gradually enhanced, and the absorption peak at 633 nm is gradually weakened. The appearance of new peaks indicates that the ester group in the probe structure is destroyed and combines with N
2H
4 to form a new substance.
Then the UV–visible response of
PI-CO-NH for N
2H
4 in HEPES buffer (pH 7.4, containing 30 % CH
3OH, v/v) was tested. It can be seen from
Figure 1B that
PI-CO-NH has strong absorption peaks at 425 nm and 580 nm. With the addition of SO
2, the absorption peak at 425 nm increased significantly and the absorption peak at 580 nm decreased significantly. It was concluded that the double bond of
PI-CO-NH reacted with SO
2 was broken, and the solution changed from blue purple to colorless. This phenomenon shows that
PI-CO-NH can be used as a colorimetric probe and can be identified with the “naked eye”.
3.3. Fluorescence Spectra of PI-CO-NH
The fluorescence intensity of
PI-CO-NH for N
2H
4 and SO
2 was detected in HEPES buffer (pH 7.4, containing 30% CH
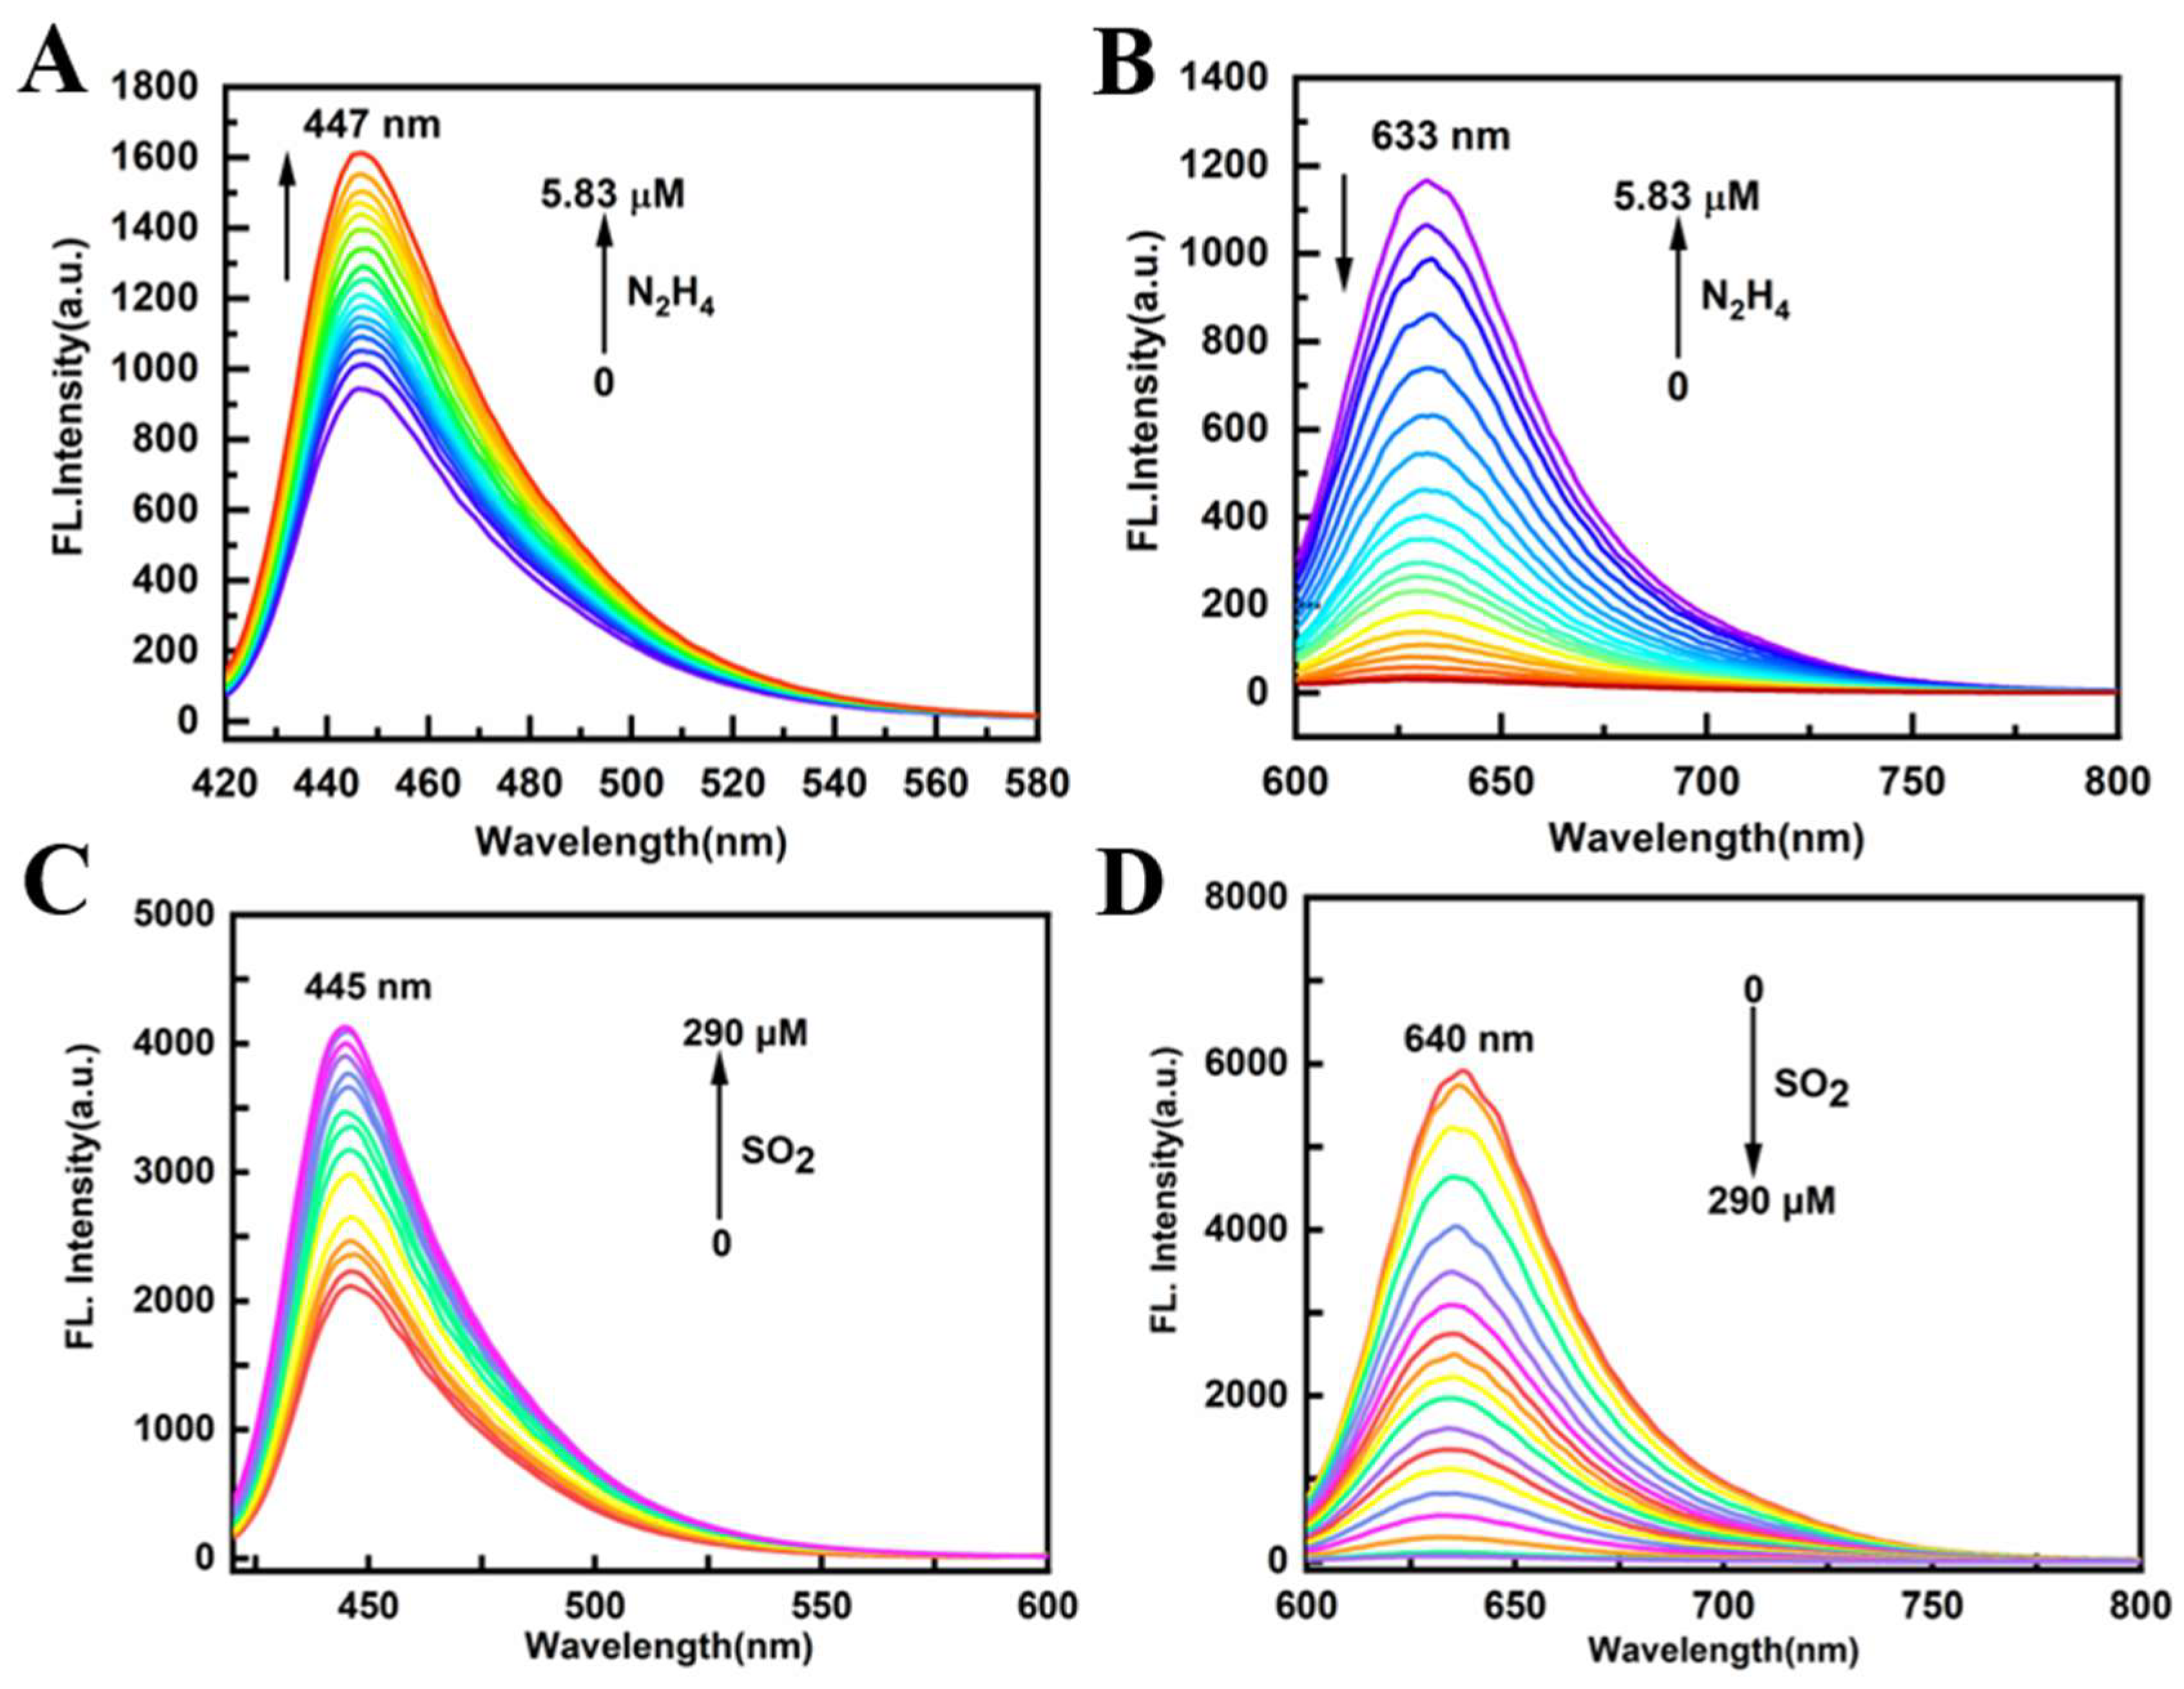
3OH, v/v). As shown in
Figure 2AB, when N
2H
4 was added, the ether bond breaks, releasing a red fluorescence of 633 nm. At the same time, the fluorescence intensity at 447 nm gradually increased with the increase of concentration. The significant increase in fluorescence intensity is due to the blocking of the PET process from PI-CO to acetyl bromide. In order to test the response of
PI-CO-NH to SO
2 (
Figure 2CD), an emission peak appeared at 640 nm under 580 nm excitation, and the fluorescence intensity gradually decreased with the addition of SO
2. The results show that
PI-CO-NH can achieve rapid detection of SO
2.
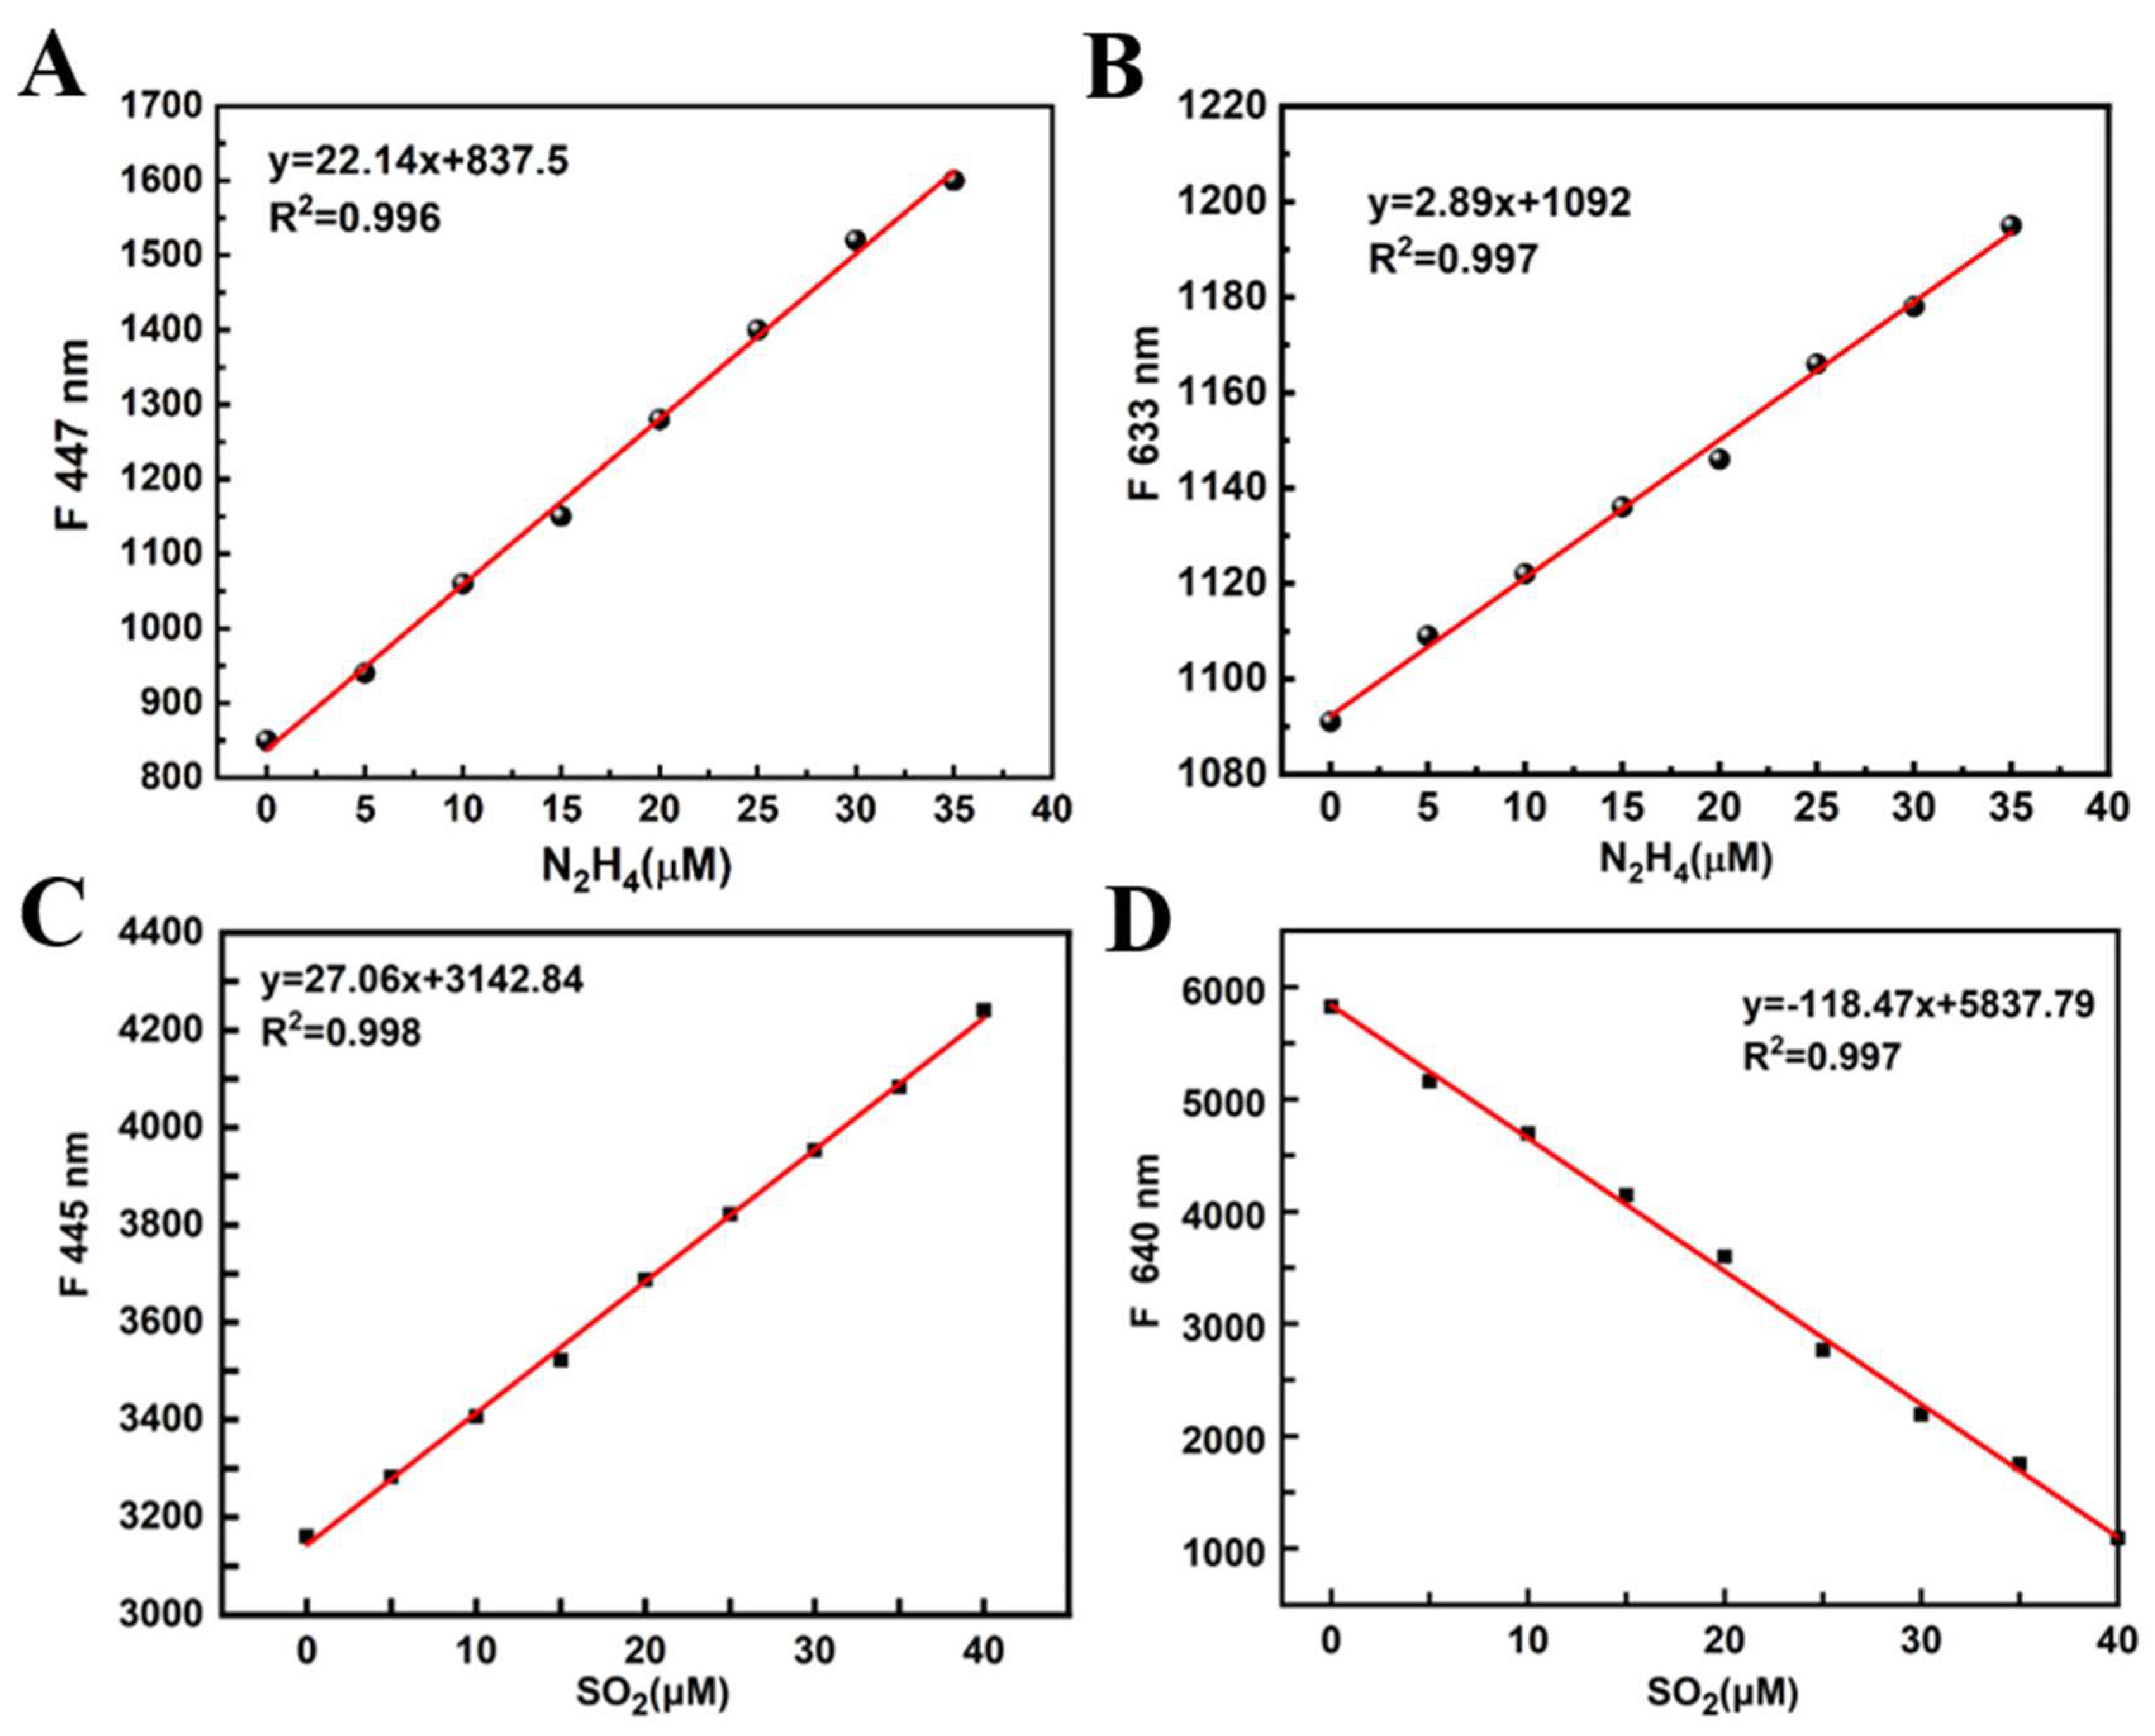
In order to determine the linear response range of
PI-CO-NH to N
2H
4 and SO
2, we obtained the corresponding curve by using the concentration of N
2H
4 and SO
2 as the transverse coordinates and the fluorescence intensity as the vertical coordinates (
Figure 3). The linear equation of N
2H
4 was y=22.14x+837.5, R
2=0.996 (
λex=420 nm); y=2.89x+1092, R
2=0.997 (
λex=580 nm). Further, the linear equation of SO
2 was y=27.06x+3142.84, R
2=0.998 (
λex=420 nm). Besides, The linear equation of SO
2 was y=-118.477x+5837.79, R
2 = 0.987 (
λex=580 nm).
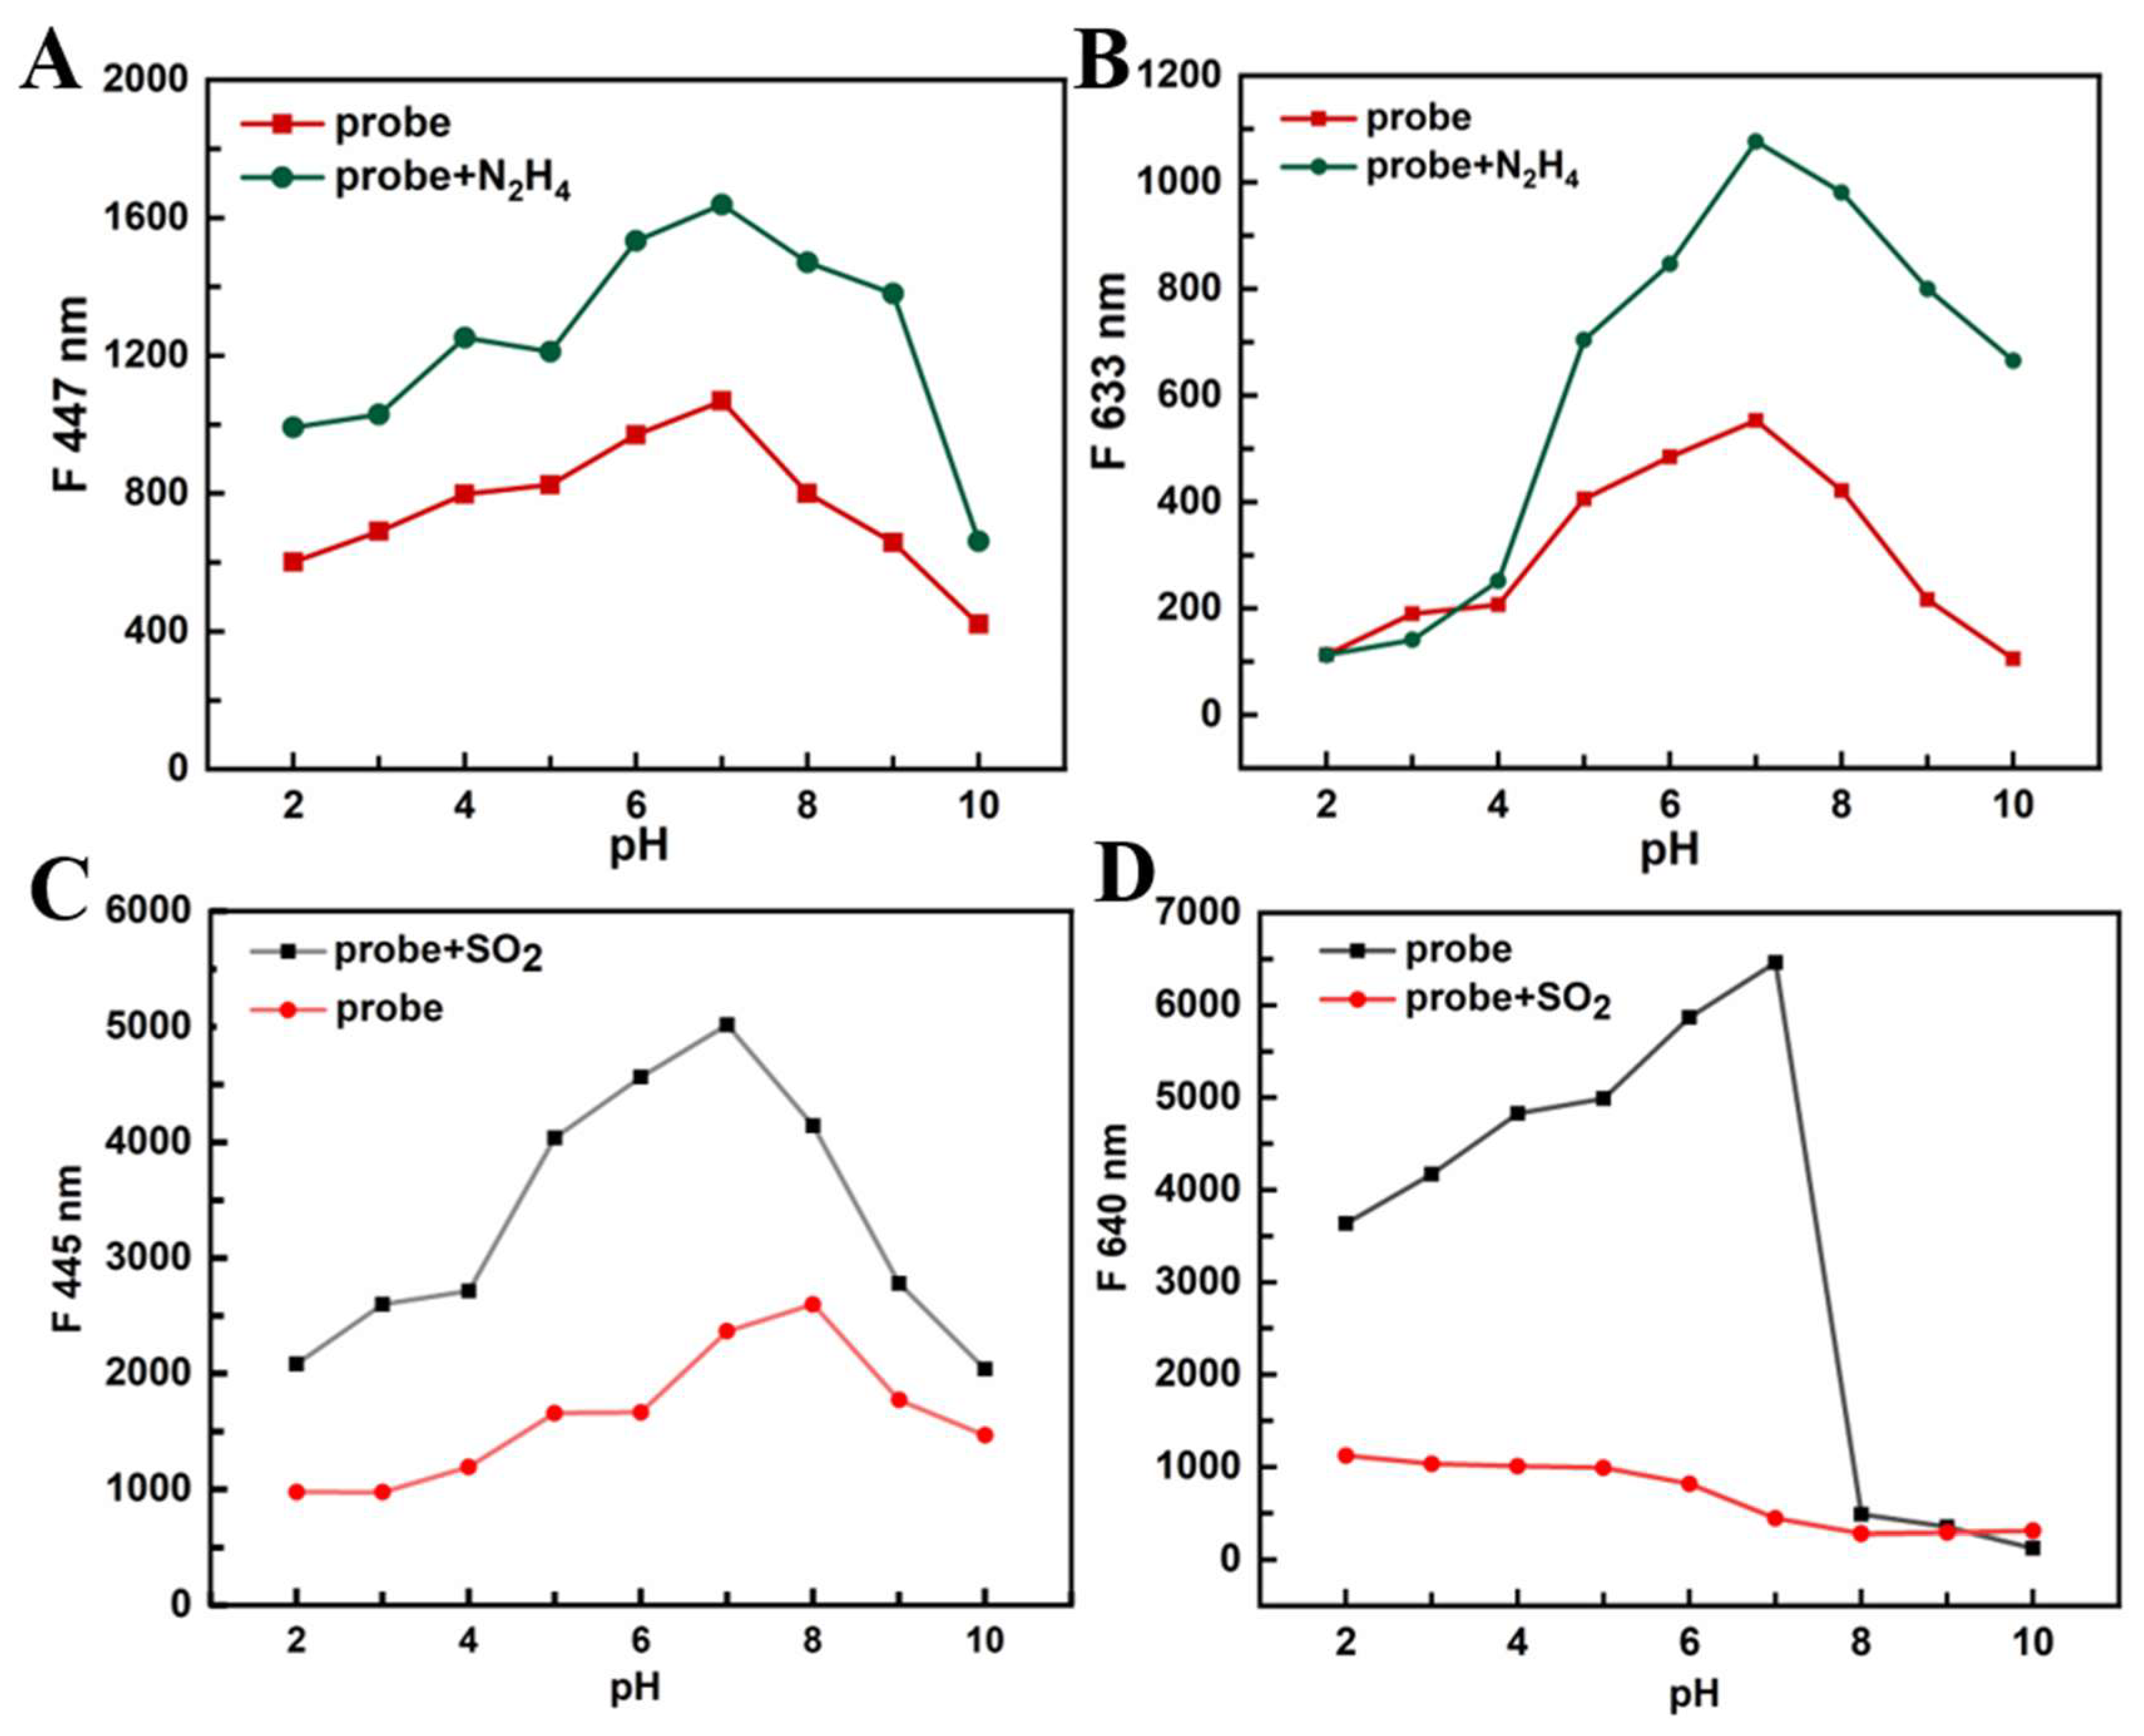
3.4. pH Test of PI-CO-NH
To investigate the effects of pH for the fluorescent response of
PI-CO-NH, the fluorescence intensity of
PI-CO-NH was measured from pH 2-10 (
Figure S2). In the absence of N
2H
4 and SO
2, the fluorescence intensity of
PI-CO-NH did not apparent changed in the range of pH 2-10. When adding N
2H
4 (SO
2), the emission of
PI-CO-NH at 447 (640) nm increased significantly with the change of pH, and reached the maximum at neutral condition. These results indicate that
PI-CO-NH has good sensing performance under physiological conditions.
Figure 4.
Different pH values fluorescent changes of PI-CO-NH in the absence and present of N2H4 and SO2.
Figure 4.
Different pH values fluorescent changes of PI-CO-NH in the absence and present of N2H4 and SO2.
3.5. Selective Testing of PI-CO-NH
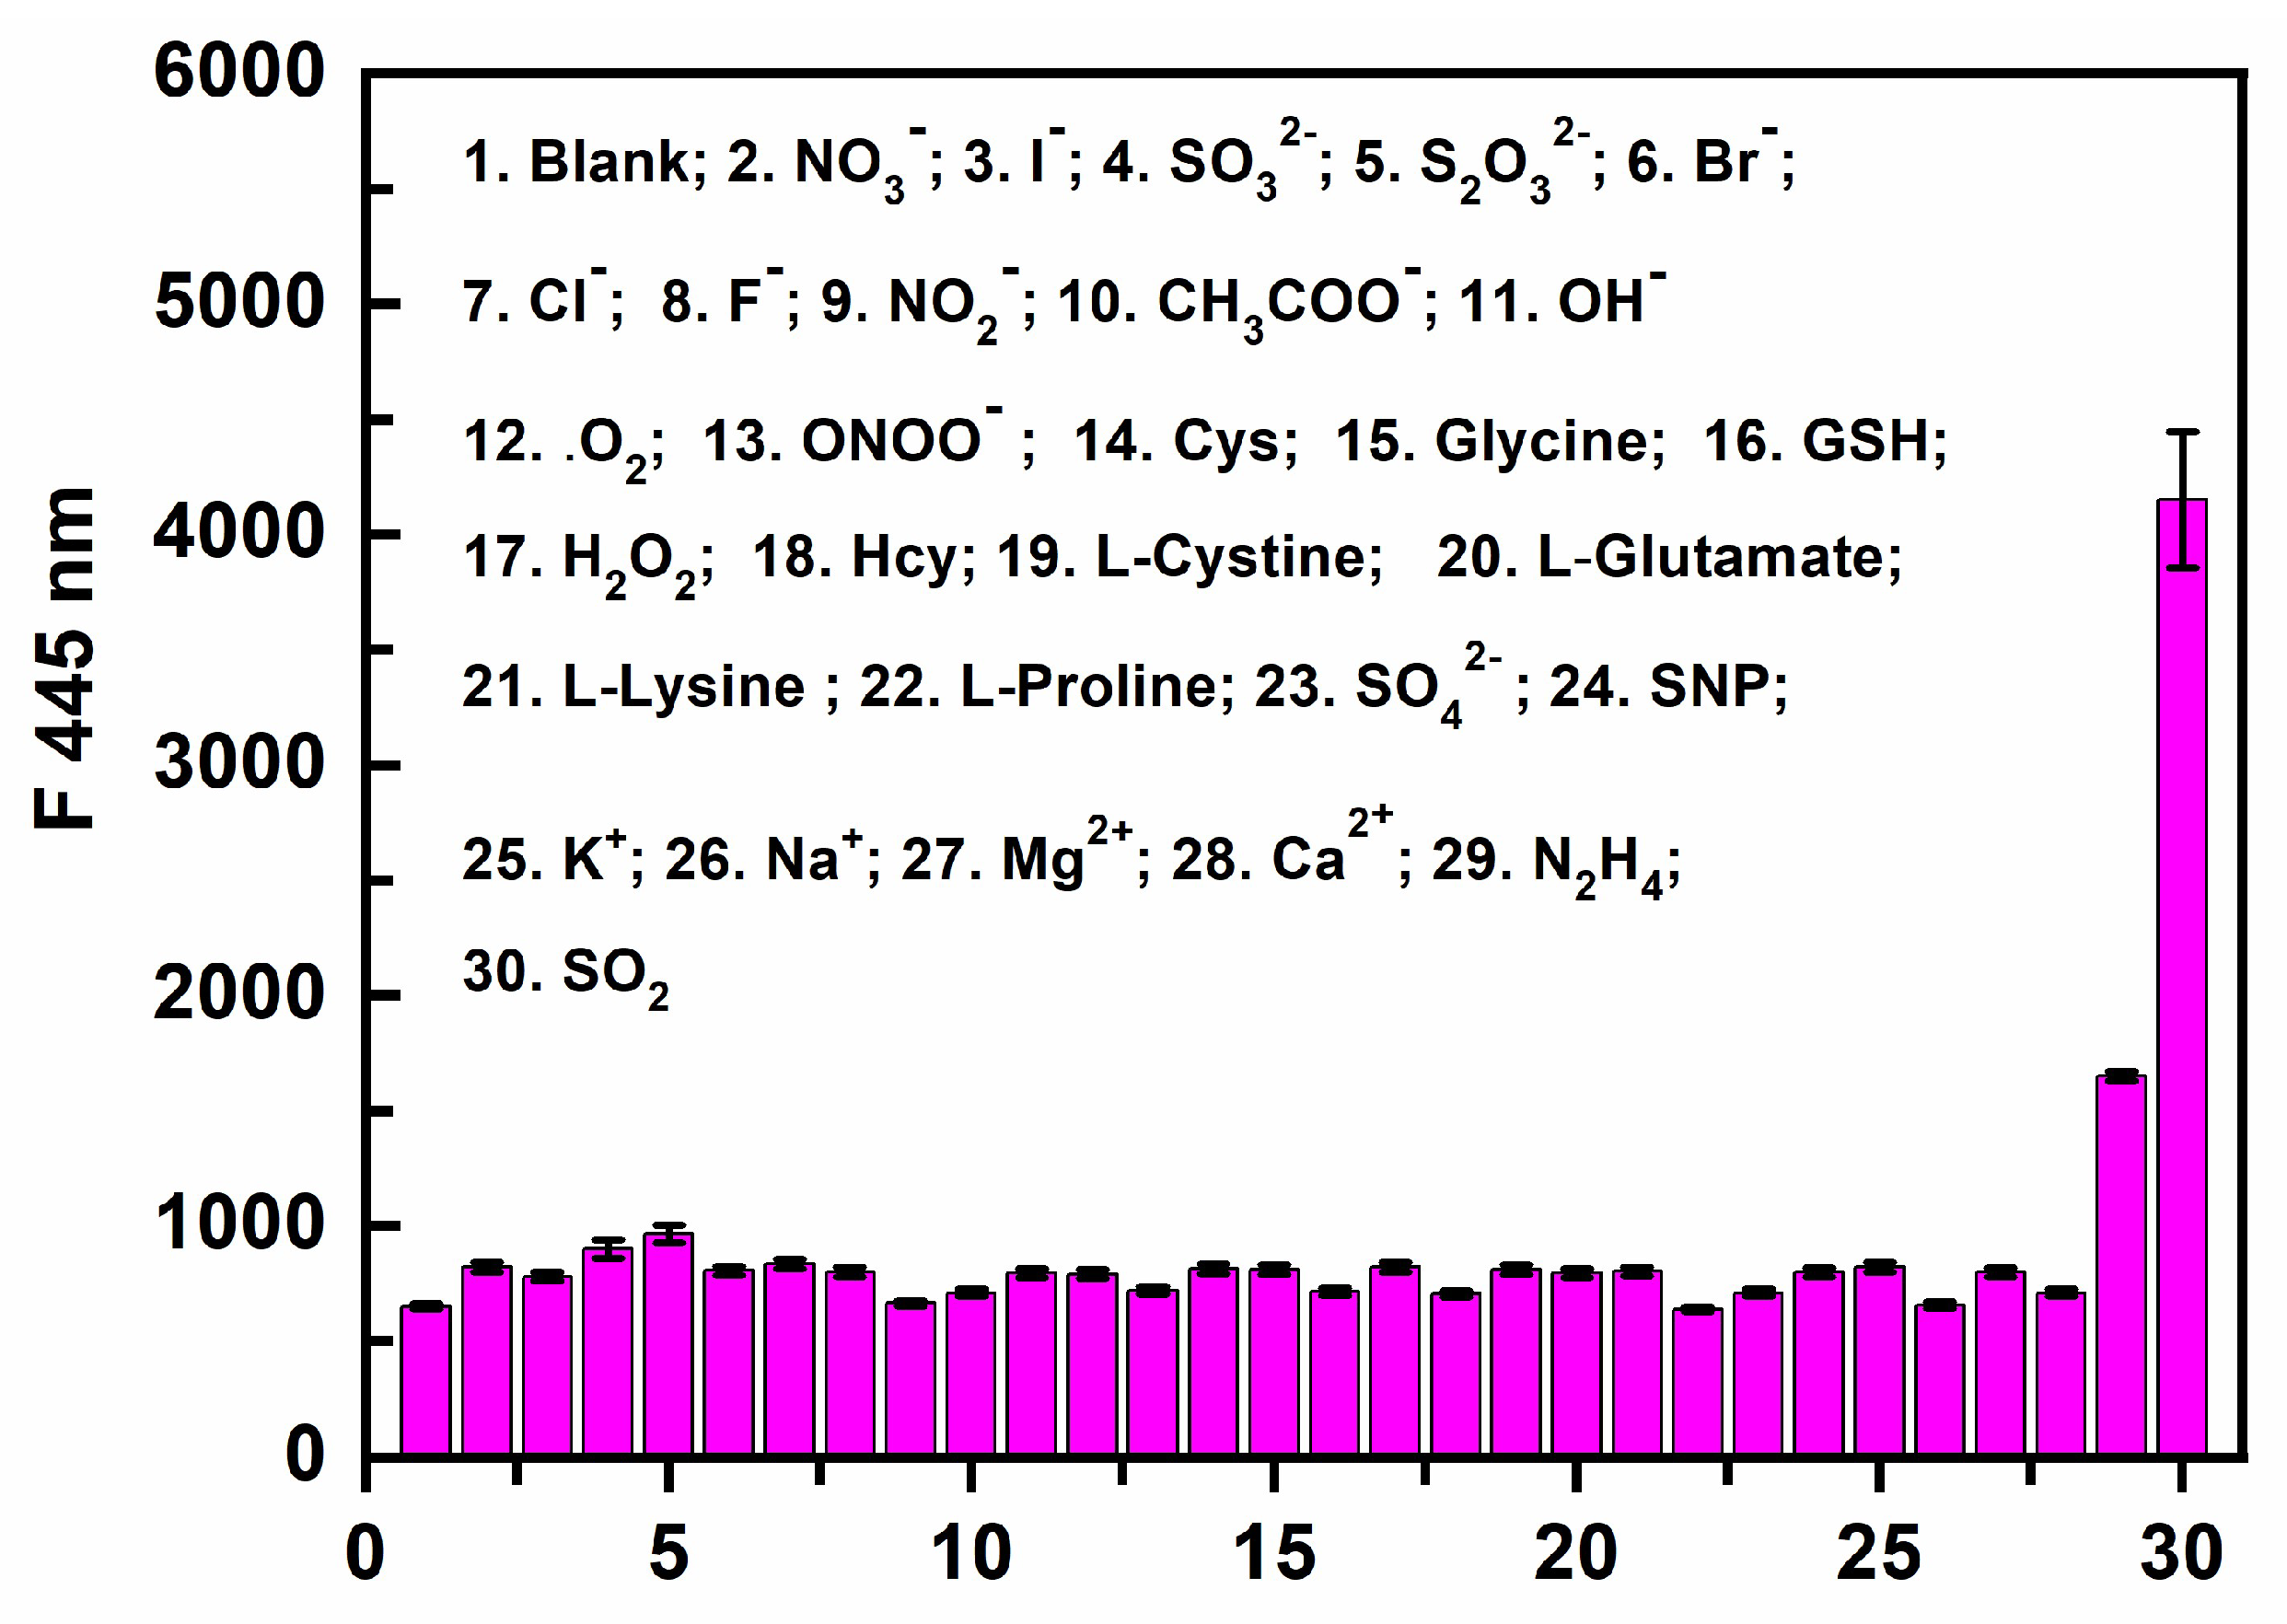
We evaluated the selectivity of
PI-CO-NH to N
2H
4 and SO
2 over other amino acids, including NO
3-; I
-; SO
32-; S
2O
32-; Br
-; Cl
-; F
-; NO
2-; CH
3COO
-; OH
-;
.O
2; ONOO
- ; Cys; Glycine; GSH; H
2O
2; Hcy; L-Cystine; L-Glutamate; L-Lysine ; L-Proline; SO
42-; SNP; K
+; Na
+; Mg
2+; Ca
2+. From
Figure 5, only N
2H
4 and SO
2 could cause obvious changes of fluorescence intensity of
PI-CO-NH, and other amino acids caused negligible fluorescence responses. This showed
PI-CO-NH had high selectivity to N
2H
4 and SO
2 over other amino acids.
3.6. Time Response of PI-CO-NH
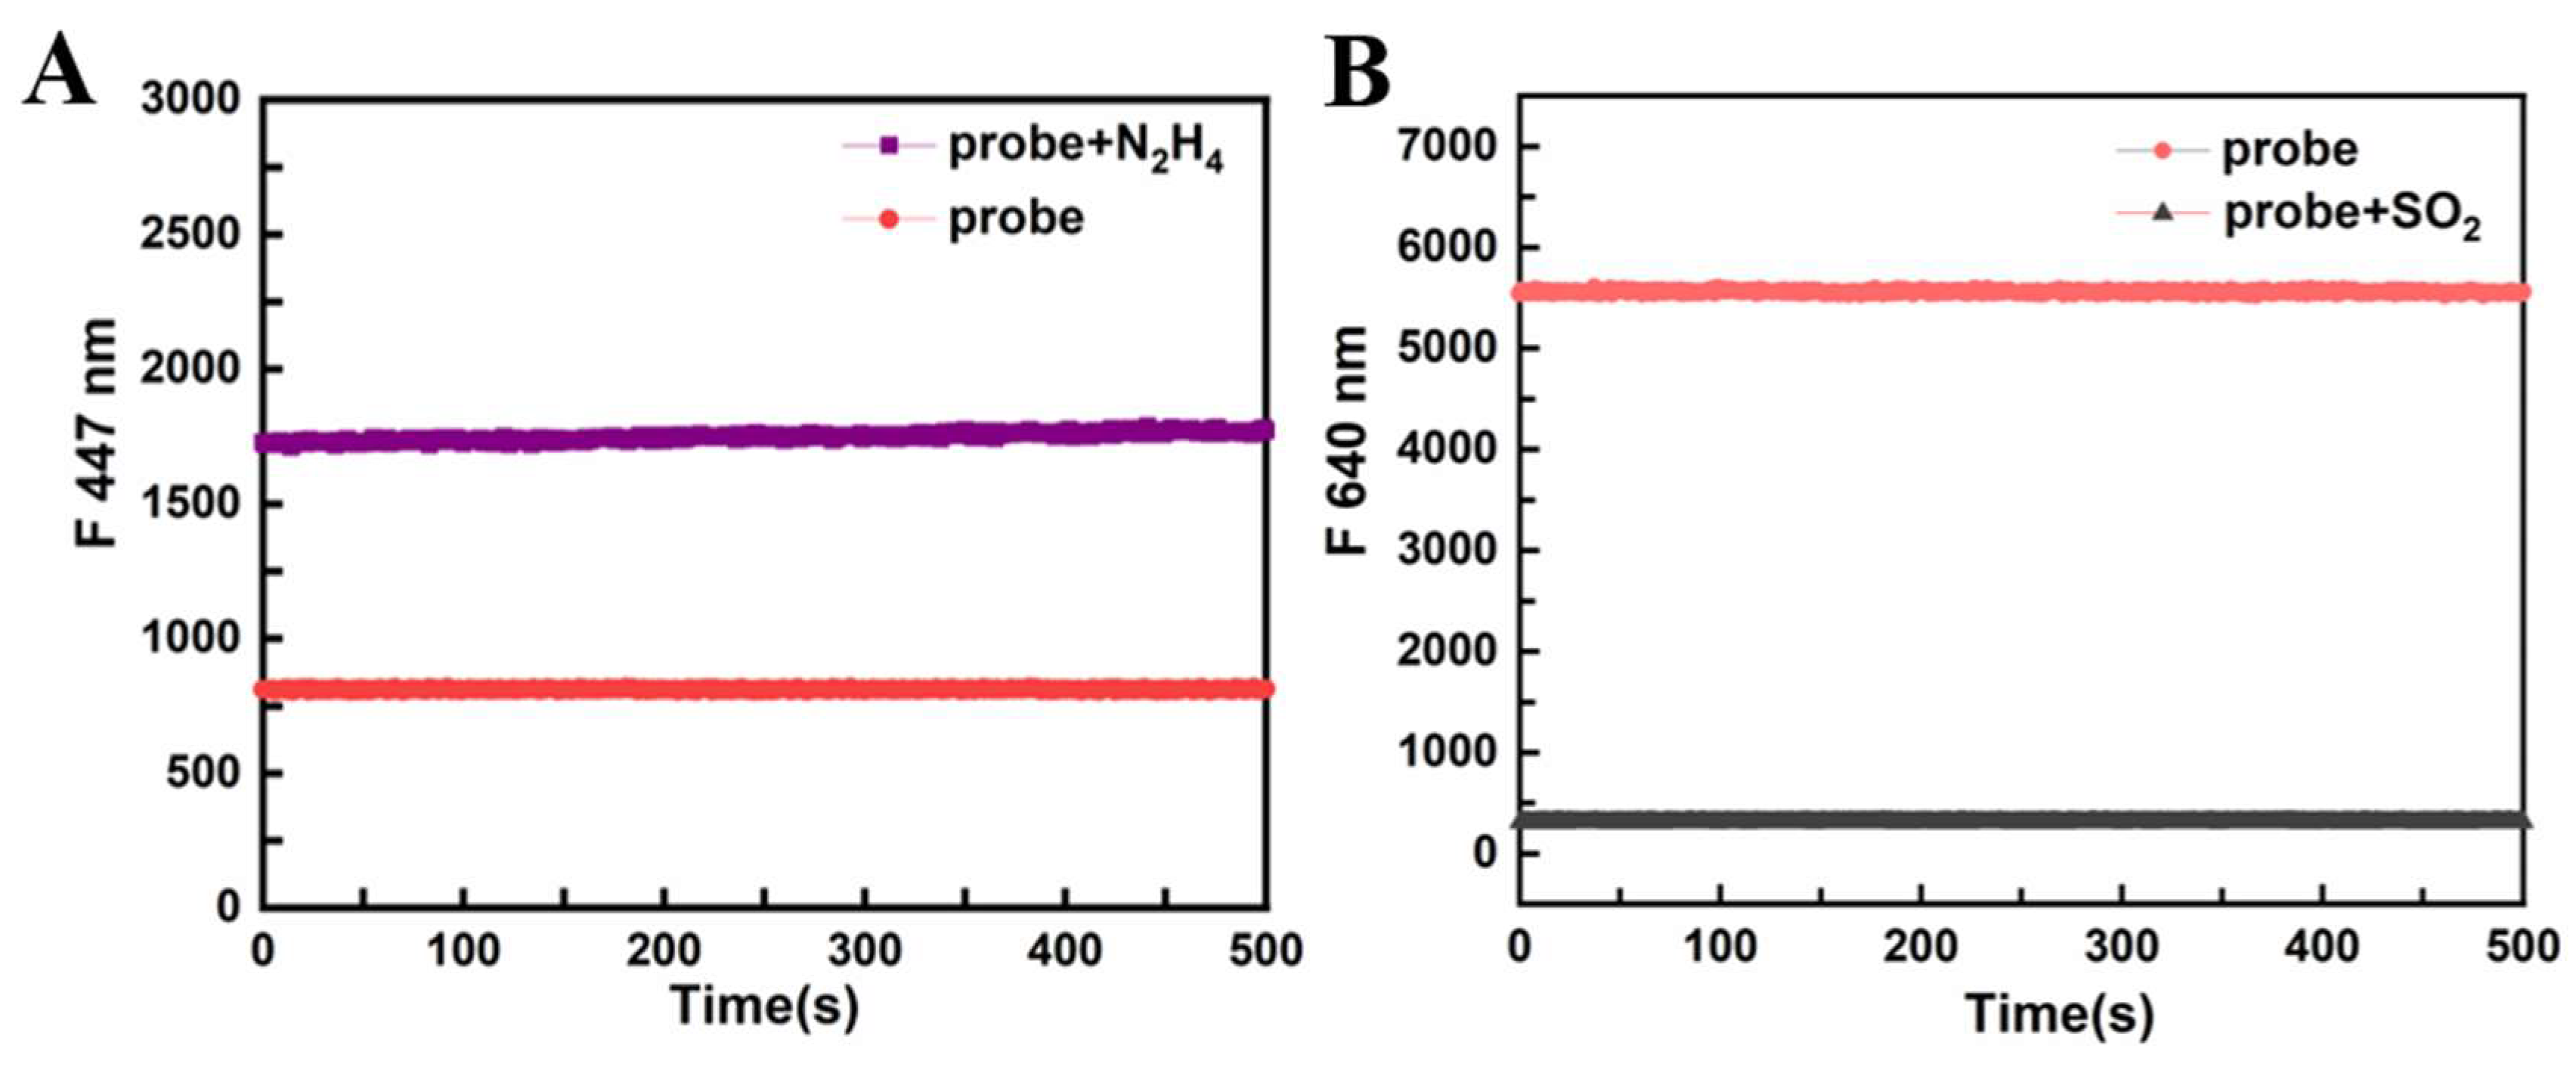
The time response of
PI-CO-NH to N
2H
4 and SO
2 was measured in HEPES buffer (pH 7.4, containing 30% CH
3OH, v/v). After adding N
2H
4, the fluorescence intensity of
PI-CO-NH significantly increased at 447 nm (
Figure 6A). Besides, when added SO
2, the fluorescence intensity drops rapidly.
PI-CO-NH has good stability.
3.7. Determination of N2H4 in Soil Samples and Strips
Based on the fact that the widespread use of N
2H
4 can lead to serious water and soil contamination, we investigated the ability of
PI-CO-NH to detect N
2H
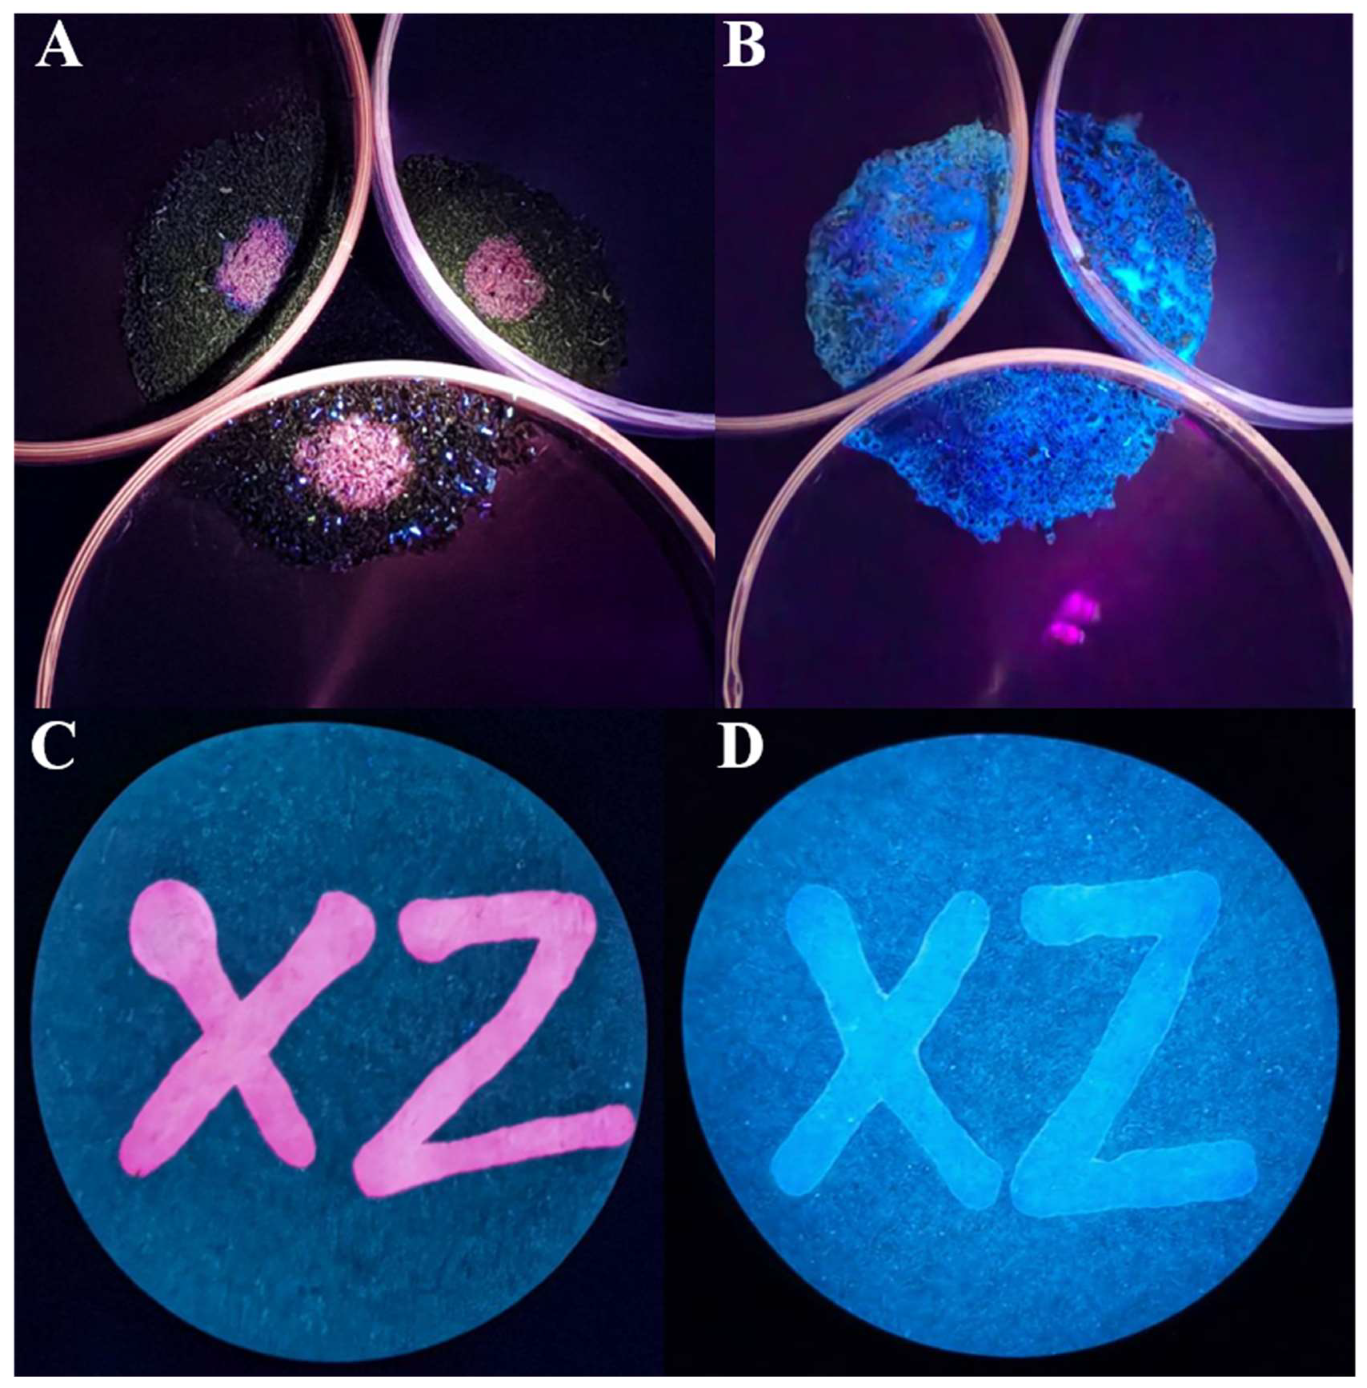
4 in various soils (sand, clay and field soil) and in test strips. In the soil sample(
Figure 7A-B), the probe was first mixed with the soil, and then the fluorescence color under the ultraviolet lamp was observed. Then N
2H
4 was added to the soil mixed with the probe, and the fluorescence color under the ultraviolet lamp was observed again. In the experiment of the test strip (
Figure 7C-D), we also did a similar test, dissolve the probe in the water source (Yunzhonghe River), observe the color of the trace left by the liquid on the filter paper under the ultraviolet lamp, and then add N
2H
4 to the liquid mixed with the probe, and observe the color of the trace left by the liquid on the filter paper under the ultraviolet lamp again. The figure shows the different fluorescence patterns of
PI-CO-NH (red) and
PI-CO-NH + N
2H
4 (blue) under ultraviolet light. It can be clearly seen from the figure that when
PI-CO-NH combines with N
2H
4, its fluorescence color changes significantly, rapidly changing from red to blue. This noticeable color change provides a convenient and intuitive way to detect the presence of N
2H
4 in soil and water. This result proves that
PI-CO-NH can be used for rapid and sensitive detection of N
2H
4 in environmental samples.
3.8. Cell Imaging of PI-CO-NH
Based on the excellent response performance of
PI-CO-NH to N
2H
4 and SO
2 in vitro, we used HeLa cells as model cells to detect the response of
PI-CO-NH to N
2H
4 and SO
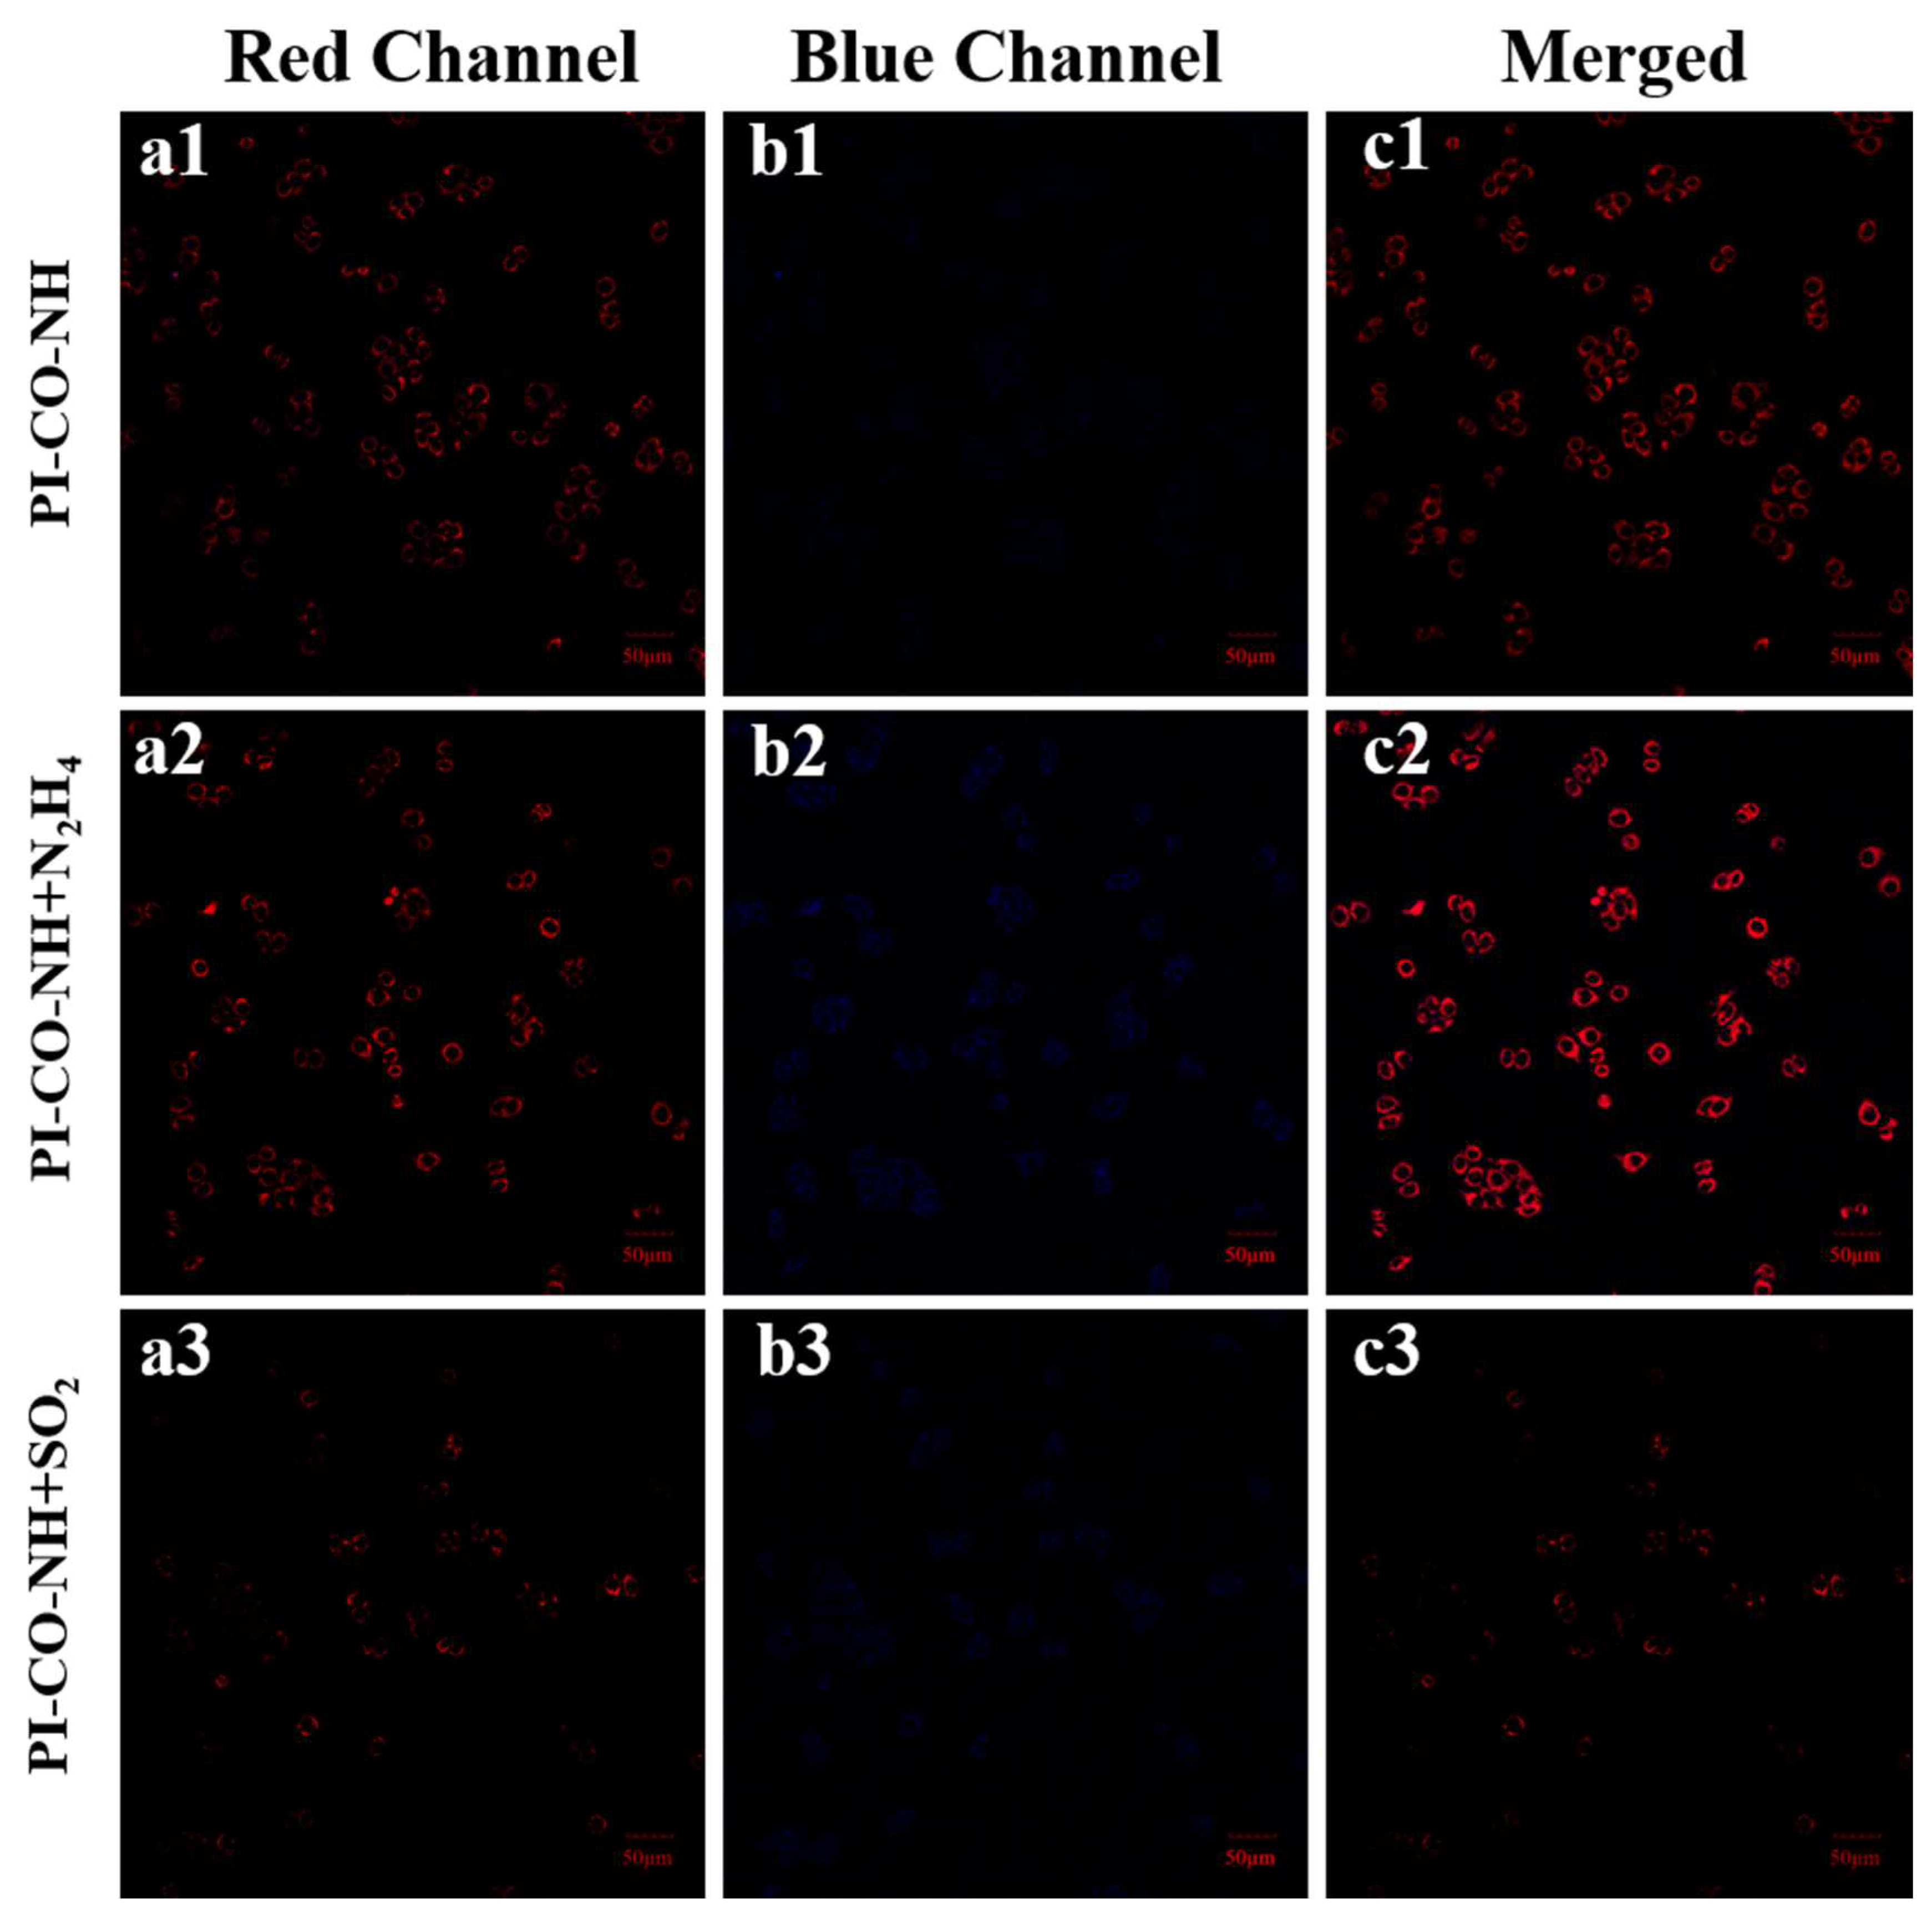
2 in living cells. As shown in
Figure 8, when HeLa cells were incubated with only 10 μM
PI-CO-NH at 37℃ for 15 min, weak blue fluorescence was observed. Cells treated with N
2H
4 and incubated with probes showed significantly enhanced fluorescence signals in blue and red channels (
Figure 8a2-b2). Cells treated with SO
2 and incubated with the probe showed a significantly reduced fluorescence signal in the red channel (
Figure 8a3-8c3). The results showed that
PI-CO-NH had good cell membrane permeability and could be used for the detection of N
2H
4 and SO
2 at cell level.
To further illustrate the recognition ability of
PI-CO-NH to N
2H
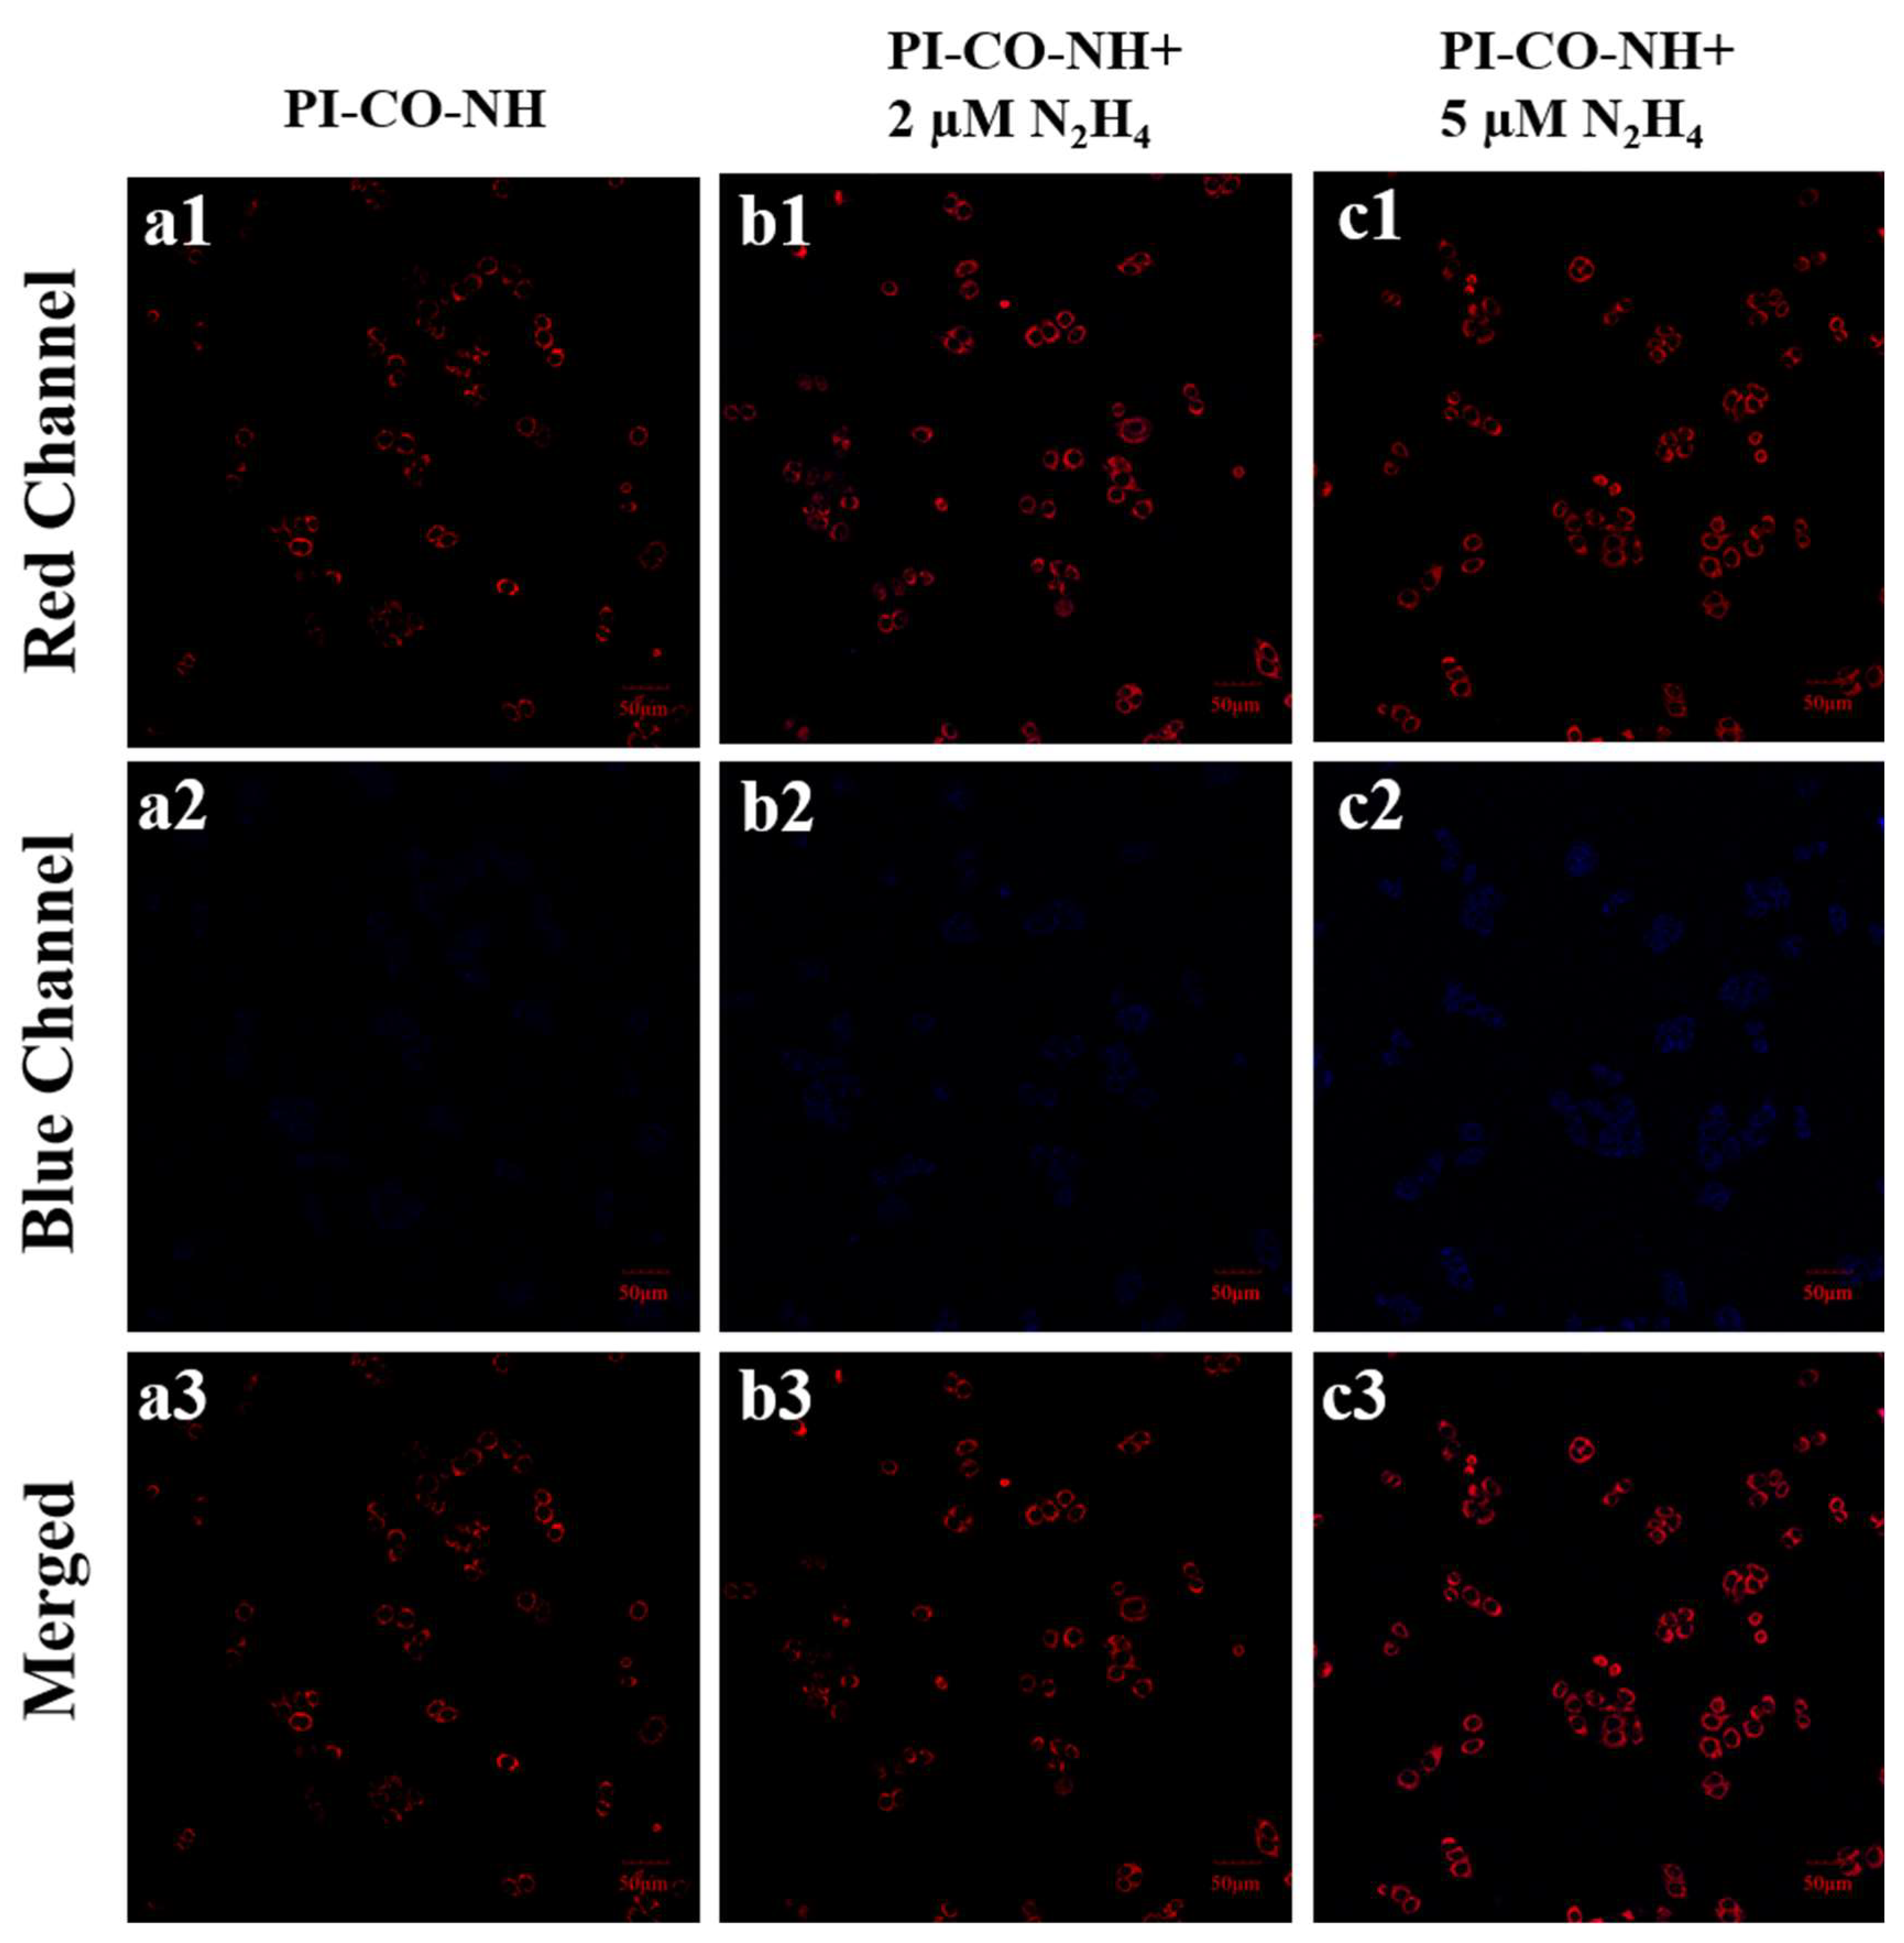
4, we measured the fluorescence changes of hydrazine at different concentrations (0 μM, 2 μM, 5 μM) during cell incubation. As shown in
Figure 9, with the increase of N
2H
4 concentration, the fluorescence of the blue channel is gradually enhanced. Therefore,
PI-CO-NH can detect different concentrations of N
2H
4 at the cellular level.
Given that N
2H
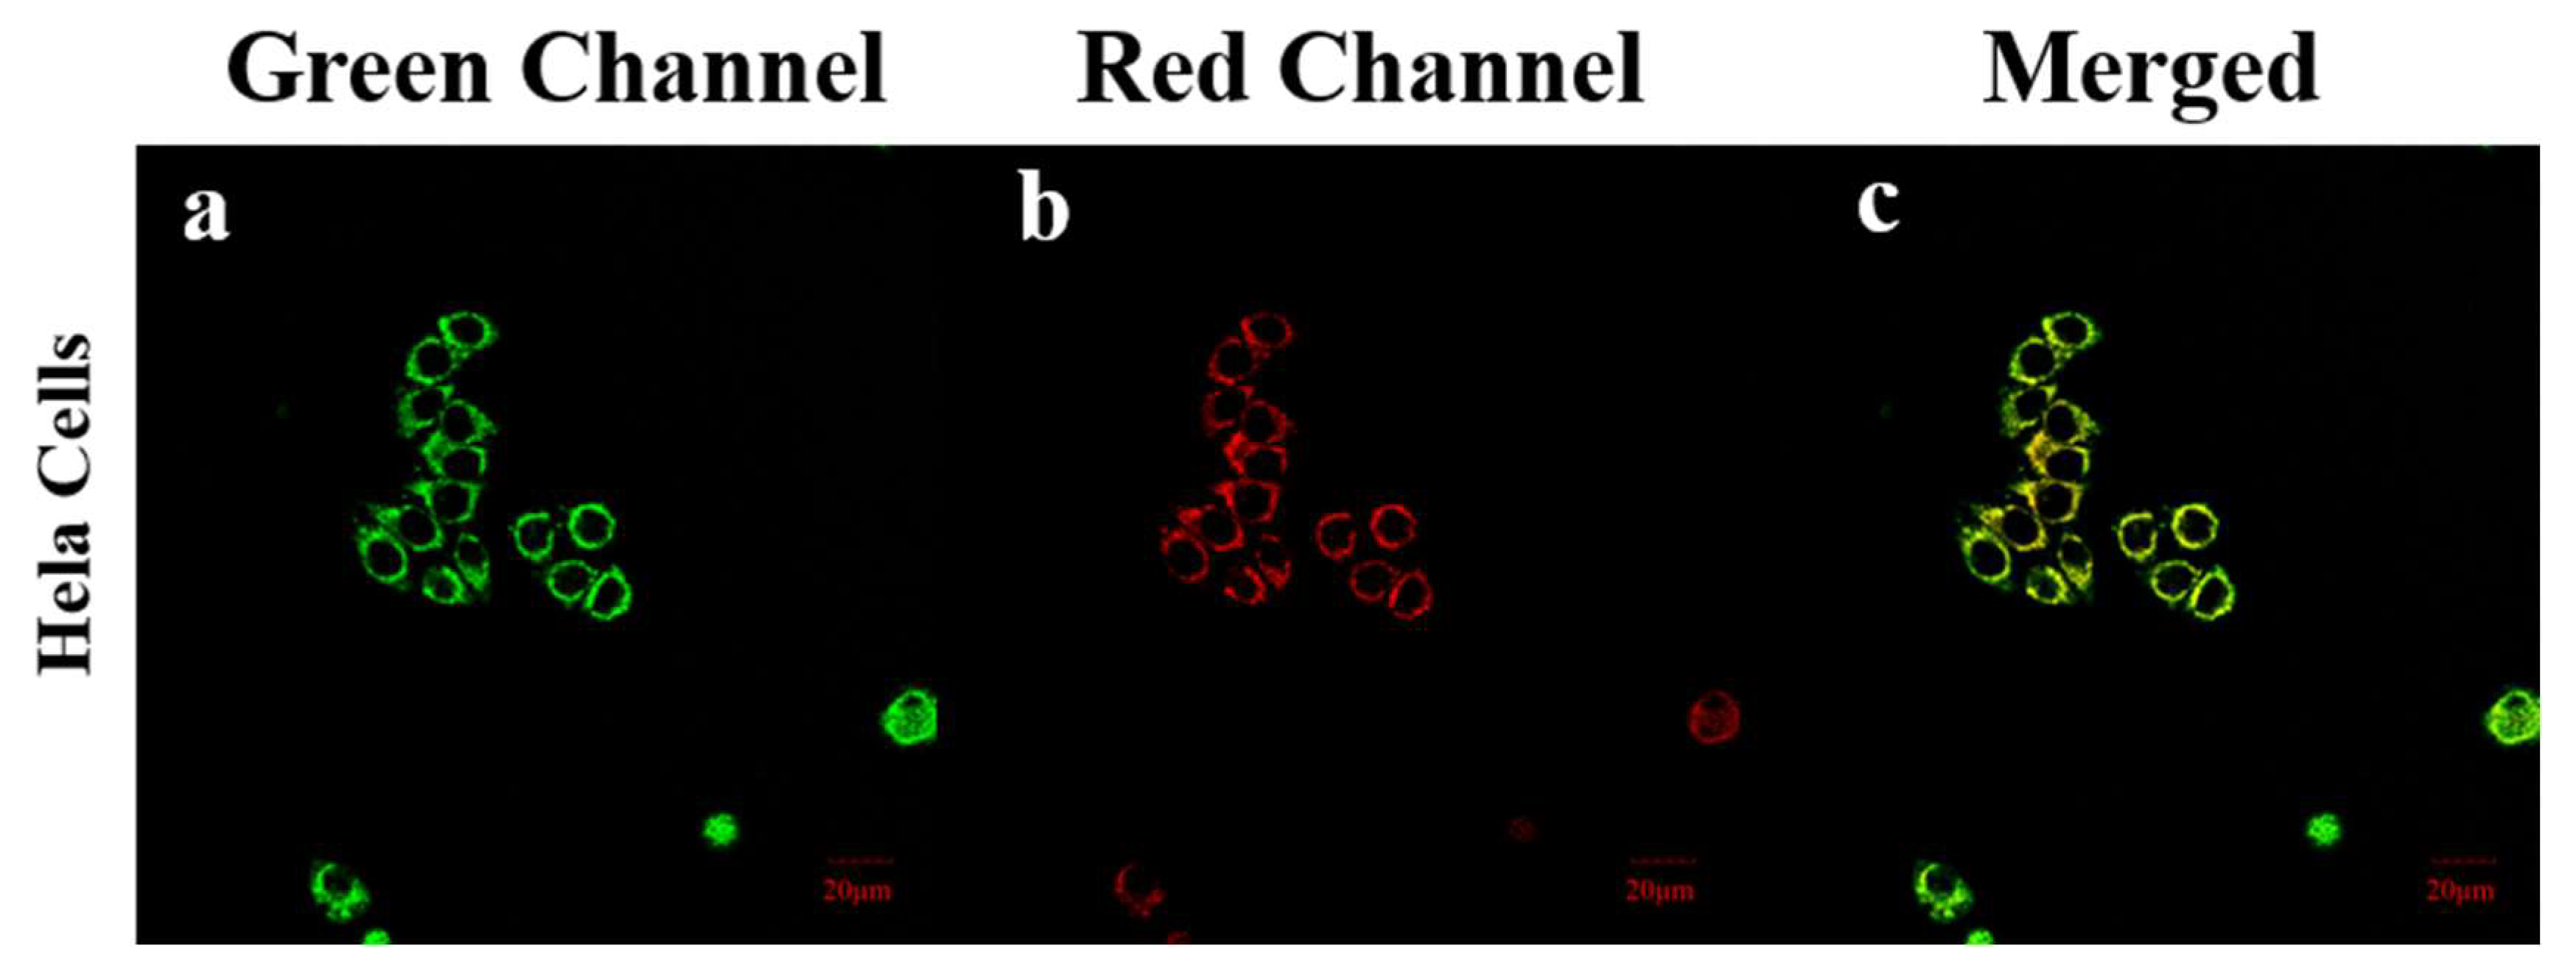
4 is toxic to mitochondria, we further explored its mitochondria-targeting ability to determine whether
PI-CO-NH has the potential to monitor mitochondrial toxicity of N
2H
4 (
Figure 10). HeLa cells pretreated with hydrazine were stained with commercially available mitochondrial green targeting reagent and
PI-CO-NH, respectively. The green fluorescence signal of Mito-tracker Green in HeLa cells basically coincided with the red fluorescence signal of
PI-CO-NH, and Pearson’s coefficient reached 0.87. The above results prove that
PI-CO-NH has good mitochondrial targeting property and can realize the imaging of both internal and external mitochondrial source hydrazine.
4. Conclusion
In summary, we have synthesized a novel dual-emission NIR fluorescent probe PI-CO-NH based on piperazine-substituted benzopyranone salts and coumarin carboxylic acids, which is a dual-function probe capable of detecting SO2 or N2H4. When detecting SO2 or N2H4, the probe exhibits rapid fluorescence changes with two different emission channels (447 nm and 633 nm) and shows resistance to interference through its independent fluorescence channel and FRET sensing mechanism. The experimental results show that the probe has high selectivity and sensitivity, excellent stability, low cytotoxicity and high cell permeability, can visualize N2H4 and SO2 in living cells, and has good mitochondrial targeting ability. More importantly, the ability of PI-CO-NH to detect N2H4 in different soil samples and test strips was successfully verified. These experiments not only validate the applicability of the probe in complex environment, but also provide a strong basis for the future application of PI-CO-NH in environmental pollution detection.
Supplementary Materials
The following supporting information can be downloaded at the website of this paper posted on Preprints.org.
Acknowledgements
This work was supported by Science and technology innovation project of higher education in Shanxi Province (2023L295) and the Natural Science Foundation of Shanxi Province (202303021222234) and the National Natural Science Foundation of China (No. 22277104).
References
- M. Wang, L. Cao, Z. Liu, et al., Sulfur dioxide-resistant platinum-based intermetallic nanocatalysts encaged by porous nitrogen-doped carbon for oxygen reduction reaction, Chemical Engineering Journal 492 (2024) 152-162. [CrossRef]
- M. Tizfahm, M. Tahmasebpoor, R.H. Behtash, et al., Coupled kinetic and hydrodynamic model for a carbonator reactor of calcium looping process: Sulfur dioxide effect, Process Safety and Environmental Protection 185 (2024) 1205-1218. [CrossRef]
- J.L. Hart, Role of sulfur-containing gaseous substances in the cardiovascular system, Frontiers in Bioscience Elite 3 (2011) 736-749. [CrossRef]
- J. Du, Y. Huang, K. Li, et al., Retina-derived endogenous sulfur dioxide might be a novel anti-apoptotic factor, Biochemical and Biophysical Research Communications 496 (2018) 955-960.
- Y. Huang, Z. Shen, Q. Chen, et al., Endogenous sulfur dioxide alleviates collagen remodeling via inhibiting TGF-β/Smad pathway in vascular smooth muscle cells, Scientific Reports 6 (2016) 19503. [CrossRef]
- S. Chen, Y. Huang, Z. Liu, et al., Sulphur dioxide suppresses inflammatory response by sulphenylating NF-κB p65 at Cys38 in a rat model of acute lung injury, Clinical Science 131(21) (2017) 2655-2670.
- Y.-H. Qin, X.-Y. Jiang, Y.-F. Que, J.-Y. Gu, T. Wu, A. Aihemaiti, K.-X. Shi, W.-Y. Kang, B.-Y. Hu, J.-S. Lan, et al., A Ratiometric and Colorimetric Hemicyanine Fluorescent Probe for Detection of SO2 Derivatives and Its Applications in Bioimaging, Molecules 24 (2019) 4011.
- Z. Meng, H. Zhang, The vasodilator effect and its mechanism of sulfur dioxide-derivatives on isolated aortic rings of rats, Inhalation Toxicology 19 (2007) 979-986. [CrossRef]
- Q. Chen, L. Zhang, S. Chen, et al., Downregulated endogenous sulfur dioxide/aspartate aminotransferase pathway is involved in angiotensin II-stimulated cardiomyocyte autophagy and myocardial hypertrophy in mice, International Journal of Cardiology 225 (2016) 392-401. [CrossRef]
- S.L. Taylor, N.A. Higley, R.K. Bush, Sulfites in foods: uses, analytical methods, residues, fate, exposure assessment, metabolism, toxicity, and hypersensitivity, Advances in Food Research 30 (1986) 1-76.
- R.F. McFeeters, Use and removal of sulfite by conversion to sulfate in the preservation of salt-free cucumbers, Journal of Food Protection 61 (1998) 885-890. [CrossRef]
- D.F. Splittstoesser, L.R. Mattic, The storage life of refrigerated grape juice containing various levels of sulfur dioxide, American Journal of Enology and Viticulture 32 (1981) 171-173. [CrossRef]
- X. Sheng, X. Sun, Y. Zhang, C. Zhang, S. Liu, S. Wang, A Ratiometric Fluorescent Probe for N2H4 Having a Large Detection Range Based upon Coumarin with Multiple Applications, Molecules 28 (2023) 7629. [CrossRef]
- J. Wu, J. Pan, Z. Ye, et al., A smart fluorescent probe for discriminative detection of hydrazine and bisulfite from different emission channels, Sensors and Actuators: B. Chemical 2 (2018) 4274-4284. [CrossRef]
- S.G. Hua, Z.G. Qian, C.W. Yun, et al., An ultrasensitive fluorescent probe for hydrazine detection and its application in water samples and living cells, Tetrahedron 18 (2019) 2642-2646.
- J. Du, X. Li, S. Ruan, et al., Rational design of a novel turn-on fluorescent probe for the detection and bioimaging of hydrazine with barbituric acid as a recognition group, Analyst 2 (2019) 636-642. [CrossRef]
- M. Du, Y. Zhang, Z. Xu, Z. Dong, S. Zhao, H. Du, H. Zhao, Point-of-Care and Dual-Response Detection of Hydrazine/Hypochlorite-Based on a Smart Hydrogel Sensor and Applications in Information Security and Bioimaging, Molecules 28 (2023) 3896-3960. [CrossRef]
- A. Serov, M. Padilla, A.J. Roy, P. Atanassov, T. Sakamoto, K. Asazawa, H. Tanaka, Anode catalysts for direct hydrazine fuel cells: from laboratory test to an electric vehicle, Angew Chem. Int. Ed. Engl. 53 (39) (2014) 10336–10340. [CrossRef]
- N. Nobari, M. Behboudnia, R. Maleki, Palladium-free electroless deposition of pure copper film on glass substrate using hydrazine as reducing agent, Appl. Surf. Sci. 385 (2016) 9–17. [CrossRef]
- L. Yi, G.D. Yao, Z. Heng, B.B. Jin, Rapid catalytic reduction of NaHCO3 into formic acid and methane with hydrazine over Raney Ni catalyst, Catal. Today 298 (2017) 124–129.
- Z. Chen, X.X. Zhong, W.B. Qu, T. Shi, H. Liu, H.P. He, X.H. Zhang, S.F. Wang, A highly selective HBT-based “turn-on” fluorescent probe for hydrazine detection and its application, Tetrahedron Lett. 58 (26) (2017) 2596–2601. [CrossRef]
- Y.B. Ding, S. Zhao, Q.Q. Wang, X. Yu, W.H. Zhang, Construction of a coumarin based fluorescent sensing platform for palladium and hydrazine detection, Sensor Actuat B Chem. 256 (2018) 1107–1113. [CrossRef]
- S. Mu, H. Gao, C. Li, S. Li, Y. Wang, Y. Zhang, C. Ma, H. Zhang, X. Liu, A dualresponse fluorescent probe for detection and bioimaging of hydrazine and cyanide with different fluorescence signals, Talanta 221 (2021) 121606–121614. [CrossRef]
- M. Zhu, Z. Zhao, Y. Huang, F. Fan, F. Wang, W. Li, X. Wu, R. Hua, Y. Wang, Hydrazine exposure: a near-infrared ICT-based fluorescent probe and its application in bioimaging and sewage analysis, Sci. Total Environ. 759 (2021) 143102–143111. [CrossRef]
- C.S. Patil, D.B. Gunjal, V.M. Naik, N.S. Harale, S.D. Jagadale, A.N. Kadam, P. S. Patil, G.B. Kolekar, A.H. Gore, Waste tea residue as a low cost adsorbent for removal of hydralazine hydrochloride pharmaceutical pollutant from aqueous media: an environmental remediation, J. Clean. Prod. 206 (2019) 407–418. [CrossRef]
- S. Garrod, M.E. Bollard, A.W. Nicholls, S.C. Connor, J. Connelly, J.K. Nicholson, E. Holmes, Integrated metabonomic analysis of the multiorgan effects of hydrazine toxicity in the Rat, Chem. Res. Toxicol. 18 (2) (2005) 115–122. [CrossRef]
- J.K. Niemeier, D.P. Kjell, Hydrazine and aqueous hydrazine solutions: evaluating safety in chemical processes, Org. Process Res. Dev. 17 (12) (2013) 1580–1590. [CrossRef]
- J.H. Ma, J.L. Fan, H.D. Li, Q.C. Yao, J. Xia, J.Y. Wang, X.J. Peng, Probing hydrazine with a near-infrared fluorescent chemodosimeter, Dyes Pigments 138 (2017) 39–46. [CrossRef]
- A.A. Ensafi, B.J. Naderi, Flow-injection spectrophotometric determination of hydrazine, Microchem. J. 56 (3) (1997) 269–275. [CrossRef]
- H. Singh, K. Tiwari, R. Tiwari, S.K. Pramanik, A. Das, Small molecule as fluorescent probes for monitoring intracellular enzymatic transformations, Chem. Rev. 119 (22) (2019) 11718–11760. [CrossRef]
- X.-Y. Zhang, Y.-S. Yang, W. Wang, Q.-C. Jiao, H.-L. Zhu, Fluorescent sensors for the detection of hydrazine in environmental and biological systems: recent advances and future prospects, Coord. Chem. Rev. 417 (2020), 213367. [CrossRef]
- X. Chen, K.-A. Lee, X. Ren, J.-C. Ryu, G. Kim, J.-H. Ryu, W.-J. Lee, J. Yoon, Synthesis of a highly HOCl-selective fluorescent probe and its use for imaging HOCl in cells and organisms, Nat. Protoc. 11 (7) (2016) 1219–1228. [CrossRef]
- X. Shi, F. Huo, J. Chao, C. Yin, A ratiometric fluorescent probe for hydrazine based on novel cyclization mechanism and its application in living cells, Sens. Actuators B Chem. 260 (2018) 609–616. [CrossRef]
- X. Kong, B. Dong, C. Wang, N. Zhang, W. Song, W. Lin, A novel mitochondriatargeted fluorescent probe for imaging hydrazine in living cells, tissues and animals, J. Photochem. Photobiol. A: Chem. 356 (2018) 321–328.
- S. Yu, S. Wang, H. Yu, Y. Feng, S. Zhang, M. Zhu, H. Yin, X. Meng, A ratiometric two-photon fluorescent probe for hydrazine and its applications, Sens. Actuators B Chem. 220 (2015) 1338–1345. [CrossRef]
- S. Wang, S. Ma, J. Zhang, M. She, P. Liu, S. Zhang, J. Li, A highly sensitive and selective near-infrared fluorescent probe for imaging hydrazine in living tissues and mice, Sens. Actuators B Chem. 261 (2018) 418–424. [CrossRef]
- B. Wang, R. Yang, W. Zhao, Construction of a mitochondria-targeted ratiometric fluorescent probe for monitoring hydrazine in soil samples and culture cells, J. Hazard. Mater. 406 (2021), 124589. [CrossRef]
- Z. Wang, Y. Zhang, Z. Meng, M. Li, C. Zhang, L. Yang, Y. Yang, X. Xu, S. Wang, Development of a ratiometric fluorescent probe with large Stokes shift and emission wavelength shift for real-time tracking of hydrazine and its multiple applications in environmental analysis and biological imaging, J. Hazard. Mater. 422 (2022),126891. [CrossRef]
- M. Oguz, S. Erdemir, S. Malkondu, An effective benzothiazole-indandione D-π-A fluorescent sensor for “ratiometric” detection of hydrazine: its solvatochromism properties and applications in environmental samples and living cells, Anal. Chim. Acta 1227 (2022), 340320. [CrossRef]
- S. Erdemir, M. Oguz, S. Malkondu, Real-time screening of hydrazine by a NIR fluorescent probe with low cytotoxicity in living cells and its multiple applications: optimization using Box-Behnken Design, Sens. Actuators B Chem. 364 (2022), 131893. [CrossRef]
- W. J. Cheng, Y. T. Xie, Z. Y. Yang, Y. Q. Sun, M. Z. Zhang, Y. B. Ding, W. H. Zhang, Anal. Chem. 91 (2019) 5817–5823.
- W. J. Zhang, F. J. Huo, F. Q. Cheng, C. X. Yin, J. Am. Chem. So.c 142 (2020) 6324–6331.
Scheme 2.
The synthesis of the probe PI-CO-NH.
Scheme 2.
The synthesis of the probe PI-CO-NH.
Figure 1.
UV-Vis absorption spectra of PI-CO-NH towards N2H4 and SO2 in the HEPES buffer (pH 7.4, containing 30% CH3OH, v/v).
Figure 1.
UV-Vis absorption spectra of PI-CO-NH towards N2H4 and SO2 in the HEPES buffer (pH 7.4, containing 30% CH3OH, v/v).
Figure 2.
Fluorescence spectra of PI-CO-NH (10 mM) with (A-B) N2H4 (0-5.83 µM) (C-D) SO2 (0-290 µM) in the HEPES buffer (pH 7.4, containing 30% CH3OH, v/v). A, C: λex=420 nm, Ex/Em slit: 5/5 nm; B, D: λex=580 nm, Ex/Em slit: 5/5 nm.
Figure 2.
Fluorescence spectra of PI-CO-NH (10 mM) with (A-B) N2H4 (0-5.83 µM) (C-D) SO2 (0-290 µM) in the HEPES buffer (pH 7.4, containing 30% CH3OH, v/v). A, C: λex=420 nm, Ex/Em slit: 5/5 nm; B, D: λex=580 nm, Ex/Em slit: 5/5 nm.
Figure 3.
Plot of the fluorescence intensity of PI-CO-NH as a function of the N2H4 and SO2 concentration.
Figure 3.
Plot of the fluorescence intensity of PI-CO-NH as a function of the N2H4 and SO2 concentration.
Figure 5.
The fluorescence intensity of PI-CO-NH with N2H4, SO2 and other amino acids (10 equiv, NO3-; I-; SO32-; S2O32-; Br-; Cl-; F-; NO2-; CH3COO-; OH-; .O2; ONOO- ; Cys; Glycine; GSH; H2O2; Hcy; L-Cystine; L-Glutamate; L-Lysine ; L-Proline; SO42-; SNP; K+; Na+; Mg2+; Ca2+) in the HEPES buffer (pH 7.4, containing 30% CH3OH, v/v) at 445 nm.
Figure 6.
Time response of probe PI-CO-NH with N2H4 and SO2.
Figure 6.
Time response of probe PI-CO-NH with N2H4 and SO2.
Figure 7.
Fluorescence detection of PI-CO-NH reaction with N2H4 on different soil and test strips.
Figure 7.
Fluorescence detection of PI-CO-NH reaction with N2H4 on different soil and test strips.
Figure 8.
Imaging of hydrazine in HeLa cells. (a1-c1) HeLa cells incubated with PI-CO-NH; (a2-c2) HeLa cells incubated with PI-CO-NH and further incubated with N2H4. (a3-c3) HeLa cells incubated with PI-CO-NH and further incubated with SO2. Blue channel: λex = 405 nm, λem = 490–550 nm; red channel: λex = 561 nm, λem = 610–670 nm.
Figure 9.
Imaging of N2H4 in HeLa cells. (a1-c1) HeLa cells incubated with PI-CO-NH (10 μM); (a2-c4) HeLa cells incubated with PI-CO-NH and further incubated with N2H4 (2 μM, 5 μM). Blue channel: λex = 405 nm, λem = 490–550 nm; red channel: λex = 561 nm, λem = 610–670 nm.
Figure 9.
Imaging of N2H4 in HeLa cells. (a1-c1) HeLa cells incubated with PI-CO-NH (10 μM); (a2-c4) HeLa cells incubated with PI-CO-NH and further incubated with N2H4 (2 μM, 5 μM). Blue channel: λex = 405 nm, λem = 490–550 nm; red channel: λex = 561 nm, λem = 610–670 nm.
Figure 10.
The colocalization fluorescence imaging of HeLa cells co-treated with (a) PI-CO-NH (10 μM) and (b) Mito-Tracker Green (500 μM). (c) The merge of the red and green channels. Scale bar: 20 μM. Blue channel: λex = 488 nm, λem = 486-546 nm; Red channel: λex = 561 nm, λem = 700-760 nm.
Figure 10.
The colocalization fluorescence imaging of HeLa cells co-treated with (a) PI-CO-NH (10 μM) and (b) Mito-Tracker Green (500 μM). (c) The merge of the red and green channels. Scale bar: 20 μM. Blue channel: λex = 488 nm, λem = 486-546 nm; Red channel: λex = 561 nm, λem = 700-760 nm.
|
Disclaimer/Publisher’s Note: The statements, opinions and data contained in all publications are solely those of the individual author(s) and contributor(s) and not of MDPI and/or the editor(s). MDPI and/or the editor(s) disclaim responsibility for any injury to people or property resulting from any ideas, methods, instructions or products referred to in the content. |
© 2024 by the authors. Licensee MDPI, Basel, Switzerland. This article is an open access article distributed under the terms and conditions of the Creative Commons Attribution (CC BY) license (http://creativecommons.org/licenses/by/4.0/).

