1. Introduction
Breast cancer remains one of the most prevalent and concerning diseases affecting women worldwide. Due to its complex nature and significant impact on public health, extensive research efforts are dedicated to understanding, treating, and ultimately eradicating this disease. Breast cancer consists of various subtypes, one of which is triple-negative breast cancer (TNBC). TNBC lacks receptors for the hormone estrogen (ER-negative), progesterone (PR-negative), and human epidermal growth factor receptor 2 (HER2/neu-negative). Consequently, TNBC does not respond to hormonal or targeted therapies. In addition to TNBC, other invasive breast cancers that express estrogen or progesterone receptors are classified as basal-like or luminal-like cancers. Approximately 20% of breast cancer diagnoses are TNBC [
1,
2].
Several characteristics make TNBC particularly challenging to treat. Firstly, TNBC often grows rapidly and undergoes metastasis, the process by which cancer cells spread from their primary site to distant parts of the body. Metastasis is considered the most life-threatening aspect of cancer, responsible for approximately 90% of cancer-related deaths in humans [
3]. Secondly, TNBC can easily become resistant through the activation of mutated pathways, making it difficult to treat. Consequently, oncologists often use high doses of anti-cancer agents from multiple drug classes to prevent and treat metastasis and resistance. Thirdly, TNBC has a high recurrence rate within the first three years of therapy,with a five-year survival rate of 65% as compared to 86% for all breast cancers [
2,
3].
Because TNBC doesn’t respond to hormonal or targeted therapies, treatment options are limited to traditional anti-cancer drugs, which often cause unfavorable adverse effects such as nausea, vomiting, bone marrow toxicity, cardiac arrest, renal failure, and infertility [
4]. Therefore, several attempts have been made to find different compounds to alleviate this problem.
Vitamin C (ascorbic acid or ascorbate, VC) has been known for treating and preventing scurvy and the common cold since 1928 [
5]. In the 1970s, several studies suggested the benefit of high-dose VC in improving advanced cancer survival [
6]. However, controversial clinical results between Linus Pauling, a Nobel Prize recipient in Chemistry, and the Mayo Clinic at that time, led to the dismissal of VC as a promising anti-cancer agent. In recent times, new knowledge has re-emerged, prompting investigations into the mechanism of action of VC as a possible anti-cancer agent [
7,
8,
9,
10].
A pharmacological dose of VC refers to as a high dose VC that is significantly greater than the recommended daily allowance (RDA) which typically consumed through diet and standard supplementation. These doses are often administered intravenously (IV) rather than orally to achieve higher plasma concentrations that are thought to have therapeutic effects in cancer treatment. Oral intake of VC is limited by intestinal absorption, which can only achieve plasma concentrations up to about 250 micromolar. In contrast, IV administration can achieve plasma concentrations in the millimolar range often used in the range from 10 grams to 100 grams per infusion. At high concentrations, VC can act as a pro-oxidant rather than an antioxidant. This effect generates hydrogen peroxide and other reactive oxygen species (ROS) that can damage cancer cells more than normal cells. Pharmacological doses of VC are generally well-tolerated, with potential side effects include gastrointestinal discomfort, kidney stones (particularly in individuals with a history of kidney stones), or rare complications related to IV administration [
11].
The MDA-MB-231 cell line, derived from a pleural effusion of a patient with invasive ductal carcinoma, is frequently utilized to investigate advanced stages of breast cancer. The cells are characterized as ER-negative and PR-negative. Microarray profiling indicates that the MDA-MB-231 cell genome aligns with the basal subtype of breast cancer. It is also lack HER2/neu, making it an effective model for TNBC. These cells are commonly used to study metastasis, tumor progression, and drug resistance mechanisms in breast cancer [
12,
13].
The aim of this study was to determine the pharmacological dose of Vitamin C (VC) required to induce cell death in MDA-MB-231 cells and to elucidate the molecular pathways involved in the process in triple-negative breast cancer (TNBC) cells. Additionally, the effects of VC were evaluated in MCF cells, which are estrogen and progesterone receptor-positive, HER2/neu receptor-negative, and considered a less invasive form of breast cancer. The study also examined the impact of VC on non-cancerous lung fibroblasts CCL205 cells, kidney HEK293 cells, and rat spleen to assess the specificity of its cytotoxic effects on cancerous versus non-cancerous cells.
2. Materials and Methods
2.1. Cell Culture, Media and Rat
MDA-MB-231 human breast adenocarcinoma cell lines (ATCC, HTB-26) were cultured to investigate the cytotoxic effects of Vitamin C on triple-negative breast cancer. These cells were grown in Dulbecco’s Modified Eagle’s Medium (DMEM) containing 4 mM L-glutamine, 4500 mg/L glucose, 1 mM sodium pyruvate, 1500 mg/L sodium bicarbonate (ATCC), and supplemented with 10% fetal bovine serum (FBS, ATCC) and 1% penicillin/streptomycin (100 U/ml penicillin, 200 µg/ml streptomycin) (Sigma Aldrich). They were maintained at 37ºC in a humidified atmosphere of 5% CO2.
To compare Vitamin C’s effects on different breast cancer subtypes, MCF-7 cells (ATCC, HTB 22), which represent estrogen and progesterone receptor-positive, HER2/neu-negative breast cancer, were cultured in Eagle’s Minimum Essential Medium (EMEM) under similar conditions with identical FBS and penicillin/streptomycin supplementation.
For non-cancerous controls, human epithelial kidney (HEK 293, ATCC CRL-11268) and lung fibroblast (ATCC, CCL 205) cell lines were cultured in DMEM and EMEM, respectively, following the same conditions. Most of the cell passages ranged between 5 to 12.
Additionally, rat spleen cells, provided by Dr. W. Thierfeldler from Union University’s Biology Department, were prepared for cell viability assays to further evaluate the selectivity of VC’s cytotoxic effects.
2.2. Cell Viability Assay
Cell viability was assessed using the MTT (3-[4,5-dimethylthiazol-2-yl]-2,5-diphenyl-tetrazolium bromide) method as previously described to determine the concentration of VC that kills about 20% of cells or 50% of cells (IC50) [
13]. Cells were detached with trypsin/EDTA, diluted to a concentration of 1x10^5 cells/ml in culture medium, and 100 µl of the cell suspension was plated into each well of a 96-well plate (Greiner-Bio One). Following overnight incubation at 37°C in 5% CO
2, the medium was replaced with neutralized ascorbate at concentrations range from 0.25 mM to 125 mM and further incubated for 24 hr at 37°C. Subsequently, the medium was aspirated, wells were rinsed with 100 µl of DPBS, and 50 µl of MTT solution was added for a 4-hour incubation. Cells were then lysed with 150 µl of DMSO, and absorbance was measured at 570 nm using a spectrophotometer (Molecular Devices, CA, USA). In addition to MDA-MB-231 cells, the assay was also conducted on MCF7 and rat spleen cells.
2.3. Morphology Analysis
The morphological changes of MDA-MB-231 cells treated with VC for 0 and 24 hours were documented using an inverted microscope with 40X capacity (Motic AE31, Hongkong), following established protocols [
14,
15]. Besides MDA-MB-231, assay also was performed on MCF7, HEK 293, and CCL 205 cell lines.
2.4. Wound-Healing Assay
To evaluate if VC affects cellular migration, MDA-MB-231 cells were cultured at a density of 1x10^5 cells in a 12-well dish for 24 hr. Subsequently, a scratch was created using a sterile pipette tip, and the area of migration was captured using an inverted microscope (40X). The width of the scratch was quantitatively analyzed at 0- and 24-hr post-scratch, following established methodologies [
14,
15]. Besides MDA-MB-231, assay was also performed on MCF7, HEK 293, and CCL 205 cell lines.
2.5. Apoptosis Assay
To examine nuclear chromatin morphological alterations in MDA-MB-231 cells after VC treatment, the NucBlue™ Live Cell Hoechst 33342 staining assay was conducted according to established protocols [
14,
15]. The quantity of apoptotic and non-apoptotic cells was recorded using the Floid Cell Imaging Station (Life Technologies, USA), and fluorescence intensities were assessed using Image J software (NIH, USA). A histogram was constructed to compare the percentage changes in apoptotic cells across the treatment groups. Besides MDA-MB-231, assay was also performed on MCF7, HEK 293, and CCL 205 cells.
2.6 Mitochondrial Membrane Potential (ѱm) Assay
To identify if there were changed in mitochondrial membrane potential, cells were stained with Rhodamine 123 fluorescence probe as previously described [
14,
15]. The relative intensities of green fluorescence were captured using FLoid cell imaging. A histogram was prepared to compare the quantities of fluorescence using Image J software. Besides MDA-MB-231, assay was also performed on MCF7, HEK 293, and CCL 205 cells.
2.7. Intracellular ROS Assay
To examine if intracellular reactive oxygen species (ROS) were generated in MDA-MB-231 cells after VC treatment, H
2DCF-DA staining assay was performed following the manufacturer protocol as previously reported [
14,
15]. The relative intensities were captured using Floid cell imaging station. A histogram was prepared to compare the quantities fluorescence using Image J software. Besides MDA-MB-231, assay was also performed on MCF7, HEK 293, and CCL 205 cells.
2.8. Live and Death Cells Assay
To assess whether the deoxynucleic acid (DNA) of MDA-MB-231 cells was altered following VC treatment, a Nuclear-ID Red/Green cell viability assay was performed according to the manufacturer's protocol, as previously described [
14]. The simultaneous use of red and green dyes allows for the determination of live and dead cells, which were captured using Floid cell imaging. A histogram was prepared to compare the quantities of live and dead cells using Image J software. Besides MDA-MB-231, assay was also performed on MCF7, HEK 293, and CCL 205 cells
2.9. Western Blot Analysis
Western blot analysis was performed to determine changes in the level of proteins of interest after treatment of MDA-MB-231 cells with VC, as previously described [
14,
15]. Briefly, RIPA buffer supplemented with protease and phosphatase inhibitors was used to extract proteins from cells followed by measurement of proteins concentrations with Bradford protein assay per manufacture protocol. Equivalent amounts of proteins 50 μg was loaded onto 10% polyacrylamide gels followed by electrophoresis. The gel was then transferred unto Immuno- Blot PVDF membranes using Trans Blot Turbo (Bio-Rad Laboratories) for 30 minutes. The membranes were then blocked for 2 hr with 5% dry milk dissolved in Tris-buffered saline containing 0.1% Tween-20 (TBST) at room temperature. Finally, the membranes were incubated overnight with specific primary antibodies. The following day, the membranes were then washed several times in TBST, followed by incubation for 2 hr with secondary antibodies. The protein bands were developed using ECL Western Blotting detection reagents and the band pictures were taken using Bio-Rad ChemiDoc XRS
+ Imaging system. Besides MDA-MB-231, assay was also performed on MCF7.
2.10. Statistical Analysis
All the statistical results were expressed as the mean ± SD of three independent sets of experiments. Differences between individual and combination treatment groups were analyzed using Newman-Keuls one-way ANOVA. * P < 0.05, ** P < 0.01 and *** P < 0.001 were considered statistically significant.
3. Results
3.1. Cell Viability Assay
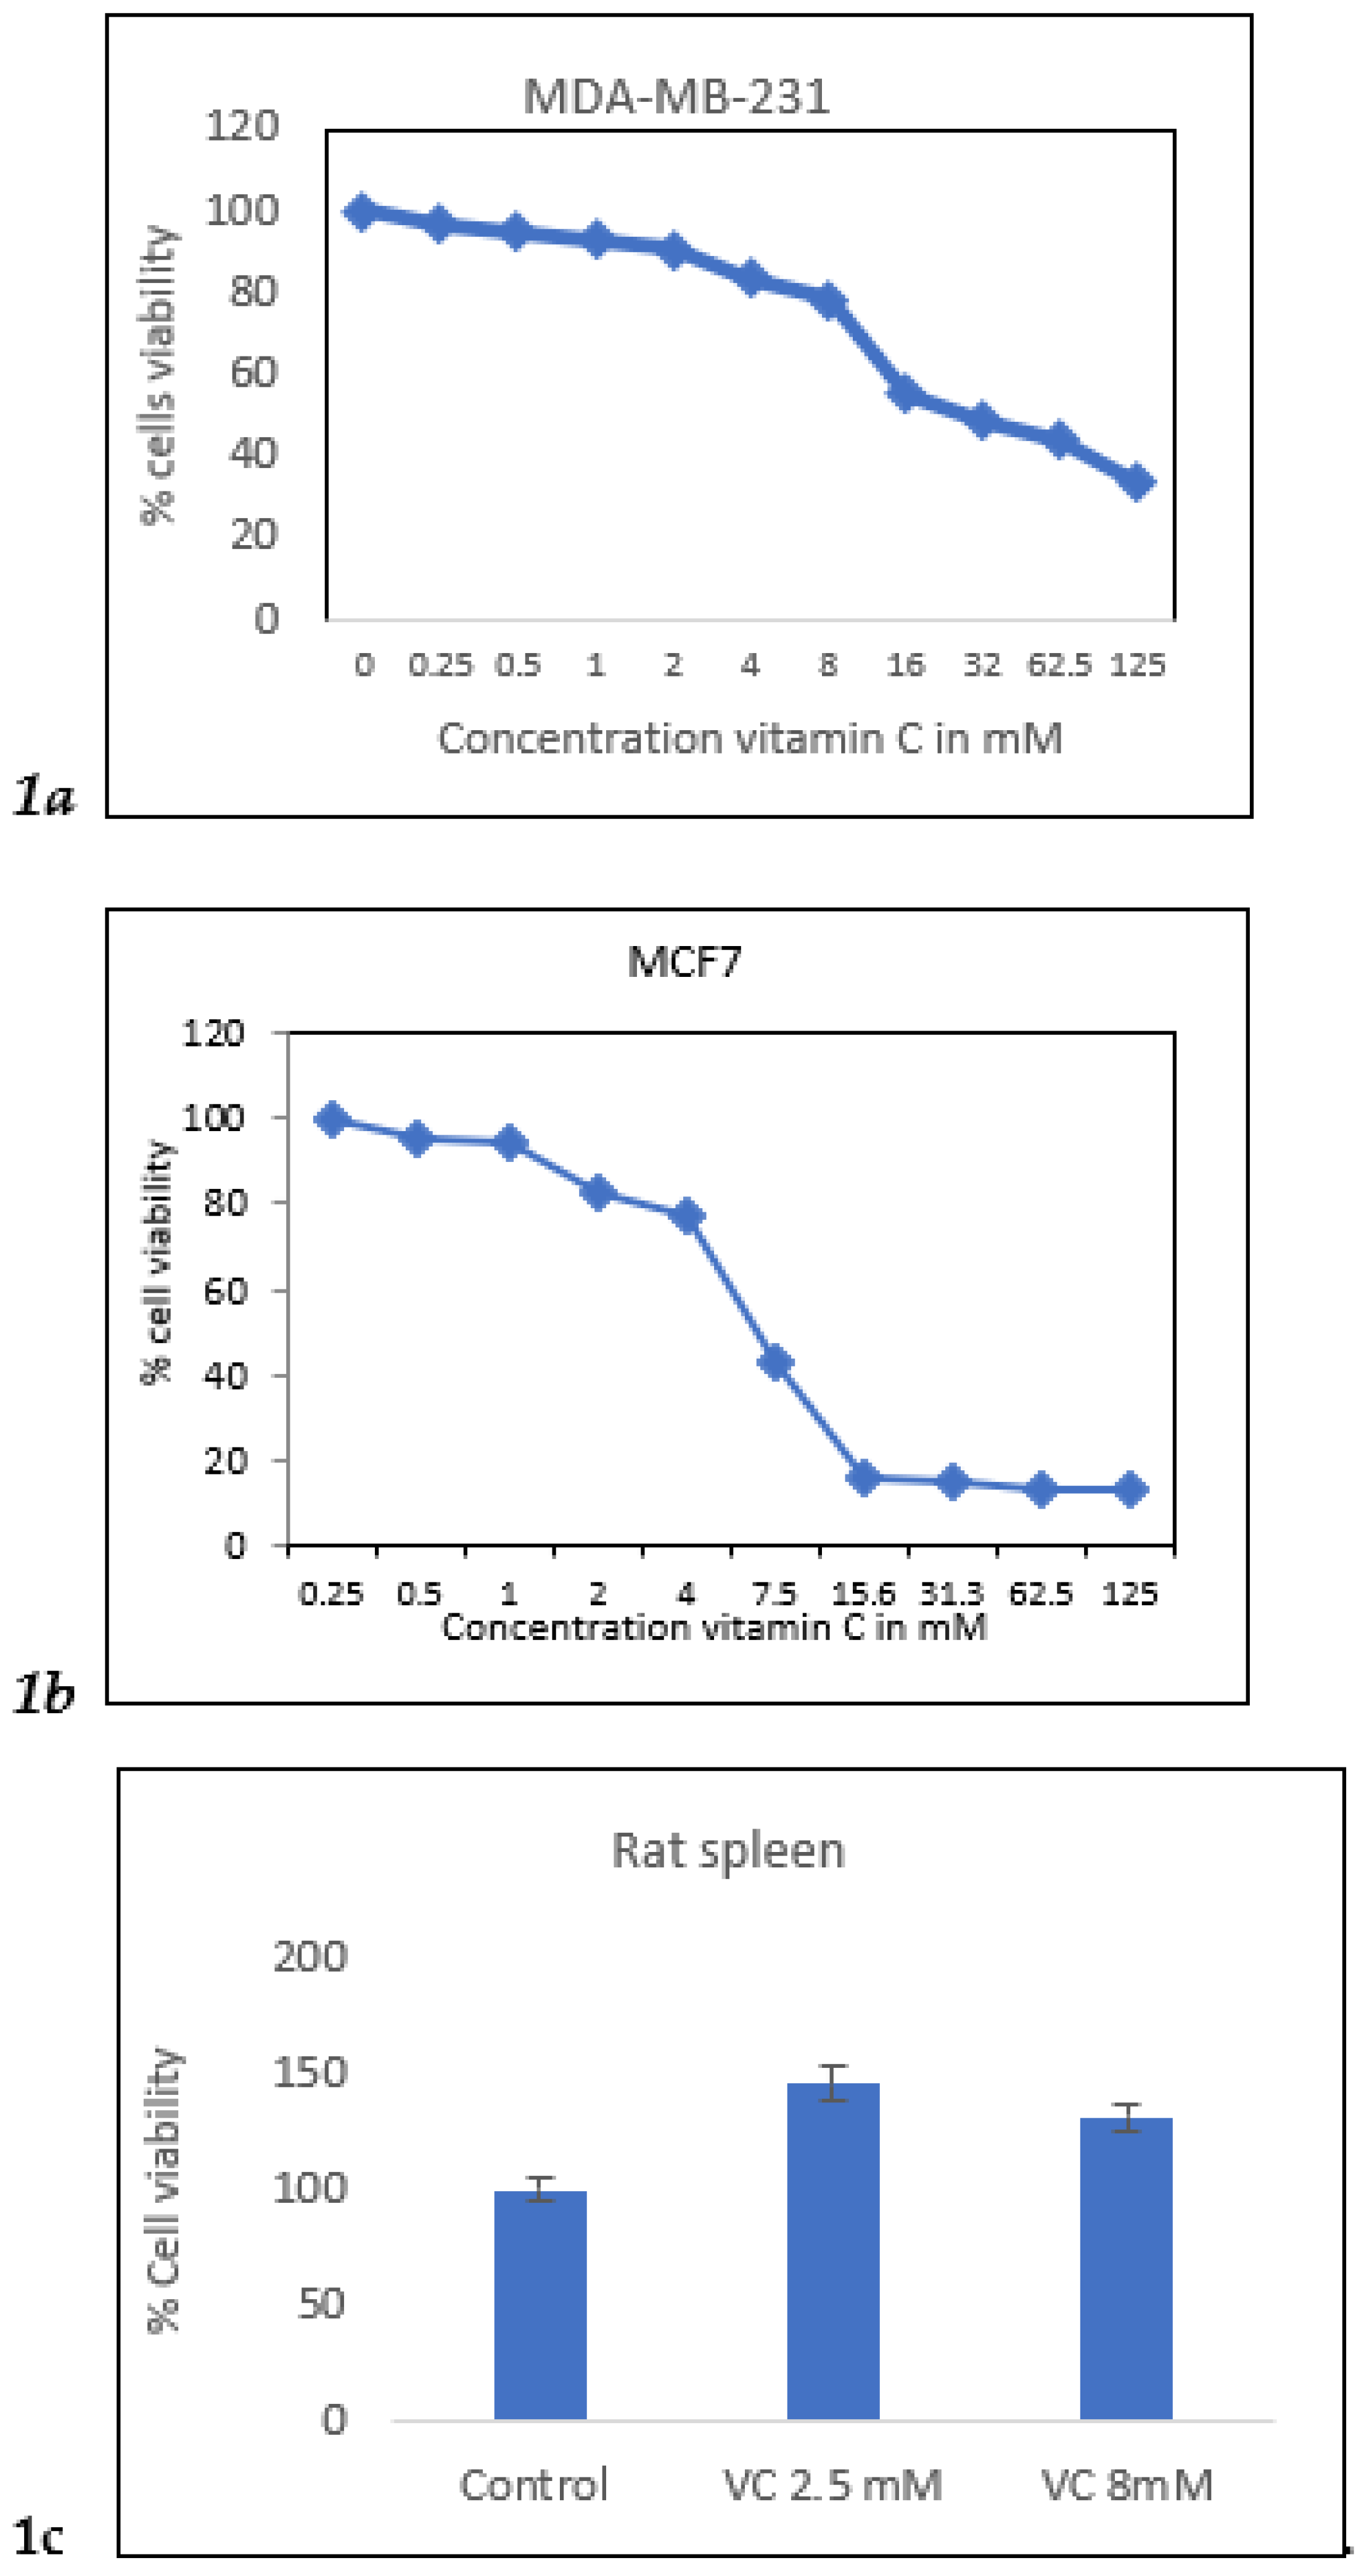
Cell viability of MDA-MB-231 cells was assessed using the MTT assay with VC concentrations ranging from 0.25 mM to 125 mM. The concentration that resulted in approximately 20% and 50% cell death (IC50) was determined. VC at 8 mM reduced cells viability by 20%, while 16 mM caused 50% cell death in MDA-MB-231 cells. In MCF7 cells, the concentrations that killed 20% and 50% of the cells were 4 mM and 7 mM, respectively. In contrast, an increase in viability was observed in rat spleen cells treated with 5 mM and 15 mM VC, indicating that VC did not cause cell death in normal cells such as spleen.
Figure 1.
a. MTT result of cell viability MDA-MB-231 cells treated with VC from 0-125 mM.
Figure 1b showed MCF7 cells treated with VC from 0-125 mM. Fig.1c showed rat spleen had higher % cell viability with treatment of VC at 2.5 mM and 8 mM showing non-cytotoxic effect of VC on normal cells.
Figure 1.
a. MTT result of cell viability MDA-MB-231 cells treated with VC from 0-125 mM.
Figure 1b showed MCF7 cells treated with VC from 0-125 mM. Fig.1c showed rat spleen had higher % cell viability with treatment of VC at 2.5 mM and 8 mM showing non-cytotoxic effect of VC on normal cells.
3.2. Changed in Cell Morphologies
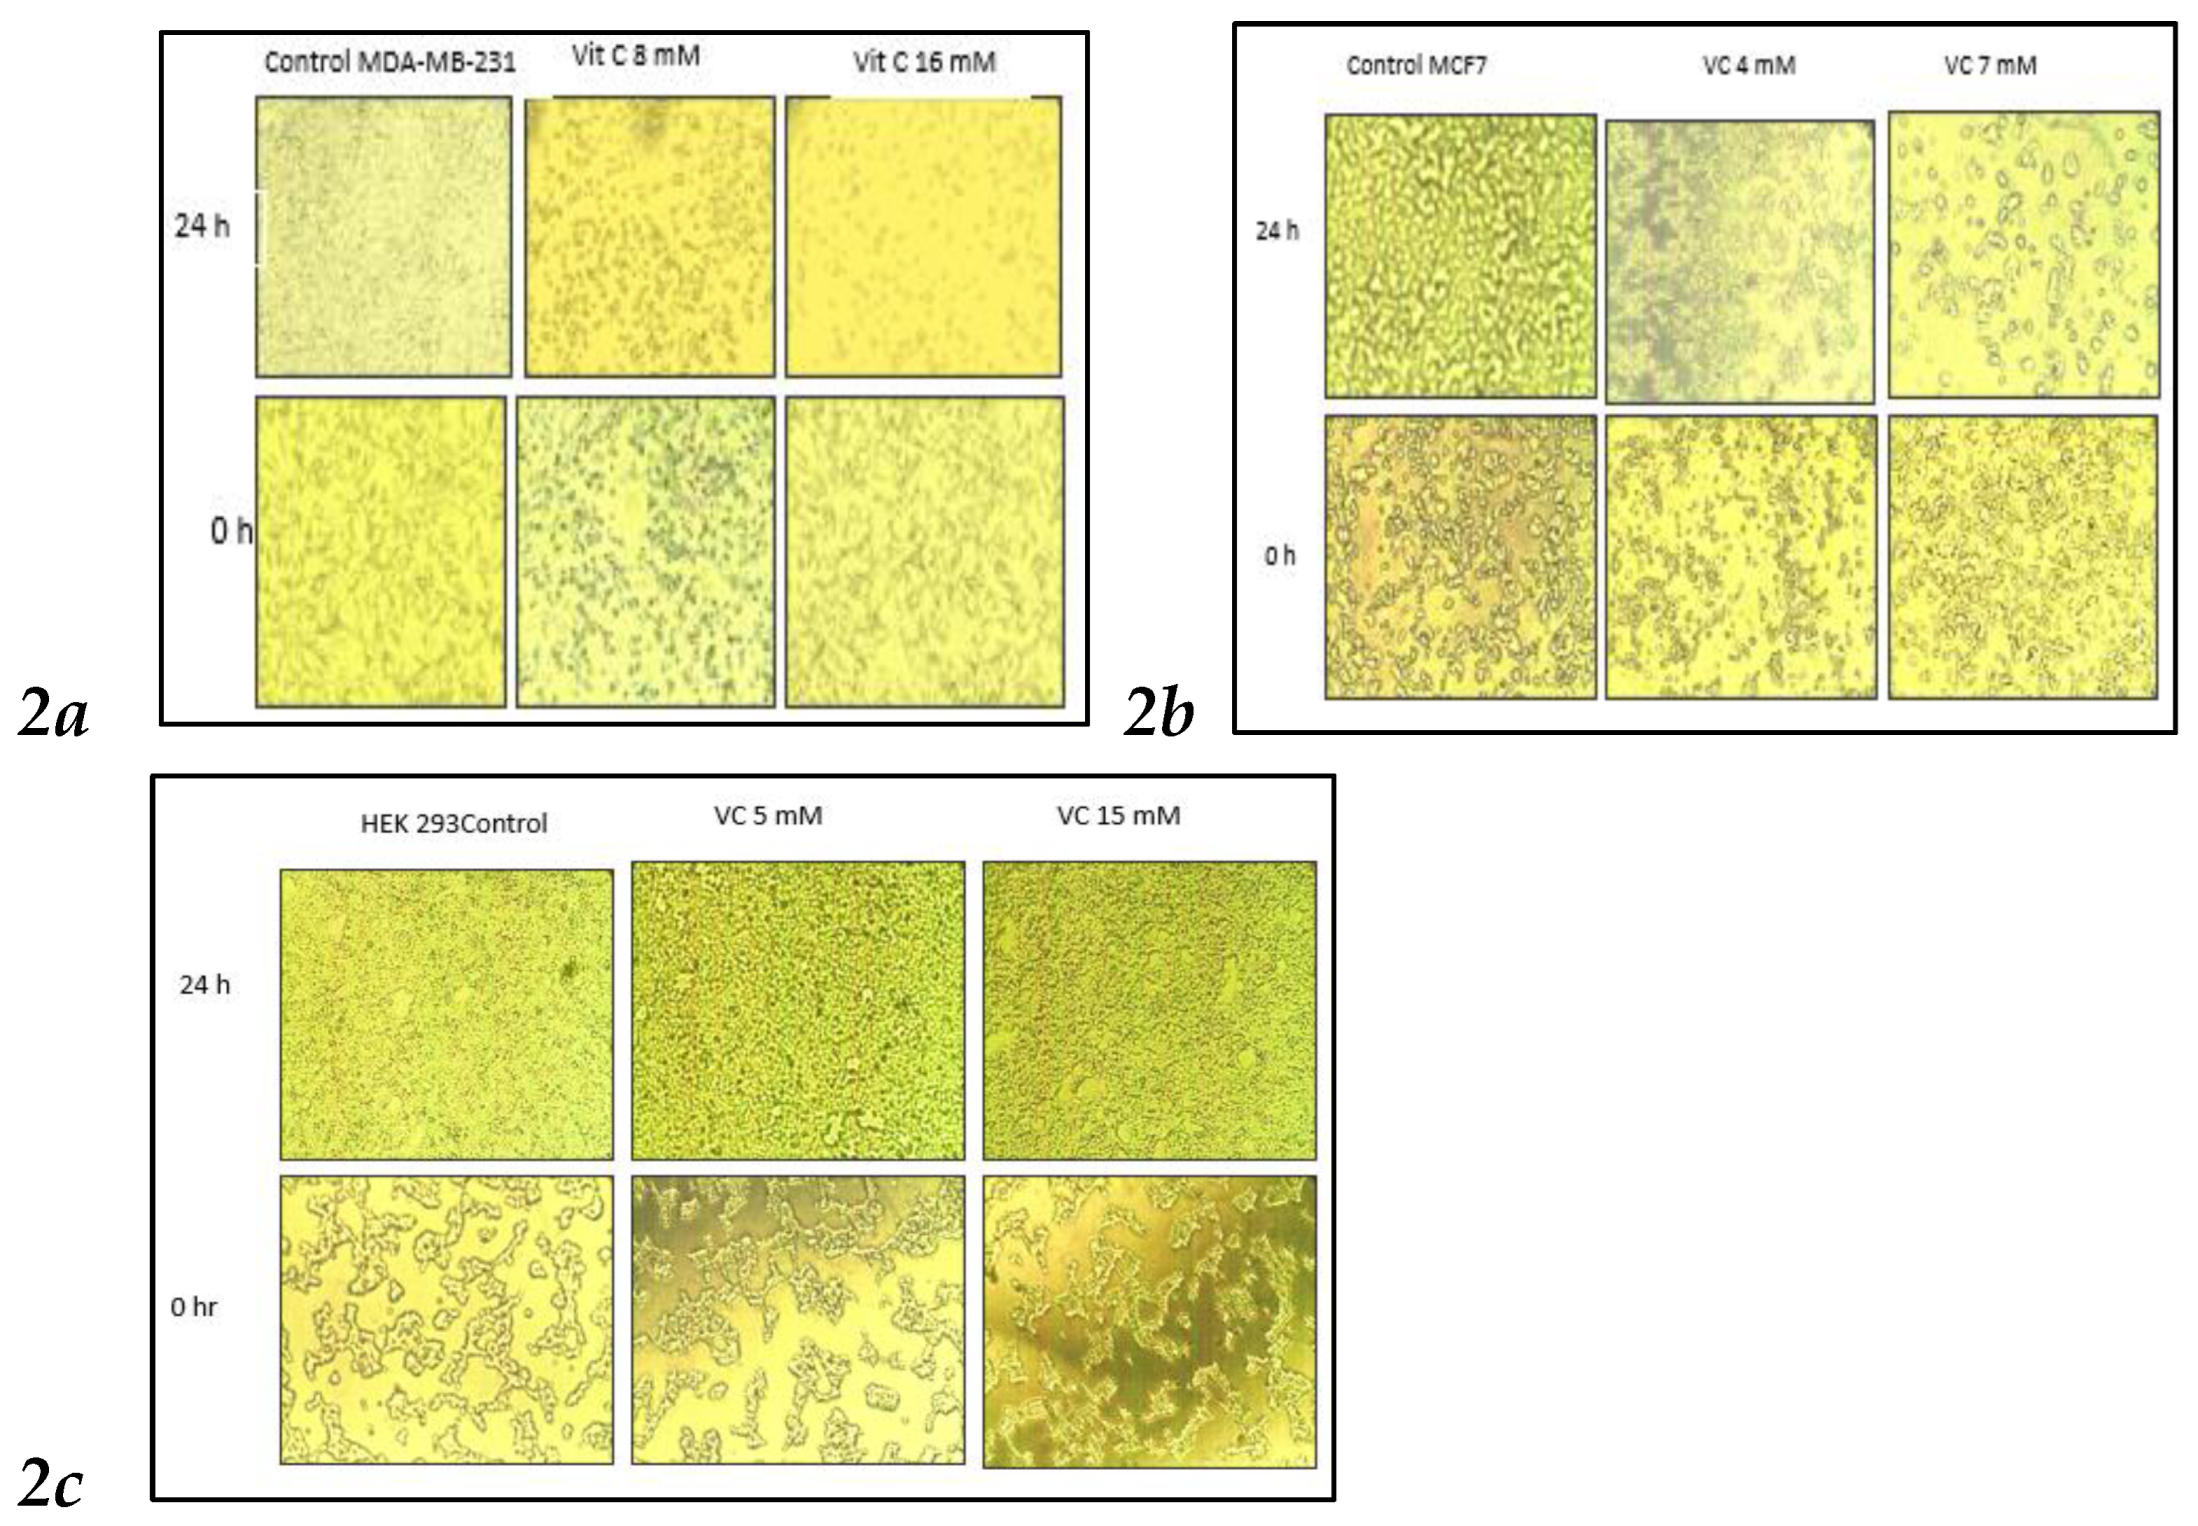
VC concentrations at 8 mM and 16 mM significantly altered cell morphology compared to the control MDA-MB-231. As shown in
Fig. 2, control cells displayed fibroblast-like growth, adhering to the culture dish. In contrast, cells treated with 8 mM VC exhibited some cell death, while those treated with 16 mM showed increased cell death, with most cells floating in the media (
Fig 2a). MCF control cells showed growth at 24 hours, whereas treatment with 4 mM and 7 mM VC resulted in reduced growth and noticeable changes in cell morphology (
Fig 2b).
Non-cancerous HEK 293 kidney cells exhibited increased growth when treated with 5 mM and 15 mM of VC, compared to the control, indicating that VC did not induce cell death in these non-cancerous cells.
Figure 2.
Inverted microscopic images of MDA-MB231 and MCF7 cancer cells after 24 hours of treatment with VC at concentrations of 8 mM and 16 mM for MDA-MB231, and 4 mM and 7 mM for MCF7. Higher concentrations of VC led to increased cell death in both MDA-MB231 and MCF7 compared to their respective controls (
Fig. 2a,
2b). In contrast, VC at 5 mM and 15 mM promoted cell growth in non-cancerous HEK-293 kidney cells (
Fig. 2c).
3.3. Inhibition of Cell Migration
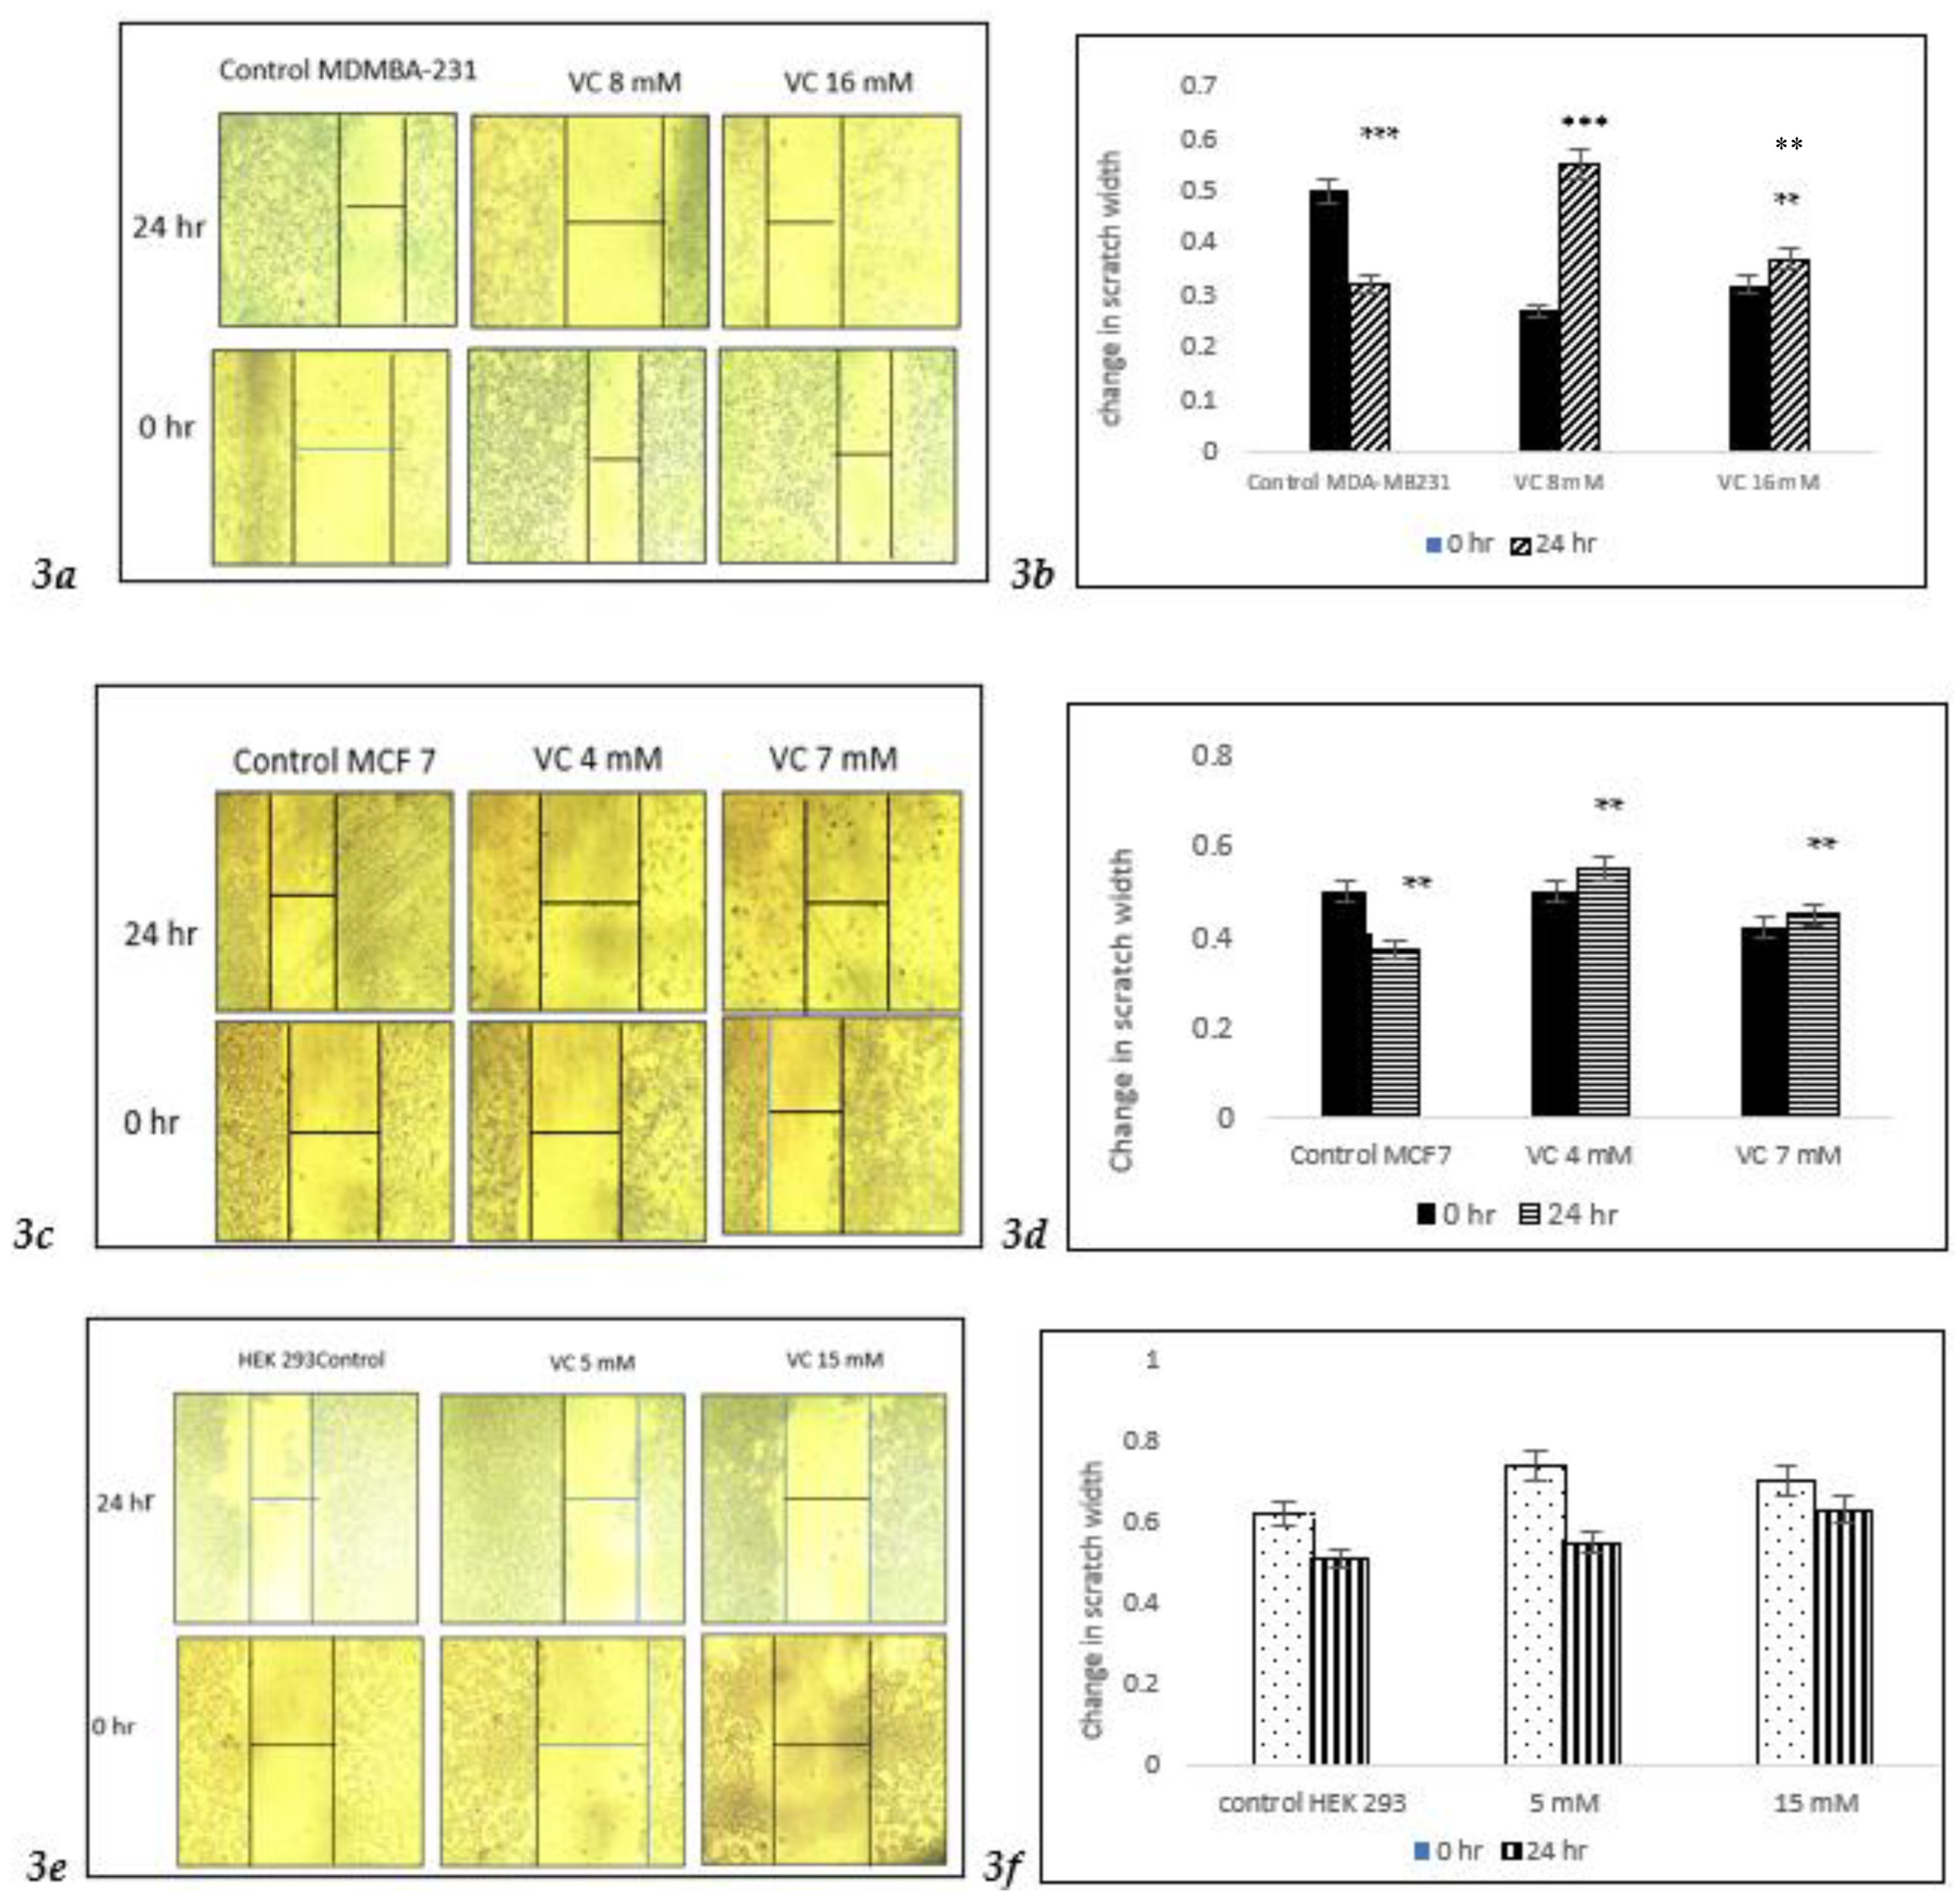
After a 24-hour treatment with 8 mM VC, significant changes in cell migration were observed, with a notable increase in cell death at 16 mM VC compared to control MDA-MB231. In the control group, a slight increase in migration indicated the early stages of invasion and metastasis in MDA-MB-231 cells (
Fig. 3a,
3b). Similarly, MCF7 cells showed increased cell death at 4 mM and 7 mM VC. However, non-cancerous HEK 293 kidney cells treated with 5 mM or 15 mM VC for 24 hours displayed no significant difference in behavior compared to its control, with continued cell growth, suggesting that VC is non-cytotoxic to non-cancerous cells.
Figure 3.
a shows inverted microscope images of cell migration after 24-hour treatment with VC at 8 mM and 16 mM for MDA-MB-231 cells, and 4 mM and 7 mM for MCF7 cells. In the control group, a narrow scratch area was observed, indicating maximal cell migration of cancer cells, while the VC-treated cells showed a wider scratch area, suggesting reduced migration (
Fig. 3a,
3c). In contrast, VC at 5 mM and 15 mM promoted cell growth in non-cancerous HEK-293 kidney cells, as demonstrated by a decreased scratch width (
Fig. 3e).
Figures 3b,
3d, and
3f present the corresponding histograms. **p<0.01, ***p<0.001, post hoc Newman-Keuls test.
3.4. Induction of Apoptosis
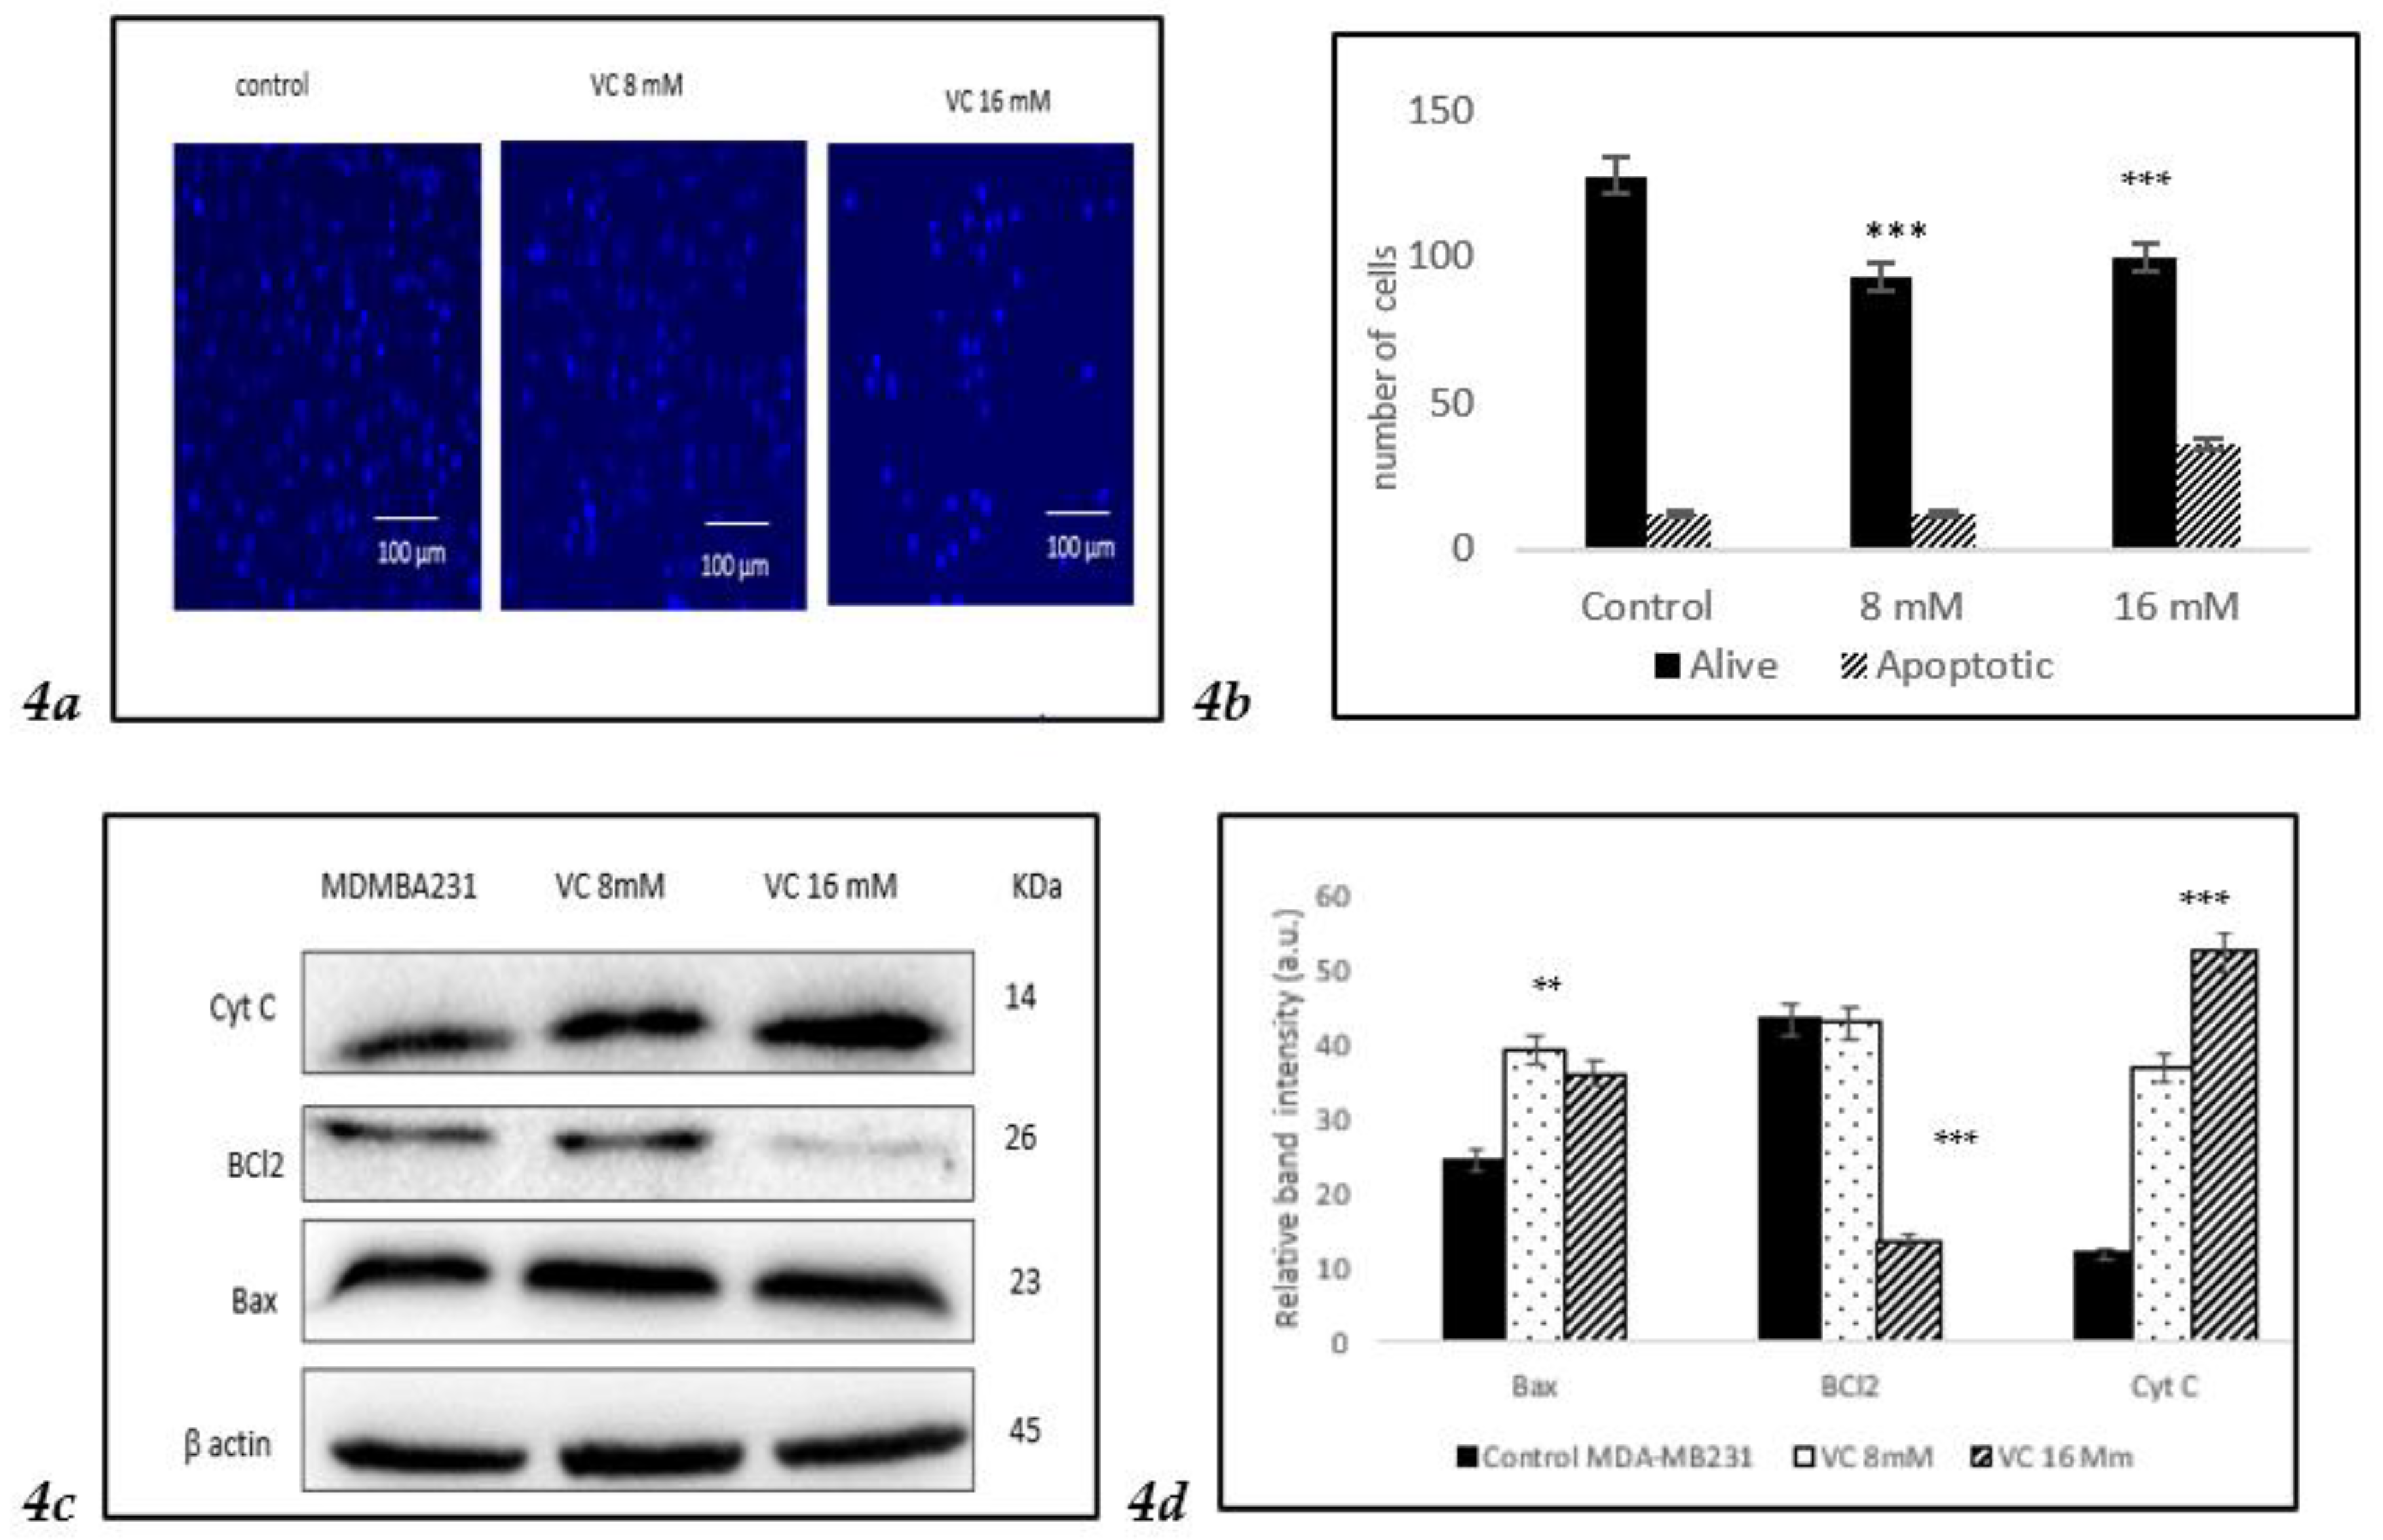
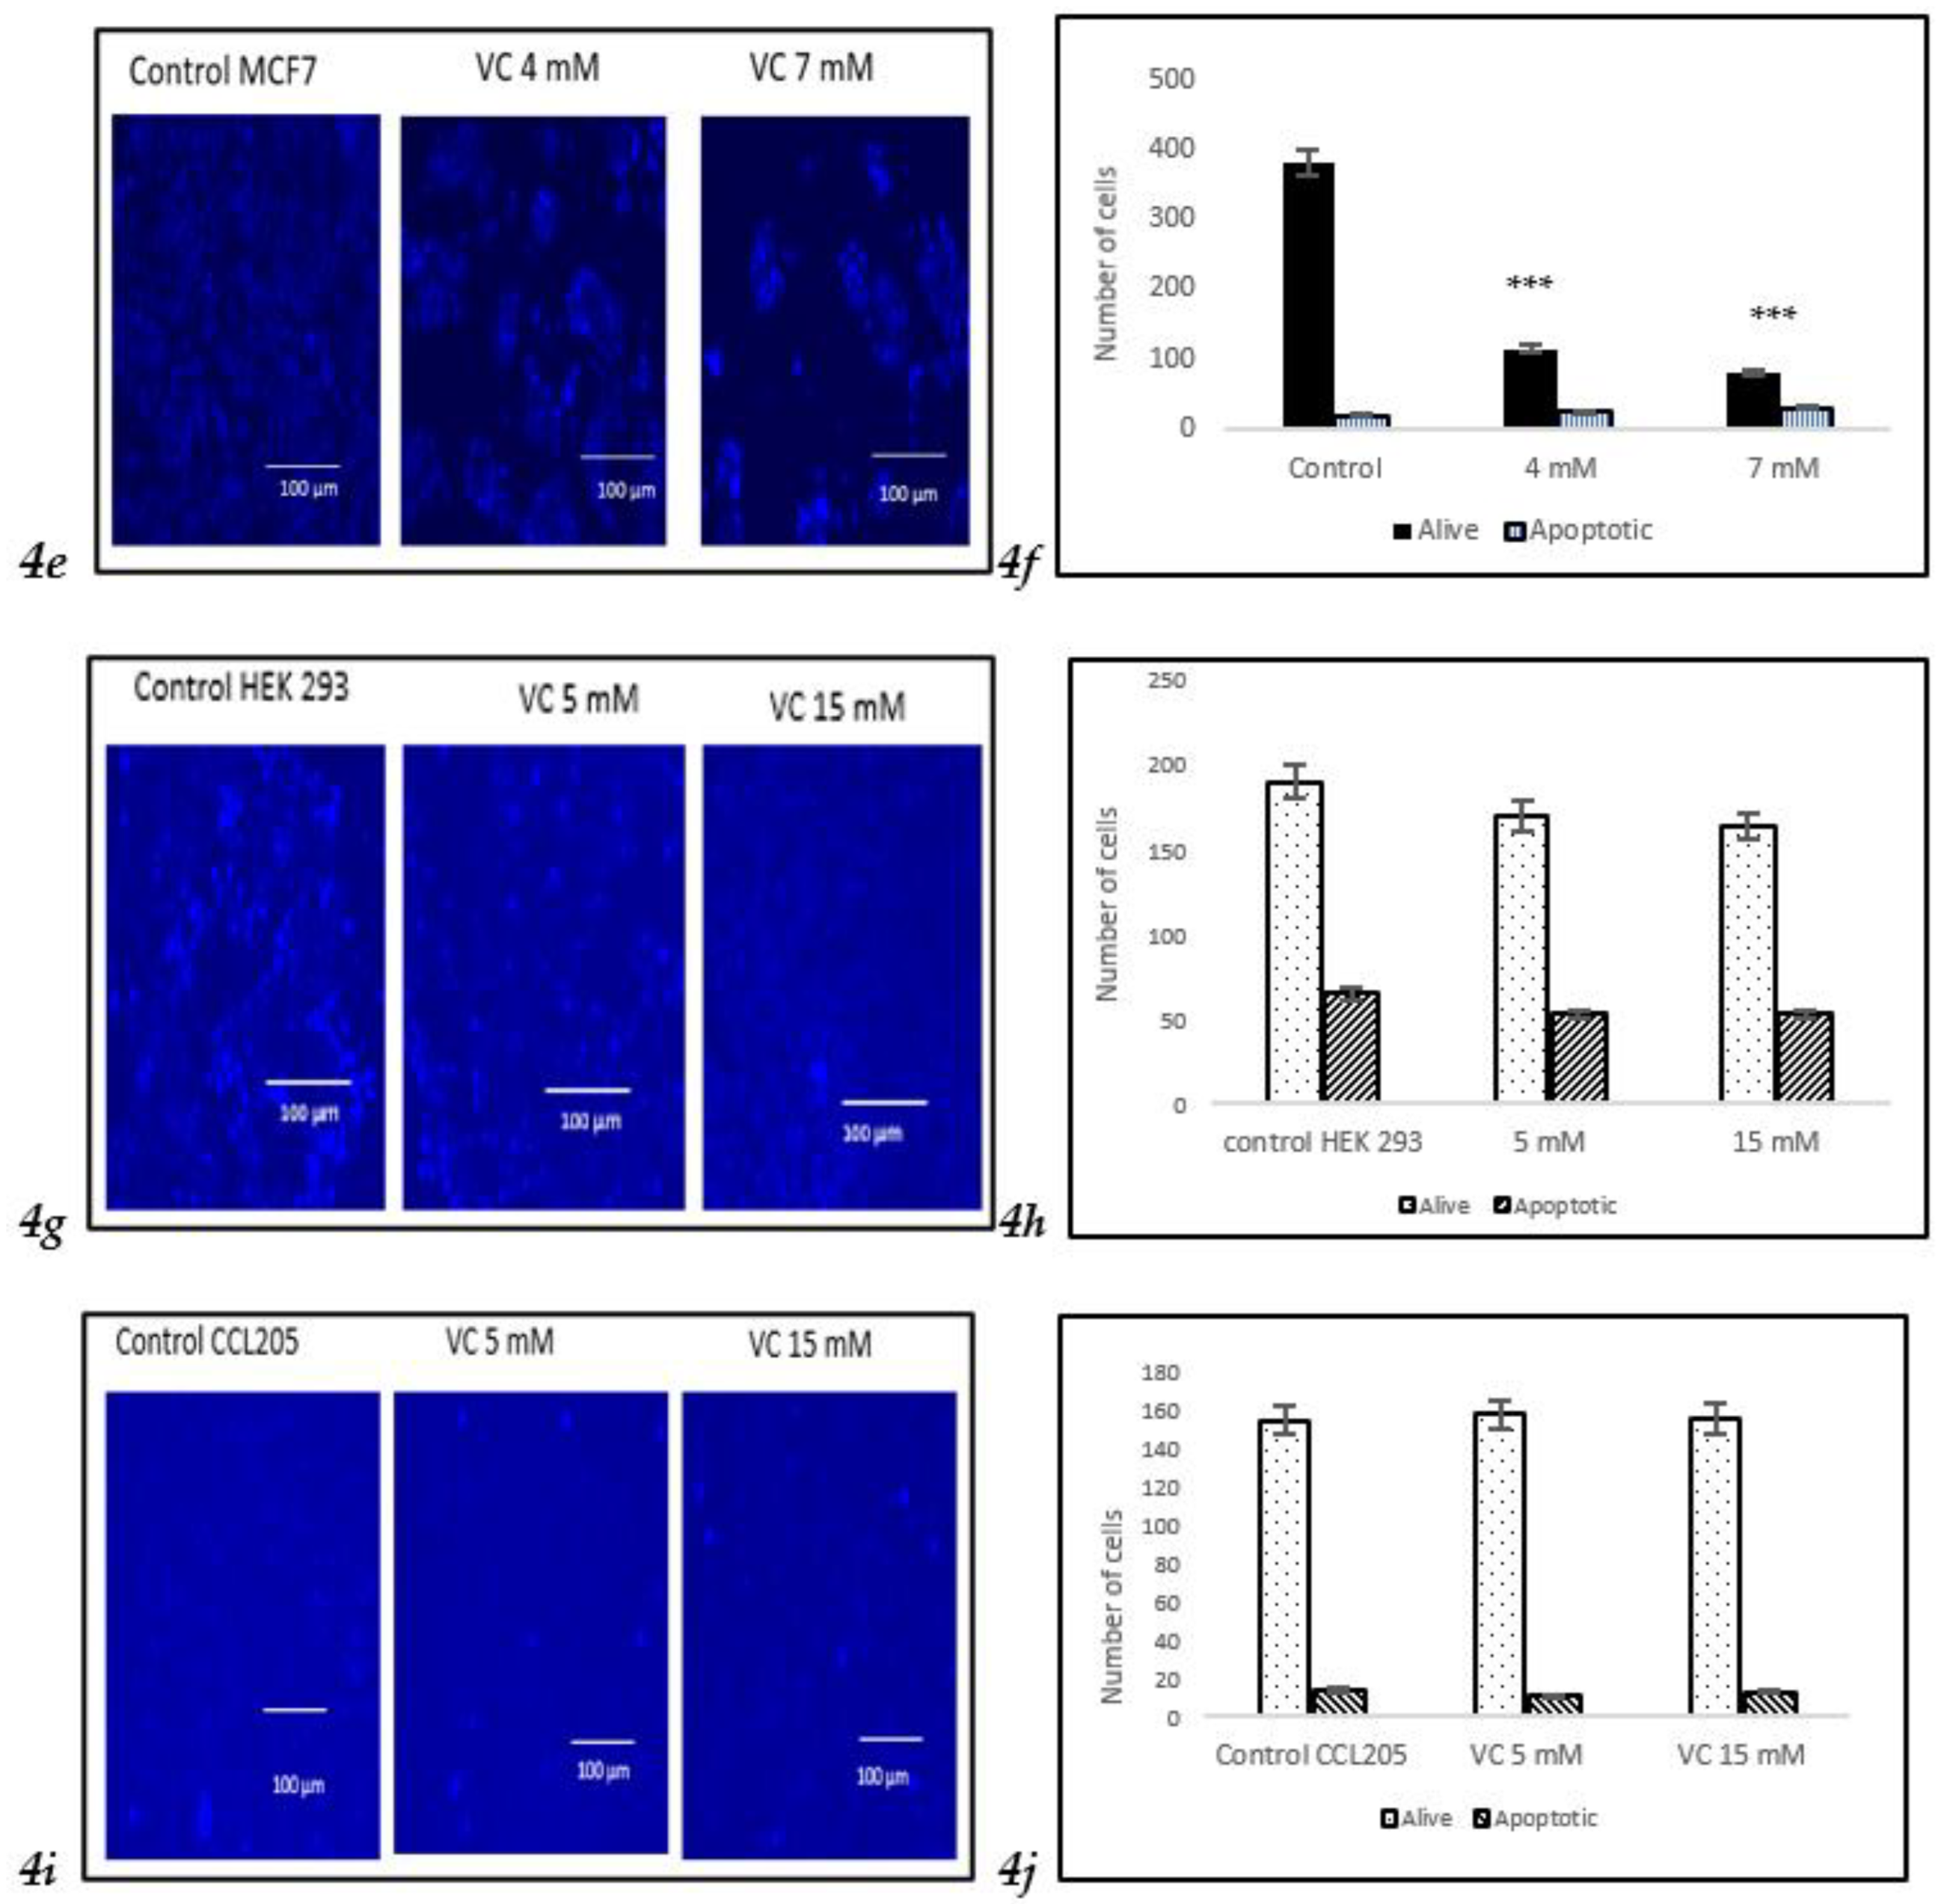
VC induced apoptosis in treated cells of MDA-MB-231, as observed using Hoechst 33342 staining. A higher concentration of VC at 16 mM resulted in increased apoptosis, indicated by a bright blue fluorescence due to condensed and fragmented nuclei, whereas control cells exhibited lower fluorescence, signifying healthy cells (
Fig. 4a). The histogram in
Fig. 4b illustrated the difference in cell expression following VC treatment, as analyzed using ImageJ software. Additionally, Western blot analysis revealed changes in the expression of pro-apoptotic Bax and anti-apoptotic Bcl-2 proteins, suggesting intracellular ROS generation.
Fig. 4c showed a significant increase in Bax expression alongside a slight decrease in Bcl-2 expression. ROS generation also led to a reduction in mitochondrial membrane potential, causing cytochrome C release into the cytosol, which further triggered apoptosis.
Fig. 4d presents a histogram of the data from
Fig. 4c.
To assess the effect of VC on different cell lines, MCF cells, non-cancerous HEK 293 kidney, and CCL 205 lung cells were tested (
Figures 4e–
4j). For the Western blot analysis of MCF7, please refer to the supplementary file.
3.5. Depletion of Mitochondrial Membrane Potential (ψm)
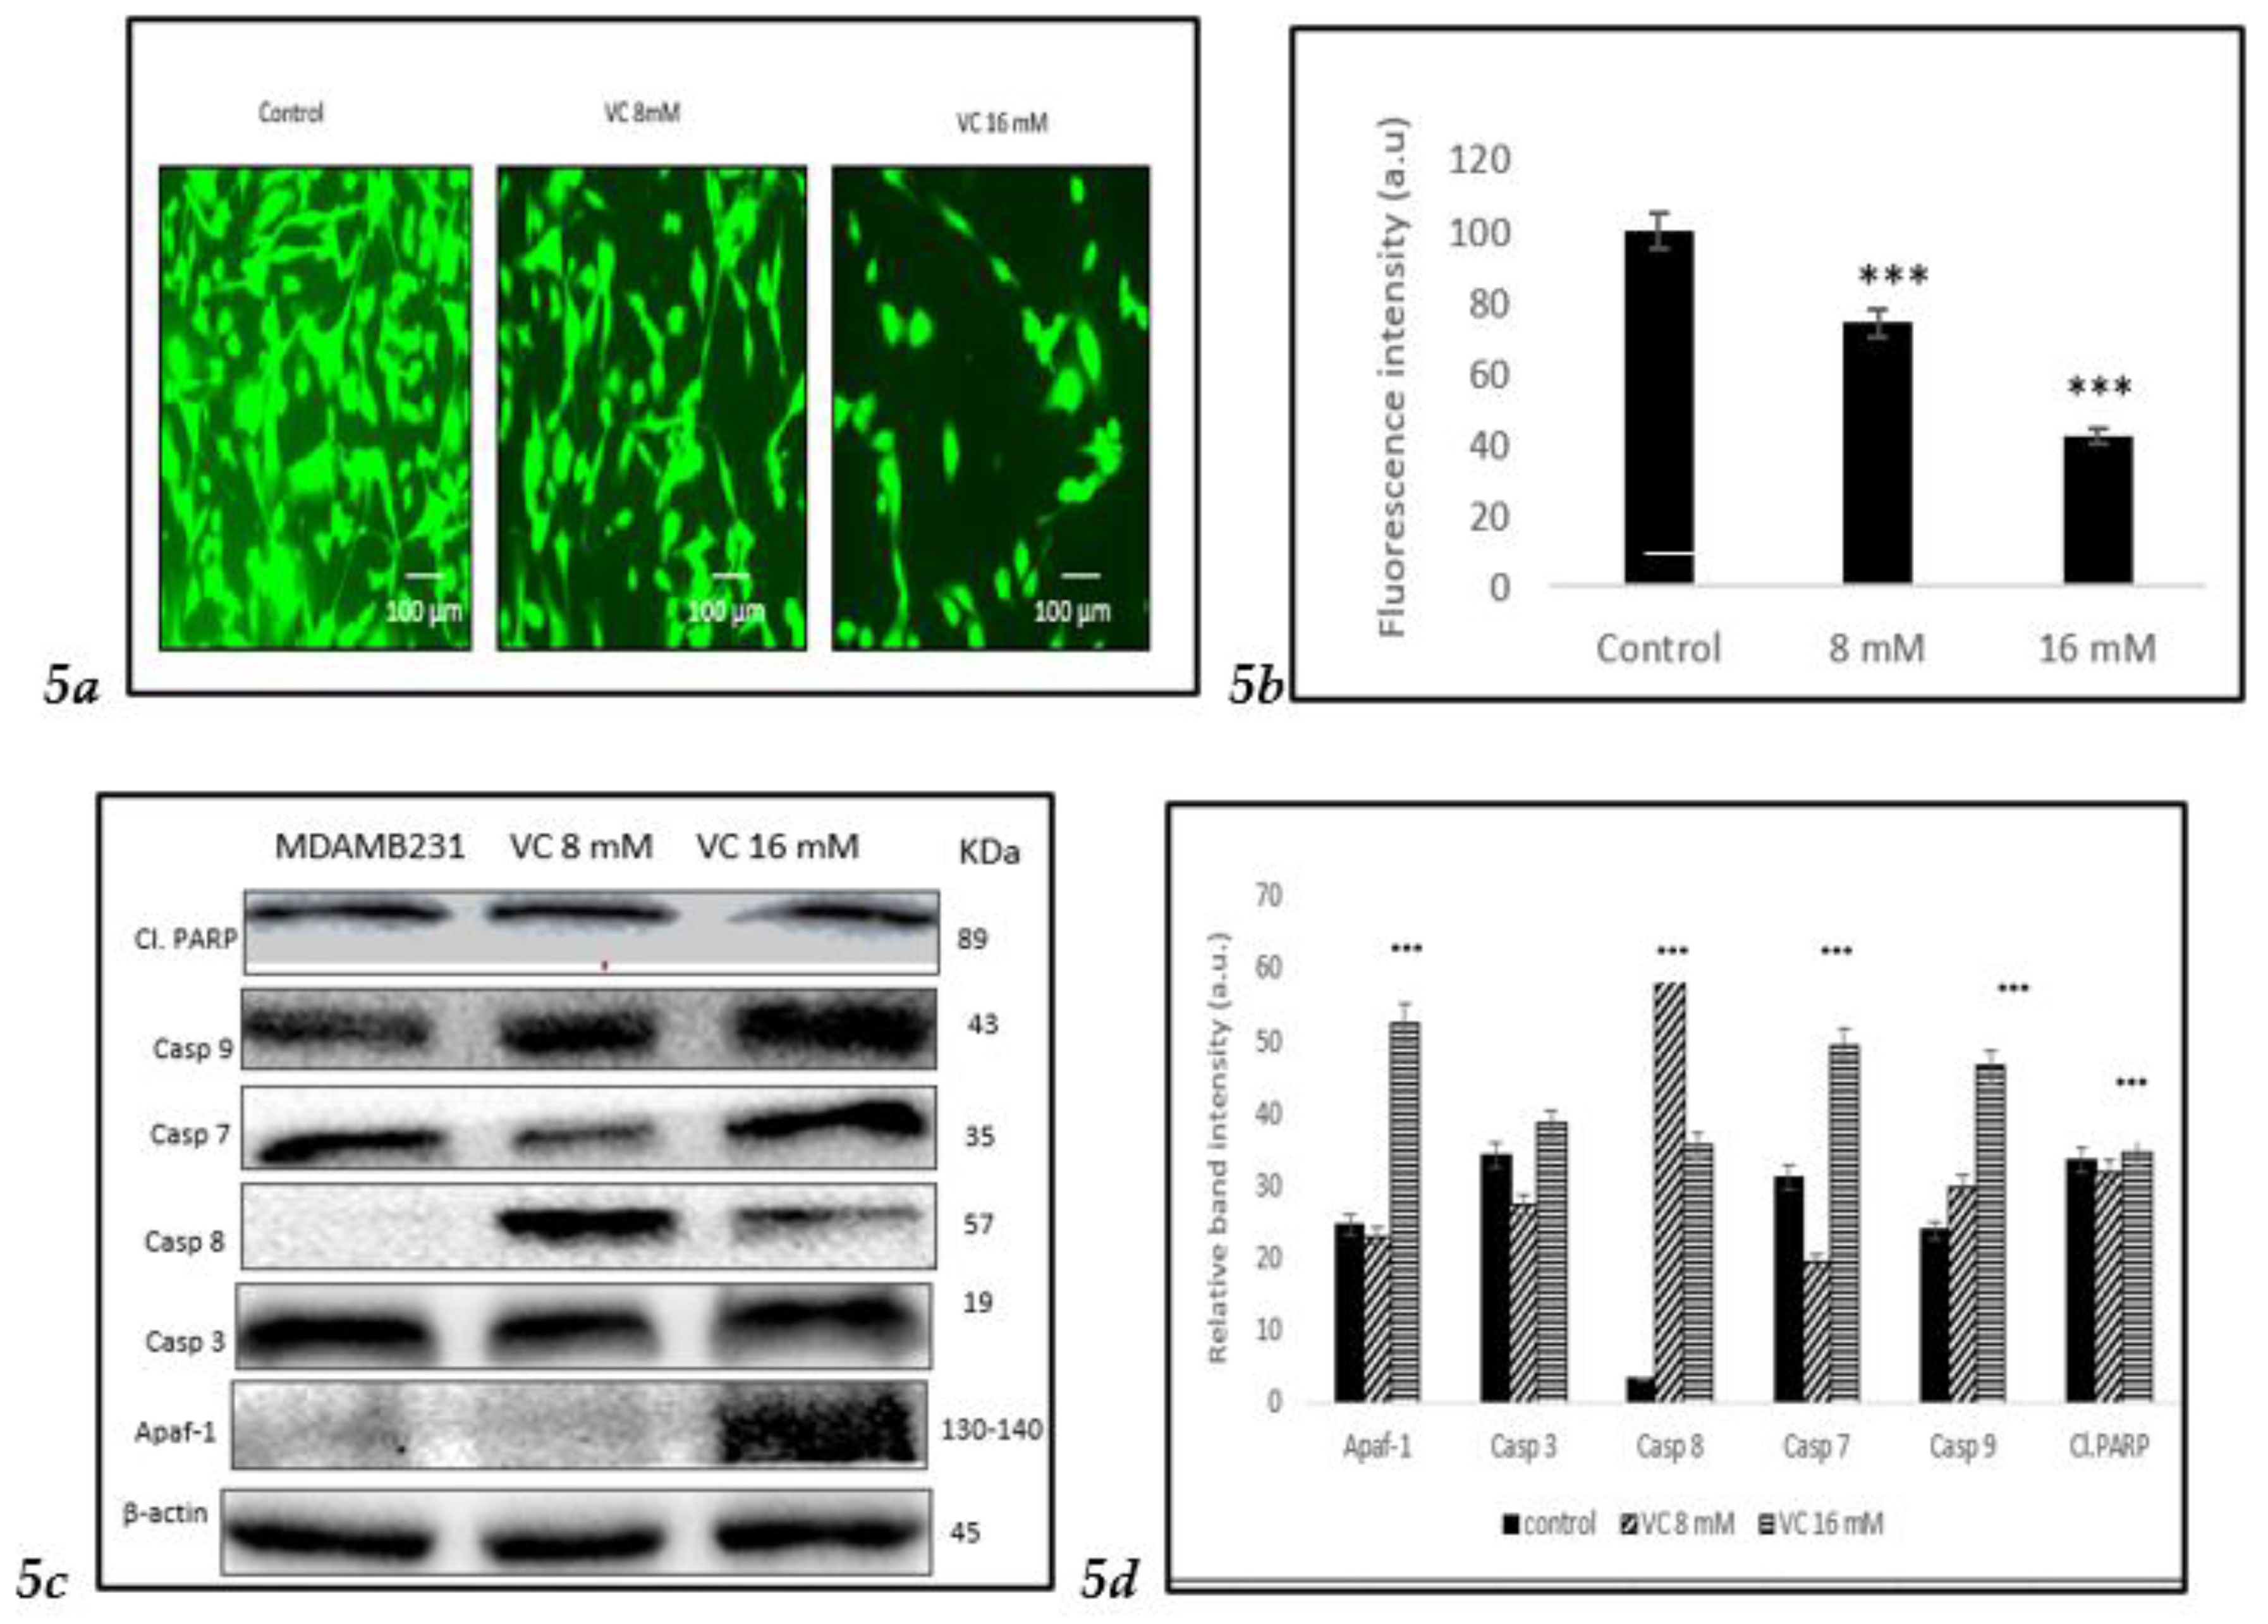
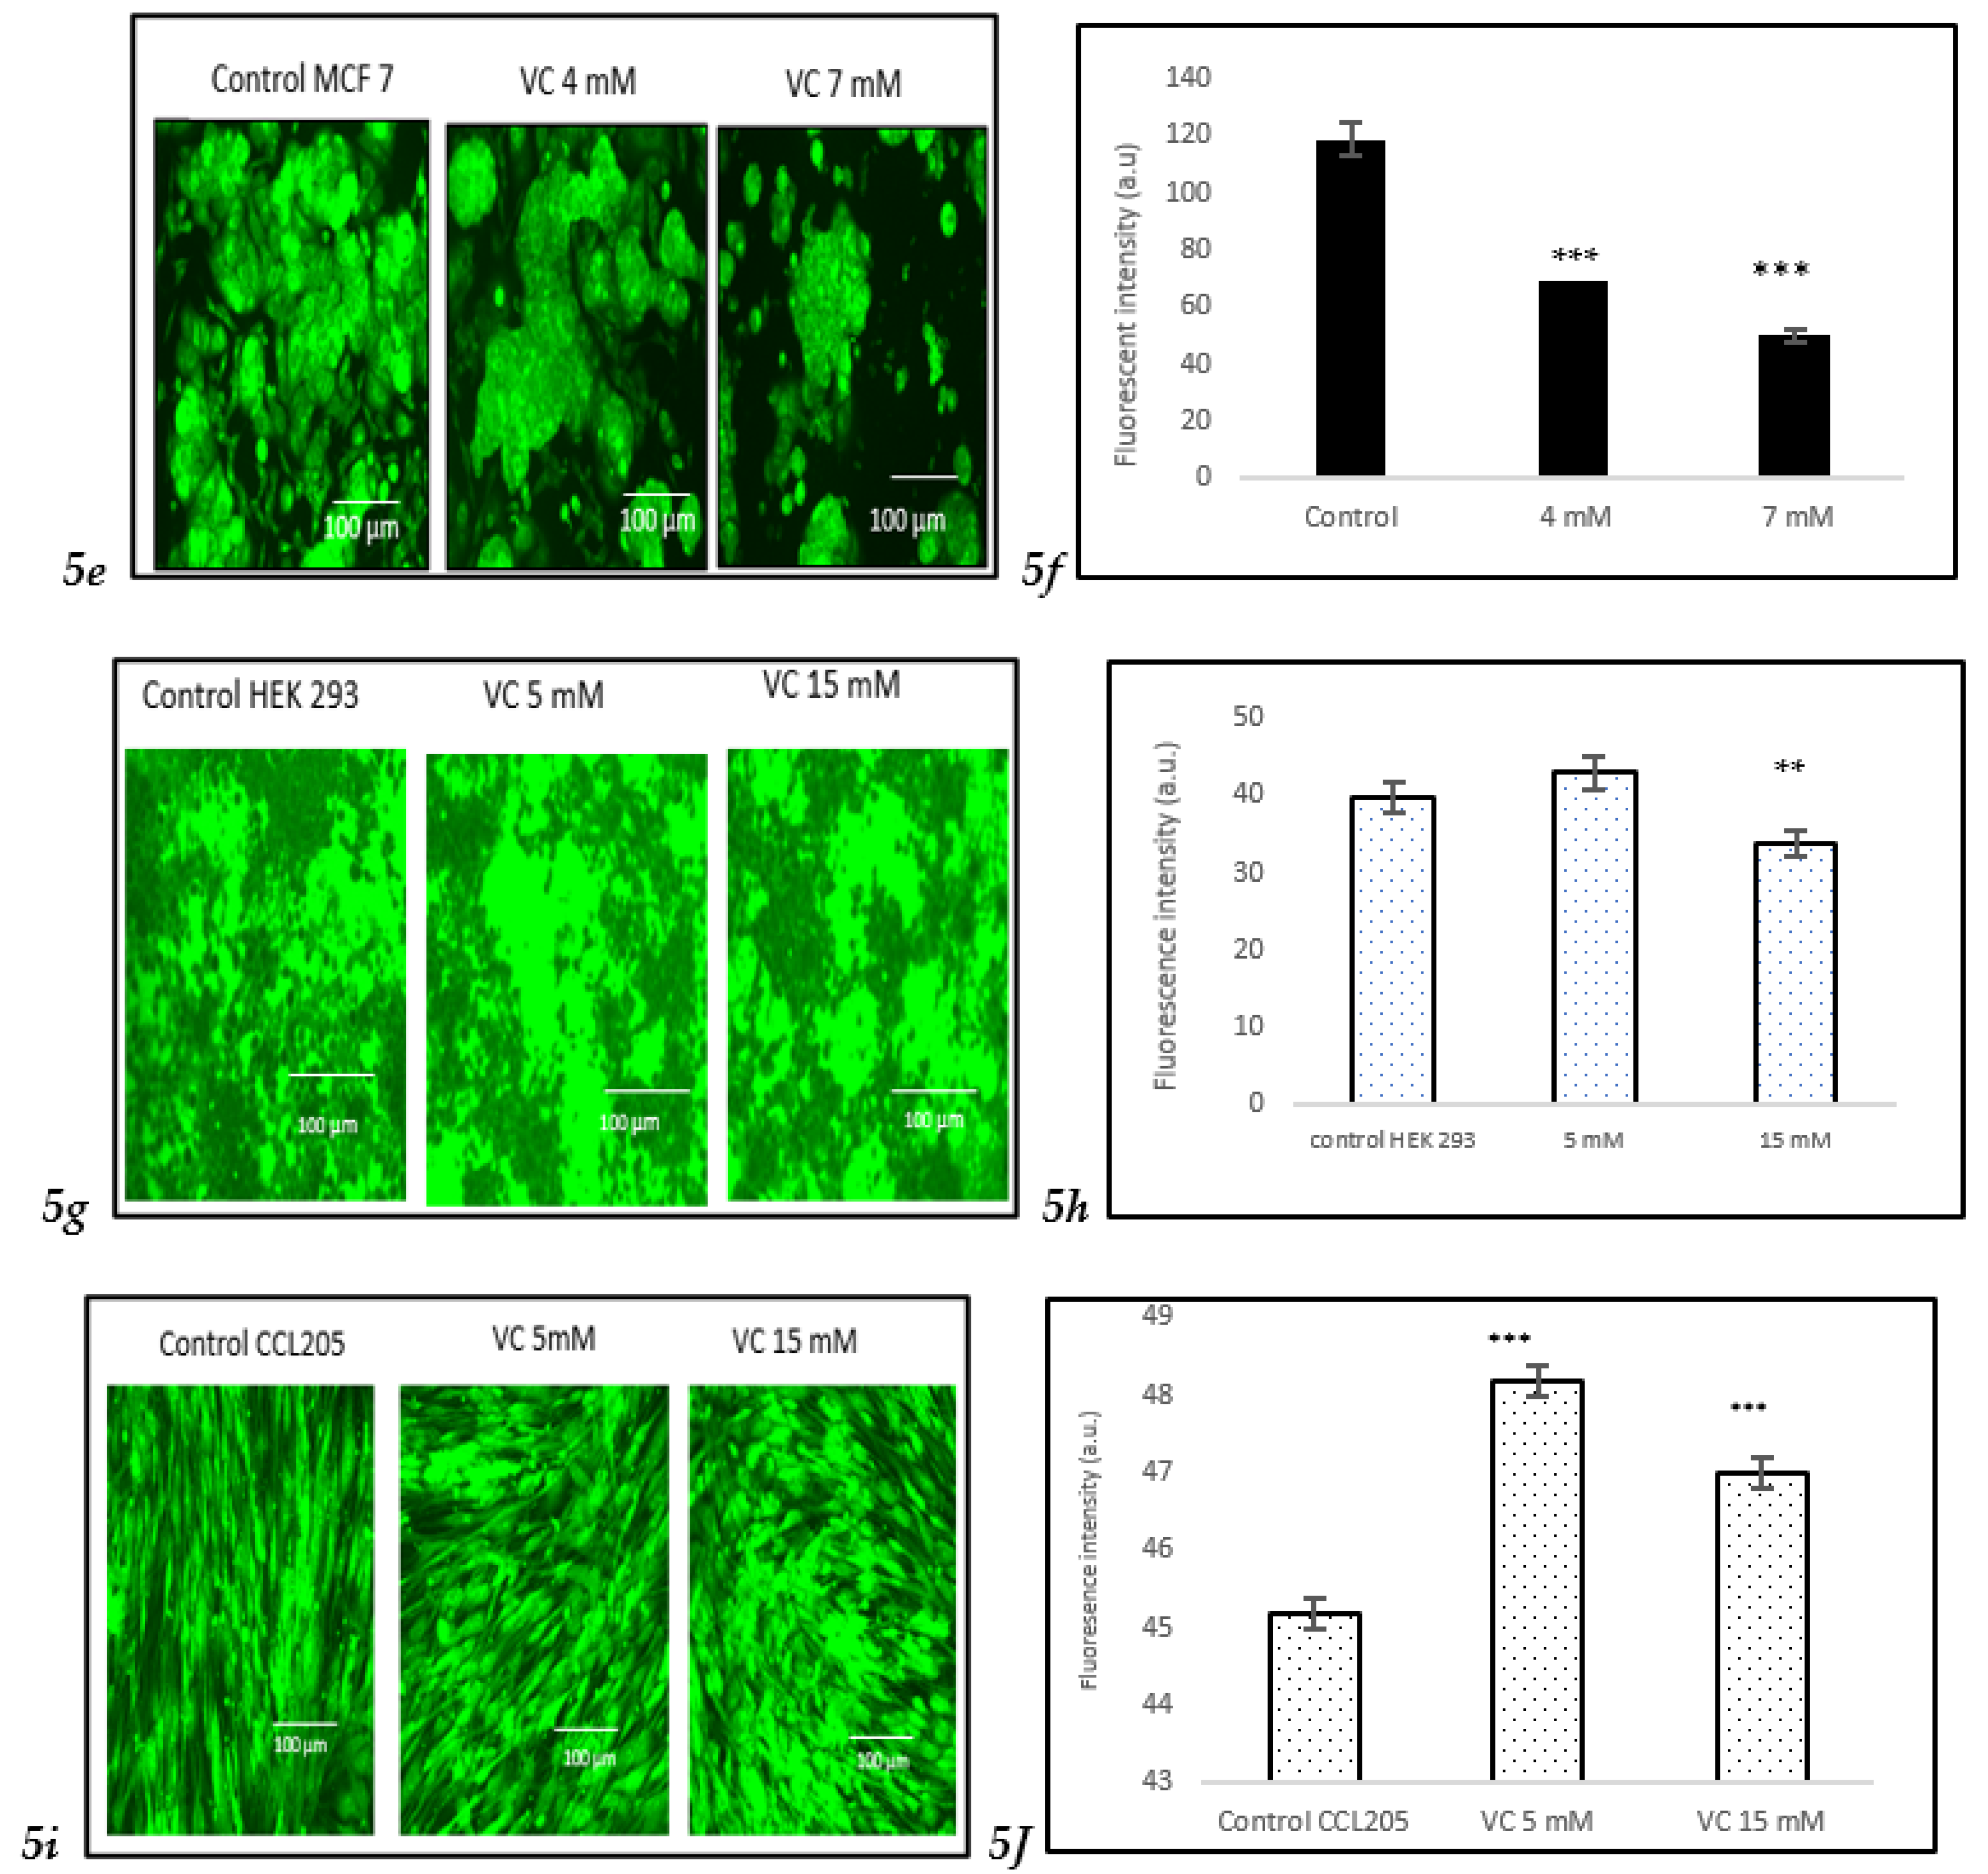
Depletion in mitochondrial membrane potential due to cell death could be identified by the generation of reactive oxygen species (ROS), as observed in MDA-MB-231cells treated with VC after staining with Rhodamine 123. Control cells exhibited higher fluorescent intensity, indicating a healthy membrane potential compared to treated cells. The depletion in mitochondrial membrane potential was more pronounced in cells treated with 16 mM of VC.
Furthermore, Western blot analysis confirmed the depletion of mitochondrial membrane potential showing increase in apoptosis-inducing factor (AIF-1), mitochondrial proteins that mediate caspase-independent cell death. Apoptosis occurred in mitochondria due to several key proteins, such as caspase -7, -8, and -9. The activation of caspases -7, -8, and -9 signifies a crucial event in cancer cell apoptosis. VC caused a direct activation of initiator caspases (caspase-8 and -9) and executioner caspases -7 (
Fig. 5c).
Fig. 5(d) Illustrated a comparison of the changes in these proteins depicted as a histogram.
To assess the effect of VC on different cell lines, MCF cells, non-cancerous HEK 293 kidney cells, and CCL 205 lung cells were tested (
Figures 5e–
5j). For the Western blot analysis of MCF7 cells, please refer to the supplementary file.
3.6. Induction of Intracellular ROS
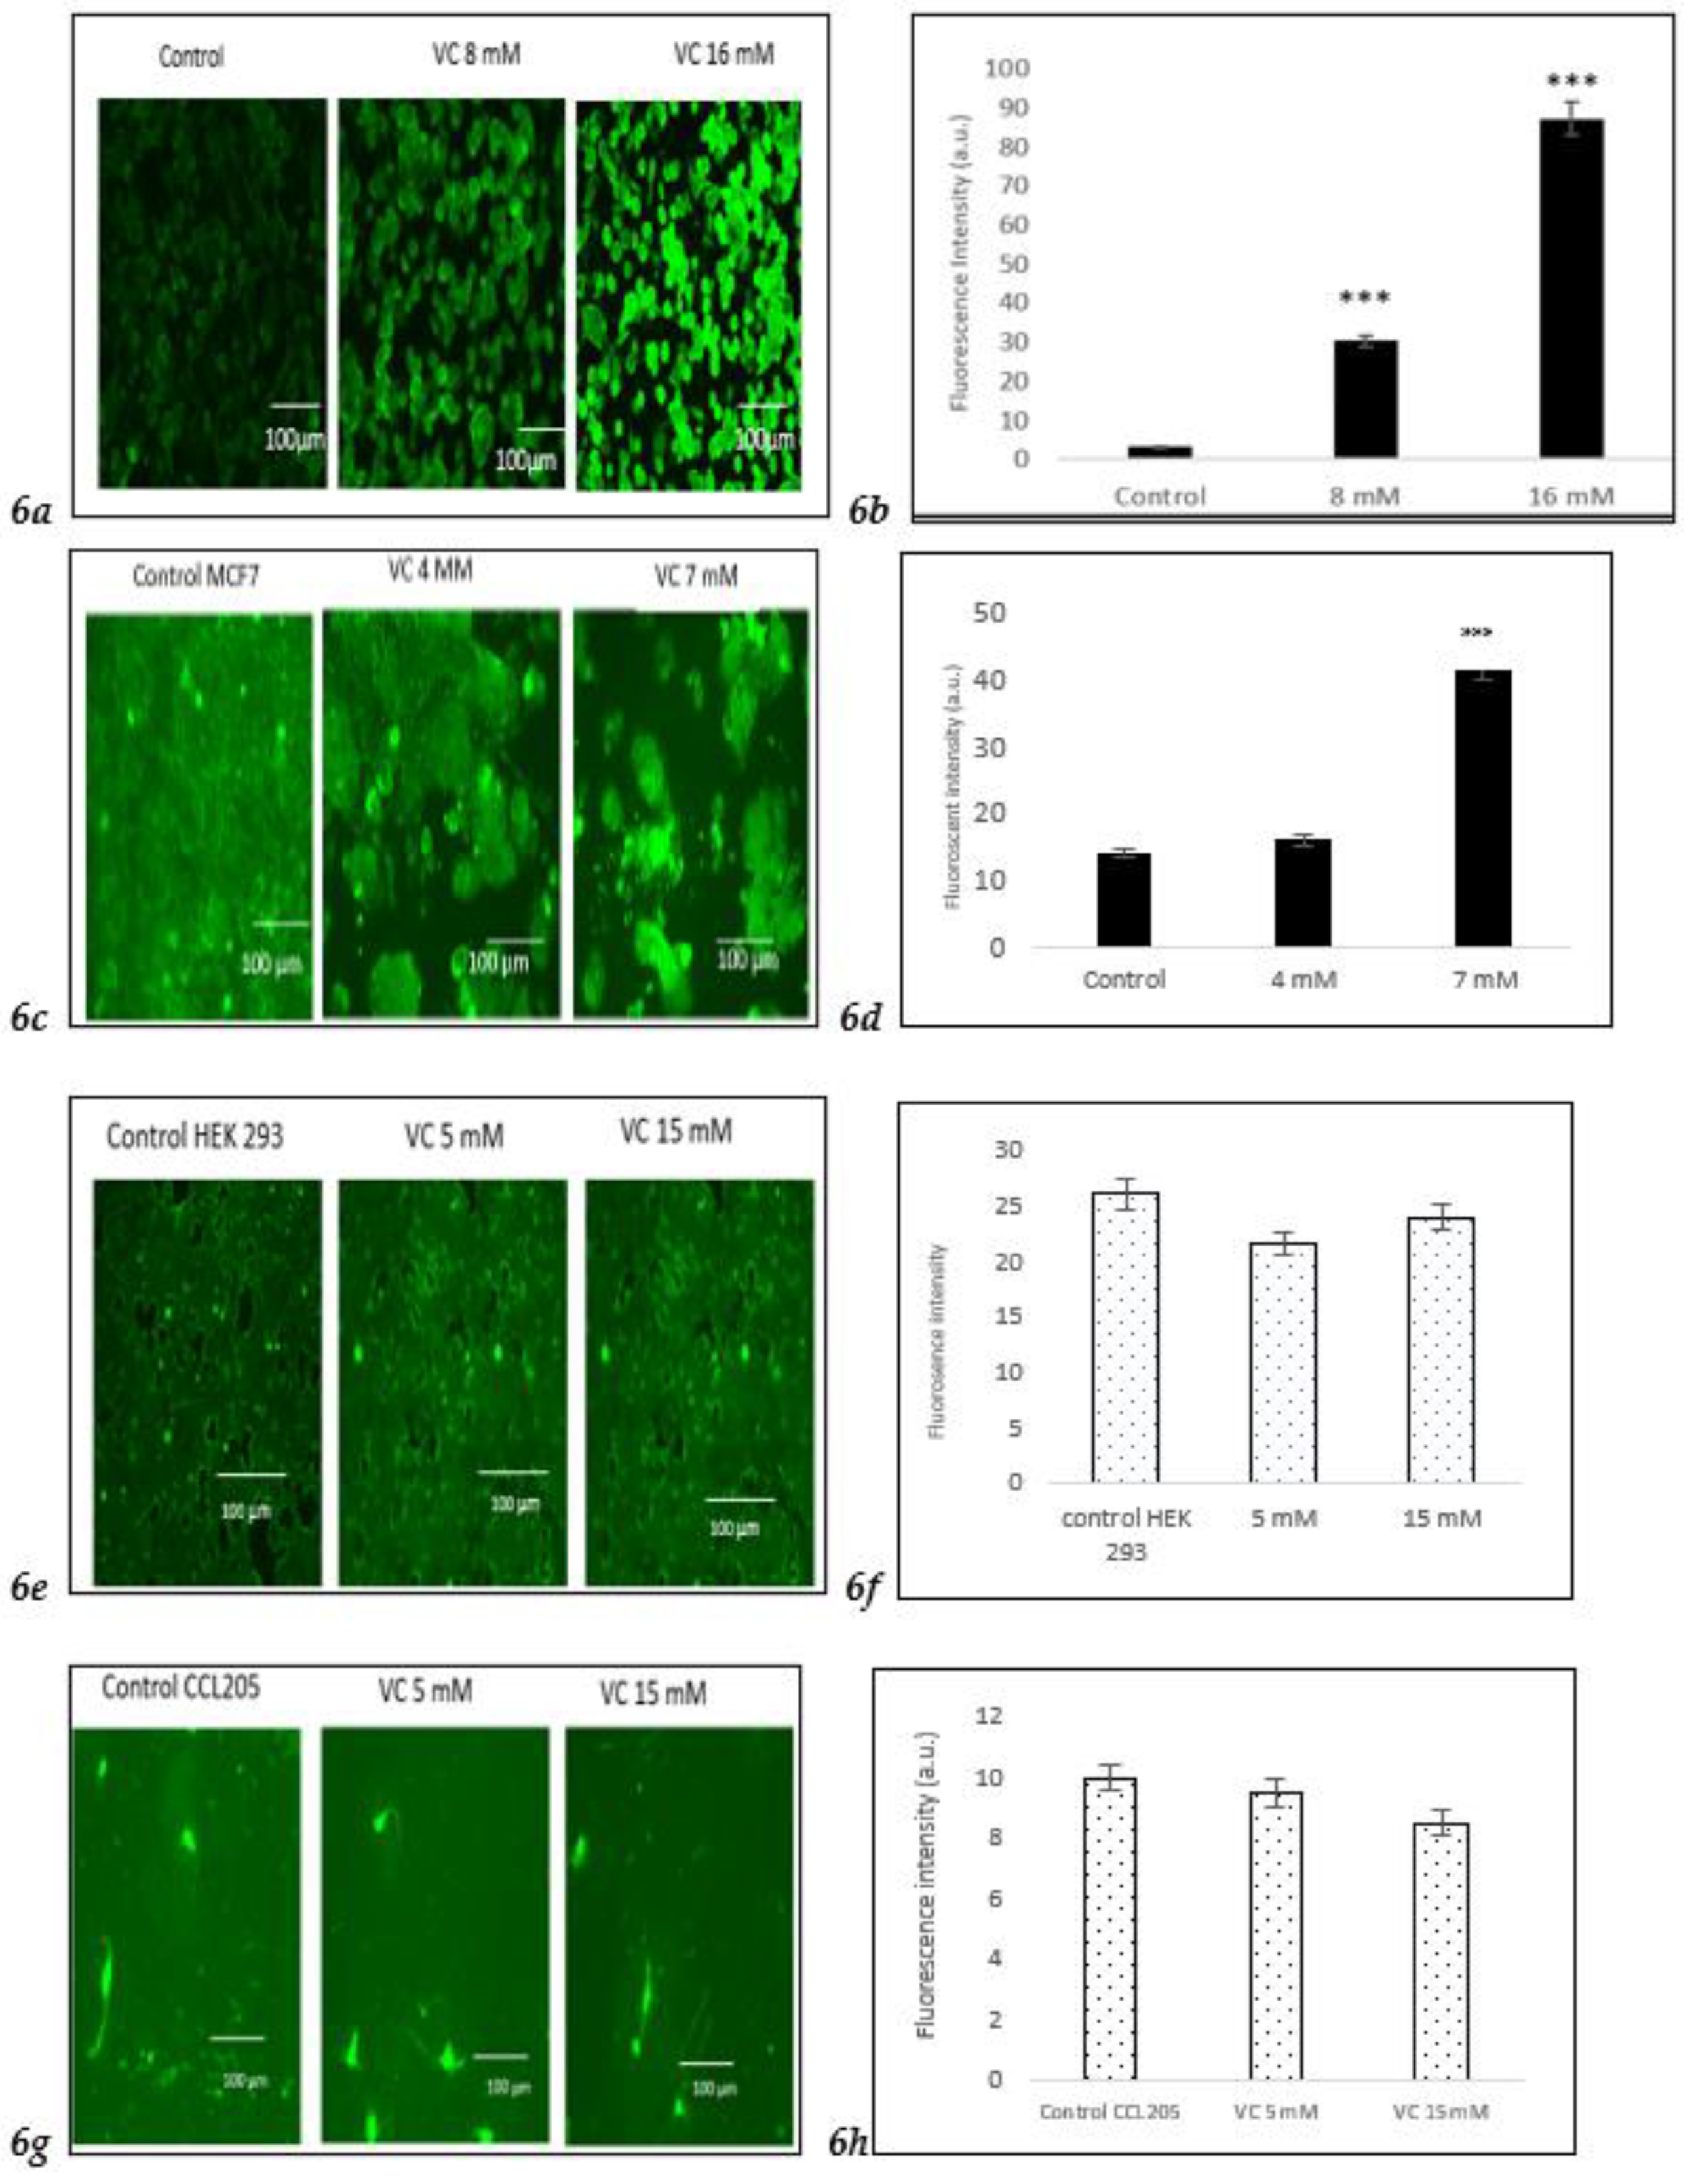
Intracellular ROS generation was assessed using the H2DCFDA staining method. Control MDA-MB-231 cells exhibited lower ROS levels, as indicated by a darker green fluorescence, compared to MDA-MB-231 cells treated with 8 mM or 16 mM VC. The higher the concentration of VC, the greater the intracellular ROS generation, characterized by a brighter green fluorescence (
Fig. 6a).
Fig. 6b presents a histogram comparing ROS levels in treated cells versus control. To further evaluate the effects of VC on different cell lines, MCF cells, along with non-cancerous HEK 293 kidney cells and CCL 205 lung cells, were also tested (
Figures 6c–
6h).
To further evaluate the effect of VC on different cell lines, ROS generation was also assessed in MCF cells and non-cancerous HEK 293 kidney and CCL 205 lung cells. While MCF cells demonstrated a similar increase in ROS as MDA-MB-231 cells, non-cancerous HEK 293 and CCL 205 cells exhibited significantly lower levels of ROS in response to VC treatment, suggesting a minimal or non-cytotoxic effect of VC on non-cancerous cells (
Figures 6e–
6h). Scale bar indicated 100 µm. Significant change of intracellular ROS generation versus control. ***p<0.001, post hoc Newman-Keuls test.
3.7. Induction of Cell Death
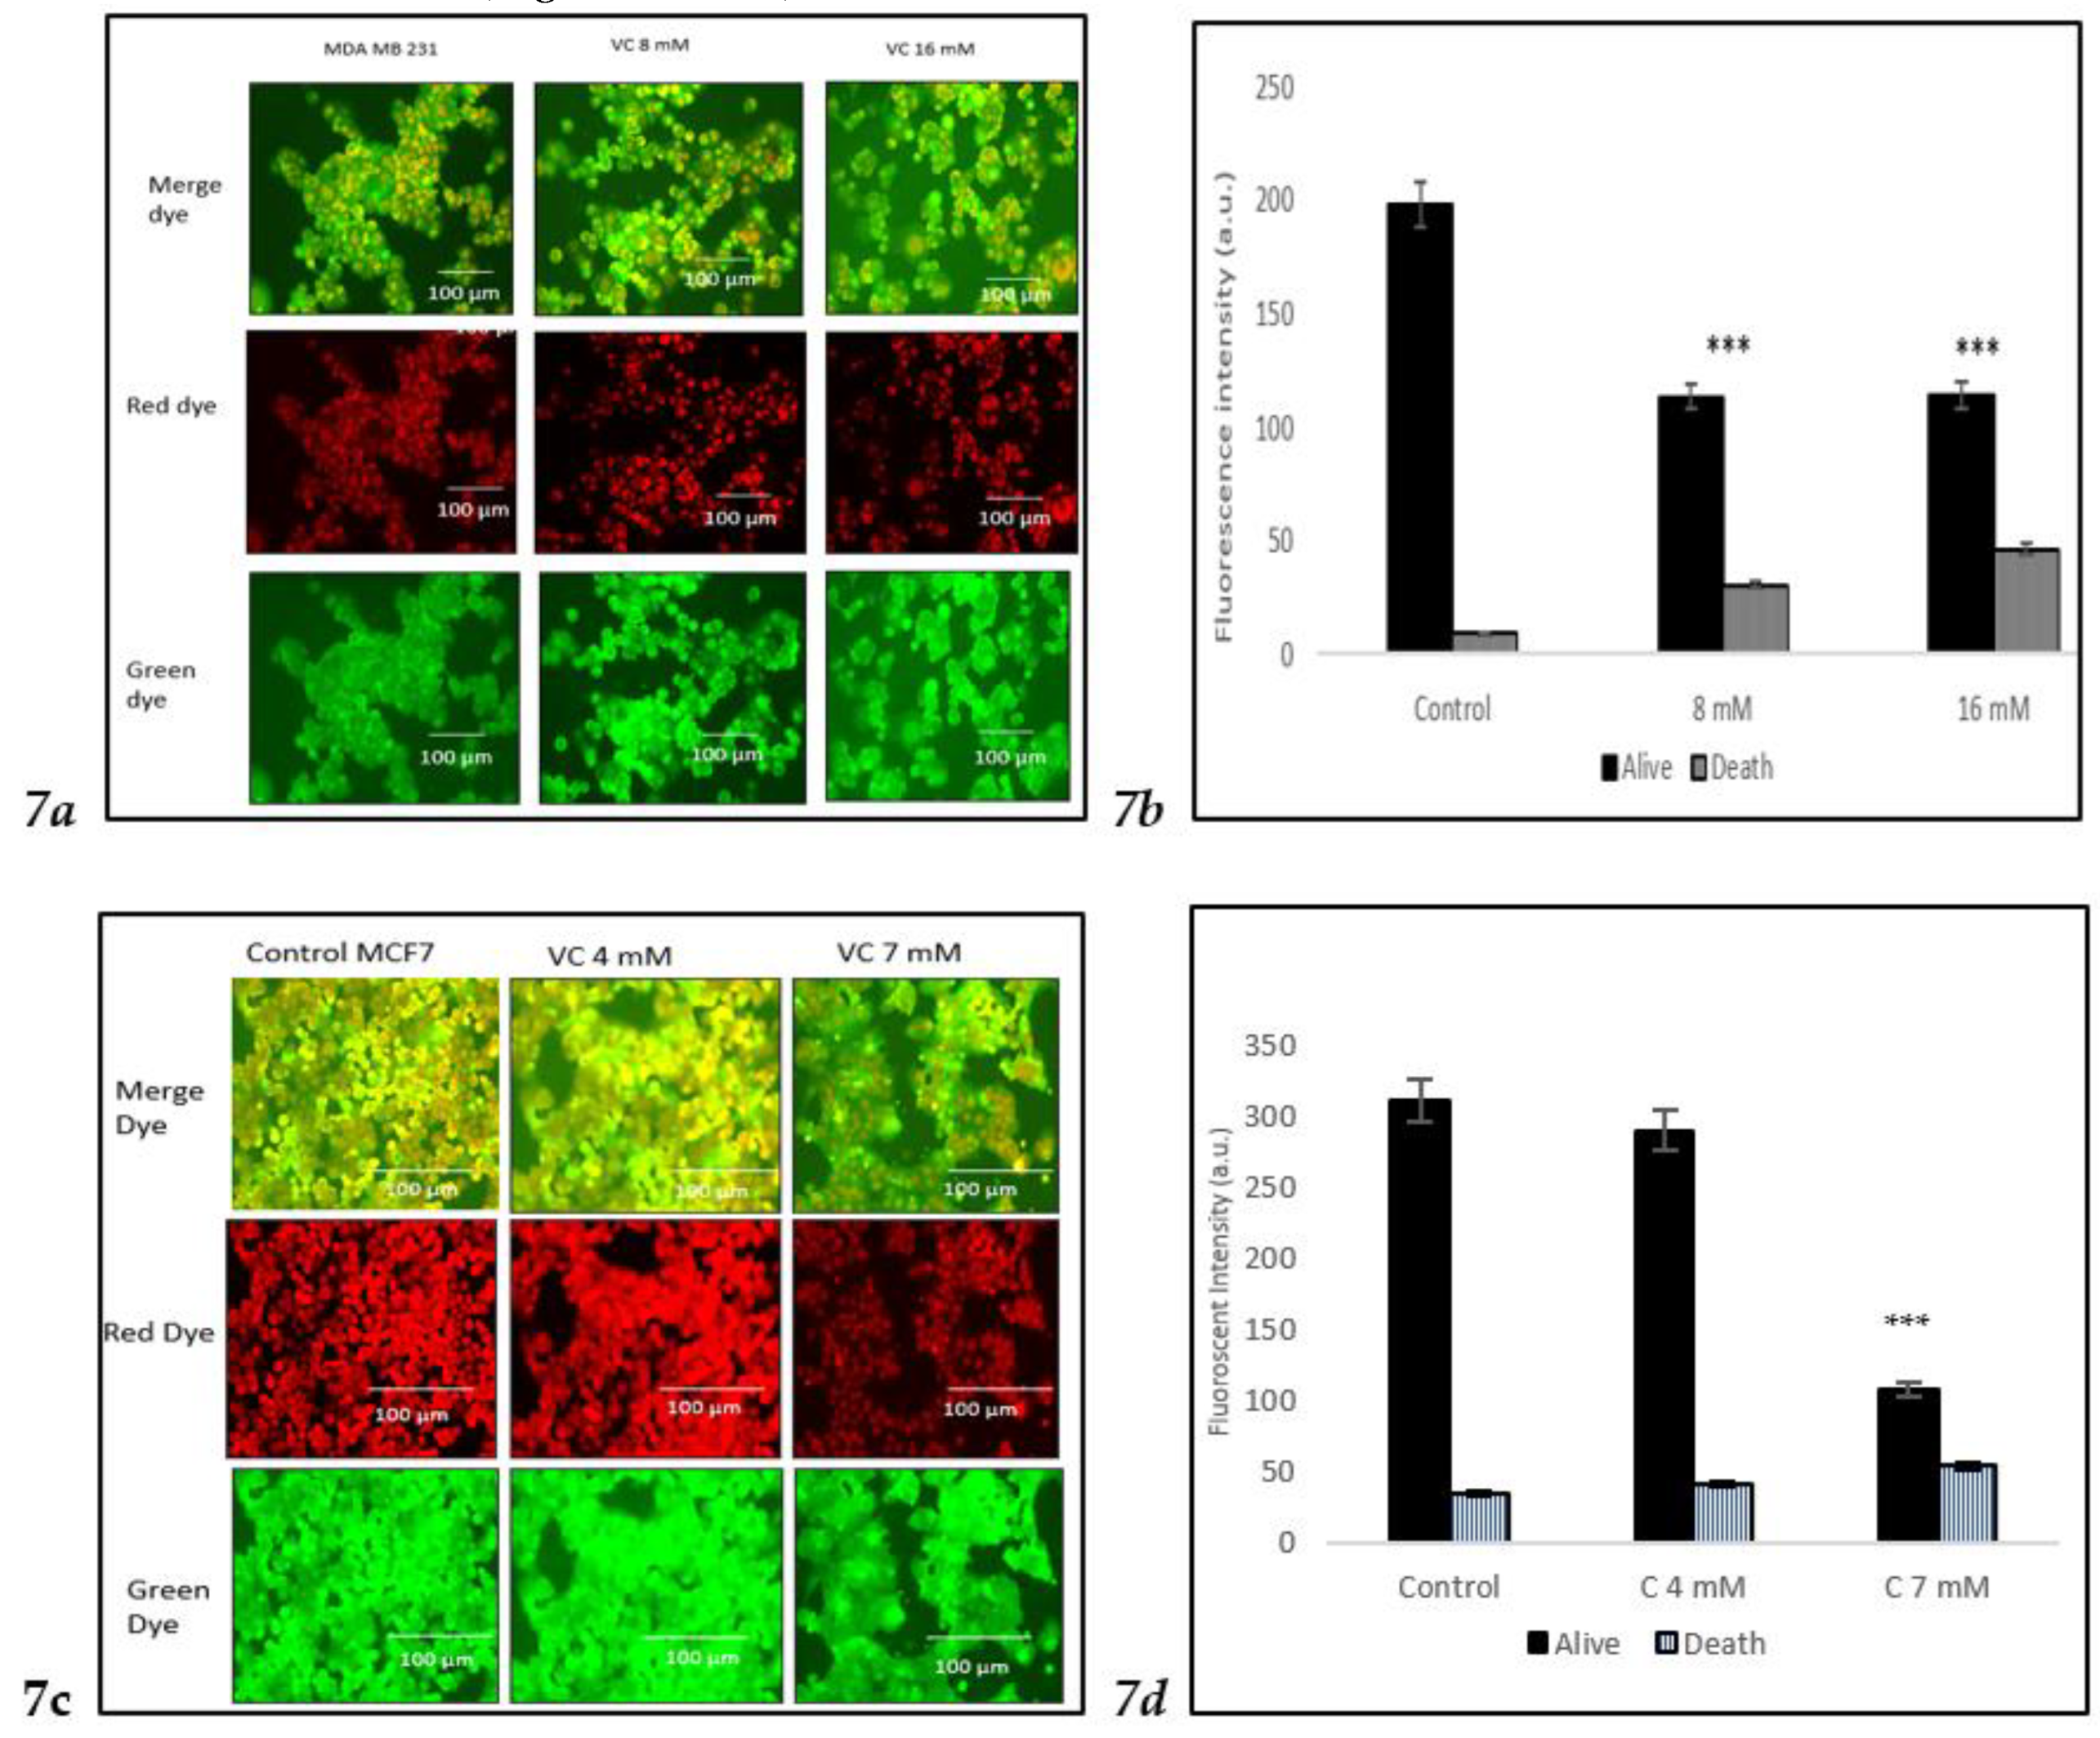
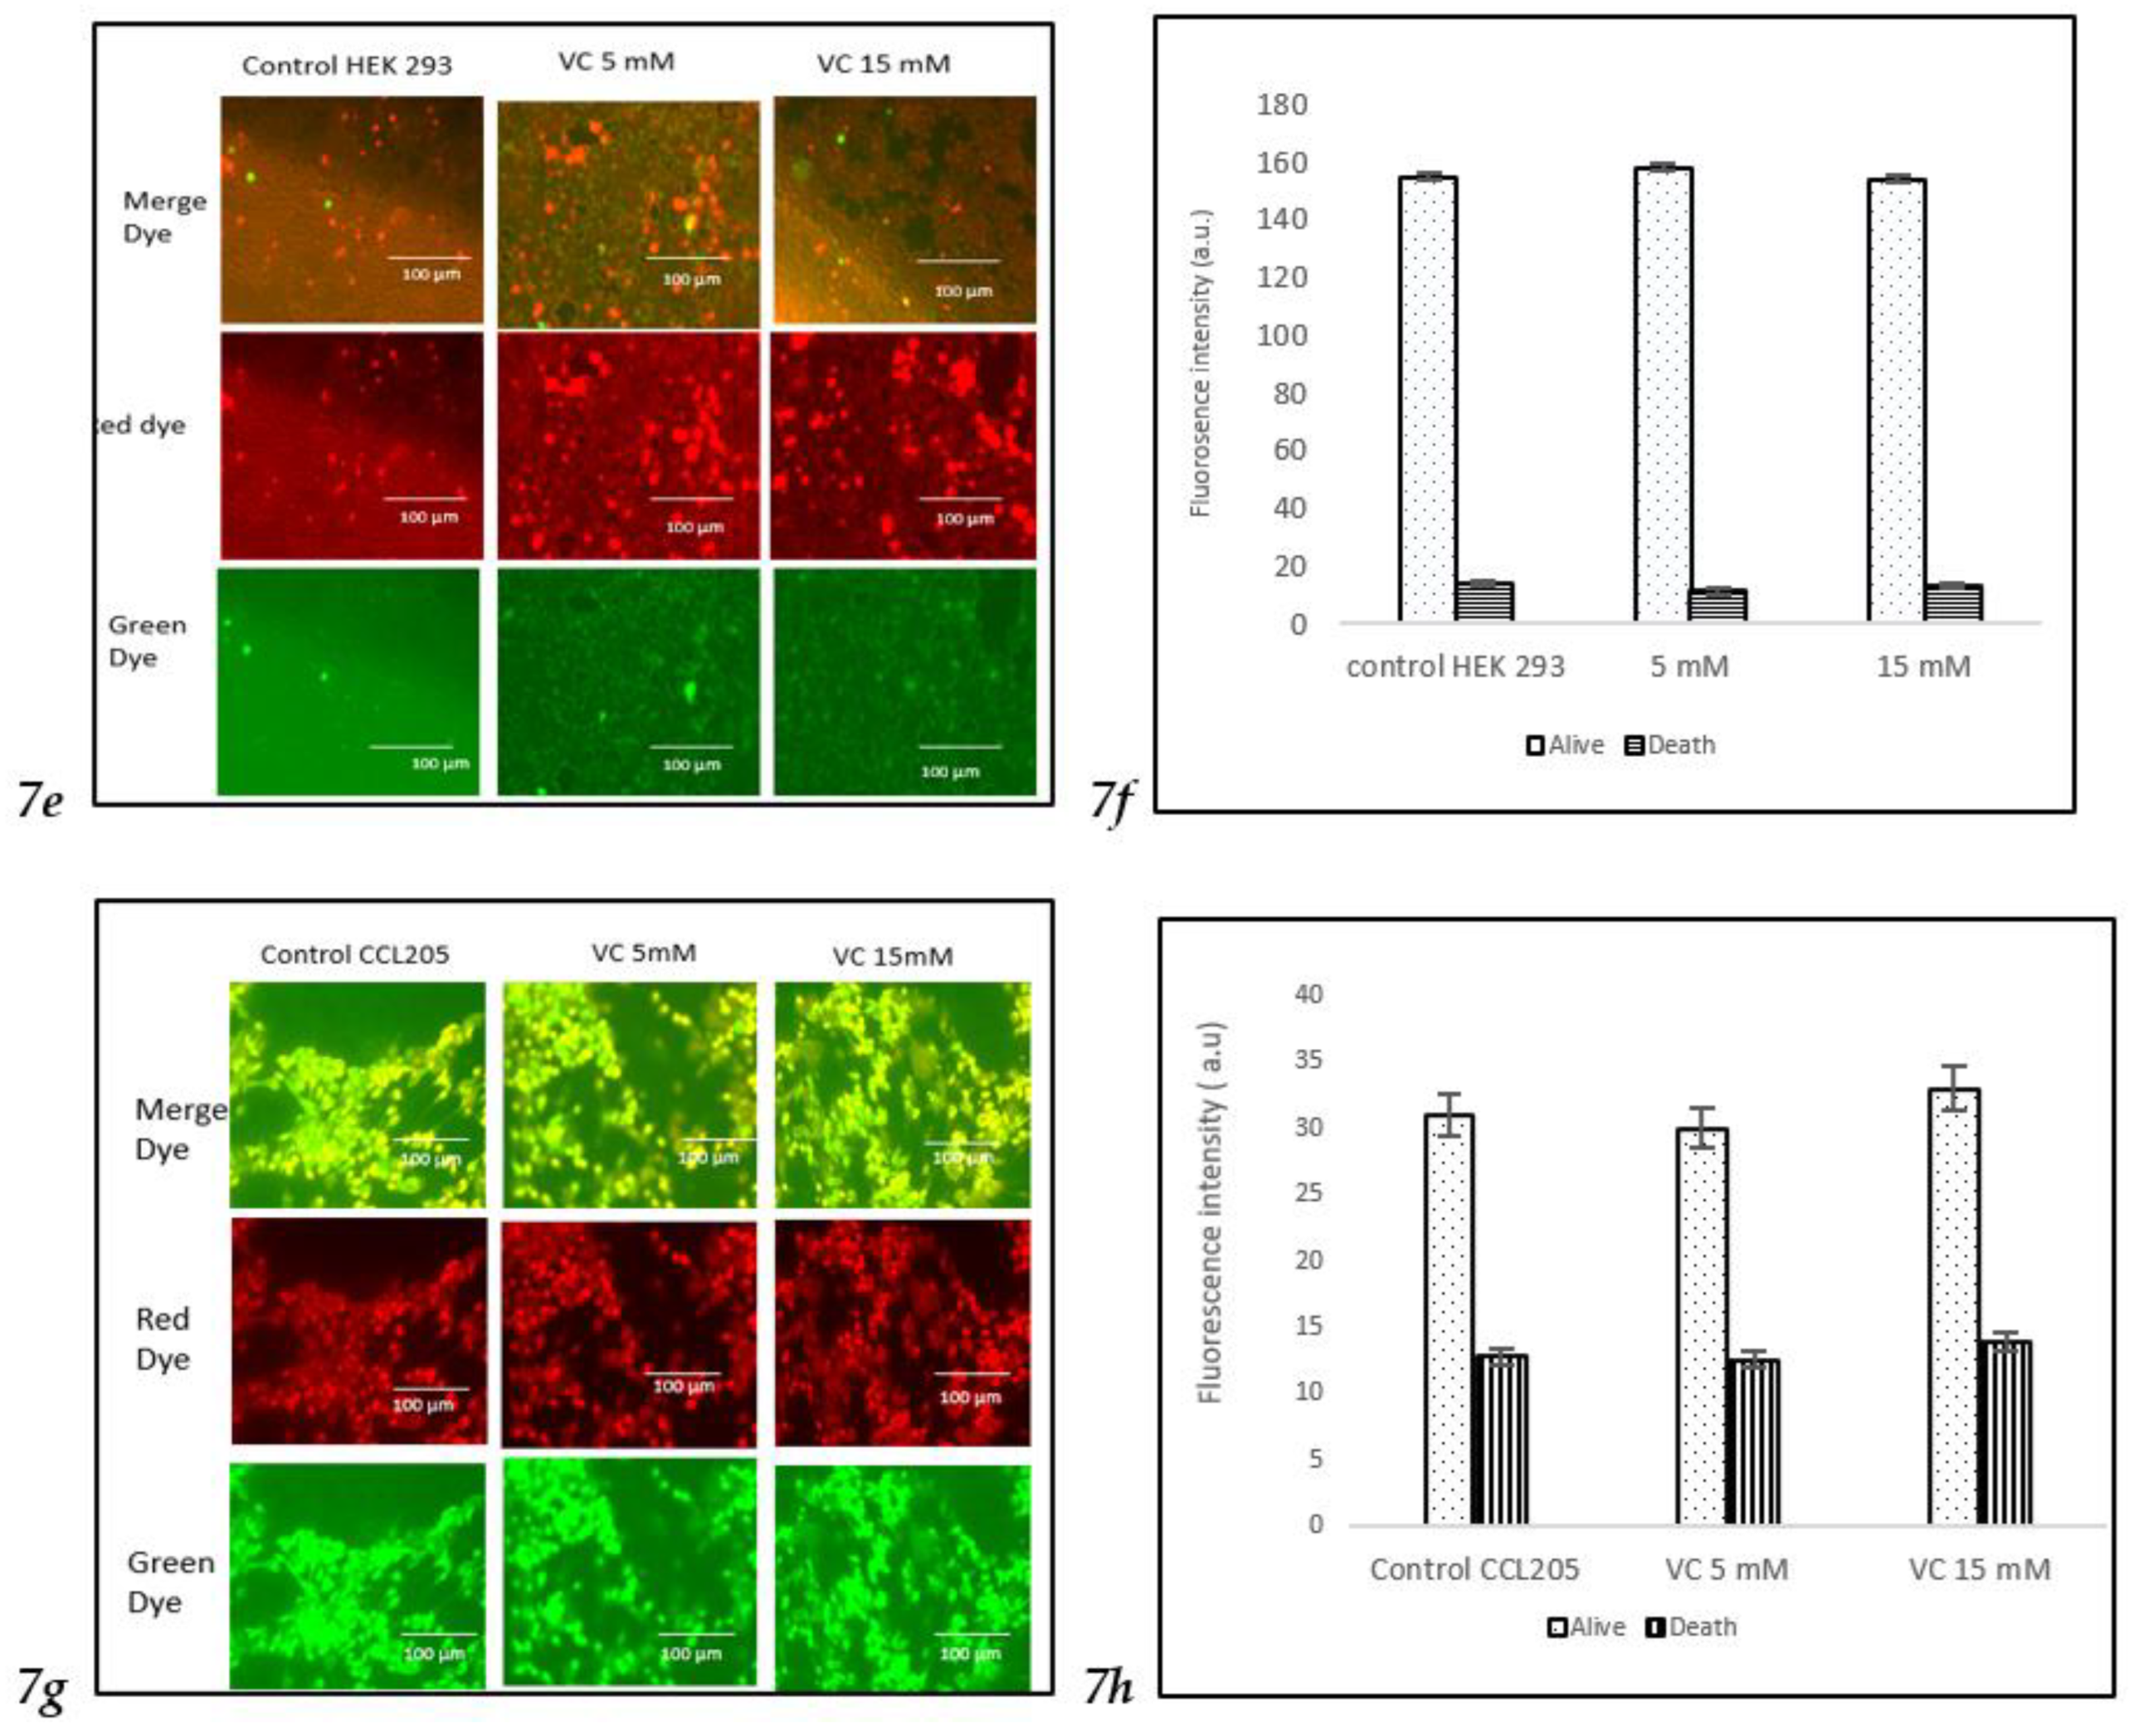
The viability of cells treated with two different concentrations of VC was assessed using the Nuclear-ID Red/Green cell staining method. Live cells were stained green, as the dye penetrated the cytoplasm of intact cell membranes, while dying or dead cells, with compromised membranes, were stained red. In the control group of MDA-MB-231, cells displayed a red or orange color when the red and green dye images were merged, indicating viable cells. Treatment of MD-MBA-231 with 16 mM VC led to the highest number of cell deaths, as evidenced by the yellow or green color observed after merging the red and green dyes (
Fig. 7a).
Fig. 7b presents a histogram showing the proportion of dead versus live cells in MDA-MB-231, analyzed using ImageJ software. To further evaluate VC's effects on various cell lines, MCF cells, along with non-cancerous HEK 293 kidney cells and CCL 205 lung cells, were also tested (
Figures 7c–
7h).
For HEK 293 and CCL 205 cells, the control group, as well as cells treated with 5 mM or 15 mM VC, displayed a similar proportion of live and dead cells, indicating that VC had no significant cytotoxic effect on these non-cancerous cell lines. The green fluorescence in both HEK 293 and CCL 205 cells was predominant, signifying high cell viability in both control and VC-treated groups (
Fig 7e-
7h).
These findings highlight VC’s selective cytotoxicity, with higher concentrations inducing cell death in cancerous MDA-MB-231 and MCF7 cells, while non-cancerous HEK 293 and CCL 205 cells remained largely unaffected. Scale bar indicated 100 µm Significant change in cells death due to VC treatment versus control. ***p<0.001, post hoc Newman-Keuls test.
3.8. Modulation of Cell Cycle Proteins
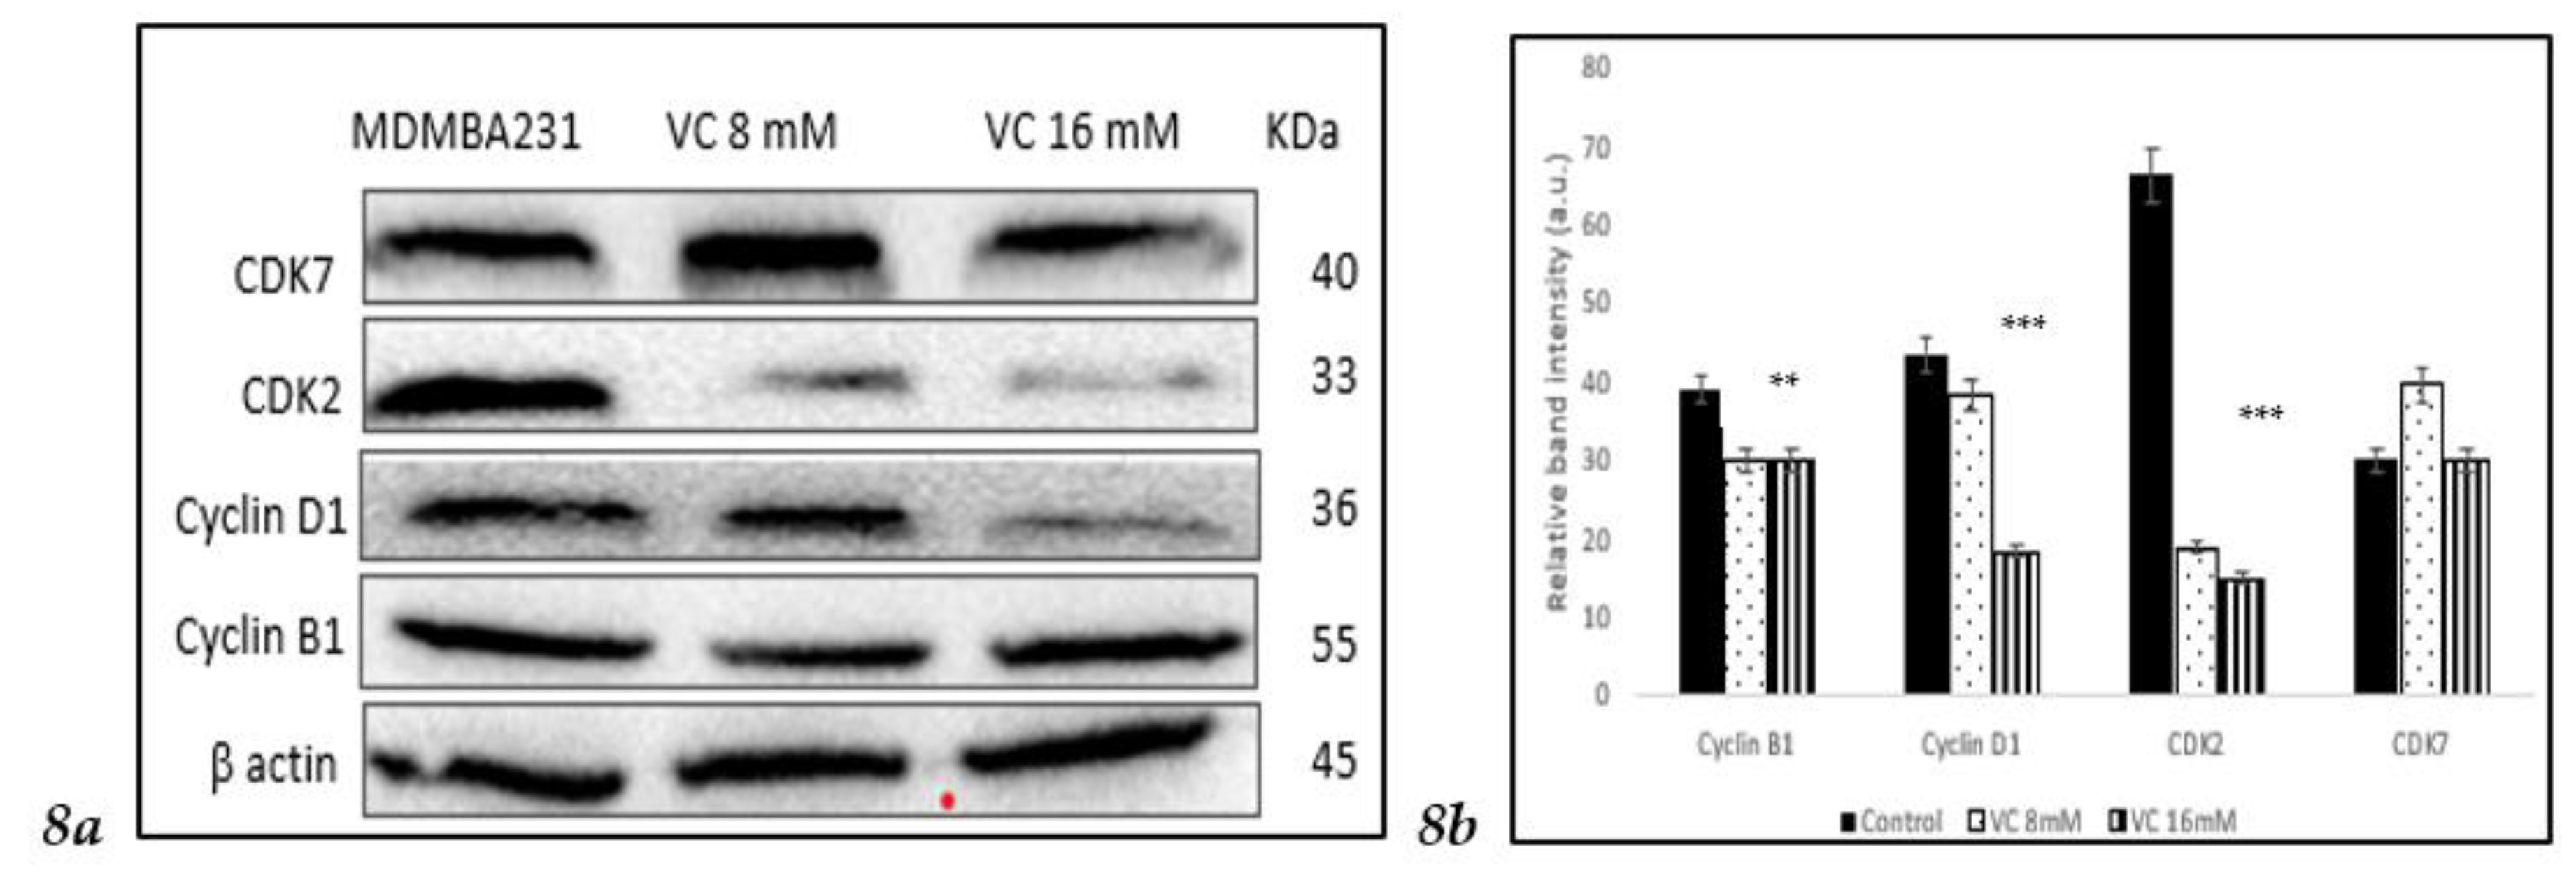
Inhibition of cell cycle regulatory proteins is considered an important strategy in the treatment of TNBC. Western blot analysis revealed a decrease in the band intensity of CDK2, cyclin B1, and cyclin D1 in MDA-MB-231, which play important roles in cell cycle regulation (
Fig. 8a).
Fig. 8 (b) displays a comparison of the changes in cell cycle proteins depicted as a histogram.
3.9. Inhibition of Matrix Metallo Proteinases
To determine if VC caused inhibition of cell migration and invasion associated with matrix metallo proteinases (MMP)-2 and -9, proteins that are involved in angiogenesis, Western blot analysis was performed in MDA-MB-231 (
Fig. 9a). Band intensity histogram
Fig. 9(b) showed the expression of MMP2 and MMP9 as compared to control.
3.10. Modulation of MDM2, -p53, and p21 pathways
To determine if VC regulated cellular pathway involved in DNA repair, cell cycle, apoptosis and angiogenesis, the interaction between p53 tumor suppressor protein was study in its interaction with oncogene mouse double minute 2 homolog (MDM2) using Western blot analysis. p21 gene codes for cyclin-dependent kinase inhibitor was upregulated along with p53. Band intensity histogram Fig 10b showed expressions of p53, p21, MDM2, and phosphatase and tensin homolog deleted on chromosome ten (pTEN)
Figure 10.
a Western blot analysis of p21, p53, pTEN, and MDM2 proteins. (b) Histogram represented the up regulation of p21, p53 and pTEN proteins while down regulation of MDM2 as compared to control. Significant change in protein expressions *** p< 0.001, post hoc Newman-Keuls test.
Figure 10.
a Western blot analysis of p21, p53, pTEN, and MDM2 proteins. (b) Histogram represented the up regulation of p21, p53 and pTEN proteins while down regulation of MDM2 as compared to control. Significant change in protein expressions *** p< 0.001, post hoc Newman-Keuls test.
3.11. Inhibition of p13k/Akt/mTOR pathway
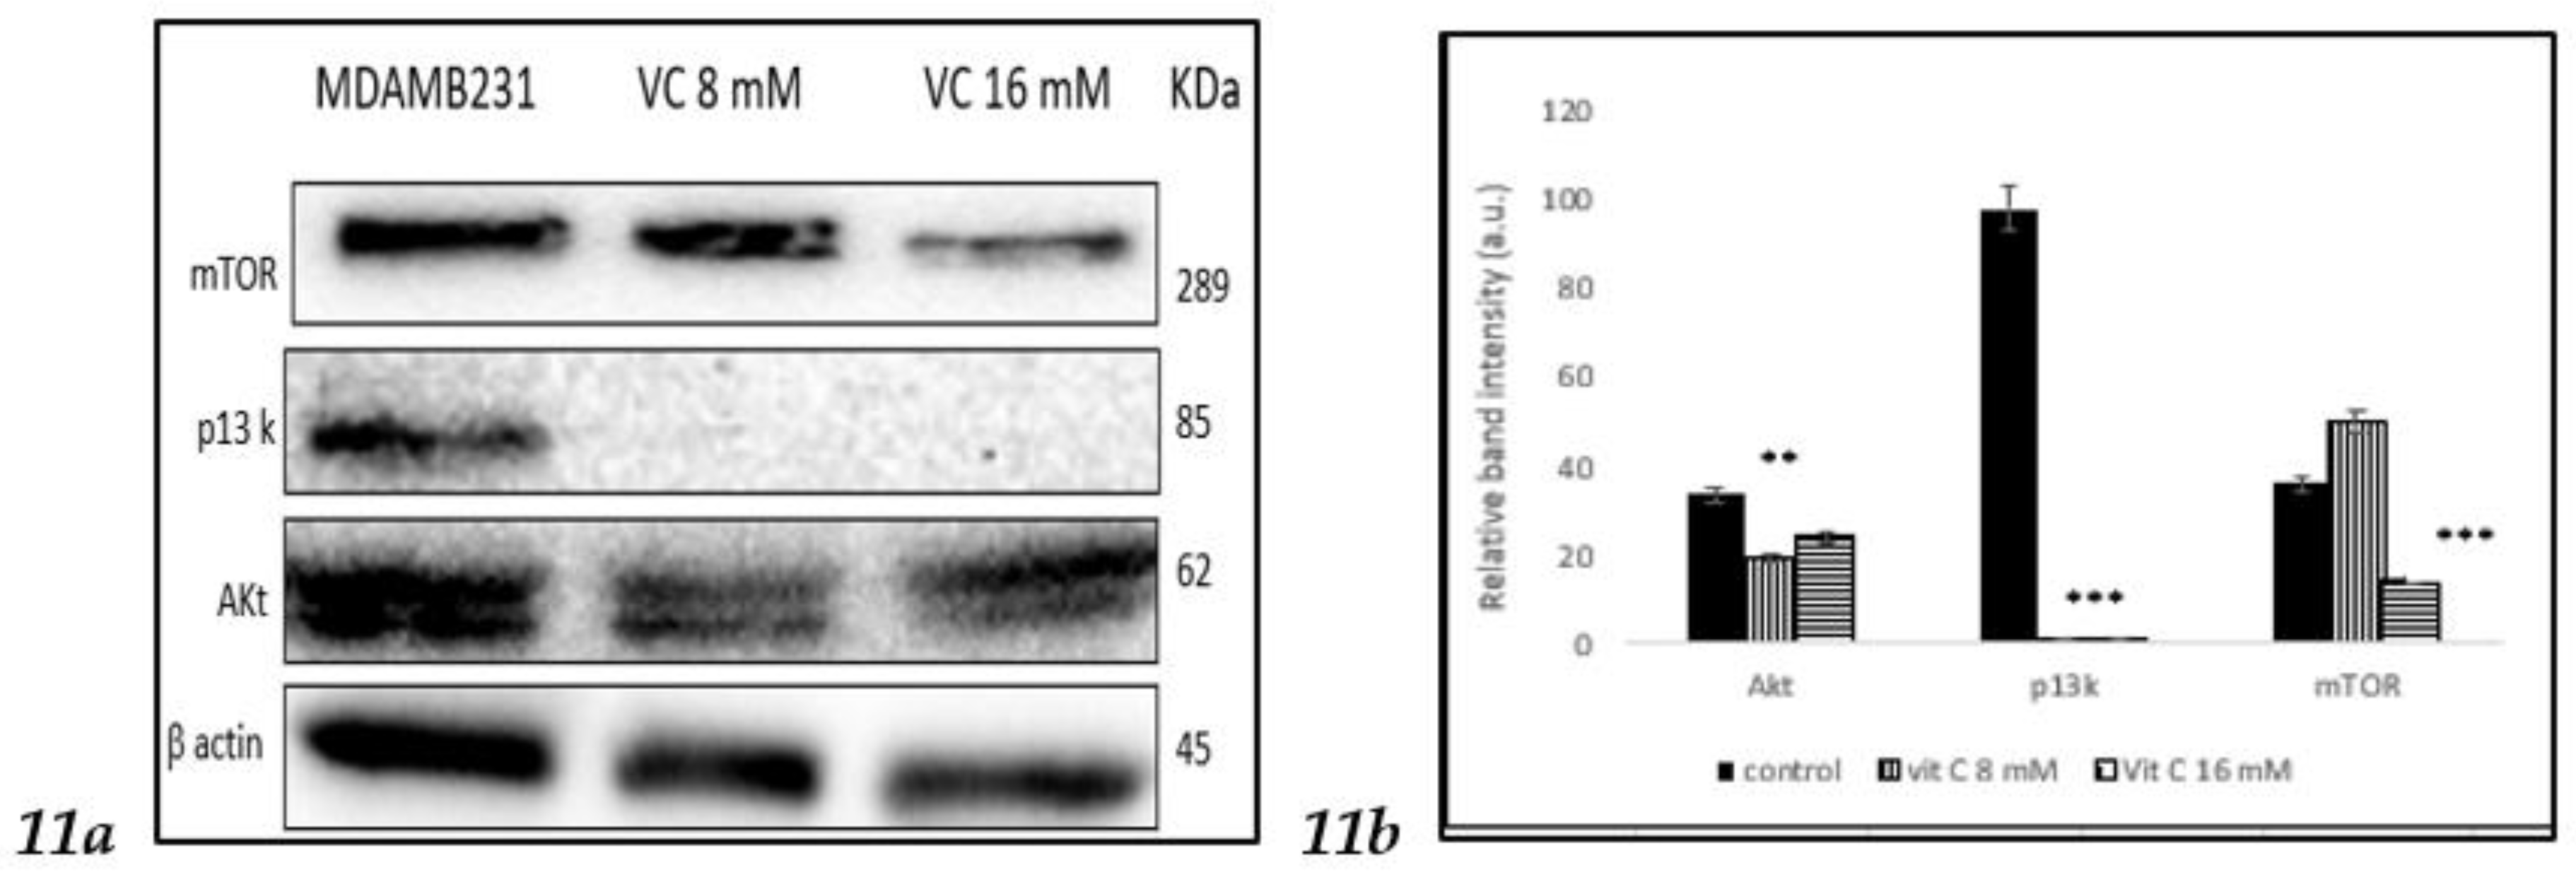
To determine if VC involved in the regulation of the phosphoinositide 3 kinase (p13k)/Akt /mammalian target of rapamycin (mTOR), a complicated intracellular pathway that leads to cell growth and cancer proliferation, the interaction was studied using Western blot assay. Band intensity histogram
Fig 11 (b) showed expressions of p13k, Akt and mTOR as compared to control.
4. Discussion
In the present study, a pharmacological dose of VC showed convincing evidence of killing MDA-MB-231, a TNBC model. At concentrations of 8 mM and 16 mM, VC killed approximately 20% and 50% of the cancer cells, respectively. Decreased cell viability, increased ROS formation, elevated levels of pro-apoptotic caspases -7, -8, and -9, decreased expression of cell cycle regulatory proteins CDK2, CDK7, cyclin B1, and cyclin D1, reduced expression of MMP2 and MMP9, increased expression of tumor suppressor genes such as p21, p53, PTEN, and decreased in the expressions of MDM2, p13k, Akt and mTOR were observed to confirm the effect of pharmacological dose of VC on TNBC.
To determine if a pharmacological dose of VC affects another breast cancer cell line, MCF7, an estrogen and progesterone receptor-positive, HER2/neu-negative breast cancer, was tested, along with non-cancerous cell lines such as kidney HEK 293 and lung CCL205.
Increased nuclear condensation of apoptotic cells was confirmed with Hoechst 33342 staining, showing fewer apoptotic cells at 8 mM compared to the higher 16 mM dose. Additionally, nuclear-ID red/green cell staining reaffirmed that VC at 8 mM and 16 mM induced cell death in MDA-MB 231. MCF showed also similar trend like MDA-MB-231 while non-cancerous HEK293 and CCL205 showed no change with VC treatment of 5 mM or 15 mM.
Evidence suggests that cancer cells generate more intracellular ROS, leading to higher apoptosis rates compared to normal cells [
16]. This study demonstrated that VC increased ROS levels, indicating the crucial role of ROS in TNBC cell apoptosis, as confirmed by H2DCF staining. Increased ROS in cancer cells is associated with modulation of key signaling proteins involved in cell cycle regulation, differentiation, tumor suppression, apoptosis, DNA damage, and the balance between pro-apoptotic and anti-apoptotic genes [
17,
18]. The upregulation of pro-apoptotic Bax protein and downregulation of anti-apoptotic Bcl2 protein suggest that VC treatment initiates favorable signaling pathways leading to apoptosis in MDA-MB-231 and MCF7 cells, while had no effect on HEK293 nor CCL205 cells.
Depletion of mitochondrial membrane potential was indicated by Rhodamine 123 staining and increased expression of Apaf-1. Apoptosis in mitochondria involves several key proteins, such as caspases -7, -8, and -9, highlighting their critical role in cancer cell apoptosis. The collapse of mitochondrial membrane potential results in the release of cytochrome C and other apoptosis-inducing factors into the cytosol, further inducing apoptosis [
19,
20].
Preventing angiogenesis is vital to hindering cancer invasion into surrounding tissues. Matrix-degrading enzymes like matrix metalloproteinases (MMPs)-2 and -9 play crucial roles in cancer invasion, metastasis, and tumorigenesis [
21]. A significant decrease in MMP-2 and -9 expression suggests that VC effectively inhibits invasion and metastasis of TNBC cells.
Cancer proliferation is often associated with altered cell cycle regulation; hence, targeting cell cycle proteins offers promising cancer chemotherapy strategies [
22]. Distinct cell cycle phases (G0/G1, S, G2, and M) are regulated by specific cyclin-dependent kinases (CDKs) [
23]. This study showed that significant downregulation of cyclin B1, cyclin D1, CDK2, and CDK7 expression strongly suggests that VC effectively inhibits MDA-MB-231 cells at different cell cycle phases. Additionally, increased p21 expression, a CDK inhibitor, confirmed that VC inhibits cell cycle proteins. p21 mediates p53-induced cell cycle arrest, and its induction by p53 and inhibition of CDKs are crucial of the p21's tumor-suppressive role [
24,
25].
In this study, VC was shown to decrease the expression of the p13k/Akt/mTOR pathway, which is often associated with resistance of cancer cells to the treatment using endocrine, HER2-directed, or cytotoxic therapies [
26]. Moreover, VC increased pTEN expression, which counteracts p13k activity. The loss of pTEN and mutations in p13k are among the most common aberrations seen in cancers, including breast cancer [
26,
27].
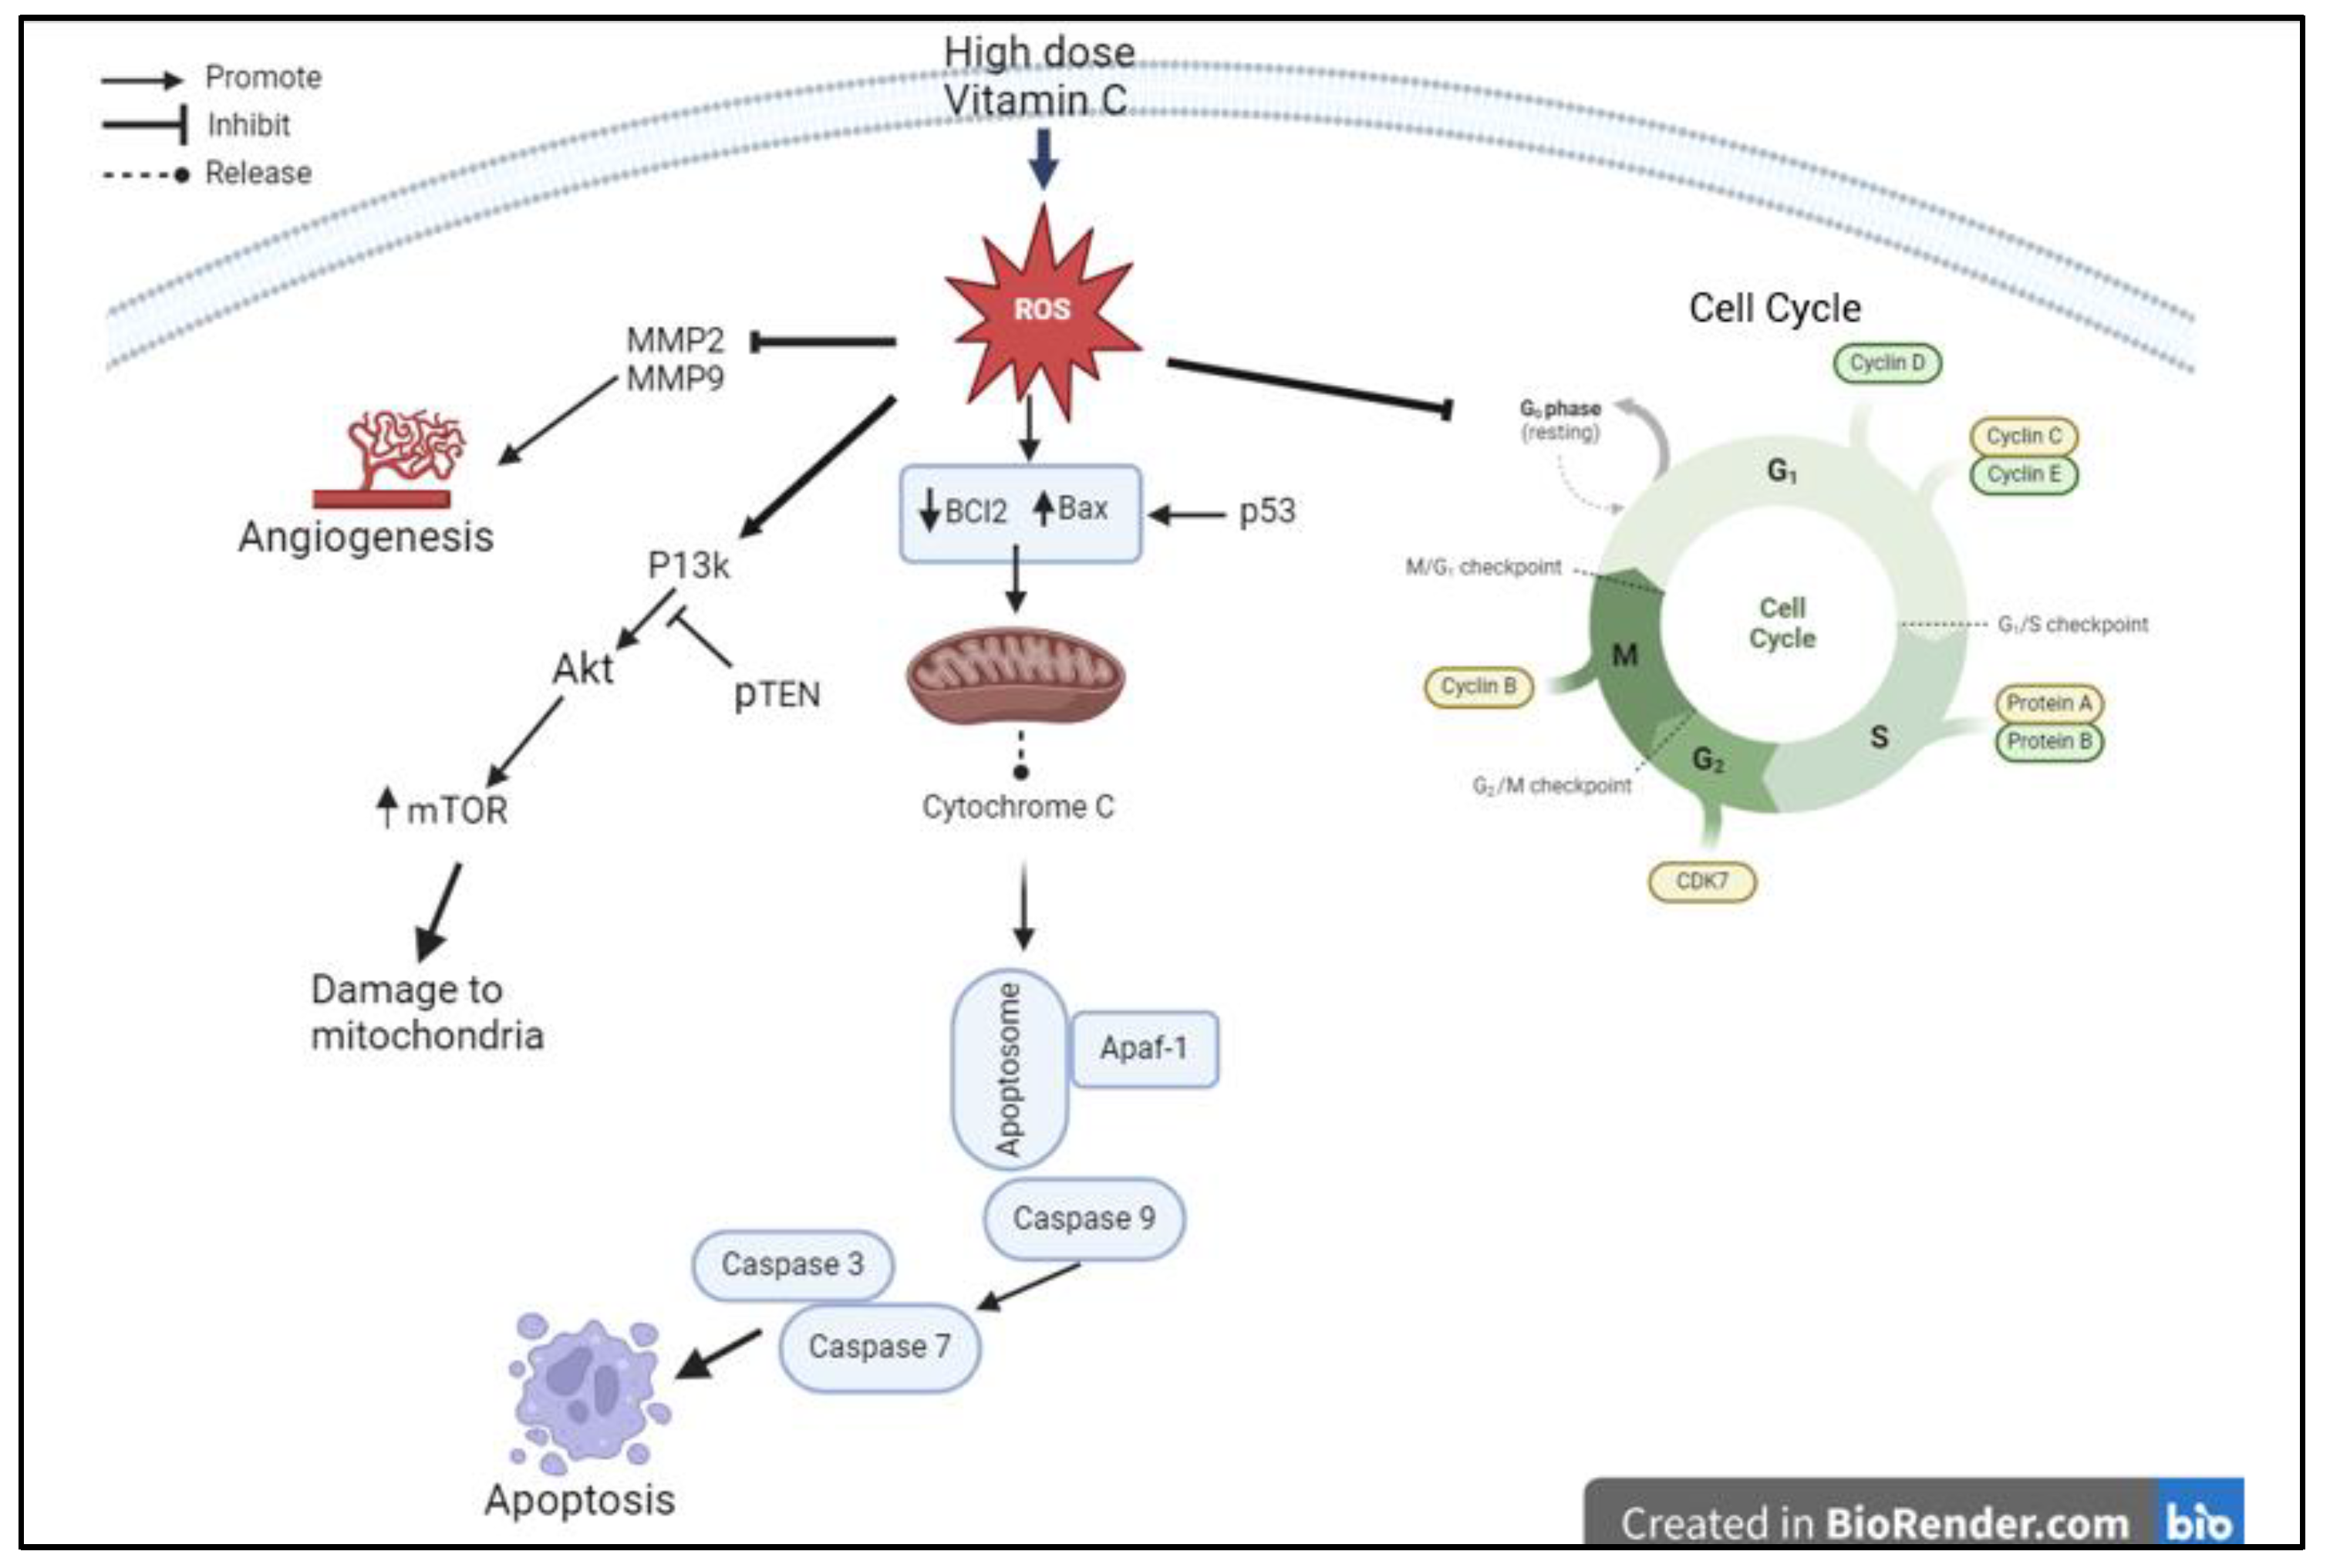
The results of this study suggest that high-dose pharmacological VC induces cell death and inhibits proliferation of cancerous cells by increasing intracellular ROS, modulating mitochondrial signaling pathways, inhibiting cell cycle progression proteins, preventing angiogenesis, and inhibiting the p13k/Akt/mTOR pathway. The higher dose of VC (16 mM) had a more profound effect than the lower dose (8 mM). This study may have significant implications for the potential application of pharmacological dose of VC in treating TNBC, by achieving higher efficacy and potency to kill the cancerous cells while have minimal side effects on normal cells.
Figure 12 illustrates the proposed mechanism of action by which high-dose VC exerts significant effects on cell cycle proteins, caspase-related proteins, inhibition of angiogenesis, and induction of apoptosis.
5. Conclusions
This study provides the first evidence that pharmacological concentrations of VC induce pro-apoptotic proteins such as Apaf-1 and caspases -7, and -9, while inhibiting cancer cell survival proteins like Bcl2, cyclins D and B1, CDK2, CDK7, Akt, PI3K, and mTOR. Additionally, VC increases the expression of tumor suppressor genes, including p53, p21, and pTEN. The results of the study will support further research, including animal studies and clinical trials, to assess the therapeutic potential of VC in treating TNBC.
The study also evaluated the effects of pharmacological VC in MCF-7 breast cancer cells, and in non-cancerous cells such as HEK 293 and CCL205. Like MDA-MB-231 cells, MCF-7 showed reduction in cells viabilities, inhibition of invasion and migration, induction of apoptosis, and reduction mitochondrial membrane potential, demonstrating that high-dose VC effectively kills breast cancer cells.
To assess potential harm to normal cells, high-dose VC was tested on non-cancerous cells. The data confirmed that VC had no cytotoxic effects on these normal cells, highlighting its selective action against cancer cells.
Author contributions
LLB did the conceptualization, investigation, writing, original draft, review, editing, and submission.
Ethical approval
Not applicable
Funding
This research was funded by Union University, Jackson, TN, USA
Institutional Review Board
Not applicable
Availability of Data and Materials
the data are available from the corresponding author upon reasonable request.
Conflict of Interest
the author declares no conflict of interest.
References
-
https://www.americanoncology.com/blogs/triple-negative-breast-cancer-symptoms-and-treatment [Access 2024 Sept 20].
- Dent, R.; Trudeau, M.; Pritchard, K.I.; Hanna, W.M.; Kahn, H.K.; Sawka, C.A.; Lickley, L.A., Rawlinson, E.; Sun, P.; Narod, S.A. Triple-Negative Breast Cancer: Clinical Features and Patterns of Recurrence. Clinical Cancer Research 2007, 13, 4429-4434. [CrossRef]
- Spano, D.; Heck, C.; De Antonellis, P.; Christofori, G.; Zollo, M. Molecular Networks that Regulate Cancer Metastasis. Semin Cancer Biol 2012, 22(3), 234-249. [CrossRef]
- Theossiou, T.A.; Ali, M.; Grigalavicius, M.; Grallert, B.; Dillard, P.; Schink, K.O.; Olsen, C.E; Walchli, S.; Inderberg, E.M.; Kubin, A. Simultaneous defeat of MCF7 and MDA-MB-231 resistance by a hypericin PDT-tamoxifen hybrid therapy. NPJ Breast Cancer 2019, 5, 13. [CrossRef]
- Padayatty, S.J.; Levine, M. Vitamin C Physiology: the Known and the Unknown and Goldilocks. Oral Disease 2016, 22(6), 463-493.
- Cameron, E.; Pauling, L. Supplemental Ascorbate in the Supportive Treatment of Cancer: Prolongation of Survival Times in Terminal Human Cancer. PNAS 1976, 73, 3685-3689. [CrossRef]
- Shenoy, N.; Creagan, E; Witzig, T. Ascorbic Acid in Cancer Treatment: Let the Phoenix Fly. Cancer Cell 2018, 34(5), 700-706. [CrossRef]
- Cantley, L.; Yun J. Intravenous High-Dose Vitamin C in Cancer Therapy https//www.cancer.gov/research/key-initiatives/ras/ras-central/blog/2020/Yun-Cantley-vitamin-C. [Access 2021 February 24].
- Choi, Y.K.; Kang, J.; Han, S.; Kim, Y.R.; Jo, J.; Kang, Y.W.; Choo, D.R.; Hyun, J.W.; Koh, Y.S., Kang, H.K. L-ascorbic acid inhibits breast cancer growth by inducing IRE/JNK/CHOP-related endoplasmic reticulum stress-mediated p62/SQSTM1 accumulation in the nucleus. Nutrients 2020, 12, 1351.
- Gan, L.; Camarena, V.; Mustafi, S.; Wang, G. Vitamin C inhibits triple-negative breast cancer metastasis by affecting the expression of YAP1 and synaptopodin 2. Nutrients 2019, 11, 2997. [CrossRef]
- Mussa, A., Idris, R.A.M.; Ahmed, N.; Ahmad, S.; Yean, C.Y.; Rahman, W.F.W.A.; Lazim, N.M.’ Hajissa, K.; Mokhtar, N.F.; Mohamud, R.; Hassan, R. High-dose vitamin C for cancer therapy. Pharmaceuticals 2022, 15, 711. [CrossRef]
- Soule, H.D.; Vazquez, J.; Long, A.; Albert, S.; Brennan, M. "A human cell line from a pleural effusion derived from a breast carcinoma". Journal of the National Cancer Institute. 1973, 51 (5), 1409–1416. [CrossRef]
- Lacroix, M.; Leclercq, G. Relevance of breast cancer cell lines as models for breast tumors: an update. Breast Cancer Res Treat. 2004, 83(3), 249-89.
- Mondal, A.; Bennett, L.L. Resveratrol enhances the efficacy of sorafenib mediated apoptosis in human breast cancer MCF7 cells through ROS, cell cycle inhibition, caspase 3 and PARP cleavage. Biomed Pharmacotherapy 2016; [CrossRef]
- Bennett, L.L.; Mondal, A. Curcumin and afatinib synergistically inhibit growth of human osteosarcoma cells by inhibition of matrix metallo proteinases, mitogen activated kinases 1-4, and reactive oxygen species. Journal of Pharmacy and Drug Development 2021, 3(1).
- Simon, H.’ Jay-Yehia A.; Levi-Schaffer, F. Role of reactive oxygen species in apoptosis induction. Apoptosis 2000, 5, 415-418. [CrossRef]
- Mates, J.M.; Sanchez-Jinenez, F.M. Role of reactive oxygen species in apoptosis: implications for cancer therapy. Int J Biochem Cell Biol 2000,32, 157-170.
- Zhang, T., Brazhnik, P.; Tyson, J.J. Exploring the mechanisms of the DNA-damage response: p53 pulses and their possible relevance to apoptosis. Cell Cycle 2007, 6, 85-94. [CrossRef]
- Kamalabadi-Farahani, M.; Najafabadi, M.R.H.; Jabbarpour Z. Apoptotic resistance of metastatic tumor cells in triple negative breast cancer: roles of death receptor-5. Asian Pac J Cancer Prev. 2019, 20, 1743-1748. [CrossRef]
- Yang, Y.; Liu, X.; Bhalla k. Prevention of apoptosis by Bcl-2 release cytochrome C from mitochondria blocked. Science 1997, 275, 1129-1132. [CrossRef]
- Wang R.X.; Chen, S.; Huang, L.; Shao, Z.M. Predictive and prognostic value of matrix metalloproteinase (MMP)-9 in neoadjuvant chemotherapy for triple negative breast cancer patients. BMC Cancer 2018, 18, 909. [CrossRef]
- Otto, T.; Sicinski, P. Cell cycle proteins as promising targets in cancer therapy. Nat Rev Cancer 2017, 17, 93-115. [CrossRef]
- Engeland, K. Cell cycle regulation: p53-p21-RB signaling. Cell Death & Differentiation 2022, 29, 946-960. [CrossRef]
- Warfel, N.A.; El-Deiry W.S. p21WAF1 and tumorigenesis: 20 years after. Curr Opin Oncol 2013, 25, 52-58.
- Paplomata, E.; O’Regan, R. The p13k/AKT/mTOR pathway in breast cancer: targets, trials and biomarkers. Ther Adv Med Oncol 2014, 6(4), 154-166.
- Cancer Genome Atlas Network. Comprehensive molecular portraits of human breast tumors. Nature 2012, 490, 61-70.
- Maehama T., Dixon J. The tumor suppressor, PTEN/MMAC1, dephosphorylates the lipid second messenger, phosphatidylinositol 3,4,5-trisphosphate. J Biol Chem 1998, 273, 13375–13378. [CrossRef]
|
Disclaimer/Publisher’s Note: The statements, opinions and data contained in all publications are solely those of the individual author(s) and contributor(s) and not of MDPI and/or the editor(s). MDPI and/or the editor(s) disclaim responsibility for any injury to people or property resulting from any ideas, methods, instructions or products referred to in the content. |
© 2024 by the authors. Licensee MDPI, Basel, Switzerland. This article is an open access article distributed under the terms and conditions of the Creative Commons Attribution (CC BY) license (http://creativecommons.org/licenses/by/4.0/).
