Submitted:
15 October 2024
Posted:
15 October 2024
You are already at the latest version
Abstract
Additive Manufacturing (AM), also know as 3D Printing (3DP), is a widely used layer-by-layer manufacturing process, it is evolving rapidly both in research and industry. Among all AM methods, Material Extrusion (ME) is one of the most popular techniques. Based on ME, another new AM method is developed, which is Low-cost Metal Material Extrusion (LCMME). In this newly developed process, pure metallic parts could be fabricated after sintering the metal infused additively manufactured parts. Both AM and sintering process parameters will have influence on the quality of the final pure metallic parts. In this research, several statistics methods were used to analyze the data gotten from the experiment. Then two Machine Learning (ML) algorithms were used to predict the Surface Roughness (SR) of the final specimens. Additionally, the results show that the neural network (NN) is more accurate than the support vector regression (SVR) on prediction.
Keywords:
Additive Manufacturing (AM)
; Surface Roughness (SR)
; Low-cost Metal Material Extrusion (LCMME)
; Machine Learning (ML)
1. Introduction
Additive manufacturing (AM) or 3D Printing (3DP), is a widely used technology to fabricate parts layer-by-layer from the computer-aided design (CAD) model [1]. There are seven different AM categories: material extrusion (ME), vat photopolymerization (VAT), powder bed fusion (PBF), direct energy deposition (DED), sheet lamination (SL), material jetting (MJ), and binder jetting (BJ) [2]. ME is the most widely used AM technology because of its numerous advantages such as using less material and time to produce complex parts, low-cost, environmental friendliness, etc [3,4,5]. ME already has many applications in several areas, such as the food industry, medicine, aerospace, and so on [6,7,8]. Also, ME is used in metal object manufacturing now [9].
However, Metal ME is a challenge because the working temperature is a difficult point [3]. The working temperature of most ME 3D printers varies from 200 to 280°C and the melting points of most metal materials are much higher. In recent years, new metal-infused polymer filaments have been developed as a feedstock material for ME and Low-cost Metal Material Extrusion (LCMME) is the new method to fabricate parts by using this kind of new material [10].
Figure 1 is the sketch of LCMME. The first several steps are the same as traditional AM, but after AM process, the parts fabricated by using metal-infused polymer filament will be sintered to melt out the internal polymer. And then the sintered part will be made from pure metal.
In Figure 2, the process of sintering is introduced. In the sintering process, the sintering temperature is lower than the melting temperature [11]. As the temperature increases, the plastic melts out and the metal powders gather together to form pure metal parts.
Surface Roughness (SR) is the deviations in the direction of the normal vector of a real surface from its ideal form [12]. It is an important mechanical property of metal. The SR of parts manufactured in AM process has been studied in some works. Ciracì et al. did research on the impact of SR in several metallic systems [13]. Due to the fabrication-induced surface roughness, most metallic systems suffer from some degree of inhomogeneity. He et al. reviewed the influencing factors and related modeling methods [14]. This work aims to generate a comprehensive understanding of the turned surface roughness in theoretical modeling. Alfieri et al. studied the influence of SR in AM applications [15].
Machine Learning (ML) is a subset of artificial intelligence and it can be used to predict the mechanical properties of AM fabricated parts [16]. In LCMME, ML has been used to do dimensional accuracy prediction [3]. ML has plenty of applications in AM [17,18,19]. However, there is no research on using ML to predict and improve SR of LCMME fabricated parts. In this study, 150 cuboid samples were made by LCMME. The influence of different manufacturing parameters was analyzed and two ML algorithms were generated to predict the SR values.
2. Materials and Methods
2.1. Material and Equipment
In this research, the samples were fabricated by bronze-PLA filament and Figure 3 shows the metal-composite part as a CAD model, 3D printed and after sintering. Figure 4 is the micro view of the final pure metallic parts. The SR of pure bronze part after sintering was measured by a SJ-210 SR Tester and Figure 5 is the SR tester used in this research.
2.2. Data Preparation
There are several SR parameters, such as Ra, Rms, Rz, Rv, and so on [20]. In this research, Ra is used since its accuracy and simplicity [21]. Ra is the arithmetical mean deviation of the assessed profile [20]; the equation is shown below:
Where lr is the measured length. Figure 6 shows the definition of Ra.
In this research, there are five different manufacturing parameters, which are:
- Layer Thickness (LT): the height of each layer during the printing process;
- Sintering Temperature (ST): the temperature to sinter the bronze-PLA parts;
- Ramp Ratio (RR): the temperature increasing ratio from room temperature to ST;
- Nozzle Temperature (NT): the temperature of the printing nozzle during the 3DP process;
- Printing Speed (PS): the moving speed of the nozzle during the 3DP process.
Table 1 shows the units and values of different manufacturing parameters.
Figure 7 is the top, front, and side views of the sample and Table 2 shows two examples of the manufacturing parameters and SR values in this research. In this research, the data are divided into three groups, which are SR_Top, SR_Front, and SR_Side. From Table 2, these two samples have different manufacturing parameters, and the SR values of different surfaces are different either.
3. Statistical Methods Results
In this subchapter, the statistical and ML algorithms used in this part of research are introduced. Also, the results are shown.
3.1. ANOVA
ANOVA analysis has two main applications in this section. The first is to determine for each single cubic sample if all surfaces have the same SR values or not. The second is to find if all manufacturing parameters have influence on SR values or not.
A one-way ANOVA model is developed to determine whether the SR is the same in different surfaces. The following hypothesis is set:
H0: μSR_Top = μSR_Front =μSR_Side
Ha: at least one group of SR values is different
The result of this one-way ANOVA result is shown in Table 3. F crit < F, which means the H0 is rejected. Thus, the three groups of surfaces do not have the same SR values.
However, during the data collection, the researcher found that the SR_Front and SR_Side are similar. So the research group did another one-way ANOVA model is developed to determine if the SR_Front and SR_Side of a part are the same or not. The following hypothesis is set:
H0: μSR_Front =μSR_Side
Ha: μSR_Front ≠μSR_Side
The result of this one-way ANOVA result is shown in Table 4. F crit > F, which means the H0 is not rejected. Thus, the two groups of surfaces have the same SR values.
Thus, the three groups of data can be simplified into two groups, which are SR_Top and SR_Edge (including SR_Front and SR_Side). Then, further ANOVA analyses were generated to find if all manufacturing parameters have influence on SR values or not. Table 5 and Table 6 show the results.
The results from the above two tables show that the P-values of ST, NT, and RR on SR_Top are smaller than 0.001, which means that these three parameters have influence on SR_Top. Besides, All parameters on SR_Edge have p-value numbers smaller than 0.01. Thus, in manufacturing process, all parameters will affect the SR_Edge values.
From the results of all ANOVA analysis, The data can be simplified into two groups, which are SR_Top and SR_Edge. And in ML algorithms, only three parameters will be used as independent variables in SR_Top analysis. All five parameters will be used as independent variables in SR_Edge analysis.
3.2. Results of ML Algorithms
In this research, Support Vector Regression (SVR) and Neural Network (NN) are used to predict the SR results of LCMME fabricated parts. SVR could provide flexibility to define the error in the model whether it is acceptable or not. NN uses a set of network layers to translate an input into an output. These two methods have been proven to be effective tools in real-value estimation.
In this research, Mean Square Error (MSE) metric is used to evaluate the performance of each algorithm. Table 7 shows the MSE results. It shows that NN behaves better in predicting the SR of LCMME fabricated parts.
4. Conclusions
In AM manufacturing process, SR is an important value in quality evaluation. In this research, as a new metal AM technique, LCMME is developed to fabricate pure metal parts in low temperature situation and without laser. Two different ML algorithms are used to do prediction on SR of LCMME fabricated parts. And the following conclusions are generated in this research:
- The top side of the LCMME fabricated parts has different SR values with the edge sides.
- Only three manufacturing parameters have influence on the SR_Top, which are ST, NT, and RR.
- All five parameters will affect the SR_Edge values.
- The MSE of NN is smaller than SVR in overall.
5. Future Work
In this research, the influence of different manufacturing parameters are evaluated by ANOVA analysis. Besides, two ML methods to predict the SR values of LCMME fabricated parts. In the further research, more parameters, such as flow rate, build-plate temperature, fan speed, and so on, could be added to increase the accuracy of prediction. Also, different materials could be used to do fabrication by this newly developed method.
Author Contributions
Conceptualization, Z.Z.; methodology, Z.Z.; software, Z.Z.; validation, Z.Z.; formal analysis, Z.Z.; investigation, Z.Z.; resources, Z.Z.; data curation, Z.Z.; writing—original draft preparation, Z.Z.; writing—review and editing, Z.Z.; visualization, Z.Z.; supervision, Z.Z.; project administration, Z.Z.; funding acquisition, Z.Z. All authors have read and agreed to the published version of the manuscript.
Funding
This research received no external funding.
Institutional Review Board Statement
Not applicable.
Informed Consent Statement
Not applicable.
Data Availability Statement
Not applicable.
Acknowledgments
This research has been made possible with the help provided by the Tennessee Tech University and Shandong Agriculture And Engineering University.
Conflicts of Interest
The authors declare no conflicts of interest.
References
- Zhang, Zhicheng, Ismail Fidan, and Michael Allen. "Detection of material extrusion in-process failures via deep learning." Inventions 5.3 (2020): 25. [CrossRef]
- ISO - ISO/ASTM 52900:2015 - Additive manufacturing — General principles —Terminology. https://www.iso.org/standard/69669.html (accessed 16 August 2021).
- Zhang, Zhicheng, et al. "Prediction of Dimensional Changes of Low-Cost Metal Material Extrusion Fabricated Parts Using Machine Learning Techniques." Metals 11.5 (2021): 690. [CrossRef]
- Attaran, Mohsen. "The rise of 3-D printing: The advantages of additive manufacturing over traditional manufacturing." Business Horizons 60.5 (2017): 677-688.
- Zhang, Zhicheng. Detection of the Additive Manufacturing In-Process Failures via Deep Learning. Diss. Tennessee Technological University, 2019.
- Choton, Skarma, et al. "Extrusion technology and its application in food processing: A review." The Pharma Innovation Journal 9.2 (2020): 162-168.
- Ravi, Prashanth. "Understanding the relationship between slicing and measured fill density in material extrusion 3D printing towards precision porosity constructs for biomedical and pharmaceutical applications." 3D printing in medicine 6.1 (2020): 1-10.
- Najmon, Joel C., Sajjad Raeisi, and Andres Tovar. "Review of additive manufacturing technologies and applications in the aerospace industry." Additive manufacturing for the aerospace industry (2019): 7-31.
- Mohammadizadeh, Mahdi, et al. "Mechanical and Thermal Analyses of Metal-PLA Components Fabricated by Metal Material Extrusion." Inventions 5.3 (2020): 44.
- Gong, Haijun, et al. "Comparison of Stainless Steel 316L Parts Made by FDM-and SLM-Based Additive Manufacturing Processes." JOM 71.3 (2019): 880-885. [CrossRef]
- Dictionary, Oxford English. "Oxford English Dictionary. Edition on CD-ROM (v. 4.0)." (2009).
- Huang, Pao-Ming, and Ching-Hung Lee. "Estimation of Tool Wear and Surface Roughness Development Using Deep Learning and Sensors Fusion." Sensors 21.16 (2021): 5338.
- Ciracì, Cristian, et al. "Impact of surface roughness in nanogap plasmonic systems." ACS Photonics 7.4 (2020): 908-913.
- He, C. L., W. J. Zong, and J. J. Zhang. "Influencing factors and theoretical modeling methods of surface roughness in turning process: State-of-the-art." International Journal of Machine Tools and Manufacture 129 (2018): 15-26.
- Alfieri, Vittorio, et al. "Reduction of surface roughness by means of laser processing over additive manufacturing metal parts." Materials 10.1 (2017): 30.
- Chaabene, Wassim Ben, Majdi Flah, and Moncef L. Nehdi. "Machine learning prediction of mechanical properties of concrete: Critical review." Construction and Building Materials 260 (2020): 119889. [CrossRef]
- Wang, Chengcheng, et al. "Machine learning in additive manufacturing: State-of-the-art and perspectives." Additive Manufacturing (2020): 101538.
- Meng, Lingbin, et al. "Machine learning in additive manufacturing: A review." Jom 72.6 (2020): 2363-2377.
- Gobert, Christian, et al. "Application of supervised machine learning for defect detection during metallic powder bed fusion additive manufacturing using high resolution imaging." Additive Manufacturing 21 (2018): 517-528. [CrossRef]
- Whitehouse, David, 2012, Surfaces and Their Measurement, Boston, Butterworth-Heinemann. ISBN 978-0080972015.
- Geometrical product specifications(GPS) - Surface texture: Profile method - Surface roughness parameters and their values, 2009, GB/T 1031-2009.
- "Surface Roughness Parameters", https://www.keyence.com/ss/products/microscope/roughness/line/parameters.jsp, accessed on September 27, 2021.
Figure 1.
Sketch of LCMME.
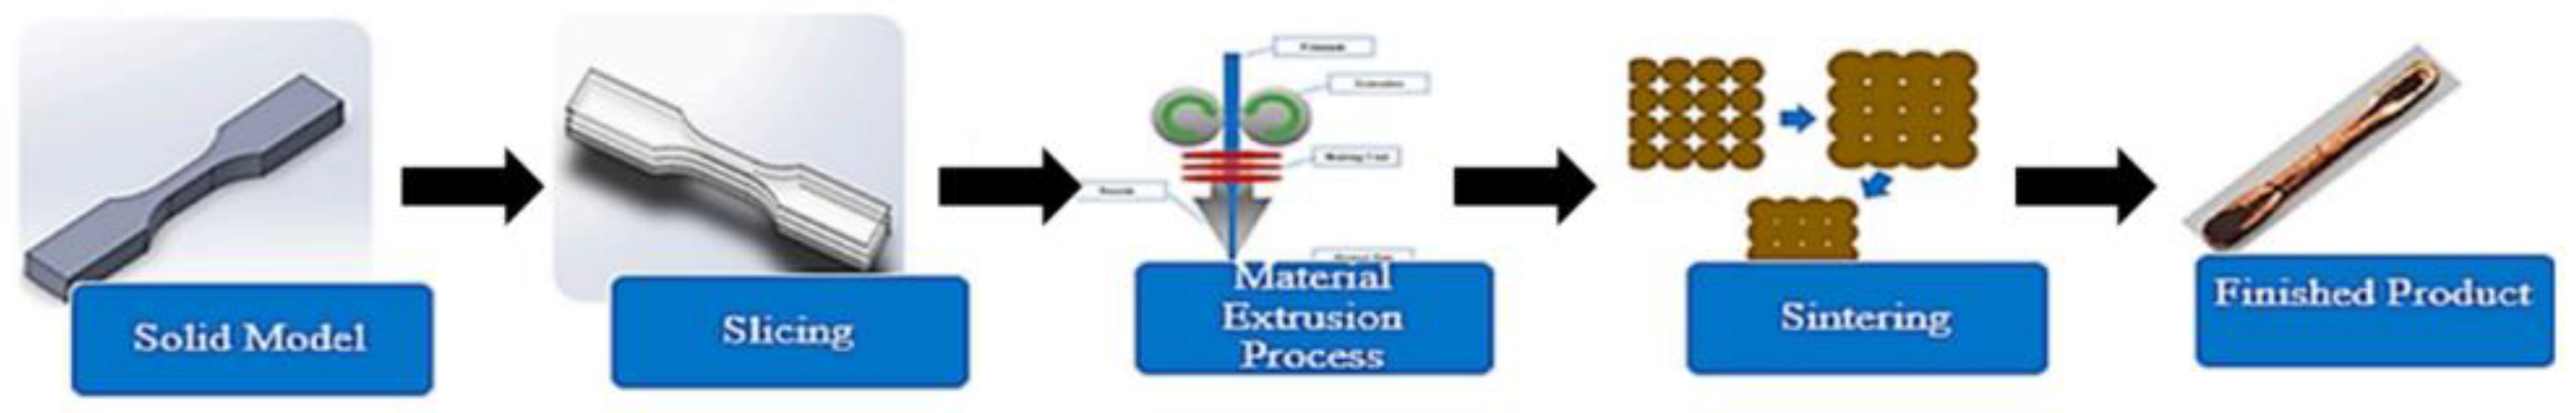
Figure 2.
Process of Sintering.
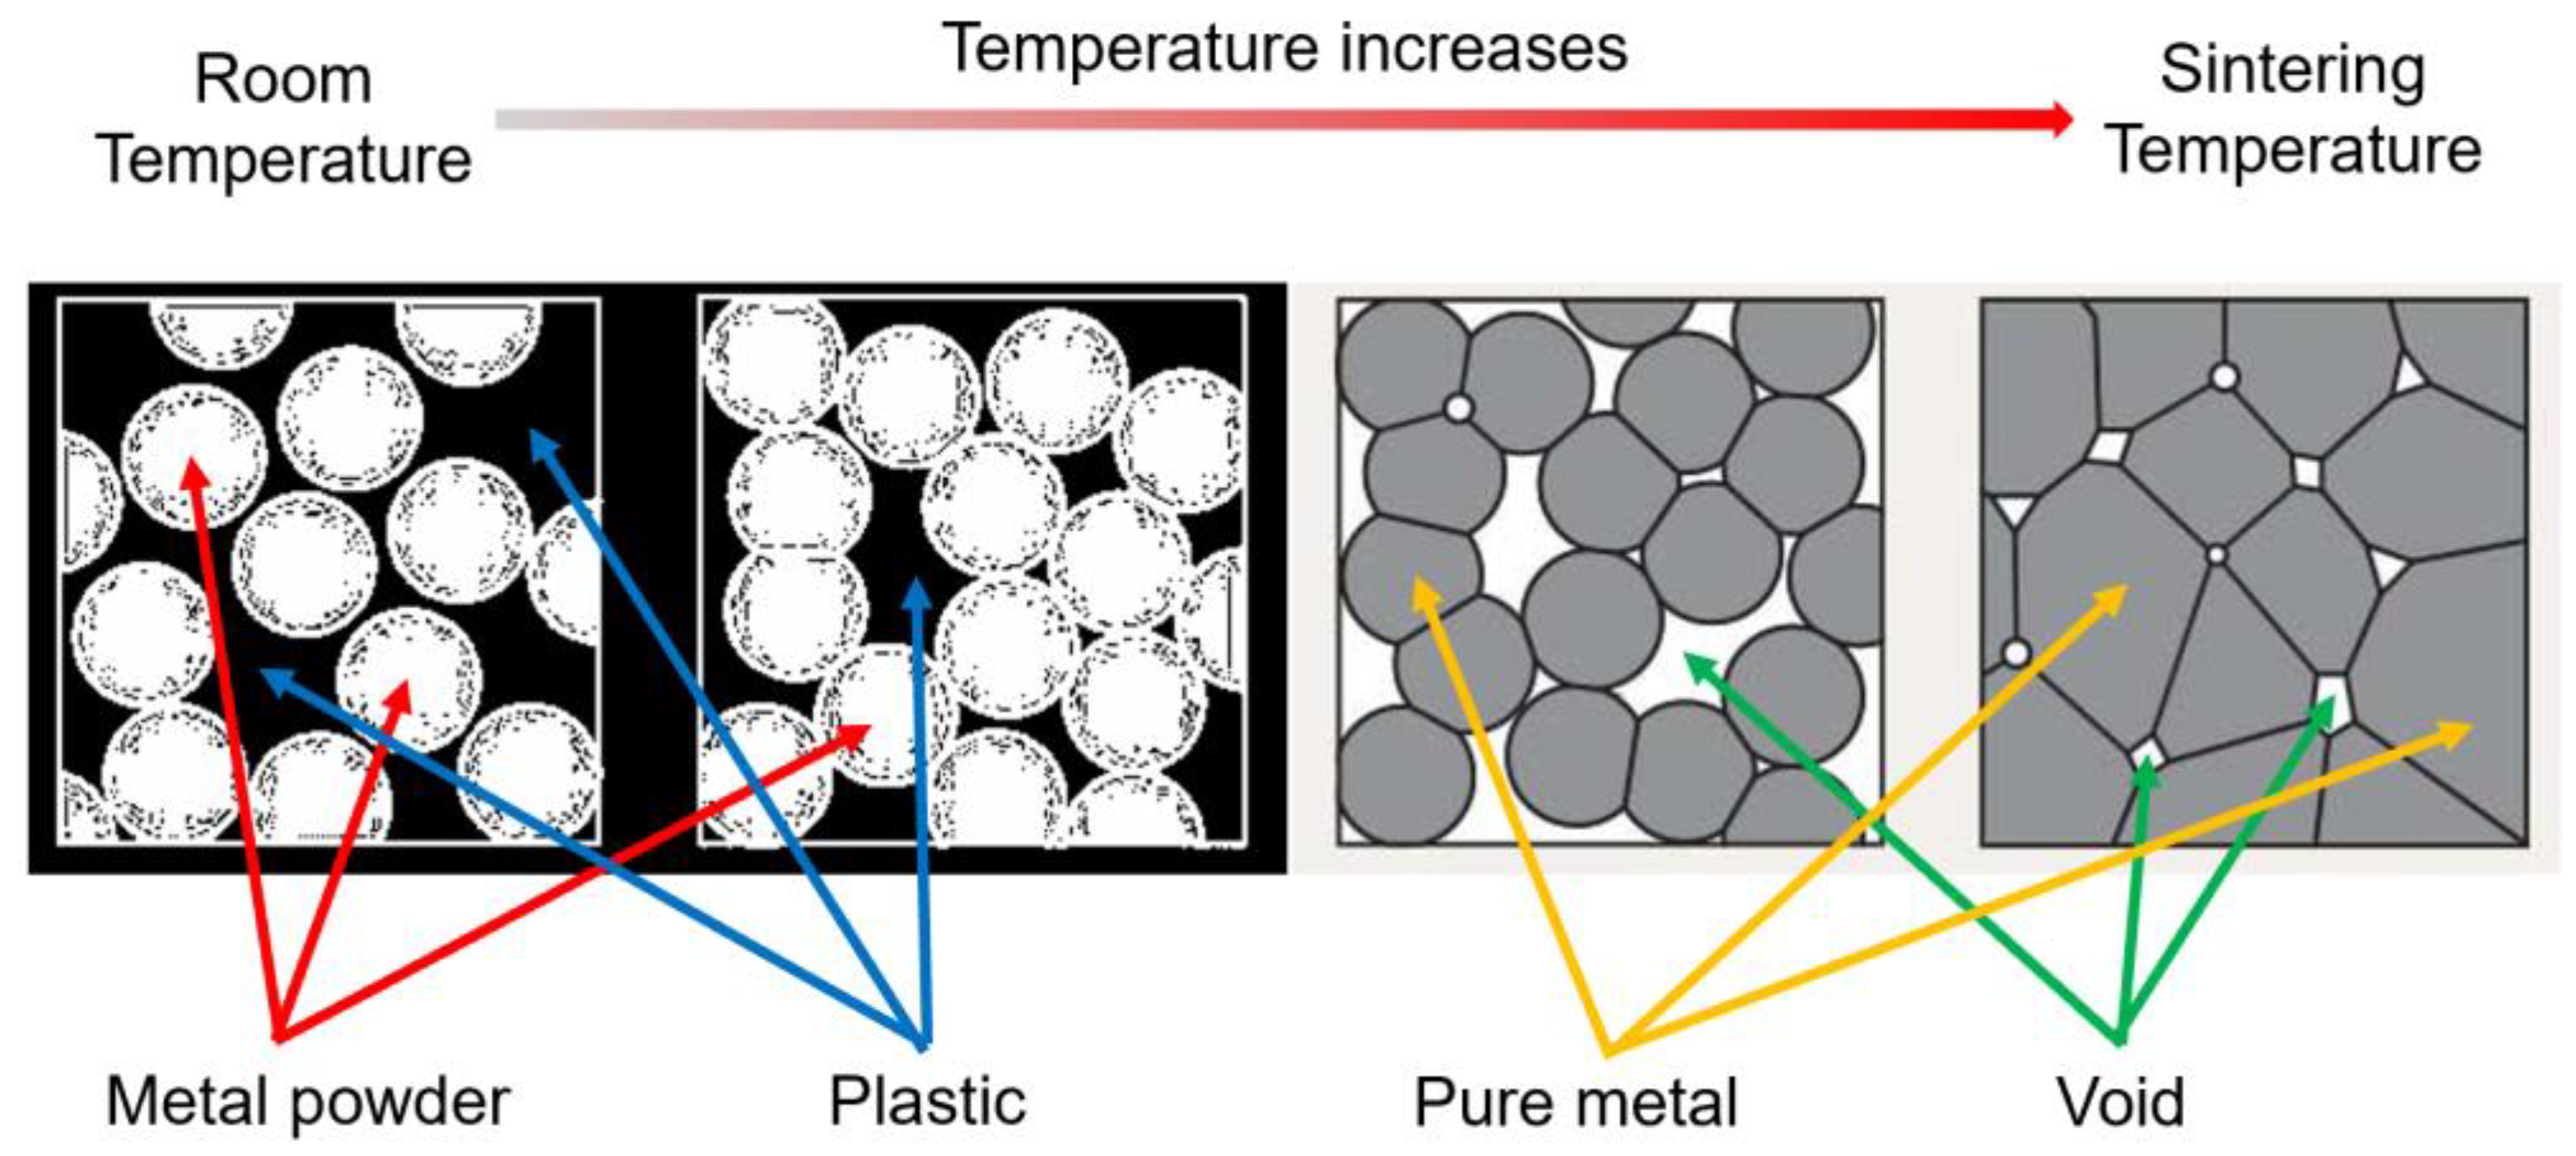
Figure 3.
Samples in different status.
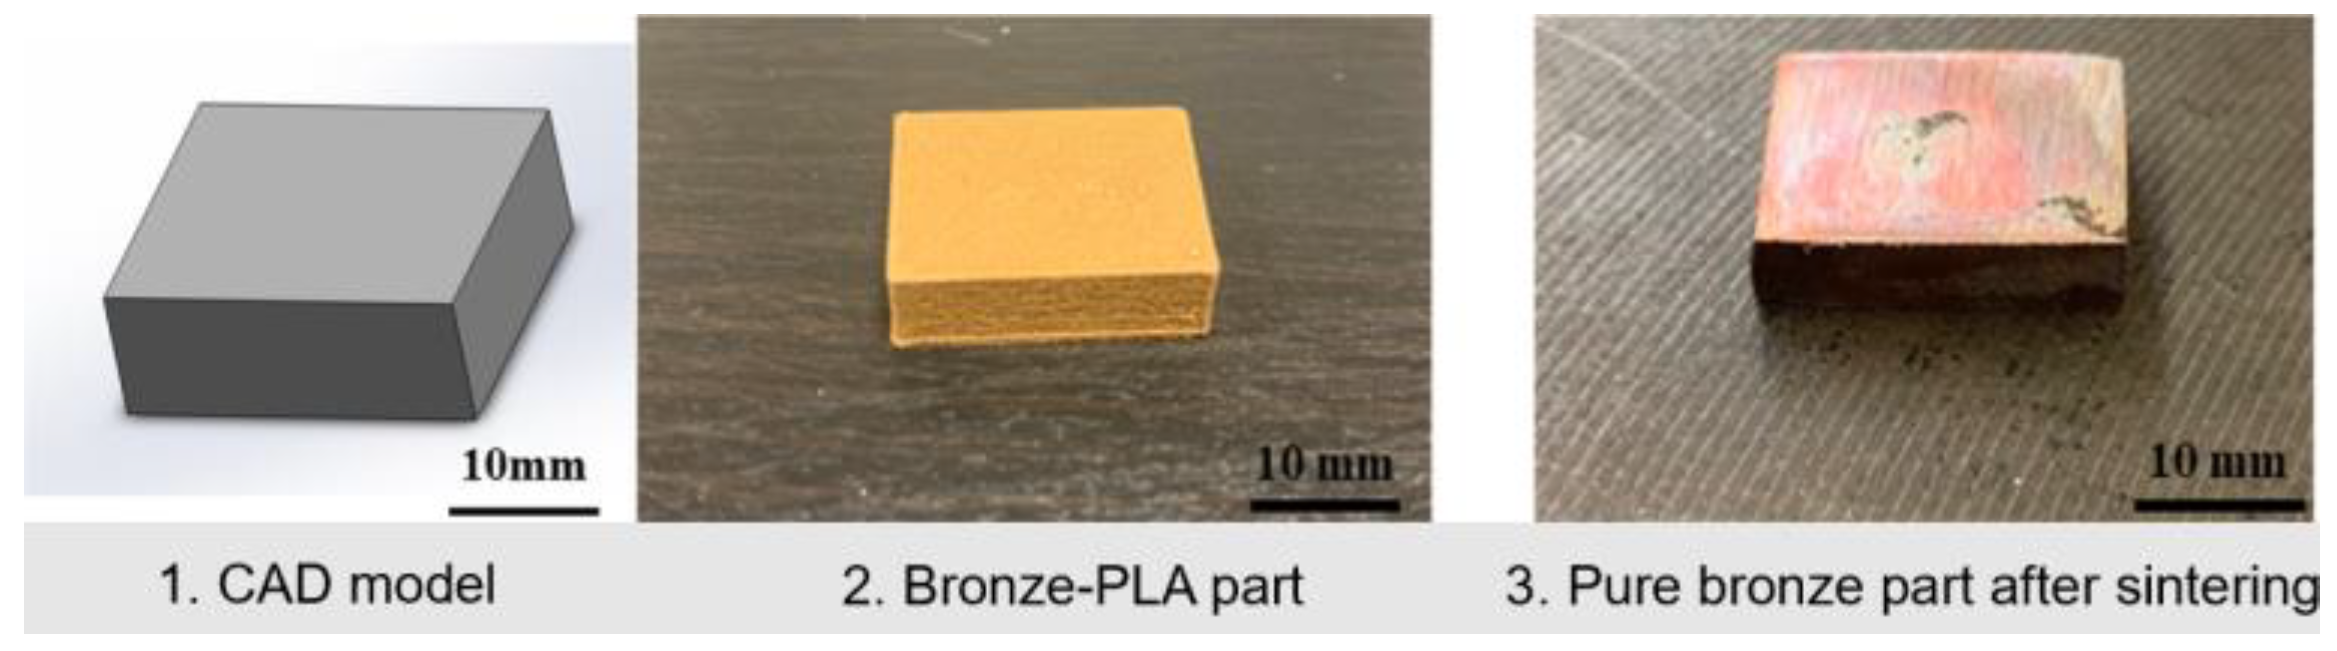
Figure 4.
Micro View of LCMME Fabricated Part.
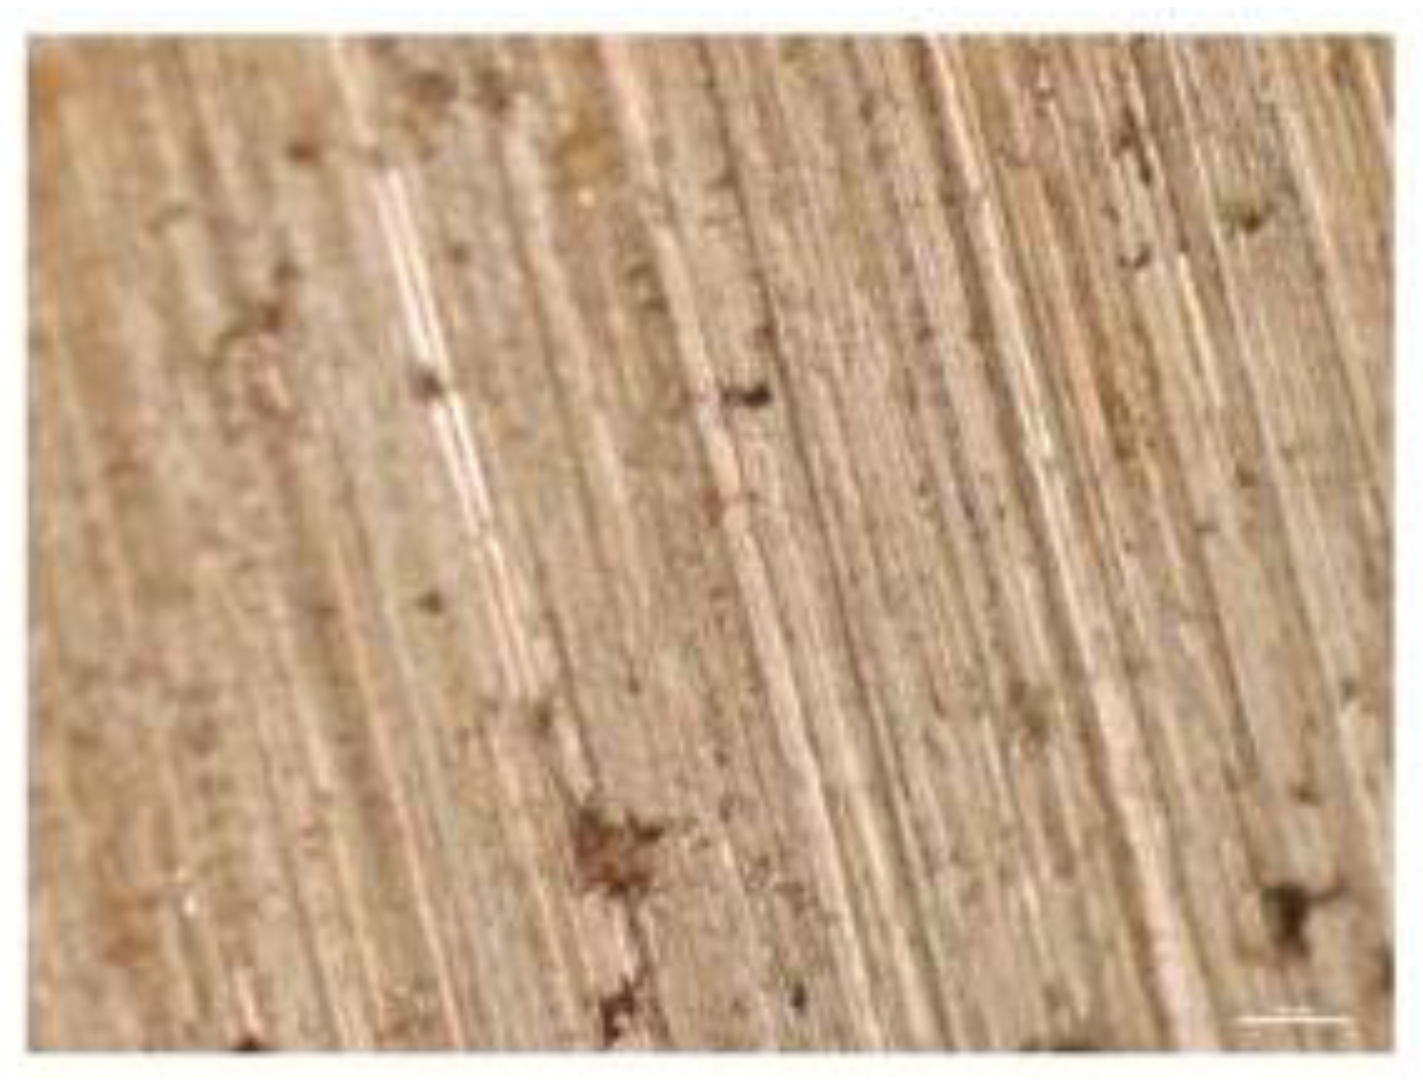
Figure 5.
SJ-210 SR Tester.

Figure 6.
Definition of Ra [22].
Figure 6.
Definition of Ra [22].
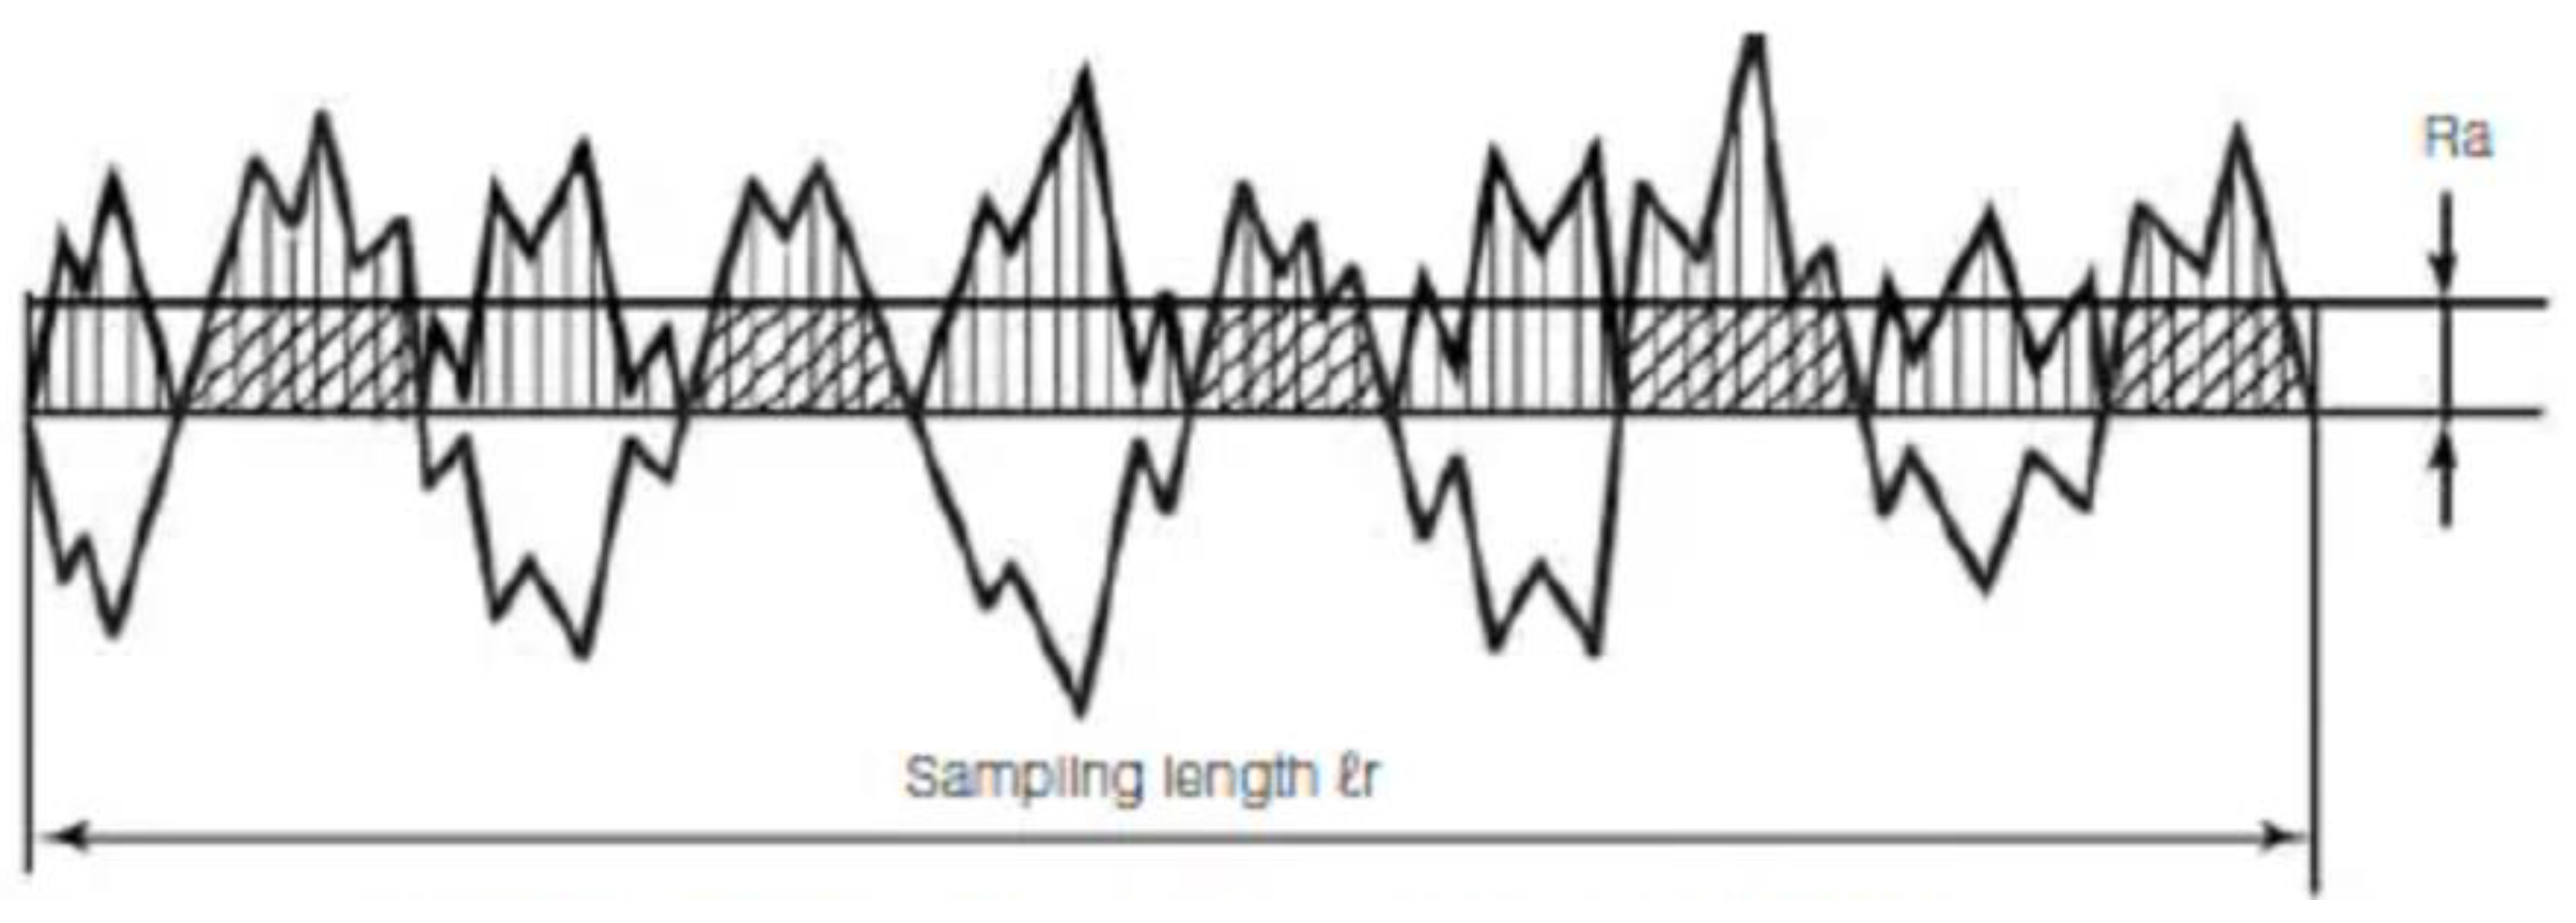
Figure 7.
Top, Front, Side Views of the Samples.
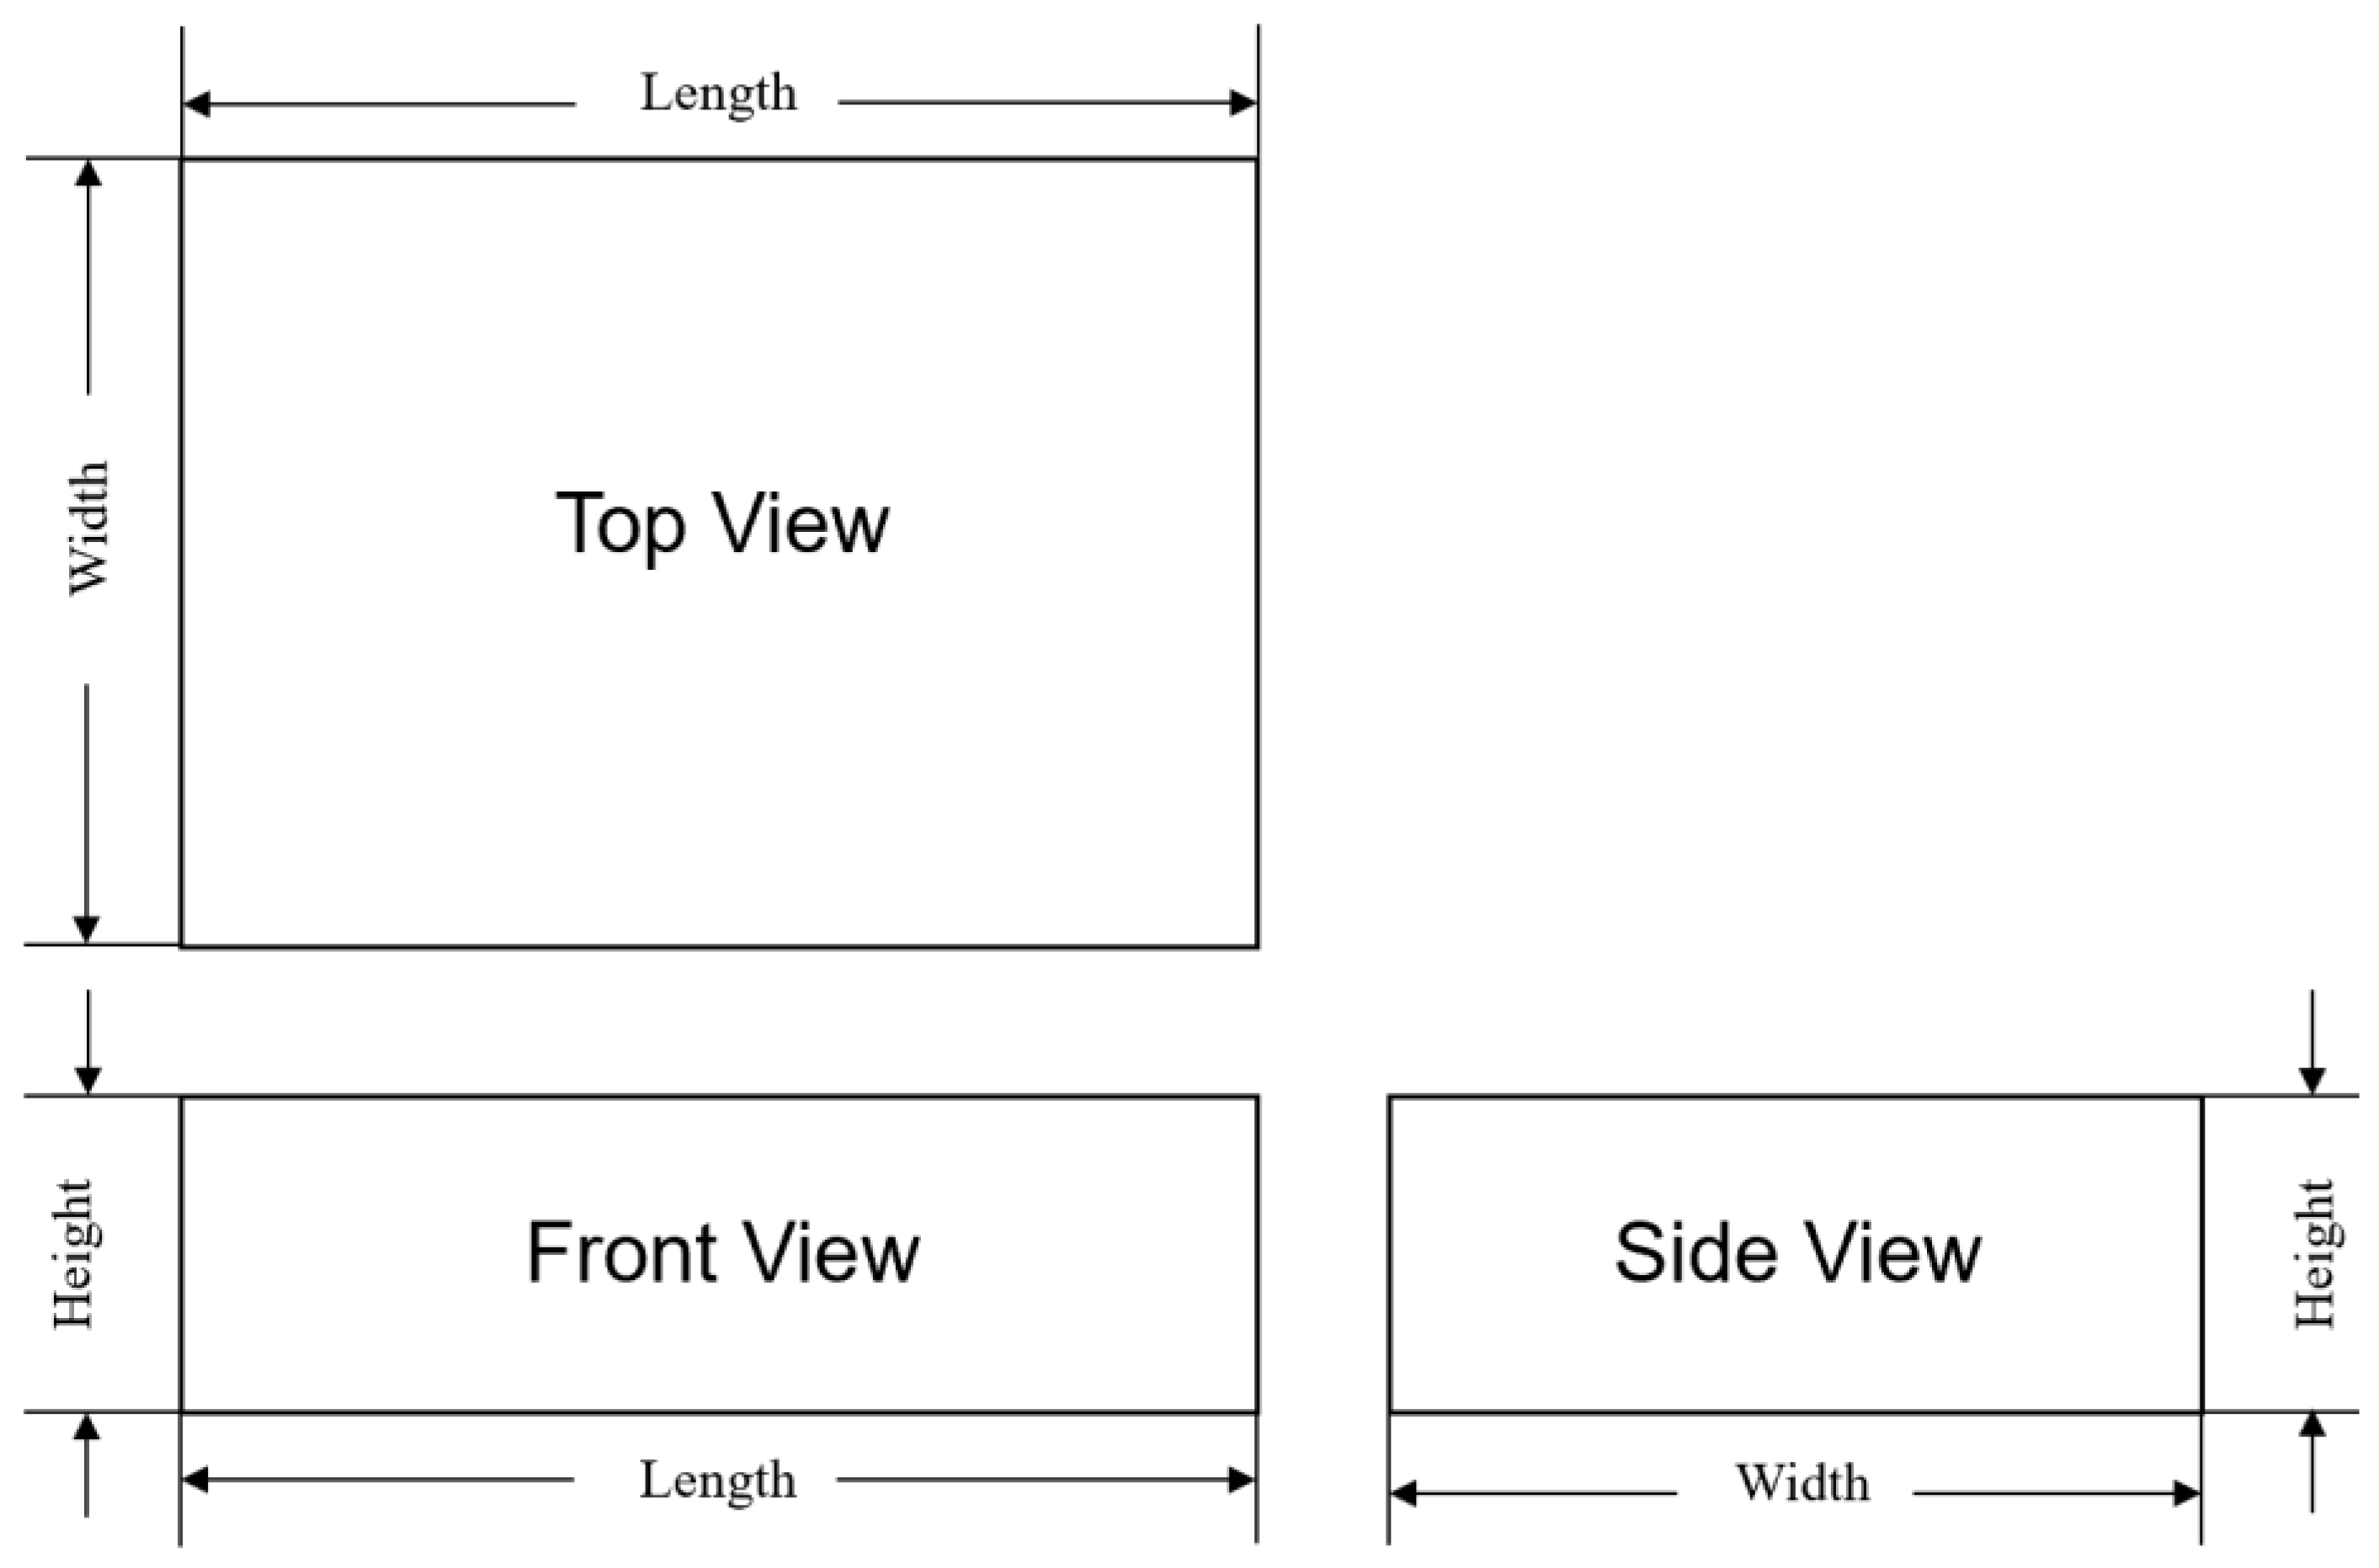

Table 1.
Manufacturing Parameters.
| Manufacturing Parameters | Values | ||||||||
|---|---|---|---|---|---|---|---|---|---|
| LT (mm) | 0.1 | 0.2 | 0.3 | ||||||
| ST (°C) | 870 | 875 | 880 | 885 | 890 | 895 | 900 | ||
| RR (°C/min) | 2 | 3 | 4 | ||||||
| NT (°C) | 220 | 230 | 240 | ||||||
| PS (mm/s) | 10 | 15 | 20 | ||||||
Table 2.
SR Examples.
| Manufacturing Parameters | SR (μm) |
||||||
|---|---|---|---|---|---|---|---|
| LT (mm) |
ST (°C) |
RR (°C/min) |
NT (°C) |
PS (mm/s) |
SR_Top | SR_Front | SR_Side |
| 0.3 | 895 | 3 | 220 | 10 | 5.13 | 1.50 | 1.36 |
| 0.2 | 870 | 4 | 240 | 15 | 12.51 | 2.51 | 2.40 |
Table 3.
ANOVA Result of Three Groups of Data.
| Df | Sum Sq | Mean Sq | F value | F crit | Pr (>F) | |
| dim | 2 | 2902297 | 1451149 | 93.39663 | 3.00648 | 2.44e-37 *** |
| Residuals | 837 | 13004875 | 15537.48 |
Table 4.
ANOVA Result of SR_Front and SR_Side.
| Df | Sum Sq | Mean Sq | F value | F crit | Pr (>F) | |
| dim | 1 | 9163.768 | 9163.768 | 0.681879 | 3.858178 | 0.409293 |
| Residuals | 558 | 7498976 | 13439.03 |
Table 5.
ANOVA Result of SR_Top.
| Df | Sum Sq | Mean Sq | F value | Pr (>F) | |
| LT | 2 | 41801 | 20901 | 1.6415 | 0.1962310 |
| ST | 6 | 299781 | 49964 | 3.9240 | 0.0009817*** |
| NT | 2 | 276153 | 138076 | 10.8441 | 3.337e-5*** |
| PS | 2 | 26087 | 13043 | 1.0244 | 0.3608456 |
| RR | 2 | 656636 | 328318 | 25.7850 | 1.026e-10*** |
Table 6.
ANOVA Result of SR_Ed.
| Df | Sum Sq | Mean Sq | F value | Pr (>F) | |
| LT | 2 | 221884 | 221884 | 34.5064 | 9.746e-15*** |
| ST | 6 | 468760 | 78127 | 12.1499 | 9.603e-13*** |
| NT | 2 | 74548 | 37274 | 5.7967 | 0.0032521** |
| PS | 2 | 141323 | 70662 | 10.9890 | 2.150e-05*** |
| RR | 2 | 83375 | 41687 | 6.4830 | 0.0016651*** |
Table 7.
MSE Values of Each ML Algorithm
| Data Group | MSE | |
| SVR | NN | |
| SR_Top | 9.41 | 8.39 |
| SR_Edge | 6.87 | 3.68 |
Disclaimer/Publisher’s Note: The statements, opinions and data contained in all publications are solely those of the individual author(s) and contributor(s) and not of MDPI and/or the editor(s). MDPI and/or the editor(s) disclaim responsibility for any injury to people or property resulting from any ideas, methods, instructions or products referred to in the content. |
© 2024 by the authors. Licensee MDPI, Basel, Switzerland. This article is an open access article distributed under the terms and conditions of the Creative Commons Attribution (CC BY) license (http://creativecommons.org/licenses/by/4.0/).
Copyright: This open access article is published under a Creative Commons CC BY 4.0 license, which permit the free download, distribution, and reuse, provided that the author and preprint are cited in any reuse.


